External Review Draft | EPA/600/R-15/047a | June 2015 | www.epa.gov/hfstudy Assessment of the Potential Impacts of Hydraulic Fracturing for Oil and Gas on Drinking Water Resources Executive Summary Office of Research and Development Washington, D.C.
Transcript
External Review Draft | EPA/600/R-15/047a | June 2015 | www.epa.gov/hfstudy
Assessment of the Potential Impacts of Hydraulic Fracturing for Oil and Gas on Drinking Water Resources
Executive Summary
Office of Research and DevelopmentWashington, D.C.
Hydraulic Fracturing Drinking Water Assessment Executive Summary
Executive Summary
This document is a draft for review purposes only and does not constitute Agency policy.
June 2015 DRAFT—DO NOT CITE OR QUOTE
Hydraulic Fracturing Drinking Water Assessment Executive Summary
Executive Summary Since the early 2000s, oil and natural gas production in the United States has been transformed 1
2 3 4 5
6 7 8 9
10 11 12
13 14 15 16 17 18 19
20 21 22 23 24 25
26 27 28 29 30
through technological innovation. Hydraulic fracturing, combined with advanced directional drilling techniques, made it possible to economically extract oil and gas resources previously inaccessible. The resulting surge in production increased domestic energy supplies and brought economic benefits to many areas of the United States.
The growth in domestic oil and gas production also raised concerns about potential impacts to human health and the environment, including potential effects on the quality and quantity of drinking water resources. Some residents living close to oil and gas production wells have reported changes in the quality of drinking water and assert that hydraulic fracturing is responsible for these changes. Other concerns include competition for water between hydraulic fracturing activities and other water users, especially in areas of the country experiencing drought, and the disposal of wastewater generated from hydraulic fracturing.
The U.S. Congress urged the U.S. Environmental Protection Agency (EPA) to study the relationship between hydraulic fracturing and drinking water. This report synthesizes available scientific literature and data to assess the potential for hydraulic fracturing for oil and gas to change the quality or quantity of drinking water resources, and identifies factors affecting the frequency or severity of any potential changes. This report can be used by federal, tribal, state, and local officials; industry; and the public to better understand and address any vulnerabilities of drinking water resources to hydraulic fracturing activities.
What is Hydraulic Fracturing?
Hydraulic fracturing is a stimulation technique used to increase oil and gas production from underground rock formations. Hydraulic fracturing involves the injection of fluids under pressures great enough to fracture the oil- and gas-producing formations. The fluid generally consists of water, chemicals, and proppant (commonly sand). The proppant holds open the newly created fractures after the injection pressure is released. Oil and gas flow through the fractures and up the production well to the surface.
Hydraulic fracturing has been used since the late 1940s and, for the first 50 years, was mostly used in vertical wells in conventional formations.1 Hydraulic fracturing is still used in these settings, but the process has evolved; technological developments (including horizontal and directional drilling) have led to the use of hydraulic fracturing in unconventional hydrocarbon formations that could not otherwise be profitably produced (see Figure ES-1). These formations include:
1 Conventional formations often allow oil and natural gas to flow to the wellbore without hydraulic fracturing and typically contain trapped oil and natural gas that migrated from other subsurface locations. Hydraulic fracturing can be used to enhance oil and gas production from these formations. In unconventional formations, hydraulic fracturing is needed to extract economical quantities of oil and gas.
This document is a draft for review purposes only and does not constitute Agency policy.
June 2015 ES-1 DRAFT—DO NOT CITE OR QUOTE
Hydr
1 2 3
4 5 6 7
8 9
10 11 12
aulic Fracturing Drinking Water Assessment Executive Summary
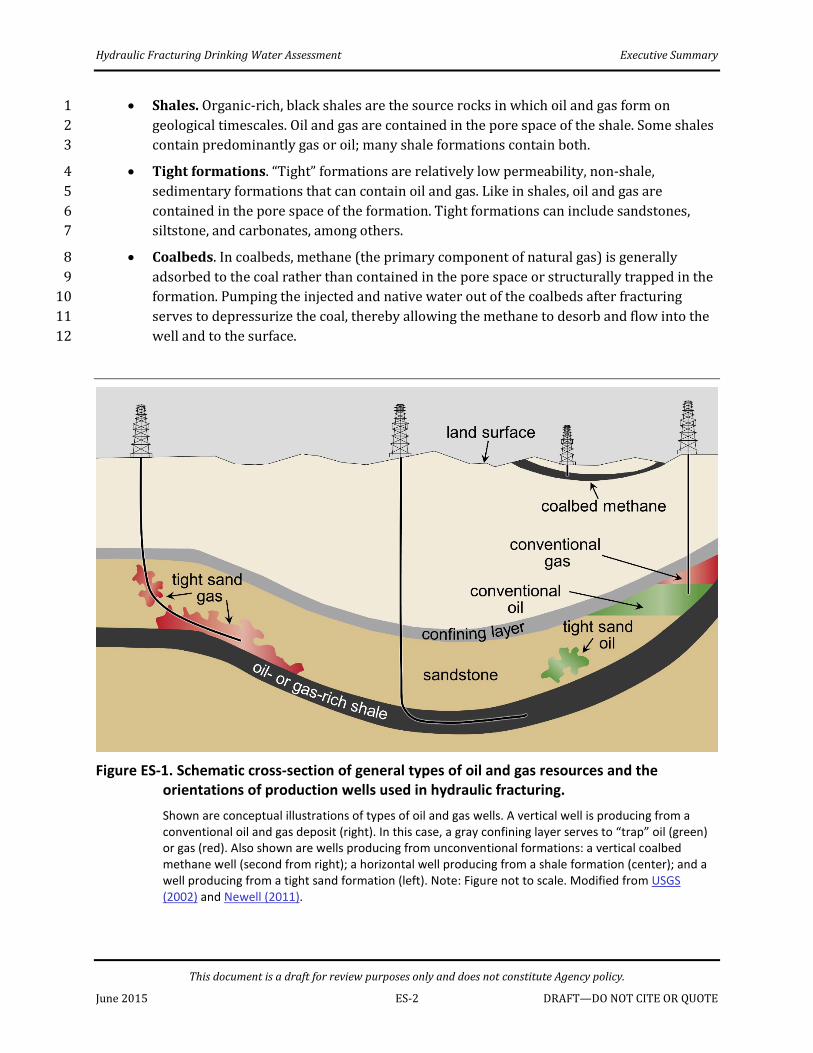
• Shales. Organic-rich, black shales are the source rocks in which oil and gas form on geological timescales. Oil and gas are contained in the pore space of the shale. Some shales contain predominantly gas or oil; many shale formations contain both.
• Tight formations. “Tight” formations are relatively low permeability, non-shale, sedimentary formations that can contain oil and gas. Like in shales, oil and gas are contained in the pore space of the formation. Tight formations can include sandstones, siltstone, and carbonates, among others.
• Coalbeds. In coalbeds, methane (the primary component of natural gas) is generally adsorbed to the coal rather than contained in the pore space or structurally trapped in the formation. Pumping the injected and native water out of the coalbeds after fracturing serves to depressurize the coal, thereby allowing the methane to desorb and flow into the well and to the surface.
Figure ES-1. Schematic cross-section of general types of oil and gas resources and the orientations of production wells used in hydraulic fracturing. Shown are conceptual illustrations of types of oil and gas wells. A vertical well is producing from a conventional oil and gas deposit (right). In this case, a gray confining layer serves to “trap” oil (green) or gas (red). Also shown are wells producing from unconventional formations: a vertical coalbed methane well (second from right); a horizontal well producing from a shale formation (center); and a well producing from a tight sand formation (left). Note: Figure not to scale. Modified from USGS (2002) and Newell (2011).
This document is a draft for review purposes only and does not constitute Agency policy.
Hydraulic Fracturing Drinking Water Assessment Executive Summary
The combined use of hydraulic fracturing with horizontal (or more generically, directional) drilling 1
2 3
4 5
6 7
8 9
10 11
12 13 14
15 16
17 18 19 20 21 22
23 24 25 26 27 28
29 30 31 32 33
has led to an increase in oil and gas activities in areas of the country with historical oil and gas production, and an expansion of oil and gas activities to new regions of the country.
Scope of the Assessment
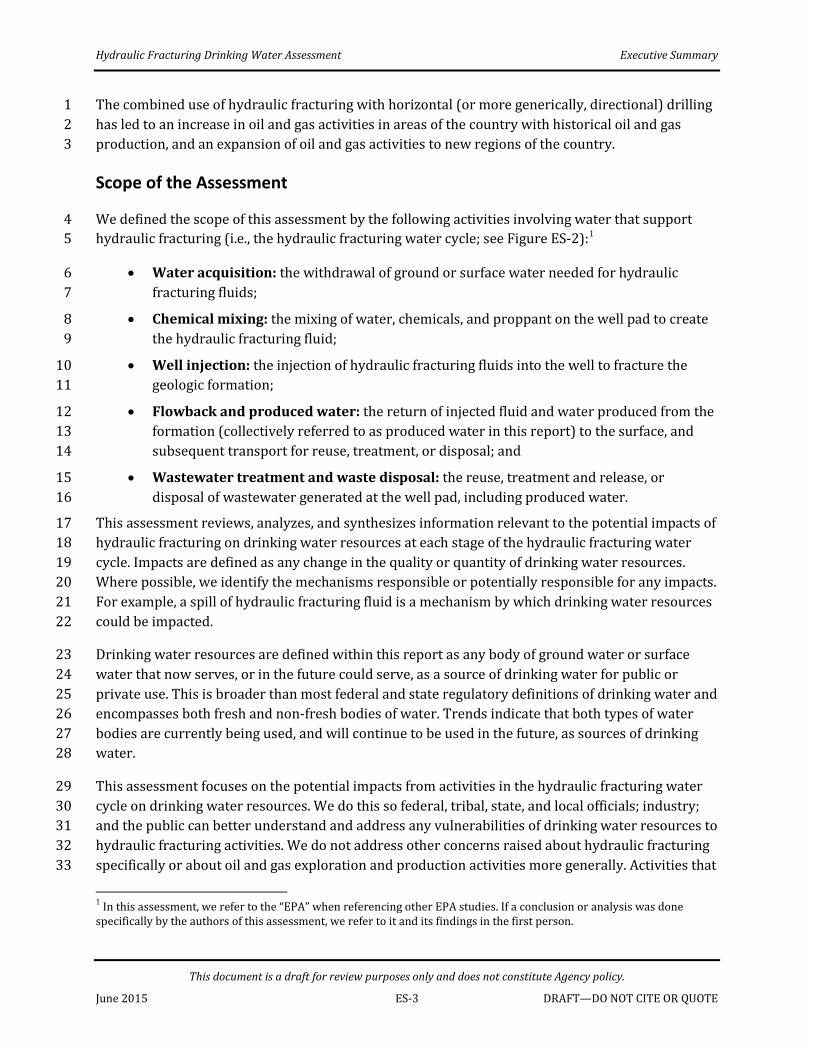
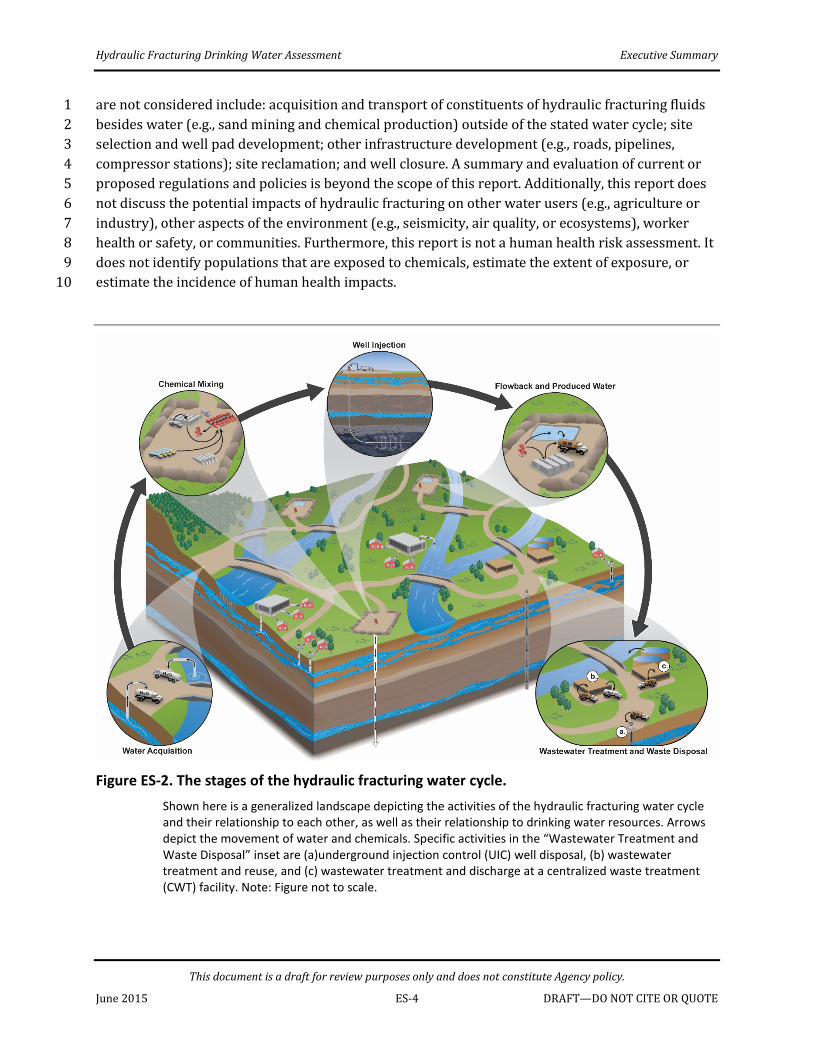
We defined the scope of this assessment by the following activities involving water that support hydraulic fracturing (i.e., the hydraulic fracturing water cycle; see Figure ES-2):1
• Water acquisition: the withdrawal of ground or surface water needed for hydraulic fracturing fluids;
• Chemical mixing: the mixing of water, chemicals, and proppant on the well pad to create the hydraulic fracturing fluid;
• Well injection: the injection of hydraulic fracturing fluids into the well to fracture the geologic formation;
• Flowback and produced water: the return of injected fluid and water produced from the formation (collectively referred to as produced water in this report) to the surface, and subsequent transport for reuse, treatment, or disposal; and
• Wastewater treatment and waste disposal: the reuse, treatment and release, or disposal of wastewater generated at the well pad, including produced water.
This assessment reviews, analyzes, and synthesizes information relevant to the potential impacts of hydraulic fracturing on drinking water resources at each stage of the hydraulic fracturing water cycle. Impacts are defined as any change in the quality or quantity of drinking water resources. Where possible, we identify the mechanisms responsible or potentially responsible for any impacts. For example, a spill of hydraulic fracturing fluid is a mechanism by which drinking water resources could be impacted.
Drinking water resources are defined within this report as any body of ground water or surface water that now serves, or in the future could serve, as a source of drinking water for public or private use. This is broader than most federal and state regulatory definitions of drinking water and encompasses both fresh and non-fresh bodies of water. Trends indicate that both types of water bodies are currently being used, and will continue to be used in the future, as sources of drinking water.
This assessment focuses on the potential impacts from activities in the hydraulic fracturing water cycle on drinking water resources. We do this so federal, tribal, state, and local officials; industry; and the public can better understand and address any vulnerabilities of drinking water resources to hydraulic fracturing activities. We do not address other concerns raised about hydraulic fracturing specifically or about oil and gas exploration and production activities more generally. Activities that
1 In this assessment, we refer to the “EPA” when referencing other EPA studies. If a conclusion or analysis was done specifically by the authors of this assessment, we refer to it and its findings in the first person.
This document is a draft for review purposes only and does not constitute Agency policy.
June 2015 ES-3 DRAFT—DO NOT CITE OR QUOTE
Hydraulic Fracturing Drinking Water Assessment Executive Summary
are not considered include: acquisition and transport of constituents of hydraulic fracturing fluids 1
2 3 4 5 6 7 8 9
10
besides water (e.g., sand mining and chemical production) outside of the stated water cycle; site selection and well pad development; other infrastructure development (e.g., roads, pipelines, compressor stations); site reclamation; and well closure. A summary and evaluation of current or proposed regulations and policies is beyond the scope of this report. Additionally, this report does not discuss the potential impacts of hydraulic fracturing on other water users (e.g., agriculture or industry), other aspects of the environment (e.g., seismicity, air quality, or ecosystems), worker health or safety, or communities. Furthermore, this report is not a human health risk assessment. It does not identify populations that are exposed to chemicals, estimate the extent of exposure, or estimate the incidence of human health impacts.
Figure ES-2. The stages of the hydraulic fracturing water cycle. Shown here is a generalized landscape depicting the activities of the hydraulic fracturing water cycle and their relationship to each other, as well as their relationship to drinking water resources. Arrows depict the movement of water and chemicals. Specific activities in the “Wastewater Treatment and Waste Disposal” inset are (a)underground injection control (UIC) well disposal, (b) wastewater treatment and reuse, and (c) wastewater treatment and discharge at a centralized waste treatment (CWT) facility. Note: Figure not to scale.
This document is a draft for review purposes only and does not constitute Agency policy.
June 2015 ES-4 DRAFT—DO NOT CITE OR QUOTE
Hydraulic Fracturing Drinking Water Assessment Executive Summary
Approach
This assessment relies on relevant scientific literature and data. Literature evaluated included 1 2 3 4 5 6 7 8 9
10 11 12
13 14 15 16 17 18 19 20 21 22 23 24 25 26
27 28
articles published in science and engineering journals, federal and state government reports, non-governmental organization (NGO) reports, and industry publications. Data sources examined included federal- and state-collected data sets, databases maintained by federal and state government agencies, other publicly-available data and information, and data, including confidential and non-confidential business information, submitted by industry to the EPA.1 The relevant literature and data complement research conducted by the EPA under its Plan to Study the Potential Impacts of Hydraulic Fracturing on Drinking Water Resources (hereafter referred to as the “Study Plan”) and published by scientific journals or as peer-reviewed EPA reports; those articles and reports are cited throughout this assessment. The research topic areas and projects described in the Study Plan were designed to meet the data and information needs of this assessment and were developed with substantial expert and public input.
Proximity of Current Activity and Drinking Water Resources
Thousands of wells are drilled and fractured every year in the United States, with activities concentrated in specific locations. We estimate 25,000-30,000 new wells were drilled and hydraulically fractured annually in the United States between 2011 and 2014. Additional, pre-existing wells (wells more than one year old that may or may not have been hydraulically fractured in the past) were also likely fractured. Hydraulic fracturing took place in at least 25 states between 1990 and 2013. The EPA’s analysis of disclosures made to FracFocus 1.0 (hereafter “FracFocus”) contained wells from 20 of these states.2 Almost half of these wells were in Texas. Colorado was a distant second, while Pennsylvania and North Dakota were third and fourth, respectively. Hydraulic fracturing activities were further localized within the 20 states. Of the approximately 1,500 counties or county equivalents in these 20 states, slightly over 400 contained all of the wells disclosed to FracFocus during this time period. In Colorado, over 85% of the hydraulically fractured wells disclosed were located in two counties. The price of gas and oil may cause short term volatility in the number of wells drilled and fractured per year, yet hydraulic fracturing is expected to continue to expand and drive an increase in domestic oil and gas production in coming decades.
Hydraulically fractured wells can be located near residences and drinking water resources. Between 2000 and 2013, approximately 9.4 million people lived within one mile of a hydraulically
1 Some information provided to the EPA in response to two separate information requests to service companies and well operators was claimed as confidential business information. 2 FracFocus is a publicly accessible website (www.fracfocus.org) managed by the Ground Water Protection Council and the Interstate Oil and Gas Compact Commission where oil and gas production well operators may disclose information voluntarily or pursuant to state requirements about the ingredients used in hydraulic fracturing fluids at individual wells. The EPA analyzed disclosures from FracFocus 1.0 for over 38,000 oil and gas production wells hydraulically fractured between January 1, 2011 and February 28, 2013. A disclosure refers to data submitted for a specific oil and gas production well for a specific fracture date. Most wells had only one disclosure, but a small number of wells (876 wells) had multiple disclosures. For the purposes of this Executive Summary, we equate disclosures with wells when discussing this study.
This document is a draft for review purposes only and does not constitute Agency policy.
Hydraulic Fracturing Drinking Water Assessment Executive Summary
fractured well. Approximately 6,800 sources of drinking water for public water systems were 1
2 3
4 5 6 7 8 9
10
11 12 13 14 15 16
17 18 19 20 21
22 23 24 25 26 27
28 29 30 31
32 33 34 35
located within one mile of at least one hydraulically fractured well during the same period. These drinking water sources served more than 8.6 million people year-round in 2013.
Although proximity of hydraulic fracturing activities to a drinking water resource is not in of itself sufficient for an impact to occur,, it does increase the potential for impacts. Residents and drinking water resources in areas experiencing hydraulic fracturing activities are most likely to be affected by any potential impacts, should they occur. However, hydraulic fracturing can also affect drinking water resources outside the immediate vicinity of a hydraulically fractured well; a truck carrying wastewater could spill or a release of inadequately treated wastewater could have downstream effects.
Major Findings
From our assessment, we conclude there are above and below ground mechanisms by which hydraulic fracturing activities have the potential to impact drinking water resources. These mechanisms include water withdrawals in times of, or in areas with, low water availability; spills of hydraulic fracturing fluids and produced water; fracturing directly into underground drinking water resources; below ground migration of liquids and gases; and inadequate treatment and discharge of wastewater.
We did not find evidence that these mechanisms have led to widespread, systemic impacts on drinking water resources in the United States. Of the potential mechanisms identified in this report, we found specific instances where one or more mechanisms led to impacts on drinking water resources, including contamination of drinking water wells. The number of identified cases, however, was small compared to the number of hydraulically fractured wells.
This finding could reflect a rarity of effects on drinking water resources, but may also be due to other limiting factors. These factors include: insufficient pre- and post-fracturing data on the quality of drinking water resources; the paucity of long-term systematic studies; the presence of other sources of contamination precluding a definitive link between hydraulic fracturing activities and an impact; and the inaccessibility of some information on hydraulic fracturing activities and potential impacts.
Below, we provide a synopsis of the assessment’s key findings, organized by each stage of the hydraulic fracturing water cycle. We provide answers to the research questions presented in the Study Plan and Chapter 1. While come citations are provided here, individual chapters should be consulted for additional detail and citations.
Water Acquisition Water is a major component of nearly all hydraulic fracturing operations. It typically makes up almost 90% or more of the fluid volume injected into a well, and each hydraulically fractured well requires thousands to millions of gallons of water. Cumulatively, hydraulic fracturing activities in the United States used on average 44 billion gal of water a year in 2011 and 2012, according to the
This document is a draft for review purposes only and does not constitute Agency policy.
June 2015 ES-6 DRAFT—DO NOT CITE OR QUOTE
Hydraulic Fracturing Drinking Water Assessment Executive Summary
EPA’s analysis of FracFocus disclosures. Although this represents less than 1% of total annual water 1 2 3
4 5 6 7 8 9
10 11
12 13 14 15 16 17 18 19 20
use and consumption at this scale, water withdrawals could potentially impact the quantity and quality of drinking water resources at more local scales.1
Research Questions: Water Acquisition
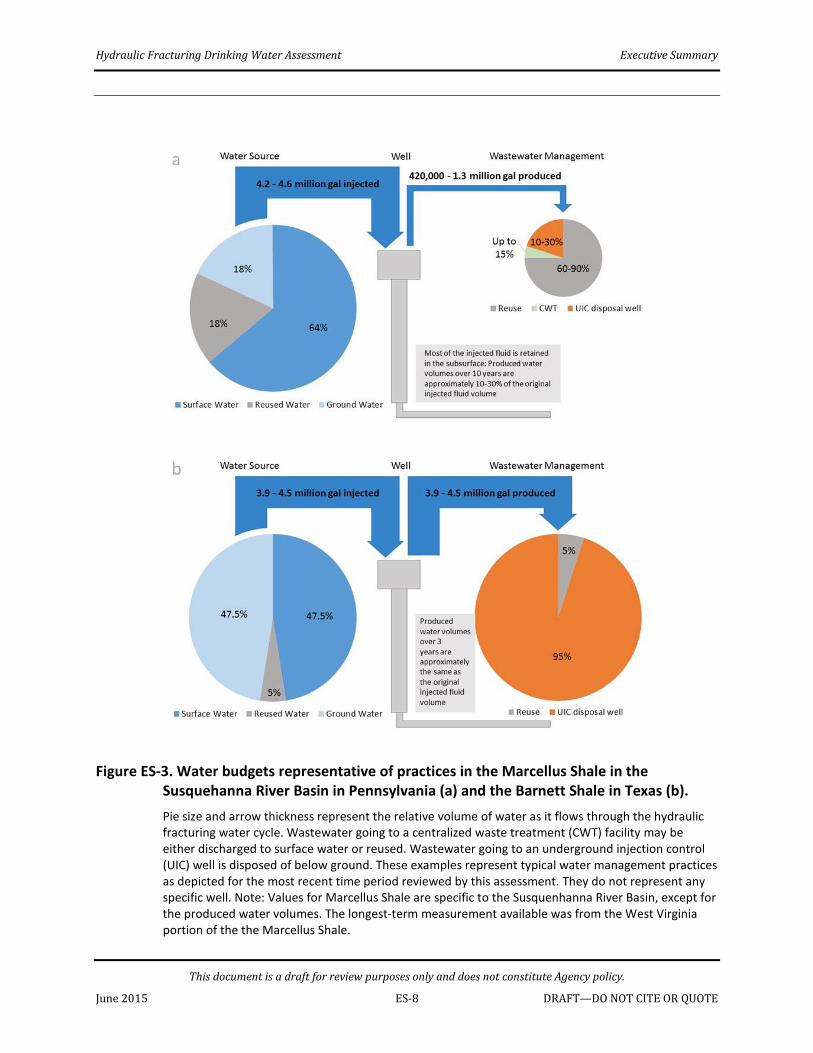
• What are the types of water used for hydraulic fracturing?Water for hydraulic fracturing typically comes from surface water, ground water, or reused hydraulic fracturing wastewater. Hydraulic fracturing operations in the eastern United States generally rely on surface water, while operations in the more semi-arid to arid western states generally use mixed supplies of surface and ground water. In the Marcellus Shale in Pennsylvania, for example, most water used for hydraulic fracturing originates from surface water, whereas surface and ground water are used in approximately equal proportions in the Barnett Shale in Texas (see Figure ES-3a,b). In areas that lack available surface water (e.g., western Texas), ground water supplies most of the water needed for hydraulic fracturing.
Across the United States, the vast majority of water used in hydraulic fracturing is fresh, although operators also make use of lower-quality water, including reused hydraulic fracturing wastewater.2 Based on available data, the median reuse of wastewater as a percentage of injected volumes is 5% nationally, with the percentage varying by location.3 Available data on reuse trends indicate increased reuse of wastewater over time in both Pennsylvania and West Virginia. Reuse as a percentage of injected volumes is lower in other areas, including regions with more water stress, likely because of the availability of disposal wells. For example, reused wastewater is approximately 18% of injected volumes in the Marcellus Shale in Pennsylvania’s Susquehanna River Basin, whereas it is approximately 5% in the Barnett Shale in Texas (see Figure ES-3a,b).
1 Water use is water withdrawn from ground- or surface water for a specific purpose, part or all of which may be returned to the local hydrologic cycle. If no water is returned, water use equals water consumption. Water consumption is water that is removed from the local hydrologic cycle following its use (e.g., via evaporation, transpiration, incorporation into products or crops, consumption by humans or livestock) and is therefore unavailable to other water users (Maupin et al., 2014). In the case of hydraulic fracturing, water can be consumed by the loss of injected water to subsurface zones or via underground disposal of wastewaters, among other means. 2 In this assessment, hydraulic fracturing “wastewater” refers to both produced water and any other water generated as a hydraulic fracturing site. As used in this assessment, the term “wastewater” is not intended to constitute a term of art for legal or regulatory purposes. 3 Reused wastewater as a percentage of injected water differs from the percentage of wastewater that is managed through reuse, as opposed to other wastewater management options. For example, in the Marcellus in Pennsylvania, approximately 18% of injected water is reused produced water, while approximately 70% of wastewater or more is managed through reuse (Figure ES-3a).
This document is a draft for review purposes only and does not constitute Agency policy.
Hydraulic Fracturing Drinking Water Assessment Executive Summary
Figure ES-3. Water budgets representative of practices in the Marcellus Shale in the Susquehanna River Basin in Pennsylvania (a) and the Barnett Shale in Texas (b). Pie size and arrow thickness represent the relative volume of water as it flows through the hydraulic fracturing water cycle. Wastewater going to a centralized waste treatment (CWT) facility may be either discharged to surface water or reused. Wastewater going to an underground injection control (UIC) well is disposed of below ground. These examples represent typical water management practices as depicted for the most recent time period reviewed by this assessment. They do not represent any specific well. Note: Values for Marcellus Shale are specific to the Susquenhanna River Basin, except for the produced water volumes. The longest-term measurement available was from the West Virginia portion of the the Marcellus Shale.
This document is a draft for review purposes only and does not constitute Agency policy.
June 2015 ES-8 DRAFT—DO NOT CITE OR QUOTE
Hydraulic Fracturing Drinking Water Assessment Executive Summary
• How much water is used per well? The national median volume of water used per hydraulically fractured well is approximately 1.5 1
2 3 4 5 6 7 8 9
10 11 12 13 14 15 16 17 18
19 20 21 22 23 24 25 26 27
28 29 30 31 32 33 34 35 36 37
million gal (5.7 million L), according to the EPA’s analysis of FracFocus disclosures. This estimate likely represents a wide variety of fractured well types, including vertical wells that generally use much less water per well than horizontal wells. Thus, published estimates for horizontal shale gas wells are typically higher (e.g., approximately 4 million gallons (Vengosh et al., 2014)). There is also wide variation within and among states and basins in the median water volumes used per well, from more than 5 million gal (19 million L) in Arkansas, Louisiana and West Virginia to less than 1 million gal (3.8 million L) in California, New Mexico, and Utah, among others. This variation results from several factors, including well length, formation geology, and fracturing fluid formulation.
• How might cumulative water withdrawals for hydraulic fracturing affect drinking water quantity?
Cumulatively, hydraulic fracturing uses billions of gallons of water each year at the national and state scales, and even in some counties. As noted above, hydraulic fracturing water use and consumption are generally less than 1% of total annual water use and consumption at these scales. However, there are a few counties in the United States where these percentages are higher. For 2011 and 2012, annual hydraulic fracturing water use was 10% or more compared to 2010 total annual water use in 6.5% of counties with FracFocus disclosures analyzed by the EPA, 30% or more in 2.2% of counties, and 50% or more in 1.0% of counties. Consumption estimates followed the same general pattern. In these counties, hydraulic fracturing is a relatively large user and consumer of water.
High fracturing water use or consumption alone does not necessarily result in impacts to drinking water resources. Rather, impacts result from the combination of water use or consumption and water availability at local scales. In our survey of published literature, we did not find a case where hydraulic fracturing water use or consumption alone caused a drinking water well or stream to run dry. This could indicate an absence of effects or a lack of documentation in the literature we reviewed. Additionally, water availability is rarely impacted by just one use or factor alone. In Louisiana, for example, the state requested hydraulic fracturing operations switch from ground to surface water, due to concerns that ground water withdrawals for fracturing could, in combination with other uses, adversely affect drinking water supplies.
The potential for impacts to drinking water resources from hydraulic fracturing water withdrawals is highest in areas with relatively high fracturing water use and low water availability. Southern and western Texas are two locations where hydraulic fracturing water use, low water availability, drought, and reliance on declining ground water has the potential to affect the quantity of drinking water resources. Any impacts are likely to be realized locally within these areas. In a detailed case study of southern Texas, Scanlon et al. (2014) observed generally adequate water supplies for hydraulic fracturing, except in specific locations. They found excessive drawdown of local ground water in a small proportion (approximately 6% of the area) of the Eagle Ford Shale. They suggested water management, particularly a shift towards brackish water use, could minimize potential future impacts to fresh water resources.
This document is a draft for review purposes only and does not constitute Agency policy.
Hydraulic Fracturing Drinking Water Assessment Executive Summary
The potential for impacts to drinking water quantity due to hydraulic fracturing water use appears 1 2 3 4 5 6 7 8 9
10 11
12 13 14 15 16 17 18
19 20 21 22 23 24
25 26 27 28 29 30 31 32 33
34 35 36 37
to be lower—but not eliminated—in other areas of the United States. Future problems could arise if hydraulic fracturing increases substantially in areas with low water availability, or in times of water shortages. In detailed case studies in western Colorado and northeastern Pennsylvania, the EPA did not find current impacts, but did conclude that streams could be vulnerable to water withdrawals from hydraulic fracturing. In northeast Pennsylvania, water management, such as minimum stream flow requirements, limits the potential for impacts, especially in small streams. In western North Dakota, ground water is limited, but the industry may have sufficient supplies of surface water from the Missouri River system. These location-specific examples emphasize the need to focus on regional and local dynamics when considering potential impacts of hydraulic fracturing water acquisition on drinking water resources.
• What are the possible impacts of water withdrawals for hydraulic fracturing on water quality?Water withdrawals for hydraulic fracturing, similar to all water withdrawals, have the potential to alter the quality of drinking water resources. Ground water withdrawals exceeding natural recharge rates decrease water storage in aquifers, potentially mobilizing contaminants or allowing the infiltration of lower quality water from the land surface or adjacent formations. Withdrawals could also decrease ground water discharge to streams, potentially affecting surface water quality. Areas with large amounts of sustained ground water pumping are most likely to experience impacts, particularly drought-prone regions with limited ground water recharge.
Surface water withdrawals also have the potential to affect water quality. Withdrawals may lower water levels and alter stream flow, potentially decreasing a stream’s capacity to dilute contaminants. Case studies by the EPA show that streams can be vulnerable to changes in water quality due to water withdrawals, particularly smaller streams and during periods of low flow. Management of the rate and timing of surface water withdrawals has been shown to help mitigate potential impacts of hydraulic fracturing withdrawals on water quality.
Chemical Mixing Hydraulic fracturing fluids are developed to perform specific functions, including: create and extend fractures, transport proppant, and place proppant in the fractures. The fluid generally consists of three parts: (1) the base fluid, which is the largest constituent by volume and is typically water; (2) the additives, which can be a single chemical or a mixture of chemicals; and (3) the proppant. Additives are chosen to serve a specific purpose (e.g., adjust pH, increase viscosity, limit bacterial growth). Chemicals generally comprise a small percentage (typically 2% or less) of the overall injected fluid volume. Because over one million gallons of fluids are typically injected per well, thousands of gallons of chemicals can be potentially stored on-site and used during hydraulic fracturing activities.
On-site storage, mixing, and pumping of chemicals and hydraulic fracturing fluids have the potential to result in accidental releases, such as spills or leaks. Potential impacts to drinking water resources from spills of hydraulic fracturing fluids and chemicals depend on the characteristics of the spills, and the fate, transport, and the toxicity of chemicals spilled.
This document is a draft for review purposes only and does not constitute Agency policy.
June 2015 ES-10 DRAFT—DO NOT CITE OR QUOTE
Hydraulic Fracturing Drinking Water Assessment Executive Summary
Research Questions: Chemical Mixing
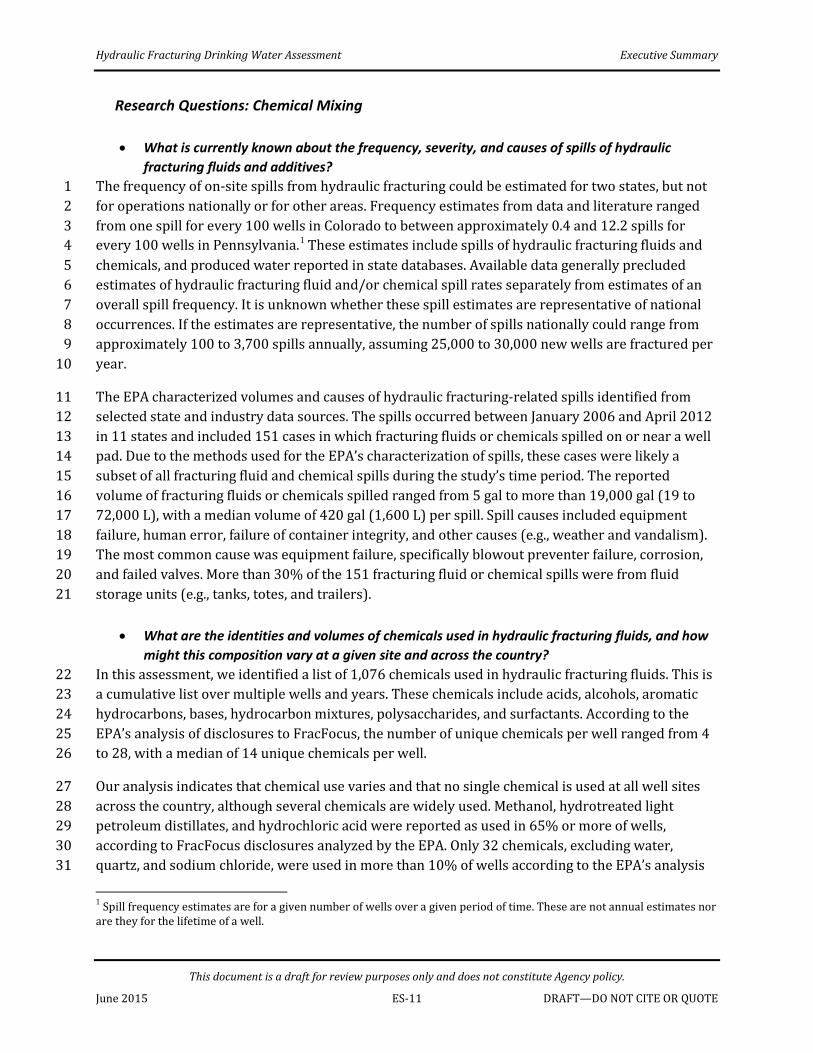
• What is currently known about the frequency, severity, and causes of spills of hydraulic fracturing fluids and additives?
The frequency of on-site spills from hydraulic fracturing could be estimated for two states, but not 1 2 3 4 5 6 7 8 9
10
11 12 13 14 15 16 17 18 19 20 21
22 23 24 25 26
27 28 29 30 31
for operations nationally or for other areas. Frequency estimates from data and literature ranged from one spill for every 100 wells in Colorado to between approximately 0.4 and 12.2 spills for every 100 wells in Pennsylvania.1 These estimates include spills of hydraulic fracturing fluids and chemicals, and produced water reported in state databases. Available data generally precluded estimates of hydraulic fracturing fluid and/or chemical spill rates separately from estimates of an overall spill frequency. It is unknown whether these spill estimates are representative of national occurrences. If the estimates are representative, the number of spills nationally could range from approximately 100 to 3,700 spills annually, assuming 25,000 to 30,000 new wells are fractured per year.
The EPA characterized volumes and causes of hydraulic fracturing-related spills identified from selected state and industry data sources. The spills occurred between January 2006 and April 2012 in 11 states and included 151 cases in which fracturing fluids or chemicals spilled on or near a well pad. Due to the methods used for the EPA’s characterization of spills, these cases were likely a subset of all fracturing fluid and chemical spills during the study’s time period. The reported volume of fracturing fluids or chemicals spilled ranged from 5 gal to more than 19,000 gal (19 to 72,000 L), with a median volume of 420 gal (1,600 L) per spill. Spill causes included equipment failure, human error, failure of container integrity, and other causes (e.g., weather and vandalism). The most common cause was equipment failure, specifically blowout preventer failure, corrosion, and failed valves. More than 30% of the 151 fracturing fluid or chemical spills were from fluid storage units (e.g., tanks, totes, and trailers).
• What are the identities and volumes of chemicals used in hydraulic fracturing fluids, and how might this composition vary at a given site and across the country?
In this assessment, we identified a list of 1,076 chemicals used in hydraulic fracturing fluids. This is a cumulative list over multiple wells and years. These chemicals include acids, alcohols, aromatic hydrocarbons, bases, hydrocarbon mixtures, polysaccharides, and surfactants. According to the EPA’s analysis of disclosures to FracFocus, the number of unique chemicals per well ranged from 4 to 28, with a median of 14 unique chemicals per well.
Our analysis indicates that chemical use varies and that no single chemical is used at all well sites across the country, although several chemicals are widely used. Methanol, hydrotreated light petroleum distillates, and hydrochloric acid were reported as used in 65% or more of wells, according to FracFocus disclosures analyzed by the EPA. Only 32 chemicals, excluding water, quartz, and sodium chloride, were used in more than 10% of wells according to the EPA’s analysis
1 Spill frequency estimates are for a given number of wells over a given period of time. These are not annual estimates nor are they for the lifetime of a well.
This document is a draft for review purposes only and does not constitute Agency policy.
June 2015 ES-11 DRAFT—DO NOT CITE OR QUOTE
Hydraulic Fracturing Drinking Water Assessment Executive Summary
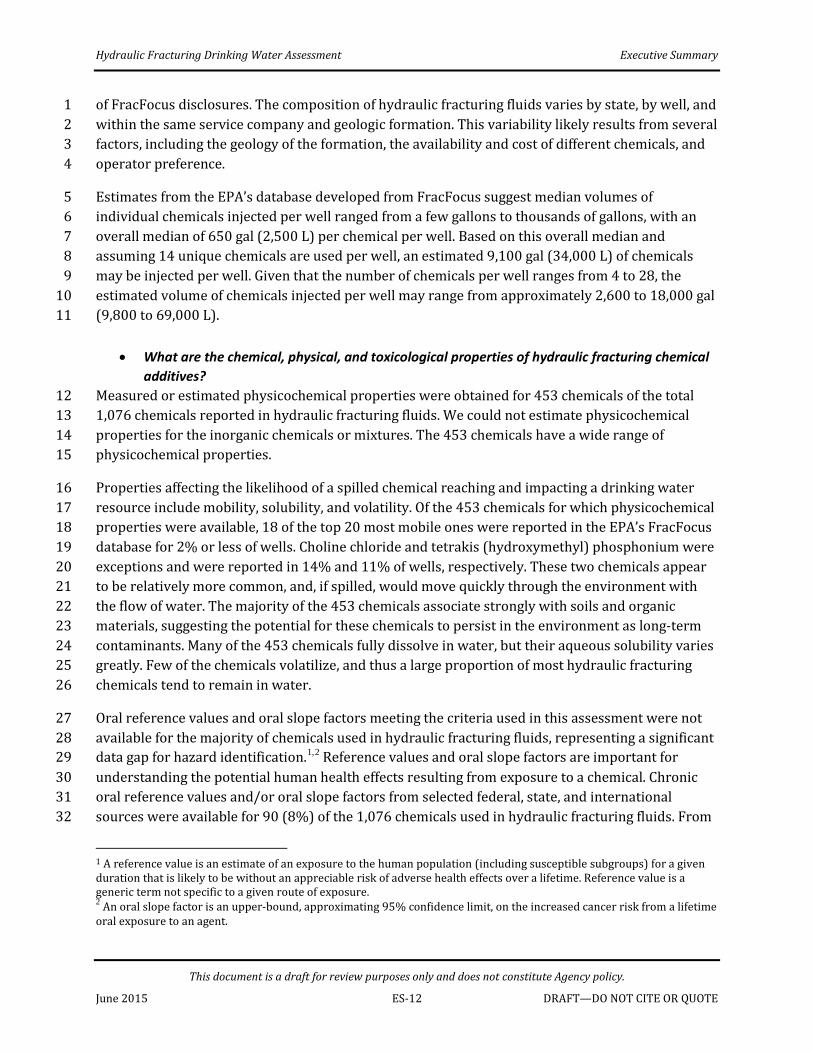
of FracFocus disclosures. The composition of hydraulic fracturing fluids varies by state, by well, and 1
2 3 4
5 6 7 8 9
10 11
12 13 14 15
16 17 18 19 20 21 22 23 24 25 26
27 28 29 30 31 32
within the same service company and geologic formation. This variability likely results from several factors, including the geology of the formation, the availability and cost of different chemicals, and operator preference.
Estimates from the EPA’s database developed from FracFocus suggest median volumes of individual chemicals injected per well ranged from a few gallons to thousands of gallons, with an overall median of 650 gal (2,500 L) per chemical per well. Based on this overall median and assuming 14 unique chemicals are used per well, an estimated 9,100 gal (34,000 L) of chemicals may be injected per well. Given that the number of chemicals per well ranges from 4 to 28, the estimated volume of chemicals injected per well may range from approximately 2,600 to 18,000 gal (9,800 to 69,000 L).
• What are the chemical, physical, and toxicological properties of hydraulic fracturing chemical additives?
Measured or estimated physicochemical properties were obtained for 453 chemicals of the total 1,076 chemicals reported in hydraulic fracturing fluids. We could not estimate physicochemical properties for the inorganic chemicals or mixtures. The 453 chemicals have a wide range of physicochemical properties.
Properties affecting the likelihood of a spilled chemical reaching and impacting a drinking water resource include mobility, solubility, and volatility. Of the 453 chemicals for which physicochemical properties were available, 18 of the top 20 most mobile ones were reported in the EPA’s FracFocus database for 2% or less of wells. Choline chloride and tetrakis (hydroxymethyl) phosphonium were exceptions and were reported in 14% and 11% of wells, respectively. These two chemicals appear to be relatively more common, and, if spilled, would move quickly through the environment with the flow of water. The majority of the 453 chemicals associate strongly with soils and organic materials, suggesting the potential for these chemicals to persist in the environment as long-term contaminants. Many of the 453 chemicals fully dissolve in water, but their aqueous solubility varies greatly. Few of the chemicals volatilize, and thus a large proportion of most hydraulic fracturing chemicals tend to remain in water.
Oral reference values and oral slope factors meeting the criteria used in this assessment were not available for the majority of chemicals used in hydraulic fracturing fluids, representing a significant data gap for hazard identification.1,2 Reference values and oral slope factors are important for understanding the potential human health effects resulting from exposure to a chemical. Chronic oral reference values and/or oral slope factors from selected federal, state, and international sources were available for 90 (8%) of the 1,076 chemicals used in hydraulic fracturing fluids. From
1 A reference value is an estimate of an exposure to the human population (including susceptible subgroups) for a given duration that is likely to be without an appreciable risk of adverse health effects over a lifetime. Reference value is a generic term not specific to a given route of exposure. 2 An oral slope factor is an upper-bound, approximating 95% confidence limit, on the increased cancer risk from a lifetime oral exposure to an agent.
This document is a draft for review purposes only and does not constitute Agency policy.
June 2015 ES-12 DRAFT—DO NOT CITE OR QUOTE
Hydraulic Fracturing Drinking Water Assessment Executive Summary
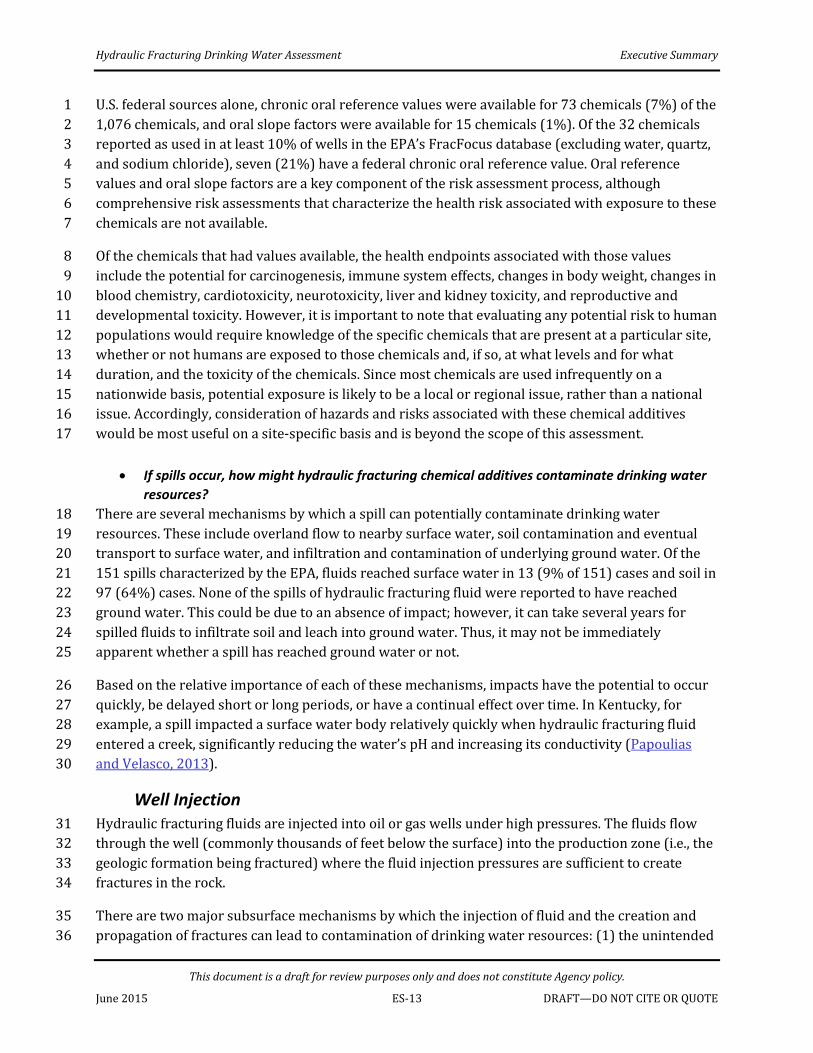
U.S. federal sources alone, chronic oral reference values were available for 73 chemicals (7%) of the 1
2 3 4 5 6 7
8 9
10 11 12 13 14 15 16 17
18 19 20 21 22 23 24 25
26 27 28 29 30
31 32 33 34
35 36
1,076 chemicals, and oral slope factors were available for 15 chemicals (1%). Of the 32 chemicals reported as used in at least 10% of wells in the EPA’s FracFocus database (excluding water, quartz, and sodium chloride), seven (21%) have a federal chronic oral reference value. Oral reference values and oral slope factors are a key component of the risk assessment process, although comprehensive risk assessments that characterize the health risk associated with exposure to these chemicals are not available.
Of the chemicals that had values available, the health endpoints associated with those values include the potential for carcinogenesis, immune system effects, changes in body weight, changes in blood chemistry, cardiotoxicity, neurotoxicity, liver and kidney toxicity, and reproductive and developmental toxicity. However, it is important to note that evaluating any potential risk to human populations would require knowledge of the specific chemicals that are present at a particular site, whether or not humans are exposed to those chemicals and, if so, at what levels and for what duration, and the toxicity of the chemicals. Since most chemicals are used infrequently on a nationwide basis, potential exposure is likely to be a local or regional issue, rather than a national issue. Accordingly, consideration of hazards and risks associated with these chemical additives would be most useful on a site-specific basis and is beyond the scope of this assessment.
• If spills occur, how might hydraulic fracturing chemical additives contaminate drinking water resources?
There are several mechanisms by which a spill can potentially contaminate drinking water resources. These include overland flow to nearby surface water, soil contamination and eventual transport to surface water, and infiltration and contamination of underlying ground water. Of the 151 spills characterized by the EPA, fluids reached surface water in 13 (9% of 151) cases and soil in 97 (64%) cases. None of the spills of hydraulic fracturing fluid were reported to have reached ground water. This could be due to an absence of impact; however, it can take several years for spilled fluids to infiltrate soil and leach into ground water. Thus, it may not be immediately apparent whether a spill has reached ground water or not.
Based on the relative importance of each of these mechanisms, impacts have the potential to occur quickly, be delayed short or long periods, or have a continual effect over time. In Kentucky, for example, a spill impacted a surface water body relatively quickly when hydraulic fracturing fluid entered a creek, significantly reducing the water’s pH and increasing its conductivity (Papoulias and Velasco, 2013).
Well Injection Hydraulic fracturing fluids are injected into oil or gas wells under high pressures. The fluids flow through the well (commonly thousands of feet below the surface) into the production zone (i.e., the geologic formation being fractured) where the fluid injection pressures are sufficient to create fractures in the rock.
There are two major subsurface mechanisms by which the injection of fluid and the creation and propagation of fractures can lead to contamination of drinking water resources: (1) the unintended
This document is a draft for review purposes only and does not constitute Agency policy.
Hydraulic Fracturing Drinking Water Assessment Executive Summary
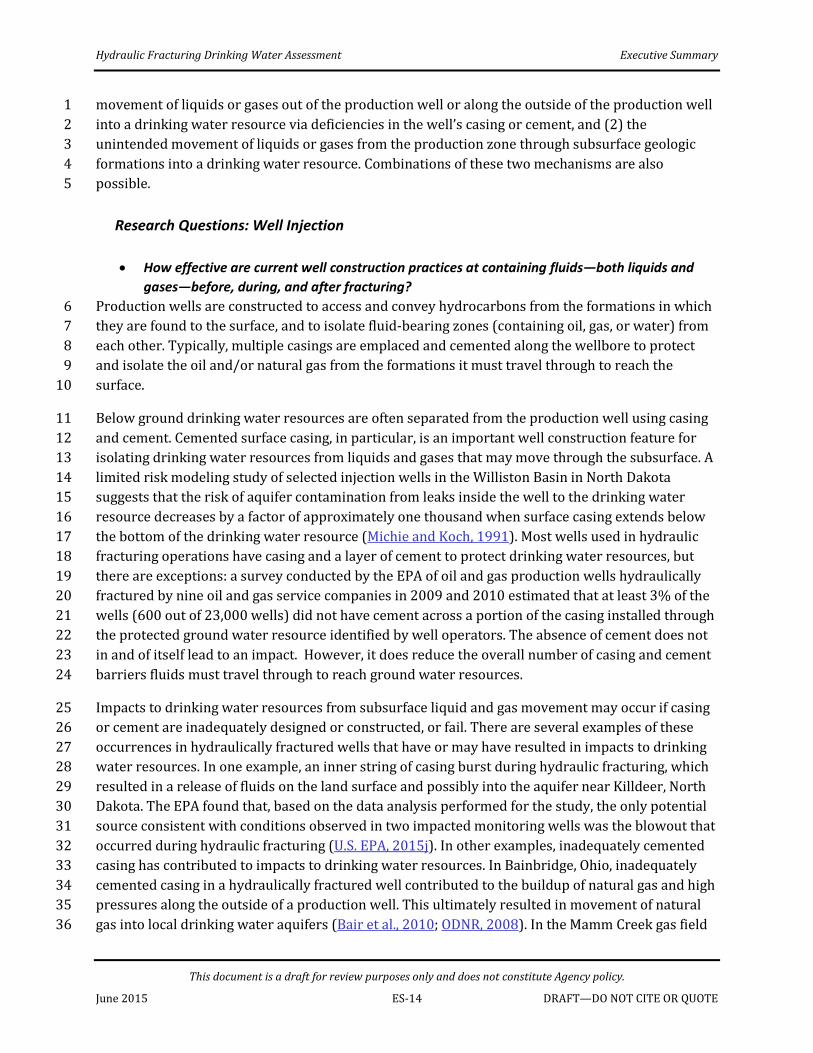
movement of liquids or gases out of the production well or along the outside of the production well 1 2 3 4 5
6 7 8 9
10
11 12 13 14 15 16 17 18 19 20 21 22 23 24
25 26 27 28 29 30 31 32 33 34 35 36
into a drinking water resource via deficiencies in the well’s casing or cement, and (2) the unintended movement of liquids or gases from the production zone through subsurface geologic formations into a drinking water resource. Combinations of these two mechanisms are also possible.
Research Questions: Well Injection
• How effective are current well construction practices at containing fluids—both liquids andgases—before, during, and after fracturing?
Production wells are constructed to access and convey hydrocarbons from the formations in which they are found to the surface, and to isolate fluid-bearing zones (containing oil, gas, or water) from each other. Typically, multiple casings are emplaced and cemented along the wellbore to protect and isolate the oil and/or natural gas from the formations it must travel through to reach the surface.
Below ground drinking water resources are often separated from the production well using casing and cement. Cemented surface casing, in particular, is an important well construction feature for isolating drinking water resources from liquids and gases that may move through the subsurface. A limited risk modeling study of selected injection wells in the Williston Basin in North Dakota suggests that the risk of aquifer contamination from leaks inside the well to the drinking water resource decreases by a factor of approximately one thousand when surface casing extends below the bottom of the drinking water resource (Michie and Koch, 1991). Most wells used in hydraulic fracturing operations have casing and a layer of cement to protect drinking water resources, but there are exceptions: a survey conducted by the EPA of oil and gas production wells hydraulically fractured by nine oil and gas service companies in 2009 and 2010 estimated that at least 3% of the wells (600 out of 23,000 wells) did not have cement across a portion of the casing installed through the protected ground water resource identified by well operators. The absence of cement does not in and of itself lead to an impact. However, it does reduce the overall number of casing and cement barriers fluids must travel through to reach ground water resources.
Impacts to drinking water resources from subsurface liquid and gas movement may occur if casing or cement are inadequately designed or constructed, or fail. There are several examples of these occurrences in hydraulically fractured wells that have or may have resulted in impacts to drinking water resources. In one example, an inner string of casing burst during hydraulic fracturing, which resulted in a release of fluids on the land surface and possibly into the aquifer near Killdeer, North Dakota. The EPA found that, based on the data analysis performed for the study, the only potential source consistent with conditions observed in two impacted monitoring wells was the blowout that occurred during hydraulic fracturing (U.S. EPA, 2015j). In other examples, inadequately cemented casing has contributed to impacts to drinking water resources. In Bainbridge, Ohio, inadequately cemented casing in a hydraulically fractured well contributed to the buildup of natural gas and high pressures along the outside of a production well. This ultimately resulted in movement of natural gas into local drinking water aquifers (Bair et al., 2010; ODNR, 2008). In the Mamm Creek gas field
This document is a draft for review purposes only and does not constitute Agency policy.
Hydraulic Fracturing Drinking Water Assessment Executive Summary
in Colorado, inadequate cement placement in a production well allowed methane and benzene to 1
2 3 4 5
6 7 8 9
10 11 12 13 14
15 16 17 18 19 20 21
22 23 24 25 26 27 28 29
30 31 32 33 34 35 36 37 38
migrate along the production well and through natural faults and fractures to drinking water resources (Science Based Solutions LLC, 2014; Crescent, 2011; COGCC, 2004). These cases illustrate how construction issues, sustained casing pressure, and the presence of natural faults and fractures can work together to create pathways for fluids to migrate toward drinking water resources.
Fracturing older wells may also increase the potential for impacts to drinking water resources via movement of gases and liquids from the inside of the production well or along the outside of the production well to ground water resources. The EPA estimated that 6% of 23,000 oil and gas production wells were drilled more than 10 years before being hydraulically fractured in 2009 or 2010. Although new wells can be designed to withstand the stresses associated with hydraulic fracturing operations, older wells may not have been built or tested to the same specifications and their reuse for this purpose could be of concern. Moreover, aging and use of the well can contribute to casing degradation, which can be accelerated by exposure to corrosive chemicals, such as hydrogen sulfide, carbonic acid, and brines.
• Can subsurface migration of fluids—both liquids and gases—to drinking water resources occur, and what local geologic or artificial features might allow this?
Physical separation between the production zone and drinking water resources can help protect drinking water. Many hydraulic fracturing operations target deep formations such as the Marcellus Shale or the Haynesville Shale (Louisiana/Texas), where the vertical distance between the base of drinking water resources and the top of the shale formation may be a mile or greater. Numerical modeling and microseismic studies based on a Marcellus Shale-like environment suggest that fractures created during hydraulic fracturing are unlikely to extend upward from these deep formations into shallow drinking water aquifers.
Not all hydraulic fracturing is performed in zones that are deep below drinking water resources. For example, operations in the Antrim Shale (Michigan) and the New Albany Shale (Illinois/Indiana/Kentucky) take place at shallower depths (100 to 1,900 ft or 30 to 579 m), with less vertical separation between the formation and drinking water resources. The EPA’s survey of oil and gas production wells hydraulically fractured by nine service companies in 2009 and 2010 estimated that 20% of 23,000 wells had less than 2,000 ft (610 m) of measured distance between the point of shallowest hydraulic fracturing and the base of the protected ground water resources reported by well operators.
There are also places in the subsurface where oil and gas resources and drinking water resources co-exist in the same formation. Evidence indicates that hydraulic fracturing occurs within these formations. This results in the introduction of fracturing fluids into formations that may currently serve, or in the future could serve, as a source of drinking water for public or private use. According to the data examined, the overall frequency of occurrence of this practice appears to be low, with the activity generally concentrated in some areas in the western United States. The practice of injecting fracturing fluids into a formation that also contains a drinking water resource directly affects the quality of that water, since some of the fluid likely remains in the formation following hydraulic fracturing. Hydraulic fracturing in a drinking water resource is a concern in the short-
This document is a draft for review purposes only and does not constitute Agency policy.
Hydraulic Fracturing Drinking Water Assessment Executive Summary
term (should there be people currently using these zones as a drinking water supply) and the long-1
2
3 4 5 6 7 8 9
10 11 12 13
14 15 16 17 18 19 20 21 22 23
24 25 26 27 28 29 30 31
32 33 34 35 36 37
term (if drought or other conditions necessitate the future use of these zones for drinking water).
Liquid and gas movement from the production zone to underground drinking water resources may also occur via other production wells or injection wells near hydraulic fracturing operations. Fractures created during hydraulic fracturing can intersect nearby wells or their fracture networks, resulting in the flow of fluids into those wells. These well communications, or “frac hits,” are more likely to occur if wells are close to each other or on the same well pad. In the Woodford Shale in Oklahoma, the likelihood of well communication was less than 10% between wells more than 4,000 ft (1,219 m) apart, but rose to nearly 50% between wells less than 1,000 ft (305 m) apart (Ajani and Kelkar, 2012). If an offset well is not able to withstand the stresses applied during the hydraulic fracturing of a neighboring well, well components may fail, which could result in a release of fluids at the surface from the offset well. The EPA identified incidents in which surface spills of hydraulic fracturing-related fluids were attributed to well communication events.
Older or inactive wells—including oil and gas wells, injection wells, or drinking water wells—near a hydraulic fracturing operation may pose an even greater potential for impacts. A study in Oklahoma found that older wells were more likely to be negatively affected by the stresses applied by hydraulic fracturing in neighboring wells (Ajani and Kelkar, 2012). In some cases, inactive wells in the vicinity of hydraulic fracturing activities may not have been plugged properly—many wells plugged before the 1950s were done so with little or no cement. The Interstate Oil and Gas Compact Commission estimates that over one million wells may have been drilled in the United States prior to a formal regulatory system being in place, and the status and location of many of these wells are unknown (IOGCC, 2008). State programs exist to plug identified inactive wells, and work is on-going to identify and address such wells.
Flowback and Produced Water Water, of variable quality, is a byproduct of oil and gas production. After hydraulic fracturing, the injection pressure is released and water flows back from the well. Initially this water is similar to the hydraulic fracturing fluid, but as time goes on the composition is affected by the characteristics of the formation and possible reactions between the formation and the fracturing fluid. Water initially produced from the well after hydraulic fracturing is sometimes called flowback in the literature, and the term appears in this assessment. However, hydraulic fracturing fluids and any formation water returning to the surface are often referred to collectively as produced water. This definition of produced water is used in this assessment.
The amount of produced water varies, but typically averages 10% to 25% of injected volumes, depending upon the amount of time since fracturing and the particular well (see Figure ES-3a). However, there are exceptions to this, such as in the Barnett Shale in Texas where the total volume of produced water can equal or exceed the injected volume of hydraulic fracturing fluid (see Figure ES-3b). Flow rates are generally high initially, and then decrease over time throughout oil or gas production.
This document is a draft for review purposes only and does not constitute Agency policy.
Hydraulic Fracturing Drinking Water Assessment Executive Summary
Impacts on drinking water resources have the potential to occur if produced water is spilled and 1
2 3 4
5 6 7 8 9
10 11 12
13 14 15 16 17 18 19
20 21 22 23 24
25 26 27 28 29 30 31 32
enters surface water or ground water. Environmental transport of chemical constituents in produced water depends on the characteristics of the spill (e.g., volume and duration), the composition of spilled fluids, and the characteristics of the surrounding environment.
Research Questions: Flowback and Produced Water
• What is currently known about the frequency, severity, and causes of spills of flowback and produced water?
Surface spills of produced water from hydraulically fractured wells have occurred. As noted in the Chemical Mixing section above, the frequency of on-site spills from hydraulic fracturing activities could be estimated for two states, but not nationally. Estimates of spill frequencies at hydraulic fracturing sites in Colorado and Pennsylvania, including spills of produced water, ranged from approximately 0.4 to 12.2 spills per 100 wells. Available data generally precluded estimates of produced water spill rates separately from estimates of overall spill frequency. Away from the well, produced water spills from pipelines and truck transport also have the potential to impact drinking water resources.
The EPA characterized spill volumes and causes for 225 cases in which produced water spilled on or near a well pad. These spills occurred between January 2006 and April 2012 in 11 states. The median reported volume per produced water spill was 990 gallons (3,750 L), more than double that for spills of hydraulic fracturing fluids and chemicals. The causes of produced water spills were reported as human error, equipment failure, container integrity failure, miscellaneous causes (e.g., well communication), and unknown causes. Most of the total volume spilled (74%) for all 225 cases combined was caused by a failure of container integrity.
• What is the composition of hydraulic fracturing flowback and produced water, and what factors might influence this composition?
A combination of factors influence the composition of produced water, including: the composition of injected hydraulic fracturing fluids, the type of formation fractured, subsurface processes, and residence time. The initial chemical composition of produced water primarily reflects the chemistry of the injected fluids. At later times, the chemical composition of produced water reflects the geochemistry of the fractured formation.
Produced water varies in quality from fresh to highly saline, and can contain high levels of major anions and cations, metals, organics, and naturally occurring radionuclides. Produced water from shale and tight gas formations typically contains high levels of total dissolved solids (TDS) and ionic constituents (e.g., bromide, calcium, chloride, iron, potassium, manganese, magnesium, and sodium). Produced water also may contain metals (e.g., barium, cadmium, chromium, lead, and mercury), and organic compounds such as benzene. Produced water from coalbed methane typically has much lower TDS levels compared to other produced water types, particularly if the coalbed was deposited under fresh water conditions..
This document is a draft for review purposes only and does not constitute Agency policy.
June 2015 ES-17 DRAFT—DO NOT CITE OR QUOTE
Hydraulic Fracturing Drinking Water Assessment Executive Summary
We identified 134 chemicals that have been detected in hydraulic fracturing produced water. These 1 2 3 4 5
6 7 8 9
10 11 12 13 14
15 16 17 18 19 20 21 22
23 24 25 26 27 28 29 30
31 32 33 34 35 36 37 38
include chemicals added during the chemical mixing stage, as well as naturally occurring organic chemicals and radionuclides, metals, and other constituents of subsurface rock formations mobilized by the hydraulic fracturing process. Data on measured chemical concentrations in produced water were available for 75 of these 134 chemicals.
Most of the available data on produced water content are for shale and coalbed methane formations, while less data are available for tight formations, such as sandstones. The composition of produced water must be determined through sampling and analysis, both of which have limitations—the former due to challenges in accessing production equipment, and the latter due to difficulties identifying target analytes before analysis and the lack of appropriate analytical methods. Most current data are for inorganic chemicals, while less data exist for organic chemicals. Many more organic chemicals were reported as used in hydraulic fracturing fluid than have been identified in produced water. The difference may be due to analytical limitations, limited study scopes, and undocumented subsurface reactions.
• What are the chemical, physical, and toxicological properties of hydraulic fracturing flowbackand produced water constituents?
The identified constituents of produced water include inorganic chemicals (cations and anions, i.e., metals, metalloids, non-metals, and radioactive materials), organic chemicals and compounds, and unidentified materials measured as total organic carbon and dissolved organic carbon. Some constituents are readily transported with water (i.e., chloride and bromide), while others depend strongly on the geochemical conditions in the receiving water body (i.e., radium and barium), and assessment of their transport is based on site-specific factors. We were able to obtain actual or estimated physicochemical properties for 86 (64%) of the 134 chemicals identified in produced water.
As in the case of chemicals in hydraulic fracturing fluid, chemical properties that affect the likelihood of an organic chemical in produced water reaching and impacting drinking water resources include: mobility, solubility, and volatility. In general, physicochemical properties suggest that organic chemicals in produced water tend to be less mobile in the environment. Consequently, if spilled, these chemicals may remain in soils or sediments near spill sites. Low mobility may result in smaller dissolved contaminant plumes in ground water, although these chemicals can be transported with sediments in surface water or small particles in ground water. Organic chemical properties vary with salinity, and effects depend on the nature of the chemical.
Oral reference values and/or oral slope factors from selected federal, state, and international sources were available for 83 (62%) of the 134 chemicals detected in produced water. From U.S. federal sources alone, chronic oral reference values were available for 70 (52%) of the 134 chemicals, and oral slope factors were available for 20 chemicals (15%). Of the chemicals that had values available, noted health effects include the potential for carcinogenesis, immune system effects, changes in body weight, changes in blood chemistry, pulmonary toxicity, neurotoxicity, liver and kidney toxicity, and reproductive and developmental toxicity. As noted above, evaluating any potential risk to human populations would require knowledge of the specific chemicals that are
This document is a draft for review purposes only and does not constitute Agency policy.
June 2015 ES-18 DRAFT—DO NOT CITE OR QUOTE
Hydraulic Fracturing Drinking Water Assessment Executive Summary
present at a particular site, whether or not humans are exposed to those chemicals and, if so, at 1
2 3 4 5 6
7 8 9
10
11 12 13 14 15 16 17
18 19 20 21 22
23 24 25 26 27 28 29
30 31 32 33 34 35 36
what levels and for what duration, and the toxicity of the chemicals. The chemicals present in produced water can vary based on the formation and specific well, due to differences in fracturing fluid formulation and formation geology. Accordingly, consideration of hazards and risks associated with these chemicals would be most useful on a site-specific basis and is beyond the scope of this assessment.
• If spills occur, how might hydraulic fracturing flowback and produced water contaminate drinking water resources?
Impacts to drinking water resources from spills or releases of produced water depend on the volume, timing, and composition of the produced water. Impacts are more likely the greater the volume of the spill, the longer the duration of the release, and the higher the concentration of produced water constituents (i.e., salts, naturally occurring radioactive material, and metals).
The EPA characterization of hydraulic fracturing-related spills found that 8% of the 225 produced water spills included in the study reached surface water or ground water. These spills tended to be of greater volume than spills that did not reach a water body. A well blowout in Bradford County, Pennsylvania spilled an estimated 10,000 gal (38,000 L) of produced water into a tributary of Towanda Creek, a state-designated trout fishery. The largest volume spill identified in this assessment occurred in North Dakota, where approximately 2.9 million gal (11 million L) of produced water spilled from a broken pipeline and impacted surface and ground water.
Chronic releases can and do occur from produced water disposed in unlined pits or impoundments, and can have long-term impacts. Ground water impacts may persist longer than surface water impacts because of lower flow rates and decreased mixing. Plumes from unlined pits used for produced water have been shown to persist for long periods and extend to nearby surface water bodies.
Wastewater Management and Waste Disposal Hydraulic fracturing generates large volumes of produced water that require management. In this section we refer to produced water and any other waters generated onsite by the single term “wastewater.” Clark and Veil (2009) estimated that, in 2007, approximately one million active oil and gas wells in the United States generated 2.4 billion gal per day (9.1 billion L per day) of wastewater. There is currently no reliable way to estimate what fraction of this total volume can be attributed to hydraulically fractured wells. Wastewater volumes in a region can increase sharply as hydraulic fracturing activity increases.
Wastewater management and disposal could affect drinking water resources through multiple mechanisms, including: inadequate treatment of wastewater prior to discharge to a receiving water, accidental releases during transport or leakage from wastewater storage pits, unpermitted discharges, migration of constituents in wastewaters following land application, inappropriate management of residual materials from treatment, or accumulation of wastewater constituents in sediments near outfalls of centralized waste treatment facilities (CWTs) or publicly owned treatment works (POTWs) that have treated hydraulic fracturing wastewater. The scope of this
This document is a draft for review purposes only and does not constitute Agency policy.
Hydraulic Fracturing Drinking Water Assessment Executive Summary
assessment excludes potential impacts to drinking water from the disposal of hydraulic fracturing 1
2
3 4 5 6 7 8 9
10
11 12 13 14 15 16 17 18 19 20
21 22 23 24 25 26 27
28 29 30 31 32
33 34 35
wastewater in underground injection control (UIC) wells.
Research Questions: Wastewater Management and Waste Disposal
• What are the common treatment and disposal methods for hydraulic fracturing wastewater, and where are these methods practiced?
Hydraulic fracturing wastewater is managed using several options, including: disposal in UIC wells (also called disposal wells); through evaporation ponds; treatment at CWTs, followed by reuse or by discharge to either surface waters or POTWs; reuse with minimal or no treatment; and land application or road spreading. Treatment of hydraulic fracturing wastewater by POTWs was used in the past in Pennsylvania. This decreased sharply following new state-level requirements and a request by the Pennsylvania Department of Environmental Protection (PA DEP) for well operators to stop sending Marcellus Shale wastewater to POTWs (and 15 CWTs) discharging to surface waters.
Wastewater management decisions are generally based on the availability and associated costs (including transportation) of disposal or treatment facilities. A survey of state agencies found that, in 2007, more than 98% of produced water from the oil and gas industry was managed via underground injection (Clark and Veil, 2009). Available information suggests that disposal wells are also the primary management practice for hydraulic fracturing wastewater in most regions in the United States (e.g., the Barnett Shale; see Figure ES-3b). The Marcellus Shale region is a notable exception, where most wastewater is reused because of the small number of disposal wells in Pennsylvania (see Figure ES-3a). Although this assessment does not address potential effects on drinking water resources from the use of disposal wells, any changes in cost of disposal or availability of disposal wells would likely influence wastewater management decisions.
Wastewater from some hydraulic fracturing operations is sent to CWTs, which may discharge treated wastewater to surface waters, POTWs, or back to well operators for reuse in other hydraulic fracturing operations. Available data indicate that the use of CWTs for treating hydraulic fracturing wastewater is greater in the Marcellus Shale region than other parts of the country. Most of the CWTs accepting hydraulic fracturing wastewater in Pennsylvania cannot significantly reduce TDS, and many of these facilities provide treated wastewater to well operators for reuse and do not currently discharge treated wastewater to surface water.
Reuse of wastewater for subsequent hydraulic fracturing operations may require no treatment, minimal treatment, or more extensive treatment. Operators reuse a substantial amount (ca. 70-90%) of Marcellus Shale wastewater in Pennsylvania (see Figure ES-3a). Lesser amounts of reuse occur in other areas (e.g., the Barnett Shale; see Figure ES-3b). In certain formations, such as the Bakken Shale in North Dakota, there is currently no indication of appreciable reuse.
In some cases, wastewater is used for land applications such as irrigation or road spreading for deicing or dust suppression. Land application has the potential to introduce wastewater constituents into surface water and ground water due to runoff and migration of brines. Studies of
This document is a draft for review purposes only and does not constitute Agency policy.
Hydraulic Fracturing Drinking Water Assessment Executive Summary
road spreading of conventional oil and gas brines have found elevated levels of metals in soils and 1
2
3 4 5 6 7 8
9 10 11 12 13 14
15 16 17 18 19 20 21
22 23 24 25 26 27 28 29 30 31 32 33 34 35
chloride in ground water.
• How effective are conventional POTWs and commercial treatment systems in removing organic and inorganic contaminants of concern in hydraulic fracturing wastewater?
Publicly owned treatment works using basic treatment processes are not designed to effectively reduce TDS concentrations in highly saline hydraulic fracturing wastewater—although specific constituents or constituents groups can be removed (e.g., metals, oil, and grease by chemical precipitation or other processes). In some cases, wastewater treated at CWTs may be sent to a POTW for additional treatment and discharge. It is blended with POTW influent to prevent detrimental effects on biological processes in the POTW that aid in the treatment of wastewater.
Centralized waste treatment facilities with advanced wastewater treatment options such as reverse osmosis, thermal distillation, or mechanical vapor recompression, reduce TDS concentrations and can treat contaminants currently known to be in hydraulic fracturing wastewater. However, there are limited data on the composition of hydraulic fracturing wastewater, particularly for organic constituents. It is unknown whether advanced treatment systems are effective at removing constituents that are generally not tested for.
• What are the potential impacts from surface water disposal of treated hydraulic fracturing wastewater on drinking water treatment facilities?
Potential impacts to drinking water resources may occur if hydraulic fracturing wastewater is inadequately treated and discharged to surface water. Inadequately treated hydraulic fracturing wastewater may increase concentrations of TDS, bromide, chloride, and iodide in receiving waters. In particular, bromide and iodide are precursors of disinfection byproducts (DBPs) that can form in the presence of organic carbon in drinking water treatment plants or wastewater treatment plants. Drinking water treatment plants are required to monitor for certain types of DBPs, because some are toxic and can cause cancer.
Radionuclides can also be found in inadequately treated hydraulic fracturing wastewater from certain shales, such as the Marcellus. A recent study by the PA DEP (2015b) found elevated radium concentrations in the tens to thousands of picocuries per liter and gross alpha and gross beta in the hundreds to thousands of picocuries per liter in effluent samples from some CWTs receiving oil and gas wastewater. Radium, gross alpha, and gross beta were also detected in effluents from POTWs receiving oil and gas wastewater (mainly as effluent from CWTs), though at lower concentrations than from the CWTs. Research in Pennsylvania also indicates the accumulation of radium in sediments and soils affected by the outfalls of some treatment plants that have handled oil and gas wastewater, including Marcellus Shale wastewater, and other wastewaters (PA DEP, 2015b; Warner et al., 2013a). Mobilization of radium from sediments and potential impacts on downstream water quality depend upon how strongly the radium has sorbed to sediments. Impacts may also occur if sediment is resuspended (e.g., following storm events). There is no evidence of radionuclide contamination in drinking water intakes due to inadequately treated hydraulic fracturing wastewater.
This document is a draft for review purposes only and does not constitute Agency policy.
Hydraulic Fracturing Drinking Water Assessment Executive Summary
Hydraulic fracturing wastewaters contain other constituents such as barium, boron, and heavy 1
2 3 4 5
6 7 8 9
10 11
12 13 14 15 16 17 18 19 20 21 22
23 24 25 26 27 28 29 30 31 32 33 34 35
metals. Barium in particular has been documented in some shale gas produced waters. Little data exist on metal and organic compound concentrations in untreated and treated wastewaters in order to evaluate whether treatment is effective, and whether there are potential downstream effects on drinking water resources when wastewater is treated and discharged.
Key Data Limitations and Uncertainties
This assessment used available data and literature to examine the potential impacts of hydraulic fracturing from oil and gas on drinking water resources nationally. As part of this effort, we identified data limitations and uncertainties associated with current information on hydraulic fracturing and its potential to affect drinking water resources. In particular, data limitations preclude a determination of the frequency of impacts with any certainty. These limitations and uncertainties are discussed in brief below.
Limitations in Monitoring Data and Chemical Information While many activities conducted as part of the hydraulic fracturing water cycle take place above ground, hydraulic fracturing itself occurs below ground and is not directly observable. Additionally, potential mechanisms identified in this assessment may result in impacts to drinking water resources that are below ground (e.g., spilled fluids leaching into ground water). Data that could be used to characterize the presence, migration, or transformation of chemicals in the subsurface before, during, and after hydraulic fracturing were found to be scarce relative to the number of hydraulically fractured oil and gas production wells. Specifically, local water quality data needed to compare pre- and post-hydraulic fracturing conditions are not consistently collected or readily available. The limited amount of data collected before and during hydraulic fracturing activities reduces the ability to determine whether hydraulic fracturing affected drinking water resources in cases of alleged contamination.
Information (identity, frequency of use, physicochemical and toxicological properties, etc.) on the chemicals associated with the hydraulic fracturing water cycle is not complete and limits understanding of potential impacts on drinking water resources. Well operators claimed at least one chemical as confidential at more than 70% of wells reported to FracFocus and analyzed by the EPA. The identity of these chemicals, and other chemicals in produced water, are needed to understand their properties and would also help inform what chemicals to test for to establish baseline conditions and to test for in the event of a suspected drinking water impact. Of the 1,173 total chemicals identified by the EPA in hydraulic fracturing fluid and flowback and produced water, 147 have chronic oral reference values and/or oral slope factors from the sources that met the selection criteria for inclusion in this assessment. Because the majority of chemicals identified in this report do not have chronic oral reference values and/or oral slope factors, risk assessors at the local and regional level may need to use alternative sources of toxicity information that could introduce greater uncertainties.
This document is a draft for review purposes only and does not constitute Agency policy.
June 2015 ES-22 DRAFT—DO NOT CITE OR QUOTE
Hydraulic Fracturing Drinking Water Assessment Executive Summary
Other Contributing Limitations We found other limitations that hamper the ability to fully assess the potential impacts of hydraulic 1
2 3 4 5 6 7 8 9
10 11 12 13 14 15
16 17 18 19 20 21 22 23
24 25 26 27 28 29 30 31 32 33 34 35
36 37
fracturing on drinking water resources nationally. These include the number and location of hydraulically fractured wells, the location of drinking water resources, and information on changes in industry practices. The lack of a definitive well count particularly contributes to uncertainties regarding total water use or total wastewater volume estimates, and would limit any kind of cumulative impact assessment. Lack of specific information about private drinking water well locations and the depths of drinking water resources in relation to hydraulically fractured rock formations and well construction features (e.g., casing and cement) limits the ability to assess whether subsurface drinking water resources are isolated from hydraulically fractured oil and gas production wells. Finally, this assessment is a snapshot in time, and the industry is rapidly changing (e.g., the number of wells fractured, the location of activities, and the chemicals used). It is unclear how changes in industry practices could affect potential drinking water impacts in the future. Consideration of future development scenarios was not a part of this assessment, but such an evaluation could help establish potential short- and long-term impacts to drinking water resources and how to assess them.
Conclusions
Through this national-level assessment, we have identified potential mechanisms by which hydraulic fracturing could affect drinking water resources. Above ground mechanisms can affect surface and ground water resources and include water withdrawals at times or in locations of low water availability, spills of hydraulic fracturing fluid and chemicals or produced water, and inadequate treatment and discharge of hydraulic fracturing wastewater. Below ground mechanisms include movement of liquids and gases via the production well into underground drinking water resources and movement of liquids and gases from the fracture zone to these resources via pathways in subsurface rock formations.
We did not find evidence that these mechanisms have led to widespread, systemic impacts on drinking water resources in the United States. Of the potential mechanisms identified in this report, we found specific instances where one or more of these mechanisms led to impacts on drinking water resources, including contamination of drinking water wells. The cases occurred during both routine activities and accidents and have resulted in impacts to surface or ground water. Spills of hydraulic fracturing fluid and produced water in certain cases have reached drinking water resources, both surface and ground water. Discharge of treated hydraulic fracturing wastewater has increased contaminant concentrations in receiving surface waters. Below ground movement of fluids, including gas, most likely via the production well, have contaminated drinking water resources. In some cases, hydraulic fracturing fluids have also been directly injected into drinking water resources, as defined in this assessment, to produce oil or gas that co-exists in those formations.
The number of identified cases where drinking water resources were impacted are small relative to the number of hydraulically fractured wells. This could reflect a rarity of effects on drinking water
This document is a draft for review purposes only and does not constitute Agency policy.
June 2015 ES-23 DRAFT—DO NOT CITE OR QUOTE
Hydraulic Fracturing Drinking Water Assessment Executive Summary
resources, or may be an underestimate as a result of several factors. There is insufficient pre- and 1
2 3 4 5
6 7 8 9
10 11 12 13 14 15 16
post-hydraulic fracturing data on the quality of drinking water resources. This inhibits a determination of the frequency of impacts. Other limiting factors include the presence of other causes of contamination, the short duration of existing studies, and inaccessible information related to hydraulic fracturing activities.
This state-of-the-science assessment contributes to the understanding of the potential impacts of hydraulic fracturing on drinking water resources and the factors that may influence those impacts. The findings in this assessment can be used by federal, state, tribal, and local officials; industry; and the public to better understand and address any vulnerabilities of drinking water resources to hydraulic fracturing activities. This assessment can also be used to help facilitate and inform dialogue among interested stakeholders, and support future efforts, including: providing context to site-specific exposure or risk assessments, local and regional public health assessments, and assessments of cumulative impacts of hydraulic fracturing on drinking water resources over time or over defined geographic areas of interest. Finally, and most importantly, this assessment advances the scientific basis for decisions by federal, state, tribal, and local officials, industry, and the public, on how best to protect drinking water resources now and in the future.
References for Executive Summary
Ajani, A; Kelkar, M. (2012). Interference study in shale plays. Paper presented at SPE Hydraulic Fracturing Technology Conference, February 6-8, 2012, The Woodlands, TX.
Bair, ES; Freeman, DC; Senko, JM. (2010). Subsurface gas invasion Bainbridge Township, Geauga County, Ohio. (Expert Panel Technical Report). Columbus, OH: Ohio Department of Natural Resources. http://oilandgas.ohiodnr.gov/resources/investigations-reports-violations-reforms#THR
Clark, CE; Veil, JA. (2009). Produced water volumes and management practices in the United States (pp. 64). (ANL/EVS/R-09/1). Argonne, IL: Argonne National Laboratory. http://www.circleofblue.org/waternews/wp-content/uploads/2010/09/ANL_EVS__R09_produced_water_volume_report_2437.pdf
COGCC. Colorado Oil and Gas Conservation Commission Order No. 1V-276, (2004). https://cogcc.state.co.us/orders/orders/1v/276.html
Crescent (Crescent Consulting, LLC). (2011). East Mamm creek project drilling and cementing study. Oklahoma City, OK. http://cogcc.state.co.us/Library/PiceanceBasin/EastMammCreek/ReportFinal.pdf
EIA (Energy Information Administration). (2015a). Glossary. Available online at http://www.eia.gov/tools/glossary/
IOGCC (Interstate Oil and Gas Compact Commission). (2008). Protecting our country's resources: The states' case, orphaned well plugging initiative. Oklahoma City, OK: Interstate Oil and Gas Compact Commission (IOGCC). http://iogcc.myshopify.com/products/protecting-our-countrys-resources-the-states-case-orphaned-well-plugging-initiative-2008
Maupin, MA; Kenny, JF; Hutson, SS; Lovelace, JK; Barber, NL; Linsey, KS. (2014). Estimated use of water in the United States in 2010. (USGS Circular 1405). Reston, VA: U.S. Geological Survey. http://dx.doi.org/10.3133/cir1405
Michie, TW; Koch, CA. (1991). Evaluation of injection-well risk management in the Williston Basin. J Pet Tech 43: 737-741. http://dx.doi.org/10.2118/20693-PA
This document is a draft for review purposes only and does not constitute Agency policy.
Hydraulic Fracturing Drinking Water Assessment Executive Summary
Newell, R. (2011). Shale gas and the outlook for U.S. natural gas markets and global gas resources.
Presentation presented at US EIA presentation at OECD Meetings, June 21, 2011, Paris, France.
ODNR, DMRM, (Ohio Department of Natural Resources, Division of Mineral Resources Management). (2008). Report on the investigation of the natural gas invasion of aquifers in Bainbridge Township of Geauga County, Ohio. Columbus, OH: ODNR. http://oilandgas.ohiodnr.gov/portals/oilgas/pdf/bainbridge/report.pdf
PA DEP (Pennsylvania Department of Environmental Protection). (2015b). Technologically enhanced naturally occurring radioactive materials (TENORM) study report. Harrisburg, PA. http://www.elibrary.dep.state.pa.us/dsweb/Get/Document-105822/PA-DEP-TENORM-Study_Report_Rev._0_01-15-2015.pdf
Papoulias, DM; Velasco, AL. (2013). Histopathological analysis of fish from Acorn Fork Creek, Kentucky, exposed to hydraulic fracturing fluid releases. Southeastern Naturalist 12: 92-111.
Scanlon, BR; Reedy, RC; Nicot, JP. (2014). Will water scarcity in semiarid regions limit hydraulic fracturing of shale plays? Environmental Research Letters 9. http://dx.doi.org/10.1088/1748-9326/9/12/124011
Science Based Solutions LLC. (2014). Summary of hydrogeology investigations in the Mamm Creek field area, Garfield County. Laramie, Wyoming. http://www.garfield-county.com/oil-gas/documents/Summary-Hydrogeologic-Studies-Mamm%20Creek-Area-Feb-10-2014.pdf
U.S. EPA (U.S. Environmental Protection Agency). (2015j). Retrospective case study in Killdeer, North Dakota: study of the potential impacts of hydraulic fracturing on drinking water resources [EPA Report]. (EPA 600/R-14/103). Washington, D.C.
USGS (U.S. Geological Survey). (2002). Natural gas production in the United States [Fact Sheet]. (USGS Fact Sheet FS-113-01). Denver, CO.
Vengosh, A; Jackson, RB; Warner, N; Darrah, TH; Kondash, A. (2014). A critical review of the risks to water resources from unconventional shale gas development and hydraulic fracturing in the United States. Environ Sci Technol 48: 36-52. http://dx.doi.org/10.1021/es405118y
Warner, NR; Christie, CA; Jackson, RB; Vengosh, A. (2013a). Impacts of shale gas wastewater disposal on water quality in western Pennsylvania. Environ Sci Technol 47: 11849-11857. http://dx.doi.org/10.1021/es402165b
This document is a draft for review purposes only and does not constitute Agency policy.