Assessment of the Suomi NPP VIIRS Cloud EDRs and IPs for Provisional Maturity Level Andrew Heidinger, NOAA/NESDIS/STAR, Team Lead Eric Wong, NGAS Cloud Algorithm Lead Janna Feeley, Cloud Products JAM Bob Holz, UW/SSEC, Validation Co-Lead January 7, 2013
Transcript
Assessment of the Suomi NPP VIIRS Cloud EDRs and IPs for Provisional Maturity Level
Andrew Heidinger, NOAA/NESDIS/STAR, Team Lead
Eric Wong, NGAS Cloud Algorithm Lead
Janna Feeley, Cloud Products JAM
Bob Holz, UW/SSEC, Validation Co-Lead
January 7, 2013
Name Organization Major Task Kurt F. Brueske* IIS/Raytheon Code testing support within IDPS
Janna Feeley* Aerospace Inc JAM
Andrew Heidinger NOAA/STAR Lead
Eric Wong* NGAS Algorithm Updates and Documentation Lead
Robert Holz UW/SSEC CALIPSO Validation and PEATE Liaison
Andi Walther UW/CIMSS Daytime COP Algorithm Support
Yue Li UW/CIMSS CTP Algorithm + ADL Support
Steve Miller CSU/CIRA Cloudsat Validation
Jay Mace University Utah ARM (surface) Validation Tools
Kwo-Sen Kuo NASA/Goddard Scattering Models for Daytime COP
Bryan Baum UW/SSEC Scattering Models for Daytime COP
Eva Borbas UW/SSEC Using CrIS for VIIRS cloud height validation
Curtis Seaman CSU/CIRA Cloud Base Height
Yoo-Jeong Noh CSU/CIRA Cloud Base Height
Min Oo UW/SSEC General Validation Support
VIIRS Cloud Cal/Val Team
2 Members in grey are no longer funded. * Members funded outside of cloud team budget
3
Cloud Product Users
• U.S. Users − AFWA – Air Force Weather Agency – (Jeff Cetola) − NOAA NWP (GFS, NAM and RAP model verification / assimilation) − National Climatic Data Center (NCDC). Serves AVHRR cloud climate records to multiple users. − National Renewable Energy Laboratory (NREL). Cloud products used in driving short-term
forecasts.
• International Users – Community Satellite Processing Package (CSPP). CLAVR-x implemented into IDPS. – Eumetsat (Cloud Top Height from IDPS)
• User Community − Navigation, Transportation − Operational Weather Prediction − Climate Research through NOAA CLASS. − DOD
The following list shows potential users based on the assumption that CLAVR-x users will migrate to IDPS. To date, no user has contacted the JPSS Cloud Cal/Val Team.
Criteria for Provisional Maturity Status
• Product quality may not be optimal – Product accuracy is determined for a broader (but still limited)
set of conditions. – No requirement to demonstrate compliance with specifications.
• Incremental product improvements still occurring – DR history and future planned efforts will be shown
• General research community is encouraged to participate in the QA and validation of the product, but need to be aware that product validation and QA are ongoing
• Users are urged to consult the EDR product status document prior to use of the data in publications
• Ready for operational evaluation
4 4
Summary of Cloud Properties Product Requirements Based on JPSS L1RD Thresholds
• Cloud Base Height – Measurement Uncertainty = 2 km
• Cloud Cover/Layers – Total Cloud Cover Uncertainty (not applicable to layers) 0.1 + 0.3*sin(sensor zenith
Angle) of HCS Area • Cloud Effective Particle Size
– Precision & Accuracy: 22% for Water; 28% for Ice ( or 1 μm whichever larger) • Cloud Optical Thickness (τ)
– Precision = 33%; Accuracy = 24% ( or =1 τ , whichever larger for both Prec. & Acc.) • Cloud Top Height
– Precision = 1 km; Accuracy = 1 km ( both increased to 2 km for thin clouds, i.e. τ < 1 )
• Cloud Top Temperature – Precision & Accuracy = 3 K ( both increased to 6 K for thin clouds, i.e. τ < 1 )
5 NGAS - E. Wong
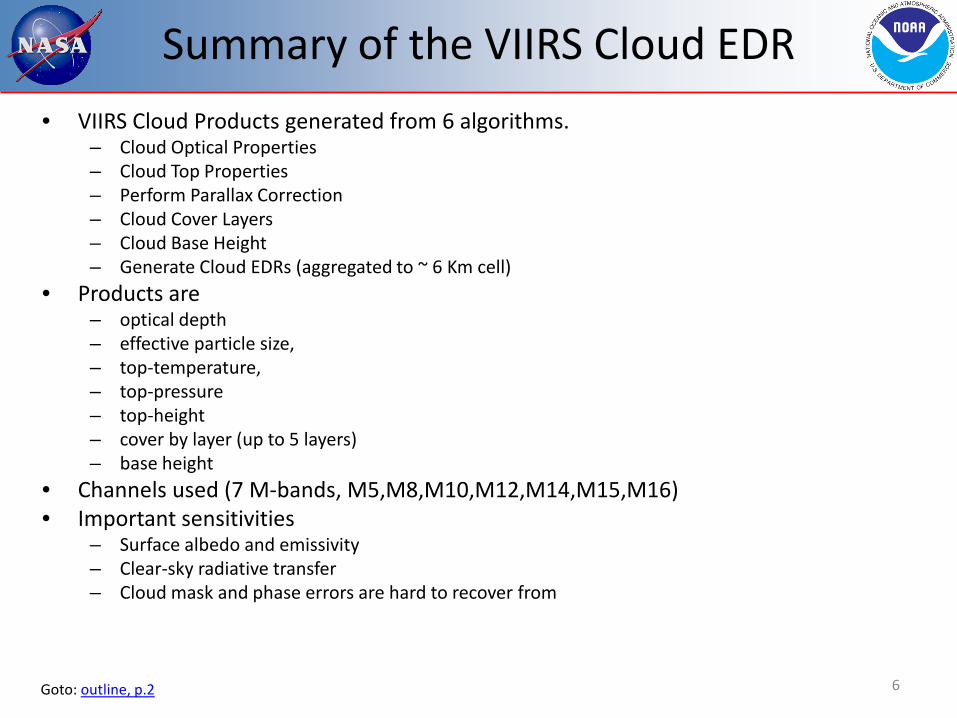
• VIIRS Cloud Products generated from 6 algorithms. – Cloud Optical Properties – Cloud Top Properties – Perform Parallax Correction – Cloud Cover Layers – Cloud Base Height – Generate Cloud EDRs (aggregated to ~ 6 Km cell)
• Products are – optical depth – effective particle size, – top-temperature, – top-pressure – top-height – cover by layer (up to 5 layers) – base height
• Channels used (7 M-bands, M5,M8,M10,M12,M14,M15,M16) • Important sensitivities
– Surface albedo and emissivity – Clear-sky radiative transfer – Cloud mask and phase errors are hard to recover from
Summary of the VIIRS Cloud EDR
6 Goto: outline, p.2
VIIRS Daytime Cloud IP Flow
VIIRS SDR
Day Cloud Optical and Properties Algorithm
VIIRS Cloud Mask
Optical Depth IP,
Particle Size IP
COP LUT
Cloud Cover Layers Algorithm
Temperature to Height/Pressure Conversion Logic
Cloud Top Temperature IP
Cloud Top Height and Pressure IP
Day Cloud Top Properties Algorithm
(includes day water module)
Cloud Base Algorithm Cloud Base IP
GFS Profiles
Moisture Profiles
VIIRS Cloud Phase
OSS Clear-sky & Cloud RTM
(day water only)
Cloud Cover Layers IP
Parallax Correction Algorithm
Upstream Input Algorithm Ancillary Data Output
VIIRS Nighttime Cloud IP Flow
VIIRS SDR
VIIRS Cloud Mask
Cloud Optical Depth, Particle Size, Cloud Top Temperature IP
IR Parameterizations
Cloud Cover Layers Algorithm
Temperature to Height Conversion
Logic
Cloud Top Temperature, Top Height and Top
Pressure IP Night Cloud Top
Properties Algorithm
Cloud Base Algorithm Cloud Base IP
GFS Profiles
IR Clear-sky PFAAST RTM
VIIRS Cloud Phase
Cloud Cover Layers IP
Parallax Correction Algorithm
Upstream Input Algorithm Ancillary Data Output
Night Cloud Optical & Top Temperature
Algorithm
Provisional EDR Maturity Definition
• Product quality may not be optimal – Optimal would be attaining all of L1B cloud requirements
• Incremental product improvements still occurring – DR history and future planned efforts will be shown
• Version control is in effect – IDPS Build number for Algorithm version and LUTs version identified
• General research community is encouraged to participate - will request feedback from appropriate users for the products
• Users urged to consult the EDR product status document prior to use of the data in publications
• Ready for operational evaluation – Key end users are identified and feedback requested
Review of Activities Done for Beta Analysis
• NPP Daytime COT and EPS Comparison to NASA MODIS Products over 200 million cloudy pixel samples
• NPP Daytime COT and EPS Comparison to NOAA DCOMP Products for NPP Granules on April 28, 2013 – 2 days after Updated Cloud LUTs were Operationalized. LUTS based on NOAA DCOMP.
• NPP Cloud Top Pressure Comparison to NASA MODIS and NOAA DCOMP Products
• 3 months of NPP and CALIOP Cloud Top Height matchups • Qualitatively Comparison of NPP Cloud Cover to that of
MODIS • Sample comparison of VIIRS cloud top and base heights with
CloudSat on 02/17/12, 11:59:16 -12:00:40 UTC
Status of Cloud Properties Products Quality Assessment at Beta
• Daytime COT - 68% of IDPS within L1RD spec relative to NOAA DCOMP
• Daytime EPS - 64% of IDPS within L1RD spec relative to NOAA DCOMP
• Night Ice COT – 40% uncertainty relative to MODIS COT derived from night ice emissivity. Night water COT comparison not made due to 2 known errors in software
• Cloud Top Pressure -70% of IDPS within L1RD spec relative to NOAA DCOMP
• NPP Cloud Cover is qualitatively similar to that of MODIS • From Cloudsat comparison NPP CBH uncertainty is
estimated 2.8 km 11
Status of Cloud Properties Products at Beta-Continued
Some Concluding Remarks at Beta: – We are confident all products except Nighttime COP
exceed Beta. – We do feel Nighttime COP could meet Beta but is less
mature than the other algorithms. – Nighttime COP bugs have been identified and we expect
full beta compliance once implemented. – Nighttime COP is not a standard product (not available
from MODIS) and we think the community has less expectations for nighttime COP than daytime COP.
12
Activities Done for Provisional Maturity Review
1. Presenting Results with Constant Lapse Rate Marine Layer Cloud logic implemented in CTP (DR 4740)
2. Assessment of NPP Ice Cloud Top Height after k-ratio update, with CALIPSO products (DR 7232)
3. NPP Night COP compared to VIIRS Lunar DNB Reflectance. 4. Day LWP compared to NESDIS MIRS. 5. CALIOP/CALIPSO Validation of CTH 6. CloudSat Validation CBH. 7. Assessment of NPP Night Time COP Algorithm with pixel-
level CERES SSF product 8. Assessment of NPP Night Time COP Algorithm with NOAA
NLCOMP (DR 7231 –correcting night water COP errors) 9. Assessment of NPP Night Ice Cloud EPS with Calipso-IIR
product
13 Not briefed – including in backup material
CLAVR-x – NESDIS Operational Cloud Processing System for POES
14
• CLAVR-x is the NESDIS Operational AVHRR Cloud Processing System.
• CLAVR-x runs the cloud algorithms implemented in NDE. Product list also equivalent to IDPS cloud products.
• CLAVR-x and the NDE algorithms also run on many other sensors (see below) http://cimss.ssec.wisc.edu/clavr
CLAVR-x modified for VIIRS
• CLAVR-x is the NESDIS Operational AVHRR Cloud Processing System
• Modified for VIIRS in 2011. Can process M-Band, I-Band and DNB.
• Bowtie gaps are filled in and DNB data is remapped to M-bands
• CLAVR-x can read in VCM and Cloud Phase from IICM0 files and
use them for product processing (or simply pass through into output).
• CLAVR-x runs the cloud algorithms implemented in NDE.
• CLAVR-x also allows for EDR/SDR sensitivity studies.
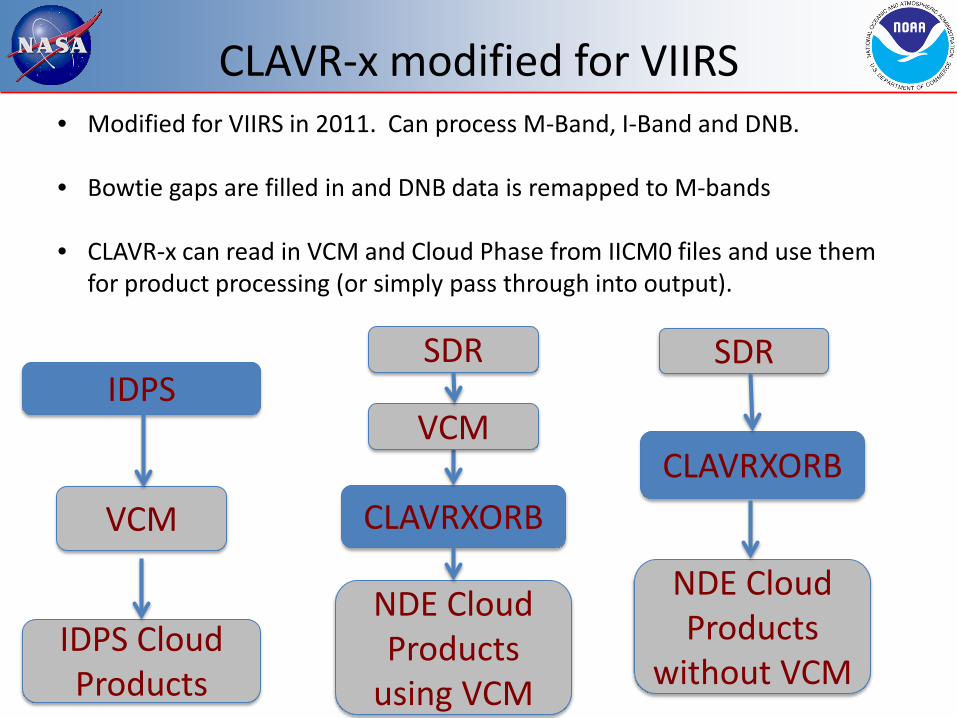
CLAVR-x modified for VIIRS • Modified for VIIRS in 2011. Can process M-Band, I-Band and DNB.
• Bowtie gaps are filled in and DNB data is remapped to M-bands
• CLAVR-x can read in VCM and Cloud Phase from IICM0 files and use them
for product processing (or simply pass through into output).
VCM
IDPS
IDPS Cloud Products
SDR
NDE Cloud Products
using VCM
CLAVRXORB
SDR
NDE Cloud Products
without VCM
CLAVRXORB VCM
CLAVR-x – Real-Time VIIRS Processing
17
• CLAVR-x does run in Real-Time on NPP JPSS VIIRS Data from from the UW/SSEC DB Antenna.
• CSPP does not yet make IDPS cloud products. When it does, we can do real-time monitoring.
CLOUD TOP PARAMETERS (CTP)
Outline: • Performance at Beta • Work Done Since Beta • Performance at Provisional
• Demonstration of low-cloud inversion fix • Global comparison with CALIPSO/CALIOP • Impact of microphysical model improvements (k-ratio)
• Planned improvements
18
CTP Performance at Beta
19
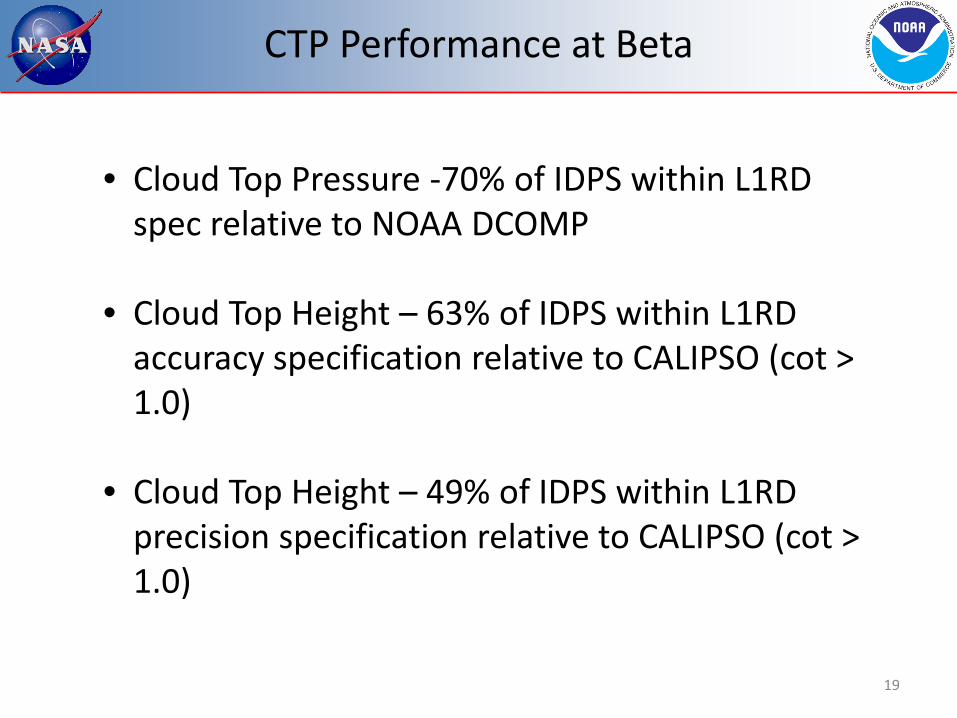
• Cloud Top Pressure -70% of IDPS within L1RD spec relative to NOAA DCOMP
• Cloud Top Height – 63% of IDPS within L1RD accuracy specification relative to CALIPSO (cot > 1.0)
• Cloud Top Height – 49% of IDPS within L1RD precision specification relative to CALIPSO (cot > 1.0)
20
• Before the fix, we saw this type of bias in the IDPS Cloud Height Product. • IDPS approach applied a top-down solution that gave errors for clouds in marine
boundary layers. • The IDPS code was modified is include logic from NOAA where a constant lapse rate
was assumed and a bottom-up solution implemented. • We may try a more complicated version from NASA. • Images below show example NPP scenes used to demonstrate improvement.
Low Cloud Inversion Logic Impact (DR 4740 )
CALIPSO Track
21
Before Low Cloud Inversion Logic Update
After Low Cloud Inversion Logic Update
Low Cloud Inversion Logic Impact (DR 4740 )
Validation of NOAA CLAVR-x / NDE Cloud Height
• We expect based on CLAVR-x experience to achieve performance like below.
• Same analysis applied to CLAVR-x on SEVIRI shown below. • VIIRS does have different spectral information.
22
All clouds
Thin cirrus
• The global distribution of CTH differences between CALIOP and VIIRS IP retrievals is presented. • The results from VIIRS retrievals indicate a significant negative CTH bias for ice clouds •Results show a positive bias for water clouds.
Results at Beta Presentation (before low cloud inversion logic)
Global Cloud Top Height Evaluation of VIIRS with CALIOP CTH product
Global CALIPSO/CALIOP Cloud Top Height Evaluation of the VIIRS IP CTH
2012 Beta 2013 Prov.
• 4 months of collocated CALIOP (lidar) comparisons with the VIIRS IP CTH product
• 20 minute maximum time separation
• Poles (>60deg lat) excluded.
• Results show positive bias for water clouds has been largely removed.
• High cloud bias remains.
Results at Provisional Presentation (after low cloud inversion logic)
2012 Beta CTH compared to CALIOP
Regional Distribution of the CALIOP vs VIIRS IP CTH differences
2013 Provisional CTH compared to CALIOP
Ice Cloud Microphysical Model Updates (DR7232)
26
• CTP employs ice scattering models using k-ratios. These are similar to β-ratios used by NOAA.
• K-ratios were recomputed using latest scattering models from Professor Ping Yang from Texas A&M.
• Impact was tested on golden granules in ADL.
• Results are compared to the IDPS output which uses the old k-ratios.
• Performance gauged against CALIPSO/CALIOP.
Day Ice CTH
27
Current Baseline (Oct-Nov 2012) Updated (08/22/2013 22:41-23:20, 28 day granules)
• Updated CTH is raised on the average by ~1.0 km from the Baseline, except for the very high ice clouds • The update will reduce the current low bias ( -1.84 km) thus bringing day ice CTH to meeting L1B CTH requirement
Night Ice CTH
28
•Updated CTH is raised on the average by ~0.5 km from Baseline, except for high clouds •The update will bring night ice CTH closer to meeting L1B CTH requirement
Current Baseline (Oct-Nov 2012) Updated (08/22/2013 21:49- 22:33, 32 day granules)
29
Cloud Top Parameters Summary
• Improvement in low cloud CTH due to inversion fix demostrated via Adl reprocessing and global CALiIPSO verification.
• ADL reprocessing indicates new ice models will improve cirrus CTH biases.
• Issues remain with Tropopause solutions and will require a new DR.
DAYTIME CLOUD OPTICAL THICKNESS AND EFFECTIVE PARTICLE SIZE
Outline: • Performance at Beta • Performance at Provisional • Comparison with VIIRS Lunar DNB Reflectance • Comparison with MIRS/ATMS • Comparison with CALIPSO/CALIOP • Planned improvements
30
Day COP Performance at Beta
31
• NPP Daytime COT and EPS Comparison to NASA MODIS Products over 200 million cloudy pixel samples
• NPP Daytime COT and EPS Comparison to NOAA DCOMP Products for NPP Granules on April 28, 2013 – 2 days after Updated Cloud LUTs were Operationalized
• Daytime COT - 68% of IDPS within L1RD spec relative to NOAA DCOMP
• Daytime EPS - 64% of IDPS within L1RD spec relative to NOAA DCOMP
• Note, no new Day COP improvements since Beta. Following results are new analyses that illustrate remaining issues.
• COT results agree with a bias of 70.2 Percent. (similar to Beta analysis)
• IDPS shows significant sensitivity to viewing angle (see below). Will explore in DR.
Red = NOAA Blue = IDPS
Provisional Effective Particle Size Water Phase
• Requirements: • Precision & Accuracy: 22% for Water ( or 1 μm whichever larger)
• 67.6% of the
pixel meet the specs.
• About 25% of the pixels have unrealistic high values for EPS water phase.
Provisional Effective Particle Size Water Phase
• Requirements: • Precision & Accuracy: 28% for Ice ( or 1 μm whichever larger)
58.6% of pixels meets the specs. (similar to Beta Analysis) Distinctive disagreement features in scatterplot density plot: •Pattern of very low EPS values
•Density gap between 5μm and 15μm
•High EPS values where DCOMP has values between 40 and 80μm.
Global Map of Provisional Daytime COP Issues
The following maps show the occurrence for one day of the non-physical daytime COP results. A. Water clouds with very large effective particle radii B. Ice clouds with very large effective particle radii C. Ice clouds with very small effective particle radii
A B C
We have submitted a DR for Issue C. Unsure if solving C will impact A or B.
COMPARISON OF DAY COP TO NESDIS MIRS CLOUD LIQUID WATER PATH
36
37
Comparison of Day COP to NESDIS MIRS LWP
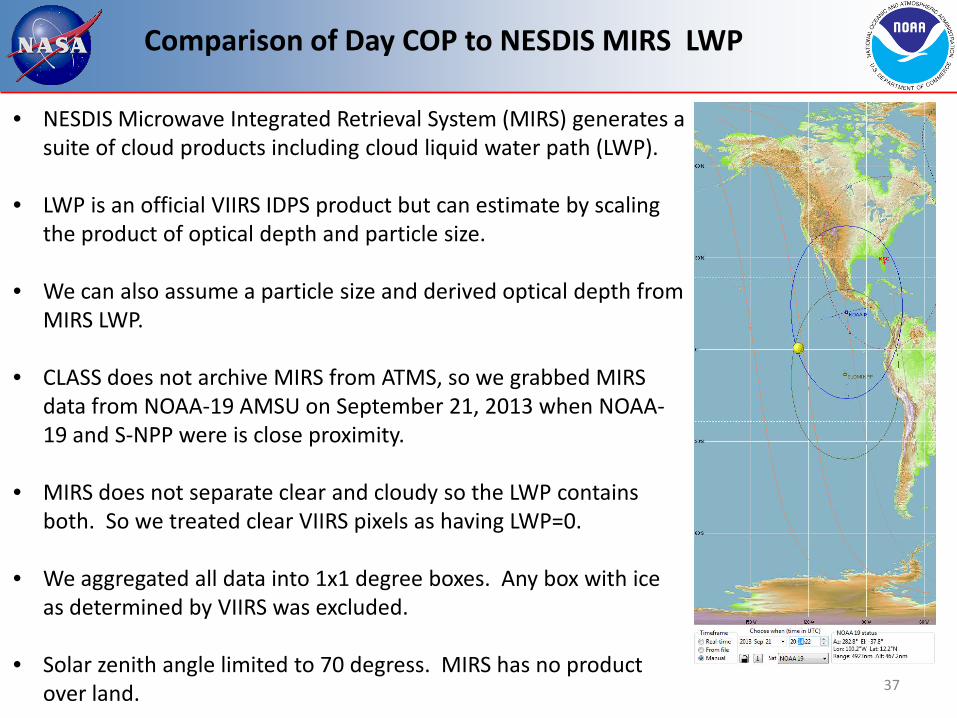
• NESDIS Microwave Integrated Retrieval System (MIRS) generates a suite of cloud products including cloud liquid water path (LWP).
• LWP is an official VIIRS IDPS product but can estimate by scaling the product of optical depth and particle size.
• We can also assume a particle size and derived optical depth from MIRS LWP.
• CLASS does not archive MIRS from ATMS, so we grabbed MIRS data from NOAA-19 AMSU on September 21, 2013 when NOAA-19 and S-NPP were is close proximity.
• MIRS does not separate clear and cloudy so the LWP contains both. So we treated clear VIIRS pixels as having LWP=0.
• We aggregated all data into 1x1 degree boxes. Any box with ice as determined by VIIRS was excluded.
• Solar zenith angle limited to 70 degress. MIRS has no product over land.
38
Comparison of Day COP to NESDIS MIRS LWP
• MIRS can see LWP that is covered by higher ice clouds. VIIRS can not.
• MIRS also misses thin clouds that are detected by the VIIRS product.
• VIIRS will saturate above 300 g/m^2
39
IDPS VIIRS vs. MIRS AMSU DAY LWP
• These density plots show the variation of the VIIRS IDPS LWP with the MIRS LWP (left). • The NOAA DCOMP algorithms results are shown on left for reference. • Impact of high particle size for water clouds seen in IDPS result but correlation is good
and we will continue to extend this analysis over many more days.
Day COP Summary
• Provisional analysis repeats findings at Beta but has revealed these additional issues that will be addressed.
• COP daytime retrieval meets the specs at about two third of pixels • COP retrieval shows partly artificial and unrealistic features • QF definition should be revised and coordinated with user feedback. • Requirements were tested by evaluation of one full day of observations against
PATMOS-x DCOMP algorithm. That’s why this cannot be seen as a fully independent evaluation since DCOMP uses a similar retrieval approach.
• MIRS LWP shows good correlation for relevant cloud types and shows expected biases due issues raised above.
• We think some of the issues we see are due to the lack of treatment of water vapor absorption.
• Cloud Optical Thickness
– 70.6 % of COT product fulfill the requirements – Stats for range [1,50]: accuracy: 19,5%, precision: 49.7%, bias: 2.01. Possible reason
may be the underestimation of atmospheric absorption by water vapor. • Effective Particle Size:
– Liquid: 67.6 % of EPS water phase pixels fulfills the requirements. – A high number of EPS Water phase have unrealistic high values – Range [1,40] : accuracy: 23.6%, precision: 31.7%, bias: 5.3μm – Ice: 58.6 % of EPS water phase pixels fulfills the requirements. – Range [1,80] : accuracy: 23.2 %, precision: 39.7%, bias: 6.03μm
NIGHTTIME CLOUD OPTICAL THICKNESS AND EFFECTIVE PARTICLE SIZE
Outline: • Performance at Beta • Work Done Since Beta • Performance at Provisional
• Comparison with Water COT with VIIRS Lunar DNB Reflectance • Comparison with of Water COT and LWP with MIRS/ATMS • Comparison of ICE COT with CALIPSO/CALIOP
• Planned improvements
41
Night COP Performance at Beta
42
• Night Ice COT – 40% uncertainty relative to MODIS COT derived from night ice emissivity.
• Night water COT comparison not made due to 2 known errors in software
• These results generated by implementing DR 7231 into ADL for 03/29/2013, 0727-0749 UTC • Modified nighttime cloud COT results in more reasonable values (DR 7231) • Modified COT show a strong zenith angle pattern that limits spatial correlation with VIIRS DNB
• Conversion from COT to LWP indicates much smaller values compared to microwave sensor, due to algorithm limitations to retrieve large COT for water clouds.
• Spatial correlation between Modified LWP and MIRS LWP still less than expected.
Night COP Comparison with MIRS LWP
09/21/2013, 2141-2216 UTC
Day COP comparison with MIRS LWP IDPS COT MIRS NOAA-19 LWP (g/m2)
• Same analysis as previous slide applied to Day COP. • Much better spatial correlation in Day than Night. Confirms our
suspicion that Night Water COP requires continued effort.
46
Calipso IIR COP Products are derived from combining IIR and Lidar observations of Calipso • Algorithm is based on the determination of k-ratios, i.e. β(12/10) and β(12/08) where 12, 10 and 08 are the IIR bands at 12, 10 and 8 micron • Effective Particle Diameter are retrieved based on LUT of the β computed for several crystal models of Yang 2005.
Ganier,A. et al “Retrieval of Cirrus Cloud Properties from combined IIR, Lidar and WFC Observations“, Int. Sym. On the A-Train Sat. Constellation 2010
CALIPSO IIR Track Product
Comparison of Updated NPP Night Ice cloud Effective Particle Size with CALIPSO IIR Product
47
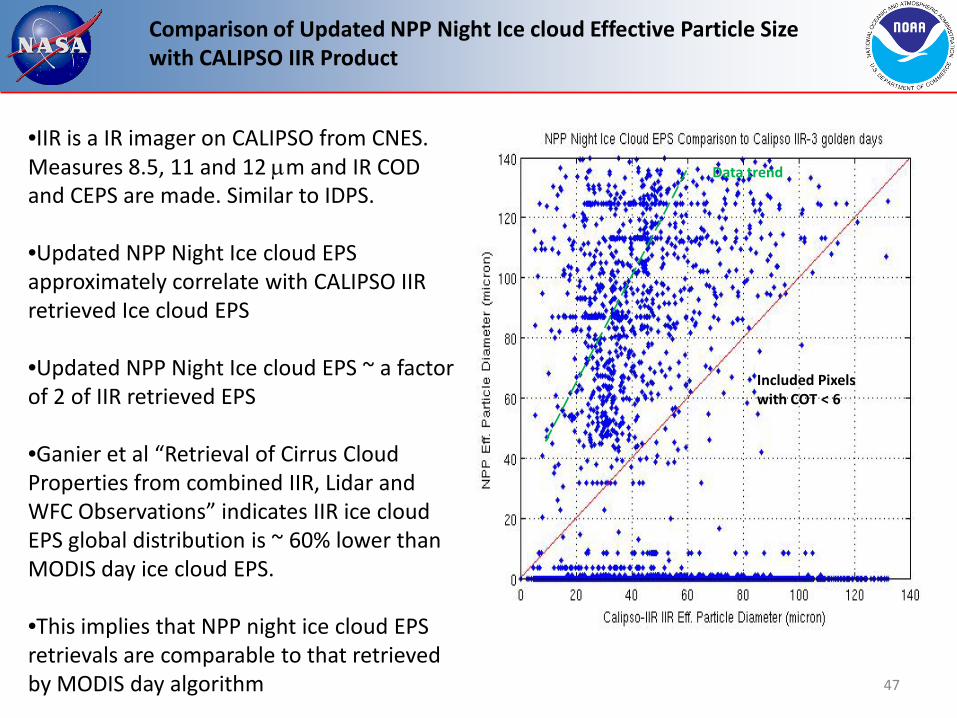
•IIR is a IR imager on CALIPSO from CNES. Measures 8.5, 11 and 12 µm and IR COD and CEPS are made. Similar to IDPS.
•Updated NPP Night Ice cloud EPS approximately correlate with CALIPSO IIR retrieved Ice cloud EPS
•Updated NPP Night Ice cloud EPS ~ a factor of 2 of IIR retrieved EPS
•Ganier et al “Retrieval of Cirrus Cloud Properties from combined IIR, Lidar and WFC Observations” indicates IIR ice cloud EPS global distribution is ~ 60% lower than MODIS day ice cloud EPS.
•This implies that NPP night ice cloud EPS retrievals are comparable to that retrieved by MODIS day algorithm
Data trend
Included Pixels with COT < 6
Comparison of Night Ice COT between Updated NPP,NLCOMP and Calipso – Dataset on 03/29/13, 07:13-07:58
48
• As shown Calipso COT data have large uncertainty for COT > 3. CALIPSO COT >3 should be ignored. • In this limited COT range NPP retrieves comparable values of COT, and are fairly well correlated with Calipso data • NLCOMP COT also well correlated over the CALIPSO range (0-2). Higher value are expected since CALIPSO saturates above 2-3.
NLCOMP = VIIRS Lunar Ref based COD
Night COP Summary
49
• ADL reprocessing confirms the fixes outlined in DR moved the night COP optical depth and particle size into expected ranges.
• Visual inspection of reprocessed ADL granules shows lack of correlation for night COP water cloud optical depths.
• CALIPSO/CALIOP COD values due show correlation over the narrow range retrieved by a LIDAR.
• The accuracy of NPP night COT and EPS cannot be fully assessed due to lack of validation data. However, it may require an investigation into the atmospheric and clear sky radiative transfer for better performance.
CLOUD BASE HEIGHT (CBH)
Outline: • Performance at Beta • Performance at Provisional
• Comparison with CloudSat for CTH within Specification • Summary
50
CBH at Beta
51
• From Cloudsat comparison NPP CBH uncertainty is estimated 2.8 km
• CBH issues driven by CTH issues.
• For Provisional Analysis, we decided to focus of CBH with CTH was meeting its specification.
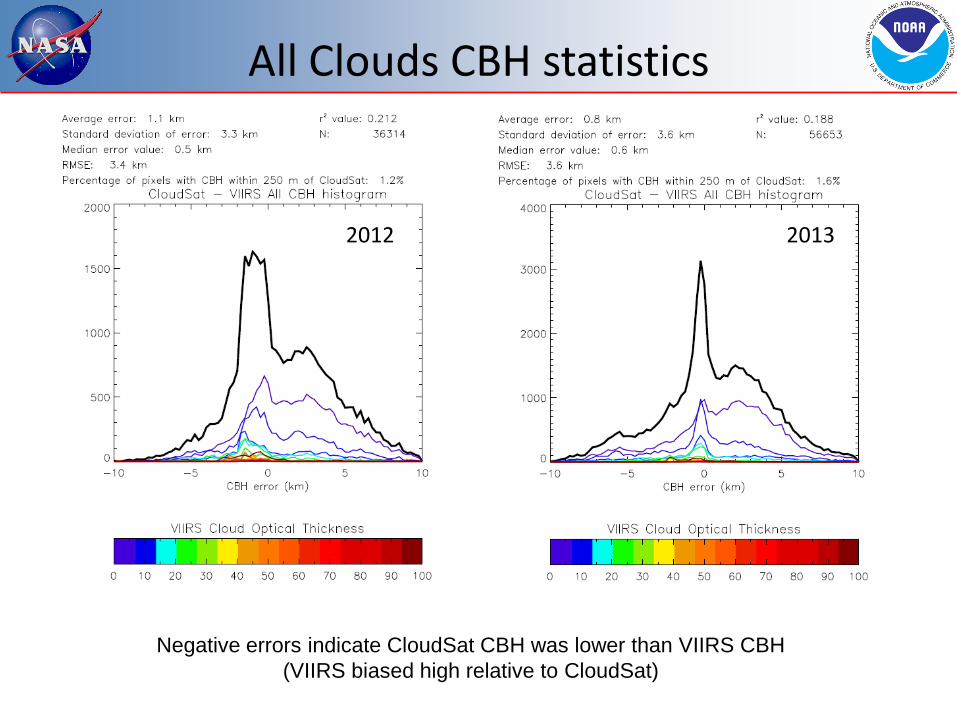
All Clouds CBH statistics
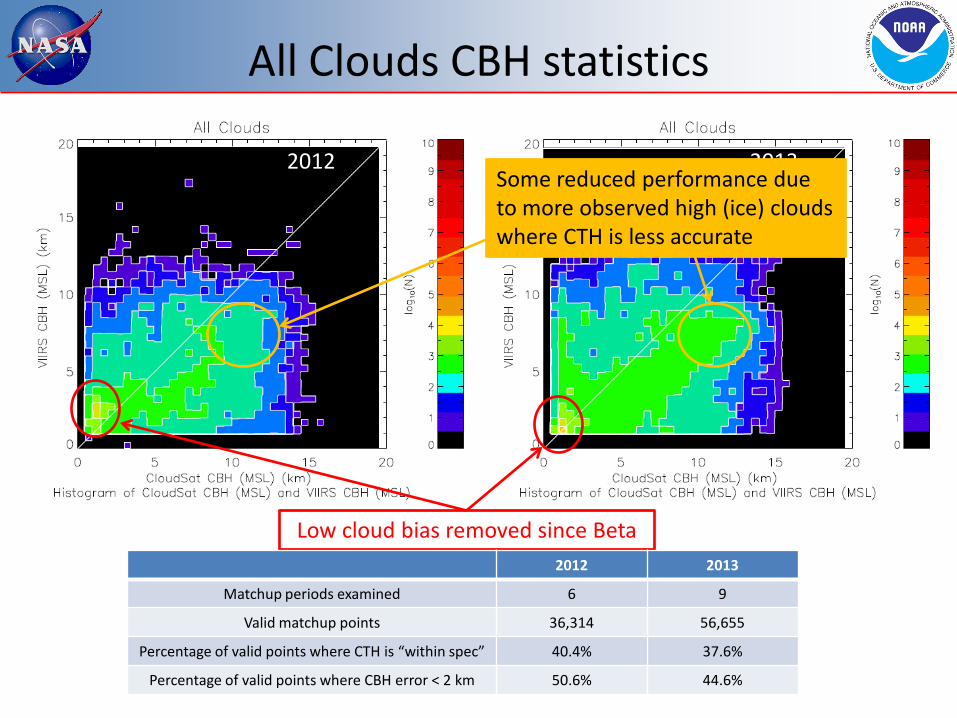
2012 2013
Low cloud bias removed since Beta 2012 2013
Matchup periods examined 6 9
Valid matchup points 36,314 56,655
Percentage of valid points where CTH is “within spec” 40.4% 37.6%
Percentage of valid points where CBH error < 2 km 50.6% 44.6%
Some reduced performance due to more observed high (ice) clouds where CTH is less accurate
CBH Statistics when CTH is “within spec”
2012 2013
All Cloud Types All Cloud Types
• CIRA continues to validate CBH using CloudSat. • CTH issue continue to drive CBH performance. • Results show CBH has skill when CTH is within Spec • Slight improvement since Beta Analysis (left)
CBH Statistics when CTH is “within spec”
2012 2013
Negative errors indicate CloudSat CBH was lower than VIIRS CBH (VIIRS biased high relative to CloudSat)
CBH statistics when CTH is “within spec”
All Clouds Opaque Ice Cirrus Water Mixed-phase Overlap
Green values indicate improvement compared to 2012 Red values indicate reduced performance compared to 2012
Black values indicate no change compared to 2012
When the CTH retrieval is within the error specifications, the CBH retrieval performs better. In most cases, errors have been reduced, the error standard deviation and RMSE have been reduced, the percentage of “correct” retrievals has increased and the correlations have increased compared to 2012. The exception is “overlap” clouds where the VIIRS retrievals are expected to perform poorly.
56
CBH Summary
• CIRA continues to validate CBH using CloudSat.
• CTH issues continue to drive CBH performance.
• Results show CBH has skill when CTH is within Spec
• Slight improvement since Beta Analysis • CIRA is investigating using some NWP data (LCL, CCL)
to add skill to CBH. This is done in the NOAA Algorithm.
CONCLUSIONS
Outline: • Future Work • Extra Material
57
Provisional Recommendations
• We feel all cloud products except Night COP for Water Clouds are provisional.
• We do feel that remaining issues with Day COP are significant enough to prevent Validation Stage 1.
• We need global assessment of k-ratio updates to Day/Night CTH to assess if the biases are sufficiently reduced for Validation Stage 1.
• We would like to also recommend a user review of the QF’s with an eye towards user application – not validating L1RD specs.
58
Future Plans and Issues • We have transitioned these changes into IDPS
– An update to remove sun glint overland as degraded condition – A nighttime water cloud COP error fix.
• We plan to implement these fixes – Update k-ratio parameterization for ice cloud CTT. – Update COP with more accurate surface albedo. – Update COP for more accurate clear sky radiances. – CBH modification of LWC/IWC values used for the various cloud types. – Modification of quality flags.
• Future Work – Several issues remain without identified causes. – Nighttime COP and cloud base continued work. – We do think most new changes will require new capabilities and
ancillary data. 59
60
Extra Material
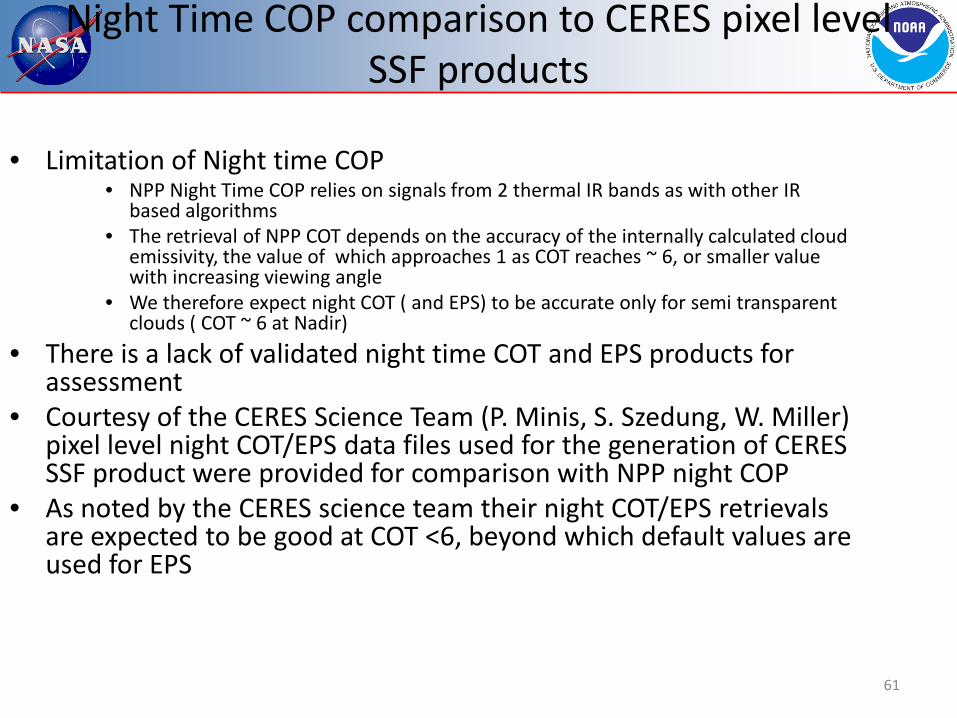
Night Time COP comparison to CERES pixel level SSF products
• Limitation of Night time COP • NPP Night Time COP relies on signals from 2 thermal IR bands as with other IR
based algorithms • The retrieval of NPP COT depends on the accuracy of the internally calculated cloud
emissivity, the value of which approaches 1 as COT reaches ~ 6, or smaller value with increasing viewing angle
• We therefore expect night COT ( and EPS) to be accurate only for semi transparent clouds ( COT ~ 6 at Nadir)
• There is a lack of validated night time COT and EPS products for assessment
• Courtesy of the CERES Science Team (P. Minis, S. Szedung, W. Miller) pixel level night COT/EPS data files used for the generation of CERES SSF product were provided for comparison with NPP night COP
• As noted by the CERES science team their night COT/EPS retrievals are expected to be good at COT <6, beyond which default values are used for EPS
61
Night Time Water COT comparison to CERES pixel level SSF product on 06/09/13 NPP dataset
•The average NPP COT ~ 5 while CERES shows average of ~4 •The 2 IR based algorithms behave similarly and retrieve approximately the same level of COT •It may be concluded that NPP night water cloud COP works equally well to other IR based method
VIIRS Water CTH over-prediction of Calipso CTH of Marine Layer Clouds – Presented at Beta
Cloudy pixels undetected by VCM • NPP CTH for marine layer cloud (MLC) over-predicts Calipso
CTH • Both NPP VCM and Calipso indicates cloud phase as water cloud •Calipso indicates semi-transparent cloud of COT 2.6-5.0
E. wong, NGAS
Black = Calipso Green = NPP
MLC
Multilayer cloud
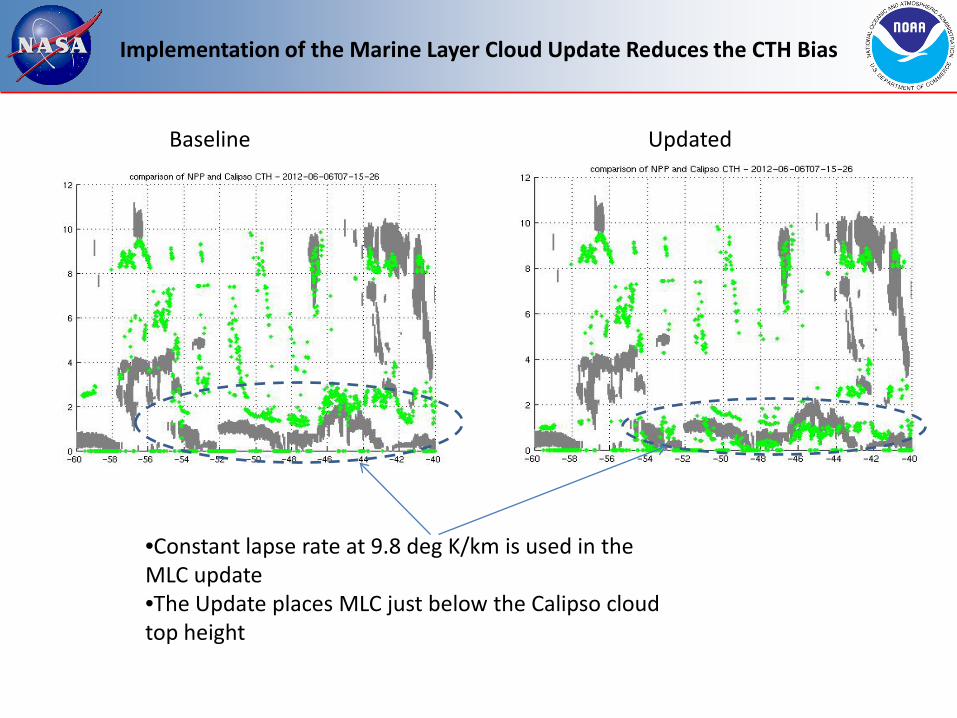
Implementation of the Marine Layer Cloud Update Reduces the CTH Bias
Baseline Updated
•Constant lapse rate at 9.8 deg K/km is used in the MLC update •The Update places MLC just below the Calipso cloud top height
Performance Enhancement with Marine Layer Cloud update – Assessment with Calipso CTH on NPP data of 08/14/12 15:02-
16:25
65
• Average bias error changes from +0.5 km to -0.3 km • Lapse rate may need to be adjusted if further comparison to CALIPSO data continues to show low bias
Bias = -0.3 km Bias=0.
5 km
Before update After update
Cloud Base Height Evaluation
CBH algorithm for liquid clouds:
Red variables come from upstream retrievals LWC is pre-defined average value based on cloud type; cloud type comes from upstream retrieval
The cloud base height for liquid clouds is defined at right. Cloud base height definition for ice clouds is similar, except the average ice water content is temperature dependent. CBH requires upstream retrievals of cloud top height (CTH), cloud optical depth (τ), effective particle size (re) and cloud type, which is used to determine the LWC value to use. Errors in CBH are directly proportional to errors in each of these values. Issues in upstream retrievals directly impact CBH retrieval.
CBH evaluation – known issues
2012 2013
Known issue with CTH retrieval (boundary layer liquid cloud tops too high due to temperature inversion) has been resolved since Beta review
CBH difficult to retrieve in cases of cloud overlap
Known issue with CTH retrieval: cirrus cloud tops too low due to CTT
Known issue with CBH retrieval: cirrus cloud too thick due to IWC parameterization
Gray shading represents vertical extent of clouds from CloudSat cloud mask. Colored areas represent vertical extent of clouds from VIIRS CTH and CBH retrievals, sorted by VIIRS cloud type retrieval (from COP).
CBH evaluation – issues caused by cloud type retrieval
Failure to detect cloud overlap
Inconsistent cloud type and CTH; thin clouds identified as “opaque ice”
Gray shading represents vertical extent of clouds from CloudSat cloud mask. Colored areas represent vertical extent of clouds from VIIRS CTH and CBH retrievals, sorted by VIIRS cloud type retrieval (from COP). Black line denotes surface elevation.
CBH retrieval performance is highly dependent on accuracy of upstream retrievals.
High clouds classified as “water”
“All Clouds” vs. “Within Spec”
• The VIIRS CBH algorithm has been evaluated for two groups: – All clouds observed by CloudSat and VIIRS – Only those clouds where the VIIRS CTH retrieval is within the
error specifications (aka “Within Spec”) • Error specifications: CTH must be within 1 km if the COT is greater
than 1, or within 2 km if the COT is less than 1 • Thus, “All Clouds” results show the general performance
of the CBH retrieval, “Within Spec” results show the performance of the CBH retrieval when the CTH retrieval is accurate – CBH accuracy is very closely related to CTH accuracy
• CBH is within the error specifications if CBH error is less than 2 km
2012 2013
All Clouds CBH statistics
Negative errors indicate CloudSat CBH was lower than VIIRS CBH (VIIRS biased high relative to CloudSat)
All Clouds CBH statistics
All Clouds Opaque Ice Cirrus Water Mixed-phase Overlap
Green values indicate improvement compared to 2012 Red values indicate reduced performance compared to 2012
Black values indicate no change compared to 2012
Overall, the average error (bias) has been slightly reduced compared to 2012. Small increases in the error standard deviation and RMSE are primarily due to relatively poor performance of the CTH retrieval for ice clouds. Ice clouds are a larger proportion of the total clouds observed in 2013 compared to 2012.