28th ARRB International Conference – Next Generation Connectivity, Brisbane, Queensland 2018 1 ASSESSMENT OF THIN ASPHALT SURFACING FATIGUE DESIGN IN WESTERN AUSTRALIA Zia Rice, Australian Road Research Board Kieran Sharp, Australian Road Research Board Geoff Cocks, Australian Road Research Board ABSTRACT Pavement design systems developed in the past may lose relevance as traffic characteristics, material properties, laboratory testing methods, and construction techniques advance over time. This may result in overly conservative outcomes which are no longer indicative of what is observed in the field. The synthesis and analysis of observational and historic performance and monitoring data can be used to critically review current design systems and ensure they align with observed behaviour and measured performance. This type of critical review was undertaken as part of a Western Australia Road Research and Innovation Program (WARRIP) project which enabled the identification of a possible alternative design method for granular pavements with thin asphalt surfacings. With further investigation, this design update may extend the implementation of these highly cost-effective pavements systems to a wider range of traffic scenarios, throughout the Perth metro area, where full depth asphalt pavements would usually be required. The system has the potential to be implemented in other states and territories. INTRODUCTION Pavement design systems provide the ability to assess the likely performance of a chosen pavement system comprising certain materials, under certain loading conditions. However, the use of a design system alone is not enough to ensure satisfactory pavement performance; performance also depends on various factors including material quality and construction and environmental management (Austroads 2017). In order to assess how well a design system can predict likely performance, data is required that explains the observed behaviour of an in-service pavement and ensures that the intended design has been achieved. Identifying links and dependencies within this data set allows a big picture understanding. This also allows the accuracy of the design system when compared with actual observed performance behaviour to be assessed and to allow conservatism within the system to be identified. In cases when large discrepancies are identified between the design system and the observed performance, further investigation of the applicability of the design method should be undertaken to ensure a cost-effective road network into the future. This paper presents the results of a review of the relationship between the pavement design and observed performance and the identification of a possible alternative design method for granular pavements with thin asphalt surfacings. PROVIDING CONTEXT TO PAVEMENT BEHAVIOUR Original Design Considerations Traffic loading, material characterisation and project reliability – in addition to environmental, construction and whole-of-life considerations – form the basis of a pavement design. Whilst guidance is provided to aid designers in accounting for each of these aspects within a pavement system, assumptions and subsequent inputs are still subjective. An in-depth review of the inputs and assumptions relating to an original design enables the intention and expected performance of the design to be better understood and ultimately replicated.
Transcript
28th ARRB International Conference – Next Generation Connectivity, Brisbane, Queensland 2018
1
ASSESSMENT OF THIN ASPHALT SURFACING FATIGUE DESIGN IN WESTERN AUSTRALIA
Zia Rice, Australian Road Research Board
Kieran Sharp, Australian Road Research Board
Geoff Cocks, Australian Road Research Board
ABSTRACT
Pavement design systems developed in the past may lose relevance as traffic characteristics, material properties, laboratory testing methods, and construction techniques advance over time. This may result in overly conservative outcomes which are no longer indicative of what is observed in the field. The synthesis and analysis of observational and historic performance and monitoring data can be used to critically review current design systems and ensure they align with observed behaviour and measured performance.
This type of critical review was undertaken as part of a Western Australia Road Research and Innovation Program (WARRIP) project which enabled the identification of a possible alternative design method for granular pavements with thin asphalt surfacings. With further investigation, this design update may extend the implementation of these highly cost-effective pavements systems to a wider range of traffic scenarios, throughout the Perth metro area, where full depth asphalt pavements would usually be required. The system has the potential to be implemented in other states and territories.
INTRODUCTION
Pavement design systems provide the ability to assess the likely performance of a chosen pavement system comprising certain materials, under certain loading conditions. However, the use of a design system alone is not enough to ensure satisfactory pavement performance; performance also depends on various factors including material quality and construction and environmental management (Austroads 2017).
In order to assess how well a design system can predict likely performance, data is required that explains the observed behaviour of an in-service pavement and ensures that the intended design has been achieved. Identifying links and dependencies within this data set allows a big picture understanding. This also allows the accuracy of the design system when compared with actual observed performance behaviour to be assessed and to allow conservatism within the system to be identified. In cases when large discrepancies are identified between the design system and the observed performance, further investigation of the applicability of the design method should be undertaken to ensure a cost-effective road network into the future.
This paper presents the results of a review of the relationship between the pavement design and observed performance and the identification of a possible alternative design method for granular pavements with thin asphalt surfacings.
PROVIDING CONTEXT TO PAVEMENT BEHAVIOUR
Original Design Considerations
Traffic loading, material characterisation and project reliability – in addition to environmental, construction and whole-of-life considerations – form the basis of a pavement design. Whilst guidance is provided to aid designers in accounting for each of these aspects within a pavement system, assumptions and subsequent inputs are still subjective. An in-depth review of the inputs and assumptions relating to an original design enables the intention and expected performance of the design to be better understood and ultimately replicated.
28th ARRB International Conference – Next Generation Connectivity, Brisbane, Queensland 2018
2
When designing a pavement profile, the design traffic loading plays a pivotal role in defining the required cover over the pavement subgrade to ensure that compressive strains are limited and subsequent permanent deformation of the foundation is avoided.
Therefore, understanding the foundation strength and the design traffic over the specified design period provides context regarding the chosen pavement profile. A breakdown of the assumptions used to calculate the design traffic – such as predicted annual growth, traffic load and axle distribution data – is also important to allow a comparison of the observed traffic loading characteristics with that assumed for design. Similarly, understanding the foundation material in addition to equilibrium moisture assumed in the design allows the characteristic subgrade strength to be quantified, and the influence of the in-service environmental loads on performance to be taken into account.
Specification Compliance and Maintenance Data
For granular pavements, meeting density and dryback specification criteria at construction is imperative to ensuring that adequate strength is achieved within the pavement structure. Similarly, achieving the correct compaction of asphalt layers also ensures that premature failure is avoided and the materials will continue to behave as assumed in the design.
Material compliance also needs to be assessed as material properties such as the grading and plasticity of granular materials and the properties of the sprayed bituminous seal or asphalt surfacing have a direct influence on the ability to achieve the design assumptions, and subsequently, the expected performance. In cases where failure has occurred but specifications have not been met, it becomes difficult to link the observed behaviour to overall pavements system performance and subsequently difficult to critically asses the applicability of the original design.
Similarly, understanding the timing of maintenance, rehabilitation or reconstruction works provides vital insight into the performance of a pavement. Identifying past failures and subsequent rehabilitation in the context of the original design profile, design period and measured traffic loading at the time of failure will enable a close comparison between the expected design performance and the observed performance to be made.
Monitoring Performance and Traffic
Assessment of the performance of the pavement throughout its in-service life will ultimately allow the design system adopted and the actual behaviour to be compared. Monitoring of surface deflection and curvature allows a timeline of behaviour to be recorded and other events such as traffic loads or maintenance tasks to be linked to specific trends in the measured data. Deflection data also allows the moduli of the pavement system to be assessed through the use of back-calculation programs such as EFROMD3. Back-calculation allows the stiffness of pavement materials to be estimated over the in-service life and linked to other data such as traffic levels, observed failures and design life.
Monitoring the traffic over the in-service life of the pavement system will allow an assessment of the applicability of the original design traffic to be undertaken. Large differences in the design traffic and actual traffic play an important role in the assessment and identification of performance trends.
Monitoring should not be limited to observed pavement performance and traffic loading; it should also extend to environmental influences. Moisture ingress is the main environmental influence on pavement performance; it will have a detrimental effect on both the subgrade and granular profile if not managed correctly. Moisture monitoring of these specific materials allows unexpected moisture levels to be identified which may account for unexpected failures or poor performance. Moisture monitoring will also allow the applicability of the assumed equilibrium design moisture – and subsequently the applicability of the assigned subgrade strength – to be assessed.
28th ARRB International Conference – Next Generation Connectivity, Brisbane, Queensland 2018
3
DETAILS OF WARRIP PROJECT
The aim of a project conducted under the Western Australian Road Research and Innovation Program (WARRIP) was to investigate the reasons for the better-than-expected performance of nine trial sections on the Tonkin Highway, Reid Highway and Kwinana Freeway, which all comprise thin asphalt surfacings (≤ 60 mm thick) and either a bitumen-stabilised limestone (BSL) or crushed rock base (CRB) basecourse, overlying a limestone subbase and sand subgrade. The pavements investigated were constructed in 1980, 1996 and 2009 respectively.
A range of historic and observational data was collated and reviewed to identify performance trends. This subsequently allowed the current design method for the fatigue life of thin asphalt surfacings to be critically reviewed and its applicability to Perth metropolitan pavements with typical materials and modern traffic loads assessed.
Design of Thin-Surfaced Granular Pavements in Western Australia
Current practice in Western Australia for the design of flexible pavements with thin asphalt or bituminous surfacings primarily relies on the empirical design procedure recommended in Austroads Guide to Pavement Technology: Part 2 (AGPT02) (Austroads 2017). It is used to determine the minimum thickness of the granular, select fill and stabilised subgrade layers – which form the pavement structure – over the subgrade. This minimum thickness is dependent on the subgrade design California Bearing Ratio (CBR) in addition to the design traffic loading over a 40-year design period (see Figure 1).
Figure 1: Empirical design chart for granular pavements (Austroads 2017)
Following the use of the empirical method to determine a pavement profile, the mechanistic-empirical method is used to assess the fatigue resistance of the asphalt surfacing. This method, as detailed in AGPT02 (Austroads (2017), is based on the structural analysis of a multi-layered pavement system using a linear elastic model such as CIRCLY. Inputs for the design method include the elastic parameters of all the selected materials within the pavement profile in addition to a design traffic loading. The critical tensile strain at the bottom of the asphalt layer is subsequently calculated and used in conjunction with the asphalt fatigue relationship (see Equation 1 below) to calculate an allowable level of loading to avoid asphalt fatigue. Project reliability is also considered by the method with ENR9 requiring a 95% reliability level when using the mechanistic-empirical method (MRWA 2013).
28th ARRB International Conference – Next Generation Connectivity, Brisbane, Queensland 2018
For pavements with a nominal asphalt thickness of 60 mm or less, the minimum asphalt fatigue life can be limited to 15 years (Main Roads Western Australia (MRWA) 2013). However, based on historic, observed performance of thin surfacings on granular pavements of certain material configurations, Clause 1.2(c) of the Western Australian design supplement Engineering Road Note 9 (ERN9) was introduced in 2013, which allowed for a reduced fatigue design life of 5 years given all criteria are met (MRWA 2013). This effectively means the allowable repetitions as calculated by Equation 1 above, need only to be greater than the first 5 years of the 40 year design traffic used in the empirical method. The Clause 1.2(c) criteria include:
The pavement basecourse must be either CRB or BSL basecourse
The pavement subbase must be limestone
The pavement must have a well-drained sand subgrade
The 40-year design traffic must be equal to or less than 3 x 10⁷ ESAs.
The traffic limit placed on the use of Clause 1.2(c) was based on the performance of various, heavily-trafficked sections in the Perth metropolitan area. At that time these selected pavements were approaching 40 years in-service and were identified as well-performing thin bituminous surfacings over either CRB or untreated limestone and sand subgrades. An analysis of the traffic data revealed that most of these older sections had reached a level of traffic loading close to, or just below, 3 x 10⁷ ESAs over the 40 years in-service life.
The introduction of this clause into ERN9 is an example of an outcome of a critical review of a design system. The use of this clause under the specified conditions ultimately calibrates a general design system to better match in-service observations and local conditions.
Material characterisation for mechanistic design
When using the mechanistic procedure to analyse the fatigue of thin asphalt pavements, the results can be highly variable depending on the material characterisation parameters input by the designer. Considering the current design procedure and parameters used for the mechanistic design of thin asphalt pavements which conform to the criteria set out in Clause 1.2(c), the granular and asphalt design moduli are presented in Table 1 and Table 2 respectively.
Table 1: Typical pavement design moduli recommended by ERN9 (MRWA 2013) and AGPT02 (Austroads 2012)
Material Modulus (MPa)
CRB 600
BSL base 500
Limestone subbase 250
Sand subgrade 120
28th ARRB International Conference – Next Generation Connectivity, Brisbane, Queensland 2018
5
Table 2: Typical design moduli for thin asphalt pavements with dense-graded asphalt (DGA)recommended by ERN9 (MRWA 2013) and AGPT02 (2012) for various speeds
Material Posted speed (km/h)
Measured modulus (MPa)
WMAPT (°C)
HV design speed (km/h)
Design modulus (MPa)
10 mm/170 bit. Perth DGA
100
5,000 29
90 2,720
90 80 2,600
80 70 2,480
70 60 2,340
INVESTIGATED PAVEMENTS
Tonkin Highway
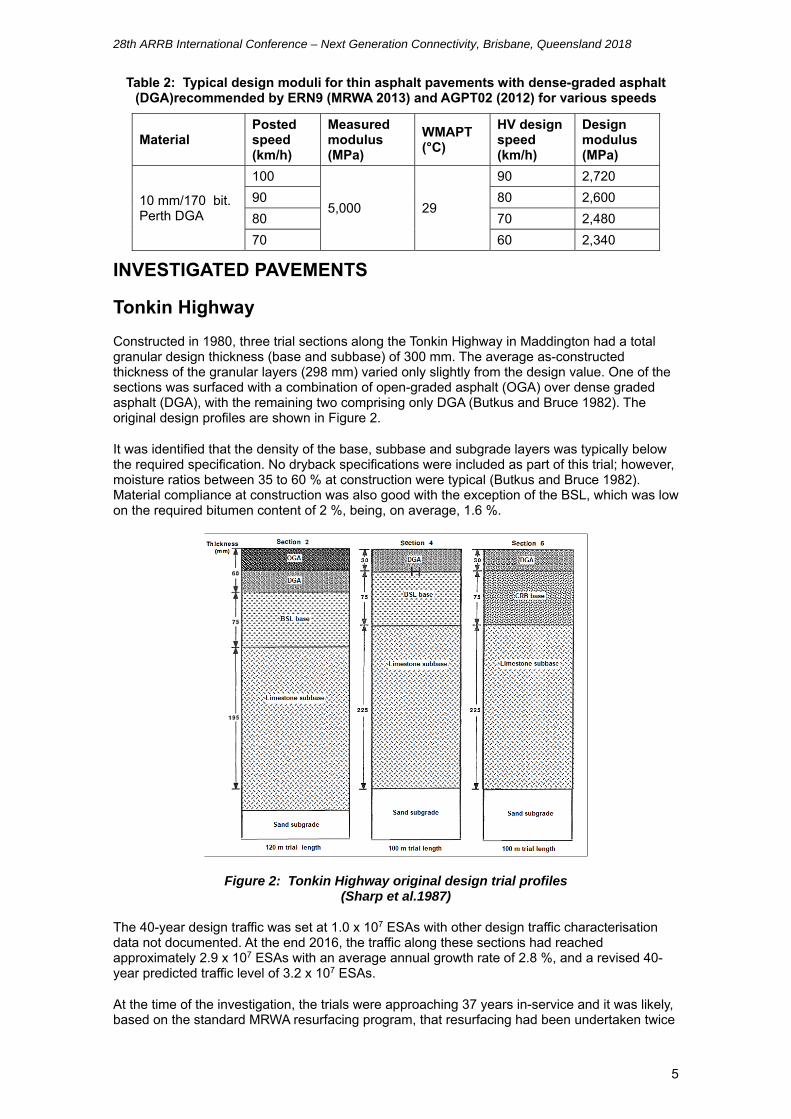
Constructed in 1980, three trial sections along the Tonkin Highway in Maddington had a total granular design thickness (base and subbase) of 300 mm. The average as-constructed thickness of the granular layers (298 mm) varied only slightly from the design value. One of the sections was surfaced with a combination of open-graded asphalt (OGA) over dense graded asphalt (DGA), with the remaining two comprising only DGA (Butkus and Bruce 1982). The original design profiles are shown in Figure 2.
It was identified that the density of the base, subbase and subgrade layers was typically below the required specification. No dryback specifications were included as part of this trial; however, moisture ratios between 35 to 60 % at construction were typical (Butkus and Bruce 1982). Material compliance at construction was also good with the exception of the BSL, which was low on the required bitumen content of 2 %, being, on average, 1.6 %.
Figure 2: Tonkin Highway original design trial profiles (Sharp et al.1987)
The 40-year design traffic was set at 1.0 x 10⁷ ESAs with other design traffic characterisation data not documented. At the end 2016, the traffic along these sections had reached approximately 2.9 x 10⁷ ESAs with an average annual growth rate of 2.8 %, and a revised 40-year predicted traffic level of 3.2 x 10⁷ ESAs.
At the time of the investigation, the trials were approaching 37 years in-service and it was likely, based on the standard MRWA resurfacing program, that resurfacing had been undertaken twice
28th ARRB International Conference – Next Generation Connectivity, Brisbane, Queensland 2018
6
in this time, which equates to an average surfacing life of 18 years. No other major rehabilitation or maintenance was recorded for these sections of pavement.
Reid Highway
Constructed in 1996, the Reid Highway trials in Middle Swan comprised a total thickness of granular pavement of 330 mm. The average as-constructed thickness (349 mm) was slightly higher than the design. All sections had a surfacing of DGA with a design thickness of 30 mm. The as-constructed thickness of the surfacings was between 44 and 65 mm (Butkus 2004).
Unlike the Tonkin trials, only minor non-conformances with construction specifications were identified at the Reid Highway trials. Dryback specifications provided for these pavements were typically met along with density specifications (Butkus 2004). Material conformance at construction was also typically well met, again with the exception of the bitumen content in the BSL, which was slightly lower than the design amount of 2% at 1.9%.
The 40-year design traffic was 3.5 x 10⁷ ESAs. By the end of 2016, the traffic along these sections had reached approximately 1.1 x 10⁷ ESAs with an average annual growth rate of 3.1 %, and a revised 40-year predicted traffic level of 2.5 x 10⁷ ESAs. An example of the disparity between the design traffic and measured traffic is shown in Figure 3.
Figure 3: Example of disparity between Reid Highway design traffic and measured traffic
At the time of the investigation, the trials were approaching 21 years in-service with no recorded re-surfacings. Visual inspections of the pavements also revealed no signs of surfacing fatigue, meaning the average surfacing life is more than 21 years. One section was identified to have been highly altered due to the upgrade of a major intersection. Therefore, data from this section was only considered before the alteration date in order not to skew performance trends.
Kwinana Freeway
The youngest of the pavements used for the study, the Kwinana Freeway trials were constructed in 2009 as part of the new Perth to Bunbury highway project. The total granular design thickness of the pavements was 380 mm, whilst the as-constructed mean thickness was approximately 420 mm. All the sections had an OGA surfacing over DGA and a design thickness of 30 mm for each layer. The mean thickness of all the surfacing layers was 65 mm (Rehman 2012).
28th ARRB International Conference – Next Generation Connectivity, Brisbane, Queensland 2018
7
These trials represent near perfect conformance to the construction specifications with dryback of the base, subbase and subgrade materials all well below the required criteria. Material conformance at construction was also typically well met, again with the exception of the bitumen content in the BSL slightly high at 2.2 % on average (Rehman 2012).
The 40-year design traffic for these trials was 2.2 x 10⁸ ESAs. At the end of 2016 (7 years in-service), the traffic along these sections had reached 7.4 x 10⁶ ESAs, with an average annual growth rate of 7.6 %, and a revised 40-year predicted traffic level of 1.7 x 10⁸ ESAs. The surfacing at these trials is performing well with no signs of fatigue.
PERFORMANCE DATA
Moisture monitoring
Moisture monitoring in the granular and subgrade layers was undertaken for approximately 10 years after construction at both the Tonkin Highway (Butkus 1991) and the Reid Highway (Harris and Lockwood 2009) trial sites. Moisture levels were consistent throughout the 10-year monitoring period, indicating that drainage and moisture protection of the pavements was sufficient and that there had not been a rise in the water table. It was therefore assumed in the analysis that moisture would not have influenced the overall in-service performance of the pavements and would be indicative of the conditions assumed during the design stage.
Deflection and curvature data
A review of all historic deflection and curvature data, where available, was undertaken to enable a preliminary performance analysis of the sections of interest. This included collation of all available data to identify unusual or unexpected trends in the deflection and curvature progression. Trends in the deflection and curvature data measured along the Reid Highway and Kwinana Freeway are shown in Figure 4 and Figure 5 respectively.
Figure 4: Trends in deflection data: Reid Highway and Kwinana Freeway (Butkus 2004; Harris & Lockwood 2009)
28th ARRB International Conference – Next Generation Connectivity, Brisbane, Queensland 2018
8
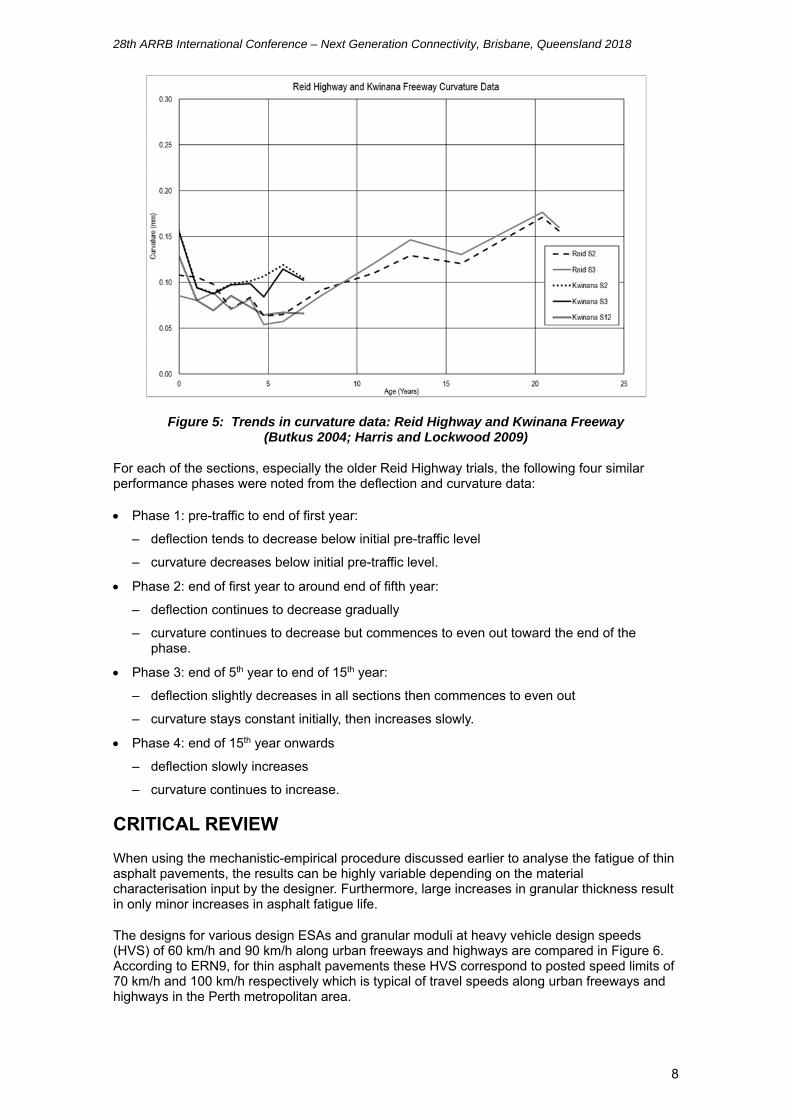
Figure 5: Trends in curvature data: Reid Highway and Kwinana Freeway (Butkus 2004; Harris and Lockwood 2009)
For each of the sections, especially the older Reid Highway trials, the following four similar performance phases were noted from the deflection and curvature data:
Phase 1: pre-traffic to end of first year:
– deflection tends to decrease below initial pre-traffic level
Phase 2: end of first year to around end of fifth year:
– deflection continues to decrease gradually
– curvature continues to decrease but commences to even out toward the end of the phase.
Phase 3: end of 5th year to end of 15th year:
– deflection slightly decreases in all sections then commences to even out
– curvature stays constant initially, then increases slowly.
Phase 4: end of 15th year onwards
– deflection slowly increases
– curvature continues to increase.
CRITICAL REVIEW
When using the mechanistic-empirical procedure discussed earlier to analyse the fatigue of thin asphalt pavements, the results can be highly variable depending on the material characterisation input by the designer. Furthermore, large increases in granular thickness result in only minor increases in asphalt fatigue life.
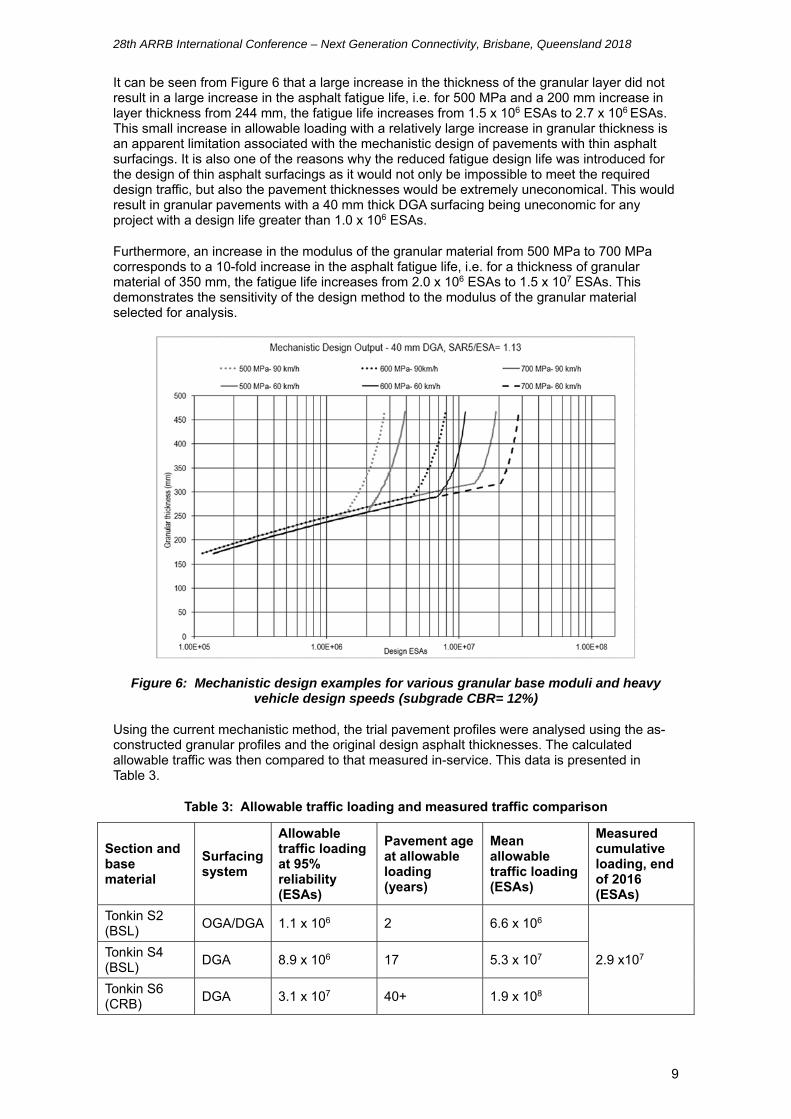
The designs for various design ESAs and granular moduli at heavy vehicle design speeds (HVS) of 60 km/h and 90 km/h along urban freeways and highways are compared in Figure 6. According to ERN9, for thin asphalt pavements these HVS correspond to posted speed limits of 70 km/h and 100 km/h respectively which is typical of travel speeds along urban freeways and highways in the Perth metropolitan area.
28th ARRB International Conference – Next Generation Connectivity, Brisbane, Queensland 2018
9
It can be seen from Figure 6 that a large increase in the thickness of the granular layer did not result in a large increase in the asphalt fatigue life, i.e. for 500 MPa and a 200 mm increase in layer thickness from 244 mm, the fatigue life increases from 1.5 x 10⁶ ESAs to 2.7 x 10⁶ ESAs. This small increase in allowable loading with a relatively large increase in granular thickness is an apparent limitation associated with the mechanistic design of pavements with thin asphalt surfacings. It is also one of the reasons why the reduced fatigue design life was introduced for the design of thin asphalt surfacings as it would not only be impossible to meet the required design traffic, but also the pavement thicknesses would be extremely uneconomical. This would result in granular pavements with a 40 mm thick DGA surfacing being uneconomic for any project with a design life greater than 1.0 x 10⁶ ESAs.
Furthermore, an increase in the modulus of the granular material from 500 MPa to 700 MPa corresponds to a 10-fold increase in the asphalt fatigue life, i.e. for a thickness of granular material of 350 mm, the fatigue life increases from 2.0 x 10⁶ ESAs to 1.5 x 10⁷ ESAs. This demonstrates the sensitivity of the design method to the modulus of the granular material selected for analysis.
Figure 6: Mechanistic design examples for various granular base moduli and heavy vehicle design speeds (subgrade CBR= 12%)
Using the current mechanistic method, the trial pavement profiles were analysed using the as-constructed granular profiles and the original design asphalt thicknesses. The calculated allowable traffic was then compared to that measured in-service. This data is presented in Table 3.
Table 3: Allowable traffic loading and measured traffic comparison
Section and base material
Surfacing system
Allowable traffic loading at 95% reliability (ESAs)
Pavement age at allowable loading (years)
Mean allowable traffic loading (ESAs)
Measured cumulative loading, end of 2016 (ESAs)
Tonkin S2 (BSL)
OGA/DGA 1.1 x 10⁶ 2 6.6 x 10⁶
2.9 x10⁷ Tonkin S4 (BSL)
DGA 8.9 x 10⁶ 17 5.3 x 10⁷
Tonkin S6 (CRB)
DGA 3.1 x 10⁷ 40+ 1.9 x 10⁸
28th ARRB International Conference – Next Generation Connectivity, Brisbane, Queensland 2018
10
Section and base material
Surfacing system
Allowable traffic loading at 95% reliability (ESAs)
Pavement age at allowable loading (years)
Mean allowable traffic loading (ESAs)
Measured cumulative loading, end of 2016 (ESAs)
Reid S2 (BSL)
DGA 1.2 x 10⁷ 26 7.2 x 10⁷ 1.1 x10⁷
Reid S3 (CRB)
DGA 4.4 x 10⁷ 40+ 2.6 x 10⁸
Kwinana S2/ S3 (CRB)
OGA/DGA 2.2 x 10⁶ 2 1.3 x 10⁷ 7.4 x10⁶
Kwinana S12 (BSL)
OGA/DGA 1.2 x 10⁶ 1 7.2 x 10⁶
It was determined that, for sections with the thicker 60 mm surfacing system of OGA/DGA, the mechanistic procedure was unable to correctly predict the allowable traffic for asphalt fatigue at the 95% reliability level required by ERN9.
To better compare the in-service performance with the design prediction, the mean asphalt fatigue life was calculated by multiplying the 95% reliability allowable traffic loading by a factor of 6. It was determined that, for all but one trial section, the cumulative traffic loadings were less than the mean predicted fatigue lives. As such, and despite the outstanding performance of these sections, this data alone is insufficient to justify a change to ERN9 design procedures.
Comparison of measured and Design Deflection Bowls
A comparison of the 95% characteristic measured deflection bowls and those predicted by the current mechanistic method at a reliability level of 95% and with ERN9 presumptive moduli was undertaken to help quantify the difference between the model generated and the field data.
The results, shown in Figure 7, suggest that the predicted deflections are considerably higher than the measured deflections even if a higher subgrade design modulus of 150 MPa is used. This demonstrates the mismatch between actual pavement performance and the design predicted performance in addition to the difference in pavement behaviour pre-traffic and at the end of the first year of trafficking.
Figure 7: Comparison of model generated and measured deflection bowl data
28th ARRB International Conference – Next Generation Connectivity, Brisbane, Queensland 2018
11
Presumptive Granular and Subgrade Moduli Design Values
EFROMD3 was used in conjunction with the results of the most recent FWD investigation undertaken in 2016 to back-calculate presumptive granular and subgrade modulus values. FWD testing was undertaken at 5 m intervals along both the OWP and BWP. The back-calculation considered the as-constructed thicknesses of each pavement layer in addition to other construction considerations such as material type, embankment data and subsurface conditions.
The moduli of the sand subgrade exceeded 150 MPa which was well in excess of the ERN9 design modulus limit of 120 MPa. In addition, the moduli of the CRB, BSL and limestone subbase were all typically greater than the presumptive design values.
To assess the variation in modulus with time/loading, back-calculation was also undertaken using historic FWD data collected at the Kwinana Freeway and Reid Highway sections (see Figure 8). The granular moduli timelines demonstrated strength phases similar to the performance phases inferred from the deflection and curvature data. The subgrade moduli remained constant over the in-service life; this is to be expected when the overlying granular cover is performing satisfactorily, and moisture ingress is managed correctly, as was the case with these pavements.
Figure 8: Timeline of back-calculated granular base moduli
PERFORMANCE PHASES AND A NEW DESIGN METHOD
Trends in the deflection and curvature data and the back-calculated moduli suggest that the performance throughout the in-service life of the pavements has followed similar phases. These phases are considered to form the basis of a revised design methodology which comprises both a short- and long-term design, with a first-year traffic limit and annual average growth rate as follows (see Figure 9):
The short-term asphalt fatigue life can be modelled using the current mechanistic-empirical procedure and current granular design moduli as this represents a conservative method to model the most detrimental loading period.
The long-term asphalt fatigue life may be subsequently modelled using the same procedure but with a change in the characterisation and stiffness of the granular base and subbase layers. This change would ensure that the model can better recognise the higher strength developed by materials typical to Perth metropolitan pavements.
28th ARRB International Conference – Next Generation Connectivity, Brisbane, Queensland 2018
12
It is anticipated that this new design method would better match the design output to the historic observed performance and make these cost-effective pavements available for use at higher range traffic scenarios, where full depth asphalt would typically be chosen.
An example of what this new design method may look like is presented in Figure 9 below where long term design moduli are based on the EFROMD3 back-calculated moduli. The revised method includes both a short and long term fatigue damage which is calculated via the ratio of design traffic to allowable fatigue repetitions. These values are then combined to calculate the cumulative fatigue damage. If the cumulative fatigue damage, or even the discrete short/long term fatigue damage, is greater than 100%, the chosen pavement design will need to be revised due to fatigue concerns.
Validation of the long term moduli values below, and indeed the notion of a short and long term design, still needs to be undertaken through a similar analysis of a range of non-trial pavements within the Perth metropolitan area.
Figure 9: Proposed method for calculating 95% reliability level short-term/long term asphalt fatigue life based on performance trends and back-calculation
CONCLUSIONS
Pavement design systems developed in the past may lose relevance as traffic characteristics, material properties, laboratory testing methods, and construction techniques advance over time. This may result in overly conservative outcomes which are no longer indicative of what is observed in the field. The synthesis and analysis of observational and historic performance and monitoring data can be used to critically review current design systems and ensure they align with observed behaviour and measured performance. This review of data also provides a context to which to explain the observed behaviour of an in-service pavement and to ensure the intended design has been achieved.
This type of critical review was undertaken as part of a WARRIP project which included the review of three separate trial locations with varying traffic levels, climatic characteristics, subsurface geology, pavement material sources, year of construction, and specification conformance. All have shown similar performance trends throughout their in-service life.
The review found that the current mechanistic method specified for the design of thin asphalt pavements in Western Australia may unnecessarily limit the allowable loading for asphalt fatigue at the required 95% reliability level. It was observed that the allowable loading at this reliability level over the in-service life of the trial pavements, determined using the current method, was much lower than what had been observed and measured in the field.
28th ARRB International Conference – Next Generation Connectivity, Brisbane, Queensland 2018
13
To combat this discrepancy between predicted and observed performance, it is suggested that the presumptive design moduli of granular and subgrade materials typical of these pavement profiles be reviewed. In addition, the consideration of a short/long term design method, which is based on observed performance phases throughout the in-service life of these types of granular pavements, should also be investigated more thoroughly through the analysis of other sections of road with similar material profiles and available performance data.
REFERENCES
Austroads 2017, Guide to pavement technology: part 2: pavement structural design, 4th edn, AGPT02-17, prepared by M Moffatt, Austroads, Sydney, NSW,
Butkus, F 1991, ‘Tonkin Highway test sections: monitoring data report (May 1981- November 1990 inclusive)’, report 91/13M, Main Roads Department, Perth, WA.
Butkus, F 2004, ‘Reid Highway basecourse test sections: volumes 1-4: construction details and performance to November 2003’, report 2004/17M, Main Roads Department, Perth, WA.
Butkus, F & Bruce, G 1982, ‘Beechboro-Gosnells Highway test sections: part 1-7: general description and construction start data’, report 82/20-26, Main Roads Department, Perth, WA.
Harris, D & Lockwood, N 2009, ‘Reid Highway basecourse test sections: performance data to December 2008’, report 2009/5 M, Main Roads Department, Perth, WA.
Main Roads Western Australia 2013, Engineering road note 9: procedure for the design of road pavements, MRWA, Perth, WA.
Rehman, S 2012, ‘Kwinana Freeway extension trial sections (SLK 55180 to 56680): volumes 1-2: construction details and performance to October 2011’, report 2010-13M, MRWA, Perth, WA.
Sharp, KG, Butkus, F, Bruce, GR, Cocks, GC & Potter, DW 1987, Field trials of pavement structures: construction report - Western Australia, report AIR 357-3, ARRB Group, Vermont South, Vic.
AUTHOR BIOGRAPHIES
Zia Rice
Zia Rice joined ARRB’s Western Australian office in 2016 having completed her degree in Civil Engineering at the University of Western Australia in 2012. Previously she worked as a geotechnical consultant where she gained extensive experience in geotechnics, specifically embankment and foundation design. She is currently undertaking pavement research as part of WARRIP and NACoE in addition to completing her Graduate Certificate in Pavement Technology through the Centre for Pavement Engineering Education (CPEE).
Kieran Sharp
Kieran Sharp has worked on a wide range of pavement, materials and asset management research projects for Austroads, State Road Agencies (including NACOE and WARRIP projects), the National Transport Commission, industry and the OECD. He was the Manager of the Australian Accelerated Loading Facility (ALF) program during the 1990s. He has been involved with various Austroads and industry-based Project Steering Committees and Reference Groups, and FEHRL and TRB Committees. In 2003, Kieran became the first member of ARRB to receive an Austroads Achievement Award in recognition of his contribution to Austroads activities over the previous 20 years. Kieran is the Chair of the Technical Committee of the Road Engineering Association of Asia and Australasia (REAAA) and a co-opted member of the Governing Council. He is also the deputy-chair of the REAAA Australian Chapter.
28th ARRB International Conference – Next Generation Connectivity, Brisbane, Queensland 2018
14
Geoff Cocks
Geoff Cocks graduated in Civil Engineering from the University of Western Australia in 1971. He completed a Master of Science in Civil Engineering at Purdue University in 1975. From 1971 to 1989 he was employed by Main Roads Western Australia where he progressed to become head of the Materials Engineering Branch. In 1989 he joined Coffey and progressed to become a Senior Principal. Since 2014, Geoff has been engaged by ARRB as a Principal Advisor in Pavement Technology.
Copyright Licence Agreement The author allows the Australian Road Research Board (ARRB) to publish the work/s submitted for the 28th ARRB International Conference, ARRB2018, granting ARRB the non-exclusive right to: • publish the work in printed format • publish the work in electronic format • publish the work online. The author retains the right to use their work, illustrations (line art, photographs, figures, plates) and research data in their own future works The author warrants that they are entitled to deal with the Intellectual Property Rights in the works submitted, including clearing all third party intellectual property rights and obtaining formal permission from their respective institutions or employers before submission, where necessary.