178
Preface 2013 Long-Term Reliability Assessment December 2013

Preface
2013 Long-Term
Reliability Assessment
December 2013
date

Preface
Table of Contents
PREFACE ................................................................................................................................................ III
EXECUTIVE SUMMARY ............................................................................................................................... 1
LONG-TERM PROJECTIONS AND HIGHLIGHTS .................................................................................................. 5
PROJECTED DEMAND, RESOURCES, AND RESERVE MARGINS ............................................................................ 14
LONG-TERM RELIABILITY CHALLENGES AND EMERGING ISSUES ......................................................................... 18 Resource Adequacy Concerns in MISO and TRE-ERCOT ............................................................................................................ 19 Continued Integration of Variable Generation .......................................................................................................................... 22 Fossil-Fired Retirements and Coordination of Outages for Environmental Control Retrofits ................................................... 29 Increased Dependence on Natural Gas for Electric Power ........................................................................................................ 35 Increased Use of Demand-Side Management ........................................................................................................................... 39 Nuclear Generation Retirements and/or Long-Term Outages .................................................................................................. 42 Other Challenges ....................................................................................................................................................................... 45
FRCC .................................................................................................................................................. 49
MISO ................................................................................................................................................. 52
MRO-MANITOBA HYDRO ....................................................................................................................... 71
MRO-MAPP ....................................................................................................................................... 77
MRO-SASKPOWER ................................................................................................................................ 80
NPCC-MARITIMES ................................................................................................................................. 85
NPCC-NEW ENGLAND ............................................................................................................................ 91
NPCC-NEW YORK ................................................................................................................................ 101
NPCC-ONTARIO .................................................................................................................................. 109
NPCC-QUÉBEC .................................................................................................................................... 117
PJM .................................................................................................................................................. 123
SERC-E ............................................................................................................................................. 131
SERC-N ............................................................................................................................................. 134
SERC-SE ............................................................................................................................................ 137
SERC-W ............................................................................................................................................ 139
SPP .................................................................................................................................................. 142
TRE-ERCOT ....................................................................................................................................... 149
WECC ............................................................................................................................................... 159
APPENDIX I: LIST OF ACRONYMS ............................................................................................................. 167

Preface
NERC | 2013 Long-Term Reliability Assessment | December 2013
Page iii
Preface The North American Electric Reliability Corporation (NERC) has prepared the following assessment in accordance with the
Energy Policy Act of 2005, in which the United States Congress directed NERC to conduct periodic assessments of the
reliability and adequacy of the bulk power system (BPS) of North America.1,2 NERC operates under similar obligations in
many Canadian provinces, as well as a portion of Baja California Norte, Mexico.
NERC is an international regulatory authority established to evaluate and improve the reliability of the BPS in North
America. NERC develops and enforces Reliability Standards; annually assesses seasonal and long-term (10-year) reliability;
monitors the BPS through system awareness; and educates, trains, and certifies industry personnel. NERC is the electric
reliability organization (ERO) for North America, subject to oversight by the U.S. Federal Energy Regulatory Commission
(FERC) and governmental authorities in Canada.3
Reliability Standards are the planning and operating rules that electric utilities follow to support and maintain a reliable
electric system. These standards are developed by the industry using a balanced, open, fair, and inclusive process
accredited by the American National Standards Institute (ANSI). While NERC does not have authority to set Reliability
Standards for resource adequacy (e.g., reserve margin criteria) or to order the construction of resources or transmission,
NERC can independently assess where reliability issues may arise and identify emerging risks. This information, along with
NERC recommendations, is then made available to policy makers and federal, state, and provincial regulators to support
decision making within the electric sector.
NERC Regional Entities NERC Regional Entities Map NERC Assessment Areas Map FRCC Florida Reliability Coordinating Council
MRO Midwest Reliability Organization
NPCC Northeast Power Coordinating Council
RFC ReliabilityFirst Corporation
SERC SERC Reliability Corporation
SPP-RE Southwest Power Pool Regional Entity
TRE Texas Reliability Entity
WECC Western Electricity Coordinating Council
NERC prepares seasonal and long-term assessments to examine the current and future reliability, adequacy, and security of
the North American BPS. For these assessments, the BPS is divided into 26 assessment areas, both within and across the
eight Regional Entity boundaries, as shown in the corresponding table and maps above.4 The preparation of these
assessments involves NERC’s collection and consolidation of data from the Regional Entities. Reference case data includes
projected on-peak demand and energy, Demand Response (DR), resource capacity, and transmission projects. Data and
1 H.R. 6 as approved by of the One Hundred Ninth Congress of the United States, the Energy Policy Act of 2005. 2 The NERC Rules of Procedure, Section 800, further detail the Objectives, Scope, Data and Information requirements, and Reliability Assessment
Process requiring annual seasonal and long-term reliability assessments. 3 As of June 18, 2007, FERC granted NERC the legal authority to enforce Reliability Standards with all U.S. users, owners, and operators of the BPS
and made compliance with those standards mandatory and enforceable. Equivalent relationships have been sought and for the most part realized in Canada and Mexico. Prior to adoption of §215 in the United States, the provinces of Ontario (2002) and New Brunswick (2004) adopted all Reliability Standards that were approved by the NERC Board as mandatory and enforceable within their respective jurisdictions through market rules. Reliability legislation is in place or NERC has memoranda of understanding with provincial authorities in Ontario, New Brunswick, Nova Scotia, Québec, Manitoba, Saskatchewan, British Columbia, and Alberta, and with the National Energy Board of Canada (NEB). NERC standards are mandatory and enforceable in Ontario and New Brunswick as a matter of provincial law. Manitoba has adopted legislation, and standards are mandatory there. In addition, NERC has been designated as the “electric reliability organization” under Alberta’s Transportation Regulation, and certain Reliability Standards have been approved in that jurisdiction; others are pending. NERC standards are now mandatory in British Columbia and Nova Scotia. NERC and the Northeast Power Coordinating Council (NPCC) have been recognized as standards-setting bodies by the Régie de l’énergie of Québec, and Québec has the framework in place for Reliability Standards to become mandatory. NEB has made Reliability Standards mandatory for international power lines. In Mexico, the Comisión Federal de Electricidad (CFE) has signed WECC’s reliability management system agreement, which only applies to Baja California Norte.
4 Maps created using Ventyx Velocity Suite.

Preface
NERC | 2013 Long-Term Reliability Assessment | December 2013
Page iv
information from each NERC Region is also collected and used to identify notable trends, emerging issues, and potential
concerns. This bottom-up approach captures virtually all electricity supplied in the United States, Canada, and a portion of
Baja California Norte, Mexico. NERC’s reliability assessments are developed to inform industry, policy makers, and
regulators and to aid NERC in achieving its mission—to ensure the reliability of the North American BPS.
Assessment Preparation and Design
The 2013 Long-Term Reliability Assessment (2013LTRA) is published by NERC in accordance with Title 18, § 39.115 of the
Code of Federal Regulations,6 also referred to as Section 215 of the Federal Power Act, which instructs NERC to conduct
periodic assessments of the BPS. Section 803 of NERC’s Rules of Procedure7 further describes NERC’s obligation to develop
annual long-term reports with a 10-year planning horizon.
This report provides an independent assessment of the 10-year8 reliability outlook for the North American BPS9 while
identifying trends, emerging issues, and potential risks. Additional insight will be offered regarding resource adequacy,
security, and operating reliability, as well as an overview of projected electricity demand growth for individual assessment
areas.
NERC prepared the 2013 LTRA with support from the Reliability Assessment Subcommittee (RAS) under the direction of the
NERC Planning Committee (PC). This report is based on data and information submitted by each of the eight Regional
Entities, which are represented on the RAS. Initial data and information were submitted in June 2013, and periodic updates
occurred throughout the development of the report. Any other data sources included by NERC staff are identified
accordingly. Additional inquiries regarding the information, data, and analysis in this assessment may be directed to:
Table I: North American Electric Reliability Staff
Name Position Email Phone
Thomas Burgess Vice President and Director [email protected] 404-446-2563 John N. Moura Director [email protected] 404-446-9731 Noha Abdel-Karim Senior Engineer [email protected] 404-446-9699 Elliott J. Nethercutt Senior Technical Analyst [email protected] 202-644-8089 Trinh C. Ly Junior Engineer [email protected] 404-446-9737 Michelle Marx Administrative Assistant [email protected] 404-446-9727
NERC uses a RAS peer review process to prepare both seasonal and long-term reliability assessments. This process allows
NERC to leverage the knowledge and experience of subject matter experts who represent NERC Regions and the electricity
industry at large. It also provides an essential balance that ensures the validity of data and information provided by the
Regional Entities. Each assessment area’s section is assigned to subcommittee members from other Regions to encourage a
comprehensive review that is discussed and verified by the RAS in open meetings. The review process gives all RAS
members the opportunity to verify that each Regional Entity produces quality assessments that are accurate and complete.
The Planning Committee (PC) members reviewed this assessment and fully vet all findings and conclusions. Prior to release,
NERC submits the assessment to the Board of Trustees (Board) for final review and approval.
5 Section 39.11(b) of the U.S. FERC’s regulations provide: “The Electric Reliability Organization shall conduct assessments of the adequacy of the
Bulk-Power System in North America and report its findings to the Commission, the Secretary of Energy, each Regional Entity, and each Regional Advisory Body annually or more frequently if so ordered by the Commission.”
6 Title 18, § 39.11 of the Code of Federal Regulations. 7 NERC Rules of Procedure. 8 The 10-year period observed in this assessment is from 2014 to 2023, with the 2014 summer as the initial season. Information and data for the
2013 summer and 2013–2014 winter seasons are provided in NERC’s seasonal reliability assessments: NERC Seasonal Reliability Assessments. 9 BPS reliability, as defined in the How NERC Defines BPS Reliability section of this report, does not include the reliability of the lower-voltage
distribution systems, which systems use to account for 80 percent of all electricity supply interruptions to end-use customers.

Preface
NERC | 2013 Long-Term Reliability Assessment | December 2013
Page v
Table II: Assessment Structure Section Description
Long-Term
Projections and
Highlights
Includes data highlights identified from the 2013LTRA reference case, including projections for Planning Reserve
Margins, demand, Demand-Side resources, generation, and transmission.
Projected Demand,
Resources, and
Reserve Margins
Detailed tables including Total Internal Demand, Net Internal Demand, Anticipated, Prospective, and Adjusted-Potential
Resources and Reserve Margins, and the NERC Reference Margin Level for each assessment area (years 2014, 2018,
2023).
Long-Term
Reliability
Challenges and
Emerging Issues
Provides an assessment of emerging BPS reliability risks and NERC recommendations. Supports the development of
scenarios—the analysis of which can indicate the sensitivity of the 2013LTRA reference case to changes in prespecified
conditions and provide insight into the risks to regional reliability. Emerging reliability issues are generally known or
unknown risks NERC and its stakeholders have endorsed for assessment. Continued understanding of potential impacts
to the BPS, the likelihood of those impacts, and regional implications are important characteristics to NERC’s reliability
assessment process.
Assessment Area
Sections
Includes summary tables and corresponding text that provide a more comprehensive and granular reliability outlook for
each assessment area.
Table III: Reliability Concepts
The concept of reliability is generally applied as the ability of the BPS to meet the electricity needs of end-use customers at all times. Reliability
can be further understood by ‘unbundling’ the concept into three essential categories:
Operating
Reliability
For decades, NERC and the bulk power industry defined system security as the operating aspects that enable the BPS to
withstand sudden, unexpected disturbances, such as short circuits or unanticipated loss of system elements due to
natural causes. In today’s world, the security focus of NERC and the industry has expanded to include withstanding
disturbances caused by man-made physical or cyber attacks. The bulk power system must be planned, designed, built
and operated in a manner that takes into account these modern threats, as well as more traditional risks to security.
Adequacy
Adequacy means having sufficient resources to provide customers with a continuous supply of electricity at the proper
voltage and frequency, virtually all of the time. Resources refer to a combination of electricity generating and
transmission facilities that produce and deliver electricity, and demand-response programs that reduce customer
demand for electricity. Adequacy requires system operators and planners account for scheduled and reasonably
expected unscheduled outages of equipment, while maintaining a constant balance between supply and demand.
Fuel Security Associated with both adequacy and operational reliability, access to reliable fuel supplies for generation must be
maintained in the presence of ongoing changes to market structures, supply routes, and deliverability challenges.
These categories are interrelated and must all be considered to promote existing and future reliability. For example: the adequacy of a system
can be threatened by fuel security challenges when there is an increased reliance on a single fuel source that may lack resilient deliverability
channels. While the system may appear to have adequate resources, reliability can still be impacted if fuel security concerns are not identified
and mitigated.
Table IV: 2013LTRA Reference Case Data Assumptions
Data Term Assumptions
Peak demand (load)
projections
Load projections are based on a noncoincident 50/50 peak demand forecast, unless otherwise noted. Values represent
the baseline values for each season, each with a range of possible outcomes based on probabilities around the baseline
or midpoint. Projections are provided on an assessment area basis and are highly dependent on the data,
methodologies, model structures, and other assumptions that often vary by Region, Reliability Coordinator, assessment
area, or Balancing Authority.10
Capacity
“Capacity” refers to the on-peak capacity available during the hour of peak demand for the peak season of each year. All
generating and transmission equipment availability is based on historic performance, unless otherwise noted. For
variable resources, capacity refers to the expected on-peak power contributions, unless otherwise denoted as
10 Additional information on the methods and assumption used by each assessment area are available through the following link: NERC Reliability
Assessments.

Preface
NERC | 2013 Long-Term Reliability Assessment | December 2013
Page vi
“nameplate” capacity.
Demand-Side
Management
All categories of DR will be available at the time of peak demand. Other Demand-Side Management programs, such as
conservation, Energy Efficiency, and price-responsive DR, are incorporated into the Net Internal Demand projections.
Capacity Transactions Firm or expected [firm] capacity transactions (transfers) between assessment areas are assumed to be available during
the peak according to contractual arrangements.
General
The summer season represents June–September and the winter season represents December–February.
Data updates are included until the entire assessment is submitted to the NERC Board of Trustees. Any subsequent
revisions or corrections may not be included or otherwise represented in this assessment.
Planned outages, additions, and upgrades of generation and transmission in the 2013LTRA reference case will be
completed as scheduled.
Existing federal, state, and provincial laws and regulations in effect at the time of data and information collection are
assumed throughout the 10-year period.
Table V: Demand Terms
Total Internal
Demand
The sum of the metered (net) outputs of all generators within the system and the metered line flows into the system,
less the metered line flows out of the system (forecast). Total Internal Demand includes adjustments conservation and
Energy Efficiency programs, improvements in efficiency of electricity use, and all nondispatchable DR programs.
Net Internal Demand Total Internal Demand less Dispatchable, Controllable Capacity Demand Response used to reduce peak load.
Table VI: Resource Terms
Anticipated
Resources
Includes Existing-Certain, Future-Planned, Net Firm Capacity Transactions, and Supply-Side Demand Response.
Existing-Certain This category includes generation resources available to operate and deliver power within or into the assessment area
during the period of peak demand. Resources included in this category may be reported as a portion of the full
capability of the resource, plant, or unit. This category includes, but is not limited to the following: (1) contracted (or
firm) or other similar resource confirmed able to serve load during peak demand; (2) where organized markets exist,
designated market resource that is eligible to bid into a market or has been designated as a firm network resource; (3)
Network Resource, as that term is used for FERC pro forma or other regulatory-approved tariffs; (4) Energy-Only
resources confirmed able to serve load during peak demand and will not be curtailed; (5) capacity resources that cannot
be sold elsewhere; (6) other resources not included in the above categories that have been confirmed able to serve load
and not to be curtailed during peak demand.
Future-Planned This category includes generation resources anticipated to be available to operate and deliver power within or into the
assessment area during the period of peak demand. This category includes, but is not limited to the following: (1)
contracted (or firm) or other similar resource; (2) where organized markets exist, designated market resource that is
eligible to bid into a market or has been designated as a firm network resource; (3) Network Resource, as that term is
used for FERC pro forma or other regulatory approved tariffs; (4) Energy-Only resources confirmed able to serve load
during the peak and not subject to curtailment; (5) where applicable, included in an integrated resource plan under a
regulatory environment that mandates resource adequacy requirements and the obligation to serve.
Net Firm Capacity
Transactions
Firm imports minus firm exports; a contract must be in place for the assessment period.
Supply-Side Demand
Response
Includes all categories of DR treated as a resource.
Prospective
Resources
Includes Anticipated Resources, plus Existing-Other, Future-Other, and Expected Capacity Transactions.
Existing-Other This category includes generation resources that may be available to operate and deliver power within or into the
assessment area during the period of peak demand but that may be curtailed or interrupted at any time for various
reasons. This category includes, but is not limited to the following: (1) a resource with nonfirm or other similar
transmission arrangements; (2) Energy-Only resources that have been confirmed able to serve load for any reason
during the reporting period, but may be curtailed for any reason; (3) mothballed generation (that may be returned to
service during peak demand); (4) generation resources constrained for other reasons.
Future-Other This category includes all generation resources that do not qualify as Future-Planned or Conceptual Energy-Only
resources. This category includes, but is not limited to the following: (1) a resource that may be curtailed or interrupted
at any time for any reason; (2) Energy-Only resources that may be able to serve load during the peak.
Expected Expected imports minus Expected exports; Expected transactions are nonfirm transactions with a reasonable
Preface
NERC | 2013 Long-Term Reliability Assessment | December 2013
Page vii
Transactions expectation of being implemented.
Adjusted-Potential
Resources
Includes Prospective Resources, plus Conceptual Resources after the application of a confidence factor by each
assessment area.
Conceptual This category includes future generation resources that do not meet the parameters defined for Future-Planned or
Future-Other resources. Conceptual resources include those that have been identified or announced on a resource
planning basis through one or more of the following: (1) corporate announcement; (2) in the early stages of an approval
process; (3) included in a generator interconnection (or other) queue or study; (4) a “place-holder” generation for use in
modeling.
Table VII: Reserve Margins
Anticipated Reserve Margin (Anticipated Resources – Net Internal Demand)
Net Internal Demand
Prospective Reserve Margin (Prospective Resources – Net Internal Demand)
Net Internal Demand
Adjusted-Potential Reserve Margin (Adjusted-Potential Resources – Net Internal Demand)
Net Internal Demand
Table VIII: Reference Materials
Document Description
Previous Long-Term Reliability Assessments Electronic versions of the 1991 through current Long-Term Reliability Assessments
2013 Long-Term Reliability Assessment Request The annual data and information request requiring response and completion by each Regional Entity
Electricity Supply and Demand (ES&D) Database
NERC collects, maintains, and annually publishes the ES&D, which includes data on the 10-year projections used to develop this report.
Assessment Area Part II Methods & Assumptions
The Methods and Assumptions document provides details on how the Regions conduct reliability assessments, develop associated criteria, and evaluate regional reliability.
Emerging Reliability Issues Survey
Summary data on the information collected as part of the 2013 Emerging Reliability Issues survey.
Probabilistic Assessments
A biennial report that supplements the Long-Term Reliability Assessment’s deterministic reserve margin assessment with probabilistic indices for each assessment area.
Reliability Assessment Guidebook
The Guidebook is a reference for Regional Entities and registered entities to use to clarify current reliability assessment practices and objectives. The intent is to document practices and provide comprehensive reliability assessments.
Special Assessments NERC performs special assessments based on findings in the long-term reliability assessments. NERC has written numerous special assessments that provide technical insight to emerging reliability challenges.
Reliability Assessment Subcommittee (RAS) Website
The RAS reviews, assesses, and reports on the overall reliability (adequacy and security) of bulk power systems, both existing and as planned. Those reviews and assessments verify that each assessment area conforms to its own planning criteria, guides, and the applicable NERC Reliability Standards.
Planning Committee (PC) Website The PC supports the NERC reliability mission by executing the policies, directives, and assignments of the Board and by advising industry on matters related to BPS transmission planning and reliability and resource adequacy.

Executive Summary
NERC | 2013 Long-Term Reliability Assessment | December 2013
Page 1
Executive Summary In preparing this assessment, NERC evaluated key reliability indicators, including peak demand and energy forecasts,
resource adequacy, transmission development, changes in overall system characteristics and operating behavior, and other
external or regulatory issues that may impact the reliability of the BPS.
The electricity industry has prepared plans for the 2014–2023 assessment period in an effort to provide reliable electric
service across North America. In some assessment areas, NERC has identified certain evolving issues that may potentially
affect the reliability of the BPS. Over the next 10 years, the electric industry will face a number of significant emerging
reliability issues, which are explained in detail throughout this report. These issues will change the industry, requiring better
modeling and risk management and increasing the reliance on natural gas, renewable resources, and a more robust
infrastructure. Each of these elements of change is critically interdependent, and industry action must be closely
coordinated to ensure reliability.
Impacts to long-term BPS reliability are categorized and assessed within three overarching risk areas:
1. RESOURCE AND TRANSMISSION ADEQUACY
Resource and transmission adequacy risks can impact the projected ability of BPS infrastructure to serve customer
demand during all hours over a specified horizon. Uncertainty in resource and transmission needs is driven by market
and environmental regulations, customer demand, and impediments to constructing facilities within a needed time
frame.
2. INTEGRATION OF NEW TECHNOLOGIES AND OPERATIONS
The integration of new technologies can introduce potential future operational risks to the BPS. Resources or new
technologies with unique operating characteristics require a level of enhanced understanding beyond traditional
capacity and energy planning. Integrating these technologies without fully understanding their impacts can threaten
real-time operations as well as the system’s ability to withstand disturbances.
3. LONG-TERM SYSTEM PLANNING AND MODELING
The approach and methods used for long-term planning and modeling, including potential inadequate assumptions,
models, data, and methods, can lead to incorrect decision making and introduce risks to the BPS. Therefore, model and
analysis inputs need to be accurate and enhanced to reflect a rapidly evolving range of future transmission and resource
challenges.
The electric industry is becoming more complex due to political and societal drivers propelling new policies, such as a
carbon-reduced resource portfolio. This assessment presents the contributing factors identified in the 2013LTRA reference
case and highlights potential reliability challenges and emerging issues. Each issue is ultimately related to the three
overarching risk areas identified above.
Key Findings and Recommendations
The evolving operation of the BPS will require new operational tools and procedures that, in order to be implemented
without adverse impacts to system reliability, will require careful consideration, preparation, and planning. Issues and
challenges related to resource and transmission adequacy, integration of new technologies, and long-term system planning
and modeling are highlighted in this assessment. While some of these challenges are more regional than others, their
cumulative impacts can affect planning and operating fundamentals that can extend to the entire interconnection.
Accordingly, NERC’s stakeholder and subject matter expert committees evaluated six issues that NERC identified would be
most impactful over the next 10 years and developed a comprehensive risk assessment. The six issues are summarized with
corresponding recommendations below:
Executive Summary
NERC | 2013 Long-Term Reliability Assessment | December 2013
Page 2
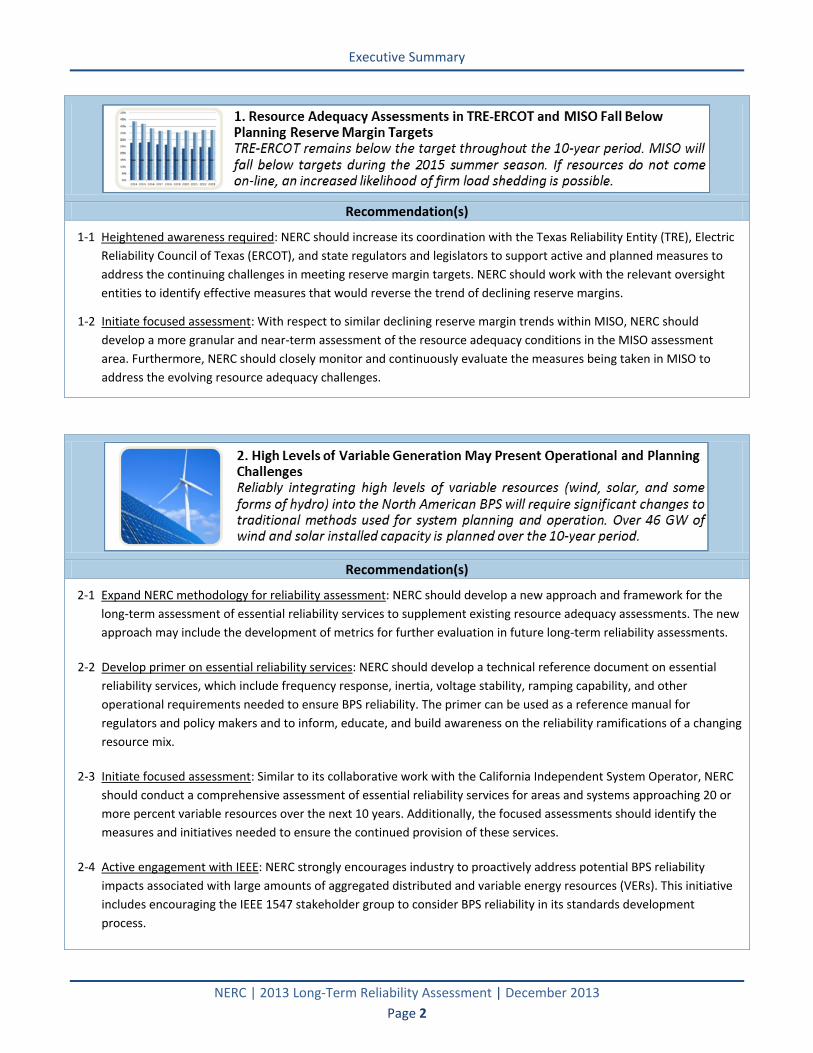
Recommendation(s)
1-1 Heightened awareness required: NERC should increase its coordination with the Texas Reliability Entity (TRE), Electric
Reliability Council of Texas (ERCOT), and state regulators and legislators to support active and planned measures to
address the continuing challenges in meeting reserve margin targets. NERC should work with the relevant oversight
entities to identify effective measures that would reverse the trend of declining reserve margins.
1-2 Initiate focused assessment: With respect to similar declining reserve margin trends within MISO, NERC should
develop a more granular and near-term assessment of the resource adequacy conditions in the MISO assessment
area. Furthermore, NERC should closely monitor and continuously evaluate the measures being taken in MISO to
address the evolving resource adequacy challenges.
Recommendation(s)
2-1 Expand NERC methodology for reliability assessment: NERC should develop a new approach and framework for the
long-term assessment of essential reliability services to supplement existing resource adequacy assessments. The new
approach may include the development of metrics for further evaluation in future long-term reliability assessments.
2-2 Develop primer on essential reliability services: NERC should develop a technical reference document on essential
reliability services, which include frequency response, inertia, voltage stability, ramping capability, and other
operational requirements needed to ensure BPS reliability. The primer can be used as a reference manual for
regulators and policy makers and to inform, educate, and build awareness on the reliability ramifications of a changing
resource mix.
2-3 Initiate focused assessment: Similar to its collaborative work with the California Independent System Operator, NERC
should conduct a comprehensive assessment of essential reliability services for areas and systems approaching 20 or
more percent variable resources over the next 10 years. Additionally, the focused assessments should identify the
measures and initiatives needed to ensure the continued provision of these services.
2-4 Active engagement with IEEE: NERC strongly encourages industry to proactively address potential BPS reliability
impacts associated with large amounts of aggregated distributed and variable energy resources (VERs). This initiative
includes encouraging the IEEE 1547 stakeholder group to consider BPS reliability in its standards development
process.

Executive Summary
NERC | 2013 Long-Term Reliability Assessment | December 2013
Page 3
Recommendation(s)
3-1 Probabilistic insights needed: NERC should monitor retirements and emerging reliability issues—including local
reliability effects—stemming from significant generator retirements. Additional insight on impacts from unit
retirements will be provided in 2014 as a result of NERC’s biennial probabilistic resource adequacy assessment.
3-2 Reliability signals must reflect system needs: Regional wholesale competitive market operators should ensure markets
are functioning effectively and can support the development of new replacement capacity where needed. Reliability
signals that are representative of BPS risks are essential for informing the market of a specific need (e.g., capacity,
energy, and ancillary services).
3-3 Initiate focused assessment: In light of emerging and proposed environmental regulations, NERC should revisit its
2010 Special Reliability Assessment: Reliability Impacts of Climate Change Initiatives report and reassess the emerging
reliability impacts.
Recommendation(s)
4-1 Monitor high-risk regions: Through its reliability assessments, NERC should closely monitor resource availability and
operational impacts in New England and other areas of North America that are quickly integrating large amounts of
natural gas-fired generation.
4-2 Expand coordination with study groups: NERC should expand its coordination with regional and interregional study
groups, as well as the natural gas industry, to further assess BPS reliability needs. Regional and interregional studies
are focusing on the long-term needs of natural gas transportation for electric power. These efforts may provide better
insight on the system planning and operating measures being taken to address an increasing dependency on natural
gas.

Executive Summary
NERC | 2013 Long-Term Reliability Assessment | December 2013
Page 4
4-3 Fulfill outstanding recommendations: NERC, the industry, and policy makers should continue addressing the
recommendations included in the 2013 Special Reliability Assessment: Impacts of Increased Natural Gas for Electric
Power.
Recommendation(s)
5-1 Enhance performance analysis: NERC should leverage the Demand Response Availability Data System (DADS) data to
identify availability and performance trends that may indicate future BPS risks. These findings should be reported in
the annual State of Reliability report.
5-2 Evaluate the need for requirements or guidelines: NERC should determine whether requirements or guidelines are
needed to support Demand Response planning and operations, specifically Demand Response that is relied on to meet
bulk system reliability requirements. The Planning and Operating Committees should provide joint technical support
to the Standards Committee on any reliability issues that should be considered during the development of NERC
Reliability Standards.
Recommendation(s)
6-1 Prioritize through risk evaluation: NERC should consider developing a sensitivity study of the potential reliability
impacts of accelerated nuclear plant retirements or shutdowns in the near future.
While these key findings are presented independently, they are cross-cutting, and interdependencies between many of the
issues present unique challenges to the electricity industry. Growth in flexible resources such as Demand Response and
quick-start natural gas-powered generators is an encouraging trend, as are transmission plans to integrate renewable
resources distant from load centers. However, evolving risks, such as the increased dependency on natural gas, increasing
amounts of variable generation, and the potential reduction of overall system inertia, must be considered in the
development of future planning and operating strategies. These risks must be strategically monitored and mitigated in
order to preserve the reliability of the BPS. NERC’s annual long-term reliability assessment provides the basis for
understanding these risks and, more importantly, how these interdependent challenges require ERO-wide coordination to
be effectively addressed.
Long-Term Projections and Highlights
NERC | 2013 Long-Term Reliability Assessment | December 2013
Page 5
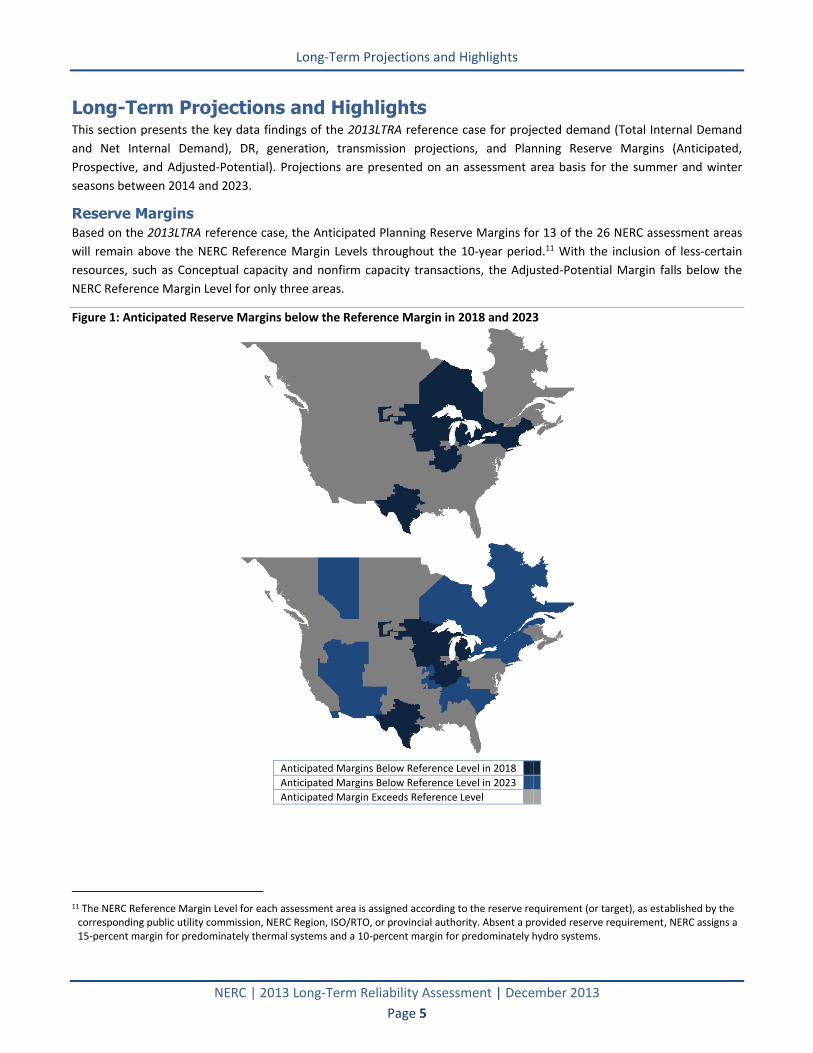
Long-Term Projections and Highlights This section presents the key data findings of the 2013LTRA reference case for projected demand (Total Internal Demand
and Net Internal Demand), DR, generation, transmission projections, and Planning Reserve Margins (Anticipated,
Prospective, and Adjusted-Potential). Projections are presented on an assessment area basis for the summer and winter
seasons between 2014 and 2023.
Reserve Margins
Based on the 2013LTRA reference case, the Anticipated Planning Reserve Margins for 13 of the 26 NERC assessment areas
will remain above the NERC Reference Margin Levels throughout the 10-year period.11 With the inclusion of less-certain
resources, such as Conceptual capacity and nonfirm capacity transactions, the Adjusted-Potential Margin falls below the
NERC Reference Margin Level for only three areas.
Figure 1: Anticipated Reserve Margins below the Reference Margin in 2018 and 2023
Anticipated Margins Below Reference Level in 2018
Anticipated Margins Below Reference Level in 2023
Anticipated Margin Exceeds Reference Level
11 The NERC Reference Margin Level for each assessment area is assigned according to the reserve requirement (or target), as established by the
corresponding public utility commission, NERC Region, ISO/RTO, or provincial authority. Absent a provided reserve requirement, NERC assigns a 15-percent margin for predominately thermal systems and a 10-percent margin for predominately hydro systems.

Long-Term Projections and Highlights
NERC | 2013 Long-Term Reliability Assessment | December 2013
Page 6
Figure 2: 2018 Peak Planning Reserve Margins12
Figure 3: 2023 Peak Planning Reserve Margins13
When examining the latter half of the assessment period (2018–2023), it is important to understand NERC’s Planning
Reserve Margin assumptions, which are based on industry’s long-term resource adequacy plans at the time the data and
information was submitted to NERC. The assessment areas of most concern are ERCOT and MISO, as their Anticipated
Margins fall below the NERC Reference Margin Level in the summer seasons of 2014 and 2015, respectively. These concerns
are discussed in greater detail in the next section.
In the summer season of 2018, the NPCC-Ontario Anticipated Margin falls below the NERC Reference Margin Level. In
addition to the shorter-term resource adequacy challenges in ERCOT and MISO, several other assessment areas fall below
the NERC Reference Margin Level in the latter part of the assessment period (2019–2023) when plans for new resources are
less certain.14 An assessment area not meeting the reference margin projection does not necessarily signal an immediate
reliability concern; however, that area may need to evaluate options throughout the next several years for constructing or
obtaining more capacity or instituting demand reduction initiatives.
12 Planning Reserve Margins over 40 percent are not shown. The 2018–2019 winter season is shown for winter-peaking assessment areas. 13 Planning Reserve Margins over 40 percent are not shown. The 2023–2024 winter season is shown for winter-peaking assessment areas. 14 Additional assessment areas below the NERC Reference Margin Level during the area’s respective peak seasons include: MRO-MAPP, NPCC-
New England, NPCC-New York, NPCC-Québec, SERC-E, SERC-N, WECC-AESO, WECC-BASN, WECC-DSW, WECC-MEXW.
Long-Term Projections and Highlights
NERC | 2013 Long-Term Reliability Assessment | December 2013
Page 7
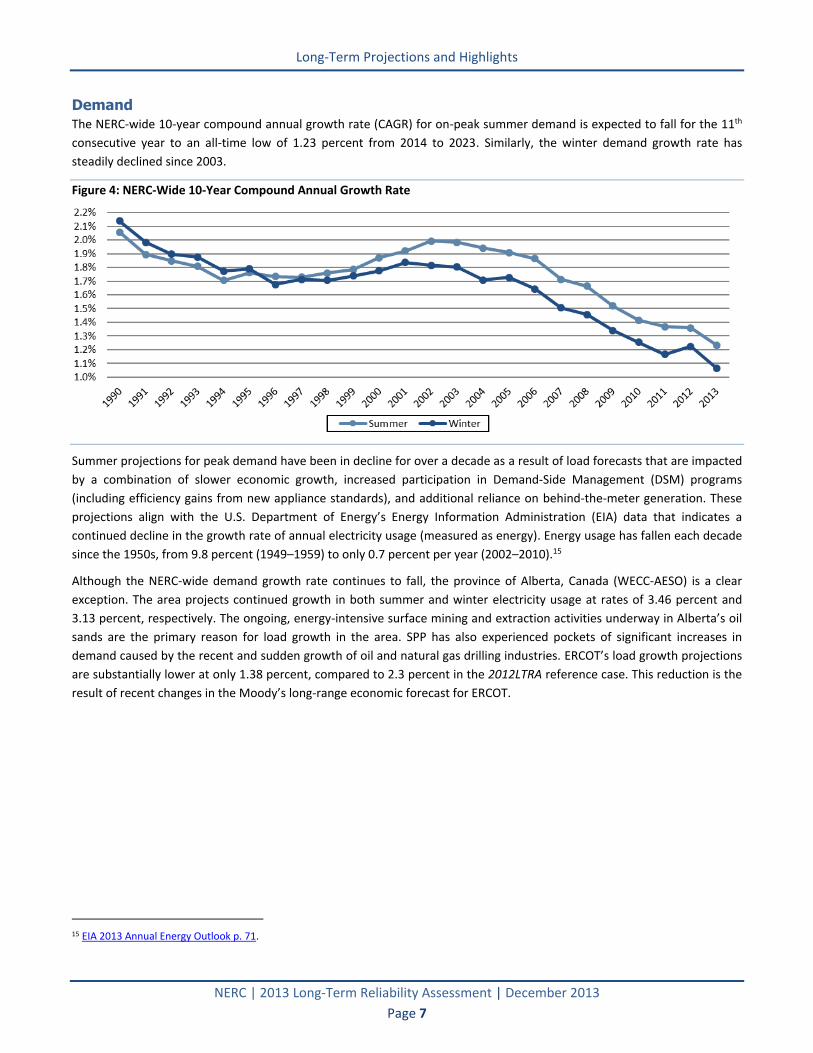
Demand
The NERC-wide 10-year compound annual growth rate (CAGR) for on-peak summer demand is expected to fall for the 11th
consecutive year to an all-time low of 1.23 percent from 2014 to 2023. Similarly, the winter demand growth rate has
steadily declined since 2003.
Figure 4: NERC-Wide 10-Year Compound Annual Growth Rate
Summer projections for peak demand have been in decline for over a decade as a result of load forecasts that are impacted
by a combination of slower economic growth, increased participation in Demand-Side Management (DSM) programs
(including efficiency gains from new appliance standards), and additional reliance on behind-the-meter generation. These
projections align with the U.S. Department of Energy’s Energy Information Administration (EIA) data that indicates a
continued decline in the growth rate of annual electricity usage (measured as energy). Energy usage has fallen each decade
since the 1950s, from 9.8 percent (1949–1959) to only 0.7 percent per year (2002–2010).15
Although the NERC-wide demand growth rate continues to fall, the province of Alberta, Canada (WECC-AESO) is a clear
exception. The area projects continued growth in both summer and winter electricity usage at rates of 3.46 percent and
3.13 percent, respectively. The ongoing, energy-intensive surface mining and extraction activities underway in Alberta’s oil
sands are the primary reason for load growth in the area. SPP has also experienced pockets of significant increases in
demand caused by the recent and sudden growth of oil and natural gas drilling industries. ERCOT’s load growth projections
are substantially lower at only 1.38 percent, compared to 2.3 percent in the 2012LTRA reference case. This reduction is the
result of recent changes in the Moody’s long-range economic forecast for ERCOT.
15 EIA 2013 Annual Energy Outlook p. 71.

Long-Term Projections and Highlights
NERC | 2013 Long-Term Reliability Assessment | December 2013
Page 8
Figure 5: 10-Year Compound Annual Growth Rate (CAGR) by NERC Assessment Area
Demand-Side Management
According to the 2013LTRA reference case, more DR during the peak will become available as industrial, commercial, and
residential participation in these programs increases in most areas. DR programs (both load modifying and supply side) will

Long-Term Projections and Highlights
NERC | 2013 Long-Term Reliability Assessment | December 2013
Page 9
increase by 3.3 GW during the next 10 years. Energy efficiency programs will also grow by 11.9 GW. During the 10-year
period, total DSM growth will account for 14.8 percent of the NERC-wide, noncoincident Total Internal Demand growth.16
Figure 6: Available Demand Response during the Peak Season Compared to Noncoincident NERC-Wide Peak Demand17
On an assessment area basis, DR programs currently account for approximately 3.8 percent of Total Internal Demand on
average. PJM has more established DR programs that account for over 8 percent of the assessment area’s Total Internal
Demand. In terms of growth, available DR programs remain steady in PJM, while TRE-ERCOT projects an increase of 646
MW during the next 10 years—an increase of almost 40 percent. The SERC-N Assessment Area also projects an increase of
1,261 MW by 2023, compared to 1,846 MW in 2014.
Generation
NERC assesses the availability of future generation based on two supply categories: Future-Planned and Conceptual.
According to the 2013LTRA reference case, a net of 23 GW of Future-Planned capacity will be added to the existing on-peak
resource mix.
16 This approach is used to more accurately reflect the amount of Demand Response available in each assessment area, since several Demand
Response programs are only available during the area’s peak season. 17 NERC-wide, noncoincident demand is used to reflect the use of Demand Response programs during the peak season for each assessment area.

Long-Term Projections and Highlights
NERC | 2013 Long-Term Reliability Assessment | December 2013
Page 10
Figure 7: NERC-Wide Annual Planned Capacity Change (2014–2023)18
Figure 8: NERC-Wide Cumulative Planned Capacity Change (2014–2023)19
Table 1: NERC-Wide Cumulative Planned Capacity Change (2014–2023)
Current 2023 Planned 2023 Planned & Conceptual
Capacity Share Capacity Share Change Capacity Share Change
Coal
318,000 30.15%
282,890 26.25% -35,110
250,534 19.18% -67,465
Petroleum
48,871 4.63%
47,646 4.42% -1,226
46,437 3.55% -2,435
Gas
411,993 39.06%
440,613 40.88% 28,620
548,648 42.00% 136,655
Nuclear
115,215 10.92%
121,945 11.31% 6,730
131,150 10.04% 15,935
Hydro
117,731 11.16%
123,294 11.44% 5,563
130,209 9.97% 12,478
Pumped Storage
21,199 2.01%
22,064 2.05% 865
22,114 1.69% 915
Renewables (Non-Hydro)
21,723 2.06%
39,319 3.65% 17,596
177,254 13.57% 177,254
TOTAL 1,054,731 100.0% 1,077,769 100.0% 23,038 1,483,600 100.0% 273,337
COAL
The amount of coal-fired generation during peak is expected to decline substantially, as 39.4 GW of retirements and
derates outpace 4.3 GW of new additions, resulting in a net reduction of 35.1 GW by 2023. Most unit retirements are
planned between 2014 and 2016, when requirements of environmental regulations become effective. These projections
18 The peak season is used for each assessment area. Annual capacity changes are impacted by new units, unit uprates, unit retirements, and unit
derates. 19 Ibid.

Long-Term Projections and Highlights
NERC | 2013 Long-Term Reliability Assessment | December 2013
Page 11
are substantially higher than the 2012LTRA reference case, which projected a net reduction of 16.3 GW between 2014 and
2023. A large portion of retirements will occur in PJM, with 9.6 GW of announced coal retirements during the assessment
period. NERC-wide coal-fired unit retirements totaled 3.5 GW in 2011 and 8.9 GW in 2012.20 An additional 4.2 GW of coal-
fired units were retired in the United States and Canada in 2013.21
NATURAL GAS
Continued lower natural gas prices in recent years creates further incentive for plant owners to convert existing units from
coal or oil to gas. Retirement considerations for existing units are mostly affected by replacement costs, which are highly
reliant on fuel costs. Therefore, the option of converting existing oil- and coal-fired units to natural gas becomes an
attractive alternative as gas prices generally remain low.
Despite 15.2 GW of planned retirements of mostly older, less-efficient units, total gas-fired generation continues to grow,
with a net increase of 28.6 GW by 2023. Several new units will become operational between 2014 and 2017, concurrent
with the anticipated retirements of several coal-fired units. A majority of these new units will be built within WECC (10.6
GW), PJM (8.5 GW), FRCC (5.5 GW), and ERCOT (4.6 GW).
PETROLEUM
Approximately 1.2 GW of petroleum-fired generation will be taken out of service during the assessment period. In many
cases, units with gas as the primary fuel type are able to switch to oil in response to gas supply shortages. NPCC-New
England and NPCC-New York have a combined total of 12.6 GW of gas-fired capacity that uses oil as a secondary fuel
source.
NUCLEAR
Electricity generation from nuclear power plants will increase by approximately 6.7 GW by 2023, primarily due to the
planned addition of five units, totaling approximately 5.6 GW.22 All additional units are planned within SERC. Unit uprates
will also contribute to increased capacity from existing plants throughout NERC.
Since 2011, five units totaling over 4.2 GW have retired or announced plans to decommission reactors.23 In NPCC-NYISO,
the Indian Point plant units 2 and 3 remain in service as their license renewal requests remain under review by the Atomic
Safety Licensing Board of the Nuclear Regulatory Commission. The 2013LTRA reference case includes the retirement of the
Vermont Yankee plant (620 MW) in NPCC-NYISO and the Oyster Creek plant (604 MW) in PJM in 2019. Despite these
retirements, nuclear generation is still expected to account for 11.3 percent of on-peak capacity in 2023, up from its current
contribution of 10.9 percent.
RENEWABLES/OTHER
Generation from renewable energy (wind, solar, biomass, and geothermal), accounts for over 50 GW of nameplate capacity
additions during the next 10 years (7.5 GW on-peak). These new resources are built in large part as a response to federal
tax credits, state-level policies (Renewable Portfolio Standards), and federal requirements. The share of NERC-wide on-peak
generation from renewable fuels (excluding hydropower) grows by 17.5 GW, from 2 percent to 3.7 percent during the next
decade. In terms of on-peak contribution, electricity from solar power accounts for the largest increase, growing by 9.1 GW.
In recent years, a majority of new solar resources has come online in the southwestern portion of WECC (WECC-DSW and
20 Actual U.S. coal-fired retirement data (2011 and 2012): EIA Today in Energy. Actual Canadian coal-fired retirement data (2011 and 2012):
Ventyx Velocity Suite. 21 Total retirements between January 1, 2013 and October 31, 2013. Data aggregated using Ventyx Velocity Suite. This data was not used in the
2013LTRA reference case; planned retirements in Schedule 2 were used for 2013 and beyond. 22 Includes the following planned units: Vogtle 3 & 4 (SERC-SE), Summer 2 &3 (SERC-E), and Watts Bar 2 (SERC-N). 23 Includes both units that have retired and units that have announced plans to decommission: Crystal River 3 (FRCC), Gentilly 2 (NPCC-Québec),
Kewaunee (MISO), Vermont Yankee (NPCC-New England), and San Onofre 2 & 3 (WECC-CALS). For additional information, see the respective assessment area sections.

Long-Term Projections and Highlights
NERC | 2013 Long-Term Reliability Assessment | December 2013
Page 12
WECC-CALS), and this trend is expected to continue. On-peak wind capacity will grow by 5.9 GW, while biomass and
pumped storage increase by 1.5 GW and 1 GW, respectively. On-peak hydro power will increase by 5.5 GW during the
assessment period, primarily due to uprates at existing facilities.
Transmission
Transmission additions during the 10-year period include plans for over 21,800 circuit miles. NERC continues to monitor the
progress of transmission projects across North America. While transmission planning is dynamic (i.e., a planned project can
later be deemed unnecessary due to reasons such as a reduction in load growth) and increasingly difficult in later years,
plans should reflect realistic expectations in order to reliably support future system needs.
Table 2: Existing Transmission with Planned and Conceptual Additions24 Existing Current 2013–2018 2019–2023
Assessment Area/ Interconnection
2012 Year-End
Under Construction Planned Conceptual Planned Conceptual
FRCC 12,037 119 309 48 77 0
MISO 43,325 18 1,948 52 1,043 16
MRO-Manitoba Hydro 7,487 0 0 236 0 1,098
MRO-MAPP 10,265 502 396 84 0 0
MRO-SaskPower 5,635 0 529 220 0 0
NPCC-Maritimes 5,103 0 42 50 0 240
NPCC-New England 8,643 255 270 278 7 0
NPCC-New York 10,981 0 0 0 0 0
NPCC-Ontario 17,931 93 0 0 0 240
NPCC-Québec 23,830 276 201 621 0 541
PJM 51,940 162 1,634 0 68 16
SERC-E 22,315 20 364 151 6 125
SERC-N 21,600 97 184 91 0 25
SERC-SE 27,672 41 560 57 118 0
SERC-W 14,295 98 178 81 15 95
SPP 33,743 507 1,228 157 315 60
TRE-ERCOT 30,047 2,564 3,346 1,088 84 528
WECC 129,398 686 7,137 3,548 1,805 2,818
EASTERN INTERCONNECTION 292,972 1,913 7,642 1,504 1,649 1,915
QUÉBEC INTERCONNECTION 23,830 276 201 621 0 541
TEXAS INTERCONNECTION 30,047 2,564 3,346 1,088 84 528
WESTERN INTERCONNECTION 129,398 686 7,137 3,548 1,805 2,818
TOTAL-NERC 476,247 5,439 18,326 6,762 3,537 5,802
In the Western Interconnection, 15 new transmission line projects, each over 200 circuit miles in length, are planned to
come into service by 2023 (an additional seven projects over 200 circuit miles are categorized as Conceptual). These larger
projects are typical in the West, due to the geographically unique transmission system—especially as large amounts of
widely dispersed renewable energy continue to be integrated. Conversely, in the Eastern Interconnection, only six Bulk
Electric System (BES) transmission projects greater than 200 miles are planned. Longer transmission lines do not necessarily
mean more capacity and enhanced reliability but may be necessary to meet Renewable Portfolio Standards (RPSs) in the
future. Current plans do not show significant additions to west-to-east power transfer capability.
NERC-wide, the most notable transmission developments include plans in WECC for a 2,500-mile Canada/Pacific
Northwest—Northern California Transmission Project (500 kV), with a split of ac and dc. In Texas, the CREZ transmission
project is nearly complete with the addition of 1,600 circuit miles coming into service in 2014 to support ERCOT’s wind
integration efforts.
24 In 2014, NERC will begin using inventory data collected in NERC’s Transmission Availability Data System (TADS).

Long-Term Projections and Highlights
NERC | 2013 Long-Term Reliability Assessment | December 2013
Page 13
Since 1991, new transmission has been built at an average rate of approximately 1,730 circuit miles every two years.
Currently, 3,800 circuit miles are classified as under construction and expected to be in-service before the end of 2013. An
additional 800 and 500 circuit miles are under construction and expected to be in-service before 2014 and 2015,
respectively. Transmission projects totaling approximately 21,800 circuit miles are categorized as planned with in-service
dates before 2023.
Figure 9: Historical Actual Miles Added during each Two-Year Period and 10-Year Projections
According to industry, new transmission projects are being driven primarily to enhance reliability. Other reasons include
congestion alleviation and integration of renewables.
Figure 10: Primary Drivers for New Transmission Projects

Reference Case Summary Tables
NERC | 2013 Long-Term Reliability Assessment | December 2013
Page 14
Projected Demand, Resources, and Reserve Margins Summary Table A: Demand, Resources, and Reserve Margins by Interconnection: 2014 Summer Demand (MW) Capacity Resources (MW) Planning Reserve Margins (%) Ref.
Interconnection Net Int. Tot. Int. Ant. Pros. Adj. Pot. Ant. Pros. Adj. Pot. Margin
EASTERN 584,960 614,953 755,936 774,296 778,765 29.23% 32.37% 33.13% -
ERCOT 67,592 69,289 76,879 76,879 77,444 13.74% 13.74% 14.58% 13.75%
QUÉBEC 20,944 20,944 32,596 31,700 31,700 55.63% 51.35% 51.35% 12.00%
WESTERN 159,100 163,691 202,076 202,076 202,907 27.01% 27.01% 27.53% 14.70%
Summary Table B: Demand, Resources, and Reserve Margins by Interconnection: 2014–15 Winter Demand (MW) Capacity Resources (MW) Planning Reserve Margins (%) Ref.
Interconnection Net Int. Tot. Int. Ant. Pros. Adj. Pot. Ant. Pros. Adj. Pot. Margin
EASTERN 563,138 577,860 842,925 860,663 865,332 49.68% 52.83% 53.66% -
ERCOT 53,742 55,439 79,323 79,323 79,932 47.60% 47.60% 48.73% 13.75%
QUÉBEC 37,179 37,179 41,786 43,433 43,433 12.39% 16.82% 16.82% 10.30%
WESTERN 134,552 136,445 194,573 194,573 195,581 44.61% 44.61% 45.36% 14.50%
Summary Table C: Demand, Resources, and Reserve Margins by Interconnection: 2018 Summer Demand (MW) Capacity Resources (MW) Planning Reserve Margins (%) Ref.
Interconnection Net Int. Tot. Int. Ant. Pros. Adj. Pot. Ant. Pros. Adj. Pot. Margin
EASTERN 616,617 647,984 743,310 767,995 792,053 21% 24.55% 28.45% -
ERCOT 73,214 75,132 80,053 80,053 81,817 9.34% 9.34% 11.75% 13.75%
QUÉBEC 21,190 21,190 35,561 35,172 35,172 67.82% 65.99% 65.99% 12.00%
WESTERN 169,786 174,909 213,604 213,604 223,697 25.81% 25.81% 31.75% 14.70%
Summary Table D: Demand, Resources, and Reserve Margins by Interconnection: 2018–2019 Winter Demand (MW) Capacity Resources (MW) Planning Reserve Margins (%) Ref.
Interconnection Net Int. Tot. Int. Ant. Pros. Adj. Pot. Ant. Pros. Adj. Pot. Margin
EASTERN 590,524 606,365 835,594 860,579 888,526 42% 45.73% 50.46% -
ERCOT 57,640 59,558 81,438 81,438 83,181 41.29% 41.29% 44.31% 13.75%
QUÉBEC 38,950 38,950 43,697 45,344 45,344 12.19% 16.42% 16.42% 10.70%
WESTERN 143,336 145,328 202,477 202,477 211,642 41.26% 41.26% 47.65% 14.50%
Summary Table E: Demand, Resources, and Reserve Margins by Interconnection: 2023 Summer Demand (MW) Capacity Resources (MW) Planning Reserve Margins (%) Ref.
Interconnection Net Int. Tot. Int. Ant. Pros. Adj. Pot. Ant. Pros. Adj. Pot. Margin
EASTERN 648,636 680,996 747,528 776,331 814,401 15% 19.69% 25.56% -
ERCOT 76,070 78,413 79,441 79,441 81,375 4.43% 4.43% 6.97% 13.75%
QUÉBEC 22,246 22,246 36,103 35,714 35,714 62.29% 60.54% 60.54% 12.00%
WESTERN 183,165 188,500 215,167 215,167 230,103 17.47% 17.47% 25.63% 14.70%
Summary Table F: Demand, Resources, and Reserve Margins by Interconnection: 2023–2024 Winter Demand (MW) Capacity Resources (MW) Planning Reserve Margins (%) Ref.
Interconnection Net Int. Tot. Int. Ant. Pros. Adj. Pot. Ant. Pros. Adj. Pot. Margin
EASTERN 617,844 635,092 842,691 871,920 913,309 36% 41.12% 47.82% -
ERCOT 59,758 62,101 81,755 81,755 83,668 36.81% 36.81% 40.01% 13.75%
QUÉBEC 40,562 40,562 44,414 46,061 46,061 9.50% 13.56% 13.56% 10.70%
WESTERN 153,038 155,225 201,614 201,614 216,223 31.74% 31.74% 41.29% 14.50%

Reference Case Summary Tables
NERC | 2013 Long-Term Reliability Assessment | December 2013
Page 15
Summary Table G: Demand, Resources, and Reserve Margins by Assessment Area: 2014 Summer
Demand (MW) Capacity Resources (MW) Planning Reserve Margins (%) Ref.
Assessment Area Net Int. Tot. Int. Ant. Pros. Adj. Pot. Ant. Pros. Adj. Pot. Margin
FRCC 43,142 46,338
55,119 61,973 61,973
27.76% 43.65% 43.65%
14.99% MISO 92,331 96,879
109,211 113,894 114,996
18.28% 23.35% 24.55%
14.20%
MRO-Manitoba Hydro 3,167 3,389
4,451 4,641 4,641
40.51% 46.52% 46.52%
12.00% MRO-MAPP 5,161 5,249
6,658 6,658 6,658
29.01% 29.01% 29.01%
15.00%
MRO-SaskPower 3,118 3,204
3,679 3,679 3,679
17.99% 17.99% 17.99%
11.00% NPCC-Maritimes 3,030 3,425
5,837 5,915 5,960
92.66% 95.23% 96.72%
20.00%
NPCC-New England 26,929 26,929
34,744 34,744 34,810
29.02% 29.02% 29.26%
13.85% NPCC-New York 33,725 33,725
41,383 42,736 42,795
22.71% 26.72% 26.89%
17.00%
NPCC-Ontario 22,937 22,937
28,645 28,645 28,826
24.89% 24.89% 25.68%
18.60% NPCC-Québec 20,944 20,944
32,596 31,700 31,700
55.63% 51.35% 51.35%
12.00%
PJM 144,497 158,717
189,088 189,088 190,797
30.86% 30.86% 32.04%
15.90% SERC-E 41,789 43,786
50,857 50,909 50,910
21.70% 21.82% 21.83%
15.00%
SERC-N 41,009 42,855
51,980 53,386 53,971
26.75% 30.18% 31.61%
15.00% SERC-SE 46,582 48,813
63,704 65,580 65,696
36.76% 40.78% 41.03%
14.99%
SERC-W 23,463 24,003
37,190 39,081 39,659
58.50% 66.56% 69.03%
14.99% SPP 54,080 54,703
73,392 73,368 73,395
35.71% 35.67% 35.72%
13.60%
TRE-ERCOT 67,592 69,289
76,879 76,879 77,444
13.74% 13.74% 14.58%
13.75% WECC-AESO 10,388 10,388
12,823 12,823 13,013
23.44% 23.44% 25.27%
12.25%
WECC-BASN 13,459 14,161
15,444 15,444 15,446
14.75% 14.75% 14.77%
13.72% WECC-BC 8,353 8,353
9,894 9,894 9,901
18.45% 18.45% 18.53%
12.91%
WECC-CALN 25,708 26,476
31,407 31,407 31,479
22.17% 22.17% 22.45%
15.02% WECC-CALS 33,706 35,748
39,850 39,850 39,932
18.23% 18.23% 18.47%
15.15%
WECC-DSW 27,638 28,222
38,154 38,154 38,540
38.05% 38.05% 39.44%
13.62% WECC-MEXW 2,393 2,393
3,027 3,027 3,027
26.47% 26.47% 26.47%
11.93%
WECC-NORW 25,680 25,680
37,204 37,204 37,209
44.88% 44.88% 44.90%
17.48% WECC-ROCK 11,775 12,270
14,272 14,272 14,359
21.21% 21.21% 21.94%
14.45%
NERC 832,596 868,877 1,067,487 1,084,951 1,090,815 28.21% 30.31% 31.01% 15.00%
Summary Table H: Demand, Resources, and Reserve Margins by Assessment Area: 2014–2015 Winter Demand (MW) Capacity Resources (MW) Planning Reserve Margins (%) Ref.
Assessment Area Net Int. Tot. Int. Ant. Pros. Adj. Pot. Ant. Pros. Adj. Pot. Margin
FRCC 44,060 47,161
60,285 66,024 66,024
36.83% 49.85% 49.85%
14.99% MISO 76,252 79,813
109,211 113,894 114,996
43.22% 49.36% 50.81%
14.20%
MRO-Manitoba Hydro 4,344 4,570
5,297 5,688 5,688
21.93% 30.92% 30.92%
12.00% MRO-MAPP 5,500 5,500
7,381 7,381 7,381
34.20% 34.20% 34.20%
15.00%
MRO-SaskPower 3,481 3,567
4,136 4,136 4,136
18.81% 18.81% 18.81%
11.00% NPCC-Maritimes 5,472 5,472
6,972 7,005 7,005
27.42% 28.02% 28.02%
20.00%
NPCC-New England 21,272 21,272
36,503 36,503 36,526
71.60% 71.60% 71.71%
13.90% NPCC-New York 24,818 24,818
43,093 44,446 44,524
73.63% 79.09% 79.40%
17.00%
NPCC-Ontario 21,800 21,800
30,674 30,674 30,808
40.71% 40.71% 41.32%
18.70% NPCC-Québec 37,179 37,179
41,786 43,433 43,433
12.39% 16.82% 16.82%
10.30%
PJM 134,742 134,742
191,384 191,384 192,670
42.04% 42.04% 42.99%
15.90% SERC-E 40,819 42,331
53,217 53,269 53,269
30.37% 30.50% 30.50%
15.00%
SERC-N 39,896 41,623
54,057 55,824 56,696
35.50% 39.92% 42.11%
15.00% SERC-SE 44,389 46,619
66,177 68,165 68,236
49.08% 53.56% 53.72%
14.99%
SERC-W 21,026 21,437
38,227 40,184 40,762
81.81% 91.12% 93.87%
14.99% SPP 41,259 41,831
74,456 74,656 74,905
80.46% 80.95% 81.55%
15.00%
TRE-ERCOT 53,742 55,439
79,323 79,323 79,932
47.60% 47.60% 48.73%
13.75% WECC-AESO 11,766 11,766
13,187 13,187 13,619
12.07% 12.07% 15.75%
11.64%
WECC-BASN 10,699 11,001
13,512 13,512 13,514
26.29% 26.29% 26.31%
13.74% WECC-BC 11,368 11,368
13,238 13,238 13,247
16.45% 16.45% 16.53%
16.07%
WECC-CALN 18,181 18,455
25,921 25,921 25,994
42.58% 42.58% 42.98%
12.11% WECC-CALS 22,637 23,327
32,818 32,818 32,861
44.97% 44.97% 45.16%
11.00%
WECC-DSW 17,589 17,931
36,683 36,683 36,973
108.56% 108.56% 110.21%
14.03% WECC-MEXW 1,512 1,512
2,603 2,603 2,603
72.13% 72.13% 72.13%
10.72%
WECC-NORW 30,902 30,906
41,388 41,388 41,393
33.94% 33.94% 33.95%
19.17% WECC-ROCK 9,899 10,180
15,223 15,223 15,376
53.78% 53.78% 55.33%
15.87%
NERC 788,611 806,923 1,158,606 1,177,992 1,184,278 46.92% 49.38% 50.17% 15.00%

Reference Case Summary Tables
NERC | 2013 Long-Term Reliability Assessment | December 2013
Page 16
Summary Table I: Demand, Resources, and Reserve Margins by Assessment Area: 2018 Summer Demand (MW) Capacity Resources (MW) Planning Reserve Margins (%) Ref.
Assessment Area Net Int. Tot. Int. Ant. Pros. Adj. Pot. Ant. Pros. Adj. Pot. Margin
FRCC 45,457 48,881
57,437 62,382 62,382
26.36% 37.23% 37.23%
14.99% MISO 95,076 99,624
100,342 109,492 115,659
5.54% 15.16% 21.65%
14.20%
MRO-Manitoba Hydro 3,203 3,425
4,801 4,792 4,792
49.88% 49.58% 49.58%
12.00% MRO-MAPP 5,692 5,788
6,839 6,867 6,867
20.15% 20.64% 20.64%
15.00%
MRO-SaskPower 3,536 3,622
4,018 4,043 4,043
13.63% 14.34% 14.34%
11.00% NPCC-Maritimes 3,042 3,435
5,912 6,143 6,188
94.37% 101.97% 103.45%
20.00%
NPCC-New England 28,213 28,213
32,548 32,548 33,305
15.36% 15.36% 18.05%
13.65% NPCC-New York 35,103 35,103
41,383 42,736 43,207
17.89% 21.74% 23.09%
17.00%
NPCC-Ontario 22,610 22,610
26,227 26,227 27,197
16.00% 16.00% 20.29%
19.30% NPCC-Québec 21,190 21,190
35,561 35,172 35,172
67.82% 65.99% 65.99%
12.00%
PJM 154,165 168,813
187,145 187,145 193,132
21.39% 21.39% 25.28%
15.60% SERC-E 44,488 46,673
51,875 51,927 52,298
16.60% 16.72% 17.56%
15.00%
SERC-N 43,122 45,585
50,536 54,297 58,621
17.19% 25.91% 35.94%
15.00% SERC-SE 49,569 51,841
63,991 65,867 68,568
29.09% 32.88% 38.33%
14.99%
SERC-W 26,336 26,895
36,442 39,749 41,869
38.37% 50.93% 58.98%
14.99% SPP 57,004 57,475
73,816 73,782 73,925
29.49% 29.43% 29.68%
13.60%
TRE-ERCOT 73,214 75,132
80,053 80,053 81,817
9.34% 9.34% 11.75%
13.75% WECC-AESO 12,615 12,615
16,113 16,113 19,575
27.73% 27.73% 55.17%
12.25%
WECC-BASN 13,514 14,570
15,464 15,464 16,067
14.43% 14.43% 18.89%
13.72% WECC-BC 8,667 8,667
10,723 10,723 10,736
23.72% 23.72% 23.87%
12.91%
WECC-CALN 27,691 28,477
33,163 33,163 33,487
19.76% 19.76% 20.93%
15.02% WECC-CALS 35,737 37,867
43,165 43,165 45,204
20.78% 20.78% 26.49%
15.15%
WECC-DSW 29,526 30,134
38,766 38,766 41,746
31.29% 31.29% 41.39%
13.62% WECC-MEXW 2,672 2,672
3,321 3,321 3,888
24.27% 24.27% 45.51%
11.93%
WECC-NORW 26,752 26,752
38,392 38,392 38,407
43.51% 43.51% 43.57%
17.48% WECC-ROCK 12,612 13,155
14,497 14,497 14,587
14.95% 14.95% 15.66%
14.45%
NERC 880,806 919,214 1,072,529 1,096,824 1,132,739 21.77% 24.52% 28.60% 15.00%
Summary Table J: Demand, Resources, and Reserve Margins by Assessment Area: 2018–2019 Winter Demand (MW) Capacity Resources (MW) Planning Reserve Margins (%) Ref.
Assessment Area Net Int. Tot. Int. Ant. Pros. Adj. Pot. Ant. Pros. Adj. Pot. Margin
FRCC 46,105 49,377
61,673 66,721 66,721
33.77% 44.71% 44.71%
14.99% MISO 78,651 82,212
100,342 109,492 115,659
27.58% 39.21% 47.05%
14.20%
MRO-Manitoba Hydro 4,433 4,659
5,535 5,926 5,926
24.85% 33.65% 33.65%
12.00% MRO-MAPP 6,046 6,046
7,351 7,351 7,351
21.58% 21.58% 21.58%
15.00%
MRO-SaskPower 3,947 4,033
4,429 4,454 4,454
12.20% 12.84% 12.84%
11.00% NPCC-Maritimes 5,393 5,393
7,056 7,242 7,242
30.84% 34.29% 34.29%
20.00%
NPCC-New England 21,295 21,295
35,554 35,554 36,192
66.96% 66.96% 69.95%
13.60% NPCC-New York 25,219 25,219
43,093 44,446 45,010
70.87% 76.24% 78.48%
17.00%
NPCC-Ontario 21,376 21,376
27,918 27,918 28,997
30.61% 30.61% 35.66%
20.00% NPCC-Québec 38,950 38,950
43,697 45,344 45,344
12.19% 16.42% 16.42%
10.70%
PJM 141,483 141,483
190,445 190,445 196,082
34.61% 34.61% 38.59%
15.60% SERC-E 43,464 45,065
55,054 55,106 55,526
26.67% 26.79% 27.75%
15.00%
SERC-N 42,531 44,966
52,537 56,280 60,660
23.53% 32.33% 42.62%
15.00% SERC-SE 46,737 49,011
65,206 67,194 69,983
39.52% 43.77% 49.74%
14.99%
SERC-W 22,055 22,478
37,588 40,964 43,108
70.43% 85.74% 95.46%
14.99% SPP 43,615 44,187
74,935 75,210 75,544
71.81% 72.44% 73.21%
15.00%
TRE-ERCOT 57,640 59,558
81,438 81,438 83,181
41.29% 41.29% 44.31%
13.75% WECC-AESO 14,035 14,035
15,755 15,755 19,273
12.25% 12.25% 37.32%
11.64%
WECC-BASN 11,260 11,565
13,709 13,709 14,420
21.75% 21.75% 28.07%
13.74% WECC-BC 11,796 11,796
14,928 14,928 14,962
26.55% 26.55% 26.84%
16.07%
WECC-CALN 19,059 19,344
26,824 26,824 27,146
40.74% 40.74% 42.43%
12.11% WECC-CALS 23,933 24,714
34,187 34,187 36,188
42.85% 42.85% 51.21%
11.00%
WECC-DSW 19,072 19,404
37,097 37,097 38,937
94.51% 94.51% 104.16%
14.03% WECC-MEXW 1,610 1,610
2,443 2,443 3,010
51.71% 51.71% 86.95%
10.72%
WECC-NORW 31,922 31,926
42,628 42,628 42,646
33.54% 33.54% 33.59%
19.17% WECC-ROCK 10,649 10,934
14,906 14,906 15,060
39.98% 39.98% 41.42%
15.87%
NERC 830,450 850,201 1,163,207 1,189,838 1,228,692 40.07% 43.28% 47.95% 15.00%

Reference Case Summary Tables
NERC | 2013 Long-Term Reliability Assessment | December 2013
Page 17
Summary Table K: Demand, Resources, and Reserve Margins by Assessment Area: 2023 Summer Demand (MW) Capacity Resources (MW) Planning Reserve Margins (%) Ref.
Assessment Area Net Int. Tot. Int. Ant. Pros. Adj. Pot. Ant. Pros. Adj. Pot. Margin
FRCC 48,359 51,968
60,100 66,390 66,390
24.28% 37.29% 37.29%
14.99% MISO 98,508 103,056
101,896 111,683 118,488
3.44% 13.37% 20.28%
14.20%
MRO-Manitoba Hydro 3,490 3,712
4,704 4,220 4,850
34.80% 20.92% 38.97%
12.00% MRO-MAPP 6,148 6,254
6,946 6,989 6,989
12.98% 13.68% 13.68%
15.00%
MRO-SaskPower 3,783 3,869
4,290 4,290 4,290
13.40% 13.40% 13.40%
11.00% NPCC-Maritimes 3,038 3,320
5,912 6,143 6,188
94.58% 102.18% 103.66%
20.00%
NPCC-New England 29,038 29,038
32,542 32,542 33,299
12.07% 12.07% 14.67%
13.65% NPCC-New York 36,613 36,613
41,383 42,736 43,207
13.03% 16.72% 18.01%
17.00%
NPCC-Ontario 23,662 23,662
23,764 23,764 28,471
0.43% 0.43% 20.32%
20.00% NPCC-Québec 22,246 22,246
36,103 35,714 35,714
62.29% 60.54% 60.54%
12.00%
PJM 162,791 177,439
188,722 188,722 194,916
15.93% 15.93% 19.73%
15.60% SERC-E 48,027 50,311
51,890 51,942 54,514
8.04% 8.15% 13.51%
15.00%
SERC-N 45,496 48,603
51,177 55,869 63,749
12.49% 22.80% 40.12%
15.00% SERC-SE 53,466 55,768
64,044 65,920 68,949
19.78% 23.29% 28.96%
14.99%
SERC-W 27,587 28,164
34,740 39,749 44,511
25.93% 44.09% 61.35%
14.99% SPP 58,629 59,219
75,419 75,373 75,590
28.64% 28.56% 28.93%
13.60%
TRE-ERCOT 76,070 78,413
79,441 79,441 81,375
4.43% 4.43% 6.97%
13.75% WECC-AESO 14,110 14,110
16,228 16,228 20,280
15.01% 15.01% 43.73%
12.25%
WECC-BASN 14,320 15,376
15,551 15,551 16,762
8.60% 8.60% 17.05%
13.72% WECC-BC 8,958 8,958
11,053 11,053 11,658
23.38% 23.38% 30.14%
12.91%
WECC-CALN 29,414 30,194
34,216 34,216 34,540
16.32% 16.32% 17.43%
15.02% WECC-CALS 38,282 40,664
44,178 44,178 47,285
15.40% 15.40% 23.52%
15.15%
WECC-DSW 33,100 33,686
37,600 37,600 41,535
13.60% 13.60% 25.48%
13.62% WECC-MEXW 3,066 3,066
3,429 3,429 4,538
11.82% 11.82% 48.02%
11.93%
WECC-NORW 28,232 28,232
37,241 37,241 37,718
31.91% 31.91% 33.60%
17.48% WECC-ROCK 13,683 14,214
15,671 15,671 15,788
14.53% 14.53% 15.39%
14.45%
NERC 930,118 970,156 1,078,240 1,106,654 1,161,593 15.93% 18.98% 24.89% 15.00%
Summary Table L: Demand, Resources, and Reserve Margins by Assessment Area: 2023–2024 Winter Demand (MW) Capacity Resources (MW) Planning Reserve Margins (%) Ref.
Assessment Area Net Int. Tot. Int. Ant. Pros. Adj. Pot. Ant. Pros. Adj. Pot. Margin
FRCC 48,695 52,101
65,192 71,201 71,201
33.88% 46.22% 46.22%
14.99% MISO 81,885 85,446
101,896 111,683 118,488
24.44% 36.39% 44.70%
14.20%
MRO-Manitoba Hydro 4,838 5,064
5,438 5,354 5,984
12.41% 10.66% 23.68%
12.00% MRO-MAPP 6,521 6,521
7,346 7,346 7,346
12.66% 12.66% 12.66%
15.00%
MRO-SaskPower 4,221 4,307
4,774 4,774 4,774
13.09% 13.09% 13.09%
11.00% NPCC-Maritimes 5,254 5,254
6,990 7,176 7,176
33.04% 36.58% 36.58%
20.00%
NPCC-New England 21,017 21,017
35,548 35,548 36,186
69.14% 69.14% 72.17%
13.60% NPCC-New York 25,808 25,808
43,093 44,446 45,010
66.97% 72.22% 74.40%
17.00%
NPCC-Ontario 21,995 21,995
25,499 25,499 30,507
15.93% 15.93% 38.70%
20.00% NPCC-Québec 40,562 40,562
44,414 46,061 46,061
9.50% 13.56% 13.56%
10.70%
PJM 147,730 147,730
190,445 190,445 196,289
28.91% 28.91% 32.87%
15.60% SERC-E 47,055 48,704
54,403 54,455 57,285
15.62% 15.73% 21.74%
15.00%
SERC-N 42,161 45,543
53,544 58,246 66,385
27.00% 38.15% 57.46%
15.00% SERC-SE 50,370 52,676
66,514 68,502 71,619
32.05% 36.00% 42.19%
14.99%
SERC-W 23,193 23,628
35,722 40,796 45,578
54.02% 75.90% 96.52%
14.99% SPP 44,549 45,121
77,040 77,303 78,359
72.93% 73.52% 75.89%
15.00%
TRE-ERCOT 59,758 62,101
81,755 81,755 83,668
36.81% 36.81% 40.01%
13.75% WECC-AESO 15,534 15,534
17,079 17,079 21,187
9.95% 9.95% 36.39%
11.64%
WECC-BASN 11,897 12,202
13,555 13,555 14,894
13.94% 13.94% 25.19%
13.74% WECC-BC 12,192 12,192
14,166 14,166 14,985
16.19% 16.19% 22.91%
16.07%
WECC-CALN 20,216 20,484
27,043 27,043 27,365
33.77% 33.77% 35.36%
12.11% WECC-CALS 25,568 26,600
34,532 34,532 37,600
35.06% 35.06% 47.06%
11.00%
WECC-DSW 21,179 21,511
36,818 36,818 39,706
73.84% 73.84% 87.48%
14.03% WECC-MEXW 1,740 1,740
2,438 2,438 3,547
40.09% 40.09% 103.87%
10.72%
WECC-NORW 33,237 33,241
41,303 41,303 42,054
24.27% 24.27% 26.53%
19.17% WECC-ROCK 11,475 11,721
14,680 14,680 14,885
27.93% 27.93% 29.71%
15.87%
NERC 871,202 892,981 1,170,475 1,201,351 1,259,261 34.35% 37.90% 44.54% 15.00%

Long-Term Reliability Challenges and Emerging Issues
NERC | 2013 Long-Term Reliability Assessment | December 2013
Page 18
Long-Term Reliability Challenges and Emerging Issues Background
The electricity industry has prepared plans for the 2014–2023 assessment period in an effort to provide reliable electric service
across North America. In some assessment areas, NERC has identified certain evolving issues that may potentially affect the
reliability of the BPS. Over the next 10 years, the electric industry will face a number of significant emerging reliability issues, which
are explained in detail throughout this report. These issues will change the industry, requiring better modeling and risk management
and increasing the reliance on natural gas, renewable resources, and a more robust infrastructure. Each of these elements of change
is critically interdependent, and industry action must be closely coordinated to ensure reliability.
Impacts to long-term BPS reliability are categorized and assessed within three overarching risk areas:
1. RESOURCE AND TRANSMISSION ADEQUACY
Resource and transmission adequacy risks can impact the projected ability of BPS infrastructure to serve customer demand
during all hours over a specified horizon. Uncertainty in resource and transmission needs is driven by market and environmental
regulations, customer demand, and impediments to constructing facilities within a needed time frame.
2. INTEGRATION OF NEW TECHNOLOGIES AND OPERATIONS
The integration of new technologies can introduce potential future operational risks to the BPS. Resources or new technologies
with unique operating characteristics require a level of enhanced understanding beyond traditional capacity and energy
planning. Integrating these technologies without fully understanding their impacts can threaten real-time operations as well as
the system’s ability to withstand disturbances.
3. LONG-TERM SYSTEM PLANNING AND MODELING
The approach and methods used for long-term planning and modeling, including potential inadequate assumptions, models,
data, and methods, can lead to incorrect decision making and introduce risks to the BPS. Therefore, model and analysis inputs
need to be accurate and enhanced to reflect a rapidly evolving range of future transmission and resource challenges.
The electric industry is becoming more complex due to political and societal drivers propelling new policies, such as a carbon-
reduced resource portfolio. This assessment presents the contributing factors identified in the 2013LTRA reference case and
highlights potential reliability challenges and emerging issues. Each issue is ultimately related to the three overarching risk areas
identified above.
The Reliability Assessment Subcommittee (RAS) of the NERC Planning Committee (PC) provides input on reliability issues that are
particularly important to the industry, including those that may not be apparent in the 2013LTRA reference case. The intent is not to
identify, evaluate, and address every issue that could potentially impact the future reliability of the BPS. Instead, NERC, with industry
support, attempts to identify a limited set of issues that are of particular concern to reliability, with related impacts expected to
develop or grow during the 10-year assessment period. Once all issues have been identified, NERC depends on input from industry
to gauge the potential impacts each issue will have on resource and transmission adequacy, operations, and long-term planning and
modeling.
For the development of this section of the 2013LTRA, the NERC Reliability Assessment staff developed a survey that was distributed
to members of the NERC PC, OC, MRC, and the RAS. Members of these committees include a wide range of electricity industry
subject matter experts who offer both operational and planning perspectives. Accordingly, NERC’s stakeholder and subject matter
expert committees evaluated six issues that NERC identified would be most impactful over the next 10 years and developed a
comprehensive risk assessment. Each issue is examined in more detail in this section.
The evolving operation of the BPS will require new operational tools and procedures that, in order to be implemented without
adverse impacts to system reliability, will require careful consideration, preparation, and planning. Issues and challenges related to
resource and transmission adequacy, integration of new technologies, and long-term system planning and modeling are highlighted
in this assessment. While some of these challenges are more regional than others, their cumulative impacts can affect planning and
operating fundamentals that can extend to the entire interconnection.

Long-Term Reliability Challenges and Emerging Issues
NERC | 2013 Long-Term Reliability Assessment | December 2013
Page 19
Resource Adequacy Concerns in MISO and TRE-ERCOT
TRE-ERCOT OVERVIEW
Since 2011, NERC has highlighted resource adequacy challenges in ERCOT25. The Anticipated Reserve Margin drops slightly
below the 13.75 percent NERC Reference Margin Level for ERCOT for the 2014 summer season and continues to decline
during the next decade. This deficit exists despite a substantial reduction in ERCOT’s projected CAGR of demand growth
(1.38 percent, compared to 2.35 percent in the 2012LTRA reference case.26 The reduced demand projection results from
the use of a lower long-range economic forecast. Higher load caused by sustained extreme weather conditions, multiple
forced generator outages, or a combination of both, increase the likelihood of rotating outages. With reserves below target
levels, these otherwise manageable operating conditions are magnified due to reduced operational flexibility.
Figure 11: TRE-ERCOT Planning Reserve Margins
TRE-ERCOT-Summer 2014 2015 2016 2017 2018 2019 2020 2021 2022 2023
ANTICIPATED 13.74% 11.59% 10.34% 10.46% 9.34% 7.36% 6.44% 5.91% 5.11% 4.43% PROSPECTIVE 13.74% 11.59% 10.34% 10.46% 9.34% 7.36% 6.44% 5.91% 5.11% 4.43% ADJUSTED POTENTIAL 14.58% 12.71% 12.53% 12.71% 11.75% 9.98% 9.04% 8.49% 7.67% 6.97%
NERC REFERENCE - 13.75% 13.75% 13.75% 13.75% 13.75% 13.75% 13.75% 13.75% 13.75% 13.75%
ERCOT has responded via efforts to increase participation in DR and Energy Efficiency programs. Total DSM has grown to
2,215 MW for the 2014 summer peak, an increase of approximately 700 MW compared to last year’s projections.
Additionally, new resources have come online, including Sandy Creek, a 900-MW coal plant that became operational in the
spring of 2013. Several new gas-fired units are also planned, including a 392-MW unit expected to come on-line before the
end of 2013, and approximately 650 MW of capacity categorized as Conceptual with in-service dates in 2014. Capacity
additions and the implementation of new DSM programs will help address reliability needs. As a result, the potential for
emergency operating conditions, including the curtailment of firm load, will be substantially reduced. In addition, the Public
Utility Commission of Texas (PUCT) is taking steps to provide economic incentives to address resource adequacy (as
described in the TRE-ERCOT section of this assessment). NERC will continue to monitor these developments in future
seasonal and long-term assessments.
MISO OVERVIEW
The Anticipated Reserve Margin for the Mid-Continent Independent System Operator (MISO) will fall to 12.13 percent
during the 2015 summer season, which is below the NERC Reference Margin Level of 14.2 percent. This resource adequacy
outlook could be further impacted by changing regulatory and economic drivers unique to MISO. Long-term Planning
Reserve Margins have been higher in recent years, as observed in the 2010–2012 long-term assessments. The 2013LTRA
reference case Planning Reserve Margins have been reduced, partially due to the announced retirement of approximately
25 ERCOT is the Independent System Operator for the ERCOT Interconnection and schedules power on an electric grid that connects 40,500 miles
of transmission lines and more than 550 generation units. Texas Reliability Entity (TRE) is the Regional Entity responsible for assessing the reliability of the BPS within ERCOT.
26 Comparison of the compound annual growth rate. For additional information, see the 2012 Long-Term Reliability Assessment.

Long-Term Reliability Challenges and Emerging Issues
NERC | 2013 Long-Term Reliability Assessment | December 2013
Page 20
11 GWs of Base Load coal units. MISO is working with the industry to conduct a Forward Resource Assessment27 to capture
critical risks in the planning horizon and depict a more comprehensive projection of long-term resource adequacy.
Figure 12: MISO Planning Reserve Margins
MISO-Summer 2014 2015 2016 2017 2018 2019 2020 2021 2022 2023
ANTICIPATED 18.28% 12.13% 7.00% 6.29% 5.54% 4.86% 5.65% 4.90% 4.16% 3.44% PROSPECTIVE 23.35% 18.44% 15.82% 15.65% 15.16% 15.08% 15.79% 14.98% 14.17% 13.37% ADJUSTED POTENTIAL 24.55% 20.94% 21.12% 21.82% 21.65% 22.18% 22.85% 21.98% 21.13% 20.28%
NERC REFERENCE - 14.20% 14.20% 14.20% 14.20% 14.20% 14.20% 14.20% 14.20% 14.20% 14.20%
This uncertainty heightens the potential for reserve requirement deficiencies. Avoiding these negative outcomes requires
increased collaboration between MISO and its members, the Organization of MISO States (OMS), and other key players in
the industry to fulfill reliability requirements and develop a system that enhances the economic benefits of a regional
transmission system.
During the long-term assessment period, MISO will face significant uncertainties that will present new reliability challenges.
These challenges will require increased collaboration, because resource adequacy plans will be dramatically impacted in
response to existing and potential emission regulations. The impact of current and proposed regulations combined with
concerns over reliable gas supply makes a 3-to-7-GW capacity shortfall possible as early as the 2015 summer.
The uncertainty increases with the potential for carbon emission limitations, which President Obama recently identified as a
priority. While some details of this proposal are uncertain, it is evident that continued policies aimed at limiting carbon
emissions will impact the coal generation fleet in MISO, increasing the potential for resource deficiencies and
corresponding reliability impacts.
While these uncertainties raise regional concerns, MISO operating procedures note the following solutions to address
potential shortages: calling on emergency generation resources, reducing load through the use of DR programs, and relying
on operating reserves. As a last resort, operators would shed firm load on a pro-rata basis.
New challenges, however, require new approaches to fulfill reliability requirements. The MISO Forward Resource
Assessment details ongoing initiatives to fulfill reliability, which include, but are not limited to, the following topics:
Bridging the gap of limited visibility that exists between the annual Module E process and the Forward Resource
Assessment.
Increasing the visibility of future resource retrofits and retirements due to environment regulations and pursuing
the development of processes to assure the most reliable coordination of retrofit outages.
Enhancing the existing loss-of-load expectation (LOLE) study to incorporate fuel limitations in the development of
planning requirements.
Enhancing existing load forecasts by accurately predicting load forecast uncertainty (LFU), measuring economic
and weather components of LFU, and including these enhancements in MISO’s planning initiatives.
27 2013 MISO Forward Resource Assessment - Incorporating Risks (Presentation).

Long-Term Reliability Challenges and Emerging Issues
NERC | 2013 Long-Term Reliability Assessment | December 2013
Page 21
RECOMMENDATIONS
Recommendation(s)
1-1 Heightened awareness required: NERC should increase its coordination with the Texas Reliability Entity (TRE), Electric
Reliability Council of Texas (ERCOT), and state regulators and legislators to support active and planned measures to
address the continuing challenges in meeting reserve margin targets. NERC should work with the relevant oversight
entities to identify effective measures that would reverse the trend of declining reserve margins.
1-2 Initiate focused assessment: With respect to similar declining reserve margin trends within MISO, NERC should
develop a more granular and near-term assessment of the resource adequacy conditions in the MISO assessment
area. Furthermore, NERC should closely monitor and continuously evaluate the measures being taken in MISO to
address the evolving resource adequacy challenges.

Long-Term Reliability Challenges and Emerging Issues
NERC | 2013 Long-Term Reliability Assessment | December 2013
Page 22
Continued Integration of Variable Generation
OVERVIEW Reliably integrating high levels of variable resources (wind, solar, and some forms of hydro) into the North American BPS
will require significant changes to traditional methods used for system planning and operation. The amount of variable
renewable generation is expected to grow considerably as policy and regulations on greenhouse gas emissions are being
developed and implemented by federal authorities and individual states and provinces throughout North America. Power
system planners must consider the impacts of variable generation in power system planning and design and develop the
necessary practices and methods to maintain long-term BPS reliability. Operators will require new tools and practices,
including potential enhancements to NERC Reliability Standards or guidelines to maintain BPS reliability.
During the past four years, the NERC Integration of Variable Generation Task Force (IVGTF) developed a number of
recommendations that support the reliability considerations for accommodating large amounts of variable generation.
These recommendations spurred significant action across the electric industry, including the identification of potential gaps
and enhancements to NERC Reliability Standards. NERC IVGTF recommendations have provided industry with guidance on
developing new operating procedures and planning considerations, including specifics on unique regional challenges,
differing market structures, and regulatory policies.
A recent NERC report focuses on the approach the California Independent System Operator (CAISO) is taking to address
those recommendations and ensure reliability given the large penetration of VERs.28 The solutions being implemented by
CAISO build on existing IVGTF recommendations. In many ways, CAISO’s ongoing efforts to effectively plan and operate a
transformed electric grid with large penetration of variable resources can serve as a model for other areas to examine and
build upon. Accordingly, the report also addresses challenges and enhancements needed in other areas in North America.
Accommodating higher levels of variable resources requires cooperation and coordination within each interconnection—
especially between BPS and non-BPS entities. Frequency stability, frequency response, energy imbalance, and increased
and dynamic transfers must be addressed at all levels. Specifically, increasing amounts of solar photovoltaic (PV) generation
leads to decreased system inertia and frequency response capabilities that could potentially result in reliability impacts on
the BPS.29
Regional differences will exist; however, this is largely an interconnection-wide issue. More than 28 continental states and
the District of Columbia have RPSs,30 and Canada has similar provincial policies. These policies mandate or encourage
electricity producers to supply a certain minimum share of their electricity from designated renewable resources (wind,
solar, biomass, geothermal, and some hydroelectric).31 Additionally, greenhouse gas emission regulations (notably CO2) and
continually declining costs of renewable resources further incentivize renewable resource investment throughout North
America. The continued growth of renewable generation offers benefits such as newer generation resources, fuel
diversification, and greenhouse gas reductions. However, to maintain BPS reliability, challenges presented by renewable
mandates need to be properly addressed.
28 2013 Special Reliability Assessment: Maintaining Bulk Power System Reliability While Integrating Variable Energy Resources – CAISO Approach. 29 NERC IVGTF Reports. 30 Also referred to as renewable electricity standards (RES). 31 Database of State Incentives for Renewables & Efficiency.
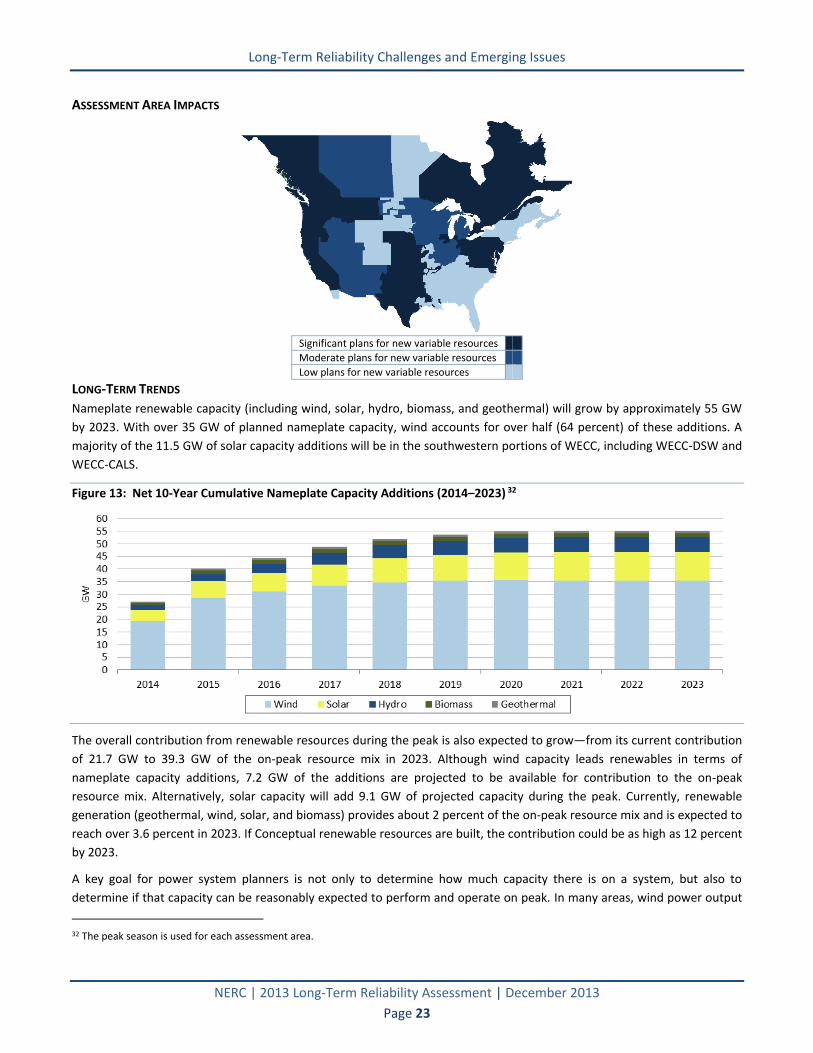
Long-Term Reliability Challenges and Emerging Issues
NERC | 2013 Long-Term Reliability Assessment | December 2013
Page 23
ASSESSMENT AREA IMPACTS
Significant plans for new variable resources
Moderate plans for new variable resources
Low plans for new variable resources
LONG-TERM TRENDS
Nameplate renewable capacity (including wind, solar, hydro, biomass, and geothermal) will grow by approximately 55 GW
by 2023. With over 35 GW of planned nameplate capacity, wind accounts for over half (64 percent) of these additions. A
majority of the 11.5 GW of solar capacity additions will be in the southwestern portions of WECC, including WECC-DSW and
WECC-CALS.
Figure 13: Net 10‐Year Cumulative Nameplate Capacity Additions (2014–2023) 32
The overall contribution from renewable resources during the peak is also expected to grow—from its current contribution
of 21.7 GW to 39.3 GW of the on-peak resource mix in 2023. Although wind capacity leads renewables in terms of
nameplate capacity additions, 7.2 GW of the additions are projected to be available for contribution to the on-peak
resource mix. Alternatively, solar capacity will add 9.1 GW of projected capacity during the peak. Currently, renewable
generation (geothermal, wind, solar, and biomass) provides about 2 percent of the on-peak resource mix and is expected to
reach over 3.6 percent in 2023. If Conceptual renewable resources are built, the contribution could be as high as 12 percent
by 2023.
A key goal for power system planners is not only to determine how much capacity there is on a system, but also to
determine if that capacity can be reasonably expected to perform and operate on peak. In many areas, wind power output
32 The peak season is used for each assessment area.

Long-Term Reliability Challenges and Emerging Issues
NERC | 2013 Long-Term Reliability Assessment | December 2013
Page 24
is inversely correlated with demand, with capacity output during times of peak demand generally amounting to a fraction of
nameplate capacity. Significant on-peak wind capacity is projected in both the United States and Canada, totaling an
increase of over 11.6 GW in WECC alone.
Currently, only MISO and ERCOT have a probabilistic basis for determining this factor. ERCOT is regularly reevaluating the
Effective Load Carrying Capability (ELCC) for the area and making modifications as necessary. The most recent modification
includes potentially calculating two values: one value for aggregated inland wind resources, and a separate value for those
classified as coastal wind resources.33 Coastal and off-shore wind patterns are generally more persistent and do not exhibit
the same variability observed inland and near mountainous topology, where siting is more difficult for developers. NERC-
wide, the on-peak capacity contributions from these wind plants in 2014 averages 17 percent of installed wind capacity.34
From an assessment area perspective, the CALS and DSW subregions in WECC are expecting the most future renewable on-
peak capacity, with over 6.6 GW of new solar capacity. Approximately 11.1 GW of nameplate solar capacity are projected to
come into service, primarily in WECC-CALS and WECC-DSW. Regional planners in these areas continue to assess the growing
impacts of this variable resource into the generation mix.
RESOURCE AND TRANSMISSION ADEQUACY IMPACTS
The addition of significant amounts of variable generation to the BPS changes the way that transmission and resource
planners develop their future systems to maintain reliability. Planners must consider the additional uncertainty in available
peak capacity. Compared to today’s power system, in scenarios of high variable generation penetration, a larger portion of
the total supply resource portfolio will be comprised of energy-limited resources. This fact somewhat complicates—but
does not fundamentally change—existing resource adequacy planning processes, which must remain driven by a reliability-
based set of metrics.
As noted in other NERC assessments, the industry should develop consistent methods to determine on‐peak wind capacity
to ensure uniform measurement and resource adequacy assumptions.35 As wind generation becomes a more significant
contributor to an area’s capacity mix, probabilistic planning techniques will be needed. Probabilistic planning techniques
indicate that in most areas, wind’s contribution to capacity is generally in the range of 5 to 10 percent of the wind energy
nameplate capacity.36
Wind generation technology has evolved rapidly during the last decade; however, advances in physical equipment have
outpaced industry’s ability to develop accurate models to use in technical planning and operating studies. In some
instances, the as-built equipment performance has differed significantly from the models provided during the system
impact and preliminary operating studies.
Wind generation is often located substantial distances from the point of interconnection to the transmission system, which
creates additional reliability implications. In many cases, the location of these variable resources only meets the minimum
voltage support requirements.
Because of these technical and policy challenges, the operation of wind generators has at times been curtailed, especially
during maintenance conditions on the transmission system. Without significant transmission expansion and improvements
at the wind plants, these curtailments are expected to continue. In addition to customer interconnection studies of elective
transmission upgrades that address marginal interconnections and transmission constraints above what currently is
33 ERCOT Loss-of-Load Study 34 This percentage is based on a comparison between the 2014 on-peak wind projections to the nameplate projections for the peak season of
each NERC assessment area. 35 Currently, Regions and subregions (in particular, difference operating entities) use different methods to determine expected on‐peak values of
wind capacity. The IVGTF is addressing this issue in the following report Methods to Model and Calculate Capacity Contributions of Variable Generation for Resource Adequacy Planning.
36Capacity Value of Wind Power

Long-Term Reliability Challenges and Emerging Issues
NERC | 2013 Long-Term Reliability Assessment | December 2013
Page 25
required, the increasing amount of system operating complexity may necessitate other interconnection studies that include
a wider range of system conditions.
Transmission planning processes to integrate large amounts of variable generation rely on a number of factors, including:
Whether government renewable policies or mandates exist,
The level of variable generation mandated and available in remote locations,
The time horizon across which capital investments in variable generation are to be made, and
The geographic footprint across which the investments occur.
In order to ensure reliability, transmission is needed to:
Interconnect VERs planned in remote areas
Accommodate the variable generation output with uniformity across a broad geographical region and resource
portfolio
Deliver ramping capability and ancillary services from inside and outside a Balancing Authority (BA) area to
equalize supply and demand
Transmission system expansion is vital for unlocking the capacity available from variable generation, and it can be used as a
tool to reduce overall variability across a broader area. Shared ramping capability and ancillary services between adjacent
areas also provides additional reliability benefits, depending on how existing and planned interarea transmission assets are
used. In regions with a competitive generation marketplace, regulatory targets such as RPSs heavily influence the location
and timing of renewable generation investments and their development. Furthermore, government policy and any
associated cost allocations (i.e., who pays for transmission, additional ancillary services, and ramping capability) will be key
drivers for variable generation capacity expansion. Therefore, an iterative approach between transmission and generating
resource planning is required to cost-effectively and reliably integrate all resources.
OPERATIONAL IMPACTS
The expected significant increase in variable generation additions to the BPS will increase the amount of uncertainty that a
system operator must factor into operating decisions. The system operator must have access to more accurate variable
generation forecasting techniques and sufficient flexible resources to mitigate the added variability and uncertainty.
Operating criteria, forecasting, commitment, scheduling, dispatch and balancing practices, procedures, and tools must be
enhanced to assist operators in maintaining BPS reliability. Improved operating practices, procedures, and tools are critical
for integrating variable generation into the power system, as well as improving its control performance and reliability
characteristics. System resources supporting reliability, such as flexible generation and responsive load, are finite.
Compared to conventional generation, variable generation is less effective at providing the system sufficient inertia to
arrest frequency decline. Similarly, variable generation may not create adequate governor response to stabilize system
frequency following the loss of a large generator. Frequency excursions caused by overgeneration are possible during
periods of high VER production and low system demand. If dispatchable resources are already operating at minimum load
levels and regulation down capacity has been exhausted, higher-than-scheduled or higher-than-expected VER production
levels can result in overgeneration and, ultimately, overfrequency conditions.
Distributed energy resources (DERs) in aggregate can have a significant impact on BPS operations and represent a potential
reliability gap. Existing interconnection requirements for DERs do not specifically take into account potential effects on bulk
system reliability. Of particular concern is the lack of disturbance tolerance, which entails voltage ride-through (VRT) and
frequency ride-through (FRT) capability. Under high penetration scenarios, it is possible for a large amount of generation to
trip on voltage or frequency due to a system disturbance, which could potentially affect bulk system stability. The need for
high-frequency tolerance is also being discussed as part of a FERC stakeholder consultation on interconnection procedures

Long-Term Reliability Challenges and Emerging Issues
NERC | 2013 Long-Term Reliability Assessment | December 2013
Page 26
for small generators.37 Distribution-connected variable resources, like all other DERs, are required to comply with IEEE
Standard 1547, which at present does not contain any VRT or FRT stipulations. Instead, IEEE Standard 1547 requires DERs to
disconnect from the grid within a short period of time after voltage or frequency falls outside a certain range. With a
significant amount of DERs online, the inability to remain interconnected, stable, and functional during and after a system
disturbance presents a significant risk to the BPS.
LONG-TERM PLANNING AND MODELING
The purpose of power system planning is to ensure that a reliable and robust power system is available to the power
system operator within the planning horizon. To improve system reliability, the industry has already begun development of
new planning methods and techniques that include the characteristics of variable generation assets. These tools need to be
expedited to ensure the reliable operation of the BPS. New models need to take into account new technologies (e.g.,
storage), variable demand (e.g., DR), and incorporation of flexible resources. For example, storage technologies, if
economical and properly planned and implemented, can provide the flexibility to accommodate large amounts of variable
resources as an alternative to the construction of more conventional flexible generation resources or transmission.
At low variable generation penetration levels, traditional approaches toward sequential expansion of the transmission
network and managing wind variability in Balancing Authorities may be satisfactory. However, at higher penetration levels,
a regional and multiobjective perspective for transmission planning, including the identification of concentrated variable
generation zones, may be needed.
System planning studies should continue to thoroughly examine voltage stability, frequency response, diminishing reactive
power, and inertia impacts. Additional transmission will also be needed to interconnect VERs planned in remote regions,
level the variable generation output across a broad geographical region and resource portfolio, and deliver ramping
capability and ancillary services from inside and outside a Balancing Area to equalize supply and demand.
These capabilities also include having access to “standard models,” which are defined as nonproprietary and publicly
available models for the simulation of steady‐state (power flow), short-circuit (fault calculations), and dynamic
(time‐domain simulations) behavior of such variable generation. These models must be made readily available for use by
power system planners.
37 See FERC Docket No. RM13-2-000.

Long-Term Reliability Challenges and Emerging Issues
NERC | 2013 Long-Term Reliability Assessment | December 2013
Page 27
INDUSTRY PERSPECTIVE
The following charts present a selection of responses to a survey developed by NERC staff that posed several questions to
gauge the industry perspective on the impacts of the continued integration of variable generation.38 Members of NERC’s PC,
OC, RAS, and MRC provided the following responses:
The likelihood that continued integration of variable generation will result in Planning Reserve Margins falling below the
NERC Reference Margin Level (Target):
11%
28%
43%
19%
Manageable. No further action isneeded from NERC.
Manageable, assuming thecontinuation of existing initiatives to
address the issue
Manageable, but will cause challengesand additional action to be taken to
address the issue (e.g., specialassessment, technical committee
review)
Potentially unmanageable withoutsignificant action, including shifts from
existing policy and possibleenhancements to NERC standards and
or guidelines
Addressing the reliability challenges associated with the integration of variable generation during the next 10 years will
be:
20%
49%
27%
4%
Manageable. No further NERCaction is needed
Manageable, assuming thecontinuation of existing initiatives
to address the issue
Manageable, but will causechallenges and additional actionshould be taken to address theissue (i.e., special assessment)
Potentially Unmanageable withoutsignificant action, including
possible enhancements to NERCstandards and/or guidelines and
shifts from existing policy
38 For additional information on the survey, please contact NERC staff ([email protected]).

Long-Term Reliability Challenges and Emerging Issues
NERC | 2013 Long-Term Reliability Assessment | December 2013
Page 28
RISK PROFILE
RECOMMENDATIONS
Recommendation(s)
2-1 Expand NERC methodology for reliability assessment: NERC should develop a new approach and framework for the
long-term assessment of essential reliability services to supplement existing resource adequacy assessments. The new
approach may include the development of metrics for further evaluation in future long-term reliability assessments.
2-2 Develop primer on essential reliability services: NERC should develop a technical reference document on essential
reliability services, which include frequency response, inertia, voltage stability, ramping capability, and other
operational requirements needed to ensure BPS reliability. The primer can be used as a reference manual for
regulators and policy makers and to inform, educate, and build awareness on the reliability ramifications of a changing
resource mix.
2-3 Initiate focused assessment: Similar to its collaborative work with the California Independent System Operator, NERC
should conduct a comprehensive assessment of essential reliability services for areas and systems approaching 20 or
more percent variable resources over the next 10 years. Additionally, the focused assessments should identify the
measures and initiatives needed to ensure the continued provision of these services.
2-4 Active engagement with IEEE: NERC strongly encourages industry to proactively address potential BPS reliability
impacts associated with large amounts of aggregated distributed and variable energy resources (VERs). This initiative
includes encouraging the IEEE 1547 stakeholder group to consider BPS reliability in its standards development
process.

Long-Term Reliability Challenges and Emerging Issues
NERC | 2013 Long-Term Reliability Assessment | December 2013
Page 29
Fossil-Fired Retirements and Coordination of Outages for Environmental Control Retrofits
OVERVIEW
NERC continues to assess the implications of environmental regulations in the United States as the industry continues to
respond to various state, federal, and provincial requirements. Since the release of the report Potential Impacts of Future
Environmental Regulations, included in the 2011LTRA,39 NERC has continued to monitor the reliability impacts of
environmental regulations, such as resource adequacy implications and impacts to operations (e.g., deliverability, stability,
localized issues, outage scheduling, operating procedures, and industry coordination). Since 2011, fossil-fired unit
retirements, retrofits, and conversions have been largely attributed to the unique confluence of final and potential
environmental regulations, as well as the continuation of low natural gas prices and other economic factors. According to
the 2013LTRA reference case, about 62.8 GW of fossil-fired generation (39.4 GW of coal, 8.3 GW of petroleum, and 15.2
GW of older natural gas) will be removed from the on-peak generation mix by 2023. A large portion of planned retirements
will occur in PJM, with 13 GW of announced fossil-fired retirements during the assessment period (amounting to 6.9
percent of the existing PJM fleet).40 Of the announced retirements, approximately 9.7 GW are coal, 2 GW are gas, and 1.3
GW are oil-fired generation.
Figure 14: Actual Retirements and Projected On-Peak Reduction of Coal, Petroleum, and Natural Gas Capacity (2011–
2023) 41
Between January 2011 and January 2012, 12.4 GW of coal-fired generation was taken out of service. During the same
period, 3.6 GW of oil-fired generation and 7.4 GW of gas-fired generation was taken out of service. The retirement of
significant amounts of fossil-fired generation each year has resulted in reduced Planning Reserve Margins in many areas.
However, retirements during the next three to four years may bring to light important issues to system stability and the
need for system enhancements which, if not addressed, could cause or exacerbate existing reliability concerns in some
areas.
In the near-term, environmental control retrofits will be needed for industry to be able to comply with existing and
proposed federal environmental regulations. Given the timelines for compliance (for example, MATS compliance by 2016),
many of the affected units may need to take concurrent maintenance outages. The need to take multiple units out of
39 Potential Impacts of Future Environmental Regulations Extracted from the 2011 Long-Term Reliability Assessment. 40 PJM Generation Deactivation Summary Sheets. 41 Actual U.S. coal-fired retirement data (2011 and 2012): EIA Today in Energy. Actual Canadian coal-fired retirement data (2011 and 2012):
Ventyx Velocity Suite. Actual NERC-wide oil- and gas-fired retirement data (2011 and 2012): Ventyx Velocity Suite. Projections are aggregated by fuel type from the 2013LTRA reference case. The reduction represents negative capacity changes due to unit derates and retirements.

Long-Term Reliability Challenges and Emerging Issues
NERC | 2013 Long-Term Reliability Assessment | December 2013
Page 30
service on extended scheduled outages can impact resource availability and reduce flexibility, particularly during shoulder
months. Industry must focus on outage coordination to avoid resource adequacy concerns during maintenance periods. In
the United States, industry has planned the following retrofits to be compliant with regulations that limit SOX, CO2, and NOX
emissions.
Figure 15: Planned Retrofits to Existing Units in the United States by Year42,43
Most retrofits are planned between 2013 and 2016 with a total of 43.5 GW for SO2 controls, 30.6 GW for mercury controls,
and 20.2 GW for NOx controls.
As the long-term resource adequacy outlook experiences ongoing changes in response to new and proposed emission
regulations, NERC continues to closely monitor reliability impacts in the United States and various Canadian provinces. The
specific environmental regulations with their current statuses are provided below:
Regulation Description and Status
Mercury and Air Toxics
Standards (MATS)
On December 16, 2011, the EPA issued a rule to reduce emissions of toxic air pollutants from power plants. MATS
will reduce emissions from existing and planned coal- and oil-fired generators by requiring the installation of
environmental controls. These controls typically involve the addition of dry sorbent injection44 or a scrubber on units
to control emission levels. Generation owners will ultimately be charged with deciding between investing in the
plant to ensure it complies with regulations, or closing it permanently.
Clean Air Act (Section
111)
The Clean Air Act impacts new and existing sources under Section 111 (a federal program for new sources and state
programs for existing sources). Section 111 is being used by the EPA to issue standards, regulations, or guidelines as
appropriate that address carbon pollution from new and existing power plants, including modifications of those
plants. This section of the Act establishes a mechanism for controlling air pollution from stationary sources. Section
111(b) is the federal program to address new, modified, and reconstructed sources by establishing standards;
Section 111(d) is a state-based program for existing sources. The EPA establishes guidelines, and the states
subsequently design programs based on those guidelines to achieve the necessary reductions.
Cross-State Air Pollution
Rule (CSAPR)
On August 21, 2012, the D.C. Circuit Court vacated the CSAPR,45 which had originally required 23 states to reduce
annual SO2 and NOX emissions. However, since CSAPR did not mandate physical requirements for electric
generators, the rule had a smaller bearing on unit retirement decisions compared to other factors. The likely drivers
behind retirement decisions will be the combination of other federal and state environmental rules, changing fuel
42 Data provided by Energy Ventures Analysis, Inc.; Analysis performed by NERC staff. 43 Planned retrofits for compliance with each regulation are examined separately. Capacity refers to the summer rating for each unit. 44 EIA Today in Energy: Dry sorbent injection may serve as a key pollution control technology at power plants. 45 The CSAPR was initially designed to replace EPA's 2005 Clean Air Interstate Rule (CAIR). A December 2008 court decision kept the requirements
of CAIR in place temporarily but directed EPA to issue a new rule to implement Clean Air Act requirements concerning the transport of air pollution across state boundaries. This action responds to the court's concerns. For additional information see the EPA website EPA Interstate Air Pollution Transport.

Long-Term Reliability Challenges and Emerging Issues
NERC | 2013 Long-Term Reliability Assessment | December 2013
Page 31
costs (i.e., lower natural gas prices), and other economic decisions. In October 2013, the Supreme Court upheld the
EPA’s ability to regulate greenhouse gas (GHG) emissions as a pollutant. With the decision reinforcing the EPA’s
regulatory authority under the Clean Air Act, additional requirements could be implemented in the coming years.
The recently announced initiatives in the United States to reduce the carbon footprint in the electric sector include
the tightening of appliance Energy Efficiency standards, continuing to support clean energy technologies, and
reducing GHG emissions from both existing and future coal-fired plants by enforcing new regulations by the EPA as
mandated under the Clean Air Act.
Clean Water Act (CWA) –
Section 316(b)
Cooling water intake operation and structures are regulated under Section 316(b) of the CWA. The 316(b) rule is
implemented by the state water permitting agencies through the National Pollution Discharge Elimination System
(NPDES) permit program of the CWA. EPA provides state permitting agencies with regulatory guidance and
standards to determine Best Technology Available (BTA) to protect aquatic life from impingement (being trapped
against the intake screen) and entrainment (passing through the screens and into the plant’s cooling water system).
Section 316(b) of the federal CWA (33 U.S.C. section 1326) requires that the location, design, construction, and
capacity of cooling water intake structures for facilities reflect the best technology available for minimizing adverse
environmental impact. Final rules are expected in early 2014.46
Coal Combustion
Residuals (CCRs)
The CCRs proposed EPA rule would regulate coal ash to address the disposal risks from waste generated by electric
utilities and independent power producers. The EPA is considering two possible options for public comment for the
management of coal ash. Under the first proposal, the EPA would list these residuals as special wastes subject to
regulation under subtitle C of the Resource Conservation and Recovery Act (RCRA) when destined for disposal in
landfills or surface impoundments. Under the second proposal, the EPA would regulate coal ash under subtitle D of
RCRA, the section for nonhazardous wastes.47
Recently announced initiatives in the United States48,49 to reduce the carbon footprint in the electric sector include the
tightening of appliance Energy Efficiency standards, the continuation of support for clean energy technologies, and
reduction of greenhouse gas (GHG) emissions from both existing and future coal-fired plants by enforcing new regulations
by the EPA, as mandated under the Clean Air Act. Because of strict emission limits and a new technology-based solution
that may be required (e.g., carbon capture and sequestration), the transition of coal to natural gas is expected to continue
throughout and beyond the assessment period. Natural gas-fired generation is likely to replace a significant amount of less
efficient coal- and oil-fired generation. However, natural gas emits significant amounts of GHGs and can only play a
transitional role in the short to medium term until a long-term, low-carbon solution is in place. Potential solutions should
include system reliability—planning and operational requirements, the availability and viability of integrating new
technologies, and the timing requirements of both.
Resource adequacy challenges can often be remedied by sending clear and accurate price signals to incentivize new
capacity. In some cases, a more immediate response to resource adequacy challenges may require regulatory action.
However, reliability factors other than capacity and energy requirements can be more difficult to address; for example, the
ability of the BPS to withstand disturbances and remain in compliance with NERC Reliability Standards. These and other less
obvious reliability concerns are further exacerbated by the continued retirement of steam-driven generators (including
nuclear), causing a decrease in total system inertia, voltage support, frequency control, and reactive power. Many of the
resources that are replacing these retired units are variable in nature (e.g., wind, solar, and biomass) and do not have the
same operating characteristics as traditional forms of generation.
As coal capacity is retired, the characteristics and system support provided by larger steam-driven turbines is reduced.
When transmitting large amounts of power over vast geographic areas, it is vital to consider the reliability implications. One
of the reliability concerns presented by higher percentages of variable resources is the displacement of resources that have
the ability to arrest and stabilize system frequency following a grid disturbance or the sudden loss of a large generation
46 EPA Carbon Pollution Standards. 47 Coal Combustion Residuals - Proposed Rule. 48 Climate Change and President Obama’s Action Plan. 49 EPA Carbon Pollution Standards.

Long-Term Reliability Challenges and Emerging Issues
NERC | 2013 Long-Term Reliability Assessment | December 2013
Page 32
source. Photovoltaic solar generation offers no inertia and no frequency response; wind generation offers virtually none
unless specifically designed to do so. As simple energy requirements are provided by these types of energy-only resources,
the other necessary components of conventional generation resources must also be replaced.
ASSESSMENT AREA IMPACTS
Higher amounts of fossil-fired resources
Moderate amounts of fossil-fired resources
Lower amounts of fossil-fired resources
RESOURCE AND TRANSMISSION ADEQUACY IMPACTS
Early retirement of multiple units in the short run can stress the BPS if plans are not in place to add resources. This can
affect both short- and long-term planning strategies and reduce Planning Reserve Margins. With fewer resources, flexibility
is reduced and the risk of a capacity shortage may increase, unless additional resources are available. Where Planning
Reserve Margins fall below targets or requirements, resources in a specific area may be insufficient to meet future
demands.
In order to maintain sufficient resources to meet peak demands, system planners continuously assess expected changes in
generation and transmission assets (in this case, the retirement of a generating unit). For example, once a system planner is
informed of an upcoming unit retirement, general studies must be conducted on the entire system to assess whether the
retirement would cause a reliability issue. If issues are identified, mitigation plans must be developed. Potential solutions
include replacing the unit with another form of capacity, confirming additional Demand-Side resources, or building new
transmission or other equipment. Each of these options is associated with various implementation timelines. From a
resource adequacy perspective, it is important to consider the typical time frame required for industry to plan and
construct replacement capacity. Accordingly, policy makers should consider these challenges when developing
environmental compliance timelines.
Unit retrofits will have alternative impacts on resource adequacy, potentially stressing the industry’s ability to coordinate
the necessary and possibly prolonged unit outages needed for the installation of environmental controls. Issues could
emerge in load pocket areas (i.e., major metropolitan areas) due to the loss of critical bulk power resources. These
vulnerabilities may persist in the shoulder months as well.
OPERATIONAL IMPACTS
Potential environmental regulations can substantially modify the overall fuel mix, ultimately changing the inherent
operating characteristics of a given resource portfolio. For example, with less coal-fired capacity, more gas-fired generation
may be needed to provide Base Load services. As a result, the interdependency of gas and electric supply, transport, and
delivery must be further assessed to ensure reliability is not degraded.
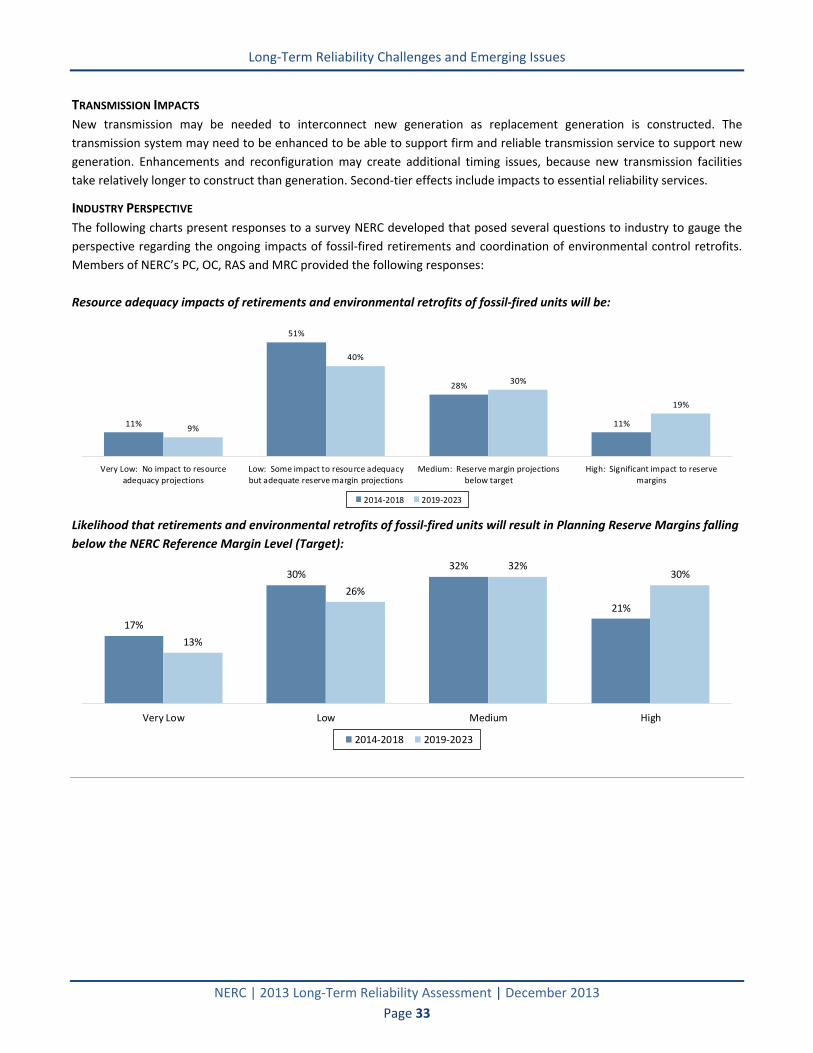
Long-Term Reliability Challenges and Emerging Issues
NERC | 2013 Long-Term Reliability Assessment | December 2013
Page 33
TRANSMISSION IMPACTS
New transmission may be needed to interconnect new generation as replacement generation is constructed. The
transmission system may need to be enhanced to be able to support firm and reliable transmission service to support new
generation. Enhancements and reconfiguration may create additional timing issues, because new transmission facilities
take relatively longer to construct than generation. Second-tier effects include impacts to essential reliability services.
INDUSTRY PERSPECTIVE
The following charts present responses to a survey NERC developed that posed several questions to industry to gauge the
perspective regarding the ongoing impacts of fossil-fired retirements and coordination of environmental control retrofits.
Members of NERC’s PC, OC, RAS and MRC provided the following responses:
Resource adequacy impacts of retirements and environmental retrofits of fossil-fired units will be:
11%
51%
28%
11%9%
40%
30%
19%
Very Low: No impact to resourceadequacy projections
Low: Some impact to resource adequacybut adequate reserve margin projections
Medium: Reserve margin projectionsbelow target
High: Significant impact to reservemargins
2014-2018 2019-2023
Likelihood that retirements and environmental retrofits of fossil-fired units will result in Planning Reserve Margins falling
below the NERC Reference Margin Level (Target):
17%
30%32%
21%
13%
26%
32%30%
Very Low Low Medium High
2014-2018 2019-2023
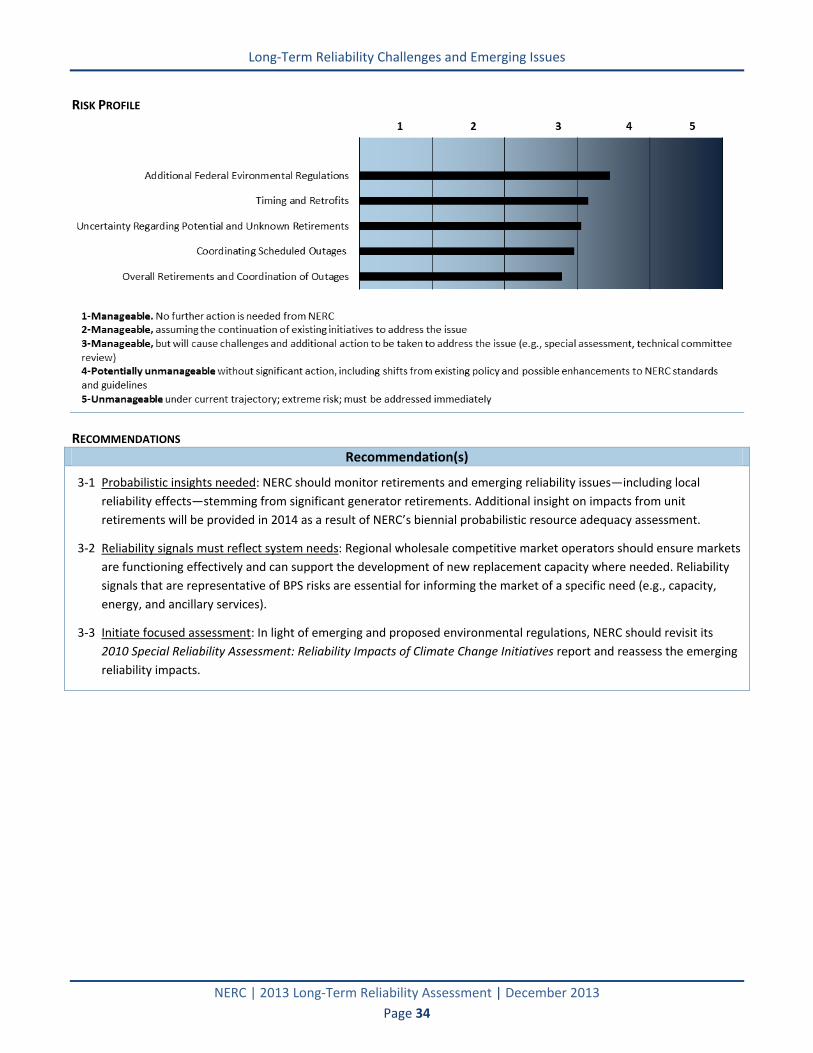
Long-Term Reliability Challenges and Emerging Issues
NERC | 2013 Long-Term Reliability Assessment | December 2013
Page 34
RISK PROFILE
RECOMMENDATIONS
Recommendation(s)
3-1 Probabilistic insights needed: NERC should monitor retirements and emerging reliability issues—including local
reliability effects—stemming from significant generator retirements. Additional insight on impacts from unit
retirements will be provided in 2014 as a result of NERC’s biennial probabilistic resource adequacy assessment.
3-2 Reliability signals must reflect system needs: Regional wholesale competitive market operators should ensure markets
are functioning effectively and can support the development of new replacement capacity where needed. Reliability
signals that are representative of BPS risks are essential for informing the market of a specific need (e.g., capacity,
energy, and ancillary services).
3-3 Initiate focused assessment: In light of emerging and proposed environmental regulations, NERC should revisit its
2010 Special Reliability Assessment: Reliability Impacts of Climate Change Initiatives report and reassess the emerging
reliability impacts.

Long-Term Reliability Challenges and Emerging Issues
NERC | 2013 Long-Term Reliability Assessment | December 2013
Page 35
Increased Dependence on Natural Gas for Electric Power
OVERVIEW
Lower prices of natural gas (due to new conventional and unconventional supplies in North America) and climate change
initiatives are projected to drive the transition from coal to gas generation. In North America, natural gas is the fastest-
growing source of new capacity during the next 10 years. A growing dependence on gas‐fired generation can increase BPS
exposure to disruptions in fuel supply, transportation, and delivery. While extremely rare, disruptions in natural gas supply
and transportation to power generators have prompted industry to seek an understanding of the reliability implications
associated with increasing gas‐fired generation.
ASSESSMENT AREA IMPACTS
Higher amounts of gas-fired resources
Moderate amounts of gas-fired resources
Lower amounts of gas-fired resources
LONG-TERM TRENDS
Gas-fired generation has increased significantly since 2008, and according to the 2013LTRA reference case, that trend is
expected to continue. Currently, approximately 412 GW of gas-fired capacity provide over 39 percent of the on-peak
resource mix. By 2023, this contribution is expected to grow to almost 41 percent, with the addition of 28.6 GW during the
assessment period. From 2008 to 2013, over 20 GW of gas-fired capacity have retired, while 60.3 GW have been added
during the same period. The inclusion of current projections amounts to a net increase of 68.7 GW between 2008 and
2023.50
50 Actual additions and retirements: Ventyx Velocity Suite: cumulative aggregation of the summer rating for all gas-fired generator additions from
January 1, 2008 to October 31, 2013. 2014–2022 projections: 2013LTRA reference case: cumulative aggregation of all on-peak, gas-fired capacity additions categorized as either Future-Planned or Future-Other with an in-service date between 2014 and 2023.
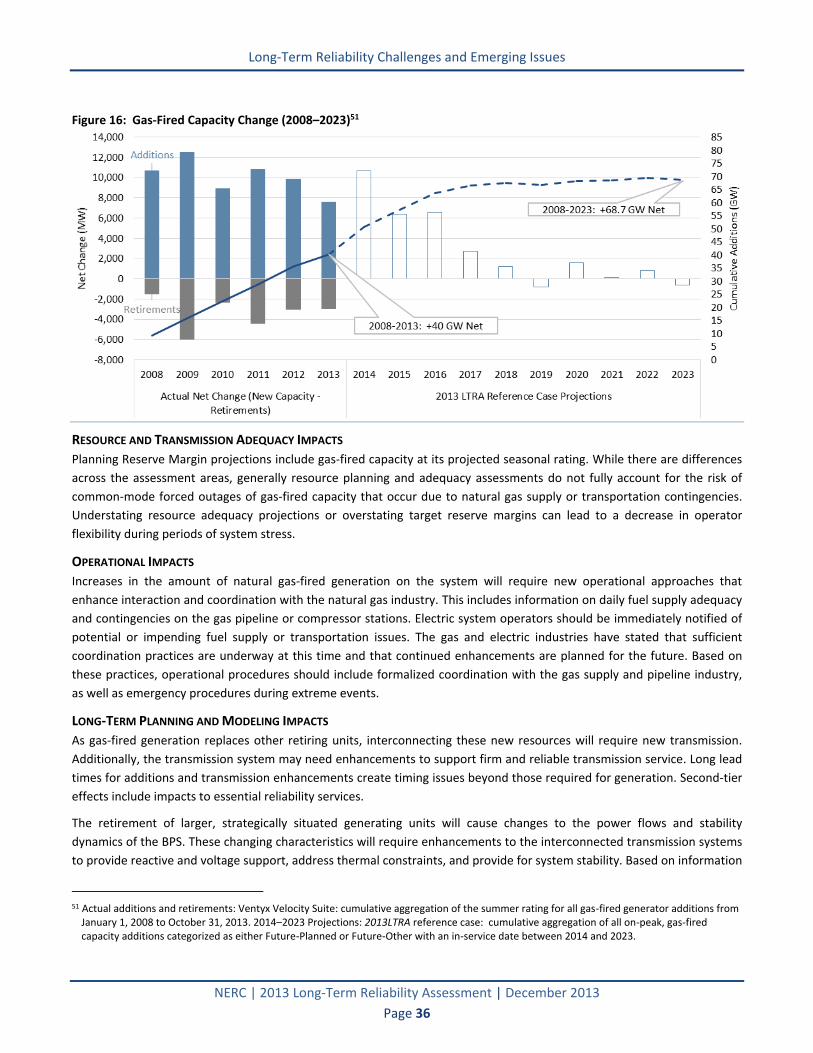
Long-Term Reliability Challenges and Emerging Issues
NERC | 2013 Long-Term Reliability Assessment | December 2013
Page 36
Figure 16: Gas-Fired Capacity Change (2008–2023)51
RESOURCE AND TRANSMISSION ADEQUACY IMPACTS
Planning Reserve Margin projections include gas-fired capacity at its projected seasonal rating. While there are differences
across the assessment areas, generally resource planning and adequacy assessments do not fully account for the risk of
common-mode forced outages of gas-fired capacity that occur due to natural gas supply or transportation contingencies.
Understating resource adequacy projections or overstating target reserve margins can lead to a decrease in operator
flexibility during periods of system stress.
OPERATIONAL IMPACTS
Increases in the amount of natural gas-fired generation on the system will require new operational approaches that
enhance interaction and coordination with the natural gas industry. This includes information on daily fuel supply adequacy
and contingencies on the gas pipeline or compressor stations. Electric system operators should be immediately notified of
potential or impending fuel supply or transportation issues. The gas and electric industries have stated that sufficient
coordination practices are underway at this time and that continued enhancements are planned for the future. Based on
these practices, operational procedures should include formalized coordination with the gas supply and pipeline industry,
as well as emergency procedures during extreme events.
LONG-TERM PLANNING AND MODELING IMPACTS
As gas-fired generation replaces other retiring units, interconnecting these new resources will require new transmission.
Additionally, the transmission system may need enhancements to support firm and reliable transmission service. Long lead
times for additions and transmission enhancements create timing issues beyond those required for generation. Second-tier
effects include impacts to essential reliability services.
The retirement of larger, strategically situated generating units will cause changes to the power flows and stability
dynamics of the BPS. These changing characteristics will require enhancements to the interconnected transmission systems
to provide reactive and voltage support, address thermal constraints, and provide for system stability. Based on information
51 Actual additions and retirements: Ventyx Velocity Suite: cumulative aggregation of the summer rating for all gas-fired generator additions from
January 1, 2008 to October 31, 2013. 2014–2023 Projections: 2013LTRA reference case: cumulative aggregation of all on-peak, gas-fired capacity additions categorized as either Future-Planned or Future-Other with an in-service date between 2014 and 2023.

Long-Term Reliability Challenges and Emerging Issues
NERC | 2013 Long-Term Reliability Assessment | December 2013
Page 37
gathered from stakeholders and the Regional Entities, these issues may cause some reliability concerns unless the
transmission system is reconfigured.
System planners should consider implementing the same probabilistic techniques currently applied to energy-limited
resources for evaluating fuel supply risks associated with natural gas-fired generation. These new approaches, in
combination with the institutionalized planning processes, can help pinpoint the BPS’s risk exposure as well as support
accurate price signals to meet specific reliability needs of individual systems.
INDUSTRY PERSPECTIVES
The following charts present selected industry responses to a NERC survey on the ongoing impacts of increased
dependence on natural gas for electric power.52 Members of NERC’s PC, OC, RAS and MRC provided the following
responses:
Likelihood that increased dependence on natural gas for electric power will result in Planning Reserve Margins falling
below the NERC Reference Margin Level (Target):
31%
38%
24%
7%
20%
38%
27%
16%
Very Low Low Medium High
2014-2018 2019-2023
During the next 10 years, insufficient natural gas pipeline capacity leading to multiple generator outages will be:
16%
27%
38%
18%
2%
Manageable. No further NERC action is needed
Manageable, assuming the continuation of existing initiatives to address theissue
Manageable, but will cause challenges and additional action should be takento address the issue (i.e., special assessment, technical committee review)
Potentially Unmanageable without significant action, including possibleenhancements to NERC standards and/or guidelines and shifts from existing…
Unmanageable under current trajectory; extreme risk; must be addressedimmediately
52 For additional information on the survey, please contact NERC staff ([email protected]).

Long-Term Reliability Challenges and Emerging Issues
NERC | 2013 Long-Term Reliability Assessment | December 2013
Page 38
RISK PROFILE
RECOMMENDATIONS
Recommendation(s)
4-1 Monitor high-risk regions: Through its reliability assessments, NERC should closely monitor resource availability and
operational impacts in New England and other areas of North America that are quickly integrating large amounts of
natural gas-fired generation.
4-2 Expand coordination with study groups: NERC should expand its coordination with regional and interregional study
groups, as well as the natural gas industry, to further assess BPS reliability needs. Regional and interregional studies
are focusing on the long-term needs of natural gas transportation for electric power. These efforts may provide better
insight on the system planning and operating measures being taken to address an increasing dependency on natural
gas.
4-3 Fulfill outstanding recommendations: NERC, the industry, and policy makers should continue addressing the
recommendations included in the 2013 Special Reliability Assessment: Impacts of Increased Natural Gas for Electric
Power.

Long-Term Reliability Challenges and Emerging Issues
NERC | 2013 Long-Term Reliability Assessment | December 2013
Page 39
Increased Use of Demand-Side Management
OVERVIEW
Increases in DSM continue to help offset future resource needs but create additional uncertainty for system planners.
These uncertainties include performance and availability, as well as long-term sustained participation in DR programs.
Capacity from demand resources and Energy Efficiency used for planning and resource adequacy has increased significantly
during the past five years and is expected to increase in the future. The initial scope of DR has expanded and evolved to
provide additional benefits to operators, including added flexibility. However, these programs are not an unlimited
resource; they may provide limited demand reductions during prespecified time periods. Unlike traditional generating
resources with many decades of historic data for analysis, the long‐term projections of DR have a shorter history and less
certainty.
ASSESSMENT AREA IMPACTS
Higher amounts of DSM
Moderate amounts of DSM
Lower amounts of DSM
LONG-TERM TRENDS
All assessment areas project at least some increase in DSM during the next 10 years. These programs will reduce peak
demand, ultimately contributing either to the deferral of new generating capacity or improved flexibility in day-ahead or
real-time operations. NERC-wide, DSM is projected to total almost 70 GW by 2023 (or about 6 percent of the NERC
noncoincident peak demand), offsetting approximately six years of peak demand growth.
NERC has recently identified a number of resource and transmission projects that were cancelled or deferred as a result of
increasing DSM. For example, last year, PJM’s plans to construct the PATH and MAPP lines were deferred due to a
combination of slowed economic growth in the impacted areas and the procurement of a significant amount of DR in the
Forward Capacity Auction. Individual project deferments and cancellations do not create significant reliability issues.
However, with long lead times to remedy a capacity shortfall, the viability and long-term sustainability of DSM must be
closely monitored for performance. These observations can provide a basis for incorporating future risks into transmission
and resource analyses.
RESOURCE AND TRANSMISSION ADEQUACY
DSM offers industry the ability to reduce future peak demand and potentially to defer the need for some future generation
capacity. The amount of DSM used to meet resource adequacy requirements is increasing across North America, especially
as resource and transmission planners are starting to depend on DR commitments in the long term to meet reserve and
resource adequacy requirements (targets). Planners cannot sufficiently assess the viability of these resources because of
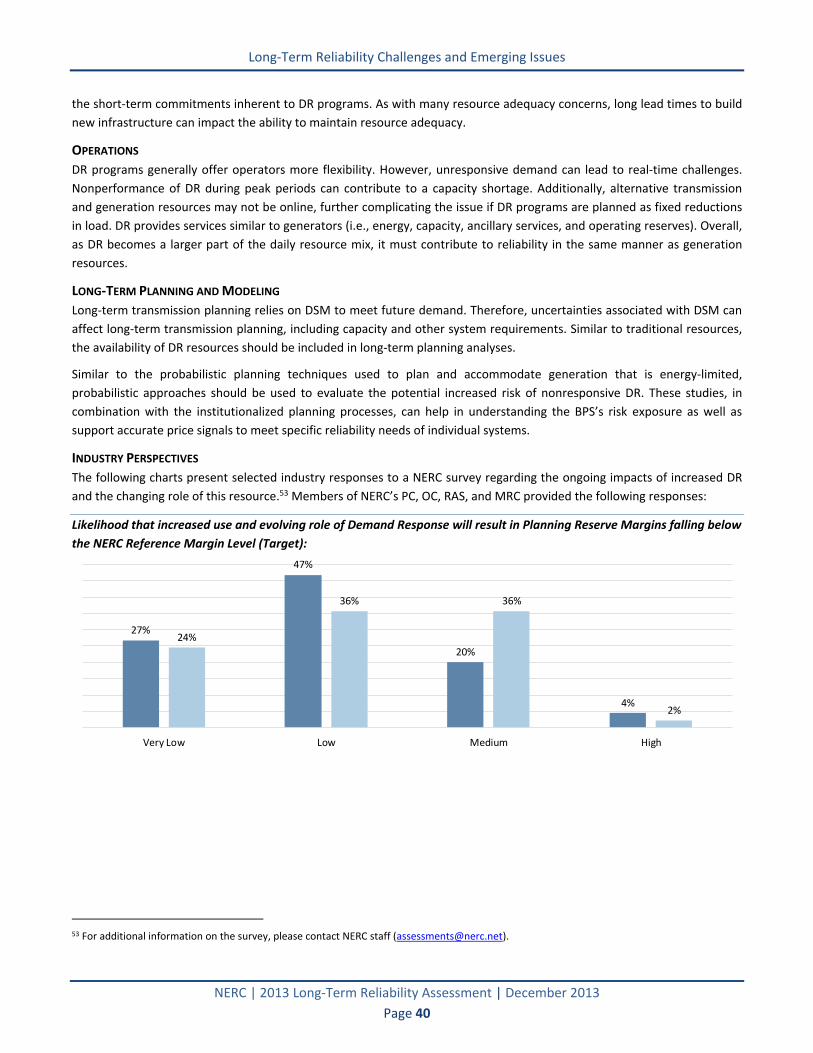
Long-Term Reliability Challenges and Emerging Issues
NERC | 2013 Long-Term Reliability Assessment | December 2013
Page 40
the short-term commitments inherent to DR programs. As with many resource adequacy concerns, long lead times to build
new infrastructure can impact the ability to maintain resource adequacy.
OPERATIONS
DR programs generally offer operators more flexibility. However, unresponsive demand can lead to real-time challenges.
Nonperformance of DR during peak periods can contribute to a capacity shortage. Additionally, alternative transmission
and generation resources may not be online, further complicating the issue if DR programs are planned as fixed reductions
in load. DR provides services similar to generators (i.e., energy, capacity, ancillary services, and operating reserves). Overall,
as DR becomes a larger part of the daily resource mix, it must contribute to reliability in the same manner as generation
resources.
LONG-TERM PLANNING AND MODELING
Long-term transmission planning relies on DSM to meet future demand. Therefore, uncertainties associated with DSM can
affect long-term transmission planning, including capacity and other system requirements. Similar to traditional resources,
the availability of DR resources should be included in long-term planning analyses.
Similar to the probabilistic planning techniques used to plan and accommodate generation that is energy-limited,
probabilistic approaches should be used to evaluate the potential increased risk of nonresponsive DR. These studies, in
combination with the institutionalized planning processes, can help in understanding the BPS’s risk exposure as well as
support accurate price signals to meet specific reliability needs of individual systems.
INDUSTRY PERSPECTIVES
The following charts present selected industry responses to a NERC survey regarding the ongoing impacts of increased DR
and the changing role of this resource.53 Members of NERC’s PC, OC, RAS, and MRC provided the following responses:
Likelihood that increased use and evolving role of Demand Response will result in Planning Reserve Margins falling below
the NERC Reference Margin Level (Target):
27%
47%
20%
4%
24%
36% 36%
2%
Very Low Low Medium High
53 For additional information on the survey, please contact NERC staff ([email protected]).

Long-Term Reliability Challenges and Emerging Issues
NERC | 2013 Long-Term Reliability Assessment | December 2013
Page 41
Addressing the reliability challenges associated with an increasing use and role of Demand-Side Management during the
next 10 years:
20%
49%
27%
4%
Manageable. No further NERCaction is needed
Manageable, assuming thecontinuation of existing initiatives
to address the issue
Manageable, but will causechallenges and additional actionshould be taken to address theissue (i.e., special assessment)
Potentially Unmanageable withoutsignificant action, including
possible enhancements to NERCstandards and/or guidelines and
shifts from existing policy
RISK PROFILE
RECOMMENDATIONS
Recommendation(s)
5-1 Enhance performance analysis: NERC should leverage the Demand Response Availability Data System (DADS) data to
identify availability and performance trends that may indicate future BPS risks. These findings should be reported in
the annual State of Reliability report.
5-2 Evaluate the need for requirements or guidelines: NERC should determine whether requirements or guidelines are
needed to support Demand Response planning and operations, specifically Demand Response that is relied on to meet
bulk system reliability requirements. The Planning and Operating Committees should provide joint technical support
to the Standards Committee on any reliability issues that should be considered during the development of NERC
Reliability Standards.

Long-Term Reliability Challenges and Emerging Issues
NERC | 2013 Long-Term Reliability Assessment | December 2013
Page 42
Nuclear Generation Retirements and/or Long-Term Outages
OVERVIEW
Nuclear generation contributes approximately 11 percent to the on-peak resource mix in North America. More importantly,
large steam turbines provide inertia and voltage support, both of which reinforce local system balancing efforts. Nuclear
plants in the United States have an average capacity rating of 979 MW for the summer and 1,001 MW for the winter. These
Base Load generators are critical reliability components that contribute to both the stability and integrity of the system.
While this is generally a low-likelihood scenario, wide-scale nuclear generation retirements and long-term outages could
have significant impacts on the BPS. It is important to examine these risks, especially considering the average age of the
North American nuclear fleet and the long-term economic viability of continuing to operate these plants.
ASSESSMENT AREA IMPACTS
Higher amounts of nuclear capacity
Moderate amounts of nuclear capacity
Low or no nuclear capacity
RESOURCE ADEQUACY IMPACTS
According to the EIA, the average commercial reactor fleet in the United States is 32 years old, which is approaching the
typical life span of 40 years.54 The continued operation of existing plants depends on the required refurbishments and
upgrades at existing reactors. In the United States, the Nuclear Regulatory Commission (NRC) issued operating license
renewals for 72 of the 100 reactors, and an additional 10 applications are currently under review. The Canadian Nuclear
Safety Commission (CNSC) maintains similar regulatory oversight of four plants that house 19 operational reactors.
Although over 115 GW of nuclear capacity is currently operational in North America, five units have either retired or will be
decommissioned between 2011 and 2013. The decision to retire many of these units is based on cost, as the operating
expenses of required unit upgrades and maintenance have increased. As these units approach their intended their life
spans, market conditions (due to renewable generation) drive uneconomic base light load dispatch at zero or negative
marginal prices. These conditions make replacing these units with less-costly resources more economically viable. The
number of unit retirements could increase beyond what is projected in the 2013LTRA reference case as older units
approach their intended lifespan. The age of a given unit is an important variable when considering the economic viability
of investing additional capital to retrofit a unit, especially when replacement generation (e.g., natural gas, biomass, etc.) is
often a more cost-effective option. Uprates of existing units are also at risk, due to low gas prices and required mitigation of
reactive power reductions.
54 EIA Frequently Asked Questions: How old are U.S. nuclear power plants and when was the last one built?

Long-Term Reliability Challenges and Emerging Issues
NERC | 2013 Long-Term Reliability Assessment | December 2013
Page 43
Since 2011, approximately 4,204 MW have either been retired or plans to decommission them have been announced. An
additional 1,219 MW (summer rating) of planned retirements will occur before 2019, according to the 2013LTRA reference
case. Additionally, in the United States, existing operating licenses for seven units totaling 7,510 MW (summer rating) of
capacity will expire before 2023.
U.S. Reactor Licenses Expiring during the Assessment Period
Reactor Name NERC Assessment Area Summer Rating (MW) License Expires Reactor Type
Davis-Besse PJM 894 Apr-2017 Pressurized Water Reactor Indian Point 2 NPCC-NYISO 1020 Sep-2013 Pressurized Water Reactor Indian Point 3 NPCC-NYISO 1040 Dec-2015 Pressurized Water Reactor La Salle 1 PJM 1137 Apr-2022 Boiling Water Reactor La Salle 2 PJM 1140 Dec-2023 Boiling Water Reactor Sequoyah 1 SERC-N 1152 Sep-2020 Pressurized Water Reactor Sequoyah 2 SERC-N 1125.7 Sep-2021 Pressurized Water Reactor
In NPCC-NYISO, the Indian Points 2 & 3 are in service while the Atomic Safety Licensing Board of the Nuclear Regulatory
Commission reviews the license renewal request for both units. It is important to note that despite the relicensing of the
Vermont Yankee plant in March 2011, the plant is still expected to close in late 2014. The Indian Point Power Plant (two
nuclear units) in NPCC-NYISO is speculated to retire by the end of 2015 (not included in the 2013LTRA reference case). If the
Indian Point Power Plant licenses were not renewed and the plant was retired by the end of 2015 or thereafter, it would
result in immediate violations of resource adequacy criteria.
All 18 reactors in Ontario, including the Pickering B, Bruce B, and Darlington Nuclear Generating Stations, have existing
licenses that will expire during the 10-year period. The Canadian Nuclear Safety Commission granted a five-year renewal of
Ontario Power Generation’s (OPG) operating license for the Pickering Nuclear Generating Station that will be valid until
August 31, 2018. The license prohibits the operation of the Pickering B NGS beyond 210,000 effective full power hours. At a
future public hearing, the Commission will consider OPG’s request to remove this regulatory hold point. Units at Bruce and
Darlington will undergo midlife refurbishments to extend their operating lives. The OPA is working with two nuclear
operators to develop a coordinated plan for nuclear fleet renewal. Unit outages will be coordinated to minimize the
number of nuclear units simultaneously on outage. The plan for nuclear renewal is complex as there are a number of
aspects that need to be resolved: operational and technical coordination, regulatory and contractual terms, financing and
revenue recovery, and risk allocation.
INDUSTRY PERSPECTIVES
The following chart presents selected industry responses to a NERC survey on the potential impacts of substantial
retirements or scheduled outages of nuclear reactors.55 Members of NERC’s PC, OC, RAS, and MRC provided the following
responses:
55 For additional information on the survey, please contact NERC staff ([email protected]).
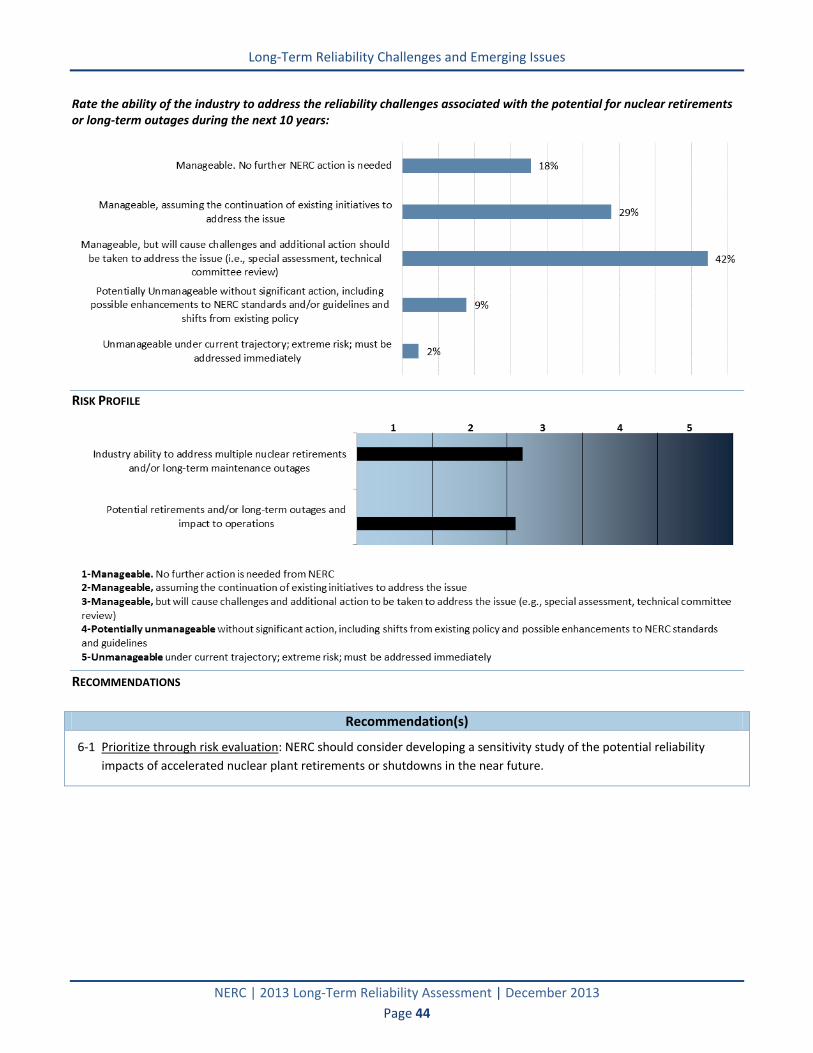
Long-Term Reliability Challenges and Emerging Issues
NERC | 2013 Long-Term Reliability Assessment | December 2013
Page 44
Rate the ability of the industry to address the reliability challenges associated with the potential for nuclear retirements or long-term outages during the next 10 years:
RISK PROFILE
RECOMMENDATIONS
Recommendation(s)
6-1 Prioritize through risk evaluation: NERC should consider developing a sensitivity study of the potential reliability
impacts of accelerated nuclear plant retirements or shutdowns in the near future.

Long-Term Reliability Challenges and Emerging Issues
NERC | 2013 Long-Term Reliability Assessment | December 2013
Page 45
Other Challenges
NERC has also evaluated several other areas of potential concern. While the challenges noted below may not rise up to a
level of significant concern, NERC will continue to monitor them and determine whether a more detailed evaluation and
assessment are necessary.
MID-CONTINENT INDEPENDENT SYSTEM OPERATOR (MISO) RELIABILITY PLAN
The creation of MISO’s Southern Region is the result of (1) FERC’s authorizing MISO as the Independent Coordinator of
Transmission (ICT) for Entergy, and (2) regulatory approvals and new memberships by Entergy and other area Transmission
Owners (TOs). This integration will add over 18,000 miles of transmission, approximately 40,000 MW of generation
capacity, and approximately 40,000 MW of load into the MISO footprint. MISO’s increased scale can drive access to more
resources by consolidating Balancing Authorities and expanding options for generation commitment and dispatch from a
more diverse set of fuel types.
In June 2013, the OC approved a revised MISO Reliability Plan. FERC approved it as well. A significant aspect of OC’s
approval was the review and consideration of an Operations Reliability Coordination Agreement (ORCA), which the various
impacted parties negotiated and approved. MISO’s integration of Entergy, the largest electric system joining MISO since its
inception, requires a significant amount of joint analysis and study work. The ORCA provides a road map for continued
studies and coordination of the expanded MISO Balancing BA footprint and the neighboring Balancing Authorities to ensure
reliability. This consolidated MISO BA footprint stretches from the Gulf Coast through the Midwest to the U.S.–Canadian
border. SERC also conducted an ERO certification of the new MISO BA operations in the latter half of 2013.
The ORCA helps vested parties understand and commit to specific operating practices—the agreement defines specific
practices and principles to use during an Operations Transition Period (OTP) and a period after the OTP (Post-OTP). The
agreement outlines vested parties’ coordination of regional issues and long-term transmission planning. However, the
physical connections between MISO North and South are currently limited, and the expected dispatch of MISO resources
can create reliability challenges for the neighboring entities. While coordinated transmission planning will lead to solution
sets that can alleviate these concerns, MISO is expected to need more resources from a resource adequacy perspective
around the 2016 time frame. If real-time transmission constraints limit the south-to-north transfers, MISO may not be able
to import power to meet demand—a particular concern during a summer peak with little weather and temperature
diversity between the north and south borders of the United States.
AGING WORKFORCE
The need for new infrastructure and technology innovations means a steady need for well-trained engineers and workers.
The electric power industry is beginning to remedy the gap in qualified employees, which will be critical as the BPS
continues to rapidly evolve. Workers entering the power industry will be tasked with understanding and implementing a
variety of new technologies and smarter systems and devices. Across the industry, there is substantial interest in training
and hiring workers to support these industry needs as well as transferring the expertise and knowledge of retiring workers.
LOAD FORECASTING UNCERTAINTY
The electric industry is currently facing several challenges in forecasting demand for electricity. The accuracy of demand
forecasts has been decreasing since the beginning of the last recession, which officially began in late 2007 and ended in
mid‐2009. There is sufficient empirical evidence to suggest correlations such as the economic outlook, new technologies,
and consumer awareness. With structural and cyclical effects of the recession continuing, demand forecasters are faced
with the challenge of redefining methods to ensure accurate projections for both short‐ and long‐term planning. As new
variables are introduced to load forecasting models, further analysis will be necessary to gain a better understanding of
their effects on short‐run planning horizons and to ensure methods are consistent in long‐term forecasting.

Long-Term Reliability Challenges and Emerging Issues
NERC | 2013 Long-Term Reliability Assessment | December 2013
Page 46
Many new technologies, like AMI, PHEVs, and real‐time pricing, may provide better quality load data to utilities. However,
in the near term (one to five years), these technologies may further contribute to the uncertainty due to changing
residential customer behavior. Moreover, the benefits of these new technologies will not be realized until several years’
worth of baseline data has been collected and used to establish accurate residential profiles that can be relied upon for
future forecasting. Finally, any changes in climate or long-term weather forecasts may have residual effects on the load
forecast and the distribution of potential outcomes.
SMART GRID
Governments, regulators, and industry organizations have proposed the smart grid to enhance consumer options, support
climate change initiatives, and enhance the reliability of the North American BPS. The evolving smart grid integration will
require significant changes in BPS planning, design, and operations. A NERC report56 on smart grid integration identifies
important reliability considerations from a BPS perspective and provides a preliminary assessment of successful smart grid
integration. The report contains the following conclusions:
Government initiatives and regulations promoting smart grid development and integration must consider BPS
reliability.
Smart grid integration requires development of new tools and analyses to support planning and operations.
Smart grid technologies will change the character of the distribution system, and these changes must be
incorporated into BPS planning and operations.
Cybersecurity and control systems will require enhancements to ensure reliability.
Research and development (R&D) has a vital role in successful integration of the smart grid.
CHANGE IN SYSTEM BEHAVIOR AND COMPOSITION OF SYSTEM LOAD
Representative risks to the BPS should be identified and reflected in long-term planning and system analysis. A large change
in a given resource mix will also change system behavior, including generation characteristics, frequency response, and
inertia requirements. Robust and risk-oriented planning and modeling approaches will be needed to address transmission
and operating reliability. Incorrect assumptions and methods can lead to incorrect decision making for system
reinforcement, resources, transmission, flexibility, and operational needs.
Continued increases in energy-efficient products (including residential air conditioners, compact fluorescent and LED
lighting, plasma, LCD and LED televisions, and other electronically coupled loads) are significantly changing the
characteristics and behavior of system load—particularly during system disturbances. Preliminary studies indicate that such
changes may exacerbate emerging problems such as fault-induced delayed voltage recovery (FIDVR). An immediate gap is
the inability of current load modeling methods to predict system behavior with the integration of new electronically
coupled loads. The changing nature of the load requires immediate improvements and additional sophistication in load
modeling to properly analyze potential system performance issues.
TRANSMISSION SITING, PERMITTING, AND RIGHT-OF-WAY ISSUES
Despite higher expectations of planned transmission lines in the 2013LTRA reference case, actually building new
transmission is an ongoing challenge for the electricity industry. The issue is increasingly important as the resource mix in
North America experiences an ongoing and rapid transformation. Transmission right-of-way issues required in the siting of
new BPS lines that spans multiple states and provinces are highly visible and require increased coordination among multiple
regulating agencies and authorities. A lack of coordination regarding cost allocation, coupled with public opposition due to
land use and property valuation concerns, has often resulted in extended delays in transmission construction. In some
cases, these delays require special operating procedures to maintain BPS reliability.
56 Reliability Considerations from the Integration of Smart Grid.

Long-Term Reliability Challenges and Emerging Issues
NERC | 2013 Long-Term Reliability Assessment | December 2013
Page 47
Ongoing state and provincial policies will require continued integration of renewable resources, including wind and solar.
These variable resources are most commonly built in remote areas where wind power densities and solar development are
favorable. In many cases, the existing transmission network needs to be expanded to integrate these renewable resources
and meet RPS mandates and other state-wide goals. Because many state and provincial renewable requirements must be
fulfilled within the next five to 15 years, current siting and approval processes may create hurdles that could further impact
operational measures and procedures. Access to less transmission than planned may cause additional stress on the system,
particularly during periods of high demand, but also when other transmission is out of service for maintenance.
Stakeholders within the electric industry continually assess the ability of their internal transmission systems and
interconnections with other systems to meet not only regional requirements but also to meet compliance with NERC
Reliability Standards. Once a set of transmission alternatives has been identified, the project can take 10 or more years to
complete, from project identification to final certification and energization. A majority of the time in this process is devoted
to the siting, permitting, and land acquisition process, which has no definitive time frame and can vary greatly depending
on the geographic location of proposed additions.
Based on the 2013LTRA reference case, a significant amount of transmission is planned to come into service during the next
10 years. Of the more than 21,800 miles projected to come into service, approximately, 7,500 miles (34 percent) is primarily
for integrating new renewable generation. However, there are ongoing hurdles that may prevent these plans from coming
to fruition. Several of these long-distance transmission lines serve as the foundation of the electricity grid’s renewable
energy backbone and will be critical for the integration and accommodation of VERs. For example, in a major step forward
for the first independent 500 kV transmission project in WECC, the Interior Department’s Bureau of Land Management
(BLM) issued a final environmental impact statement to the SunZia Southwest Transmission. SunZia consists of two 500 kV
transmission lines running between central New Mexico and central Arizona (approximately 500 miles). The two SunZia
lines will carry primarily renewable energy from new projects that will be built in those states to customers and markets
across the southwestern United States, including California, by 2017.
Interconnection-wide studies in WECC identify opportunities to improve development and optimization of needed
transmission infrastructure. During the next decade, WECC has the most transmission planned, and although transmission
lines are inherently longer in the Western Interconnection, more west-to-east transmission will be needed to support the
continued integration of VERs.
AGING INFRASTRUCTURE
Aging transmission system infrastructure has many challenges, such as the availability of spare parts, the obsolescence of
older equipment, the ability to maintain equipment due to outage scheduling restrictions, and the ability to keep pace with
technological advancements. Risk-based approaches for maintaining and replacing BPS facilities also incorporate resilience
planning. This includes maintaining spare equipment and restoration teams trained for fast response. Larger scale
“infrastructure revitalization” may be necessary in the future; however, with older generation retiring throughout the next
decade, the average age of BPS generation facilities will be relatively young. Implementation of any replacement strategy
and in-depth training programs requires additional capital investment, engineering and design resources, and construction
labor resources, all of which are in relatively short supply.
REGION/INTERCONNECTION-WIDE MODELING
Examining interconnection-wide phenomena is becoming a necessary practice that enables the industry to more effectively
address frequency response, inertial response, small-signal stability, extreme contingency impacts, and geomagnetic
disturbances. To support improved system performance and planning, validated models should accurately represent actual
equipment performance in simulations. All devices and equipment attached to the electric grid must be modeled to
accurately capture how that equipment performs under static and system disturbance conditions. Models provided for
Long-Term Reliability Challenges and Emerging Issues
NERC | 2013 Long-Term Reliability Assessment | December 2013
Page 48
equipment must be open-source and shareable across the interconnection to support its reliability. Such models cannot be
considered proprietary.
System modeling issues have been identified in several significant system events during the past two decades (the latest
being the Southwest Blackout). Issues cover the full gamut of the system (i.e., transmission, generation, loads, protection)
and, more importantly, the interaction between all components. NERC has advanced the development of appropriate
modeling standards, and the industry as a whole has begun addressing various pieces and parts of the modeling issues.
While the industry continues to address various modeling issues, the most significant current risk is the lack of centralized
coordination and oversight of the many efforts. Without a centralized entity overseeing all the individual efforts, the risk is
duplicity in effort, lack of reaching industry consensus, and the use of invalid data input. Additionally, planning and
operations models that use different representations (for instance, node-breaker models vs. bus-branch models) lead to
inconstant understanding of contingencies and duplication of modeling efforts, both of which may lead to inaccurate
prediction of power system behavior.
POTENTIAL OPERATIONAL RISKS ASSOCIATED WITH INTERACTION OF SPECIAL PROTECTION SYSTEMS/REMEDIAL ACTION SCHEMES
Special Protection Systems (SPS) and Remedial Action Schemes (RAS) provide alternatives to the addition of new
transmission facilities. System operators need to be aware and informed of the SPS and RAS devices in service, as well as
the corresponding impacts associated with these devices. The possible lack of modeling requirements and real-time analysis
capabilities of an SPS/RAS reduces the planners’ and operators’ capability to evaluate the reliability impact that these tools
bring into the system. These tools also had important implications during the Southwest outage in September 2011.57
Accordingly, the objectives of this emerging issue are to: (1) evaluate historical and future trends in SPS application and
deployment; (2) identify limitations of SPS deployment; (3) propose a framework for assessing SPS risks; and (4) propose
modeling and assessment improvements.
GLOBAL SUPPLY CHAINS AND FUEL RELIABILITY
Reliance on global supply chains for fuel and other products used to generate electricity must be managed with a common
goal of reducing the risk of a prolonged disruption. The electric industry has a reputation for being risk averse; therefore,
discrete or short disruptions in the supply chain are less likely to cause great issue—operational and strategic plans are
often put in place to deal with a low-occurrence event. However, large and prolonged supply chain impacts could disrupt
electricity production, which would therefore cause significant reliability concerns. The current constructs of global supply
chains are of specific concern. Some examples include political uncertainty, instability of nation-states, and weak ties to
North American foreign affairs. There are additional concerns regarding liquefied natural gas imports from the Middle East;
however, the current supply of domestic natural gas has greatly reduced this risk.
COORDINATED CYBER OR PHYSICAL ATTACKS ON ELECTRICITY INFRASTRUCTURE
One of the principal types of High-Impact, Low-Frequency (HILF) events facing the BPS is a concerted, well-planned cyber,
physical, or blended attack conducted by an active adversary against multiple points on the system. Such an attack, though
as of yet never experienced in North America, could damage or destroy key system components, significantly degrade
system operating conditions, and, in extreme cases, result in prolonged outages to large parts of the system. The rapid
convergence of the electric power system’s infrastructure with information and communications technologies, combined
with a new awareness of the sophistication of adversary capabilities, requires a fresh understanding of the risk and
subsequent well-coordinated steps needed to improve the protection, resilience, and response capabilities of the BPS.
From a BPS resilience and operations perspective, ensuring the grid has the ability to recover from a widespread,
coordinated cyber attack is of critical importance.
57 NERC Southwest Blackout Event Reports

FRCC
NERC | 2013 Long-Term Reliability Assessment | December 2013
Page 49
FRCC The Florida Reliability Coordinating Council’s (FRCC) membership includes 30 Regional Entity Division and 24 Member Services Division members composed of investor-owned utilities (IOUs), cooperative systems, municipal utilities, power marketers, and independent power producers. FRCC is divided into 10 Balancing Authorities with 68 registered entities (both members and nonmembers) performing the functions identified in the NERC Reliability Functional Model and defined in the NERC Reliability Standards. The Region contains a population of over 16 million people and has a geographic coverage of about 50,000 square miles over peninsular Florida.
Planning Reserve Margins
FRCC-Summer 2014 2015 2016 2017 2018 2019 2020 2021 2022 2023ANTICIPATED 27.76% 27.97% 28.30% 26.46% 26.36% 24.30% 23.50% 23.14% 24.62% 24.28%PROSPECTIVE 43.65% 41.72% 38.32% 36.36% 37.23% 35.54% 36.87% 35.44% 37.29% 37.29%ADJUSTED POTENTIAL 43.65% 41.72% 38.32% 36.36% 37.23% 35.54% 36.87% 35.44% 37.29% 37.29%NERC REFERENCE - 14.99% 14.99% 14.99% 14.99% 14.99% 14.99% 14.99% 14.99% 14.99% 14.99%
FRCC-Winter 2014 2015 2016 2017 2018 2019 2020 2021 2022 2023ANTICIPATED 36.83% 33.05% 36.14% 30.78% 33.77% 29.95% 34.01% 33.47% 33.88% 33.88%PROSPECTIVE 49.85% 45.99% 45.77% 43.56% 44.71% 42.86% 46.38% 45.68% 46.22% 46.22%ADJUSTED POTENTIAL 49.85% 45.99% 45.77% 43.56% 44.71% 42.86% 46.38% 45.68% 46.22% 46.22%NERC REFERENCE - 14.99% 14.99% 14.99% 14.99% 14.99% 14.99% 14.99% 14.99% 14.99% 14.99%Summer Winter
0%
10%
20%
30%
40%
50%
2014 2015 2016 2017 2018 2019 2020 2021 2022 2023
0%
10%
20%
30%
40%
50%
2014 2015 2016 2017 2018 2019 2020 2021 2022 2023
Cumulative 10-Year Planned Capacity Change
-1012345678
2014 2015 2016 2017 2018 2019 2020 2021 2022 2023
GW
2013 Existing 2023 Planned 2023 Planned & Conceptual
FRCC Capacity
(MW) Share
(%) Capacity
(MW) Share
(%) Change
(MW) Capacity
(MW) Share
(%) Change
(MW)
Coal
8,434 16.2%
7,580 12.9% -854
7,580 12.9% -854
Petroleum
7,646 14.7%
8,173 13.9% 527
8,173 13.9% 527
Gas
32,054 61.6%
37,528 63.8% 5,474
37,528 63.8% 5,474
Nuclear
3,471 6.7%
4,691 8.0% 1,220
4,691 8.0% 1,220
Hydro
44 0.1%
44 0.1% 0
44 0.1% 0
Pumped Storage
0 0.0%
0 0.0% 0
0 0.0% 0
Geothermal
0 0.0%
0 0.0% 0
0 0.0% 0
Wind
0 0.0%
0 0.0% 0
0 0.0% 0
Biomass
383 0.7%
762 1.3% 379
762 1.3% 379
Solar
8 0.0%
16 0.0% 7
16 0.0% 7
TOTAL 52,040 100.0% 58,793 100.0% 6,753 58,793 100.0% 6,753

FRCC
NERC | 2013 Long-Term Reliability Assessment | December 2013
Page 50
Demand, Resources, and Planning Reserve Margins
The Florida Public Service Commission requires a 15 percent reserve margin criteria for non-investor-owned utilities and a
20 percent reserve margin criteria for IOUs (applied as 15 percent for the NERC Reference Margin Level). Based on the
expected load and generation capacity, the projected reserve margin is above 23 percent for all seasons during the
assessment period.
Compared to the 2012LTRA reference case, FRCC is projecting a small decrease in the peak demands for summer and
winter. This is mainly attributed to lower-than-expected consumption and decreased economic activity in FRCC.
DR from interruptible and load management programs within FRCC is treated as a load modifier and is relatively constant at
approximately 7 percent and 6.6 percent of the summer and winter total peak demands, respectively, for all years of the
planning horizon.
FRCC recently conducted a study to identify the impact of the potential retirement of two coal-fired units (totaling over 900
MW) that a site would retire in order to achieve compliance with the EPA Mercury Air Toxics Standards (MATS) set to
become effective in 2015. In addition, an 800-MW unit at the same site was announced to be retired due to a prolonged
maintenance outage; however, this capacity was excluded from the reserve margin calculations in prior assessments. In
large part due to equipment modernizations, several plants in FRCC are (or will be) undergoing capacity uprates (totaling
817 MW during the summer and 976 MW during the winter) in the near-term horizon. Short-term activation of offline
capacity staged in Inactive Reserves58 mitigated any potential impacts from the temporary removal of the generation. As a
result, the Planning Reserve Margins will be maintained during all peak seasons.
To ensure that the inherent uncertainty associated with variability in the nonfirm output is minimized, only the contractual
firm capacity from intermittent or energy-limited resources is included in the calculation of seasonal reserve margins. FRCC
expects variable resources to grow by 2.88 percent by the end of the long-term planning horizon; no operational changes
are needed to accommodate their integration.
Through 2015, 1,340 MW of generation are available under firm contract to be imported from SERC-SE into FRCC.
Approximately 840 MW more of FRCC member-owned generation is dynamically dispatched out of southern SERC-SE.
These purchases have firm transmission service to ensure deliverability into FRCC. While FRCC does not rely on external
resources for emergency imports and reserve sharing, there are emergency power contracts in place between SERC
members and FRCC entities.
FRCC has 143 MW of generation under firm contract to be exported only during the summer season into the SERC-SE
assessment area through 2020. These sales have firm transmission service to ensure deliverability.
Transmission and System Enhancements
FRCC recently conducted a study to identify the potential impact of multiple generation retirements. The study identified
the need to develop remedial actions depending on system conditions in the near-term until permanent solutions are
further investigated and implemented. FRCC has plans for 41 new BES transmission projects (399 miles), 13 BES rebuild
projects (102 miles), and 19 BES reconductor projects (138 miles). These projects are primarily related to expansion needed
to serve forecasted growing demand in certain local areas and maintain the long-term reliability of the BES.
During this assessment period, there are no foreseen project delays that would keep planned transmission facilities with an
impact on long-term reliability from meeting the in-service date. Temporary service outages required for construction will
be performed during off-peak seasonal conditions and studied in the operations horizon. No significant substation
equipment (i.e., static var compensators (SVCs), flexible alternating-current transmission systems (FACTS) controllers, high-
voltage direct current (HVdc), etc.) additions are expected through 2023.
58 Classified by NERC as Inoperable Resources.
FRCC
NERC | 2013 Long-Term Reliability Assessment | December 2013
Page 51
There is no change to the approximately 1,020 MW of under-voltage load shedding (UVLS) programs within FRCC; most are
designed to respond to localized low-voltage conditions potentially caused by multiple contingency events. FRCC does not
plan to install any additional Special Protection Systems (SPSs) during the study horizon. However, ongoing generation
retirement studies may identify the need for additional SPSs until permanent transmission and generation projects are
constructed.
Entities in FRCC continue to evaluate new technologies, such as FACTS devices and high-temperature conductors, to
address specific transmission conditions or issues. Presently, there are several transmission lines constructed with high-
temperature conductors within the FRCC Region. However, at this time there are no FACTS devices installed within the
Region. FRCC TOs are considering enhancements to existing transmission planning tools (e.g., enhancements to existing
software, new software, etc.) to address the expected planning needs of the future.
Long-Term Reliability Issues
The FRCC Region recently conducted a study identifying the impacts of the retirement of two generators (915 MW) starting
in April 2015 to comply with the EPA’s MATS. These two units, combined with the recent retirement of an 825 MW unit at
the same site, total 1,740 MW. The regional study determined that the required retirements do have an impact on the BES
transmission system and demonstrated the need to extend the retirement date of these units, to allow sufficient time to
construct transmission projects in order to maintain the reliability of the BES within the FRCC Region.
The Florida Electric Power Coordinating Group’s (FCG) Environmental Committee was actively involved in petitioning for
judicial review of EPA’s final Cross-State Air Pollution Rule (CSAPR), which was to take effect on January 1, 2012. On August
21, 2012, the court vacated the rule. The EPA appealed the court’s ruling to the U.S. Supreme Court, but the court has not
yet decided whether to hear the case. It is unknown what regulatory program may be developed to replace CSAPR, but, for
the near term, CSAPR’s predecessor (the Clean Air Interstate Rule (CAIR)) will continue to be implemented. The EPA’s MATS
became effective on April 16, 2012, and require compliance within three years, with the possibility of a one- or two-year
extension under specific circumstances.
In 2010, the EPA issued national emission standards for hazardous air pollutants (NESHAP) for existing compression ignition
reciprocating internal combustion engines (RICE) (i.e., diesel generators), which must comply with the rule beginning May 3,
2013. The RICE NESHAP imposes stringent emission limits and other requirements on nonemergency RICE. As amended in
January 2013, it also imposes hourly limits on the operation of emergency RICE in nonemergency situations, including for
emergency DR, local system reliability, peak shaving (not allowed at all after May 3, 2014), and other nonemergency
operation. The full impact that CSAPR and its replacement rule, MATS, and the RICE NESHAP will have on the long-range
reliability of the BES in the FRCC Region is still unknown.

MISO
NERC | 2013 Long-Term Reliability Assessment | December 2013
Page 52
MISO
Planning Reserve Margins
MRO-MISO-Summer 2014 2015 2016 2017 2018 2019 2020 2021 2022 2023ANTICIPATED 18.28% 12.13% 7.00% 6.29% 5.54% 4.86% 5.65% 4.90% 4.16% 3.44%PROSPECTIVE 23.35% 18.44% 15.82% 15.65% 15.16% 15.08% 15.79% 14.98% 14.17% 13.37%ADJUSTED POTENTIAL 24.55% 20.94% 21.12% 21.82% 21.65% 22.18% 22.85% 21.98% 21.13% 20.28%NERC REFERENCE - 14.20% 14.20% 14.20% 14.20% 14.20% 14.20% 14.20% 14.20% 14.20% 14.20%
MRO-MISO-Winter 2014 2015 2016 2017 2018 2019 2020 2021 2022 2023ANTICIPATED 43.22% 35.35% 29.59% 28.55% 27.58% 26.70% 27.39% 26.34% 25.41% 24.44%PROSPECTIVE 49.36% 42.97% 40.27% 39.87% 39.21% 39.05% 39.63% 38.48% 37.46% 36.39%ADJUSTED POTENTIAL 50.81% 45.98% 46.70% 47.33% 47.05% 47.63% 48.13% 46.92% 45.83% 44.70%NERC REFERENCE - 14.20% 14.20% 14.20% 14.20% 14.20% 14.20% 14.20% 14.20% 14.20% 14.20%Summer Winter
0%
5%
10%
15%
20%
25%
2014 2015 2016 2017 2018 2019 2020 2021 2022 2023
0%
10%
20%
30%
40%
50%
2014 2015 2016 2017 2018 2019 2020 2021 2022 2023
Cumulative 10-Year Planned Capacity Change
-10
-8
-6
-4
-2
0
2
4
2014 2015 2016 2017 2018 2019 2020 2021 2022 2023
GW
2013 Existing 2023 Planned 2023 Planned & Conceptual
MISO Capacity
(MW) Share
(%) Capacity
(MW) Share
(%) Change
(MW) Capacity
(MW) Share
(%) Change
(MW)
Coal
59,771 56.3%
51,156 51.9% -8,615
51,156 48.8% -8,615
Petroleum
2,401 2.3%
2,401 2.4% 0
2,401 2.3% 0
Gas
31,798 30.0%
30,451 30.9% -1,346
35,687 34.1% 3,890
Nuclear
7,455 7.0%
9,007 9.1% 1,552
9,007 8.6% 1,552
Hydro
725 0.7%
891 0.9% 166
895 0.9% 170
Pumped Storage
2,308 2.2%
2,723 2.8% 415
2,723 2.6% 415
Geothermal
0 0.0%
0 0.0% 0
0 0.0% 0
Wind
1,122 1.1%
1,423 1.4% 301
2,311 2.2% 1,189
Biomass
509 0.5%
557 0.6% 48
557 0.5% 48
Solar
0 0.0%
0 0.0% 0
0 0.0% 0
TOTAL 106,087 100.0% 98,608 100.0% -7,480 104,736 100.0% -1,352
The Midcontinent Independent System Operator, Inc. (MISO) is a not-for-profit, member-based organization administering wholesale electricity markets that provide customers with valued service, reliable and cost-effective systems and operations, dependable and transparent prices, open access to markets, and planning for long-term efficiency. MISO manages energy and operating reserves markets, which consists of 12 BAs, including the MISO BA (reliability), 28 local BAs, and 362 market participants, who serve approximately 48 million people. This section assesses the reliability of this market area—consisting of seven Local Resource Zones (LRZs)—during the next 10 years. MISO developed LRZs to reflect the need for an adequate amount of Planning Resources located in the right physical locations within MISO to reliably meet demand and loss-of-load expectation (LOLE) requirements.

MISO
NERC | 2013 Long-Term Reliability Assessment | December 2013
Page 53
Demand, Resources, and Planning Reserve Margins
MISO BOUNDARY CHANGE
MISO is expanding its reliability and market areas into the South, with six Entergy operating companies, Cleco, and South
Mississippi Electric Power Association (SME) working toward full integration into MISO’s market operations by December
2013. Two additional Local Resource Zones (LRZs) will come out of this expansion. LRZ #8 consists of Entergy Arkansas and
Arkansas Electric Cooperative Corporation (AECC), and LRZ #9 consists of all other integrating entities. MISO plans on
assuming reporting responsibilities for the southern MISO Region in next year’s (i.e., 2014) assessments. However, in this
year’s assessments, the SERC-W Assessment Area is reporting for the majority of LRZs #8 and #9, with a portion of LRZ #9,
Louisiana, being reported by the SPP Assessment Area (Cleco, Lafayette Utilities System, and Louisiana Energy and Power
Authority).
Addition of MISO Southern Region LRZs (Right)
The MISO Reference Margin Level59 is 14.2 percent and remains constant throughout the 10-year assessment period.60
Through the MISO stakeholder process, it was determined that a one-day-in-10-year LOLE is an acceptable risk level for
planning. Approximately 54.0 percent of this reserve level is for managing system outages, while the remaining 44.0
percent is utilized for managing LFU and OMC events. If MISO Midwest’s system had enough planning resources to meet its
14.2 percent requirement (i.e., one-day-in-10-years LOLE), MISO would initiate an EEA Level 2b event to access LMRs or rely
on non-Planning Resources,61 such as nonfirm imports or energy-only resources, nearly 100 percent of the daily peak hours
during the summer season, and would accept the annual risk of a 7.8 percent chance of shedding firm load on peak. The
waterfall chart below breaks the 14.2 requirement into its operating components and illustrates how the Planning Reserve
Margin (NERC Reference Margin Level) manages risk.
59 Planning Reserve Margin (PMR) is the reserve margin target level (in percent form) that represents the reserve percentage the MISO system
must hold above its applicable demand to meet a reliability criterion of one-day-in-10-years LOLE (2013 LOLE Study Report). MISO conducts an LOLE study to determine the next planning year’s PMR on an annual basis. MISO’s Planning Reserve Margin is on an installed capacity basis for planning year 2013–2014, which runs from June 1, 2013 through May 31, 2014.
60 The purpose of the Planning Reserve Margin is to have enough installed capacity on the system to manage uncertainties such as differences in the load forecast versus actual load (e.g., LFU, system outages, and Outside Management Control (OMC) events (tornados, lightning strikes, etc.)). MISO allows Load-Serving Entities (LSEs) to register DSM programs, such as Direct Control Load Management (DCLM), interruptible load programs, and behind-the-meter generation, to meet MISO’s Planning Reserve Margin. MISO refers to these DSM programs and behind-the-meter generation resources as Load-Modifying Resources (LMRs), which are only accessible to MISO during a NERC Energy Emergency Alert (EEA) Level 2b per MISO’s Emergency Operating Procedures. For more information, see MISO’s Emergency Operating Procedures.
61 Per Module E of MISO’s Tariff, a Capacity Resource meets all qualifications to be eligible to meet an LSE’s Planning Reserve Margin requirement.

MISO
NERC | 2013 Long-Term Reliability Assessment | December 2013
Page 54
MISO Midwest Region Planning Reserve Margin by Operating Components and Percent Chance of NERC Energy Emergency Alert Events62
Based on MISO’s current awareness of projected retirements and the resource plans of its membership, Planning Reserve
Margins will erode over the course of the next couple of years and will not meet the 14.2 percent requirement. The impacts
of environmental regulations and economic factors contribute to a potential shortfall of 6,750 MW, or a 7.0 percent
Anticipated Reserve Margin (7.2 percentage points below the Reference Margin Level) by summer 2016. Accordingly,
Existing-Certain resources are projected to be reduced by 10,382 MW due to retirement and suspended operation.
MISO Anticipated Reserve Margins by Year with Calculation Components63 2014 2015 2016 2017 2018 2019 2020 2021 2022 2023
NERC Ref. Margin Level (%) 14.20% 14.20% 14.20% 14.20% 14.20% 14.20% 14.20% 14.20% 14.20% 14.20%
Net Internal Demand (MW) 92,331 93,017 93,703 94,390 95,076 95,763 96,449 97,136 97,822 98,508
Requirement (MW) 105,442 106,225 107,009 107,793 108,577 109,361 110,145 110,929 111,713 112,497
Anticipated Resources (MW) 109,211 104,298 100,260 100,329 100,342 100,414 101,896 101,896 101,896 101,896
Reserve Margin (MW) 16,880 11,281 6,556 5,939 5,266 4,651 5,447 4,760 4,074 3,387
Reserve Margin (%) 18.30% 12.10% 7.00% 6.30% 5.50% 4.90% 5.60% 4.90% 4.20% 3.40%
The next waterfall chart breaks down the incremental changes in capacity from 2013 Existing-Certain Capacity Resources to
2016 Anticipated Capacity Resources. The graphic also breaks down 2013 Total Internal Demand to 2013 Net Internal
Demand (net 4 GW of DSM). Finally, the graphic shows the 2016 requirement (92 GW grown annually at 0.8 percent and
multiplied by 1.142 percent) and the potential shortfall in GW (2016 Anticipated Resources minus 2016 Planning Reserve
Margin Requirement).
62 Modeled as if system resources only equaled requirement. 63 As of September 9, 2013.

MISO
NERC | 2013 Long-Term Reliability Assessment | December 2013
Page 55
MISO Midwest Region Anticipated Reserves Shortfall64
At a 7.0 percent Anticipated Reserve Margin in 2016, MISO does not have enough Planning Resources to effectively manage
risk associated with load uncertainty and system outages and has an 87.0 percent chance of shedding firm load on 2016
peak. However, this assumes MISO would not be able to benefit from its diversity with neighboring systems through
nonfirm capacity imports or any of its energy-only resources on peak (non-Planning Resources). Historically, neighboring
systems have provided MISO with an additional 4,500 MW of nonfirm external support on peak; however, given future
external capacity uncertainty, MISO derates the 4,500 MW by 50.0 percent to 2,250 MW of nonfirm imports. Also, MISO
has 2,124 MW of Existing-Other Energy-Only resources in its generation fleet, which may be available to serve MISO load on
peak. MISO would need to rely on the majority of its non-Planning Resources and LMRs on peak to mitigate the high risk of
shedding firm load. The waterfall chart below breaks the 7.0 percent Anticipated Reserve Margin into its operating
components and illustrates how real-time operations would have to manage increasing risk.
64 Based on 0.8% Load Growth and 14.2% PRM; as of September 9, 2013.

MISO
NERC | 2013 Long-Term Reliability Assessment | December 2013
Page 56
MISO Midwest Region 2016 Anticipated Reserve Margin Percent Chance of Utilizing Non-Planning Resources and Initiating NERC Energy Emergency Alert Events65
POTENTIAL MITIGATION OF ERODING RESERVES AND ADDITIONAL UNCERTAINTIES
MISO and Organization of MISO States (OMS) are conducting a joint survey of LSEs to bridge the gap of limited visibility that
exists between the annual Module E Tariff process and Forward Resource Assessment. MISO needs more granular data with
respect to DSM growth and resource procurement to conduct Forward Resource Assessment and more accurately predict
reserve margins in later years. MISO will not disseminate individual LSE data but will use the data for MISO system-level
assessments and to support individual state jurisdictional Integrated Resource Planning requirements, where applicable.66
The potential exists to mitigate some—or all of—the projected 2016 shortfall by assessing key components of the projected
Anticipated Reserve Margin including, but not limited to, the potential for more Future-Planned additions, the potential for
growth in DSM, the additional support anticipated from the MISO Southern Region, the potential for transmission upgrades
to mitigate current generation deliverability constraints, and the potential for transmission upgrades to convert current
energy-only resources to network resources.
Per NERC’s definition that a Future-Planned Capacity addition be a designated Network Resource expected to be in service
in a related out year and, where applicable, included in a state Integrated Resource Plan, MISO only counts those Generator
Interconnection Queue projects being studied for Network Resource Interconnection Service (NRIS) with signed Generator
Interconnection Agreements that are actively participating in MISO’s post-queue process. Therefore, MISO’s Future-
Planned Capacity additions equal 1,267 MW of the total 2016 Anticipated Capacity Resources. MISO also considers an
additional 1,737 MW of other queue study statuses that require significant financial obligations to be expected by 2016,
which increases the 2016 Anticipated Reserve Margin by 1.9 percentage points to an 8.9 percent MISO Expected Reserve
Margin, or a potential shortfall of 5,103 MW.
Per individual state mandates, MISO’s current 2013 noncontrollable DR totaling 1,489 MW may grow to 1,561 MW by 2016,
an increase of 72 MW. MISO’s current 2013 Energy Efficiency programs totaling 208 MW may grow to 1,294 MW by 2016,
an increase of 1,086 MW. Assuming that none of this growth is embedded in MISO’s 10-year Total Internal Demand
65 As of August 9, 2013. 66 Joint MISO-OMS Long-Term Resource Adequacy Survey Presentation.

MISO
NERC | 2013 Long-Term Reliability Assessment | December 2013
Page 57
forecasts and that the incremental DSM registers as an LMR per Module E of MISO’s Tariff, this incremental growth
increases the 2016 Anticipated Reserve Margin by 1.4 percentage points.
The MISO 2013 Summer Coordinated Seasonal Transmission Assessment analyzed a high South–North transfer from MISO
Southern Region into MISO Midwest Region LRZs #4 and #6 (i.e., Illinois and Indiana). The analysis indicates an interregional
transfer capability of at least 1,400 MW.67 The assumption of an additional 1,400 MW from the Southern Region into the
Midwest Region increases the 2016 Anticipated Reserve Margin by 1.5 percentage points.
MISO’s generation fleet contains 1,471 MW of Existing-Other transmission-limited resources based on generation
deliverability test results. Transmission limitations of 1,236 MW in aggregate are generator units limited by 10 MW or more.
Assuming the applicable network upgrades are done by 2016 to mitigate these 1,236 MW of transmission limitations, the
2016 Anticipated Reserve Margin increases by 1.3 percentage points.
MISO’s generation fleet contains 2,124 MW of Existing-Other energy-only resources with no firm point-to-point
transmission. Assuming the applicable network upgrades are done by 2016 to convert these energy-only resources to
network resources, the 2016 Anticipated Reserve Margin increases by 2.3 percentage points.
The waterfall chart below presents the potential measures that could completely mitigate the projected shortfall in 2016. It
should be noted that uncertainty factors for each potential measure are unknown at this time. MISO expects to gain further
certainty through the joint MISO/OMS survey and the Forward Resource Assessment.
MISO Midwest Region 2016 Anticipated Resource Shortfall Potential Mitigation Measures68
Future sensitivities regarding uncertainty in load forecasts and the impact of potential fuel supply limitations on resource
adequacy are discussed in the Long-Term Reliability Issues section of this report. Further enhancements to current LOLE
models are being studied to better project risks associated with lack of fuel for power generation and monthly variations in
load forecasts, which would influence more accurate portrayal of future reserve margins. These studies are ongoing and
expected to be revised for the next long-term assessment.
Per Module E of MISO’s tariff, LSEs submit an annual peak demand forecast coincident to MISO’s time of peak for use in
MISO’s annual Planning Resource Auction. Section 3.2 of MISO’s Resource Adequacy Business Practice Manual69 and the
67 MISO 2013 Summer Coordinated Seasonal Transmission Assessment section 8.12. 68 As of August 9, 2013. 69 BPM 011- Resource Adequacy.

MISO
NERC | 2013 Long-Term Reliability Assessment | December 2013
Page 58
Peak Forecasting Methodology white paper70 provide assumptions and methodologies for calculating MISO coincident
peaks. Starting November 1 and concluding March 1 annually, MISO undergoes a review of all forecasts. The summation of
all 2013 MISO peak demand forecasts (i.e., Total Internal Demand) totals 96,192 MW.71 The bar chart below shows MISO’s
Total Internal Demand by LRZ and the table shows MISO’s demand outlook.
MISO Midwest Region 2013 Total Internal Demand (Coincident) Peak Forecast by LRZ72
Per Module E of MISO’s tariff, LSEs also submit monthly peak demand forecasts for two years and an additional eight years’
worth of seasonal peak demand forecasts noncoincident to MISO’s peak. MISO uses these forecasts to calculate growth
rates for each of the seven LRZs. Based on these forecasts, MISO anticipates a system-wide growth rate of approximately
0.72 percent, causing Total Internal Demands of 96,879 MW and 103,056 MW in 2014 and 2023, respectively. From an LRZ
perspective, the highest load growths occur in LRZ #1 and LRZ #3 at 0.94 percent and 1.21 percent, respectively, and the
lowest load growths occur in LRZ #5 and LRZ #7 at 0.41 percent and 0.48 percent, respectively.
MISO LRZ Annual Percentage Growth Rates during the Assessment Period
LRZ 1 LRZ 2 LRZ 3 LRZ 4 LRZ 5 LRZ 6 LRZ 7
0.94% 0.75% 1.21% 0.69% 0.41% 0.67% 0.48%
In the Long-Term Reliability Issues section, MISO evaluates load forecast sensitivity impacts on the reserve margins. The
sensitivities include LFU, weather, and economic variability. For more information on load forecast assumptions and
methodology, see the Demand section of MISO’s Methodology and Assumptions document.
Interruptible load, DCLM, and Energy Efficiency resources are eligible to participate in the Planning Resource Auction as
registered LMRs.73 Per MISO’s Emergency Operating Procedures, LMR DSM is an emergency resource callable by MISO only
during a Maximum Generation Emergency Event Level 2b. As MISO’s visibility of future expansion of LMR DSM is low, MISO
assumes that the 4,548 MW that cleared in the 2013 Planning Resource Auction will be available throughout the
assessment period. The bar chart below shows each zone’s portion of MISO’s LMR DSM.
70 Peak Forecasting Methodology Review Whitepaper. 71 2013 MISO Coincident Load Forecasts; Slide 5 (PRMR Obligation divided by 1.062) 72 As of April 15, 2013. 73 See section 4.3 of the Resource Adequacy Business Practice Manual
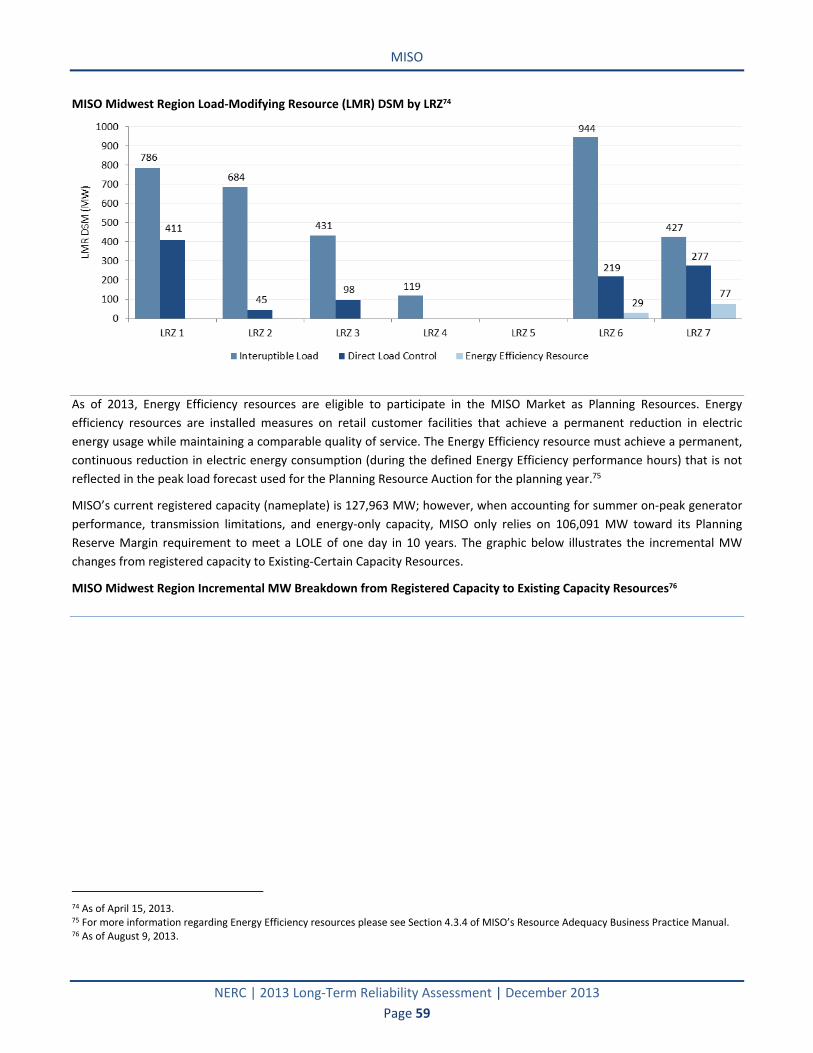
MISO
NERC | 2013 Long-Term Reliability Assessment | December 2013
Page 59
MISO Midwest Region Load-Modifying Resource (LMR) DSM by LRZ74
As of 2013, Energy Efficiency resources are eligible to participate in the MISO Market as Planning Resources. Energy
efficiency resources are installed measures on retail customer facilities that achieve a permanent reduction in electric
energy usage while maintaining a comparable quality of service. The Energy Efficiency resource must achieve a permanent,
continuous reduction in electric energy consumption (during the defined Energy Efficiency performance hours) that is not
reflected in the peak load forecast used for the Planning Resource Auction for the planning year.75
MISO’s current registered capacity (nameplate) is 127,963 MW; however, when accounting for summer on-peak generator
performance, transmission limitations, and energy-only capacity, MISO only relies on 106,091 MW toward its Planning
Reserve Margin requirement to meet a LOLE of one day in 10 years. The graphic below illustrates the incremental MW
changes from registered capacity to Existing-Certain Capacity Resources.
MISO Midwest Region Incremental MW Breakdown from Registered Capacity to Existing Capacity Resources76
74 As of April 15, 2013. 75 For more information regarding Energy Efficiency resources please see Section 4.3.4 of MISO’s Resource Adequacy Business Practice Manual. 76 As of August 9, 2013.
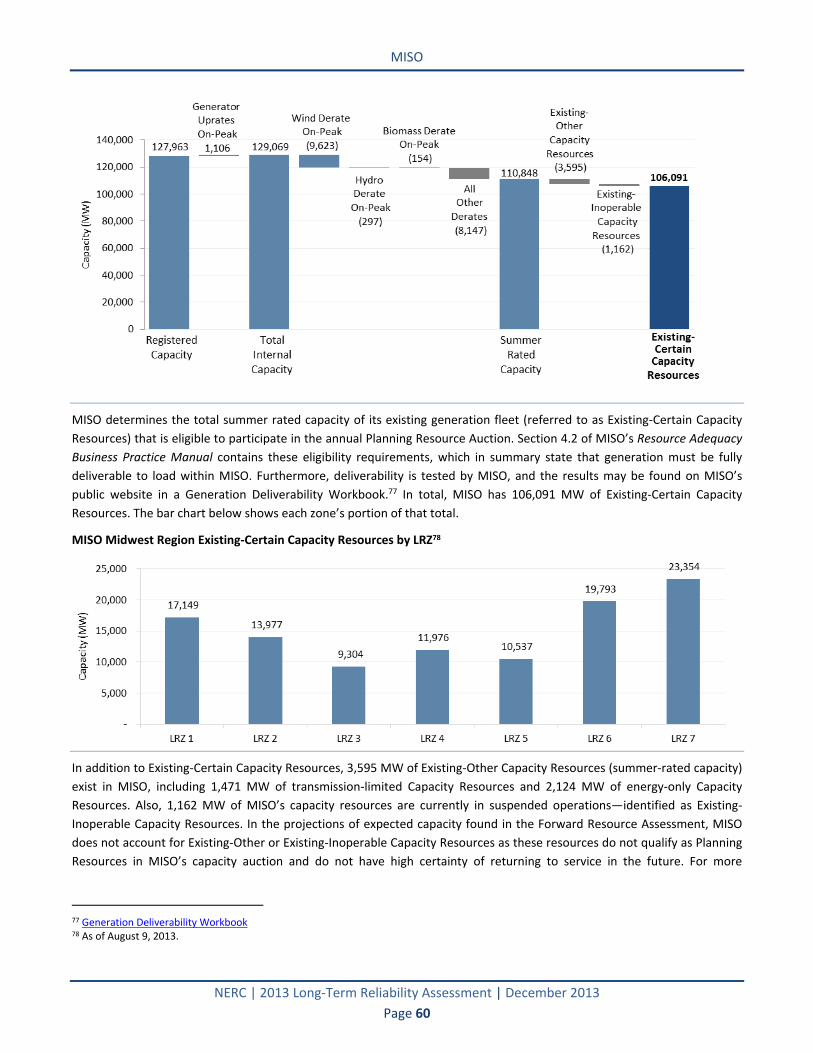
MISO
NERC | 2013 Long-Term Reliability Assessment | December 2013
Page 60
MISO determines the total summer rated capacity of its existing generation fleet (referred to as Existing-Certain Capacity
Resources) that is eligible to participate in the annual Planning Resource Auction. Section 4.2 of MISO’s Resource Adequacy
Business Practice Manual contains these eligibility requirements, which in summary state that generation must be fully
deliverable to load within MISO. Furthermore, deliverability is tested by MISO, and the results may be found on MISO’s
public website in a Generation Deliverability Workbook.77 In total, MISO has 106,091 MW of Existing-Certain Capacity
Resources. The bar chart below shows each zone’s portion of that total.
MISO Midwest Region Existing-Certain Capacity Resources by LRZ78
In addition to Existing-Certain Capacity Resources, 3,595 MW of Existing-Other Capacity Resources (summer-rated capacity)
exist in MISO, including 1,471 MW of transmission-limited Capacity Resources and 2,124 MW of energy-only Capacity
Resources. Also, 1,162 MW of MISO’s capacity resources are currently in suspended operations—identified as Existing-
Inoperable Capacity Resources. In the projections of expected capacity found in the Forward Resource Assessment, MISO
does not account for Existing-Other or Existing-Inoperable Capacity Resources as these resources do not qualify as Planning
Resources in MISO’s capacity auction and do not have high certainty of returning to service in the future. For more
77 Generation Deliverability Workbook 78 As of August 9, 2013.

MISO
NERC | 2013 Long-Term Reliability Assessment | December 2013
Page 61
information on the basis of these supply category determinations, refer to the Generation section of MISO’s Methodology
and Assumptions document.
Based on the effective load-carrying capability of wind generation, MISO’s Existing Capacity wind resources receive a wind
capacity credit. The average wind capacity credit for MISO is 13.3 percent.79 Per section 4.2.2 of MISO’s Resource Adequacy
Business Practice Manual, all other variable generation resources receive unforced capacity ratings based on historical
summer performance.
Behind-the-meter generation is eligible to participate in the Planning Resource Auction as a registered LMR.80 LMR behind-
the-meter generation is an emergency resource callable by MISO only during a Maximum Generation Emergency Event Step
2b, per MISO’s Emergency Operating Procedures. Since MISO’s visibility of future expansion or reduction of behind-the-
meter generation is low, MISO assumes the 3,394 MW that cleared in the 2013 Planning Resource Auction will be available
throughout the assessment period, along with 152 MW of DR resources. The bar chart below shows each zone’s portion of
MISO behind-the-meter generation.
MISO Midwest Region Load Modifying Resources (LMR) Behind-the-Meter Generation (BTMG) by LRZ81
Largely due to new EPA rules, MISO anticipates the potential retirement and suspended operation of its older Base Load
generation fleet. During the last two years, approximately 1 GW of summer-rated capacity has been retired, and MISO is
projecting that 10,383 MW of Existing-Certain Capacity Resources will be retired or suspended by 2016.
On a quarterly basis, MISO sends an EPA survey to its asset owners to gauge the retrofit and retirement decisions of the
coal generation fleet due to environmental regulations and other economic factors. Asset owners also must submit a
completed Attachment Y82 to MISO at least six months prior to retiring or suspending operations of a resource. To ensure
no transmission issues result from the resource being decommissioned and to comply with section 6.2 of MISO’s
Transmission Planning Business Practice Manual,83 MISO will conduct a detailed System Support Resource (SSR) study. If
transmission constraints are identified, the generation resource must operate per the tariff and Business Practices Manual
(BPM) until said constraints are mitigated. If an asset owner wants MISO to perform a nonbinding study of reliability
impacts due to the potential retirement or suspension of a resource, that asset owner may submit an Attachment Y2. The
following waterfall chart breaks up the 10.3 GW of Existing-Certain Capacity Resource retirement and suspension by 2016
according to data source, whether it is the EPA survey, Attachment Y, or Attachment Y2.
79 2013 Wind Capacity Report 80 see section 4.3.2 of the Resource Adequacy Business Practice Manual 81 As of April 15, 2013. 82 Attachment Y of MISO’s Tariff. 83 BPM 020 Section 6.2.

MISO
NERC | 2013 Long-Term Reliability Assessment | December 2013
Page 62
The majority of the 6.3 GW of potential Existing-Certain Capacity Resource retirements are from coal-fired units (1 GW of
gas-fired units). Of the Attachment Y, Attachment Y2, and SSR contracts, 1.3 GW of potential Existing-Certain Capacity
Resource suspensions are from gas-fired units, while the remaining 2.7 GW are from coal-fired units.
Midwest Region 2016 Potential Retirements and Suspensions of Existing-Certain Capacity Resources by Data Source84
To date, MISO knows of approximately 1.2 GW of the Total Retirements that have been granted a one-year extension to
operate through April 2016. Through the EPA survey, MISO is working toward increasing its visibility on extension requests
past the compliance deadline of April 2015.
The Generator Interconnection Queue (GIQ) database posted on MISO’s public website lets generation customers and TOs
check the status of projects at any time.85 MISO conducts a thorough assessment of the GIQ to forecast future resource
additions and MW uprates to existing facilities during the 10-year planning horizon.
As of July 1, 2013, the GIQ contained 1,297 projects, although only 101 of these projects (totaling 19,550 MW of max
output) were identified by MISO as actively awaiting approval or construction to come into service within the assessment
period.86 Of the 19,550 MW Active Queue, 674 MW are uprates to existing facilities (170 MW coal, 420 MW hydro, and 84
MW nuclear). Over half of the Active Queue maximum output comes from wind projects in the queue totaling 9,857 MW.
The following chart breaks out the 19,550 MW by fuel type.
84 As of August 9, 2013. 85 Generator Interconnection Queue. 86 For more information on the assessment of the GIQ refer to the Generation section of MISO’s Methods and Assumptions document.
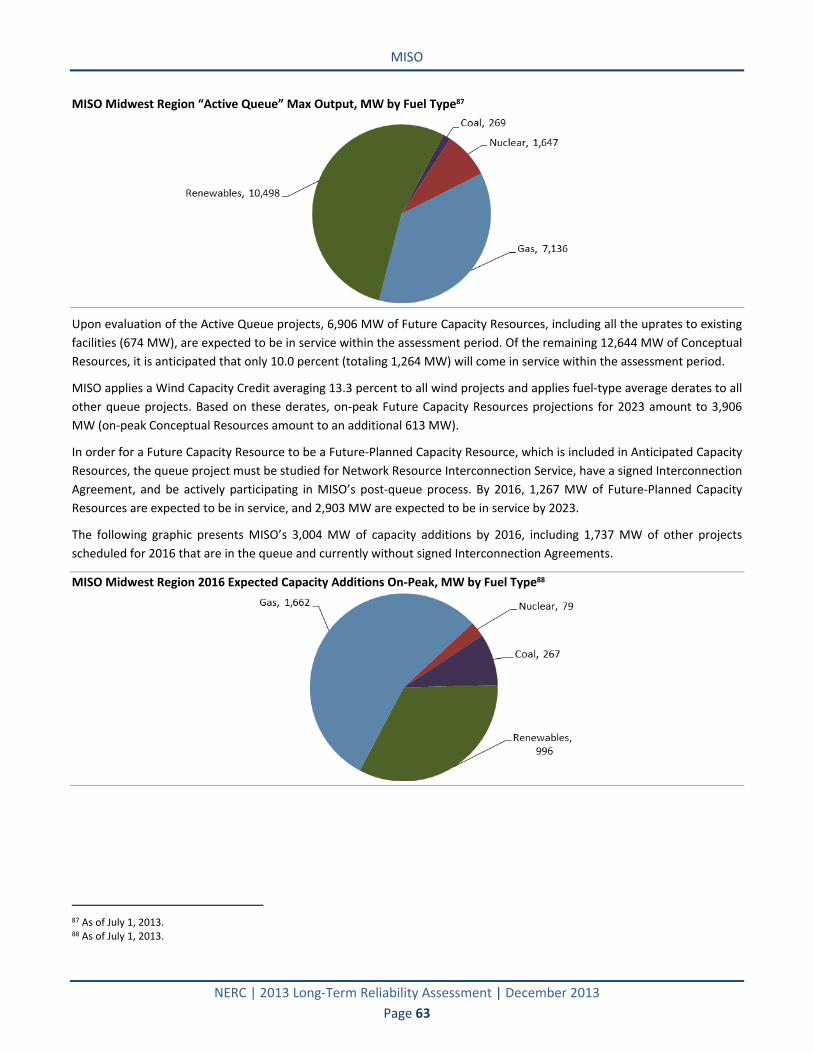
MISO
NERC | 2013 Long-Term Reliability Assessment | December 2013
Page 63
MISO Midwest Region “Active Queue” Max Output, MW by Fuel Type87
Upon evaluation of the Active Queue projects, 6,906 MW of Future Capacity Resources, including all the uprates to existing
facilities (674 MW), are expected to be in service within the assessment period. Of the remaining 12,644 MW of Conceptual
Resources, it is anticipated that only 10.0 percent (totaling 1,264 MW) will come in service within the assessment period.
MISO applies a Wind Capacity Credit averaging 13.3 percent to all wind projects and applies fuel-type average derates to all
other queue projects. Based on these derates, on-peak Future Capacity Resources projections for 2023 amount to 3,906
MW (on-peak Conceptual Resources amount to an additional 613 MW).
In order for a Future Capacity Resource to be a Future-Planned Capacity Resource, which is included in Anticipated Capacity
Resources, the queue project must be studied for Network Resource Interconnection Service, have a signed Interconnection
Agreement, and be actively participating in MISO’s post-queue process. By 2016, 1,267 MW of Future-Planned Capacity
Resources are expected to be in service, and 2,903 MW are expected to be in service by 2023.
The following graphic presents MISO’s 3,004 MW of capacity additions by 2016, including 1,737 MW of other projects
scheduled for 2016 that are in the queue and currently without signed Interconnection Agreements.
MISO Midwest Region 2016 Expected Capacity Additions On-Peak, MW by Fuel Type88
87 As of July 1, 2013. 88 As of July 1, 2013.

MISO
NERC | 2013 Long-Term Reliability Assessment | December 2013
Page 64
The following bar chart graphic breaks out MISO’s expected 2016 capacity additions (3,004 MW) by LRZ.
MISO Midwest Region 2016 Expected Capacity Additions by LRZ89
CAPACITY TRANSACTIONS
Imports – As stated in section 4.2.4 of the Resource Adequacy Business Practice Manual, external resources are eligible to
participate in the Planning Resource Auction as registered Capacity Resources. As the Region’s visibility of future expansion
or reduction of firm imports is low, MISO assumes the 3,103 MW that cleared in the 2013 Planning Resource Auction will be
available throughout the assessment period.
Exports – Based on information received from PJM, MISO projects 3,365 MW of firm exports into PJM by 2016.90 The chart
below shows net firm capacity transactions by LRZ.
MISO Midwest Region 2016 Expected Capacity Transactions by LRZ91
CHANGES IN MISO’S 2016 RESERVE MARGIN FORECASTS FROM PRIOR NERC LTRA REPORTS
In 2011, MISO conducted an independent analysis of the impact of four proposed EPA regulations the Region’s resource
adequacy. In October 2011, the EPA Impact Analysis white paper was published, and the results were summarized in the
89 As of July 1, 2013. 90 Of the 3,365 MW of projected firm exports, 2,278 MW have Transmission Service Requests (TSR), 867 MW have one firm path confirmed, and
220 are actively being studied in MISO and PJM. 91 As of April 15, 2013.

MISO
NERC | 2013 Long-Term Reliability Assessment | December 2013
Page 65
MISO Transmission Expansion Plan 2011 Report (MTEP). The study indicated that 12.6 GW of coal generation within MISO’s
footprint could potentially be retired as a direct result of the EPA regulations.
As the EPA regulations had not yet been finalized in 2011, the 12.6 GW of retirements were assessed in the MISO 2011LTRA
as a future sensitivity rather than as part of the 2013LTRA reference case. The 2011LTRA reference case without EPA
retirements indicated a 2016 reserve margin of 22.5 percent. The 2011LTRA reference case with EPA retirements indicated
a 2016 reserve margin of 10.1 percent, or a 3,750 MW shortfall, based on a 14.2 percent Planning Reserve Margin
requirement. In the 2011 assessment, MISO did not have information regarding firm sales out of MISO into PJM. Assuming
3,365 MW of sales from MISO into PJM (reported in 2011 for planning year 2016 and currently being reported), the 2016
reserve margin with EPA retirements would have been 6.5 percent, or a 7,115 MW shortfall based on a 14.2 percent
Planning Reserve Margin requirement.
Again, in the NERC 2012LTRA reference case, MISO did not report EPA-related retirements. However, the potential shortfall
in 2016 was identified as a sensitivity in the MISO Standing and Emerging Issues section of the 2012LTRA, in which MISO
projected a 9.7 percent Anticipated Reserve Margin, or a 4,103 MW shortfall based on a 14.2 percent Planning Reserve
Margin requirement. Keeping consistent with current forecasted firm sales into PJM for planning year 2016, the 2016
reserve margin would have been 6.0 percent, or a 7,468 MW shortfall based on a 14.2 percent Planning Reserve Margin
requirement. The following chart illustrates the evolution of the 2016 Anticipated Reserve Margin from 2011 to the current
projection in which EPA retirements have been moved from the sensitivity analysis to the reference case.
Evolution of 2016 Anticipated Reserve Margin (from 2011 to Present)92
92 Current as of August 9, 2013

MISO
NERC | 2013 Long-Term Reliability Assessment | December 2013
Page 66
Transmission and System Enhancements
MISO’s MTEP1293 recommends 242 new transmission expansion projects through 2022 for inclusion in its Appendix A and
eventual construction. This is part of a continuing effort to ensure a reliable and efficient electric grid that keeps pace with
energy and policy demands. The projects fall into the following four categories: (1) 31 Baseline Reliability Projects (BRPs)
(i.e., projects required to meet NERC Reliability Standards); (2) 23 Generator Interconnection Projects (GIPs) (i.e., projects
required to reliably connect new generation to the transmission grid); (3) 1 Market Efficiency Project (MEP) (i.e., a project
to reduce market congestion, as required by Attachment FF of the Tariff); (4) 187 Other projects (i.e., wide range of
projects, including those that support lower-voltage transmission systems or provide local economic benefit, but do not
meet the threshold to qualify as MEPs).
The following is a breakdown of MISO’s near-term transmission projects grouped by LRZ.
LRZ #1
Couderay–Osprey 161-kV line (Xcel Energy) – The project has an in-service date of December 2014.
During summer peak conditions, river conditions can be such that there is low or no hydro generation along the
Flambeau River. These conditions, in addition to load growth in the area, result in low voltages on the transmission
system for Category B outages.
LRZ #2
Green Bay–Morgan 345-kV line; Holmes–Escanaba 138-kV line (ATC) – The project has an in-service target of
January 2017.
A major loss-of-load event in northeastern Wisconsin and northwestern Michigan in May 2011 drew attention to
shifting supply-and-demand patterns and emerging reliability needs in the area. Multiple Category B and C
contingencies led to overloads and voltage instability on the five-year horizon and drove a package of projects
through an out-of-cycle study that terminated in August 2012. Those projects include:
o A new 345-kV Green Bay substation between North Appleton and Kewaunee,
o 40 miles of new 345 kV,
o 60 miles of new 138 kV, and
o Approximately 150 Mvar of new 138-kV reactive supply.
LRZ #3
Salix–Kellogg 161-kV line (MidAmerican Energy Co.) – The anticipated in-service date is June 2015.
For a common tower, Category C5, outage of the Raun–Sioux City 345-kV and the Raun–Morningside 161-kV lines
will overload the Raun–Interchange 161-kV line. Adding a new line from the Salix substation to the Kellogg
substation, both 161 kV, will mitigate the overload.
LRZ #4
Ameren Illinois is replacing more than 80 miles of its older 138-kV lines that were built with copper conductors.
These lines have integrity issues and were originally constructed in the 1940s. The new lines will have modern
ACSS conductors.
LRZ #6
Upgrades needed to accommodate the PJM Auction Revenue Rights (ARR) request.
Replace existing Burr Oak Substation Transformer (NIPSCO) with a 556 MVA 345/138-kV transformer. The
anticipated in-service date is March 2013.
93 https://www.misoenergy.org/Planning/TransmissionExpansionPlanning/Pages/MTEP12.aspx.
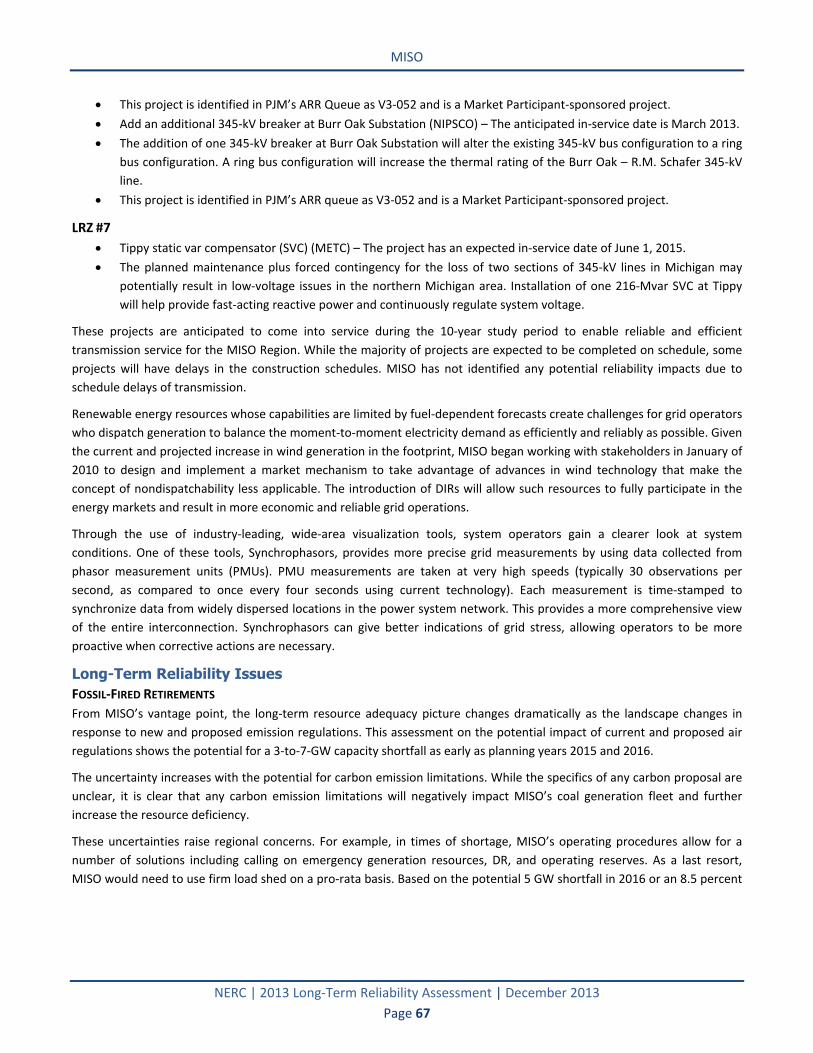
MISO
NERC | 2013 Long-Term Reliability Assessment | December 2013
Page 67
This project is identified in PJM’s ARR Queue as V3-052 and is a Market Participant-sponsored project.
Add an additional 345-kV breaker at Burr Oak Substation (NIPSCO) – The anticipated in-service date is March 2013.
The addition of one 345-kV breaker at Burr Oak Substation will alter the existing 345-kV bus configuration to a ring
bus configuration. A ring bus configuration will increase the thermal rating of the Burr Oak – R.M. Schafer 345-kV
line.
This project is identified in PJM’s ARR queue as V3-052 and is a Market Participant-sponsored project.
LRZ #7
Tippy static var compensator (SVC) (METC) – The project has an expected in-service date of June 1, 2015.
The planned maintenance plus forced contingency for the loss of two sections of 345-kV lines in Michigan may
potentially result in low-voltage issues in the northern Michigan area. Installation of one 216-Mvar SVC at Tippy
will help provide fast-acting reactive power and continuously regulate system voltage.
These projects are anticipated to come into service during the 10-year study period to enable reliable and efficient
transmission service for the MISO Region. While the majority of projects are expected to be completed on schedule, some
projects will have delays in the construction schedules. MISO has not identified any potential reliability impacts due to
schedule delays of transmission.
Renewable energy resources whose capabilities are limited by fuel-dependent forecasts create challenges for grid operators
who dispatch generation to balance the moment-to-moment electricity demand as efficiently and reliably as possible. Given
the current and projected increase in wind generation in the footprint, MISO began working with stakeholders in January of
2010 to design and implement a market mechanism to take advantage of advances in wind technology that make the
concept of nondispatchability less applicable. The introduction of DIRs will allow such resources to fully participate in the
energy markets and result in more economic and reliable grid operations.
Through the use of industry-leading, wide-area visualization tools, system operators gain a clearer look at system
conditions. One of these tools, Synchrophasors, provides more precise grid measurements by using data collected from
phasor measurement units (PMUs). PMU measurements are taken at very high speeds (typically 30 observations per
second, as compared to once every four seconds using current technology). Each measurement is time-stamped to
synchronize data from widely dispersed locations in the power system network. This provides a more comprehensive view
of the entire interconnection. Synchrophasors can give better indications of grid stress, allowing operators to be more
proactive when corrective actions are necessary.
Long-Term Reliability Issues
FOSSIL-FIRED RETIREMENTS
From MISO’s vantage point, the long-term resource adequacy picture changes dramatically as the landscape changes in
response to new and proposed emission regulations. This assessment on the potential impact of current and proposed air
regulations shows the potential for a 3-to-7-GW capacity shortfall as early as planning years 2015 and 2016.
The uncertainty increases with the potential for carbon emission limitations. While the specifics of any carbon proposal are
unclear, it is clear that any carbon emission limitations will negatively impact MISO’s coal generation fleet and further
increase the resource deficiency.
These uncertainties raise regional concerns. For example, in times of shortage, MISO’s operating procedures allow for a
number of solutions including calling on emergency generation resources, DR, and operating reserves. As a last resort,
MISO would need to use firm load shed on a pro-rata basis. Based on the potential 5 GW shortfall in 2016 or an 8.5 percent
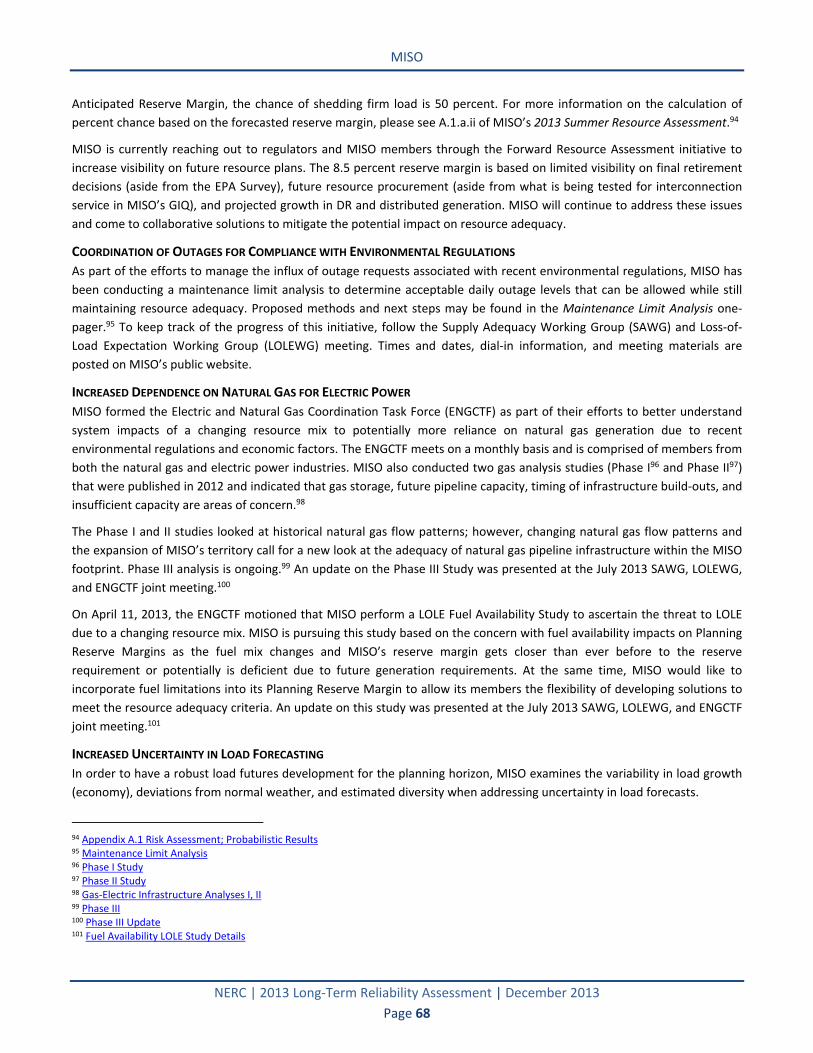
MISO
NERC | 2013 Long-Term Reliability Assessment | December 2013
Page 68
Anticipated Reserve Margin, the chance of shedding firm load is 50 percent. For more information on the calculation of
percent chance based on the forecasted reserve margin, please see A.1.a.ii of MISO’s 2013 Summer Resource Assessment.94
MISO is currently reaching out to regulators and MISO members through the Forward Resource Assessment initiative to
increase visibility on future resource plans. The 8.5 percent reserve margin is based on limited visibility on final retirement
decisions (aside from the EPA Survey), future resource procurement (aside from what is being tested for interconnection
service in MISO’s GIQ), and projected growth in DR and distributed generation. MISO will continue to address these issues
and come to collaborative solutions to mitigate the potential impact on resource adequacy.
COORDINATION OF OUTAGES FOR COMPLIANCE WITH ENVIRONMENTAL REGULATIONS
As part of the efforts to manage the influx of outage requests associated with recent environmental regulations, MISO has
been conducting a maintenance limit analysis to determine acceptable daily outage levels that can be allowed while still
maintaining resource adequacy. Proposed methods and next steps may be found in the Maintenance Limit Analysis one-
pager.95 To keep track of the progress of this initiative, follow the Supply Adequacy Working Group (SAWG) and Loss-of-
Load Expectation Working Group (LOLEWG) meeting. Times and dates, dial-in information, and meeting materials are
posted on MISO’s public website.
INCREASED DEPENDENCE ON NATURAL GAS FOR ELECTRIC POWER
MISO formed the Electric and Natural Gas Coordination Task Force (ENGCTF) as part of their efforts to better understand
system impacts of a changing resource mix to potentially more reliance on natural gas generation due to recent
environmental regulations and economic factors. The ENGCTF meets on a monthly basis and is comprised of members from
both the natural gas and electric power industries. MISO also conducted two gas analysis studies (Phase I96 and Phase II97)
that were published in 2012 and indicated that gas storage, future pipeline capacity, timing of infrastructure build-outs, and
insufficient capacity are areas of concern.98
The Phase I and II studies looked at historical natural gas flow patterns; however, changing natural gas flow patterns and
the expansion of MISO’s territory call for a new look at the adequacy of natural gas pipeline infrastructure within the MISO
footprint. Phase III analysis is ongoing.99 An update on the Phase III Study was presented at the July 2013 SAWG, LOLEWG,
and ENGCTF joint meeting.100
On April 11, 2013, the ENGCTF motioned that MISO perform a LOLE Fuel Availability Study to ascertain the threat to LOLE
due to a changing resource mix. MISO is pursuing this study based on the concern with fuel availability impacts on Planning
Reserve Margins as the fuel mix changes and MISO’s reserve margin gets closer than ever before to the reserve
requirement or potentially is deficient due to future generation requirements. At the same time, MISO would like to
incorporate fuel limitations into its Planning Reserve Margin to allow its members the flexibility of developing solutions to
meet the resource adequacy criteria. An update on this study was presented at the July 2013 SAWG, LOLEWG, and ENGCTF
joint meeting.101
INCREASED UNCERTAINTY IN LOAD FORECASTING
In order to have a robust load futures development for the planning horizon, MISO examines the variability in load growth
(economy), deviations from normal weather, and estimated diversity when addressing uncertainty in load forecasts.
94 Appendix A.1 Risk Assessment; Probabilistic Results 95 Maintenance Limit Analysis 96 Phase I Study 97 Phase II Study 98 Gas-Electric Infrastructure Analyses I, II 99 Phase III 100 Phase III Update 101 Fuel Availability LOLE Study Details
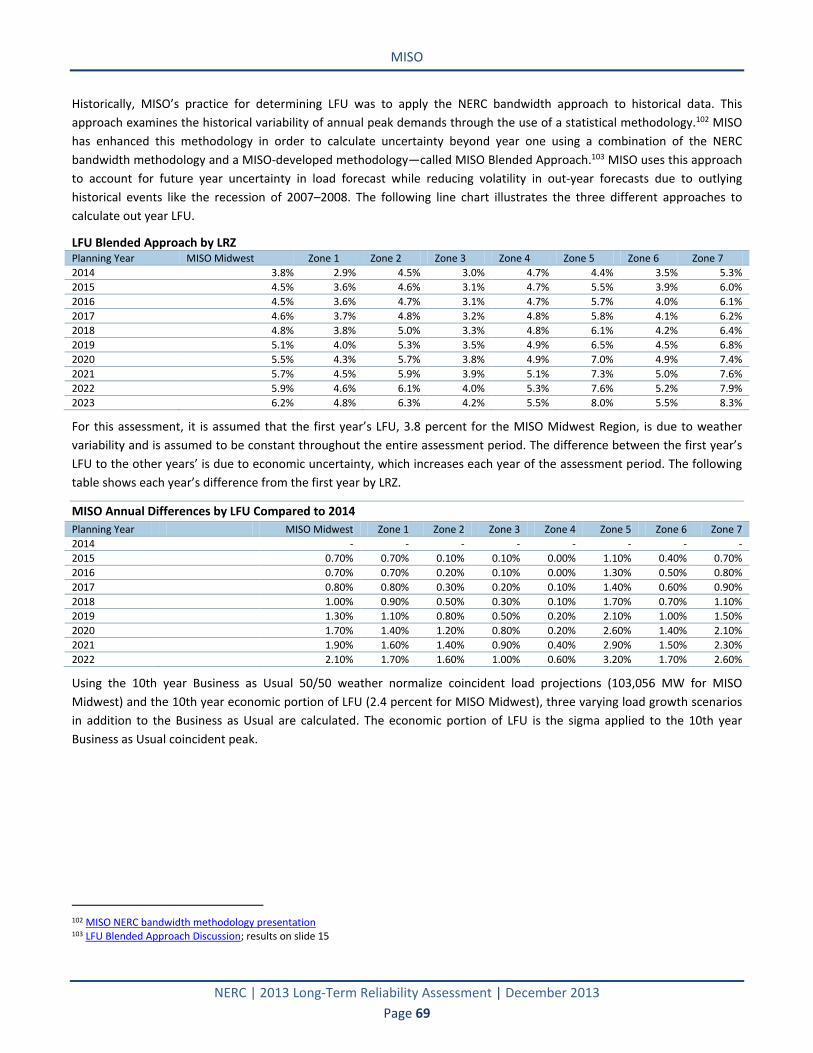
MISO
NERC | 2013 Long-Term Reliability Assessment | December 2013
Page 69
Historically, MISO’s practice for determining LFU was to apply the NERC bandwidth approach to historical data. This
approach examines the historical variability of annual peak demands through the use of a statistical methodology.102 MISO
has enhanced this methodology in order to calculate uncertainty beyond year one using a combination of the NERC
bandwidth methodology and a MISO-developed methodology—called MISO Blended Approach.103 MISO uses this approach
to account for future year uncertainty in load forecast while reducing volatility in out-year forecasts due to outlying
historical events like the recession of 2007–2008. The following line chart illustrates the three different approaches to
calculate out year LFU.
LFU Blended Approach by LRZ Planning Year MISO Midwest Zone 1 Zone 2 Zone 3 Zone 4 Zone 5 Zone 6 Zone 7
2014 3.8% 2.9% 4.5% 3.0% 4.7% 4.4% 3.5% 5.3%
2015 4.5% 3.6% 4.6% 3.1% 4.7% 5.5% 3.9% 6.0%
2016 4.5% 3.6% 4.7% 3.1% 4.7% 5.7% 4.0% 6.1%
2017 4.6% 3.7% 4.8% 3.2% 4.8% 5.8% 4.1% 6.2%
2018 4.8% 3.8% 5.0% 3.3% 4.8% 6.1% 4.2% 6.4%
2019 5.1% 4.0% 5.3% 3.5% 4.9% 6.5% 4.5% 6.8%
2020 5.5% 4.3% 5.7% 3.8% 4.9% 7.0% 4.9% 7.4%
2021 5.7% 4.5% 5.9% 3.9% 5.1% 7.3% 5.0% 7.6%
2022 5.9% 4.6% 6.1% 4.0% 5.3% 7.6% 5.2% 7.9%
2023 6.2% 4.8% 6.3% 4.2% 5.5% 8.0% 5.5% 8.3%
For this assessment, it is assumed that the first year’s LFU, 3.8 percent for the MISO Midwest Region, is due to weather
variability and is assumed to be constant throughout the entire assessment period. The difference between the first year’s
LFU to the other years’ is due to economic uncertainty, which increases each year of the assessment period. The following
table shows each year’s difference from the first year by LRZ.
MISO Annual Differences by LFU Compared to 2014
Planning Year MISO Midwest Zone 1 Zone 2 Zone 3 Zone 4 Zone 5 Zone 6 Zone 7
2014 - - - - - - - -
2015 0.70% 0.70% 0.10% 0.10% 0.00% 1.10% 0.40% 0.70%
2016 0.70% 0.70% 0.20% 0.10% 0.00% 1.30% 0.50% 0.80%
2017 0.80% 0.80% 0.30% 0.20% 0.10% 1.40% 0.60% 0.90%
2018 1.00% 0.90% 0.50% 0.30% 0.10% 1.70% 0.70% 1.10%
2019 1.30% 1.10% 0.80% 0.50% 0.20% 2.10% 1.00% 1.50%
2020 1.70% 1.40% 1.20% 0.80% 0.20% 2.60% 1.40% 2.10%
2021 1.90% 1.60% 1.40% 0.90% 0.40% 2.90% 1.50% 2.30%
2022 2.10% 1.70% 1.60% 1.00% 0.60% 3.20% 1.70% 2.60%
Using the 10th year Business as Usual 50/50 weather normalize coincident load projections (103,056 MW for MISO
Midwest) and the 10th year economic portion of LFU (2.4 percent for MISO Midwest), three varying load growth scenarios
in addition to the Business as Usual are calculated. The economic portion of LFU is the sigma applied to the 10th year
Business as Usual coincident peak.
102 MISO NERC bandwidth methodology presentation 103 LFU Blended Approach Discussion; results on slide 15
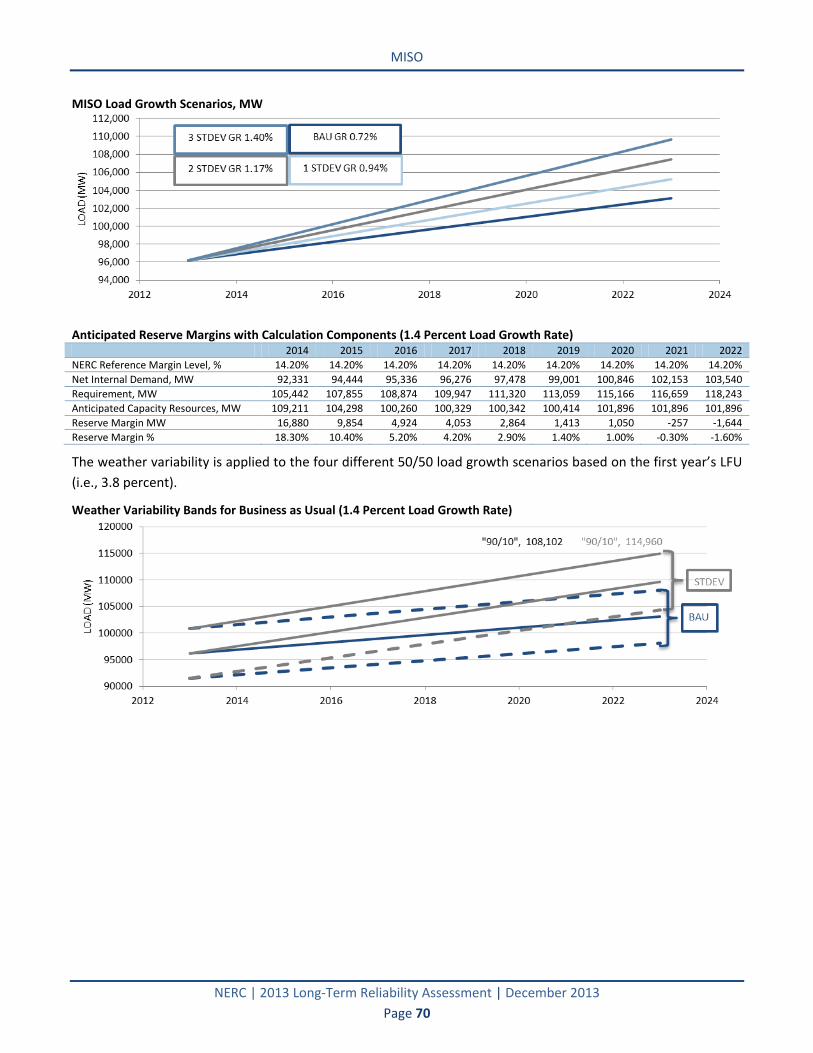
MISO
NERC | 2013 Long-Term Reliability Assessment | December 2013
Page 70
MISO Load Growth Scenarios, MW
Anticipated Reserve Margins with Calculation Components (1.4 Percent Load Growth Rate) 2014 2015 2016 2017 2018 2019 2020 2021 2022
NERC Reference Margin Level, % 14.20% 14.20% 14.20% 14.20% 14.20% 14.20% 14.20% 14.20% 14.20%
Net Internal Demand, MW 92,331 94,444 95,336 96,276 97,478 99,001 100,846 102,153 103,540
Requirement, MW 105,442 107,855 108,874 109,947 111,320 113,059 115,166 116,659 118,243
Anticipated Capacity Resources, MW 109,211 104,298 100,260 100,329 100,342 100,414 101,896 101,896 101,896
Reserve Margin MW 16,880 9,854 4,924 4,053 2,864 1,413 1,050 -257 -1,644
Reserve Margin % 18.30% 10.40% 5.20% 4.20% 2.90% 1.40% 1.00% -0.30% -1.60%
The weather variability is applied to the four different 50/50 load growth scenarios based on the first year’s LFU
(i.e., 3.8 percent).
Weather Variability Bands for Business as Usual (1.4 Percent Load Growth Rate)

MRO-Manitoba Hydro
NERC | 2013 Long-Term Reliability Assessment | December 2013
Page 71
MRO-Manitoba Hydro Manitoba Hydro is a Provincial Crown Corporation providing electricity to 542,000 customers throughout Manitoba and natural gas service to 267,000 customers in various communities throughout southern Manitoba. The province of Manitoba is 250,946 square miles. Manitoba Hydro also has formal electricity export sale agreements with more than 35 electric utilities and marketers in the midwestern United States, Ontario, and Saskatchewan. Manitoba Hydro is its own Planning Authority and BA. Manitoba Hydro is a coordinating member of the MISO. MISO is the Reliability Coordinator (RC) for Manitoba Hydro.
Planning Reserve Margins
MRO-Manitoba Hydro-Summer 2014 2015 2016 2017 2018 2019 2020 2021 2022 2023ANTICIPATED 40.51% 49.71% 49.72% 47.74% 49.88% 45.49% 43.33% 39.80% 36.88% 34.80%PROSPECTIVE 46.52% 49.42% 49.42% 47.45% 49.58% 45.20% 35.42% 25.40% 22.79% 20.92%ADJUSTED POTENTIAL 46.52% 49.42% 49.42% 47.45% 49.58% 47.98% 54.62% 44.12% 41.12% 38.97%NERC REFERENCE - 12.00% 12.00% 12.00% 12.00% 12.00% 12.00% 12.00% 12.00% 12.00% 12.00%
MRO-Manitoba Hydro-Winter 2014 2015 2016 2017 2018 2019 2020 2021 2022 2023ANTICIPATED 21.93% 26.27% 25.87% 24.11% 24.85% 21.29% 19.36% 16.64% 14.28% 12.41%PROSPECTIVE 30.92% 35.18% 34.75% 32.86% 33.65% 30.00% 22.44% 14.83% 12.50% 10.66%ADJUSTED POTENTIAL 30.92% 35.18% 34.75% 32.86% 33.65% 32.01% 36.27% 28.34% 25.74% 23.68%NERC REFERENCE - 12.00% 12.00% 12.00% 12.00% 12.00% 12.00% 12.00% 12.00% 12.00% 12.00%Summer Winter
0%
10%
20%
30%
40%
50%
60%
2014 2015 2016 2017 2018 2019 2020 2021 2022 2023
0%5%
10%15%20%25%30%35%40%
2014 2015 2016 2017 2018 2019 2020 2021 2022 2023
Cumulative 10-Year Planned Capacity Change
-100
-80
-60
-40
-20
0
20
2014 2015 2016 2017 2018 2019 2020 2021 2022 2023
MW
2013 Existing 2023 Planned 2023 Planned & Conceptual
Manitoba Hydro Capacity
(MW) Share (%) Capacity
(MW) Share (%) Change
(MW) Capacity
(MW) Share (%) Change
(MW)
Coal
97 1.8%
0 0.0% -97
0 0.0% -97
Petroleum
0 0.0%
0 0.0% 0
0 0.0% 0
Gas
242 4.4%
242 4.5% 0
242 4.0% 0
Nuclear
0 0.0%
0 0.0% 0
0 0.0% 0
Hydro
5,172 93.9%
5,172 95.5% 0
5,802 96.0% 630
Pumped Storage
0 0.0%
0 0.0% 0
0 0.0% 0
Geothermal
0 0.0%
0 0.0% 0
0 0.0% 0
Wind
0 0.0%
0 0.0% 0
0 0.0% 0
Biomass
0 0.0%
0 0.0% 0
0 0.0% 0
Solar
0 0.0%
0 0.0% 0
0 0.0% 0
TOTAL 5,510 100.0% 5,413 100.0% -97 6,043 100.0% 533

MRO-Manitoba Hydro
NERC | 2013 Long-Term Reliability Assessment | December 2013
Page 72
Demand, Resources, and Planning Reserve Margins
As a predominately hydro system, the Manitoba Hydro Assessment Area has both an energy criterion and a capacity
criterion. The capacity criterion requires a minimum 12 percent Planning Reserve Margin.
Manitoba Hydro is projecting adequate Planning Reserve Margins throughout the 10-year period. Assessment projections
show ample resources during the next five years due to the addition of the Wuskwatim Generating Station in 2012.
Potential issues that could result in differences from the long-term assessment projection are sustained higher than
expected load growth and delays in the licensing and construction of new resources that may be required after 2020.
According to the normal-weather forecast, demand is projected to grow at a rate of 1.15 percent per year through 2023.
The demand forecast is down approximately 3.0 percent in each year compared to the 2012LTRA reference case. The
change is mainly attributed to a correction of the calculation of distribution losses for the peak.
The Energy Efficiency and conservation growth pattern for DSM is expected to be minimal. Current DR implementations are
limited to interruptible customer load and are not expected to grow during the assessment period.
DR programs are load-modifying and are used to provide operational flexibility for the system operator under emergency
conditions. These DR programs are all interruptible customer load for which the industrial customers receive reduced
electricity rates in exchange for these services. The interruptible customer load may only be used to reduce peak demand if
contingency reserve obligations are in jeopardy of not being met.
DR programs used for Ancillary Services (Nonspinning Reserves) in place at Manitoba Hydro is the Curtailable Customer
Load Option R. Option R consists of an agreement between Manitoba Hydro and a large industrial customer to carry 50 MW
of Nonspinning Reserves in the form of a curtailable customer load.
Manitoba Hydro’s fleet of primarily hydro generation units continues to perform well from an availability perspective, and
there are no notable issues expected during the next decade that would lead to large-scale impacts.
At this time, it is anticipated that Manitoba Hydro’s sole coal generating unit (approximately 95 MW and located in
Brandon, Manitoba) will be retired in 2019, when replacement resources are expected to be completed. However,
Manitoba Hydro is investigating the possibility of keeping this unit available until 2029. Units taken out of service for
planned maintenance during the summer and winter peaks during the assessment period range between 13 MW and 91
MW.
Wind generation in Manitoba Hydro is fully derated for December, January, and February, the three months during which
the annual peak load will occur given the winter-peaking load. The zero value is used as the winter peak load is expected to
occur at temperatures below negative 30°C, when wind generation is expected to shut down due to low-temperature
operating restrictions. For spring, fall, and summer months, Manitoba Hydro assumed a capacity value of 13.3 percent,
based on the Effective Load Carrying Capability (ELCC) analysis.104 To date, the integration of wind generation in Manitoba
has not significantly impacted operational procedures. As no additional wind generation is anticipated for at least five
years, additional operations impacts are not expected in that time period.
For reservoir and variable hydro generation (also referred to as run-of-river hydro) expected on-peak values are determined
using the testing guideline and data processing procedures in accordance with the Midwest Reliability Organization (MRO)
Generator Testing Guidelines approved on March 29, 2007.105
104 See MISO’s Planning Year 2013–2014 Wind Capacity Credit report. 105 MRO Generator Testing Guidelines

MRO-Manitoba Hydro
NERC | 2013 Long-Term Reliability Assessment | December 2013
Page 73
All of Manitoba Hydro’s dependable exports and imports are backed by contracts. Manitoba Hydro has up to 600 MW of
firm on-peak capacity exports and 500 MW of firm on-peak capacity imports during the winter, 1,100 MW of on-peak
capacity exports in the summer, and associated firm transmission reservations during the assessment period. Manitoba
Hydro does not have any capacity imports during the summer. These contractual agreements have firm transmission
reservations with staggered terms associated with them. Manitoba Hydro does not have any capacity transactions beyond
the contract terms. Some Expected exports transactions are contingent upon additional resources being built within the
assessment time frame.
Transmission and System Enhancements
Manitoba Hydro is planning on adding a major new 500-kV HVdc transmission line and new Riel switching station in order
to mitigate the loss of the Dorsey converter station or loss of the Bipole I or II transmission corridor. These facilities are
planned to be in-service by 2017 and are included in the 2013LTRA reference case.
The following new transmission projects and line refurbishments are expected during the 10-year time frame.
NEW TRANSMISSION PROJECTS
A new 500/230-kV Riel Station with a scheduled in-service date of 2014 consists of establishing a new station, which will
include:
Installing a 1,200-MVA 230-kV/500-kV transformer bank,
Sectionalizing the existing Dorsey–Forbes 500-kV line, and
Sectionalizing two existing 230-kV lines (i.e., Ridgeway–St. Vital lines R32V and R33V).
A New Bipole III transmission line with a scheduled in-service date of 2017 will run from Keewatinoow Station in the North
to Riel Station near Winnipeg. The Bipole III project includes:
A ±500-kV HVdc transmission line, about 833 miles long, from Keewatinoow Converter Station to Riel Converter
Station;
A 2,000-MW converter station at Keewatinoow;
Five 230-kV ac transmission lines each approximately 19 miles in length to connect the Keewatinoow Converter
Station to the northern collector system; and
A 2,000-MW converter station at Riel, including four 250-Mvar synchronous compensators.
TRANSMISSION LINE REFURBISHMENTS
Winnipeg Area Transmission Refurbishments consist of upgrading an estimated 113 miles of 230-kV transmission lines to
carry higher loads with various scheduled in-service dates within this assessment period.
The Rockwood 230/115-kV Station consists of the development of a new 230/115-kV Rockwood East Station supplied from
sectionalized Ashern to Rosser 230-kV transmission line A3R. A 285-MVA, 230/115-kV transformer and associated structural
and electrical apparatus will be needed to connect this new station to the existing 115-kV system. The scheduled in-service
date for this project is 2015.
Improvements to the Winnipeg to Brandon transmission system include the addition of a fourth 54-Mvar, 115-kV capacitor
bank at Brandon Generating Station and the construction of a new Dorsey–Portage South 230-kV transmission line that
runs 44 miles. The scheduled in-service date for all facilities is 2015.
The Stafford Station Rebuild project is required in order to provide additional load-serving transformer capacity to the core
Winnipeg area load and to facilitate the replacement of aging equipment at the existing Scotland Station. In addition, the
138-kV transmission systems between Pointe Du Bois, Slave Falls, and Stafford will be converted to 115 kV so that the
former Winnipeg Hydro transmission can be integrated into the Manitoba Hydro 115-kV system. The scheduled in-service
date for this project is estimated to be 2014.

MRO-Manitoba Hydro
NERC | 2013 Long-Term Reliability Assessment | December 2013
Page 74
The Pointe du Bois transmission line replacement consists of four transmission lines on two parallel sets of steel towers
covering a distance of 77 miles and operating at 66 kV. The scheduled in-service date for this project is 2015. The lines were
first installed in 1910 and need to be replaced. The current plan is to remove the existing Pointe to Rover 66-kV lines and
replace them with a new 115-kV line that will run from Pointe du Bois to Whiteshell Station. Several other system
modifications are required to accommodate this, including the advance construction of a new 115-kV switchyard at Pointe
du Bois.
A fourth transformer addition is required at Cornwallis Station in order to meet the provincial Greenhouse Gas (GCG)
reduction target that the government passed as legislation to restrict operation of coal-fired generation in Manitoba. The
new legislation (assented on June 12, 2008) specified a coal phase-out requirement, meaning that after December 31, 2009,
Brandon Unit 5 (the only coal-fired generation in Manitoba Hydro) cannot be used to generate power except under
emergency or drought conditions. This provision has not changed since 2008. Without support of coal-fired generation, a
shortage of firm transformation has been identified in the Brandon area. There are plans to extend Cornwallis Station to
accommodate a fourth 230/115-kV transformer and a new 230-kV breaker. Upgrades and rerouting of transmission lines
BE3 (Brandon to Victoria), CB3 (Cornwallis to Brandon), MR11 (Raven Lake to Brandon Victoria), and CB4 (Cornwallis to
Brandon) are also planned. Installation of the fourth transformer and associated transmission line upgrades are estimated
to be in-service by June 30, 2013.
A 21.1-mile, 230-kV transmission line from La Verendrye to St. Vital will be added. This project will form a 230-kV ring
around the city of Winnipeg, which will greatly increase reliability. The scheduled in-service date for this project is
estimated to be 2015. A 77.7-mile, 230-kV transmission line from St. Vital to Letellier will be added. This line is required to
address load growth issues and low voltage concerns in the southern central area of Manitoba and has a scheduled in-
service year of 2016.
The new 695-MW Keeyask Generating Station will require new outlet transmission facilities to connect the generating
station to the Manitoba Hydro grid. A new Keeyask Switching Station will be established to terminate seven new 138-kV
lines, including four unit lines (approximately 1.9 miles each) to receive the power from Keeyask Generating Station and
three 138-kV transmission lines (approximately 24 miles each) to deliver the power to Manitoba Hydro’s existing Radisson
Converter Station. The scheduled in-service date for all facilities is 2019.
Improvements to the 115-kV Southwest Winnipeg Transmission System consist of improvement and reconfiguration of the
Southwest Winnipeg 115-kV transmission system required to enhance reliability. This project deals with a requirement for
additional 115-kV transmission capacity into the southwestern Winnipeg. Potential overload scenarios exist due to future
load growth. The project is divided into four stages:
1. The first stage consists of rebuilding approximately 12.4 miles of 115-kV line YH33 (now YS33) from La Verendrye
to Harrow station as well as upgrading of undersized line terminations at La Verendrye and Harrow.
2. The second stage involves rebuilding approximately nine miles of 115-kV line VS27 from St. Vital to Harrow and
using and upgrading the former HS5 to complete the 115-kV line VS27 from St. Vital to Scotland. Stage two also
involves the creation of a new 115-kV line YS33 from La Verendrye to Scotland using the existing 115-kV line YH33
and rebuilding the former VS27 right-of-way to complete the Harrow to Scotland portion of this new line. The
upgrade of undersized terminations at St. Vital will also be completed.
3. The third stage consists of opening 115-kV line YV5, creating a La Verendrye to Wilkes radial line, and terminating
the former 115-kV line YV5 into Fort Garry Mohawk station, which will create the new St. Vital to Fort Garry
Mohawk line.
4. The fourth stage includes the reconductoring of three miles of line VH1. The proposed alternative has been
deemed to be superior based on technical and economic analysis of all alternatives considered. The various stages
of the project are expected to be completed between 2013 and 2021.

MRO-Manitoba Hydro
NERC | 2013 Long-Term Reliability Assessment | December 2013
Page 75
The construction of a new 500-kV ac transmission tie line from Dorsey to the U.S. border is planned for 2020. There are two
options being studied in detail: Dorsey–Fargo–Minneapolis and Dorsey–Iron Range–Duluth.
The project to establish a 230/66-kV Neepawa station and tap the existing 230-kV line Dorsey–Cornwallis D54C was
originally planned for an in-service date of 2011. Due to budget constraints this project’s in-service date was deferred to
2015. The deferral of the Neepawa 230/66-kV station and the proposed new oil and gas pipeline load increases the risk of
under-voltage conditions for various single contingency outage conditions. Operating guides will be put in place as required
to mitigate the under-voltage conditions. Planned voltage support equipment includes:
Riel 230-kV three 73.4 Mvar capacitors (May 2014)
Keewatinoow and Riel – 2,000-MW converters at each station (October 2017)
Riel synchronous condensers (four 250 Mvar) (October 2017)
Dorsey 150 Mvar line reactor – new (September 2019)
Dorsey capacitor bank 51, second stage 73.4 Mvar tertiary caps (May 2019)
Riel second 230/500-kV transformer bank with two 73.4 Mvar tertiary caps (May 2019)
A new SPS is in service at Raven Lake Station on 115-kV line MR11. When North to South transfers are high during summer
and off-peak loads coincident with maximum generation, there is a potential to thermally overload this line (> 115 percent)
for the loss of 230-kV line C28R. Over-current tripping of line MR11 has been initiated and no other thermal or voltages
issues exist. This will be a permanent solution.
Manitoba Hydro has already deployed FACTS devices in the form of SVCs and Statcom at several stations to improve system
reliability. A number of PMUs have also been deployed at various points on Manitoba Hydro’s system and a data analysis
tool is being used to extract information from the collected data to improve system simulation models and fine-tune
control systems. Future plans include the use of PMU data for real-time visualization and decision support tools for system
operators. Near-term plans to increase reliability through the use of technology include dynamic security assessment,
dynamic equipment ratings, advanced equipment monitoring, and fault current mitigation.
Long-Term Reliability Issues
Manitoba does not have a legislated, renewable mandate such as an RPS and no legislation is currently anticipated. The
resource mix in Manitoba already includes over 95 percent hydro under typical inflow conditions.
There are no resource adequacy concerns related to DR programs in Manitoba Hydro. No significant increases in DR are
expected as current actual DR curtailments only use approximately 20 percent of available DR curtailments. The most
significant operational concern for scenarios of unresponsive or unavailable DR is the need to carry contingency reserves
elsewhere. In addition, when interruptible customer load is unavailable, system operators will have to rely on emergency
energy purchases prior to shedding firm load under severe system contingencies.
The Brandon coal unit is impacted by the Manitoba Climate Change and Emissions Reduction Act and the Canadian federal
Coal-Fired Electricity Regulations, and these have been considered in developing the plan to close this unit in 2019. As
legislation evolves, Manitoba Hydro is investigating the possibility of keeping this unit available until 2029. At this time,
there are no pending regulations that are expected to impact existing hydro generation in Manitoba.
Extreme weather events that may impact critical infrastructure and aging infrastructure have been identified as two
emerging reliability issues. Severe weather events can include tornados and ice storms, for example. These events can
occur at any time but the consequence is most severe at or near the system peak load in winter. Loss of a major station or
corridor can impact access to northern hydro generation, which will impact resource adequacy.
Generation and transmission assets are aging. Many assets were put in service in the 1960s and 1970s during periods of
high load growth. There is the potential for increased forced outages if additional investment is not made to replace this

MRO-Manitoba Hydro
NERC | 2013 Long-Term Reliability Assessment | December 2013
Page 76
infrastructure. Should such additional infrastructure investments not be made, there may be some small incremental risk of
loss-of-load events. The 2013LTRA reference case was not adjusted to consider aging infrastructure. Capital constraints
have the potential to defer investments in infrastructure replacement, which may elevate the risk.

MRO-MAPP
NERC | 2013 Long-Term Reliability Assessment | December 2013
Page 77
MRO-MAPP The Mid-Continent Area Power Pool (MAPP) is an association of electric utilities and other electric industry participants operating in all or parts of Iowa, Minnesota, Montana, North Dakota, and South Dakota. Currently, the MAPP Planning Authority includes entities in two BAs and 13 LSEs. The MAPP Planning Authority covers an area of approximately 200,000 square miles and serves a population of about 3.5 million. MAPP typically experiences its annual peak demand in summer. There have not been any changes to the MAPP Assessment Area footprint in the last two years, and no changes are expected in the future.
Planning Reserve Margins
MRO-MAPP-Summer 2014 2015 2016 2017 2018 2019 2020 2021 2022 2023
ANTICIPATED 29.01% 29.15% 24.36% 22.20% 20.15% 18.10% 16.29% 15.49% 14.22% 12.98% PROSPECTIVE 29.01% 29.15% 24.76% 22.64% 20.64% 18.64% 16.87% 16.11% 14.88% 13.68% ADJUSTED POTENTIAL 29.01% 29.15% 24.76% 22.64% 20.64% 18.64% 16.87% 16.11% 14.88% 13.68%
NERC REFERENCE - 15.00% 15.00% 15.00% 15.00% 15.00% 15.00% 15.00% 15.00% 15.00% 15.00%
MRO-MAPP-Winter 2014 2015 2016 2017 2018 2019 2020 2021 2022 2023
ANTICIPATED 34.20% 36.08% 25.76% 23.18% 21.58% 19.62% 17.86% 16.09% 14.40% 12.66% PROSPECTIVE 34.20% 36.08% 25.76% 23.18% 21.58% 19.62% 17.86% 16.09% 14.40% 12.66% ADJUSTED POTENTIAL 34.20% 36.08% 25.76% 23.18% 21.58% 19.62% 17.86% 16.09% 14.40% 12.66%
NERC REFERENCE - 15.00% 15.00% 15.00% 15.00% 15.00% 15.00% 15.00% 15.00% 15.00% 15.00% Summer Winter
0%
5%
10%
15%
20%
25%
30%
2014 2015 2016 2017 2018 2019 2020 2021 2022 2023
0%5%
10%15%20%25%30%35%
2014 2015 2016 2017 2018 2019 2020 2021 2022 2023
Cumulative 10-Year Planned Capacity Change
050
100150200250300350400450500
2014 2015 2016 2017 2018 2019 2020 2021 2022 2023
MW
2013 Existing 2023 Planned 2023 Planned & Conceptual
MRO-MAPP Capacity
(MW) Share
(%) Capacity
(MW) Share
(%) Change
(MW) Capacity
(MW) Share
(%) Change
(MW)
Coal
3,205 44.1%
3,347 43.7% 142
3,347 43.7% 142
Petroleum
564 7.8%
564 7.4% 0
564 7.4% 0
Gas
1,059 14.6%
1,299 17.0% 240
1,299 17.0% 240
Nuclear
60 0.8%
60 0.8% 0
60 0.8% 0
Hydro
2,135 29.4%
2,135 27.9% 0
2,135 27.9% 0
Pumped Storage
0 0.0%
0 0.0% 0
0 0.0% 0
Geothermal
0 0.0%
0 0.0% 0
0 0.0% 0
Wind
247 3.4%
247 3.2% 0
247 3.2% 0
Biomass
3 0.0%
3 0.0% 0
3 0.0% 0
Solar
0 0.0%
0 0.0% 0
0 0.0% 0
TOTAL 7,273 100.0% 7,656 100.0% 382 7,656 100.0% 382

MRO-MAPP
NERC | 2013 Long-Term Reliability Assessment | December 2013
Page 78
Demand, Resources, and Planning Reserve Margins
All Planning Reserve Margins exceed the target reference margins (NERC Reference Margin Level) of 15 percent through
2021. The Anticipated Reserve Margin falls below 15 percent in 2022 and reaches 12.7 percent in 2023. Falling short of the
target reserve margin in the final two years is not a new trend in MAPP. MAPP has traditionally met its target reserve
margin through the mid-term planning horizon, but beyond that time frame, firm contracts or new peaking capacity units
may not yet be known. MAPP will have a more accurate picture of 2020–2023 in the next few years as load projections
become more accurate, long-term contracts are executed, and new generation resources are planned.106
In the 2012LTRA reference case, MAPP forecasted 10-year annual growth rates of 2.0 percent for Total Internal Demand
and 2.2 percent for Net Energy for Load. In the 2013LTRA, the forecasted 10-year annual growth rate for Total Internal
Demand decreased slightly to 1.9 percent over the assessment period, while the forecasted 10-year annual growth rate for
Net Energy for Load decreased to 2.0 percent.
Most of the MAPP utilities report annual demand growth near the composite MAPP annual growth demand. One localized
area of greater load growth is Rochester Public Utilities, which serves the greater Rochester, Minnesota area and has a
forecasted 10-year annual growth rate of 6.5 percent for Total Internal Demand. This growth rate is primarily due to the
development of downtown Rochester and the expansion of the Mayo Clinic. Another area of strong load growth is
attributed to the increasing development in the oil and gas production in the Bakken Formation in western North Dakota
and eastern Montana. Western Area Power Administration (WAPA) and Basin Electric Power Cooperative (BEPC) performed
studies of the northwestern North Dakota region to evaluate the impact of the load growth in this area. Transmission and
system enhancements are noted in the sections below as a result of these studies.
The growth pattern for DR is a flat 1.0 percent throughout the assessment period, with the amount of available DR
increasing from 102 MW in 2014 to 122 MW in 2023. The growth pattern for Energy Efficiency and conservation increases
300 percent throughout the assessment period from 18.9 MW in 2014 to 56.6 MW in 2023.
A wide variety of programs, including direct load control (such as electric appliance cycling) and interruptible load, may be
used to reduce peak demand during the assessment period. Minnkota’s DR—which accounts for a majority of DR in the
MAPP Assessment Area–is treated as load modifying.
There are 382 MW of Future-Planned and Conceptual resources projected to come on-line throughout the assessment time
frame, with 85.2 MW of projected retirements. Rochester Public Utilities plans to retire Silver Lake units 1–4 in 2016,
accounting for all 85.2 MW of retirements. The retirement of these units is not expected to have a significant impact on
reliability during the assessment period. Regarding existing capacity resources, 250 MW of wind generation is expected on
peak, with a nameplate rating of 1,100 MW. There are 2,135 MW of hydro and 3 MW of biomass Existing-Certain capacity
resources in MAPP.
MAPP is traditionally a net capacity exporting area and is projecting total firm imports of 398 MW and firm exports of 1,458
MW. For both imports and exports, firm contracts exist for both the generation and the transmission service.107
Transmission and System Enhancements
MAPP has 502 miles of greater than 100-kV transmission lines under construction. Additionally, there are 396 miles of
planned projects and 84 miles of conceptual projects greater than 100-kV expected to be in service within five years. These
106 MAPP has not received any notice from neighboring areas about issues that could impact operations during the assessment period. MAPP is part of the MISO RC footprint and operating issues are coordinated through the RC. 107 Firm contracts are at least one year in length, and some extend out 10 years or more. Capacity transactions projected beyond the length of
firm contracts may be based on extensions of those contracts. Transmission providers within MAPP handle Liquidated Damage Contracts (LDC) according to their tariff policies. Most MAPP LSEs are within nonretail access jurisdictions and therefore liquidated damages products are not typically used. MAPP is forecasted to meet the various reserve margin targets without needing to include Energy-only, uncertain, or transmission-limited resources.

MRO-MAPP
NERC | 2013 Long-Term Reliability Assessment | December 2013
Page 79
projects are anticipated to come into service during the 2013–2017 time frame to enable reliable and efficient transmission
service for the MAPP Region. Significant 345-kV projects include Center–Prairie, Antelope Valley Station–Neset, and
Brookings County–Hampton. Basin Electric is monitoring voltage stability performance in its Bakken Area studies, which
could identify any static reactive limits in the area. One of the transmission projects was identified to have permitting
delays but this delay is not expected to impact reliability.
In December 2012, a temporary UVLS scheme was installed at the Williston 57-kV bus due to unforecasted load growth in
that area attributed to the increasing development in the oil and gas production in the Bakken Formation. The UVLS
prevents low post-contingent voltages in the local area for the loss of certain transmission facilities. Approximately 70 MW
of peak load can be tripped by the UVLS in three stages. In April 2014, a parallel 230/115-kV transformer is scheduled to be
energized at Williston, at which time the temporary UVLS will be removed. Additional transmission projects are being
reviewed and planned to address the needs of the unforecast demands of the Bakken Formation (e.g., the Antelope Valley
Station–Neset 345-kV line noted above).
MAPP and its members continue to research new technologies and tools (e.g., smart grids or FACTS) to improve BPS
reliability. There is no timeline on deploying new technologies or smart grid programs during the assessment period.
Long-Term Reliability Issues
Several states in MAPP have a renewable energy mandate or goal, creating the expectation that the primary source of new
renewable energy will come from intermittent resources, including wind. The integration of intermittent resources presents
new challenges in the Region. As the amount of wind resources increases, their contribution to resource adequacy will also
increase. This may introduce additional uncertainty in maintaining system reliability. New wind resources will have an
impact on the transmission system and may increase the potential for congestion on the system. Intermittent resources
also have an impact on the operation of the system generation fleet as resources that will need to be considered in meeting
the potential ramp and minimum generation issues that could occur.
Currently, wind development is focused around meeting the existing state renewable energy mandates. However, if
additional regulations (e.g., clean energy standards, carbon reduction) are pushed forward, more resources may be
required. Additionally, economic factors such as higher gas prices or lower construction costs may increase the amount of
intermittent resources found on the system.
MAPP has not conducted any assessment area-wide studies around environmental or regulatory restrictions that could
impact reliability, including from minimum demand or over-generation situations.
Another emerging issue that impacts MAPP, as well as other Regions, is the complex process building transmission projects.
Transmission projects that do not get built or are delayed may impact reliability through congestion on the existing BES.
This could impact the amount of transmission loading relief (TLR) used. Currently, this issue is not impacting resource
adequacy as reported through the LTRA. Siting and permitting issues could be barriers to transmission in-service dates,
which may constrain the existing BES and affect real-time operations.

MRO-SaskPower
NERC | 2013 Long-Term Reliability Assessment | December 2013
Page 80
MRO-SaskPower Saskatchewan is a province of Canada and comprises a geographic area of 651,900 square kilometers
and approximately one million people. Peak demand is experienced in the winter. The Saskatchewan
Power Corporation (SaskPower) is the Planning Authority and RC for Saskatchewan and is the
principal supplier of electricity in the province. SaskPower is a Provincial Crown Corporation and
under provincial legislation is responsible for the reliability oversight of the Saskatchewan BES and its
interconnections.
Planning Reserve Margins
MRO-SaskPower-Summer 2014 2015 2016 2017 2018 2019 2020 2021 2022 2023
ANTICIPATED 17.99% 19.30% 17.64% 14.80% 13.63% 18.89% 17.61% 16.37% 16.35% 13.40% PROSPECTIVE 17.99% 19.30% 18.39% 15.52% 14.34% 19.59% 18.30% 17.04% 16.35% 13.40% ADJUSTED POTENTIAL 17.99% 19.30% 18.39% 15.52% 14.34% 19.59% 18.30% 17.04% 16.35% 13.40%
NERC REFERENCE - 11.00% 11.00% 11.00% 11.00% 11.00% 11.00% 11.00% 11.00% 11.00% 11.00%
MRO-SaskPower-Winter 2014 2015 2016 2017 2018 2019 2020 2021 2022 2023
ANTICIPATED 18.81% 19.73% 16.50% 13.21% 12.20% 18.28% 17.02% 15.59% 16.45% 13.09% PROSPECTIVE 18.81% 19.73% 17.17% 13.85% 12.84% 18.91% 17.64% 16.20% 16.45% 13.09% ADJUSTED POTENTIAL 18.81% 19.73% 17.17% 13.85% 12.84% 18.91% 17.64% 16.20% 16.45% 13.09%
NERC REFERENCE - 11.00% 11.00% 11.00% 11.00% 11.00% 11.00% 11.00% 11.00% 11.00% 11.00% Summer Winter
0%
5%
10%
15%
20%
2014 2015 2016 2017 2018 2019 2020 2021 2022 2023
0%
5%
10%
15%
20%
2014 2015 2016 2017 2018 2019 2020 2021 2022 2023
Cumulative 10-Year Planned Capacity Change
-400-200
0200400600800
1,0001,200
2014 2015 2016 2017 2018 2019 2020 2021 2022 2023
MW
2013 Existing 2023 Planned 2023 Planned & Conceptual
MRO-SaskPower Capacity
(MW) Share
(%) Capacity
(MW) Share
(%) Change
(MW) Capacity
(MW) Share
(%) Change
(MW)
Coal
1,683 42.6%
1,491 31.2% -192
1,491 31.2% -192
Petroleum
0 0.0%
0 0.0% 0
0 0.0% 0
Gas
1,361 34.4%
2,226 46.6% 865
2,226 46.6% 865
Nuclear
0 0.0%
0 0.0% 0
0 0.0% 0
Hydro
860 21.8%
927 19.4% 67
927 19.4% 67
Pumped Storage
0 0.0%
0 0.0% 0
0 0.0% 0
Geothermal
0 0.0%
0 0.0% 0
0 0.0% 0
Wind
40 1.0%
83 1.7% 44
83 1.7% 44
Biomass
10 0.3%
46 1.0% 36
46 1.0% 36
Solar
0 0.0%
0 0.0% 0
0 0.0% 0
TOTAL 3,954 100.0% 4,774 100.0% 820 4,774 100.0% 820

MRO-SaskPower
NERC | 2013 Long-Term Reliability Assessment | December 2013
Page 81
Demand, Resources, and Planning Reserve Margins
For the purpose of this assessment, Saskatchewan’s Reference Margin Level is 11 percent throughout the assessment
period. Saskatchewan uses an Expected Unserved Energy (EUE) analysis to project its Planning Reserve Margins and as the
criterion for adding new generation resources. Saskatchewan also uses a most likely load forecast (50/50).
Saskatchewan has planned for adequate resources to meet anticipated load throughout the assessment period. Based on
the deterministic calculation made within this assessment, Saskatchewan’s Anticipated Reserve Margin ranges from 12.20
to 19.73 percent for the winter season and does not fall below the Reference Margin Level.
Saskatchewan does not anticipate any challenges that would lead to significant detractions of its Planning Reserve Margin
projections. GHG regulations are expected to become an issue as specific federal and provincial regulations are introduced
and finalized. The consequences of such regulations are expected to have a low impact on reliability because it is
anticipated that sufficient lead time will be given to allow for appropriate mitigation.
The forecasted compound annual growth rates (CAGR) for Total Internal Demand is 2.12 percent for the winter during the
assessment period (2014–2023). Saskatchewan has modified its load forecasting methodology and has begun using a 50/50
load forecast for the purposes of the MRO and NERC assessments. The change to the 50/50 load forecast methodology has
caused a corresponding decrease in the expected peak demand.
Saskatchewan does not anticipate any significant economic or weather-related forecast changes. An upswing in the
economy could lead to an increase in electricity usage and cause a spike to the overall demand. Saskatchewan has plans to
meet resource reliability requirements should a sudden economic change cause a need for new capacity. Load growth in
Saskatchewan is primarily due to economic growth in the industrial sector that is spread evenly throughout the province.
It is expected that 86 MW of Contractually Interruptible (Curtailable) DR and 66 MW of Energy Efficiency will be available
during the 2014–2015 winter. DR will remain constant but Energy Efficiency will increase to 149 MW by the 2023–2024
winter. The primary driver for DSM programs in Saskatchewan is the economic incentive or the difference in cost between
providing the DSM programs and the cost of serving the load. Increases in DSM will come from growth of existing and new
programs. Energy efficiency and conservation savings are counted as load-modifying and are netted from the load forecast.
Saskatchewan considers DR to be a capacity resource used for peak shaving and has energy-limited contracts in place with a
number of customers to provide this service. Saskatchewan will continue to initiate new economically viable DSM programs
and will monitor and expand (if required) the DR programs.
The primary sources of fuel in Saskatchewan are coal, hydro, and natural gas. Throughout the assessment period, a total
capacity of 1,720 MW (nameplate) of Future‐Planned resources is projected to come on‐line. This total consists of 348 MW
of refurbished coal, 1,039 MW of gas, 230 MW (nameplate) of wind, 36 MW of biomass resources, and 67 MW of additional
hydro resources.
Saskatchewan relies on conventional, pulverized coal plants to supply a significant portion of the energy demand. Canadian
federal GHG regulations (released in September 2012) stipulate that coal units must either meet a CO2 emission intensity
factor equivalent to an efficient natural gas facility (420 Mg/MWh) or be shut down based on the age of the unit. An
equivalency agreement is currently being discussed at the provincial level to further define how coal facilities may be
allowed to operate during the assessment period. Once this agreement is determined, there will be more certainty as to
how Saskatchewan’s coal-fired units will be affected. Approximately 278 net MW of Saskatchewan’s coal fleet must meet
federal regulations in the assessment period.
In addition to the 62-MW coal facility that was retired in 2013, new unit retirements throughout the assessment period
include a 61-MW coal facility in 2015 and a 79-MW gas-fired facility in 2023. Saskatchewan is also developing plans to
convert existing pulverized coal units into Integrated Carbon Capture and Storage (ICCS) facilities that would result in an
incremental decrease in net capacity of approximately 15 percent. Saskatchewan manages unit retirements and negative

MRO-SaskPower
NERC | 2013 Long-Term Reliability Assessment | December 2013
Page 82
impacts to capacity within its resource planning process and allows adequate time for new supply resources to be put in
service to meet the reliability requirements during the assessment period.
Saskatchewan plans for 10 percent of wind nameplate capacity to be available to meet summer peak demand and 20
percent of wind nameplate capacity to be available to meet winter peak demand.108 On‐peak expected values for hydro
assume nameplate net generation minus expected seasonal derates due to water conditions. Saskatchewan plans for 100
percent of biomass nameplate capacity to be available to meet demand based on a base‐load contract.
Due to integrating variable resources, operational procedures for the assessment period have not been impacted. The
addition of future variable resources will require the ability to curtail the resource or have additional fast ramping capacity
available to follow the intermittency of the variable resource.
Saskatchewan does not rely on capacity transactions for reliability assessments unless there is a firm contract for both the
supply source and transmission. Saskatchewan anticipates having a firm import contract for 25 MW from winter 2015 to
spring 2022. There are no anticipated firm exports for the assessment period. Saskatchewan does not rely on emergency
imports to meet its demand.
Transmission and System Enhancements
The following are the top transmission projects that relate to the maintenance or enhancement to reliability over the
assessment period for Saskatchewan. These projects are heavily dependent on load growth. Project scopes have been
defined, funds have been secured, and engineering and construction resources are currently being allocated. Delays are
assessed when indicated and interim measures (if required) are implemented to ensure system reliability is not impacted.
No long-term transmission constraints have been identified within Saskatchewan for the assessment period.
At this time there are no planned interconnection-related projects. Materialization of such projects would occur as a result
of study work performed for transmission service requests and approval of requests would only be granted once required
facilities are in service.
At this time there are no confirmed delays for targeted in-service dates for planned projects and there are no major
concerns with temporary service outages for any existing line or transformer facilities. For planned and emergency outages,
further detailed study work is performed and temporary operating guides are issued as required.
Approximately 300 km of 138-kV line in the Island Falls to Key Lake area (northern Saskatchewan) by mid-2015
Approximately 110 km of 230-kV line in the Saskatoon-Wolverine area (central Saskatchewan) by mid-2014
Approximately 225 km of 230-kV line, 225 km of 138-kV, and salvage of 135 km of 138-kV line in the Moose Jaw-
Swift Current area (central Saskatchewan) by late 2016
Approximately 100 km of 230-kV line in the Kennedy-Tantallon area (eastern Saskatchewan) by late 2016. This
project also includes two new 300-MVA 230/138-kV auto-transformers in the Tantallon area by late 2013.
Two new 300-MVA 230/138-kV auto-transformers in the Fleet Street area (southeast Saskatchewan) by late 2013.
Two new 350-MVA 230/138-kV auto-transformers in the Boundary Dam area (southeast Saskatchewan) by late
2013 and 2014 (phased approach)
To support local area voltage control, a 100-Mvar static var system (SVS) is planned for the Swift Current area
(southwestern Saskatchewan) in mid-2014
One UVLS scheme is currently under construction in Saskatchewan in the Tantallon (eastern) area of the province with a
projected in-service date of mid-2014. This scheme will be installed to mitigate potential low voltages under certain
generation dispatch scenarios caused by N-1 outages (until planned transmission reinforcements in 2016 are in place) and a
108 The wind available to meet peak requirements is based on the historic, actual wind generation over a four‐hour period during the peak for
each day for the entire year. Historical data was used for each wind installation from the time it was first in-service.
MRO-SaskPower
NERC | 2013 Long-Term Reliability Assessment | December 2013
Page 83
few N-2 outages. These outages are in the southeastern portion of the province. The planned UVLS scheme targets
approximately 70 MVA of load to be shed. This equates to approximately two percent of the projected total Saskatchewan
2013 winter peak load. This UVLS scheme does not influence this reliability assessment as it is being implemented to
mitigate potential local area post-contingency voltage concerns. A new 230-kV transmission line is planned into the
Tantallon area, which will reinforce the area’s voltage. This line has a projected in-service date of mid-2016. The UVLS
scheme will then be used to mitigate potential low voltages for N-1-1 and N-2 outages under certain generation dispatch
scenarios.
For the assessment period, the following conceptual SPSs in Saskatchewan address potential generation deliverability
concerns in the local area caused by N-2 outages of 230-kV double circuits. Once local area system reinforcements are
installed to mitigate the N-2 contingency concerns, these protection systems may still remain installed to address more
extreme operating scenarios:
Boundary Dam area (southeastern) - Planned in-service date of 2015
o This protection system is planned to be temporary until 2016 when planned generation unit retirements and
projected industrial load growth in the southeastern portion of the province materialize.
E.B. Campbell area (eastern) - Planned in-service date of 2015
o This protection system is planned to be permanent for the assessment period.
Beatty area (central) - Planned in-service date of 2015
o This protection system is planned to be temporary until 2016 when the Beatty–Wolverine 230-kV line is
planned to be in-service.
Saskatchewan evaluates new technologies as they become available, and uses them if economic. Saskatchewan does not
have any significant smart grid programs that affect the BES. Current efforts are primarily focused on the distribution
system.
Long-Term Reliability Issues
Reliability issues in Saskatchewan with the highest level of priority include the addition of intermittent resources and the
inclusion of emission regulations for both GHGs and criteria air contaminants.
Resource adequacy and operational concerns can apply for various reasons, including hydro conditions, standards, DR
programs, variable generation, and other unit conditions. Saskatchewan’s hydro planning is based on median flow
conditions using historical data. Most of Saskatchewan’s hydro facilities have some form of storage and are capable of
achieving near full-load output for some period of time under most operating conditions. Currently there are no RPSs for
the assessment area. Saskatchewan is planning the system based on a portfolio of supply options and will ensure that there
is sufficient time to meet any RPS that could be initiated in the future. DR programs are contracted on an as-needed basis. If
additional DR programs are required, Saskatchewan will initiate further customer uptake. One of the largest factors for
operational concerns is the addition of more intermittent or variable resources such as wind and solar. Saskatchewan
performs wind integration studies and is in the process of developing a 10-year wind power strategy.
Saskatchewan will have approximately 8.5 percent of wind integration in 2016 and is looking at adding more in the 2020 to
2025 time frame. The inclusion of more intermittent resources may have operational impacts that need to be studied to
determine the power system effects to both Saskatchewan and neighbouring jurisdictions. Depending on the makeup of
the future power system, intermittent resources may need to be curtailed or other generation sources may be required on-
line to allow for the sudden changes in output.
Finalized federal regulations for CO2 emissions lay out the requirements and timelines for existing coal-fired generation for
the reduction of GHGs. These regulations could impact direction taken on ICCS and new natural gas generation. These
impacts will have a cascading effect on many other significant areas, including current and projected contracts for future
supply of coal and natural gas. Provincial regulations are currently being developed, and an equivalency agreement

MRO-SaskPower
NERC | 2013 Long-Term Reliability Assessment | December 2013
Page 84
between the provincial and federal governments may be created to allow greater flexibility to meet GHG regulations.
Saskatchewan is working with the provincial government to develop the equivalency agreement.
Development and finalization of federal regulations to limit CO2 from natural gas-based electricity generation could cause
Saskatchewan to modify operational use of existing gas units in order to remain compliant. Pending federal natural gas
rules for electricity generation will impact timing and nature of capital projects, potential retirements, and the replacement
and creation of new energy decisions. These regulations are constantly monitored and included in any decision making
processes related to system reliability. Saskatchewan includes these factors in all reliability analyses and includes sufficient
time to perform retrofits or replacements to meet the required regulations. Saskatchewan has not yet experienced any
reliability issues related to GHG regulations and is expected to effectively mitigate any future reliability issues related to
GHG.
Emission regulations will begin to affect Saskatchewan as early as 2015 for NOx and SO2 and as early as 2019 for CO2. The
requirement to reduce emissions for both coal and natural gas facilities will require proper planning to ensure that
retrofitting or the addition of new emission control equipment is done in a timely manner. The parasitic load for emission
equipment is substantial and dependent on the intensity limits for emission reductions; it must be included in determining
net outputs from generation facilities. Saskatchewan is working with both the provincial and federal governments on
emission regulations and equivalency agreements.

NPCC-Maritimes
NERC | 2013 Long-Term Reliability Assessment | December 2013
Page 85
NPCC-Maritimes The Maritimes Assessment Area is a winter-peaking subregion of the Northeast Power Coordinating Council (NPCC) Region that contains two BAs. It is comprised of the Canadian provinces of New Brunswick, Nova Scotia, and Prince Edward Island, and the northern portion of Maine, which is radially connected to the New Brunswick power system. The area covers 58,000 square miles with a total population of 1.9 million people. The footprint has not changed during the last two years and is not expected to change during the 10-year assessment period unless a conceptual tie line to the Canadian province of Newfoundland and Labrador is constructed.
Planning Reserve Margins
NPCC-Maritimes-Summer 2014 2015 2016 2017 2018 2019 2020 2021 2022 2023
ANTICIPATED 92.7% 88.0% 88.9% 89.1% 94.4% 93.2% 95.8% 95.0% 95.2% 94.6% PROSPECTIVE 95.2% 90.6% 91.4% 91.6% 102.0% 100.7% 103.4% 102.7% 102.8% 102.2% ADJUSTED POTENTIAL 96.7% 92.1% 92.9% 93.1% 103.4% 102.2% 104.9% 104.1% 104.3% 103.7%
NERC REFERENCE - 20.00% 20.00% 20.00% 20.00% 20.00% 20.00% 20.00% 20.00% 20.00% 20.00%
NPCC-Maritimes-Winter 2014 2015 2016 2017 2018 2019 2020 2021 2022 2023
ANTICIPATED 27.4% 26.3% 26.3% 26.8% 30.8% 32.8% 32.8% 32.9% 32.8% 33.0% PROSPECTIVE 28.0% 26.9% 26.9% 27.4% 34.3% 36.4% 36.4% 36.5% 36.3% 36.6% ADJUSTED POTENTIAL 28.0% 26.9% 26.9% 27.4% 34.3% 36.4% 36.4% 36.5% 36.3% 36.6%
NERC REFERENCE - 20.00% 20.00% 20.00% 20.00% 20.00% 20.00% 20.00% 20.00% 20.00% 20.00% Summer Winter
0%15%30%45%60%75%90%
105%
2014 2015 2016 2017 2018 2019 2020 2021 2022 20230%5%
10%15%20%25%30%35%40%
2014 2015 2016 2017 2018 2019 2020 2021 2022 2023
Cumulative 10-Year Planned Capacity Change
-200-150-100
-500
50100150200
2014 2015 2016 2017 2018 2019 2020 2021 2022 2023
MW
2013 Existing 2023 Planned 2023 Planned & Conceptual
NPCC-Maritimes Capacity
(MW) Share
(%) Capacity
(MW) Share
(%) Change
(MW) Capacity
(MW) Share
(%) Change
(MW)
Coal
1,709 25.1%
1,556 23.0% -153
1,556 23.0% -153
Petroleum
1,857 27.3%
1,892 28.0% 35
1,892 28.0% 35
Gas
848 12.5%
848 12.6% 0
848 12.6% 0
Nuclear
660 9.7%
660 9.8% 0
660 9.8% 0
Hydro
1,333 19.6%
1,333 19.7% 0
1,333 19.7% 0
Pumped Storage
0 0.0%
0 0.0% 0
0 0.0% 0
Geothermal
0 0.0%
0 0.0% 0
0 0.0% 0
Wind
252 3.7%
311 4.6% 59
311 4.6% 59
Biomass
141 2.1%
151 2.2% 10
151 2.2% 10
Solar
0 0.0%
0 0.0% 0
0 0.0% 0
TOTAL 6,800 100.0% 6,752 100.0% -49 6,752 100.0% -49

NPCC-Maritimes
NERC | 2013 Long-Term Reliability Assessment | December 2013
Page 86
Planning Reserve Margins
During summer and winter peak load periods, all Planning Reserve Margins for the Maritimes Area do not fall below the
Reference Margin Level at any time, and they exceed 26 percent during the assessment time frame.
With fiscal restraint, challenging economic conditions, and anticipated gain and loss-of-loads, the aggregated growth rate
for the combined subareas increases slightly and then turns marginally negative for both the summer and winter seasonal
peak load periods over the 10-year assessment period. This indicates that any aggregated growth will be effectively offset
by the sum of any DSM projections or load losses included in the subarea forecasts.
Though not specifically identified in the load projections, the load growth in the southeastern corner of New Brunswick has
outpaced the rest of that subarea. Planning studies to propose transmission solutions that will reliably supply load in the
southeastern area, which includes the Prince Edward Island and Nova Scotia Interconnections, are ongoing. Nova Scotia is
expected to experience modest load reductions. The declines in these two subareas more than offset the modest growth
forecast for the much smaller Prince Edward Island area, where an increase in electric heating is driving an average annual
increase of 1.7 percent for the assessment period, and the northern Maine region, where a practically flat annual growth
rate of 0.5 percent was projected for all assessment years.
Current and projected Energy Efficiency effects are incorporated directly into the load forecast for each of the areas. DR is
specifically identified. Winter DR is projected at levels approximating 250 MW until 2019; after 2019, it drops to about 185
MW. DR in the Maritimes Area is uniformly load-modifying and is not used for peak shaving. It is used to reduce demand
during emergencies and is not backed by capacity reserves.
Jurisdictions within the Maritimes Area have established Energy Efficiency corporations or government agencies whose
mandates are to provide sustainable Energy Efficiency and conservation solutions to customers. Policy drivers include
maintaining affordable electricity prices for customers and lessening the impact of energy use on the environment.
Additionally, a pilot program called PowerShift Atlantic is developing the capability to use load control for Ancillary Services.
Launched in 2010 as part of the Clean Energy Fund, PowerShift Atlantic is a collaborative research project led in partnership
by New Brunswick Power, Saint John Energy, Maritime Electric, Nova Scotia Power, New Brunswick Power – System
Operator, the University of New Brunswick, Natural Resources Canada, the government of New Brunswick, and the
government of Prince Edward Island. This four-year innovative program will run until 2014, piloting technology that shifts
energy supply to specific appliances in homes and commercial buildings in order to optimize wind generation with minimal
or no disruption to participating electric utility customers.
There is one planned retirement over the assessment period, located in Nova Scotia. A 153-MW generator is expected to be
retired in January 2018 and is tied to the conceptual construction of an undersea HVdc cable between Nova Scotia and the
Canadian Province of Newfoundland and Labrador as part of the Muskrat Falls hydroelectric generation development. Unit
retirements in Nova Scotia are reviewed and re-evaluated based on system requirements and regulatory compliance. The
33-MW Burnside 4 generator in Nova Scotia unit is out of service and is expected to be back in service in 2015. Because of
its small size, it does not have a significant effect on resource adequacy measures.
In an effort to retain large industrial customers that own renewable energy sources in New Brunswick and promote
renewable energy, New Brunswick Power, the government-owned utility in New Brunswick, purchases surplus renewable
energy from them. The energy produced never enters the New Brunswick system and is netted out against the customers’
load. Current load forecasts assume no further uptake of this program. The impact of this program on resource adequacy is
minimal since the major sources are already included in area capacity totals. There are no other significant increases in
distributed generation identified in the Maritimes Area except in Nova Scotia. Existing distributed resources are netted
against load and not counted as capacity. In Nova Scotia, increased amounts of renewable generation will be connected to
the distribution system through the Community Feed-in-Tariff as outlined in the province’s Renewable Electricity Plan in
April 2010. Further study will be required to fully understand the cost and technical implications related to possible

NPCC-Maritimes
NERC | 2013 Long-Term Reliability Assessment | December 2013
Page 87
transmission upgrades and new operational demands on existing infrastructure. Nova Scotia Power has commissioned a
renewables integration study with General Electric. The results of the study will be available this year and should provide
insight into the resource adequacy and operational issues related to increased renewables.
The PowerShift Atlantic pilot project (described in the DSM section of this report) is an example of a potential
“nontraditional” Demand-Side resource that could be developed in the Maritimes Area. The program attempts to balance
variable wind generation against loads that contain some degree of energy storage, such as water heaters to make more
effective use of wind resources. Any impact on resource adequacy would be positive since it allows wind to be dispatched
with less variability.
With the exception of minimal summer derates in northern Maine, biomass facilities in the Maritimes are not derated
during peak load periods. Hydro facilities contain enough storage at the sites to allow them to be dispatched at their full
ratings during peak load periods. Currently in New Brunswick, Prince Edward Island, and Northern Maine, wind generators
are accredited with on-peak capacity based on their observed or expected seasonally adjusted capacity factors. In Nova
Scotia, the firm capacity of wind projects is assumed to be 20 percent of the installed capacity if the project has the
necessary transmission capacity available. The Maritimes Area is reviewing and assessing previously used methods for
attributing on-peak wind capacity. To this end, for probabilistic resource adequacy analysis at the NPCC regional level, the
Maritimes Area supplies an hourly wind profile rather than a derated capacity value during peak load periods.
Plans are underway for the individual jurisdictions within the Maritimes Area to coordinate the sharing of wind data and
possibly wind forecasting information and services. With the integration of more variable resources, it may become
necessary to curtail these generation levels at light load periods to ensure adequate levels of Spinning Reserves and inertia
for frequency control. The grid codes in the area require the ability to curtail to be designed into the control systems for
large-scale variable resources and to be available for system operators to dispatch accordingly.
The Maritimes Area is not dependent on capacity transactions with neighboring areas to meet its Reserve Margin Reference
targets. Beginning in 2018 and continuing well beyond the assessment period, the Maritimes Area has included 153 MW of
firm imports from the Newfoundland utility, Nalcor, but this is completely offset by the corresponding retirement of a coal-
fired generator in Nova Scotia with no significant impacts on resource adequacy.
Transmission and System Enhancements
During the review period, one major new transmission line addition is categorized as Conceptual. In 2018, development of
the Muskrat Falls hydroelectric project would see the installation of an HVdc undersea cable link (Maritime Link) between
Newfoundland and Labrador and Nova Scotia.
In recent years, the load growth in southeastern New Brunswick has exceeded growth in other areas of the province. This
has resulted in increased reliance on the Dedicated Path Logic (DPL) SPS as well as the eastern UVLS schemes for loss of
345-kV lines feeding the Southeast. Planning studies are ongoing to propose transmission solutions that will reliably supply
load in the southeastern area, which includes the Prince Edward Islands and Nova Scotia Interconnections.
In 2014, a 345-kV breaker installation will complete a ring bus at the tap point to which the 467-MW Belledune plant in New
Brunswick is connected, increasing the reliability supply from the second-largest generator in the Maritimes Area.
Additionally, the Eel River HVdc Interconnection with the Canadian province of Québec will be refurbished during 2014. This
interface provides import and export capability up to 350 MW with Quebec and contributes to frequency response in the
Maritimes Area. An additional 240-kV breaker will be installed to allow the separation of supplies to two 240/138-kV
transformers in the substation at Eel River.
The construction periods for the above projects are short and can be scheduled during times that will not significantly affect
the reliability of the area. The Maritime Link Project and the retirement of a comparably sized unit will be timed to coincide
so that the project will not have an impact on overall reliability.

NPCC-Maritimes
NERC | 2013 Long-Term Reliability Assessment | December 2013
Page 88
Regarding system enhancements, a new 75-Mvar reactor will be installed during 2014 at the Belledune Terminal and will
provide additional voltage control in the area during times of light load. UVLS is used throughout the Maritimes Area to
maintain adequate voltages during contingencies to major transmission facilities. In particular, this is the case in
southeastern New Brunswick where, driven by a lack of generating facilities, UVLS and SPS facilities are critical to maintain
voltages during loss of major transmission facilities feeding that sector. In that region, up to 475 MW (as estimated at peak
load) can be interrupted using UVLS. This is not expected to change during the assessment period; however, studies are
underway to identify specific enhancements that may increase transfer capabilities and reliability and reduce exposure to
events that may trigger UVLS operation.
There are currently no specific plans to install more SPS schemes in the Maritimes Area, but this does not rule out the
possibility during the assessment period. SPS schemes are considered when it is in the best interests of the customer to
provide an efficient and reliable electric system. The ongoing studies to enhance the capabilities of the southeastern
transmission supply lines will assess the use of such technology. Current SPS schemes are expected to remain in service for
the assessment period.
As previously mentioned in this report, while still in pilot study mode, PowerShift Atlantic seeks to take control of loads
with some inherent energy storage capability (such as water heaters), dispatching their reduction as variable wind
resources drop in output and reintroducing them when the wind generation picks back up. This levels the output from
these variable resources and frees up traditional resources from this balancing duty, allowing them to be used to supply the
remaining loads.
The main utility in New Brunswick (New Brunswick Power) is investing heavily in smart grid technology, which includes
capabilities to control loads in its jurisdiction. To the extent that this leads to a reduction in peak loads, it will enhance
reliability.
Long-Term Reliability Issues
With a capacity of approximately 1,330 MW, the hydroelectric power supply system in the Maritimes Area is predominantly
run-of-the-river (as opposed to storage-based) and is not able to be held in reserve to stave off drought conditions. If such
conditions were to exist in the Maritimes Area, operation of the system would be relatively unchanged. The hydro system
would still be used to follow load in the area and respond to sudden short-term capacity requirements. Thermal units
would be used to keep the small storage capability of the hydro systems usable for load following and peak supply.
RPSs have led to the development of substantially more wind generation capacity than any other renewable generation
type. Reduced frequency response is associated with wind generation and, with increasing levels in the future, may require
displacement with conventional generation during light load periods.
Because of the relative size of the area’s largest generating units compared to its aggregated load, the area carries
substantial reserve capacity. For this reason, a lack of response from some of the loads expected to be shed during an
interruption request will not significantly affect resource adequacy. For the same reason, and because the area peaks in
winter as opposed to neighboring jurisdictions that peak in summer, long-term outages to individual units do not cause
undue stress from a technical perspective. It is expected that any capacity or energy shortfalls due to long-term unit
outages could be offset by purchases from New England during their off-peak season, or from Québec.
There are no significant increases in distributed generation identified in the Maritimes Area except in Nova Scotia, where
increased amounts of renewable generation will be connected to the distribution system through the Community Feed-in-
Tariff outlined in the province’s Renewable Electricity Plan in April 2010. Further study will be required to fully understand
the cost and technical implications related to possible transmission upgrades and new operational demands on existing
infrastructure.

NPCC-Maritimes
NERC | 2013 Long-Term Reliability Assessment | December 2013
Page 89
The government has acknowledged the need to develop less intermittent sources of renewable energy in the New
Brunswick subarea. With the significant amount of large-scale wind energy currently being balanced on New Brunswick’s
system, the next phase of renewable energy development will focus on smaller scale projects, with a particular emphasis on
nonintermittent forms of generation, such as wood-based biomass. Wind energy will continue to be integrated in the New
Brunswick balancing area, but in measured and manageable stages. In Nova Scotia, approximately 216 MW of wind
generation, including distributed resources, is planned for installation during the assessment period. Additional RPS energy
is expected to be sourced from the Conceptual tie Maritime Link HVdc connection to the Muskrat Falls hydroelectric power
project in the Canadian province of Newfoundland and Labrador. The Maritimes Area examines cases where a complete
absence of wind in the area occurs due to weather conditions and has concluded that the area is not overly reliant on wind
generation to meet its 20 percent reserve criterion, the level at which the area meets the NPCC resource adequacy
reliability criterion.
To reduce emissions associated with energy production, governments in the Maritimes Area introduced RPSs that led to a
large-scale development of wind energy resources. Current emissions limits in the Maritimes Area are specified as annual
system volumes rather than generator-specific volumes, providing flexibility in the operation of the fleet. Future regulations
limiting GHG emissions are expected and could limit the future utilization of fossil-fuelled generation. System Operators in
the Maritimes Area are tracking such developing standards and conducting analyses regarding their impact on future
resource adequacy.
Currently, the increasing load in southeastern New Brunswick and additional renewable resources throughout the area are
being examined in the Maritimes Area as two emerging reliability issues. Load growth in the southeastern area of New
Brunswick has been more rapid than in other areas in the province. Voltages and thermal loading on lines are approaching
unacceptable levels during 345-kV contingencies for various operating scenarios. This issue may require transmission
reinforcements four to eight years from now. With recent reductions in load forecasts, emphasis on peak load reduction in
DSM programs, and a potential conceptual tie to Newfoundland that may provide a new source in the area, New Brunswick
Power is studying transmission enhancements and SPS solutions to the overload and undervoltage issues that currently do
not include 345-kV line construction within the assessment period.
If enhancements are not made and load continues to grow, this issue could affect system reliability by threatening voltage
instability and potentially overloading circuits for 345-kV outages feeding that area. Though the load growth and potential
voltage issues are localized to southeastern New Brunswick, the circuit overloads occur on parallel 138-kV circuits leading
from sources in southwestern New Brunswick to the high load areas in the Southeast. The localized low voltages and
overloads of parallel circuits during contingencies would be moderate and unlikely to create reliability problems in
neighboring Regions.
Generation levels are unaffected and with lower expected loads, the issue is purely transmission-related—predominately
affecting transfer capabilities from New Brunswick to Prince Edward Island and Nova Scotia. The impact on the resource
adequacy LOLE value is captured by modeling a reduction in tie transfer capabilities between subareas. The 2012 NPCC
Interim Review of Resource Adequacy109 showed that after transfer levels were reduced from 300 MW to 150 MW, LOLE
values did not exceed the NPCC target limit of one day in 10 years of resource inadequacy. The Reference Margins will not
be affected by this issue.
In southeastern New Brunswick, interconnection of any new resources would likely help mitigate this emerging issue. New
Transmission circuits (if required) would be feasible, since New Brunswick Power has already secured right-of-way corridors
for the circuits needed to address the issue.
109 NPCC 2012 Maritimes Area Interim Review of Resource Adequacy.

NPCC-Maritimes
NERC | 2013 Long-Term Reliability Assessment | December 2013
Page 90
The issue is most problematic for 345-kV contingencies when New Brunswick loads are at near peak levels during
particularly high southern or northern New Brunswick generation dispatches with high exports to Prince Edward Island
and/or Nova Scotia.
Nova Scotia’s Renewable Electricity Standard (RES) would displace significant amounts of fossil-fuelled generation with
renewable resources. By 2015, 25 percent of the province’s electricity sales will be supplied by renewable energy sources.
This increases to 40 percent by 2020.
The addition of renewable resources—particularly in Nova Scotia—is an emerging concern in the Maritimes area. Nova
Scotia has commissioned a renewables integration study with General Electric. The results of the study will be available by
the end of 2013 and will provide insight into the resource adequacy and operational issues related to increased renewables.
The impacts on LTRA Reserve Margin Reference levels are positive as the addition of new resources actually enhances
resource adequacy (provided that existing traditional resources are not prematurely retired as a result of the new capacity).
Increasing the amount of renewable resources could affect system reliability if variable or low-mass, slow-speed units are
added without considering the reduction of frequency response after system contingencies or transmission enhancements
to prevent voltage or overload problems. Completing system impact studies prior to interconnecting new generation should
identify whether the emergence of any of these issues could limit operation of—or the amount of—new renewable
generation added to the system on a case-by-case basis.
Many of the sites chosen for new renewable generation facilities are located near the energy sources or existing
transmission infrastructure. There is potential for such additions across the entire Maritimes area. While the added
generation may relieve congestion in some cases, the lack of adequate transmission facilities could delay or limit the
development of new renewable resources. The variable output and intermittent nature of many renewable resources is a
major daily consideration for generation dispatchers. The low inertia effects on system frequency response will be felt
mostly during off-peak, light load periods when high-mass units have been displaced by low-mass new renewable
resources.
Several new resources being considered have short installation timelines, which makes long-term capacity projections used
in the 2013LTRA reference case less reliable as projects come and go in response to changing government incentive
policies.
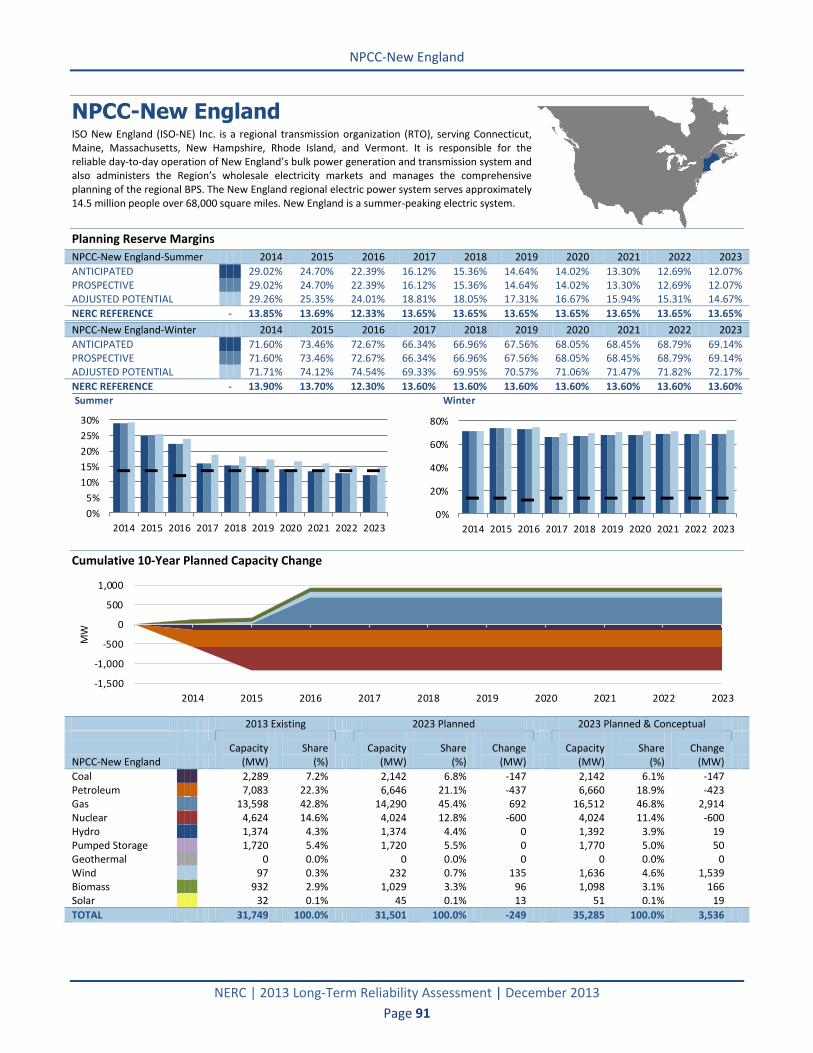
NPCC-New England
NERC | 2013 Long-Term Reliability Assessment | December 2013
Page 91
NPCC-New England ISO New England (ISO-NE) Inc. is a regional transmission organization (RTO), serving Connecticut, Maine, Massachusetts, New Hampshire, Rhode Island, and Vermont. It is responsible for the reliable day-to-day operation of New England’s bulk power generation and transmission system and also administers the Region’s wholesale electricity markets and manages the comprehensive planning of the regional BPS. The New England regional electric power system serves approximately 14.5 million people over 68,000 square miles. New England is a summer-peaking electric system.
Planning Reserve Margins
NPCC-New England-Summer 2014 2015 2016 2017 2018 2019 2020 2021 2022 2023
ANTICIPATED 29.02% 24.70% 22.39% 16.12% 15.36% 14.64% 14.02% 13.30% 12.69% 12.07% PROSPECTIVE 29.02% 24.70% 22.39% 16.12% 15.36% 14.64% 14.02% 13.30% 12.69% 12.07% ADJUSTED POTENTIAL 29.26% 25.35% 24.01% 18.81% 18.05% 17.31% 16.67% 15.94% 15.31% 14.67%
NERC REFERENCE - 13.85% 13.69% 12.33% 13.65% 13.65% 13.65% 13.65% 13.65% 13.65% 13.65%
NPCC-New England-Winter 2014 2015 2016 2017 2018 2019 2020 2021 2022 2023
ANTICIPATED 71.60% 73.46% 72.67% 66.34% 66.96% 67.56% 68.05% 68.45% 68.79% 69.14% PROSPECTIVE 71.60% 73.46% 72.67% 66.34% 66.96% 67.56% 68.05% 68.45% 68.79% 69.14% ADJUSTED POTENTIAL 71.71% 74.12% 74.54% 69.33% 69.95% 70.57% 71.06% 71.47% 71.82% 72.17%
NERC REFERENCE - 13.90% 13.70% 12.30% 13.60% 13.60% 13.60% 13.60% 13.60% 13.60% 13.60% Summer Winter
0%
5%
10%
15%
20%
25%
30%
2014 2015 2016 2017 2018 2019 2020 2021 2022 20230%
20%
40%
60%
80%
2014 2015 2016 2017 2018 2019 2020 2021 2022 2023
Cumulative 10-Year Planned Capacity Change
-1,500
-1,000
-500
0
500
1,000
2014 2015 2016 2017 2018 2019 2020 2021 2022 2023
MW
2013 Existing 2023 Planned 2023 Planned & Conceptual
NPCC-New England Capacity
(MW) Share
(%) Capacity
(MW) Share
(%) Change
(MW) Capacity
(MW) Share
(%) Change
(MW)
Coal
2,289 7.2%
2,142 6.8% -147
2,142 6.1% -147
Petroleum
7,083 22.3%
6,646 21.1% -437
6,660 18.9% -423
Gas
13,598 42.8%
14,290 45.4% 692
16,512 46.8% 2,914
Nuclear
4,624 14.6%
4,024 12.8% -600
4,024 11.4% -600
Hydro
1,374 4.3%
1,374 4.4% 0
1,392 3.9% 19
Pumped Storage
1,720 5.4%
1,720 5.5% 0
1,770 5.0% 50
Geothermal
0 0.0%
0 0.0% 0
0 0.0% 0
Wind
97 0.3%
232 0.7% 135
1,636 4.6% 1,539
Biomass
932 2.9%
1,029 3.3% 96
1,098 3.1% 166
Solar
32 0.1%
45 0.1% 13
51 0.1% 19
TOTAL 31,749 100.0% 31,501 100.0% -249 35,285 100.0% 3,536

NPCC-New England
NERC | 2013 Long-Term Reliability Assessment | December 2013
Page 92
Planning Reserve Margins
New England’s (ISO-NE) Reference Margin Level (target reserve margin) is based on the capacity needed to meet the NPCC
one day in 10 years loss-of-load expectation (LOLE) resource planning reliability criterion. The amount of capacity needed,
referred to as the Installed Capacity Requirement (ICR), can and does vary from year to year, depending on expected
system conditions. The ICR, which is calculated three years in advance for each Forward Capacity Auction, results in
Reference Margin Level of 13.85 percent in 2014, 13.69 percent in 2015, 12.33 percent in 2016, and 13.65 percent in
2017.110 In this assessment, the last calculated Reference Margin Level (13.65 percent) is applied for the remaining years.
In the 2014 summer, ISO-NE’s Anticipated Resources will amount to 34,744 MW, which will result in an Anticipated Reserve
Margin of 29.0 percent of the reference demand forecast of 26,929 MW.111 The Anticipated Reserve Margin falls just below
the assumed Reference Margin Level of 13.65 percent beginning in 2021, decreasing to 12.07 percent by 2023.
This Anticipated Reserve Margin during the annual peak reflects the Seasonal Claimed Capability112 (which could be higher
than the Capacity Supply Obligation (CSO))113 of all ISO-NE generators as well as demand resources and imports that have
CSOs as a result of ISO-NE’s Forward Capacity Market (FCM) auctions.
The primary reason for the Anticipated Reserve Margin falling below the Reference Margin Level is that ISO-NE does not
extend the import CSOs that are in place in 2016 through the remainder of the assessment period. The imports that are
assumed for 2017 through 2023 are those based on long-term firm contracts, which are approximately 1,500 MW lower
than the CSOs in 2016. In reality, that steep reduction in capacity will not occur because ISO-NE will procure the capacity
needed to meet the Installed Capacity Requirement with its FCM. If the 2016 import amount was carried through the
remainder of the assessment period, the Anticipated Reserve Margin would be nearly 20 percent in 2023. If the Anticipated
Reserve Margin falls below the level required to meet the regional reliability standards due to retirements associated with
environmental regulations, ISO-NE will purchase the needed capacity through its FCM.
As there has not been any change in the New England footprint or any significant changes in the economic outlook or the
long-term weather outlook, the 2013 demand forecast has not changed significantly from the 2012 demand forecast. There
are no particular areas where load growth is significantly above or below the regional aggregate New England load growth.
The 2014 summer peak demand forecast is 28,290 MW, and the Total Internal Demand, which takes into account 1,361
MW of passive demand resources (Energy Efficiency),114 is 26,929 MW. This year’s forecast of the 10-year summer Total
Internal Demand compound annual growth rate (CAGR) is 0.84 percent, which is slightly higher than the 2012LTRA
reference case projection of 0.79 percent. Changes in the economic forecast led to this decrease.
DSM in the ISO-NE BPS includes both active and passive demand resources. Active demand resources consist of real-time
DR and Real-time Emergency Generation, which can be activated with the implementation of ISO-NE Operating Procedure
No. 4 – Action during a Capacity Deficiency (OP-4).115 Some assets in the real-time DR programs are under direct load
control by the load response providers (LRP). The LRP implements direct load control of these assets upon dispatch
instructions from ISO-NE—for example, interruption of central air conditioning systems in residential and commercial
facilities. Passive demand resources (i.e., Energy Efficiency and conservation) include installed measures (e.g., products,
equipment, systems, services, practices, and strategies) on end-use customer facilities that result in additional and
110 The ICR values for 2017–2018 are proposed and will be filed with FERC by November 2013. 111 Without a reduction of 1,361 MW to account for passive demand resources, the demand would be 28,290 MW. 112 Seasonal Claimed Capability is the audited capacity rating of the resource. The audits are conducted every season. 113 Capacity Supply Obligation is the amount of installed capacity obligation a resource has assumed for a Capacity Commitment Period extending
from June 1 of a particular year to May 31 of the following year. 114 Energy Efficiency is treated as Demand Response in ISO-NE and receives a capacity payment. 115 OP-4 is used by ISO-NE operators when resources are insufficient to meet the anticipated load plus Operating Reserve Requirement.

NPCC-New England
NERC | 2013 Long-Term Reliability Assessment | December 2013
Page 93
verifiable reductions116 in the total amount of electrical energy used during on-peak hours. Active demand resources are
based on the CSOs obtained through ISO-NE’s FCM three years in advance. The CSOs decrease slightly from 1,694 MW in
2014 to 1,621 WM in 2015 and then drop to 1,044 MW in 2016. Since there are no further auction results, the CSOs are
assumed to remain at the same level through the end of the reporting period.
Energy efficiency is also secured by means of FCM CSOs. However, ISO-NE has developed an Energy Efficiency forecasting
methodology that takes into account the potential impact of growing Energy Efficiency and conservation initiatives in the
Region to project the amount of Energy Efficiency beyond the years when the FCM CSOs have already been procured.
Energy efficiency has generally been increasing and is projected to continue growing throughout the study period, but at a
continually decreasing growth rate. The amount of Energy Efficiency in 2014 is 1,361 MW, increasing by 13 percent to 1,535
MW in 2015, and then decreasing slightly to 1,520 MW in 2016. The amount of Energy Efficiency is projected to be about
2,800 MW by 2023.
Both passive and active demand resources are treated as capacity in New England’s FCM. As previously noted, the active
demand resources can be triggered by ISO-NE in real time under OP-4 to help mitigate an actual or anticipated capacity
deficiency by reducing the peak demand. For example, on July 22, the 2011 peak demand day, a total of 642 MW of active
demand resources were activated and 644 MW responded, corresponding to a response rate of 100.3 percent. On another
OP-4 occurrence on the morning of December 19, 2011, active demand resources reduced the load by 380 MW, which was
75.4 percent of the 504 MW activated. The reason for the lower response on that winter day was that the event occurred
early in the morning when the loads were low and fewer demand resources were available to respond.
A significant number of active demand resources are serving as capacity in the FCM. Most of these resources are not
dispatched in the ISO’s energy-market clearing process; rather, they are activated when the ISO faces a capacity deficiency
during the operating day. ISO-NE is proposing market rule changes that allow DR to set market-clearing prices that better
reflect the costs of activating these resources in the day-ahead and real-time energy markets.
In response to Order 745: Demand Response Compensation in Organized Wholesale Energy Markets, ISO-NE proposed two
sets of market rule changes associated with the full integration of price-responsive demand into the energy markets.117
These market rule changes will require all real-time DR programs to participate as capacity resources, with the associated
requirement to participate in the energy market starting on June 1, 2017.
ISO-NE is analyzing changing environmental compliance requirements that could impact generator availability due to
economic impairment of generators complying with air, water, and GHG restrictions. Both the Salem Harbor and Vermont
Yankee retirements were included in the Planning Reserve Margin calculations, and the reserve margin does fall below the
13.6 percent Reference Reserve Margin in 2021. ISO-NE has adequate capacity up to three years in advance with its
Forward Capacity Auctions and Annual Reconfiguration Auctions.
Salem Harbor Units 3 and 4, which are coal- and oil-fired units with a combined capacity of 587 MW, are scheduled to retire
by June 1, 2014. As the Salem Harbor plant is located in the Boston subarea, ISO-NE performed a reliability review to
determine the impact of the retirement of the full plant. ISO-NE found that under certain second contingency scenarios
with a 345-kV line-out as the initial outage, thermal overloads could exist in the local area. To address these thermal
overloads, ISO-NE and the affected TOs developed plans to perform 115-kV transmission line reconductoring projects on
portions of five lines prior to the plant retirement. In addition, the Vermont Yankee Nuclear Power Plant, with a capacity of
600 MW, recently announced that it will be shutting down by the end of 2014.
116 New passive demand resources must submit a Measurement and Verification (M&V) Plan, which must be approved by ISO-NE. The project
sponsor is required to submit an annual certification that the project continues to comply with their ISO-approved M&V Plan. ISO-NE has the authority to initiate an audit of any demand resource, including Energy Efficiency resources (see Market Rule 1).
117 ISO-NE Price Responsive Demand.

NPCC-New England
NERC | 2013 Long-Term Reliability Assessment | December 2013
Page 94
ISO-NE continues to integrate new resources, including variable resources, into the network. All new resources are studied
in detail by ISO-NE Operations Engineering prior to commercial operation. These are all integrated through the use of
operating guides, interface limits, and the Energy Management System (EMS).
The ISO has made progress implementing the recommendations from the New England Wind Integration Study (NEWIS),118
which analyzed various planning, operating, and market aspects of wind integration for up to a 12-GW addition of wind
resources to the system. The recommendations developed from NEWIS led ISO-NE to implement a centralized wind power
forecast, which is currently under development. To facilitate system operation with potentially large amounts of wind
power, ISO-NE Operating Procedure No. 14 Appendix F – Wind Plant Operators Guide (OP-14F)119 was implemented in
September 2011. OP-14F is chiefly concerned with requirements for Real-time and static-type data that will facilitate
accurate wind power forecasting over the intra-day, day-ahead, and week-ahead timescales, as well as data for use in
situational awareness functions for ISO system operators.
The ISO will continue to analyze wind integration issues and work with stakeholders to address the issues challenging the
wind interconnection process and the performance of the system with wind resources in locally constrained areas. New
England is applying advanced technologies, including FACTS and HVdc, phasor measurement units (PMUs), and smart
meters, which may be used to provide the regulation and reserve services required to reliably integrate variable renewable
resources. Currently there is only 97 MW of on-peak wind capacity in New England, and only 135 MW (on-peak capacity) of
Future-Planned wind additions during the study period.
Photovoltaic (PV) resources are rapidly developing in New England and predominantly are situated relatively close to load
centers. Most of the PV resources, however, are not directly observable or controllable by the ISO and may respond
differently to grid disturbances than larger, conventional generators. New ISO initiatives are addressing these highly
complex issues with stakeholders.120
Firm summer capacity imports are based on FCM CSOs, which amount to 1,851 MW in 2014 and decrease to 1,607 MW in
2016. In addition to capacity imports that have CSOs, external transactions can participate in the Day-Ahead and Real-time
Energy Markets. In 2012, the imports to New England from New York, New Brunswick, and Quebec at the time of the peak
demand totaled 2,251 MW or 1,475 MW more than the CSO of 776 MW. At the time of the 2011 peak, the amount of
actual imports was 2,001 MW, which was 765 MW more than the CSO. As the Forward Capacity Auction imports are based
on one-year contracts, beginning in 2017 the imports will reflect only known, long-term Installed Capacity (ICAP) contracts
totaling approximately 100 MW. If the imports beyond the 2016 summer do not clear in future FCM commitment periods,
the lost capacity will be replaced by other supply or Demand-Side resources. For the 2014 summer, there is a firm capacity
sale to New York (Long Island) of 100 MW anticipated to be delivered via the Cross-Sound Cable (CSC). This firm capacity
sale holds constant through the assessment period.
118 New England Wind Energy Study (NEWIS). 119 ISO New England Operating Procedure No. 14. 120 Solar photovoltaic (PV) resources being installed in New England are “behind-the-meter,” meaning that they are not visible to ISO operations
in real time. However, a portion of these projects are registered in ISO’s energy market. As of the end of 2012, ISO estimated that approximately
two-thirds of the installed behind-the-meter PV capacity in the Region (approximately 250 MW, dc nameplate) is not registered in ISO’s energy
market. ISO-NE has small amounts (less than 5 MW total) of nontraditional resources (e.g., battery storage, flywheels, electric thermal storage,
and aggregated load control) that provide regulation service through a pilot program. After the pilot program concludes, these resource types will
remain eligible to provide regulation service. There is no current expectation that these resources will participate in the energy and capacity
markets in the future. However, technologies with multi-hour storage capability may become economically viable participants in the energy
market depending on fuel prices, penetration of renewable resources, and localized transmission congestion.

NPCC-New England
NERC | 2013 Long-Term Reliability Assessment | December 2013
Page 95
Transmission and System Enhancements
There are several transmission projects projected to come on-line during the assessment period that are important to the
continuation of, or enhancement to, system or subarea reliability. These projects are the result of progress made by the ISO
and regional stakeholders in analyzing the transmission system in New England and developing and implementing back-stop
solutions to address existing and projected transmission system needs. The major projects under development in New
England include the Maine Power Reliability Program (MPRP), the New England East–West Solution (NEEWS), and the Long-
Term Lower Southeast Massachusetts (SEMA) project. The new paths that are part of MPRP, many components of which
are under construction, will provide the basic infrastructure necessary to increase the ability to move power from New
Hampshire into Maine and improve the ability of Maine’s transmission system to move power into the local load pockets as
necessary. NEEWS consists of a series of projects that will improve system reliability in areas including Springfield,
Massachusetts, and Rhode Island, and increase total transfer capability across the New England east-to-west and west-to-
east interfaces. The Long-Term Lower SEMA project addresses reliability concerns in the lower southeastern Massachusetts
area, which includes Cape Cod.
At this time, there are no plans to install more UVLS schemes in New England. Currently, northern New England has the
potential to use approximately 600 MW of load shedding as part of UVLS. However, it is important to recognize that a
significant portion of this load shedding is normally not armed and is only armed under severe loading conditions with a
transmission line or autotransformer already out of service. Presently, two significant projects could completely eliminate
the need for the UVLS or significantly reduce the likelihood of depending on such schemes: the Vermont Southern Loop
Project (completed in late 2010) and the MPRP (scheduled to be completed in 2015).
There are no SPSs that are proposed to be installed in lieu of proposed regulated transmission facilities to address system
reliability needs. However, two new, temporary SPSs are to be installed in Maine as part of the MPRP. The first SPS is
needed to ensure reliable system operation due to configuration changes at South Gorham while the MPRP is under
construction. The second SPS is needed to ensure reliable system operation due to configuration changes in the Rumford
area while the MPRP is under construction. Once construction of the necessary portions of the MPRP is complete
(anticipated in 2015), these two temporary SPSs will be removed. It should also be noted that several existing SPSs will be
removed from service after the MPRP project is completed.
New smart grid technologies are being used in New England to improve the electric power system’s performance and
operating flexibility. Smart grid technologies, such as FACTS, are used to facilitate the integration of variable resources in
the power system. Because much of the potential for wind development is remote from load centers, additional
transmission development may be pursued. Some of these transmission improvements may use HVdc technology, which is
cost-effective over long distances. Both HVdc and FACTS are regularly considered as part of transmission planning studies
when their application economically meets system or generator interconnection needs.
On July 1, 2010, ISO-NE received a U.S. Department of Energy (DOE) Smart Grid Investment Grant Award and subsequently
began a three-year Synchrophasor Installation and Data Utilization (SIDU) project. The goal of the project is to provide ISO-
NE and associated TOs with a significantly expanded base of PMUs, Phasor Data Concentrators, and greatly enhanced
phasor data analytical tools. The SIDU project supplements the five existing PMUs in the Region with at least 30 new PMUs
at various substations around New England. The project is focused on the deployment of Synchrophasor technology as a
foundation for the next generation of power grid situational awareness and serves as the smart grid technology platform
upon which advanced analysis and visualization tools can be deployed. It is hoped that the SIDU project will yield
efficiencies in the way the grid is operated and will improve reliability, serving as a backbone for regional smart grid efforts.
In addition, several investor-owned and municipal utilities in New England are conducting smart grid pilot programs or
projects ranging from smart meter deployments to full-scale direct load control and distribution automation projects. ISO-
NE anticipates that these projects may lead to more significant smart grid assets becoming available for potential utilization
during the assessment period.

NPCC-New England
NERC | 2013 Long-Term Reliability Assessment | December 2013
Page 96
Long-Term Reliability Issues
The New England area is not currently experiencing a drought. However, in the event that the Region was to experience an
extended drought, some traditional hydroelectric stations could be temporarily capacity- or energy-constrained. Due to the
relatively small contribution to overall capacity from hydroelectric facilities (1,374 MW or 4.3 percent), any potential
reduction in hydroelectric energy production due to regional drought conditions could be readily supplemented by
increased levels of other types of generation.
New England has witnessed significant growth in the development of solar PV resources over the past few years, and
continued growth of PV is anticipated. Regional PV installations are small (i.e., less than 10 MW) and interconnected to the
distribution system. States with policies more supportive of PV (e.g., Massachusetts) are experiencing the most growth of
the resource. While existing amounts of PV have yet to have a significant impact on system operations, the ISO is working
on several initiatives aimed at facilitating the reliable and efficient integration of significant amounts of PV in the Region.
RPSs mandate that Energy Efficiency and renewable resources must supply 31.8 percent of the Region’s projected electric
energy by 2022,121 and 20.2 percent of RPSs and policies addressing renewable supply goals.
Possible solutions for meeting or exceeding the Region’s RPSs include (1) developing the renewable resources in the ISO
generator interconnection queue; (2) importing renewable resources from adjacent Control Areas; (3) building new
renewable resources in New England not yet in the queue; (4) using new behind-the-meter projects; and (5) using eligible
renewable fuels, such as biomass, in existing generators. Achievements in Energy Efficiency in the Region that exceed the
levels in the Energy Efficiency forecast could reduce the amount of new renewable resources required to meet state RPSs.
Concerns exist over the resultant impacts from compliance with state RPSs and the potential build-out of these new
renewable resources. Because of concerns over the increasing amounts of wind capacity, ISO-NE completed a major wind
integration study that identified the detailed operational issues of integrating large amounts of wind resources into the
New England power grid. The New England Wind Integration Study (NEWIS) found that the large-scale integration of wind
resources is feasible, but the Region will need to continue addressing a number of issues, including the development of an
accurate means of forecasting wind generation outputs. As a result of that recommendation, ISO-NE implemented a
centralized wind power forecasting service. The Wind Power Forecast Integration Project (WPFIP) is being implemented in
two phases.122 The addition of VERs, particularly wind, will likely grow with time, increasing the need for flexible resources
to provide operating reserves as well as other ancillary services, such as regulation and ramping.
Distributed energy resources must be integrated into the local electric company’s distribution systems and therefore must
comply with the interconnection standards applicable to such systems. Although distributed generation has not
traditionally been a major concern for BPS operation, the amount of distributed generation, particularly PV, has been
increasing rapidly.
ISO-NE has been informed of two impending retirements: Salem Harbor Units 3 and 4 will cease operations in June 2014,
and Vermont Yankee is scheduled to close by the end of 2014. Preserving the reliable operation of the system will become
121 This percentage includes an 11.6 percent reduction in the Region’s projected electric energy consumption in 2022 that resulted from passive
demand resources and the forecasted energy-efficiency savings, as reported in the 2013–2022 Forecast Report of Capacity, Energy, Loads, and Transmission (2012 CELT Report).
122 Phase 1 of the WPFIP, scheduled to be completed in the second half of 2014, focuses on setting up the communications and database systems to enable the delivery of wind power forecasting-related data from wind plants through ISO-NE to the wind power forecaster service and vice-versa, as well as incorporating the forecasts into the day-ahead unit commitment and periodic unit commitment refinement processes. Phase 2 of the WPFIP will integrate wind power into the real-time dispatch process, which means that wind plants will submit economic offers and be able to set price at their local bus, and transmission congestion will be managed in a transparent and automated process (versus the typically manual process that is currently used for real-time self-schedule resources). Phase 2 will also include closer coupling with the short-term outage scheduling process, and will include publishing of the aggregate week-ahead wind power forecast in order for market participants to be able to incorporate this information into their decision-making processes and market strategies.

NPCC-New England
NERC | 2013 Long-Term Reliability Assessment | December 2013
Page 97
increasingly challenging with other potential retirements and the need for operating flexibility, particularly in light of the
reliance on natural gas resources. As a result of these factors, the need for reliable resources, especially those able to
provide operating reserves and ramping capabilities, is expected to increase. To begin addressing this need, the ISO
procured additional operating reserves. To compensate for the observed nonperformance of generators relied on for
contingency response, the ISO increased the total 10-minute operating reserve requirement by 25 percent. Consequently,
the total 10-minute operating reserve previously equivalent to the largest single contingency is now 125 percent of this
contingency.
Existing and pending state, regional, and federal environmental requirements will require the addition of pollution control
devices to many generators, reducing water use and wastewater discharges, and in some cases, limiting operations and
increasing retirements. The ISO initiated a study to better quantify the implications of the likely retirement of several
generating units and their potential replacements. Most of the at-risk capacity would face compliance or retirement
decisions starting late in this decade and extending into the early part of the next decade.
Pending EPA restrictions may require existing fossil fuel and nuclear capacity to mitigate the adverse impacts of cooling
water use, with compliance due between 2014 and 2021 for some generators. Modification of cooling water use may be
necessary for up to 12.1 GW of generating capacity, with a subset of 5.6 GW (those with larger withdrawal capacities)
potentially needing to convert from once-through to closed-cycle cooling systems.123
The EPA’s proposed revisions to the Effluent Limitation Guidelines (ELG) would require many thermal generating stations to
reduce or remove certain contaminants from their wastewater discharges beginning in 2017. However, based on EPA’s
proposed approach to the ELG revisions, ISO anticipates limited impact on existing fossil and nuclear stations in the Region.
Approximately 7.9 GW of existing coal- or oil-fired capacity in the Region is subject to EPA’s final MATS, which require
compliance by early 2015. However, much of this capacity is already retrofitted with the controls needed to comply with
state air toxics regulations and less than 1 GW of affected capacity is expected to retire due to MATS.124 Recent revisions to
air quality standards that limit ambient concentrations of ozone and its precursors, fine particulate matter, and sulfur
dioxide will require additional reductions from larger fossil fuel-fired generators while technology-based performance
standards affect other generators.125 At this time there are no planned outages for generator environmental retrofits that
would impact reliability. Any retrofits required under MATS are expected to be completed (or have already been
completed) during traditional outage periods. At this time, ISO-NE does not anticipate an impact on reliability during
shoulder months due to environmental regulations being implemented.
The procedures currently in place to maintain system reliability include reliability agreements and out-of-merit unit
commitments. However, ISO-NE is studying longer-term solutions to the problem, such as appropriate enhancements to
wholesale market design and system planning procedures. Losing a significant quantity of coal, oil, and nuclear capacity
could further increase the Region’s dependence on natural gas-fired resources. If all of the Region’s older oil units were to
seek retirement, new capacity would be required to satisfy the Installed Capacity Requirement.
As part of the Strategic Planning Initiative, the ISO is collecting and analyzing data to identify the units expected to face
significant capital investments in the longer term because of environmental compliance deadlines. In addition, a Strategic
123 EPA, Cooling Water Intake Structures § 316(b), Notice of Proposed Rulemaking, 76 FR 22174 (April 20, 2011). Applies to existing and new
cooling water intake structures (CWIS) at power plants and manufacturers. 124EPA, National Emission Standards for Hazardous Air Pollutants: Coal- and Oil-fired Electric Utility Steam Generating Units, Final Rule 77 FR 9304
(February 16, 2012). EPA developed standards under Section 112(d) to reduce hazardous air pollutant (HAP) emissions from this source category. MATS was proposed on May 3, 2011 (76 FR 24976), and included proposed amendments to the criteria pollutant new source performance standards (NSPS) for utilities.
125 EPA, National Ambient Air Quality Standards for Ozone, Final Rule, 73 FR 16436 (March 27, 2008), National Ambient Air Quality Standards for Particulate Matter, Final Rule, 78 FR 3086 (January 15, 2013), National Ambient Air Quality Standards for Sulfur Dioxide, Final Rule, 75 FR 35520 (June 22, 2010).

NPCC-New England
NERC | 2013 Long-Term Reliability Assessment | December 2013
Page 98
Transmission Analysis was used to evaluate how the retirement of at-risk units would affect reliability and to locate the
most favorable locations for replacing the retired units. As part of this analysis, ISO-NE is also developing a conceptual
system build-out, which would be necessary for combinations of unit retirements, repowering, and integrating remote wind
generators.
During the past few years, ISO-NE grid operators experienced numerous events during stressed system conditions when the
performance and flexibility of power plants and demand resources were insufficient to correct these situations in a timely
manner. This led to a growing concern that as the power system continues to evolve, the mix of supply resources may be
unable to operate when and as needed to maintain the grid’s present level of reliability.
These concerns arise from several different challenges ISO-NE is facing: (1) the increasing reliance on natural gas as a fuel
source for power plants and the potential for reduced operational performance during stressed system conditions; (2) the
large number of aging, economically challenged oil- and coal-fired generators that provide fuel diversity to the resource
mix; and (3) the greater future needs for flexible supply resources to balance variable renewable resources that have
operating characteristics markedly different from those of traditional generating resources. These three challenges are
discussed below in order of urgency.
MITIGATING THE RISKS OF NEW ENGLAND’S DEPENDENCE ON NATURAL GAS
Approximately 12,000 of the 14,000 MW of generating capacity built in New England during the past 15 years is natural gas
combined-cycle units, and gas continues to be the fuel of choice for new power plant construction. The Region’s growing
dependence on natural gas and its related issues have been a consistent concern during winter when the priority for natural
gas supplies goes to heating New England’s homes and businesses. But as the use of natural gas has increased, this
dependence has become a major challenge for managing the electric grid throughout the year. As older coal- and oil-fired
plants retire and new gas-fired plants are built to replace them, it is likely the Region will come to rely even more on this
fuel. In addition, gas-fired plants can provide much of the flexibility needed to balance variable wind power resources;
therefore, it is expected that gas-fired resources will be needed on-line as wind resources are built and interconnected.
The lack of dependable fuel arrangements by generators,126 limited on-site fuel storage or alternate fuel arrangements, and
increasing constraints on the pipeline system have hindered the performance of New England’s natural gas generators,
creating potentially serious, immediate risks to grid reliability. The Region’s growing dependence on natural gas for power
generation is a rapidly escalating strategic risk.
If contingencies occur during situations when the weather is cold and gas-supply margins are tight, the electric system is
vulnerable. When other resources suddenly become unavailable, the ISO’s system operators face significant challenges
identifying additional resources to cover the load and the operating reserve requirement. A large, single-source contingency
on the power system at times such as this could put the Region immediately into a reserve shortage and cause the
activation of multiple steps of procedures to manage capacity deficiencies (i.e., OP 4) or more serious actions, including
load shedding.
AGING GENERATOR FLEET
By 2020, nearly 8,300 MW of ISO-NE’s generation is expected to be more than 40 years old. Representing more than 25
percent of total generating capacity, a significant portion of New England’s generator fleet faces retirement.
The rising costs associated with oil and coal and the declining costs of natural gas have made it difficult for older oil and coal
power plants to compete against newer, more efficient natural gas generators. For example, the Region’s oil-fired
generators represent more than 20 percent of existing capacity but provided less than 1 percent of the Region’s electricity
126 Most natural gas-fired generators do not make forward gas procurement arrangements, and rely on the procurement of “spot” gas if called
upon to run. The gas-supply market is largely illiquid during evening and weekend hours.

NPCC-New England
NERC | 2013 Long-Term Reliability Assessment | December 2013
Page 99
needs in 2011 and 2012—most of it during periods of peak demand. By operating so infrequently, these units cannot
recover costs for capital investments that would help them become more efficient. In addition, strict environmental
regulations requiring extensive investment may force a number of these power plants to retire in the coming years.
If the assumed at-risk generators retire, over 6,000 MW of resources would need to be retained, repowered, or replaced to
satisfy ISO-NE’s Installed Capacity Requirement. As generators retire, they will likely be replaced by natural gas-fired
generation, amplifying the Region’s dependence on natural gas.
Many of the at-risk units are located at critical locations on the transmission grid. If they retire without repowering,
transmission security challenges could be created on both the local and regional scale. Many of the Region’s older oil- and
coal-fired generators were built at or near major electricity demand centers, such as the Boston area, to best meet peak
consumer demand. The replacement of a large number of these resources could alter the makeup of the grid and create
transmission reliability and security issues, depending on where the new resources are located.
Transmission development expected between 2013 and 2020 will significantly expand and fortify the Region’s energy
trading hub (the Hub)127 and the connections to it from other areas of the grid. The addition of new capacity electrically
located at or deliverable to the Hub would allow the Region to serve most of its load reliably. The southeastern
Massachusetts and Connecticut load zones, however, may need some resources to provide local capacity or transmission
reinforcements to address reliability concerns. If the retired units are not replaced, the direct result would be a decrease in
seasonal reserve margins during the assessment period.
INTEGRATING VARIABLE RESOURCES WHILE MAINTAINING RELIABILITY
Region-wide RPSs and other environmental targets call for 30 percent of New England’s projected total electric energy
needs in 2020 to be met by renewable resources and Energy Efficiency. Currently, approximately 40 percent of the
proposed projects in the ISO’s generator Interconnection Queue are wind-powered.
During the past several years, a number of wind generation projects have interconnected to the northern portions of the
New England transmission system. This is an area remote from New England’s larger load centers, with a transmission
system sufficient to serve the relatively small amounts of area load but not designed for integrating large amounts of
resources. Project developers have proposed additional wind projects to interconnect in these areas as well; however, the
operation of wind resources in these areas is challenging for reasons presented below.
While new wind resources are being added to the system, substantial increases are not expected for several years. During
the assessment period, only 232 MW of on-peak wind capacity is expected to be in service. With respect to all types of
variable resources, only a total of 751 MW128 (on peak) of such resources are currently in service, and only 147 MW of
Future-Planned wind and PV projects are expected to be added during the assessment period.
Contemporary wind generators are a relatively new and evolving technology that to date has not typically self-provided
significant voltage or stability support to the system.
Wind generation technology has evolved rapidly during the last few years. The advances in physical equipment have
outpaced industry’s ability to develop accurate models for use in technical planning and operating studies. In some
instances the as-built equipment performance differed significantly from the models provided during the system impact
studies and preliminary operating studies.
127 The New England Trading Hub is a central trading location in the energy market where no significant energy congestion is expected.
Approximately 32 electrical buses/nodes in West-Central Massachusetts make up the Hub. 128 ISO-NE generators that are classified as variable include wood (236 MW), refuse (243 MW), hydro (121 MW), wind (97 MW), solar (32 MW),
and landfill gas (22 MW) units.

NPCC-New England
NERC | 2013 Long-Term Reliability Assessment | December 2013
Page 100
Wind generators are often located many miles from their point of interconnection to the transmission system. Many are
connected to electrically weak parts of the New England power system, most often with the bare minimum of voltage
support required.
Wind generators often interconnect on the basis of what is minimally required pursuant to meeting the respective
interconnection standard and lack elective transmission enhancements. Resources compete for transmission access in the
energy market based on offer price. The fact that wind resources rarely bid into the Day-Ahead Energy Market contributes
to their risk of curtailment.
Wind generation is subject to regional and local transmission constraints. Most recent wind curtailments have been due to
local constraints.
Power system operating conditions are often much different from those studied during the interconnection process. The
narrow scope of conditions examined in the interconnection study construct pursuant to Order 2003 and FERC
interconnection requirements for wind pursuant to Order 661, along with wind generators only being minimally upgraded
to meet the respective interconnection standard, result in sensitivity to operating conditions and a greater risk of
curtailment for these resources. This situation significantly complicates system operations.
Because of the confluence of these technical and policy challenges, the operation of wind generators has at times been
curtailed, especially during maintenance conditions on the transmission system. These curtailments are expected to
continue in the absence of improvements at the wind plants and significant transmission expansion.
In addition to customer interconnection studies of elective transmission upgrades that address marginal interconnections
and transmission constraints above what currently is required, other interconnection studies may be needed to consider a
wider range of system conditions due to the increasing amount of system operating complexity.

NPCC-New York
NERC | 2013 Long-Term Reliability Assessment | December 2013
Page 101
NPCC-New York The New York Independent System Operator (NYISO) is the only BA within New York state.(NYBA) The NYISO is a single-state ISO that was formed as the successor to the New York Power Pool—a consortium of the eight IOUs—in 1999. The NYISO manages the New York State transmission grid, encompassing approximately 11,000 miles of transmission lines over 47,000 square miles and serving the electric needs of 19.5 million New Yorkers. New York experiences its peak load in the summer period with the all-time peak load of 33,956 MW in the summer of 2013.
Planning Reserve Margins
NPCC-New York-Summer 2014 2015 2016 2017 2018 2019 2020 2021 2022 2023
ANTICIPATED 22.71% 21.22% 19.75% 18.85% 17.89% 16.85% 15.77% 14.73% 13.83% 13.03% PROSPECTIVE 26.72% 25.18% 23.67% 22.74% 21.74% 20.67% 19.56% 18.49% 17.55% 16.72% ADJUSTED POTENTIAL 26.89% 25.40% 24.45% 24.09% 23.09% 22.00% 20.88% 19.79% 18.85% 18.01%
NERC REFERENCE - 17.00% 17.00% 17.00% 17.00% 17.00% 17.00% 17.00% 17.00% 17.00% 17.00%
NPCC-New York-Winter 2014 2015 2016 2017 2018 2019 2020 2021 2022 2023
ANTICIPATED 73.63% 73.02% 71.72% 71.36% 70.87% 70.53% 69.11% 68.42% 67.51% 66.97% PROSPECTIVE 79.09% 78.45% 77.11% 76.74% 76.24% 75.88% 74.42% 73.70% 72.77% 72.22% ADJUSTED POTENTIAL 79.40% 78.94% 79.36% 78.98% 78.48% 78.12% 76.63% 75.91% 74.96% 74.40%
NERC REFERENCE - 17.00% 17.00% 17.00% 17.00% 17.00% 17.00% 17.00% 17.00% 17.00% 17.00% Summer Winter
0%
5%
10%
15%
20%
25%
30%
2014 2015 2016 2017 2018 2019 2020 2021 2022 2023
0%
20%
40%
60%
80%
2014 2015 2016 2017 2018 2019 2020 2021 2022 2023
Cumulative 10-Year Planned Capacity Change
-700-600-500-400-300-200-100
0100
2014 2015 2016 2017 2018 2019 2020 2021 2022 2023
MW
2013 Existing 2023 Planned 2023 Planned & Conceptual
NPCC-New York Capacity
(MW) Share
(%) Capacity
(MW) Share
(%) Change
(MW) Capacity
(MW) Share
(%) Change
(MW)
Coal
1,992 5.6%
1,548 4.5% -445
1,548 4.2% -445
Petroleum
8,948 25.3%
8,839 25.5% -109
8,839 23.8% -109
Gas
13,143 37.2%
13,143 37.9% 0
15,340 41.4% 2,198
Nuclear
5,411 15.3%
5,411 15.6% 0
5,411 14.6% 0
Hydro
3,826 10.8%
3,826 11.0% 0
3,826 10.3% 0
Pumped Storage
1,407 4.0%
1,407 4.1% 0
1,407 3.8% 0
Geothermal
0 0.0%
0 0.0% 0
0 0.0% 0
Wind
137 0.4%
137 0.4% 0
276 0.7% 139
Biomass
449 1.3%
402 1.2% -46
425 1.1% -24
Solar
0 0.0%
0 0.0% 0
0 0.0% 0
TOTAL 35,311 100.0% 34,711 100.0% -600 37,069 100.0% 1,759

NPCC-New York
NERC | 2013 Long-Term Reliability Assessment | December 2013
Page 102
Demand, Resources, and Planning Reserve Margins
The current Installed Reserve Margin (IRM) requirement that covers the period from May 2013 to April 2014 (2013
Capability Year) is 17.0 percent. For this assessment, the IRM is applied as the Reference Margin Level for the entire 10-year
period. This requirement is set by the New York State Reliability Council (NYSRC) based upon an annual study conducted by
its Installed Capacity Subcommittee (ICS). This is an increase of 1.0 percent compared to the 2012LTRA reference case. The
principal drivers for the increased IRM are a change in Special Case Resource (SCR) modeling, an updated LFU model, and
an updated external area model.
There have been no footprint changes since the 2012LTRA. The economic outlook was updated in January 2013 with
projections resulting in lower annual energy growth compared to a year earlier—0.47 percent per year in 2013 versus 0.59
percent per year in 2012. The long-term weather outlook has not changed compared to the 2012LTRA.
Due to the higher levels of consumer spending and economic growth associated with the Nassau and Suffolk counties,
energy growth is projected to be higher in Long Island than the state as a whole. There has been a gradual increase in the
share of annual energy use during summer months—from 27.5 percent in 2000 to 28.6 percent in 2012. This is attributed to
an increase in air conditioning usage.
The peak demand forecast shows a higher annual average rate of growth in the 2013LTRA reference case compared to the
2012LTRA reference case—0.96 percent in 2013 versus 0.85 percent in 2012. This is related to a gradual decline in the
state-wide annual load factor that has been observed during the past eight years (a decrease in load factor occurs when the
ratio of average annual energy to peak demand decreases from one year to the next). This indicates that summer peak
demand is growing faster than annual energy supply.
DR is reported under Load as a Capacity Resource and treated on the supply-side in the calculation of Planning Reserve
Margins. Voluntary DR is also reported as a resource. DR resources are modeled conservatively in planning studies to
account for the possibility of the resources being unavailable or nonresponsive.
The New York Public Service Commission has authorized budgets for the state’s investor-owned utilities (IOUs) and the New
York State Energy Research and Development Agency through 2015. In addition, the state’s two power authorities, Long
Island Power Authority and the New York Power Authority, each have authorized spending through at least 2015 and have
long-term plans for additional spending beyond 2015.
The Indian Point Power Plant (2 nuclear units) is speculated to retire by the end of 2015. If the Indian Point Power Plant
licenses were not renewed and the plant was retired by the end of 2015 or thereafter, it would result in immediate
violations of resource adequacy criteria. As reliance on natural gas as the primary fuel for electric generation increases,
disruptions of natural gas supplies will have a greater impact on generator availability.
During the 10-year period, there is only one scheduled retirement amounting to 97 MW in June 2015. There are an
additional 402 MW of proposed retirements, but no retirement dates are known. Two of those units (309 MW) submitted
notices of intent to mothball or retire. As a result of the generator outage process described in the next paragraph, those
units are currently operating under a Reliability Support Services agreement as their retirements would result in a reliability
need.129
The NYBA neither plans for nor relies on behind-the-meter generation for reliability purposes, except for those resources
that opt to participate in one of the NYBA’s DR programs.
129

NPCC-New York
NERC | 2013 Long-Term Reliability Assessment | December 2013
Page 103
There are only two nontraditional resources in the NYBA’s markets: a 20 MW flywheel and an 8 MW storage battery, as
listed in the 2013 Load and Capacity Data Report (Gold Book).130 There is no reliability impact from these resources
expected during the assessment period.
As variable resources, such as wind, have been added to the resource mix, procedures have been modified and updated.
For example, the NYBA implemented a centralized wind forecasting program to provide NYBA operations with a better
estimate of the amount of energy produced by wind resources over various time frames.
Capacity transactions modeled in NYBA reliability studies are part of the NYBA’s resource mix to meet LOLE criteria. These
transactions would be expected to perform on peak, or any other time, as needed to meet the demand.
Unforced Capacity Deliverability Rights (UDRs) are rights associated with new incremental controllable transmission
projects that provide a transmission interface to a NYBA locality where a minimum amount of installed capacity must be
maintained. Three such projects are currently in-service with a total transmission capability of 1,290 MW. A fourth project,
the Hudson Transmission Project (HTP), with a 660 MW transmission capability went into service May 2013. Capacity
transactions associated with UDRs are considered confidential market data. Only net capacity import totals can be publicly
disclosed in order to maintain market confidentiality.
External capacity (ICAP) purchases and sales are administered by NYISO. An annual study is performed to determine the
maximum level of capacity imports from neighboring BAs allowed without violating the LOLE criteria. For the Capability
Year 2013–2014, the amount is 2,480 MW. Except for grandfathered contracts, these import rights are allocated on a first-
come, first-served basis with a monthly obligation. While capacity purchases are not required to have accompanying firm
transmission, adequate external transmission rights must be available to assure delivery to the NYBA border when
scheduled. All external ICAP suppliers must also meet the eligibility requirements as specified in the Installed Capacity
Manual.131
The NYBA does not rely on emergency imports to meet the assessment area’s Reference Margin Level. However, transfer
capability is reserved on the ties with the Region’s neighbors in planning studies to allow for emergency imports as one
potential emergency operating procedure step in the event of a system emergency.
Capacity transactions modeled in NYBA’s assessments have met the requirements as defined in NYBA’s tariffs. Both NYBA
and the respective neighboring assessment areas agreed upon the terms of the capacity transaction, including, for example,
a) the megawatt value, b) the duration (minimum of one year), c) the contract path, d) the source of capacity, d) the
capacity rating of the resource. Transfer capability is reserved on the ties with the Region’s neighbors in planning studies to
allow for emergency imports as one potential emergency operating procedure step in the event of a system emergency.
Transmission and System Enhancements
The HTP is a new market-based tie line between PJM and NYISO from PSE&G’s Bergen 230-kV substation to Con Edison’s
W.49th Street 345-kV station. The project consists of a back-to-back HVdc converter in New Jersey with a submarine 345-kV
ac cable from the converter station to New York City. The project is capable of transferring 660 MW, but has firm capacity
withdrawal rights from PJM of 320 MW. The project went into service May 2013. Additional local TO plans include
transmission and subtransmission system reinforcements throughout the state.
The NYISO 2012 CRP identified solutions to thermal overloads identified in the RNA. The reliability needs identified in the
Rochester and Syracuse areas will be resolved by 2017 with permanent solutions identified in the most recent TO Local
Transmission Plans. These permanent solutions include a new RG&E 345/115-kV substation and reconductoring of a
National Grid 115-kV line. In the interim, mitigating measures, including local operating procedures, will be called on—if
1302013 Load and Capacity Data - "Gold Book". 131 NYISO Installed Capacity Manual (April 2013).

NPCC-New York
NERC | 2013 Long-Term Reliability Assessment | December 2013
Page 104
required—to prevent overloads. The reliability need identified for Ramapo 345/138-kV transformers was mitigated by the
installation of new independent protective relay in 2013.
Historically, the most congested transmission paths in New York are Central East, Leeds–Pleasant Valley, and Dunwoodie–
Shore Road. The constraints on Central East and Leeds–Pleasant Valley are driven by demands in the lower Hudson Valley
resulting in high transfers of power from Upstate New York to New York City. The Dunwoodie–Shore Rd. constraint is driven
by Long Island demand. These constraints could be mitigated through additional transmission, generation, or demand
reduction.
There are no project delays or temporary service outages for any transmission facilities that will impact long-term reliability
of BPTFs during the assessment period. However, if the Indian Point Power Plant licenses are not renewed and the plant
was to retire by the end of 2015 or thereafter, it would result in immediate violations of transmission security criteria.
As part of the DOE Smart Grid Investment Grant, 938 Mvar of smart grid-enabled capacitor banks will be installed at various
subtransmission voltage levels and 39 PMUs will be installed at bulk power stations throughout New York by June 2013.
NYBA BPS security is maintained by limiting power transfers according to the determined transfer limits, including voltage-
constrained transfer limits. Therefore, UVLS schemes are not expected to be needed.
There are no current plans to install additional SPSs in NYBA. The Athens generation rejection SPS is currently used to
mitigate curtailment of Athens generation in securing the UPNY–SENY interface. This SPS is expected to be removed if a
permanent solution, such as the addition of bulk power transmission facilities, was installed.
The deployment of a NYBA-wide, open, flexible, interoperable, secure, and expandable Phasor Measurement Network
(PMN) system will work in concert with the existing control and monitoring systems. The PMN system will operate using
standard information models and communication protocols and will be the integral part of the interconnection-wide North
American Synchrophasor Initiative Network (NASPInet). The PMN system will enhance NYISO’s ability to detect system
vulnerabilities and disturbances in real time and potentially mitigate their impact.
Integration of new reactive power sources through the installation of additional shunt capacitors will enhance the control
and coordination of the voltage profile on the New York power grid, resulting in improvements to the efficiency and
reliability of the state’s grid. These switched or controllable capacitor banks will provide for additional reactive power
resources, which will be available to the BPS during system conditions in which they are most needed.
Three operational system tools are in the process of acceptance, testing, or deployment. Real-time Dynamics Monitoring
System (RTDMS), a situational awareness application from Electric Power Group (EPG), was tested in 2012 and is currently
in site acceptance testing. An enhanced State Estimator application was tested in 2012 and deployed in the first quarter of
2013. A voltage stability monitoring application was deployed to production in June 2013.
Long-Term Reliability Issues
NYBA has a significant amount of hydro resources. Many of these resources are located on rivers throughout the state. The
output of these run-of-river resources is subject to water levels, which may vary greatly on a month-to-month basis based
on weather conditions (e.g., snowfall amounts, temperature, rainfall amounts, etc.) For reliability purposes, these units are
modeled with a 45-percent derate factor. This derate factor represents a severe scenario case for drought or low water
level.
RPS resources are incorporated into NYBA’s planning studies as information becomes available and these resources meet
criteria to be in-service. As the amount of variable resources, such as wind, has been added to the resource mix, procedures
have been modified and updated. For example, the NYBA has implemented a centralized wind forecasting program to
better estimate the amount of energy to be produced by wind resources over various time frames.

NPCC-New York
NERC | 2013 Long-Term Reliability Assessment | December 2013
Page 105
Retirement of additional generating units beyond those already contemplated for either economic or environmental factors
could adversely affect the reliability of NYBA’s BPS. NYISO recognizes that numerous risk factors can contribute to reliability
concerns with the need to take swift actions to maintain reliability, which may need to be preceded by putting sufficient
replacement resources into operation depending on the units in question.
Historically, this Region has actively participated in the development of the environmental policies and regulations that
govern the permitting, construction, and operation of power generation and transmission facilities. Currently, New York’s
standards for permitting new generating facilities are among the most stringent in the nation. The combination of tighter
environmental standards coupled with competitive markets administered by NYISO since 1999 has resulted in the
retirement of older plants equaling approximately 5,000 MW of capacity and the addition of over 10,000 MW of new
efficient generating capacity. In turn, these changes have led to marked reduction of power plant emissions and a
significant improvement in the efficiency of the generation fleet. The following charts show the change in New York power
plant emissions of SO2, NOx and CO2 between 2000 and 2013(left), and the change in New York power plant heat rates
between 1999 and 2012.
0
10
20
30
40
50
60
0
50
100
150
200
250
300
2000 2001 2002 2003 2004 2005 2006 2007 2008 2009 2010 2011 2012
CO
2M
ass (M
illi
on
To
ns)
NO
Xan
d S
O2
Mass (1000 T
on
s)
New York State Power Plant Emissions 2000-2012
SO2 NOX CO2Source: USEPA Air Markets Program Data
* 2012 Data Preliminary Estimates
8,000
8,500
9,000
9,500
10,000
10,500
11,000
11,500
12,000
12,500
13,000
13,500
1999 2000 2001 2002 2003 2004 2005 2006 2007 2008 2009 2010 2011 2012
Heat
Rate
(B
tu/G
ross kW
h)
New York State Power Plant Heat Rates 1999 - 2012
Source: USEPA Air Markets Program Data* All 2012 Data is Preliminary
Notwithstanding the progress toward achieving New York’s clean energy and environmental goals, various environmental
initiatives that will affect the operation of the existing fleet are in place or pending. Environmental initiatives that may
affect generation resources may be driven by either or both the state or federal programs. Since the previous LTRA, the EPA
has promulgated several regulations that will affect the majority of NYBA’s thermal fleet of generators. Similarly, New York
State Department of Environmental Conservation (NYSDEC) has undertaken the development of several regulations that
will apply to most of the thermal fleet in New York.
The purpose of the development of this analysis is to gain insight into the population of resources that are likely to be faced
with major capital investment decisions in order to achieve compliance with several evolving environmental program
initiatives. The premise of this analysis is that the risk of unplanned retirements is related to two factors: first, the capital
investment decisions resource owners need to make in order to achieve compliance with the new regulatory program
requirements, and secondly the recent change in the relative attractiveness of gas vs. coal has challenged the viability of
some former Base Load units. The goal of this scenario analysis is to identify when and where these risks occur on the New
York Power System.
Five environmental initiatives are sufficiently broad in application and have requirements that may require retrofitting
environmental control technologies. Therefore, generator owners will likely need to address the retirement vs. retrofit
question. These environmental initiatives are: (1) NYSDEC’s Reasonably Available Control Technology for Oxides of Nitrogen
(NOx RACT), (2) Best Available Retrofit Technology (BART), (3) Best Technology Available (BTA), (4) U.S. EPA’s Mercury and
Air Toxics Standards (MATS), and (5) Clean Air Interstate Rule (CAIR).

NPCC-New York
NERC | 2013 Long-Term Reliability Assessment | December 2013
Page 106
REASONABLY AVAILABLE CONTROL TECHNOLOGY (NOX RACT)
The NYSDEC finalized new regulations for the control of emissions of nitrogen oxides (NOx) from fossil fueled power plants
(Part 227-2).132 The regulations establish presumptive emission limits for each type of fossil fueled generator and each fuel
used as an electric generator in New York that has a capacity greater than 25 MW. Compliance options include averaging
emissions with lower emitting units, fuel switching, or installing emission reduction equipment (e.g., low NOx burners or
combustors), selective catalytic reduction units, or retirement. Generators have filed permit applications and RACT analyses
with NYSDEC. As required, Title V permits have been amended. Compliance with approved plans is required by July 1, 2014.
Publically available compliance plans have been reviewed. Several generators requested that their submittals be considered
Competitive Business Information; however, NYSDEC denied these requests. The resolution of this issue may extend
beyond 2023.
Reviewing the plans that are public, it is seen that approximately 28,000 MW of capacity is subject to this rule, of which
approximately 4,000 MW of generating capacity are involved in emission reduction projects. Several of these projects are
underway, and the remaining projects should be accomplished prior to the July 2014 compliance date.
System averaging plans, known as emission bubbles, have been used as compliance methods for a number of generation
portfolios under common ownerships. These systems have some units that are capable of achieving emission rates lower
than presumptive limits prescribed by the NOx RACT rule, while other generating units were unable to achieve the
prescribed limits. The rules provided for a system average that is based on heat input and the application of the relevant
emission rate. The revised NOx RACT standard, which will take effect in 2014, lowers the prescribed emission rate for
boilers. When this reduction takes effect, the ability to average emission rates across the owner’s portfolio will be
significantly reduced. This will result in further limitations on the duration of operation of high-emitting generators that are
typically only called for on days with high electric demand.
A review of historical emission patterns suggests that some portfolios will need to either undertake emission control
technology retrofits or limit the number of hours per day that the higher emitting machines are available. This review also
determined that there are approximately 1,000 MW of high emitting resources in Zone J.
Current and New Presumptive NOx RACT Emission Limits (NOx/mmBTU) Current Limits New Presumptive Limits
Fuel Type Tangential Wall Cyclone Stokers Tangential Wall Cyclone Fluidized Bed
Gas Only 20.0% 20.0% n/a n/a 8.0% 8.0% n/a n/a
Gas/Oil 25.0% 25.0% 43.0% n/a 15.0% 15.0% 20.0% n/a
Coal Wet Bottom 100.0% 100.0% 60.0% n/a 12.0% 12.0% 20.0% n/a
Coal Dry Bottom 42.0% 45.0% n/a 30.0% 12.0% 12.0% n/a 8.0%
BEST AVAILABLE RETROFIT TECHNOLOGY (BART)
NYSDEC recently promulgated a new regulation: Part 249, Requirements for the Applicability, Analysis, and Installation of
BART Controls.133 The regulation applies to fossil-fueled electric generating units with approximately 8,200 MW of capacity
that were built between August 7, 1962, and August 7, 1977. The state must comply with provisions of the federal Clean Air
Act that are designed to improve visibility in national parks. Affected generation plant owners have prepared analyses to
determine the impact of each affected unit’s emissions on visibility in national parks. NYSDEC and the EPA determined that
emission reductions must be made at the affected units. These new emission limitations are now included in amended Title
V permits. The compliance deadline is January 1, 2014.
132 Subpart 227-2 Reasonably Available Control Technology (RACT) For Major Facilities of Oxides Of Nitrogen (NOx). 133 Part 249: Best Available Retrofit Technology (BART).

NPCC-New York
NERC | 2013 Long-Term Reliability Assessment | December 2013
Page 107
Emission controls of sulfur dioxide (SO2), NOx, and particulate matter are necessary. Compliance plans were filed with
NYSDEC in October 2011. Several units have been chosen to retire, representing a capacity loss of approximately 300 MW.
To achieve the required emission reductions, several plants will use cleaner fuels while others will undertake retrofit
projects.
BEST TECHNOLOGY AVAILABLE (BTA)
NYSDEC finalized its policy document “Best Technology Available (BTA) for Cooling Water Intake Structures.”134 The
proposed policy applies to plants with design intake capacity greater than 20 million gallons per day and prescribes
reductions in fish mortality. It also establishes performance goals for new and existing cooling water intake structures. The
performance goals call for the use of wet, closed-cycle cooling systems at existing generating facilities. The policy does
provide some limited relief for plants with historical capacity factors less than 15 percent.
The policy will be applied at the time that the State Pollution Discharge Elimination System Permit is renewed—
theoretically in five years. The application of this policy is one of the main issues being decided on in the Indian Point
relicensing process. Generators with approximately 18,000 MW of capacity are subject to this policy and may be required to
retrofit 4,000–7,000 MW of generating capacity. If cooling tower retrofits are required, compliance deadlines will be project
specific.
The EPA announced the MATS in December 2011, replacing the Maximum Achievable Control Technology (MACT) rule. The
MATS establish limits for HAPs for acidic gases, hydrogen chloride (HCl), hydrogen fluoride (HF), mercury (Hg), and
particulate matter. Alternative limits were also established. These limits will apply to coal- and oil-fired generators. The
compliance date is March 2015. If necessary, NYSDEC may provide an additional year to comply. If retrofitting of emissions
control technology is required or the reliability improvement project will take an additional year, reliability-critical units
may qualify for another year to achieve compliance.
In New York, 11,331 MW of capacity will be affected by this regulation. The EPA established a subcategory for limited-use,
oil-fired generators. This means that units maintaining a capacity factor on oil that is less than eight percent will be more
lightly regulated. No oil-fired EGUs have exceeded the eight-percent capacity factor threshold since 2009. While they
remain subject to MATS, it is not expected that significant emission control retrofit projects will be required at these units.
Emission records were reviewed to determine the best level of emission reductions that is proven to be sustainable. These
emission levels were then compared to those necessary to comply with MATS for coal-fired units. The review showed that
most of the coal-fired units in New York are already or nearly capable of complying with MATS. In addition, NYSDEC has
promulgated Part 246: Mercury Reduction Program for Coal-Fired Electric Utility Steam Generating Units, which establishes
currently in-effect emission limitations in New York for the reduction of mercury emissions. Phase II of this regulation will
require additional reductions from coal-fired boilers in 2015. The Phase II emission limitations are more stringent than the
EPA MATS limits. The owner of one reliability-critical unit (Cayuga 2) notified the NYISO that it will need the fifth year in
order to install the emissions control technology necessary for compliance with MATS.
CROSS STATE AIR POLLUTION RULE (CSAPR)
CSAPR is the EPA’s revision of the Clean Air Interstate Rule (CAIR), which was vacated by the U.S. Supreme Court. In doing
so, the Court ordered that the Clean Air Interstate Rule (CAIR) remain in effect until replacement rule is implemented. CAIR
has a significant reduction in allowable emissions scheduled for 2015. The CAIR emission allowance system currently is
over-supplied. In its current form, the rule will have only a limited impact on the reduction of emissions and it not a major
consideration in the retirement versus retrofit decision. While it may be reasonable to assume that a national program will
eventually be in effect for limiting emissions of SO2 and NOx via a cap and trade program, the timing remains uncertain.
134 CP-#52 / Best Technology Available (BTA) for Cooling Water Intake Structures.

NPCC-New York
NERC | 2013 Long-Term Reliability Assessment | December 2013
Page 108
In December 2011, the EPA finalized the CSAPR, which is designed to reduce emissions of SO2, annual NOx, and Ozone
season NOx from fossil-fueled power plants in 28 central and eastern states. The regulation is implemented through the use
of emission allowances and limited trading programs. The regulation establishes emission budgets for each affected state.
The emission budget is divided on a pro-rata basis determined by historic heat input for existing facilities. There are set-
asides to provide allowances for new fossil generators. The use of emission allowances is expected to increase offering
prices for generation from affected facilities. The final rule was vacated by the U.S. District Court. But for the action of the
courts, the rule would currently be in effect with another reduction in the SO2 cap scheduled for 2014.
NATIONAL EMISSION STANDARDS FOR HAZARDOUS AIR POLLUTANTS (NESHAP) AND NEW SOURCE PERFORMANCE STANDARDS
(NSPS) FOR RECIPROCATING INTERNAL COMBUSTION ENGINES (RICE)
In January 2013, the EPA promulgated these rules concurrently. The new rules will apply to central-station, engine-driven
generators and engine-driven generators at major and area sources of HAPs. The rules establish emission limits for engines
based on fuel, ignition, and size. The rules allow owners who do not make the upgrades to the emission control systems
needed for the machines to meet the new emission limits to continue to participate in the NYISO’s Special Case Resource
(SCR) and Emergency DR programs by limiting the hours of operation. Emergency generators can continue to participate in
these programs by undertaking commitments to limit operations to either 50 hours or 15 hours depending on which
compliance route they choose.
NYISO is conducting a poll of SCR providers to quantify the potential reduction in capacity resulting from owners’ decisions
to not upgrade emission control systems but rather to limit their participation in NYISO’s SCR and Emergency DR programs.
NYISO conducted the analysis described above to identify generating units that are subject to the key environmental
initiatives. The analysis also estimated the amounts of capacity that would be potential candidates for retrofits and thus
require recapitalization. These units could become unplanned retirements. The analysis was then extended to identify the
amount of capacity subject to multiple environmental requirements. The bi-annual Reliability Needs Assessment includes
scenario evaluations and comparisons of the zones at risk with the amount of capacity that could be considered at risk for
unplanned retirement due to the need to add capital for retrofitting environmental control technology.
Environmental Initiatives Summary
Regulation Status Compliance Deadline Est. Capacity Affected Potential Retrofits
NOx RACT In effect 4182100.0% 27,700 MW (242 units) 5,700 MW (20 units)
BART In effect 4164000.0% 8,500 MW (18 unit) 1,500 MW (4 units)
MATS In effect Mach 2015 10,000 MW (25 units) 200 MW (1 unit)
BTA In effect Upon Permit Renewal 16,500 MW (35 units) 4,400 – 7,300 MW
CSAPR Implementation stayed (rule in litigation) January 2012 & January 2014 26,000 MW (155 units) 2,000 MW (9 units)
RGGI In effect In effect 26,000 MW (157 units) N/A
The 2012 CRP determined that under the conditions studied and with the market‐based solutions submitted and the
responsible TO-updated local transmission plans, the proposed system upgrades and local transmission solutions will
maintain the reliability of the New York BPS. The projects included in the regulated backstop or alternative regulated
solutions, if they need to be triggered or are otherwise put into service, may further improve system reliability.
Market‐based projects may also further improve system reliability.

NPCC-Ontario
NERC | 2013 Long-Term Reliability Assessment | December 2013
Page 109
NPCC-Ontario Ontario’s electrical power system is, geographically, one of the largest in North America covering an area of 415,000 square miles and serving the power needs of more than 13.5 million people. Ontario is interconnected electrically with Quebec, Manitoba, Minnesota, Michigan, and New York. No footprint changes occurred during the past two years and no changes are anticipated.
Planning Reserve Margins
NPCC-Ontario-Summer 2014 2015 2016 2017 2018 2019 2020 2021 2022 2023
ANTICIPATED 24.89% 26.05% 22.86% 19.53% 16.00% 7.93% 1.28% -1.60% -2.54% 0.43% PROSPECTIVE 24.89% 26.05% 22.86% 19.53% 16.00% 7.93% 1.28% -1.60% -2.54% 0.43% ADJUSTED POTENTIAL 25.68% 26.22% 24.18% 21.84% 20.29% 20.08% 20.14% 20.21% 20.27% 20.32%
NERC REFERENCE - 18.60% 18.70% 18.00% 19.10% 19.30% 20.00% 20.00% 20.00% 20.00% 20.00%
NPCC-Ontario-Winter 2014 2015 2016 2017 2018 2019 2020 2021 2022 2023
ANTICIPATED 40.71% 43.35% 37.74% 37.80% 30.61% 22.77% 19.16% 13.63% 17.38% 15.93% PROSPECTIVE 40.71% 43.35% 37.74% 37.80% 30.61% 22.77% 19.16% 13.63% 17.38% 15.93% ADJUSTED POTENTIAL 41.32% 43.62% 39.26% 40.54% 35.66% 36.68% 40.14% 38.22% 43.43% 38.70%
NERC REFERENCE - 18.70% 18.00% 19.10% 19.30% 20.00% 20.00% 20.00% 20.00% 20.00% 20.00% Summer Winter
-5%
0%
5%
10%
15%
20%
25%
30%
2014 2015 2016 2017 2018 2019 2020 2021 2022 2023
0%
10%
20%
30%
40%
50%
2014 2015 2016 2017 2018 2019 2020 2021 2022 2023
Cumulative 10-Year Planned Capacity Change
-10,000
-8,000
-6,000
-4,000
-2,000
0
2,000
2014 2015 2016 2017 2018 2019 2020 2021 2022 2023
MW
2013 Existing 2023 Planned 2023 Planned & Conceptual
NPCC-Ontario Capacity
(MW) Share
(%) Capacity
(MW) Share
(%) Change
(MW) Capacity
(MW) Share
(%) Change
(MW)
Coal
3,166 10.2%
0 0.0% -3,166
0 0.0% -3,166
Petroleum
2,145 6.9%
2,145 9.2% 0
2,145 7.7% 0
Gas
6,753 21.8%
5,720 24.7% -1,033
10,006 35.9% 3,253
Nuclear
12,844 41.5%
8,139 35.1% -4,705
8,139 29.2% -4,705
Hydro
5,662 18.3%
6,046 26.1% 384
6,046 21.7% 384
Pumped Storage
89 0.3%
89 0.4% 0
89 0.3% 0
Geothermal
0 0.0%
0 0.0% 0
0 0.0% 0
Wind
197 0.6%
693 3.0% 495
957 3.4% 759
Biomass
106 0.3%
282 1.2% 176
282 1.0% 176
Solar
0 0.0%
84 0.4% 84
240 0.9% 240
TOTAL 30,963 100.0% 23,197 100.0% -7,766 27,904 100.0% -3,059

NPCC-Ontario
NERC | 2013 Long-Term Reliability Assessment | December 2013
Page 110
Demand, Resources, and Planning Reserve Margins
The Reference Margin Levels (target reserve margins) for the first five years of the assessment period vary from 18.6
percent in 2014 to 19.3 percent in 2018.135 Ontario Power Authority’s (OPA’s) Reference Margin Level (target reserve
margin) of 20 percent is applied from 2019 to 2023, which has not changed from the 2012LTRA reference case. The OPA
target reserve margin, like the IESO’s, is also based on meeting NPCC LOLE criteria. The OPA calculations include additional
allowance for project uncertainty.
Anticipated Reserve Margins are projected to fall below the target reserve margin in 2018. Some of the Bruce and
Darlington nuclear units will be out of service for refurbishment during this time frame. Various options described below
are under consideration to ensure that future resources are available to maintain adequacy.136
This forecast for Net Energy for Load has an average annual growth rate of -0.2 percent during the 10-year period, similar to
last year’s forecast of -0.3 percent average growth for 2012–2022. This is the product of modest economic expansion,
conservation impacts, and growing embedded generation capacity. Due to a number of factors, the growth rate for overall
consumption is lower than the peak growth rates. Conservation is initially aimed at reducing peaks, but as those peak
reduction opportunities are realized, conservation and embedded generation will start to impact nonpeak hours, affecting
overall energy demand.
Since the underlying drivers are very similar to last year, the projected growth rates remain similar as well. Canada is
expected to post modest growth during the assessment period, though Ontario will lag in the near-term. The oil-producing
regions in Canada will see stronger growth than Ontario’s manufacturing- and export-based economy. In fact, Canada’s oil
wealth puts upward pressure on the dollar, which is more detrimental to central Canada.
Throughout the forecast, Ontario’s economy will continue to undergo structural changes. By the fifth year of the
assessment period, projections indicate the economy will see a continued transition from energy-intense industrial
processes to a larger service sector and specialized or high-value added manufacturing. This will lead to a less energy-
intense economy. However, the very end of the forecast will see the rise in mineral extraction as Ontario begins exploiting
its vast but untapped mineral resources in the far North.
The forecasting methodology has not changed since last year’s forecast. The models have been updated and re-estimated
to incorporate the latest information regarding the relationship between electricity demand and the economy,
demographics, and weather.
Within Ontario there will be some localized variation in demand. The Golden Horseshoe, which encapsulates the Greater
Toronto area and the Niagara peninsula, has the largest share of Ontario’s population and economy. This area will maintain
its dominant position in the province. The northern areas of the province will see a rebound later in the forecast at the
location of the aforementioned mineral resources. The northwestern area, in particular, will see a rebound as its load drops
due to lower demand from the pulp and paper sector. Mining will help boost demand in the northern areas of the province.
135 The Reference Margin Level requirements are calculated annually for the next five years and published on the Independent Electricity System
Operator (IESO). The IESO determines the required reserve levels based on probabilistic methods deemed by NPCC to be acceptable for meeting regional LOLE criteria.
136 The IESO and the OPA recognize the potential for certain adverse conditions (e.g., extended forced outages, drought conditions, and particular fuel interruptions) to result in higher-than-expected resource unavailability and have established planning reserves sufficient to address many of these conditions. To the extent resource procurement exceeds the planning reserve requirements, resource adequacy can be maintained for higher than normal contingencies. However, there are always conditions that can exceed those planning assumptions. In such extreme situations, IESO’s operations would rely on interconnection support and available control actions to maintain system reliability. Through retention and further development of a diverse resource mix, the potential consequence of these events is reduced.

NPCC-Ontario
NERC | 2013 Long-Term Reliability Assessment | December 2013
Page 111
IESO treats demand measures as a resource and conservation as a decrement to demand. Conservation is projected to
increase throughout the assessment period, whereas demand measures will increase through 2015, remaining constant
thereafter.
Over the course of the forecast, effective Demand Measures Capacity137 is expected to be just over 500 MW, rising to just
under 600 MW at the end of the forecast. The effective capacity of these programs has been significantly reduced
compared to last year. The Global Adjustment Allocation (GAA) has led to a significant reduction in the offers of
dispatchable loads during peak periods. The GAA allows customers with peak demands of greater than 5 MW to reduce
their share of the Global Adjustment costs by reducing demand during the five highest peak demand days. As a result, this
has led to a reduction of roughly 400 MW in the offers of dispatchable loads during peak conditions. The GAA has acted to
reduce peak demands by over 900 MW, a greater reduction in the peak than the reduction in demand measures resources.
The conservation projections are consistent with those included in the 2012LTRA reference case. Conservation is expected
to yield incremental peak savings of more than 3,000 MW by 2023.
Two coal units at Lambton will be shut down in October 2013 and four units at Nanticoke are expected to be shut down by
the end of 2013. As coal inventories are depleted, the Nanticoke units will be removed from service by the facility owner.
By 2014, all coal units in Ontario will be phased out in accordance with government policy. In the years following the coal
phase-out, the province’s next reliability challenge will be to carefully manage the renewal of its nuclear fleet.
Units at the Pickering B, Bruce B, and Darlington Nuclear Generating Stations will be reaching their end of service lives
during the 10-year period. The Canadian Nuclear Safety Commission granted a five-year renewal of Ontario Power
Generation's operating license for the Pickering Nuclear Generating Station, valid until August 31, 2018. The license
prohibits the operation of the Pickering B NGS beyond 210,000 effective full power hours. The Commission will consider
OPG’s request to remove this regulatory hold point at a future public hearing.
Units at Bruce and Darlington will undergo mid-life refurbishment to extend their operating lives. The OPA is working with
two nuclear operators to develop a coordinated plan for nuclear fleet renewal. Unit outages will be coordinated to
minimize the number of nuclear units simultaneously on outage. The plan for nuclear renewal is complex as there are a
number of aspects related to operational and technical coordination, regulatory and contractual terms, financing and
revenue recovery, and risk allocation that need to be resolved.
Supply options for maintaining resource adequacy over this time period are being considered. These options include
conservation, recontracting Non-Utility Generator (NUG) facilities, new gas-fired generation, conversion of some or all of
the Lambton and Nanticoke coal-fired units to natural gas, imports, and energy storage. There are about 1,500 MW of NUG
contracts with the opportunity to be renegotiated as the contracts are expiring now and within the next decade. Currently,
the structure of the contracts consists of fixed-price payments that limit the effective operation of resources and efficient
participation within the electricity market. The OPA is in the process of assessing the opportunities and merits of
renegotiating the NUG contracts, and the procurement process for some NUGs has already begun.
A 280-MW, gas-fired generating station under construction in Mississauga was cancelled in the fall of 2011. The power
plant has been relocated to the Lambton Generating Station site and is expected to be in-service by third quarter of 2017.
In 2010, a 900-MW, gas-fired generating station intended to be constructed in Oakville was cancelled. Work is underway to
relocate the generating station to the existing gas- or oil-fired Lennox generating station site in the Napanee by fourth
quarter of 2018. The new station will include two gas turbine units and one steam turbine unit. They will be connected to
two 500-kV buses at Lennox Substation. No other major generation or transmission projects have been cancelled or
significantly deferred that affect reliability.
137 Considered in this assessment as Load as a Capacity Resource, a category of Demand Response.

NPCC-Ontario
NERC | 2013 Long-Term Reliability Assessment | December 2013
Page 112
During the assessment period, the amount of renewables’ penetration is expected to increase significantly through the
Feed-in Tariff (FIT) and microFIT programs, some of which will be behind-the-meter generation. Much of this generation
could be variable in nature, which adds more volatility as on-grid demand is impacted by underlying demand and variable
generation within the distribution system. The majority of distribution-connected generation is expected to be solar, with
lesser amounts of wind.
While a vast number of storage technologies are available for development, five are particularly promising and are being
developed by companies within Ontario. These include batteries, pumped hydro, compressed air energy storage (CAES),
flywheels, and hydrogen storage. While most of these technologies are only recently seeing major development for grid
applications, some technologies have a long history in the province such as hydroelectric pumped storage at the Sir Adam
Beck Pump Generating Station in Niagara Falls.
While all these technologies offer energy storage, each provides its own specific utility to the grid. Short-term storage
systems, which can supply power for less than two minutes, are generally used for frequency regulation and to maintain
grid power quality. Technologies such as batteries and larger flywheels can supply limited energy storage suitable for
providing frequency regulation and ramping capability and can help improve system reliability. More sustained energy
supply can be provided from technologies such as pumped hydro, CAES, hydrogen, and some battery technologies that are
capable of lasting more than one hour. These solutions, among others, can be used to increase grid capacity, offering firm
output. If installed in the right location, energy storage can also defer transmission and distribution system upgrades.
As renewables make up an increasingly large portion of the supply, energy storage systems can address some of the
problems caused by the intermittent nature of some renewable energy sources such as wind and solar
Through a Request for Proposals issued last year, IESO sought to procure up to 10 MW of regulation from alternative
sources such as dispatchable loads, aggregated DR, and storage technologies, including batteries and flywheels. To allow
IESO to acquire experience with a range of technologies, the request for proposal (RFP) sought proposals from multiple
vendors, each providing a small quantity of regulation.
IESO has entered contracts with the three successful proponents. This procurement process is part of IESO's efforts to
broaden access to Ontario's electricity markets. These resources have significantly different operating characteristics than
conventional units, allowing them to contribute to Ontario's energy needs in different ways and complement the
performance of existing generators.
As the supply mix quickly evolves, IESO is adapting the manner in which the electricity grid is operated while preparing for a
continuing increase in variable renewable generation. By 2018, an estimated 10,700 MW of wind and solar generation is
expected to be in-service, with substantial amounts by 2014.
About 14 percent of the installed wind capacity is assumed to be available at the time of summer peak, and 33 percent is
assumed to be available at the time of winter peak. Monthly Wind Capacity Contribution (WCC) values are used to forecast
the contribution from wind generators. WCC values (percent of installed capacity) are determined by picking the lower
value between the actual historic median wind generator contribution and the simulated 10-year wind historic median
contribution at the top five contiguous demand hours of the day for each winter and summer season, or shoulder-period
month. The process of picking the lower value between actual historic wind data and the simulated 10-year historic wind
data will continue until 10 years of actual wind data is accumulated, at which point the simulated wind data will be phased
out of the WCC calculation. WCC values are updated annually.
Ontario’s solar capacity value is forecast to be 30 to 34 percent of installed capacity for the summer peak and 0 to 4 percent
contribution for the winter peak. The difference is due to the fact that the summer peak occurs in the afternoon whereas
the winter peak occurs after sunset in the evening. The projected solar output is observed for the top demand hours during
the summer and winter months.

NPCC-Ontario
NERC | 2013 Long-Term Reliability Assessment | December 2013
Page 113
On average, the assumed capacity contribution for biomass generation is about 95 percent of installed capacity.138 The
assumed capacity contribution for hydroelectric is 72 percent for the summer and 76 percent for the winter.
A formal review of Ontario’s Long-Term Energy Plan (LTEP) is currently underway which will include province-wide
consultations on a variety of topics including the province's mix of energy sources such as wind, solar and nuclear, and
conservation. The updated LTEP will be released in the fall.
IESO is working with OPA and industry stakeholders to develop and implement the necessary changes to accommodate
increased renewable generation. As Ontario’s renewable energy landscape changes and evolves so must the operation of
the grid. Specifically with the influx of wind generation facilities connected to the Ontario electricity transmission system, a
new set of operational and reliability considerations have emerged. An IESO stakeholder initiative, Renewables Integration
Initiative (RII), is nearing completion by addressing three major issues facing wind and solar generation. The RII addresses
the following issues:
Forecast: the implementation of a centralized forecasting service for wind and solar generation;
Visibility: access to Real-time information on embedded renewable generation; and
Dispatch: the dispatch of directly connected wind and solar generation.
RII has already yielded results, including the integration of the hourly centralized forecast into IESO scheduling tools and
enhanced visibility of renewable output within the IESO control room, which will provide greater levels of awareness of
system conditions.
The dispatch of grid-connected renewable resources, which started the second week of September, 2013 will provide
increased flexibility from available variable generation resources and will allow IESO to operate the system more efficiently.
No firm imports into Ontario or firm exports to other Regions or emergency generation are considered in this long-term
assessment. However, for use during daily operation, operating agreements between IESO and neighboring jurisdictions in
NPCC, RFC, and MRO include contractual provisions for emergency imports directly by IESO. IESO also participates in a
shared activation of reserve group, which includes IESO, ISO-NE, the Maritimes, NYISO, and PJM.
Transmission and System Enhancements
A new 176-km (110 mile), 500-kV double-circuit line from the Bruce Power nuclear complex to Milton Switching Station was
officially declared in-service in June 2012. This new line was built to accommodate the output of all eight generating units at
the Bruce complex, approximately 500 MW of existing wind generating capacity, and 1,200 MW of new renewable
generating capacity that is forecasted for development within the area. With all eight Bruce nuclear generating units and
new renewables, the combined generation in the Bruce area can reach 8,000 MW.
Northwestern Ontario is connected to the rest of the province by the double-circuit, 230-kV East–West Tie. The northwest
region has significant amounts of hydroelectric generation as well as other resources such as coal, gas, and biomass. As part
of the coal shutdown, Thunder Bay Generating Station (totaling 300 MW of capacity) will cease coal-fired operation by
2014. In addition, strong local load growth is forecast as a result of an active mining sector in the Region. Additional supply
is required to maintain supply security in this area under the wide range of possible system and water conditions. The
reinforcement of the East–West Tie with the addition of a new 230-kV transmission link will provide reliable, cost-effective,
and long-term supply to the Northwest. The line is anticipated to be in-service in 2018. Additional options are being
developed to address interim needs and any supply requirements that may exceed the capabilities of the new transmission.
138 The hydroelectric generation output forecast is based on historical values of median hydroelectric production and contribution to operating
reserves during weekday peak demand hours. Routine maintenance and actual forced outages of the generating units are implicitly accounted for in the historical data.
NPCC-Ontario
NERC | 2013 Long-Term Reliability Assessment | December 2013
Page 114
The Lambton to Longwood transmission upgrade consists of replacing approximately 70 km of existing double-circuit
transmission line between Lambton Transmission station (near Sarnia, Ontario) and Longwood Transmission station (near
London, Ontario) with a higher ampacity conductor. This project will increase the transfer capability from southwestern
Ontario toward London. The purpose of this project is to incorporate additional renewable resources and increase
deliverability of system capacity located west of London. It is anticipated that the project will be completed by 2014. Two
new 500-kV switching stations planned to be in-service by the end of 2014, Evergreen and Ashfield, are being built to
accommodate 384 MW and 270 MW of wind generation respectively.
The transmission projects that are under various stages of construction and other planned projects will address the
transmission constraints identified. The TOs in Ontario, together with the OPA, proactively plan the transmission network in
order to ensure timely system adjustments, upgrades, and expansions. Delays to the in-service dates of bulk transmission
projects caused by delays in obtaining required approvals or delays in construction may result in increased congestion or
usage of SPSs in the interim.
System reinforcements are also being considered in a number of regional areas (e.g., Kitchener–Waterloo–Cambridge–
Guelph, York region, and Ottawa) throughout the province in order to maintain a reliable, local supply of electricity. The
OPA’s regional planning approach develops options for each need, in a coordinated manner, guided by principles that
maintain a long-term view that anticipates uncertainties and maintains flexibility. Conservation, supply, and transmission
plans are coordinated to deliver the solutions that are required for each locale. This approach also addresses interim needs
when projects are delayed.
To enable the connection of additional renewable generation in the Bruce area, a static var compensator (SVC) rated at 350
MVA and connecting to the 500-kV voltage level at the Milton station was planned to be in-service by 2015. However, the
project is delayed pending a stakeholder consultation on the issue.
Ontario will monitor the progress of the continued operation of nuclear units at Pickering Nuclear Generating Station.
Pickering Nuclear Generating Station units connect directly to the 230-kV system at Cherrywood Transformer Station, east
of the greater Toronto area. The retirement of Pickering NGS would require an additional 230-kV supply source for the
Pickering and Oshawa areas. This will be provided by a new Clarington 500/230-kV transformer station with a 2017 in-
service date. Clarington Transformer Station will also improve load restoration capabilities to loads east of Cherrywood
following certain contingencies.
As demand increases in the western part of the greater Toronto area, the loads on the 500/230-kV transformers at
Claireville Transformer Station and Trafalgar Transformer Station are forecast to exceed capacity near the end of this
decade. An additional 500 to 230-kV supply source—involving the installation of 500/230-kV transformers at the 500-kV
Milton Switching Station by 2018—would be required to relieve the loading on these existing transformers.
There are no wide-area UVLS programs in Ontario, and there are no plans to install any such UVLS schemes in future. The
majority of the SPSs that are in use within Ontario are intended to address the effects of contingencies under outage
conditions and are not intended to avoid or delay the construction of bulk transmission facilities. The principal exception is
the North–East load and generation rejection SPS that mitigates the effects of contingencies involving the single-circuit,
500-kV line that services the North-East area. This SPS is designed to achieve a post-contingency match between the load
and available generation in the area to minimize load loss and prevent possible separation and islanding of a portion of the
North–East system.
The existing Bruce SPS has been enhanced to accommodate the two new 500-kV circuits between the Bruce complex and
Milton Switching Station and to address other contingency conditions not previously covered by the SPS. The intent of the
expanded coverage is to limit the extent of restrictions imposed on the output from the Bruce units during transmission
element outage conditions while also assisting with the repreparation of the system following a permanent fault when
subsequent contingency conditions may become more critical. This SPS will be a permanent feature to deal with planned

NPCC-Ontario
NERC | 2013 Long-Term Reliability Assessment | December 2013
Page 115
outages and is not intended for normal operations or to avoid or delay the construction of bulk transmission facilities. The
enhanced system was approved by NPCC and placed into service in 2012. The current Bruce SPS hardware is approaching its
end-of-life. A replacement is being developed and is scheduled to become fully operational in 2015.
To coincide with the completion of the new Bruce–Milton 500-kV line, a 350-Mvar SVC was installed at Nanticoke Switching
Station, connected to the 500-kV bus, and another 350-Mvar SVC was installed at Detweiler Transformer Station, connected
to the 230-kV bus. These SVCs were required to provide dynamic reactive support following a critical double-circuit
contingency involving the 500-kV lines between the Bruce complex and Milton Switching Station.
IESO has advanced the development of an on-line limit derivation tool to maximize transmission capability in the operating
time frame. Currently, this tool is used in operational planning to calculate a limited set of operating security limits in
southern, northeast, and east Ontario. The use of the tool is being extended to other parts of the province with an aim to
use this tool for the entire province by mid-2014. The limits calculated by the tool are used to plan and schedule equipment
outages and to re-prepare the power system following forced outages that impact Interconnection Reliability Operating
Limits (IROLs).
Long-Term Reliability Issues
As described in Generation section, hydroelectric generation capacity contributions are based on median historic values of
hydroelectric production plus operating reserves that have been observed during weekday peak demand hours.
Hydroelectric production is monitored on a monthly basis and due allowance is made for the median historical values when
drought conditions are expected in the midterm forecasts. However, it is expected that the production would bounce back
to median levels for the longer time frame.
The renewable resources target for wind, solar, and bioenergy is 10,700 MW by 2018, accommodated through transmission
expansion and maximized use of the existing system. Ontario will add a few hundred MW of hydroelectric capacity to reach
a target of 9,000 MW by 2018. A substantial amount of renewable generation is embedded and included in the demand
forecast. This will be achieved through the development of new facilities and significant investments to upgrade Ontario's
existing facilities. As described in the Generation section, the operational and adequacy concerns of integration of new
variable generation are addressed through RII.
IESO includes a quantity of demand measures termed the “Reliably Available Capacity” in its reliability analyses. This does
not represent the total registered capacity of DR programs. For market-based programs, IESO uses historical information to
ascertain the amount of DR capacity that is typically bid into the market at the time of the weekly peak demand. For
programs that have contracts, IESO uses both historical information and contract information in order to determine the
quantity of Reliably Available Capacity. As mentioned in the DSM section, the quantity of reliable capacity was significantly
reduced after the introduction of the GAA.
IESO’s initial studies indicated that there is no threat to system reliability based on the projected distribution connected
generation. The majority of the generation is solar, small scale, and geographically diverse. These factors combine to
mitigate much of the variability in the generation output.
As a result of the increase in the level of penetration of variable generation combined with the return of two units at Bruce
Nuclear Generating Station, potential surplus energy is expected to continue well into the decade. Potential surplus energy
conditions, referred to as surplus Base Load generation, are expected to be significantly reduced when the nuclear
refurbishment programs begin. A vast majority of surplus Base Load generation is being managed via IESO tools and
processes, such as nuclear maneuvering and managing inter-tie trades. In September 2013, IESO gained another tool to
help manage surplus Base Load generation as wind became a dispatchable resource and helps maintain market efficiency.
The Ontario government has implemented GHG emissions targets for coal-powered generation between 2013 and 2014,
ensuring that annual emissions are two-thirds lower than 2003 levels. Moving forward, Ontario’s low carbon portfolio mix

NPCC-Ontario
NERC | 2013 Long-Term Reliability Assessment | December 2013
Page 116
has the potential for producing surplus energy. As described earlier, potential surplus energy conditions are expected to
significantly diminish when nuclear refurbishment programs begin. A low carbon portfolio will also increase operability
complexities. Increases in wind resources in the system increases the ramping requirements during periods when demand
picks up and wind output drops off. Traditionally, coal-fired generation contributed to ramping flexibility, but that capability
will be reduced with the coal phase-out. In the years ahead, gas-fired generation will play an important role in Ontario’s
balance supply mix, providing the flexibility to cushion the electricity system when demand and intermittent resources rise
or fall.
With the growth in conservation savings and embedded generation capacity, demand forecasting has become increasingly
more complex. Additionally, the introduction of smart meters and higher on-peak electricity prices has introduced
consumer price response previously not seen in Ontario. Traditionally, demand was a function of weather conditions,
economic cycles, and population growth. With multiple factors influencing demand, determining the causality of demand
changes has become increasingly nuanced and requires greater data and analysis.
Technological change is always challenging to capture in long-term forecasts. IESO is evaluating two pilot project storage
technologies. The success of these programs could provide further growth in storage capacity within Ontario. To date, the
time-shifting impacts have not been factored into the demand forecast but, if widespread, could impact the hourly demand
profile. Other unforeseen technological changes may also present forecasting challenges.
Asset renewal is a systematic approach for continuous modernization of aging energy infrastructure. Much of the current
power system infrastructure, be it generation, transmission, or distribution equipment, is aging and needs to be
refurbished, replaced, or upgraded to comply with new standards and meet demand. A long-term plan is required to
coordinate the renewal of infrastructure to manage reliability, environmental, and cost impacts.
Within the next 10 years, nuclear units at the Bruce, Darlington, and Pickering facilities reach the end of their service lives
and will be taken out of service for refurbishment or retirement. Elsewhere, some transmission and distribution
components are over 80 years old and require upgrading. Although owners have programs in place for asset renewal, the
overall scope of the problem is what presents the challenge. Moreover, challenges can be expected in the coordination
between parties and the competition for resources from other major nonelectrical infrastructure developments.

NPCC-Québec
NERC | 2012 Long-Term Reliability Assessment | November 2012
Page 117 of 177
NPCC-Québec The Québec Assessment Area (Québec Area) is a NERC subregion in the northeastern part of the NPCC Region, covering 643,803 square miles with a population of eight million (province of Québec). The Area is winter peaking and one of the four NERC Interconnections in North America with ties to Ontario, New York, New England, and the Maritimes, consisting either of HVdc ties or radial generation or load to and from neighboring systems.
Planning Reserve Margins
NPCC-Québec-Summer 2014 2015 2016 2017 2018 2019 2020 2021 2022 2023
ANTICIPATED 55.63% 60.20% 59.81% 64.97% 67.82% 64.28% 63.44% 64.41% 63.41% 62.29% PROSPECTIVE 51.35% 58.33% 57.95% 63.12% 65.99% 62.48% 61.66% 62.64% 61.65% 60.54% ADJUSTED POTENTIAL 51.35% 58.33% 57.95% 63.12% 65.99% 62.48% 61.66% 62.64% 61.65% 60.54%
NERC REFERENCE - 12.00% 12.00% 12.00% 12.00% 12.00% 12.00% 12.00% 12.00% 12.00% 12.00%
NPCC-Québec-Winter 2014 2015 2016 2017 2018 2019 2020 2021 2022 2023
ANTICIPATED 12.39% 11.17% 10.90% 13.96% 12.19% 11.76% 11.97% 11.10% 10.24% 9.50% PROSPECTIVE 15.35% 14.11% 13.80% 16.84% 15.01% 14.56% 14.74% 13.85% 12.97% 12.21% ADJUSTED POTENTIAL 15.35% 14.11% 13.80% 16.84% 15.01% 14.56% 14.74% 13.85% 12.97% 12.21%
NERC REFERENCE - 10.30% 10.50% 10.70% 10.70% 10.70% 10.70% 10.70% 10.70% 10.70% 10.70% Summer Winter
0%10%20%30%40%50%60%70%
2014 2015 2016 2017 2018 2019 2020 2021 2022 20230%3%6%9%
12%15%18%21%
2014 2015 2016 2017 2018 2019 2020 2021 2022 2023
Cumulative 10-Year Planned Capacity Change
0500
1,0001,5002,0002,5003,0003,5004,000
2014 2015 2016 2017 2018 2019 2020 2021 2022 2023
MW
2013 Existing 2023 Planned 2023 Planned & Conceptual
NPCC-Québec Capacity
(MW) Share
(%) Capacity
(MW) Share
(%) Change
(MW) Capacity
(MW) Share
(%) Change
(MW)
Coal
0 0.0%
0 0.0% 0
0 0.0% 0
Petroleum
436 1.1%
436 1.0% 0
436 1.0% 0
Gas
0 0.0%
0 0.0% 0
0 0.0% 0
Nuclear
0 0.0%
0 0.0% 0
0 0.0% 0
Hydro
38,276 97.0%
40,877 95.0% 2,601
40,877 95.0% 2,601
Pumped Storage
0 0.0%
0 0.0% 0
0 0.0% 0
Geothermal
0 0.0%
0 0.0% 0
0 0.0% 0
Wind
483 1.2%
1,213 2.8% 730
1,213 2.8% 730
Biomass
254 0.6%
483 1.1% 229
483 1.1% 229
Solar
0 0.0%
0 0.0% 0
0 0.0% 0
TOTAL 39,449 100.0% 43,009 100.0% 3,561 43,009 100.0% 3,561

NPCC-Québec
NERC | 2013 Long-Term Reliability Assessment | December 2013
Page 118
Demand, Resources, and Planning Reserve Margins
The Reference Reserve Margin Levels are drawn from the Québec Area’s 2012 Interim Review of Resource Adequacy, which
was approved by NPCC’s Reliability Coordinating Committee on November 27, 2012. These levels vary between 10 and 11
percent during the four-year planning assessment.
The Québec Area demand forecast has decreased compared to the 2012LTRA reference case, reaching -1,000 MW for the
2015–2016 winter peak period. This decline in the demand forecast is mainly attributed to lower than expected load from
the industrial sector.
Energy efficiency and conservation programs and energy saving trends are accounted for directly in the assessment area’s
demand forecasts and count for 2,150 MW toward the 2014–2015 winter peak demand. Energy efficiency and conservation
programs are implemented throughout the year by Hydro-Québec Distribution and by the provincial government through
its Ministry of Natural Resources. Energy efficiency will continue to grow throughout the assessment period.
DR programs in the Québec Area—specifically designed for peak load reduction during winter operating periods—are
interruptible demand programs (for large industrial customers), totaling 1,439 MW for the 2014–2015 winter period. DR is
usually used in situations in which load is expected to reach high levels or when resources are not expected to be sufficient
to meet load at peak periods. DR is considered as a resource and is relatively stable during the assessment period, with a
maximum reached for the 2014–2015 winter peak period then settling down to 1,300 MW starting at the 2019–2020 winter
period. The total on-peak DR and Energy Efficiency and conservation for the 2023–2024 winter period is projected to be
approximately 4,900 MW.
There are no significant unit retirements planned during the assessment period. A few small hydroelectric projects, totaling
80 MW, have been cancelled by the provincial government. TransCanada Energy’s 547 MW natural gas combined-cycle
power plant in Bécancour is mothballed. Each summer, Hydro-Québec Distribution must decide whether to mothball the
Bécancour power plant for an additional year or restart it for the coming year. Although this plant is expected to be
mothballed until December 2020, it could be restarted sooner if needed. For that reason, it accounts for the total Existing-
Other resources. On the other hand, hydro generator uprates will be adding close to 500 MW of capacity during the
assessment period. Behind-the-meter generation is negligible and is accounted for in the load forecast.139
Biomass and wind resources are owned by Independent Power Producers (IPPs). These IPPs have signed contractual
agreements with Hydro-Québec. Therefore, for biomass resources, maximum capacity and expected on-peak capacity are
equal to contractual capacity, representing almost 100 percent of nameplate capacity. For wind resources, capacity
contribution at peak is estimated at 30 percent of contractual capacity, representing 840 MW and 1,210 MW respectively
for the 2014–2015 and 2023–2024 winter periods. Maximum wind capacity is set equal to contractual capacity, which
generally equals nameplate capacity. For summer peak period calculations, the expected on-peak wind capacity is set to
zero as wind resources are derated by 100 percent.
Wind generation integration has not significantly impacted day-to-day operation of the system, and the actual level of wind
generation does not require particular operating procedures. However, with the increasing amount of wind in the system,
the foreseeable impact on system management may show up.
Currently, the studies are underway, examining the following issues (1) wind generation variability on system load and
interconnection ramping; (2) frequency and voltage regulation problems; (3) increase of start-ups and shutdowns of
hydroelectric units due to load following coupled with wind variability; (4) expected efficiency losses in generating units;
139 When calculating on-peak capacity values for hydro resources, maximum capacity is set equal to the power that each plant can generate at its
maximum rating during two full hours, while expected on-peak capacity is set equal to maximum capacity minus scheduled maintenance outages and restrictions.

NPCC-Québec
NERC | 2013 Long-Term Reliability Assessment | December 2013
Page 119
and (5) reduction of low load operation flexibility due to low inertia response of wind generation coupled with must-run
hydro generation.
Expected capacity purchases are planned as needed for the Québec internal demand by Hydro-Québec Distribution. These
purchases are set at 1,100 MW throughout the assessment period and may be supplied by resources located in Québec or
in neighboring markets. In this regard, Hydro-Québec Distribution has designated the Massena–Châteauguay (1,000 MW)
and Dennison–Langlois (100 MW) interconnections’ transfer capacity to meet its resource requirements during winter peak
periods. These purchases are not backed by firm long-term contracts. However, on a yearly basis, Hydro-Québec
Distribution proceeds with short-term capacity purchases (UCAP) in order to meet its capacity requirements, if needed. The
Québec Area does not rely on any emergency capacity imports to meet its Reserve Margin Reference Level. The Québec
Area will support firm capacity sales totaling 626 MW to New England and Ontario (Cornwall) during the 2014–2015 winter
peak period, backed by firm contracts for both generation and transmission, declining to 145 MW in 2020.
Transmission and System Enhancements
ROMAINE RIVER HYDRO COMPLEX INTEGRATION
Construction of the first phase of transmission for the Romaine River Hydro Complex project is presently underway. Total
capacity will be 1,550 MW. The generating stations will be integrated on a 735-kV infrastructure initially operated at 315-
kV. In 2014–2016, Romaine-2 (640 MW) and Romaine-1 (270 MW) will be integrated at Arnaud 735/315/161-kV substation.
In 2017–2020, Romaine-3 (395 MW) and Romaine-4 (245 MW) will be integrated at Montagnais 735/315-kV substation.
For 2014, main system upgrades for this project will require construction of a new 735-kV switching station to be named
“Aux Outardes” and located between existing Micoua and Manicouagan Transformer Stations. Two 735-kV lines will be
redirected into the new station and one new 735-kV line (5 km or 3 miles) will be built between Aux Outardes and Micoua.
BOUT-DE-L’ÎLE 735-KV SECTION
Hydro-Québec TransÉnergie (TransÉnergie) is adding a new 735-kV section at Bout-de-l’Île substation (located at east end
of Montréal Island). This was originally a 315/120-kV station. The Boucherville – Duvernay line (line 7009), which passes by
Bout-de-l’Île, will be looped into the new station. A new -300/+300-Mvar SVC will be integrated into the 735-kV section in
2013.
The project also includes the addition of two 735/315-kV 1,650-MVA transformers in 2014. This new 735-kV source will
allow redistribution of load around the Greater Montréal area and absorb load growth in eastern Montréal. This project will
enable future major modifications to the Montréal area regional subsystem. Many of the present 120-kV distribution
stations will be rebuilt into 315-kV stations and the Montréal regional network will be converted to 315-kV. The addition of
a second -300/+300-Mvar SVC at Bout-de-l’Île in 2014 is also projected.
CHAMOUCHOUANE–MONTRÉAL 735-KV LINE
Planning studies have shown the need to consolidate the transmission system with a new 735-kV line in the near future.
Generation additions (such as the Romaine Complex and wind generation) and new transmission services are the reason
the new line is warranted. The line will extend from the Chamouchouane substation on the eastern James Bay subsystem to
the Duvernay substation just north of Montréal (about 400 km or 250 miles).
Planning, permitting, and construction delays are such that the line is scheduled for the 2018−2019 winter peak period.
Public information meetings have begun on this project. The final line route has not completely been determined yet, and
authorization processes are ongoing.
The new line will also reduce transfers on other parallel lines on the Southern Interface, thus optimizing operation flexibility
and reducing losses.

NPCC-Québec
NERC | 2013 Long-Term Reliability Assessment | December 2013
Page 120
OTHER 735-KV PROJECTS
Additionally, a 735-kV series compensation upgrade at Bergeronnes switching station is scheduled for 2014.
THE NORTHERN PASS TRANSMISSION PROJECT
This project will increase interconnection transfer capability between Québec and New England by 1,200 MW and is now
being studied. The project involves construction of a ±300-kV dc transmission line about 75 km (46 miles) long from Des
Cantons 735/230-kV substation to the Canada–United States border. This line will extend to a substation in Franklin, New
Hampshire. The project in Québec also includes the construction of two 600-MW converters at Des Cantons and a 300-kV
dc switchyard. Permitting for this project is presently ongoing. The initial planned in-service date (fall 2015) has been re-
evaluated to 2017−2018.
THE CHAMPLAIN-HUDSON POWER EXPRESS PROJECT
This project will increase interconnection transfer capability between Québec and New York by 1,000 MW and is now under
study. The project involves construction of ±320-kV dc underground transmission line about 50 km (31 miles) long from the
Hertel 735/315-kV substation just south of Montréal to Canada–United States border. This line will be extended
underground and underwater (Lake Champlain and Hudson River) to Astoria station in New York City. The project in Québec
also includes the construction of two 550-MW converters at Hertel and a 320-kV dc switchyard. Permitting for this project is
presently ongoing. The planned in-service date is fall 2017.
WIND GENERATION INTEGRATION PROJECTS
Hydro-Québec Distribution has issued different calls for tenders for wind generation in past years. A total of approximately
3,350 MW (including wind generation already in-service) is forecasted to be on-line in 2015. A number of wind transmission
projects with voltages ranging from 120-kV to 315-kV are either under construction or in planning stages to integrate this
wind generation. These wind generation projects are distributed in many areas of Québec, but most are near the shores of
the Gaspésie Peninsula, along the Gulf of St. Lawrence down to the New Brunswick border.
OTHER 735-KV CONCEPTUAL PROJECTS
The subregion is planning a new 735/315-kV transformer station near the existing Lebel 315/120-kV station in the Abitibi
region of the system. This will consolidate the Abitibi subsystem, which presently has a 120-kV infrastructure with a 315-kV
feed at Lebel and Figuery substations. A new 142-km (88-mile), 735-kV line is projected from Abitibi 735-kV station on the
western James Bay system to feed this new station. Two 735/315-kV, 1650-MVA transformers and four 315-kV line feeders
will complete the station. The projected in-service date is fall 2018, but this may vary depending on the projected industrial
loads in the area.
UPCOMING REGIONAL PROJECTS
There are a number of regional projects now underway. The three important projects scheduled for fall 2014 are:
Charlesbourg 315/25-kV substation and 315-kV transmission (Québec City)
Lefrançois 315/25-kV substation and 315-kV transmission (Québec City)
St-Césaire–Bedford 230-kV, double-circuit line (Eastern Townships to upgrade feed to Highgate)
Other regional substation and line projects are now in the planning and permitting stages. There are about a dozen regional
transmission projects in the Montréal and Québec City areas and another dozen in other areas with in-service dates from
2013 to 2018, consisting mostly of replacing the 120-kV and 69-kV infrastructure with 315/25-kV and 230/25-kV satellite
(distribution) substations. Other regional upgrade projects (i.e., in the Abitibi and Manicouagan subsystems) will also be
commissioned in the upcoming years.
Planning studies leading to system enhancement projects, such as those mentioned above, ensure that there will be no
long-term transmission constraints in the assessment area. Generation on the system is integrated on a 100 percent firm
basis.

NPCC-Québec
NERC | 2013 Long-Term Reliability Assessment | December 2013
Page 121
SYSTEM ENHANCEMENTS
In the Québec Interconnection, load shedding caused by an under voltage is initiated by a specific remote UVLS named
TDST. A maximum of 1,500 MW is targeted by TDST. It has been designed to operate following contingencies involving the
loss of two or more 735-kV lines. Contingencies range from the loss of two parallel 735-kV lines to the loss of a 735-kV line
with series compensation bypass on parallel lines. These contingencies do not require more than 1,500 MW of load
shedding, although TDST operates on a pre-defined pool of 2,500 MW located in the Montréal Area. The last NPCC
Comprehensive Review Assessment of the Québec transmission system for the year 2017—conducted by TransÉnergie
(approved by NPCC June 2013)—shows that TDST is adequate to preserve system stability after the contingencies for which
it is designed.
No additional load is expected to be assigned to UVLS during the next 10 years.
There are no plans to install SPSs or Remedial Action Schemes in lieu of planned bulk power transmission facilities in the
Québec Area.
Hydro-Québec intends to deploy a number of new technologies, systems, and tools (including smart grid incentives) to
improve future BPS reliability. Government policies and targets for renewable energy integration, Energy Efficiency, electric
or rechargeable hybrid vehicles, and GHG emission reductions are among the major drivers for the development of smart
grid programs.
TransÉnergie’s system consists of an extensive 735-kV network with 315-kV, 230-kV, 120-kV, and 69-kV underlying
subsystems totaling 33,639 km (i.e., 20,902 line miles). The system uses telecommunications and advanced protection and
control applications to ensure its reliability and improve its performance. This will continue into the future. The system is
planned according to NPCC and NERC Planning Standards but includes additional criteria that consider system topology and
substation characteristics particular to TransÉnergie’s system (complementary contingencies) and address voltage
sensitivity to load variation and interconnection ramping. SPSs to ensure reliability (for extreme events) are presently in use
and will continue to be used. These include Remote Generation Rejection and Load Shedding (RPTC SPS), Undervoltage
Remote Load Shedding (TDST SPS), and Under Frequency Load Shedding.
Other technologies such as synchronous condensers, SVCs, 735-kV series compensation, multi-band power system
stabilizers (MBPSSs), HVdc systems, and a variable frequency transformer (VFT) are in use. Such systems are planned for
future system upgrades or for generation integration as needed.
In order to upgrade transfer capability and improve system reliability, another project is aimed at regulation systems and
SPS improvement. This includes installation of MBPSSs in a great number of generating stations, new regulation circuits for
the dynamic shunt compensation equipment, new relaying for SPSs, new control strategies for HVdc converters,
development of severity indices for angular and voltage stability, etc. The project also includes the potential introduction of
a type of global regulation for dynamic shunt equipment (as opposed to regulation based on local parameters) employing
measurement units, a data concentrator, control units, all linked by synchronized digital communications.
For more than two decades now, TransÉnergie has been operating an angular displacement measuring system to accurately
monitor and register system frequency and angular displacement between major generating stations and load centers. This
is used for online reporting and provides priceless data for all system events involving frequency variations and angular
displacements. The system also measures voltage and current distortion and is quite valuable for monitoring harmonic
content during solar magnetic disturbances (SMDs).
No smart grid programs have been fully implemented at Hydro-Québec during the past year. In 2013, the IMAGINE project,
which involves automated maintenance and enhanced processing of monitoring data, is still ongoing. This project, which
focuses first and foremost on power transformers, will enable TransÉnergie to optimize target maintenance efforts to
NPCC-Québec
NERC | 2013 Long-Term Reliability Assessment | December 2013
Page 122
prevent equipment failures and improve system reliability. The IMAGINE program is carried out with Hydro-Québec
Research Institute (IREQ), Hydro-Québec's research center, with the help of industrial partners.
Long-Term Reliability Issues
Given the importance of hydroelectric resources within the Québec Area, an energy criterion has been developed to assess
energy reliability. The criterion states that sufficient resources should be available to go through sequences of two or four
consecutive years of low water inflows totaling 64 TWh and 98 TWh respectively with a two percent probability of
occurrence. These assessments are presented three times a year to the Régie de l'énergie du Québec (Québec Energy
Board). Normal hydro conditions are projected during the assessment period and reservoir levels are expected to be
sufficient to meet both peak demands and daily energy demand.
Also, as a member of the Western Climate Initiative, the Province of Québec implemented a cap-and-trade system in 2012,
with compliance beginning January 1, 2013. Given the significant proportion of renewable generation in the Québec Area,
this new regulation will not impact reliability in the Québec Area.
However, there are several important issues that may impact system reliability during the assessment period. While there is
no doubt that during recent years technical developments have contributed to creating a more reliable system, sustainable
system reliability may be challenged by several issues. The two issues described and analyzed below are considered as
standing reliability issues.
WIND PLANT INTEGRATION TO GRID
As a separate NERC Interconnection, the Québec Area is responsible for its own frequency regulation. System inertia is
quite low compared to the Eastern Interconnection, for example. Large post-contingency frequency excursions—up to ±1.5
Hz—can occur after normal contingencies, and operating limits related to post-contingency frequency behavior are
required.
Through 2015, Hydro-Québec will have integrated around 3,350 MW of nameplate wind capacity. This kind of large-scale
wind capacity integration on the system has triggered a need for frequency support by wind plants as it displaces
conventional hydro generation that inherently provides inertia. In order to maintain present system performance,
TransÉnergie (the Transmission Planner) has requested from manufacturers an inertia emulation function that would cover
lack of inertia and spinning reserve from modern variable speed wind turbine generators. In 2012, the first wind plants able
to provide this function were commissioned. TransÉnergie is now beginning to observe and assess the performance of the
inertia emulation function for real system events. Further studies are needed to implement fine-tuning of the feature.
Inertia emulation is required for Hydro-Québec’s wind generation resulting from the second and third calls for tenders,
totaling 2,295 MW of capacity.
EQUIPMENT AGING AND SUSTAINABILITY
Equipment aging and sustainability (i.e., for line and station equipment) have been standing issues at TransÉnergie for more
than 15 years. However, during the years 2000–2010, it became obvious that a global strategic investment policy was
needed to tackle the issue. The strategy is based on the risk (sustainability) of losing equipment due to a major failure as
the equipment approaches the end of its life cycle. This risk assessment considers the probability of a major failure and its
impact on the transmission system and on TransÉnergie as an asset owner. In 2007, the strategy and an accompanying
annual budget were presented to and authorized by the Québec Energy Board.
Significant investment cuts, personnel and equipment availability for maintenance outages as well as new projects, and
system availability for outages are all issues that could impact reliability in the context of equipment aging.
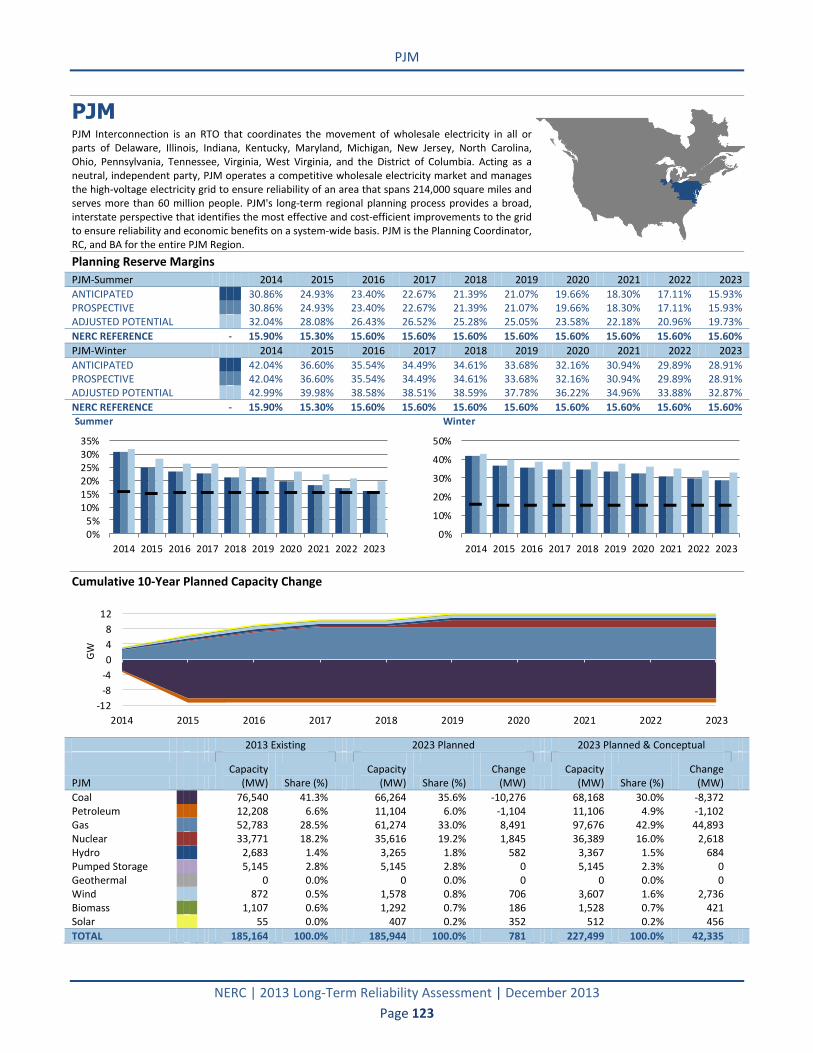
PJM
NERC | 2013 Long-Term Reliability Assessment | December 2013
Page 123
PJM PJM Interconnection is an RTO that coordinates the movement of wholesale electricity in all or parts of Delaware, Illinois, Indiana, Kentucky, Maryland, Michigan, New Jersey, North Carolina, Ohio, Pennsylvania, Tennessee, Virginia, West Virginia, and the District of Columbia. Acting as a neutral, independent party, PJM operates a competitive wholesale electricity market and manages the high-voltage electricity grid to ensure reliability of an area that spans 214,000 square miles and serves more than 60 million people. PJM's long-term regional planning process provides a broad, interstate perspective that identifies the most effective and cost-efficient improvements to the grid to ensure reliability and economic benefits on a system-wide basis. PJM is the Planning Coordinator, RC, and BA for the entire PJM Region.
Planning Reserve Margins
PJM-Summer 2014 2015 2016 2017 2018 2019 2020 2021 2022 2023
ANTICIPATED 30.86% 24.93% 23.40% 22.67% 21.39% 21.07% 19.66% 18.30% 17.11% 15.93% PROSPECTIVE 30.86% 24.93% 23.40% 22.67% 21.39% 21.07% 19.66% 18.30% 17.11% 15.93% ADJUSTED POTENTIAL 32.04% 28.08% 26.43% 26.52% 25.28% 25.05% 23.58% 22.18% 20.96% 19.73%
NERC REFERENCE - 15.90% 15.30% 15.60% 15.60% 15.60% 15.60% 15.60% 15.60% 15.60% 15.60%
PJM-Winter 2014 2015 2016 2017 2018 2019 2020 2021 2022 2023
ANTICIPATED 42.04% 36.60% 35.54% 34.49% 34.61% 33.68% 32.16% 30.94% 29.89% 28.91% PROSPECTIVE 42.04% 36.60% 35.54% 34.49% 34.61% 33.68% 32.16% 30.94% 29.89% 28.91% ADJUSTED POTENTIAL 42.99% 39.98% 38.58% 38.51% 38.59% 37.78% 36.22% 34.96% 33.88% 32.87%
NERC REFERENCE - 15.90% 15.30% 15.60% 15.60% 15.60% 15.60% 15.60% 15.60% 15.60% 15.60% Summer Winter
0%5%
10%15%20%25%30%35%
2014 2015 2016 2017 2018 2019 2020 2021 2022 2023
0%
10%
20%
30%
40%
50%
2014 2015 2016 2017 2018 2019 2020 2021 2022 2023
Cumulative 10-Year Planned Capacity Change
-12
-8
-4
0
4
8
12
2014 2015 2016 2017 2018 2019 2020 2021 2022 2023
GW
2013 Existing 2023 Planned 2023 Planned & Conceptual
PJM Capacity
(MW) Share (%) Capacity
(MW) Share (%) Change
(MW) Capacity
(MW) Share (%) Change
(MW)
Coal
76,540 41.3%
66,264 35.6% -10,276
68,168 30.0% -8,372
Petroleum
12,208 6.6%
11,104 6.0% -1,104
11,106 4.9% -1,102
Gas
52,783 28.5%
61,274 33.0% 8,491
97,676 42.9% 44,893
Nuclear
33,771 18.2%
35,616 19.2% 1,845
36,389 16.0% 2,618
Hydro
2,683 1.4%
3,265 1.8% 582
3,367 1.5% 684
Pumped Storage
5,145 2.8%
5,145 2.8% 0
5,145 2.3% 0
Geothermal
0 0.0%
0 0.0% 0
0 0.0% 0
Wind
872 0.5%
1,578 0.8% 706
3,607 1.6% 2,736
Biomass
1,107 0.6%
1,292 0.7% 186
1,528 0.7% 421
Solar
55 0.0%
407 0.2% 352
512 0.2% 456
TOTAL 185,164 100.0% 185,944 100.0% 781 227,499 100.0% 42,335
PJM
NERC | 2013 Long-Term Reliability Assessment | December 2013
Page 124
BOUNDARY CHANGE
This year’s report includes the load and generation of Duke Energy Ohio/Kentucky (DEOK), which was integrated into the
PJM regional transmission organization (RTO) on January 1, 2012, and the generation and load of East Kentucky Power
Cooperative (EKPC), which was integrated into PJM on June 1, 2013.
Demand, Resources, and Planning Reserve Margins
The PJM RTO Reserve Requirement is 15.9 percent for the 2014–2015 planning period, which runs from June 1, 2014,
through May 31, 2015. The PJM RTO Reserve Requirement is 15.3 percent for the 2015–2016 planning period, which runs
from June 1, 2015, through May 31, 2016. The PJM RTO Reserve Requirement is 15.6 percent for the 2016–2017 planning
period through the end of the LTRA assessment period. For more information, see the 2012 PJM Reserve Requirement
Study.140 The PJM RTO will have an adequate Anticipated Reserve Margin and the Adjusted-Potential Resources Reserve
Margin is above the PJM Reserve Requirement though the entire assessment period.
With the exception of the addition of EKPC demand on June 1, 2013, the demand forecast for the rest of PJM has remained
at a historically typical rate of 1.3 percent. DEOK was integrated into the PJM RTO on January 1, 2012, and added
approximately 5,400 MW to the PJM forecast at the time. The load of EKPC added approximately 1,910 MW of load to the
PJM RTO forecast.141
The total amount of Energy Efficiency for the PJM Area that is expected to be available on peak for summer 2014 is 924
MW. This value decreases to 891 MW in 2015 and remains constant through the end of the assessment period. Demand-
Side resources available during the 2014 summer peak period are forecasted to total 11,250 MW and remain relatively
constant through the entire assessment period. DSM used for reserves is limited by the RFC criteria to 25 percent of the
PJM Operating Reserve requirement. This type of DSM is typically fully subscribed and can range up to approximately 2,500
MW during a peak summer day.
PJM has announced plans for over 13,000 MW (6.9 percent of the PJM Existing-Certain fleet) of generator retirements
during the assessment period.142 Of the announced retirements, approximately 9,700 MW is coal, 2,000 MW is gas, and
1,300 MW is oil-fired generation. From a Regional Transmission Expansion Plan (RTEP) perspective, generation
deactivations coupled with steady load growth and sluggish generation additions can lead to the emergence of reliability
criteria violations in many areas of PJM. Each generation deactivation is reviewed and any required transmission upgrades
to address the transmission network reliability needs as result of the generation deactivation are included in the RTEP.
140 PJM Reserve Requirement Study 141 There is no change in economic outlook or weather assumptions for this year’s assessment. 142 Generator Deactivation Summary Sheets.

PJM
NERC | 2013 Long-Term Reliability Assessment | December 2013
Page 125
In the PJM RTEP analysis, generator uprates are considered exactly the same as adding a new generator. There are over 100
generator uprates in the PJM Interconnection Queue ranging from 200 MW to less than 1 MW. No significant generation is
planned to be out-of-service during the peak periods. Behind-the-meter-generation is not counted as PJM capacity and has
no effect on the PJM reserve margin.

PJM
NERC | 2013 Long-Term Reliability Assessment | December 2013
Page 126
Capacity transactions amount to a net import of 4,255 MW in 2014 and then increasing to 4,340 MW in 2015. In 2016, and
for the remainder of the assessment period, the net import is expected to be 3,022 MW. This import is composed of
specific transactions for each generator. These transactions include the firm reservation rights for the generation and firm
transmission rights to transfer the power across the PJM border. All import and export contracts that are counted toward
the PJM Reserve Margin are firm for both capacity and transmission service. PJM has no reliance on outside assistance for
emergency imports. Capacity Benefit Margin is reserved on transmission across the PJM border but there is no reservation
of capacity with our neighbors. The original transaction agreements include the firm reservation rights for the generation
and firm transmission rights to transfer the power across the PJM border.
Transmission and System Enhancements
SUSQUEHANNA TO ROSELAND
The Susquehanna–Roseland 500-kV line (Susquehanna–Lackawanna–Hopatcong–Roseland) had a required in-service date
of June 1, 2012. Regulatory process delays pushed the expected in-service to June 1, 2015. In February 2010, the
Pennsylvania Public Utility Commission approved the line, and the New Jersey Board of Public Utilities approved it in April
2010. The line received final approval from the National Park Service (NPS) when they issued a Record of Decision on
October 2, 2012, affirming the route chosen by PPL and PSE&G; the NPS issued a Special Use (Construction) Permit on

PJM
NERC | 2013 Long-Term Reliability Assessment | December 2013
Page 127
December 12, 2012. PJM will continue to operate to double circuit tower line limits in real-time operation until the new line
is placed in-service.
MID-ATLANTIC POWER PATHWAY (MAPP)
PJM’s 2011 RTEP analysis, which included various generation sensitivities, indicated that the need for the MAPP 500-kV line
(Possum Point–Burches Hill–Chalk Point–Calvert Cliffs–Vienna–Indian River) had moved several years into the future,
beyond 2015. In 2011, the PJM Board decided to hold the project in abeyance with a 2019–2021 in-service date. On August
24, 2012, the Board formally removed the MAPP project from the PJM RTEP.
POTOMAC–APPALACHIAN TRANSMISSION HIGHLINE (PATH)
PJM’s 2011 RTEP analysis also indicated that the need for the PATH 765-kV line (Amos–Welton Springs–Kemptown) had
moved out several years, beyond 2015. Based on these analyses, the PJM Board decided to hold the project in abeyance
and requested that the TO suspend development activities. On August 24, 2012, the Board formally removed the PATH
project from the PJM RTEP.
MOUNT STORM–DOUBS
The 2011 RTEP analysis identified a required in-service date of June 2020 for the Mount Storm–Doubs line rebuild.
However, recognizing the urgency of upgrading these aging facilities, Dominion indicated its intention to complete the
reconductoring project by June 1, 2015. To that end, the capacity of the rebuilt line–with a rating 65 percent higher than
the original—was reflected in PJM’s 2017 power flow case modeling.

PJM
NERC | 2013 Long-Term Reliability Assessment | December 2013
Page 128
THE HUDSON TRANSMISSION PARTNERS (HTP) PROJECT
The HTP project—a back-to-back HVdc interconnection between PJM and New York City (New York Zone J)—went into
service in May 2013. While the interconnection facility is rated at 660 MW, only 320 MW are designated for firm
transmission service, with the remaining 340 MW designated for non-firm transmission service. Currently, only a small
portion of the firm transmission rights (13 MW) are available because the required network transmission upgrades needed
to make the full 320 MW deliverable in the PJM system will not be in-service until June 1, 2014. The remaining capability
will be available for non-firm service.
Current plans include over 9,000 Mvar of reactive reinforcements that will be installed on the PJM system during the next
five years. The reactive reinforcements include both static (capacitor and reactor) as well as dynamic (SVC) installations.
PLANNED SVCS
138th Street 138-kV Dayton 75 Mvar (December 31, 2013)
Meadowbrook 500-kV FirstEnergy (AP) 600 Mvar (June 1, 2014)
Mt. Storm 500-kV Dominion 250 Mvar (June 1, 2014)
Hunterstown 500-kV FirstEnergy (ME) 500 Mvar (June 1, 2014)
Altoona 230-kV FirstEnergy (ME) 250 Mvar (June 1, 2014)
Loudon 500-kV Dominion 450 Mvar (June 1, 2014)

PJM
NERC | 2013 Long-Term Reliability Assessment | December 2013
Page 129
New Castle 138-kV FirstEnergy (ATSI) 150 Mvar (June 1, 2015)
Prospect Heights (Red) 138-kV ComEd 300 Mvar (June 1, 2015)
Prospect Heights (Blue) 138-kV ComEd 300 Mvar (June 1, 2015)
Crawford (Green) 138-kV ComEd 300 Mvar (June 1, 2016)
Crawford (Yellow) 138-kV ComEd 300 Mvar (June 1, 2016)
Landstown 230-kV Dominion 500 Mvar (June 1, 2016)
PLANNED FAST-SWITCHING CAPACITORS
Mansfield 345-kV FirstEnergy (PN) 100 Mvar (June 1, 2014)
Pleasant View 500-kV Dominion 150 Mvar (June 1, 2014)
Jack's Mountain 500-kV FirstEnergy (PN) 100 Mvar (June 1, 2017)
Jack's Mountain 500-kV FirstEnergy (PN) 500 Mvar (June 1, 2017)
PLANNED SERIES COMPENSATIONS
0.5 percent reactor in the Red Bank–Oakley 138-kV line Duke
3.8 ohm 138-kV reactor in Red Bank–Ashland 138-kV line Duke
PLANNED VARIABLE REACTORS
Cedar Creek 230-kV Dayton 100 Mvar
New Castle 138-kV Dayton 100 Mvar
Churchland 230-kV Dominion 100 Mvar
Shawboro 230-kV Dominion 100 Mvar
UVLS is utilized at two 138-kV buses in PJM. The relays trip approximately 25 MW of load and work in conjunction with
other non-BES UVLS installations. The relays are installed to prevent voltage collapse or instability for one possible Type C
(loss of two 345-kV lines) contingency and three Type D (two loss of right-of-way and one loss of substation - two voltage
levels) contingencies.
Two new SPSs are planned. The first SPS is a load drop scheme that was installed on June 1, 2013 in Delmarva due to low
voltage after a double contingency, voltage drop, and nonconvergence problems. The SPS will be retired when the Wye
Mills–Church 138-kV line is installed on June 1, 2015. The second SPS is to sectionalize the Stanton 230-kV bus in PPL for
several double-contingency losses. This SPS will go into service on November 1, 2014, and will be retired when line
upgrades are completed on November 30, 2019.
Long-Term Reliability Issues
PJM has very little hydro generation and reservoir levels are adequate. PJM expects no problems with warm cooling water.
Significant development of wind, solar and biomass has already occurred in PJM. Much of this development is in response
to existing RPSs. The challenges of integration this variable generation will grow as more and more generation of this type is
added. Demand side resources are not of a significant enough size to be of great concern for unresponsiveness. Penalties
exist to make unresponsiveness financially unattractive. Distributed energy resources has been increasing in PJM especially
solar installations which are mostly connected to lower voltage lines. No special operating procedures required. PJM has
developed a Wind Power Forecast tool and visualization to assist operations.
PJM developed an analysis of coal generation at risk of retiring based on an assessment of required environmental retrofit
costs vs. the cost of constructing a new natural gas-fired turbine. This at risk generation analysis concluded that there is no
overall resource adequacy concern for the PJM footprint, however there may be localized reliability concerns that will need
to be addressed either with replacement generation capacity or transmission upgrades if the impacted units are retired or
need lengthy environmental retrofit outages. PJM continues to coordinate closely with PJM Generation Owners, PJM TOs

PJM
NERC | 2013 Long-Term Reliability Assessment | December 2013
Page 130
and neighboring systems through the PJM Committee structure and consistent with the PJM Tariff and manuals. In order to
maintain system reliability, PJM will designate units as "Reliability Must Run" if their retirement date is targeted to be in
advance of required system reinforcements.
PJM requested that all impacted generation owners provide the most accurate information regarding unit retirements,
environmental retrofits, unit derates and potential regulatory issues related to the environmental regulations. Combined
with the publically announced unit retirements and the deactivation analysis results, PJM is utilizing this information to
address short term impacts and long term projections through 2018. PJM is communicating with interconnected TOs as
required to address local reliability issues, and also communicating with MISO to compare reliability analyses and
coordinate outages.
At this point PJM has added the environmental retrofit outages, to the extent provided by the generation owners, to
projections for maintenance outages from 2012–2018, and we are continuing to assess the impact to off-peak reliability.
PJM will continue to coordinate closely to analyze the impact of retiring generation, planned outage to perform retrofits,
normal generation and transmission maintenance outages as well as transmission outages required to perform planning
upgrades to resulting from retiring generation.
Generation owners have indicated that while at this time there appears to be sufficient time to complete environmental
retrofits, if there are delays in scheduling retrofit outages due to system constraint issues or capital budget limitations, then
there may be significant challenges in completing the retrofit outages in the required time to comply with environmental
regulations.

SERC-E
NERC | 2013 Long-Term Reliability Assessment | December 2013
Page 131
SERC-E SERC‐E is an assessment area covering portions of North and South Carolina, excluding SERC entities that are in PJM. The five BAs in this area are Alcoa Power Generating, Inc. – Yadkin Division (Yadkin), Duke Energy Carolinas and Duke Energy Progress (Duke), South Carolina Electric & Gas Company (SCE&G), and South Carolina Public Service Authority (SCPSA). The SERC-E Assessment Area serves about 4.4 million customers over approximately 32,000 square miles. There have been no changes to the footprint during the past two years, other than the merger of Duke Energy and Progress Energy.
Planning Reserve Margins
SERC-E-Summer 2014 2015 2016 2017 2018 2019 2020 2021 2022 2023
ANTICIPATED 21.70% 19.15% 16.28% 16.44% 16.60% 15.00% 12.97% 11.29% 9.60% 8.04% PROSPECTIVE 21.82% 19.28% 16.40% 16.56% 16.72% 15.12% 13.09% 11.40% 9.71% 8.15% ADJUSTED POTENTIAL 21.83% 19.28% 16.40% 16.56% 17.56% 16.35% 16.01% 14.76% 14.68% 13.51%
NERC REFERENCE - 15.00% 15.00% 15.00% 15.00% 15.00% 15.00% 15.00% 15.00% 15.00% 15.00%
SERC-E-Winter 2014 2015 2016 2017 2018 2019 2020 2021 2022 2023
ANTICIPATED 30.37% 28.84% 25.83% 25.65% 26.67% 22.97% 21.02% 19.80% 17.33% 15.62% PROSPECTIVE 30.50% 28.97% 25.96% 25.77% 26.79% 23.08% 21.14% 19.92% 17.45% 15.73% ADJUSTED POTENTIAL 30.50% 28.97% 25.96% 25.77% 27.75% 24.51% 24.49% 23.72% 23.06% 21.74%
NERC REFERENCE - 15.00% 15.00% 15.00% 15.00% 15.00% 15.00% 15.00% 15.00% 15.00% 15.00% Summer Winter
0%
5%
10%
15%
20%
25%
2014 2015 2016 2017 2018 2019 2020 2021 2022 2023
0%5%
10%15%20%25%30%35%
2014 2015 2016 2017 2018 2019 2020 2021 2022 2023
Cumulative 10-Year Planned Capacity Change
-1,500-1,000
-5000
5001,0001,5002,0002,5003,000
2014 2015 2016 2017 2018 2019 2020 2021 2022 2023
MW
2013 Existing 2023 Planned 2023 Planned & Conceptual
SERC-E Capacity
(MW) Share (%) Capacity
(MW) Share (%) Change
(MW) Capacity
(MW) Share (%) Change
(MW)
Coal
17,257 33.9%
15,864 30.3% -1,393
15,864 28.8% -1,393
Petroleum
1,865 3.7%
1,865 3.6% 0
1,865 3.4% 0
Gas
13,941 27.4%
14,623 27.9% 682
16,752 30.5% 2,811
Nuclear
11,564 22.7%
13,831 26.4% 2,267
14,273 25.9% 2,709
Hydro
3,079 6.1%
3,079 5.9% 0
3,079 5.6% 0
Pumped Storage
3,044 6.0%
3,044 5.8% 0
3,044 5.5% 0
Geothermal
0 0.0%
0 0.0% 0
0 0.0% 0
Wind
0 0.0%
0 0.0% 0
0 0.0% 0
Biomass
97 0.2%
97 0.2% 0
98 0.2% 2
Solar
28 0.1%
28 0.1% 0
28 0.1% 0
TOTAL 50,874 100.0% 52,430 100.0% 1,556 55,003 100.0% 4,129

SERC-E
NERC | 2013 Long-Term Reliability Assessment | December 2013
Page 132
Demand, Resources, and Planning Reserve Margins
Generation resources are planned to ensure that Planning Reserve Margins are met. Resource plans are reviewed and
revised by entities in the assessment area to achieve individual entity Planning Reserve Margins. Results show that entities
are planning for reserves in the range of 14 to 20 percent for the 2014–2023 reporting period. There have been no changes
made to the Reference Margin Levels since the release of the 2012 long-term assessment.
Entities in SERC-E anticipate a slightly decreasing trend in demand growth compared to last year’s forecast. Differences are
accounted for through lower load projections and a shift in load-serving responsibilities among entities in the area. This is
due to contractual agreements scheduled between 2013 and 2019 and a lower level of energy sales due to the sluggish
economy and increased conservation.
A variety of Energy Efficiency and DR programs are offered to customers in SERC-E. Some of the current Energy Efficiency,
DR, and DSM programs include: interruptible capacity, load control curtailing programs, residential air conditioning direct
loads, energy products loan programs, standby generator controls, residential time-of-use, interruptible and related rate
structures, Power Manager Power Share conservation programs, residential Energy Star rates, Good Cents new home
program, commercial Good Cents program, thermal storage cooling program, H20 Advantage water heater program,
general service and industrial time-of-use, hourly pricing for incremental load interruptible, product additions to lighting
programs, new residential construction programs to address new building codes, and standards. The commitment to these
programs is part of a long-term balanced strategy to meet future energy needs.143 Entities in North Carolina include
renewables in their portfolios to meet the state's Renewable Energy and Efficiency Portfolio Standard (REPS)
requirement.144 Energy Efficiency and DR programs are considered part of utility resource planning and are used as load
modifiers during periods of peak demand.
The SERC-E entities have reported that some generating unit retirements will impact available capacity during the next 10
years. Some of the retirements are directly related to compliance with the EPA’s new MATS. In order to minimize this
impact and respond to projected growing demand, SERC-E utilities are adding new, more efficient generating units while
retrofitting older units. This will result in a more efficient, environmentally friendly generating fleet, with an increased
amount of nuclear and renewable capacity.
There are a small number of generator uprates during the assessment period, with no addition of nontraditional resources.
SERC methods of data collection do not identify specific uprates or derates throughout the year. Rather, entities reporting
to SERC make changes to unit generation continually throughout the year. These entities also use behind-the-meter
generation for load modification.
Variable generation is limited within the assessment area. However, these renewable resources are assessed for reliable
and economic availability, based on regulatory requirements and the utility's plan for long-term resource flexibility. The
utilities will continue to evaluate these resources within their Integrated Resource Planning (IRP) process. Due to the small
amount of variable resources, no changes to entity planning or operational procedures are needed.
SERC-E imports and exports have been accounted for in the reserve margin calculations, with average annual firm imports
and exports of 972 MW and 1,555 MW, respectively. Most of the contracts are for a 10-year period for the winter- and
summer-peaking seasons and are both internal and external to the reporting area and to the Region. All purchases are
backed by firm contracts for both generation and transmission and are not considered partial path reservations. Very few
imports and exports are associated with Liquidated Damages Contracts (LDCs), in which the contracts are considered 100
143 Load response will be measured by trending Real-time load data from telemetry and statistical models that identify the difference between
actual and projected consumption, absent a curtailment event. 144 North Carolina Renewable Energy and Energy Efficiency Portfolio Standard (REPS).

SERC-E
NERC | 2013 Long-Term Reliability Assessment | December 2013
Page 133
percent “make-whole.” Firm transmission reservations vary in length from two to eight years, with most qualifying for roll-
over rights.
The SERC-E entities do not rely on resources outside the assessment area for emergency imports, reserve sharing, or
outside assistance or external resources in order to meet reserve margins during the assessment period. Most SERC-E
entities participate in Reserve Sharing Agreements (RSAs) with other VACAR utilities. The members of the VACAR RSA hold
1.5 times the largest single contingency (1,135 MW) in the VACAR RSA area to meet Operating Reserve Margin targets for
responding to loss of generation.
To ensure the availability of Expected imports during peak demand, neighboring entities discuss each member’s daily load
forecasts and expected system conditions. Coordination with neighboring assessment areas is done through standard
operating procedures.
Transmission and System Enhancements
The SERC-E entities do not anticipate any long-term transmission constraints or that any current transmission project in-
service dates will be at risk for the assessment period. Construction efforts are focused on facility completion ahead of the
seasonal peaks. The companies monitor construction project status and continually review and confirm completion dates.
Transmission projects that receive the highest priority are those which address a potential System Operating Limit or
Interconnection Reliability Operating Limit. Close coordination between construction management and operations planning
ensures schedule and completion requirements are understood.
To maintain and enhance reliability, Duke Energy Progress is implementing a transmission project in response to NERC’s
recommendation entitled “Consideration of Actual Field Conditions in Determination of Facility Ratings.”145 Duke is using
Light Detection and Ranging (LiDAR) technology to analyze actual field conditions, and the project is scheduled for
completion by the end of 2014.146 The LiDAR technology has been proven accurate and dependable.
The SERC-E utilities have plans to modernize the bulk communication infrastructure, deploy PMUs to be used for events
analysis, and employ strategies such as smart grid Distribution System Demand Response (DSDR) to enhance overall system
reliability.
Long-Term Reliability Issues
The SERC-E utilities report that resource adequacy and operational concerns are primarily associated with fuel interruptions
and water availability during droughts, even though hydro capacity is a small portion of total generating resources. To
address these concerns, water levels are carefully managed. Capacity can be added and hydro reserve margins increased.
These precautions are in place for future droughts, extended outages, or unavailable DR.
The SERC-E entities have incorporated the impact of current and pending environmental regulations during the upcoming
peak seasons into their reliability plans. The EPA MATS regulation is forcing the potential retirement of some generating
units, and studies are underway to plan for the short-term and long-term replacement of needed capacity. Since many
factors influence reliability plans, no specific impact regarding a given environmental regulation can be identified at this
time.
145NERC Recommendation to Industry: Consideration of Actual Field Conditions in Determination of Facility Ratings. 146The NERC recommendation to Transmission Owners and Operators, Generator Owners and Operators, Reliability Coordinators, Transmission
Planner, and Planning Authorities should review the current Facility Ratings Methodology for their solely and jointly owned transmission lines to verify that the methodology used to determine facility ratings is based on actual field conditions.

SERC-N
NERC | 2013 Long-Term Reliability Assessment | December 2013
Page 134
SERC-N SERC‐N is an assessment area covering most of Tennessee, Kentucky, northern Alabama, northeastern Mississippi, and small portions of Georgia, Iowa, Missouri, North Carolina, Oklahoma, and Virginia; this excludes the SERC entities that are in PJM. There are five BAs in SERC‐N: Associated Electric Cooperative, Inc. (AECI), Constellation Energy Control and Dispatch, LLC (CECD), Electric Energy, Inc. (EEI), LG&E and KU Services Company (as agent for Louisville Gas and Electric Company and Kentucky Utilities Company, LG&E/KU), and the Tennessee Valley Authority (TVA). East Kentucky Power Cooperative (EKPC), which was previously reported in SERC-N, joined PJM on June 1, 2013, and will no longer be reported in the SERC-N Assessment Area.
Planning Reserve Margins
SERC-N-Summer 2014 2015 2016 2017 2018 2019 2020 2021 2022 2023
ANTICIPATED 26.75% 24.73% 20.92% 19.64% 17.19% 16.45% 17.83% 16.60% 15.29% 12.49% PROSPECTIVE 30.18% 29.18% 29.84% 28.46% 25.91% 25.07% 26.34% 25.02% 23.62% 22.80% ADJUSTED POTENTIAL 31.61% 31.65% 36.82% 35.36% 35.94% 34.98% 36.13% 34.71% 34.49% 40.12%
NERC REFERENCE - 15.00% 15.00% 15.00% 15.00% 15.00% 15.00% 15.00% 15.00% 15.00% 15.00%
SERC-N-Winter 2014 2015 2016 2017 2018 2019 2020 2021 2022 2023
ANTICIPATED 35.50% 39.78% 36.46% 32.14% 23.53% 23.18% 24.34% 26.42% 31.12% 27.00% PROSPECTIVE 39.92% 44.24% 46.01% 41.39% 32.33% 31.84% 32.88% 35.11% 40.12% 38.15% ADJUSTED POTENTIAL 42.11% 46.44% 53.28% 48.43% 42.62% 41.97% 42.87% 45.27% 52.25% 57.46%
NERC REFERENCE - 15.00% 15.00% 15.00% 15.00% 15.00% 15.00% 15.00% 15.00% 15.00% 15.00% Summer Winter
0%
10%
20%
30%
40%
50%
2014 2015 2016 2017 2018 2019 2020 2021 2022 20230%
10%
20%
30%
40%
50%
60%
2014 2015 2016 2017 2018 2019 2020 2021 2022 2023
Cumulative 10-Year Planned Capacity Change
-6,000-5,000-4,000-3,000-2,000-1,000
01,0002,0003,0004,0005,000
2014 2015 2016 2017 2018 2019 2020 2021 2022 2023
MW
2013 Existing 2023 Planned 2023 Planned & Conceptual
SERC-N Capacity
(MW) Share (%) Capacity
(MW) Share (%) Change
(MW) Capacity
(MW) Share (%) Change
(MW)
Coal
24,317 45.7%
18,627 35.9% -5,690
18,627 33.3% -5,690
Petroleum
51 0.1%
51 0.1% 0
51 0.1% 0
Gas
16,498 31.0%
17,627 34.0% 1,129
20,377 36.4% 3,879
Nuclear
6,687 12.6%
9,487 18.3% 2,800
10,747 19.2% 4,060
Hydro
4,081 7.7%
4,339 8.4% 258
4,339 7.8% 258
Pumped Storage
1,414 2.7%
1,616 3.1% 202
1,616 2.9% 202
Geothermal
0 0.0%
0 0.0% 0
0 0.0% 0
Wind
154 0.3%
154 0.3% 0
154 0.3% 0
Biomass
0 0.0%
0 0.0% 0
0 0.0% 0
Solar
0 0.0%
0 0.0% 0
0 0.0% 0
TOTAL 53,202 100.0% 51,901 100.0% -1,301 55,911 100.0% 2,709

SERC-N
NERC | 2013 Long-Term Reliability Assessment | December 2013
Page 135
BOUNDARY CHANGE
Entergy, CLECO, Lafayette Utilities System, Louisiana Energy and Power Authority, Louisiana Generating LLC, South
Mississippi Electric Power Association, Constellation Energy Control and Dispatch, City of Rushton, City of Osceola, Union
Power Partners, Plum Point Energy Associates, City of West Memphis, City of Benton, City of Conway, and City of North
Little Rock will be integrated into the MISO BA Area and the MISO Market on December 19, 2013. This transition into the
MISO BA Area and MISO Market has the potential to result in significant flow changes, compared to what has historically
been observed and managed on neighboring transmission systems. TVA, AECI, LG&E/KU, Southern Company, Power South,
and SPP signed a temporary coordination agreement with MISO called the Operations Reliability Coordination Agreement
to mitigate reliability impacts from these operational changes and initiate development of a long-term seams agreement
that would alleviate reliability impacts in the long-term. MISO and the impacted entities are implementing the processes
outlined in the agreement in preparation for the integration on December 19.
Demand, Resources, and Planning Reserve Margins
Generation resources are planned to ensure that Planning Reserve Margins are met. Resource plans are reviewed and
revised as needed to achieve these Planning Reserve Margins. Reporting results show that entities are planning for reserves
in the range of 14.5 to 29 percent during the 2014–2023 reporting period.
While system-wide projections of both energy sales and demand continue to indicate lower growth rates, planning analyses
show Energy Efficiency to be a cost-effective option as a part of the long-term supply plan. Adjustments to projected
impacts are made on a semi-annual basis to incorporate ongoing program performance results. At present, the focus on
successful commercial and industrial efforts coupled with short-term budget constraints have produced conservative
projections of energy savings with respect to estimated potential. However, the overall impact is slightly greater than the
previous iteration due to a shift in focus on Energy Efficiency over DR efforts.
The SERC-N entities reported the anticipated retirement of some generating units (1,672 MW) within the next 10 years,
which will impact available capacity. Some unit retirements are directly related to compliance with the EPA’s MATS. In
order to minimize this impact and respond to projected growing demand, SERC-N utilities are adding new, more efficient
generating units (3,000 MW) during the next 10 years, retrofitting older units, and increasing purchased capacity.
All unit outage impacts have been considered in capacity and generation planning for the long-term assessment period,
with no impacts to overall system reliability. As-needed purchases from the short-term markets will also ensure system
reliability.
Firm capacity transactions are about 7.0 percent of the total firm peak capacity for summer 2013, assuming capacity
transactions are the same as capacity transfers in the summer assessment. The majority of the firm capacity transfers are
under contract for the peak season, with less than 0.4 percent of the peak firm capacity expected to be acquired under
short-term contract or from the spot market. During the assessment period, firm capacity transactions average about 8.0
percent of the total firm peak capacity.
Transmission and System Enhancements
TVA has identified the C33–Marshall 161-kV line as a constraint for transfers from Ameren to TVA and from Big Rivers
Electric Corporation (BREC) to Southern Illinois Power Cooperative (SIPC). This line will no longer be a constraint after its
planned upgrade in summer 2014. There are no other long-term transmission constraints identified in the assessment area.
There are several planned transmission projects in the SERC-N assessment area that will increase transfer capability and,
thereby, increase the reliability of the system. AECI is constructing a new West New Madrid 500/345-kV substation. This
station is located on the New Madrid–Dell 500-kV transmission line, approximately a quarter mile from New Madrid.

SERC-N
NERC | 2013 Long-Term Reliability Assessment | December 2013
Page 136
TVA finished a facility study to interconnect two generators with 106 MW summer and 122 MW winter capabilities.
Additionally, TVA identified a need for various upgrades at the interconnection substation and transmission lines of four
generators with 122 MW capacity. The planned completion date for both projects is June 2015 and June 2014.
TVA plans to retire a number of fossil fuel generating units and is conducting studies to evaluate the use of SVCs and FACTS
controllers and the conversion of generators to synchronous condensers to make up for the retired capacity. TVA is also
evaluating HVdc wind import interconnections from the West.
The majority of utilities in SERC-N reported that there are no existing system conditions that require UVLS protection
devices, which protect the system during wide-area, under voltage events. The few existing UVLS schemes cover
approximately 380 MW, and the events that would cause these schemes to operate have a low probability of occurrence.
Utilities in SERC-N continue to evaluate and install new technologies that can be used to improve BES reliability. TVA
continues to install PMUs across the Tennessee Valley and assess various smart grid technologies. TVA continues to install
Geomagnetically Induced Current (GIC) detectors across the Tennessee Valley as part of the EPRI Sunburst program and
work with the Smart Wire Group on a pilot project to install Discrete Series Reactors on transmission lines. TVA is also
working with ORNL, SPX Transformer, and the University of Tennessee at Knoxville to develop a magnetic flow controller.
The SERC-N utilities continue to assess the costs and benefits of various smart grid technologies and implement those which
are economically justifiable and appropriate for each system. Current projects include the:
Development and instrumentation of a CIP and smart grid lab;
Evaluation and integration of low-cost wireless sensors for substations;
Design, evaluation, and integration of field data for asset management support;
Evaluation of the Doble ARMS product for asset management support;
Development of a Telecommunications Infrastructure Management and Monitoring Architecture;
Use of software to improve reactive reserves management for grid operations; and,
Development of a transformer management system using sensor data.
Long-Term Reliability Issues
The EPA MATS regulation will force the retirement of some generating units. The SERC-N entities are conducting studies to
assess the short-term and long-term impact on transmission from the loss of this capacity. Based on the study results, some
changes in seasonal outages and maintenance management may be necessary to maintain BES reliability. Utilities in SERC-N
continue to prepare for compliance with MATS and other pending regulatory requirements by adapting current operating
practices while maintaining reliability.
Utilities in SERC-N have identified three emerging issues that could potentially impact reliability during the assessment
period. Utilities need to control or idle coal units as a consequence of their age, EPA regulations, or economics. Significant
work is required to ensure transmission outage coordination, construction, and acquisition of replacement capacity.
Unexpected consequences might result from new EPA regulations, supply mandates, or technology-related events that
could limit the use of alternate fuels for generation, such as coal, natural gas, or nuclear. New planning standards may
increase the complexity of planning and implementation processes. TVA and other SERC-N utilities are conducting
probability studies to minimize the effect such issues could have on BES reliability.
The SERC-N Region continues to anticipate Planning Reserve Margins above minimum requirements. The Region is actively
assessing and implementing smart grid technologies. The most notable emerging issue is control or idling of coal
generation, which will require significant effort to coordinate transmission work with generation schedules.

SERC-SE
NERC | 2013 Long-Term Reliability Assessment | December 2013
Page 137
SERC-SE SERC‐SE is a summer-peaking Area covering all or portions of four southeastern states (Alabama, Georgia, Mississippi, and Florida). The four BAs in this assessment area are: PowerSouth Energy Cooperative (PowerSouth), South Mississippi Electric Power Association (SMEPA), Southeastern Power Administration (SEPA), and Southern Company Services, Inc. (Southern). SERC-SE serves about 14.2 million customers over approximately 120,000 square miles. There have been no changes to the footprint during the past two years.
Planning Reserve Margins
SERC-SE-Summer 2014 2015 2016 2017 2018 2019 2020 2021 2022 2023
ANTICIPATED 36.76% 28.01% 29.73% 30.48% 29.09% 27.08% 25.47% 23.57% 21.67% 19.78% PROSPECTIVE 40.78% 31.96% 33.61% 34.30% 32.88% 30.81% 29.14% 27.19% 25.24% 23.29% ADJUSTED POTENTIAL 41.03% 32.20% 35.78% 39.80% 38.33% 36.19% 35.08% 33.04% 30.99% 28.96%
NERC REFERENCE - 14.99% 14.99% 14.99% 14.99% 14.99% 14.99% 14.99% 14.99% 14.99% 14.99%
SERC-SE-Winter 2014 2015 2016 2017 2018 2019 2020 2021 2022 2023
ANTICIPATED 49.08% 40.76% 43.07% 44.29% 39.52% 40.19% 38.16% 36.11% 34.07% 32.05% PROSPECTIVE 53.56% 45.18% 47.42% 48.61% 43.77% 44.38% 42.29% 40.18% 38.07% 36.00% ADJUSTED POTENTIAL 53.72% 45.34% 51.41% 54.66% 49.74% 50.26% 48.76% 46.56% 44.36% 42.19%
NERC REFERENCE - 14.99% 14.99% 14.99% 14.99% 14.99% 14.99% 14.99% 14.99% 14.99% 14.99% Summer Winter
0%
10%
20%
30%
40%
50%
2014 2015 2016 2017 2018 2019 2020 2021 2022 2023
0%
10%
20%
30%
40%
50%
60%
2014 2015 2016 2017 2018 2019 2020 2021 2022 2023
Cumulative 10-Year Planned Capacity Change
-4,000
-3,000
-2,000
-1,000
0
1,000
2,000
3,000
2014 2015 2016 2017 2018 2019 2020 2021 2022 2023
MW
2013 Existing 2023 Planned 2023 Planned & Conceptual
SERC-SE Capacity
(MW) Share (%) Capacity
(MW) Share (%) Change
(MW) Capacity
(MW) Share (%) Change
(MW)
Coal
24,620 38.1%
22,074 34.5% -2,546
22,074 33.0% -2,546
Petroleum
1,017 1.6%
893 1.4% -124
893 1.3% -124
Gas
28,091 43.5%
27,737 43.4% -354
30,650 45.8% 2,559
Nuclear
5,818 9.0%
8,018 12.5% 2,200
8,018 12.0% 2,200
Hydro
3,353 5.2%
3,353 5.2% 0
3,353 5.0% 0
Pumped Storage
1,632 2.5%
1,632 2.6% 0
1,632 2.4% 0
Geothermal
0 0.0%
0 0.0% 0
0 0.0% 0
Wind
0 0.0%
0 0.0% 0
0 0.0% 0
Biomass
67 0.1%
194 0.3% 127
248 0.4% 181
Solar
4 0.0%
4 0.0% 0
20 0.0% 16
TOTAL 64,602 100.0% 63,905 100.0% -697 66,888 100.0% 2,286
SERC-SE
NERC | 2013 Long-Term Reliability Assessment | December 2013
Page 138
Demand, Resources, and Planning Reserve Margins
Planning Reserve Margins are anticipated to be adequate due to a slightly decreasing demand forecast related to the
economy. The demand and energy forecasts were developed using low short-term growth scenarios. SERC-SE’s load growth
has not yet returned to its prerecession level. As a result, the Energy Efficiency and DR levels are expected to be slightly
lower than previously stated. There have been no further updates to SERC-SE’s DSM programs since last year’s assessment.
Energy efficiency and conservation is reflected in the load forecast using historical data. The majority of utilities in SERC-SE
consider DSM a load-modifying component. Southern considers nondispatchable (passive) DSM as a load-modifying
component and dispatchable (active) DR as a capacity resource. Since the 2012LTRA, PowerSouth enhanced and expanded
their H2O plus program to reduce demand during peak periods. In July 2012, PowerSouth also added a new Energy
Efficiency program that provides rebates to consumers who purchase high-efficiency heating, cooling, and lighting devices.
PowerSouth is also developing a consumer financing program for residential Energy Efficiency improvements.
Few utilities in SERC-SE have limited variable resources that are evaluated by analyzing historical or projected output
profiles, and no changes have been made to how these values are calculated. About 200 MW of nameplate wind capacity
were added in SERC-SE. Considering the small size of this capacity relative to the whole, no operational procedure changes
are needed.
The SERC-SE utilities report firm imports and exports. These transactions are considered in the SERC-SE reserve margin
calculation. The majority of the contracts are multi-year firm agreements, typically lasting five or more years. All imports
and exports are backed by firm contracts for both generation and transmission. Reporting entities maintain emergency
reserve sharing agreements with organizations such as the SPP Reserve Sharing Group and other entities in the area (~250
MW). Other contract agreements with neighboring utilities provide capacity for outages of specific generation. The entities
did not report their total emergency MW from these imports but that information is available if needed. Overall, entities
are not dependent on outside imports or transfers to meet load.
Transmission and System Enhancements
PowerSouth has installed a new 115-kV capacitor bank at the Gulf Shores substation. Meanwhile, Southern is planning to
install two SVCs during the long-term planning horizon. Since the 2012LTRA, Southern fully deployed smart meters
throughout its territory. These smart meters provide accurate Real-time data, which enhances demand management and
helps isolate grid problems for faster restoration.
Long-Term Reliability Issues
The uncertainty of generating resource availability in 2015 and beyond due to the recent implementation of EPA MATS and
other pending environmental rules presents significant reliability concern. Southern, as a Planning Authority, is working
with LSEs and Generator Operators to assess resource availability and potential unit retirements. Potential additional
transmission enhancements have been identified and will be reassessed during the spring planning cycle for possible
inclusion in 2014 expansion plans. These assessments may also lead to requests associated with MATS implementation
requirements for operating units beyond 2015, as needed to maintain reliability.
A related reliability concern involves the extensive generation and transmission construction work that must be completed
prior to the implementation of MATS in 2015. The RC and Transmission Operators are working with impacted entities to
coordinate construction and outage schedules to maintain reliable operations.
Because the EPA has not yet established a time frame for the implementation of pending compliance requirements, the
future impact upon grid reliability is uncertain. Utilities in SERC-SE will continue to monitor environmental compliance
developments and evaluate their options, including resource replacements and the installation of controls on existing
generation.

SERC-W
NERC | 2013 Long-Term Reliability Assessment | December 2013
Page 139
SERC-W SERC‐W is an assessment area covering portions of four southeastern states (Arkansas, Louisiana, Mississippi, and Texas) and including the SPP RC entities registered in SERC. The eleven registered BAs serve about 5.3 million people across approximately 91,000 square miles.
Planning Reserve Margins
SERC-W-Summer 2014 2015 2016 2017 2018 2019 2020 2021 2022 2023
ANTICIPATED 58.50% 47.96% 46.50% 41.79% 38.37% 35.34% 33.88% 31.09% 28.54% 25.93% PROSPECTIVE 66.56% 55.35% 54.09% 52.42% 50.93% 49.46% 48.08% 46.72% 45.36% 44.09% ADJUSTED POTENTIAL 69.03% 57.62% 56.60% 58.49% 58.98% 59.11% 59.97% 61.43% 61.28% 61.35%
NERC REFERENCE - 14.99% 14.99% 14.99% 14.99% 14.99% 14.99% 14.99% 14.99% 14.99% 14.99%
SERC-W-Winter 2014 2015 2016 2017 2018 2019 2020 2021 2022 2023
ANTICIPATED 81.8% 82.1% 79.9% 74.0% 70.4% 66.5% 63.8% 60.3% 57.3% 54.0% PROSPECTIVE 91.1% 91.3% 89.3% 87.0% 85.7% 83.8% 81.1% 79.3% 77.6% 75.9% ADJUSTED POTENTIAL 93.9% 94.0% 92.3% 94.3% 95.5% 95.5% 95.4% 97.0% 96.6% 96.5%
NERC REFERENCE - 14.99% 14.99% 14.99% 14.99% 14.99% 14.99% 14.99% 14.99% 14.99% 14.99% Summer Winter
0%10%20%30%40%50%60%70%
2014 2015 2016 2017 2018 2019 2020 2021 2022 2023
0%
20%
40%
60%
80%
100%
2014 2015 2016 2017 2018 2019 2020 2021 2022 2023
Cumulative 10-Year Planned Capacity Change
-3500-3000-2500-2000-1500-1000-5000500
-3,500-3,000-2,500-2,000-1,500-1,000
-5000
500
2014 2015 2016 2017 2018 2019 2020 2021 2022 2023
MW
2013 Existing 2023 Planned 2023 Planned & Conceptual
SERC-W Capacity
(MW) Share
(%) Capacity
(MW) Share
(%) Change
(MW) Capacity
(MW) Share
(%) Change
(MW)
Coal
6,290 16.1%
6,290 17.5% 0
6,290 15.4% 0
Petroleum
259 0.7%
254 0.7% -5
254 0.6% -5
Gas
26,820 68.6%
23,704 65.8% -3,116
27,330 66.9% 510
Nuclear
5,392 13.8%
5,392 15.0% 0
5,517 13.5% 125
Hydro
311 0.8%
338 0.9% 27
607 1.5% 296
Pumped Storage
0 0.0%
0 0.0% 0
0 0.0% 0
Geothermal
0 0.0%
0 0.0% 0
0 0.0% 0
Wind
0 0.0%
0 0.0% 0
23 0.1% 23
Biomass
0 0.0%
50 0.1% 50
860 2.1% 860
Solar
0 0.0%
0 0.0% 0
0 0.0% 0
TOTAL 39,073 100.0% 36,029 100.0% -3,044 40,881 100.0% 1,809

SERC-W
NERC | 2013 Long-Term Reliability Assessment | December 2013
Page 140
BOUNDARY CHANGES
Significant footprint changes will be completed by December 2013. In 2014, Entergy will be reported by MISO, and it is
anticipated that several of the remaining entities in SERC-W will also join MISO. The SPP RC is working with Entergy and
MISO for the transition to the MISO RC footprint and for the eventual transition into the MISO BA Area and the MISO
Market. The transition to the MISO RC footprint began in June 2013, and the transition of these entities to the MISO BA and
the MISO Market is expected to occur in December 2013. This transition is expected to result in significant changes in flows,
as compared to what has historically been observed and managed using existing congestion management processes. SPP
and MISO are evaluating ways to mitigate reliability concerns from these operational changes by improving how flows are
accounted for and by reviewing congestion management techniques for potential enhancements. These coordination
activities are expected to ensure the continued reliable operation of the interconnected transmission system.
Demand, Resources, and Planning Reserve Margins
While load growth remains high in a few areas of SERC-W, the overall demand forecast for the Region is down due to the
economy. The exception is found in certain residential and commercial load pockets—such as Louisiana and New Orleans—
where load growth is occurring due to specific industrial and commercial projects. Load growth remains high in the western
portion of Entergy (Texas service area) where residential and commercial load growth is spurred by strong economic
growth. Specific industrial and commercial expansion projects are also driving load growth in the Entergy Gulf States
(Louisiana and New Orleans service areas).
Some utilities in SERC-W have just started implementing Energy Efficiency and conservation programs and may or may not
include Energy Efficiency impacts in the load forecast, as would those entities with regulator-approved programs in place
and operating. The load forecast also reflects Energy Efficiency and conservation created by evolving efficiency codes and
standards. The load forecast incorporates Energy Efficiency by making an adjustment to the sales forecast prior to the
development of the final forecast. , At the SERC-W utilities that use it, DR consists primarily of commercial and industrial
load on interruptible rates. DR is considered a LMR that differentiates between total and firm load requirements. Long-term
annual growth in DR is expected to be around 0.8 percent, in line with industrial customer demand growth. Utility-
administered Energy Efficiency programs are expected to continue at current levels.
Some of the generating units in SERC-W may be deactivated during the next 10 years, based on factors such as current
operating role, unit age and condition, historical and projected investment, and projected cost. Deactivation assumptions,
used in the planning process, are not actual decisions regarding the future investment in resources. Unit-specific portfolio
decisions (e.g., sustainability investments, environmental compliance investments, or unit retirements and betterments)
are based on economic and technical evaluations that consider such factors as projected forward costs, anticipated
operating roles, and the cost of supply alternatives. As a result of these dynamic factors, future decisions may differ from
current planning assumptions as greater certainty is gained regarding legislative, regulatory, or economic requirements. The
alternatives available to address these needs include: (1) future investments in units to keep them operational beyond
assumed deactivation dates; (2) incremental long-term resource additions, such as self-supply alternatives, acquisitions, or
Power Purchase Agreement (PPAs) (including contract extensions); (3) limited-term power purchase agreements; and (4)
Demand-Side initiatives.
Peak imports and exports for SERC-W have been considered in the reserve margin calculations for the reporting area. Most
of these contracts are 10-year agreements for the winter- and summer-peaking seasons. All imports and exports in SERC-W
are firm agreements for both generation and transmission that range from one to 20 years. The SERC-W entities, most of
which are members of the SPP Reserve Sharing Group, are dependent on certain imports, transfers, or contracts to meet
load. Group participants within SPP generally transfer reserves into the SERC-W Area to supply generation or replace the
largest generation contingency. These reserves are not relied on in the resource adequacy assessment or for capacity or
Planning Reserve Margins. System operators generally coordinate reserve scheduling and transmission.

SERC-W
NERC | 2013 Long-Term Reliability Assessment | December 2013
Page 141
Neighboring balancing areas have interchange agreements to ensure needed imports are available during critical peak
events. Under these agreements, both Real-time and day-ahead personnel are in place to coordinate imports as necessary.
From a transmission perspective, Entergy coordinates with neighboring areas to ensure that adequate transfer capabilities
will be available for the upcoming season’s Expected imports.147
Transmission and System Enhancements
Currently, utilities in SERC-W do not expect any significant transmission facility outages that would impact BES reliability. A
three-phase project is currently underway to construct a new 230-kV transmission line and install a new 230/115-kV
autotransformer in lower Plaquemines Parish of southeastern Louisiana. The project will provide an additional transmission
source to help support the underlying area’s load during a single-contingency event. Loss of a single 115-kV transmission
element could result in a long radial configuration causing low voltages and elements exceeding their thermal capability.
Without this improvement, and due to the radial configuration during the contingency, local nonconsequential load loss in
the extreme southeastern Louisiana area is required in order to eliminate any thermal and voltage violations. Phases 1 and
2 of this project have been successfully completed. However, routing issues and landowner opposition are expected to
delay the final phase of the project into the second quarter of 2014 or beyond. There is also a single Extra High Voltage
(EHV) connection on the western end with a neighboring system that provides some limited support, but can be
constrained by autotransformer and underlying 138-kV transmission circuit limitations. Another project is underway to
install additional transformer capacity at the EHV source and construct a new 230-kV transmission line from the western
EHV source down to the primary load center in the western area. This project is scheduled for completion in 2016 and will
address both future reliability needs and congestion issues.
Entergy is constructing a project that interconnects a new generator in the Amite South region of southern Louisiana.
Utilities in SERC-W have no plans to install additional UVLS schemes, SPSs, or Remedial Action Schemes (RASs). However,
Entergy is planning on modifying its existing UVLS scheme in the western area of Texas to replace its existing SCADA-based
scheme with a microprocessor relay-based scheme to help improve the efficiency and reliability of the existing UVLS.
Entergy has adopted an automated critical clearing time methodology by using POM-TS software that automatically
generates the critical clearing times for generating units. This will help analyze stability limits on the system under planning
and operational conditions and determine the stability margin on the system. In addition, Entergy is using optimal power
flow (OPF) for reactive power planning and management, which helps to assess the reactive power needs of the system.
Entergy is also planning to deploy a total of 41 phasor measurement units (PMUs) to monitor abnormal system conditions
and disturbances. The data obtained from the PMUs is then used in model validation and investigating corrective actions.
Louisiana Generating, LLC is systematically upgrading communications with relay devices. This will assist in quickly
evaluating events and system restoration.
Long-Term Reliability Issues
Utilities in SERC-W report that resource adequacy and operational concerns are mainly associated with water levels and
extended generating unit outages. Scenario assessments for weather and hydro flows have been incorporated into reserve
margin studies. Current operational plans mitigate the impact of drought in 2015 and beyond.
Mitigation plans also include availability and responsiveness of DR programs. For extended generating unit outages,
securing a short-term capability will not have an impact on resource adequacy.
The EPA MATS regulation will have an impact on retirement or retrofitting of some generating units. Outages for planned
maintenance and retrofits are carefully coordinated well in advance and—according to current timelines—will not result in
reliability concerns within the SERC-W Assessment Area.
147 Coordination is executed via participation in intra-regional (SERC Near-term Study Group [NTSG] and SERC Long-term Study Group [LTSG]) and
inter-regional (ERAG MRSWS) working groups and coordination studies for the near-term and long-term capacity and resource impacts.

NERC | 2013 Long-Term Reliability Assessment | December 2013
Page 142
SPP The Southwest Power Pool (SPP) Assessment Area is a NERC RE that covers 370,000 square miles and encompasses all or part of Arkansas, Kansas, Louisiana, Mississippi, Missouri, New Mexico, Oklahoma, and Texas. The SPP RE reporting footprint includes the MRO entity members that are part of the SPP Planning Coordinator, which consists of the Nebraska entities. SPP’s footprint consists of 20 BA Areas including 48,368 miles of transmission lines, 915 generating plants, and 2,481 substations.
Planning Reserve Margins
SPP-Summer 2014 2015 2016 2017 2018 2019 2020 2021 2022 2023
ANTICIPATED 35.71% 34.67% 32.68% 31.08% 29.49% 27.15% 26.66% 26.72% 27.14% 28.64% PROSPECTIVE 35.67% 34.62% 32.62% 31.03% 29.43% 27.08% 26.59% 26.65% 27.06% 28.56% ADJUSTED POTENTIAL 35.72% 34.78% 32.82% 31.28% 29.68% 27.33% 26.94% 27.02% 27.43% 28.93%
NERC REFERENCE - 13.60% 13.60% 13.60% 13.60% 13.60% 13.60% 13.60% 13.60% 13.60% 13.60%
SPP-Winter 2014 2015 2016 2017 2018 2019 2020 2021 2022 2023
ANTICIPATED 80.46% 79.00% 75.95% 73.77% 71.81% 68.66% 68.36% 69.61% 70.51% 72.93% PROSPECTIVE 80.95% 79.48% 76.41% 74.22% 72.44% 69.28% 68.97% 70.22% 71.10% 73.52% ADJUSTED POTENTIAL 81.55% 80.07% 77.00% 74.79% 73.21% 70.03% 71.00% 72.60% 73.48% 75.89%
NERC REFERENCE - 15.00% 15.00% 15.00% 15.00% 15.00% 15.00% 15.00% 15.00% 15.00% 15.00% Summer Winter
0%5%
10%15%20%25%30%35%
2014 2015 2016 2017 2018 2019 2020 2021 2022 20230%
20%
40%
60%
80%
100%
2014 2015 2016 2017 2018 2019 2020 2021 2022 2023
Cumulative 10-Year Planned Capacity Change
-2000
200400600800
1,0001,2001,4001,6001,8002,000
2014 2015 2016 2017 2018 2019 2020 2021 2022 2023
MW
2013 Existing 2023 Planned 2023 Planned & Conceptual
SPP Capacity
(MW) Share (%) Capacity
(MW) Share (%) Change
(MW) Capacity
(MW) Share (%) Change
(MW)
Coal
30,026 41.3%
29,969 40.2% -57
29,969 39.1% -57
Petroleum
1,345 1.8%
1,336 1.8% -8
1,336 1.7% -8
Gas
35,046 48.2%
36,626 49.2% 1,580
38,461 50.2% 3,415
Nuclear
2,755 3.8%
2,906 3.9% 151
2,906 3.8% 151
Hydro
1,762 2.4%
1,686 2.3% -76
1,686 2.2% -76
Pumped Storage
0 0.0%
0 0.0% 0
0 0.0% 0
Geothermal
0 0.0%
0 0.0% 0
0 0.0% 0
Wind
1,698 2.3%
1,922 2.6% 224
2,252 2.9% 554
Biomass
26 0.0%
32 0.0% 5
32 0.0% 5
Solar
35 0.0%
36 0.0% 1
36 0.0% 1
TOTAL 72,693 100.0% 74,514 100.0% 1,821 76,678 100.0% 3,985
NERC | 2013 Long-Term Reliability Assessment | December 2013
Page 143
BOUNDARY CHANGE
The SPP RC is coordinating with Entergy, CLECO, Lafayette Utilities System, Louisiana Energy and Power Authority, and
MISO for the transition of those entities to the MISO RC footprint and eventually into the MISO BA Area and the MISO
Market. This transition began in June 2013 and will conclude in December 2013. This transition into the MISO Market and
MISO BA is expected to result in significant changes in flows as compared to what has historically been observed and
managed using existing congestion management processes. SPP and MISO are evaluating ways to mitigate reliability
concerns from these operational changes by improving how flows are accounted for and reviewing congestion
management techniques for potential enhancements. These additional coordination activities are expected to continue to
ensure the reliable operation of the interconnected transmission system.
Demand, Resources, and Planning Reserve Margins
The SPP Assessment Area’s target reserve margin is 13.6 percent, which has not changed since the 2012LTRA.148 The
assessment area is projecting adequate Planning Reserve Margins above the SPP target (NERC Reference Margin Level)
throughout the assessment period. 149 Due to the modest 10-year projections for annual demand growth, the existing and
planned generation in the SPP footprint will provide sufficient Planning Reserve Margins each year of the assessment
period.
SPP RE is showing a decrease in Total Internal Demand from 2012 to 2013. This decrease in Total Internal Demand is
primarily due to a methodology change in SPP RE forecasting. Beginning with the 2012–2013 winter assessment, SPP RE
reported a coincident peak demand forecast based on the Model Development Working Group (MDWG) modeling data
submitted by individual entities. Previously, SPP RE reported a noncoincident Total Internal Demand forecast based on
aggregated member data. SPP RE will continue to use the MDWG model for future demand forecasts. The High-Priority
Incremental Load Study, which began in April 2013, indicates that the SPP Assessment Area is experiencing an increase in oil
and gas drilling that is causing substantial load growth in northern Oklahoma, southwestern Kansas, Texas, and New
Mexico.
Continued annual growth in Energy Efficiency and conservation and DR programs is expected through 2023; however, the
overall impact of these programs is relatively small. DR programs in the SPP RE footprint are voluntary and are primarily
targeted for summer peak load reduction use. For the most part, SPP RE members include their own DR and Energy
Efficiency programs as reductions in their load forecasts. The utilization of DR resources is not vital to meeting the energy
and capacity obligations of the SPP Region.
Since 2009, three voluntary customer DR programs have been implemented in the SPP footprint. Westar Energy launched a
program in 2009 for residential and small to mid-size commercial customers. The program has more than 32,000 customers
enrolled and a load reduction capacity of 27 MW. By the end of 2015, Westar anticipates the enrollment of 90,000
participants and a potential load reduction capability of 90 MW. In 2010, Oklahoma Gas & Electric began a program that
installed 40,000 residential-customer smart meters and provides up to 84 MW of DR during peak hours. The newest
program, Kansas City Board of Public Utilities’ residential customer thermostat program, will provide a demand reduction of
approximately 3 MW, with 3,500 subscribers expected by the end of 2013.
SPP RE does not expect to have any reliability issues because of the modest amount (approximately 400 MW) of projected
retirements. With new generation projected to come into service during the assessment period, there are no operational or
planning concerns at this time. There have been no project cancellations. While some derates were reported from the
previous year’s assessment, they were not material.
148 SPP’s target Reserve Margin of 13.6 percent also serves as NERC’s Reference Reserve Margin. 149 In 2010, NERC created a Reliability Assessment Procedure that realigned the reporting areas for the REs. Beginning in 2011, SPP RE assumed
the reporting responsibilities of the Nebraska entities (NPPD, OPPD, and LES) that are part of the SPP Planning Coordinator. The realignment of footprints increased the demand forecast for the SPP RE footprint.

NERC | 2013 Long-Term Reliability Assessment | December 2013
Page 144
SPP RE relies on members to provide the information needed to model all load and generation, including any changes to
generation ratings and long-term outage plans. SPP RE does not designate units for seasonal availability or have specific
criterion to address behind-the-meter generation, although individual entities may net the generation from their load.
The expected on-peak capacity values for variable generation are determined by historical performance guidelines.150 The
net capability for wind is determined on a monthly basis, and there are eight steps that outline the process for establishing
net capability. Wind facilities that have been in commercial operation for three years or less must include the most recently
available data. If MW values are not available, estimates based on wind data correlated with reference towers outside a 50-
mile radius of the facility’s location must be approved by the SPP RTO Generation Working Group (GWG).
The net capability for solar resources is also determined on a monthly basis via the same eight-step process applicable to
wind resources. Solar data that is correlated beyond 200 miles of the reference measuring device must also be approved by
SPP RTO GWG. 151
SPP RTO evaluates operational procedures on an ongoing basis to determine if any improvements can be made for
efficiency and reliability. Because of the level of wind resources in the footprint, SPP RTO is investigating the addition of
wind into its automatic, security-constrained dispatch calculations. This would allow SPP RTO to better manage local
congestion issues in which wind is the primary impacting resource. It is anticipated that SPP RTO would then be able to
better manage system reliability by using quicker and more effective control actions.
For 2014, SPP RE members report 3,184 MW of firm imports, 25 MW of Expected imports, 2,252 MW of firm exports, and
49 MW of Expected exports. For the assessment period, 2014 has the highest reported number of imports and exports. All
of these capacity transactions have firm transmission service contracts with terms between three to 10 years. On-Peak
capacity transactions do not have a significant impact on operational reliability due to the volume of internal generation
capacity available within the SPP Assessment Area.
SPP RE members, along with some members of the SERC Region, jointly participate in a Reserve Sharing Group. Group
members receive contingency reserve assistance from each other and do not require support from generation resources
outside the SPP RE Region.152 The SPP RE’s Operating Reliability Working Group sets the Reserve Sharing Group’s Minimum
Daily Contingency Reserve Requirement. The Reserve Sharing Group maintains a minimum first Contingency Reserve equal
to the generating capacity of the largest unit scheduled to be on-line plus 50 percent of the capacity of the next largest
generating unit scheduled to be on-line. SPP sets aside the Transmission Reserve Margin (TRM) to allow for loss of the most
impacting generation on each flowgate. This ensures that reserve assistance among members is viable.
Transmission and System Enhancements
SPP RE has identified several transmission reliability upgrades. The following list, which is arranged by state (although some
projects may cross state lines), shows a description, location, and in-service date for these identified upgrades.
ARKANSAS
18 miles of 345-kV transmission line from Flint Creek to Shipe Road in northwestern Arkansas in 2014
55 miles of 345-kV transmission line from Shipe Road to Osage Creek (passing near East Rogers) in northwestern
Arkansas in 2015
150 SPP Criteria - Section 12.0. 151 Facilities that have been in commercial operation for four years or more must include a minimum of four years or up to 10 years of the most recent commercial operation data available, whichever is greater. Metered hourly net power output (MWh) data may be used. After three years of commercial operations, if the Load-Serving Member does not perform or provide the net capability calculations to SPP, then the net capability for the resource will be 0 MW. Net capability calculations are to be updated at least once every three years. 152 While the RSG does have generation-owning members outside the SPP footprint, that generation is not expected to provide support into SPP
except for intra-hour contingency events.

NERC | 2013 Long-Term Reliability Assessment | December 2013
Page 145
KANSAS
114 miles double-circuit, 345-kV transmission line from Spearville to Clark County to Thistle in southwestern
Kansas in 2014
78 miles double-circuit, 345-kV transmission line from Thistle to Wichita in southern Kansas in 2014
58 miles of 345-kV transmission line from Elm Creek to Summit in northern central Kansas in 2016
OKLAHOMA
100 miles of 345-kV transmission line from Seminole to Muskogee in central Oklahoma in 2013
122 miles of double-circuit, 345-kV transmission line from Hitchland to Woodward District EHV in northwestern
Oklahoma in 2014
107 miles of double-circuit, 345-kV transmission line from Thistle to Woodward District EHV in northwest
Oklahoma and southwest Kansas in 2014
76 miles of 345-kV transmission line from northwestern Texarkana to Valliant in southeastern Oklahoma in 2015
93 miles of 345-kV transmission line from Elk City to Gracemont in western Oklahoma in 2018
5 miles of 345-kV transmission line from Arcadia to Redbud in central Oklahoma in 2019
126 miles of 345-kV transmission line from Woodward District EHV to Tatonga to Mathewson to Cimarron in
northwestern Oklahoma in 2021
MISSOURI
30 miles of 345-kV transmission line from Iatan to Nashua in northwestern Missouri in 2015
181 miles of 345-kV transmission line from Sibley to Mullin’s Creek to Nebraska City in northwestern Missouri and
southeastern Nebraska in 2017
NEBRASKA
40 miles of 345-kV transmission line from Neligh to Hoskins in north-central Nebraska in 2016
222 miles of 345-kV transmission line from Gentleman to Cherry County to Holt County in northwestern Nebraska
in 2018
TEXAS
305 miles of 345-kV transmission line from Woodward District EHV in western Oklahoma to Tuco in the Texas
Panhandle in 2014
The most congested flowgates and areas in the SPP Region are identified on a monthly basis. Some of these congested
flowgates are considered long-term transmission constraints. SPP has identified several long-term constraints in two areas
and proposed transmission solutions to help alleviate them.
In the Texas Panhandle, the interface monitoring the Southwest Public Service North–South lines and the flowgate
monitoring Osage–Canyon East 115-kV for the loss of the Deaf Smith–Bushland 230-kV are expected to be relieved with the
installation of the new 305-mile Tuco–Woodward 345-kV line in spring 2014. In spring 2015, the same flowgate monitoring
Osage–Canyon East 115-kV is also expected to be relieved with the installation of the new Castro County–Newhart 115-kV
line. Another constraint in the Texas Panhandle is the flowgate monitoring the Grapevine 230/115-kV transformer for the
loss of Elk City–Sweetwater 230-kV line, which is expected to be alleviated by installation of 38-mile Bowers–Howard 115-
kV line in late 2014.
In June 2015, a top long-term constraint in the Kansas City area (i.e., the flowgate monitoring Pentagon–Mund 115-kV for
the loss of 87th Street–Craig 345-kV line) is expected to be alleviated by installation of a new 31-mile Iatan–Nashua 345-kV
line.

NERC | 2013 Long-Term Reliability Assessment | December 2013
Page 146
For the purpose of improving reliability, there are several significant transmission projects involving upgrades to existing
transmission lines. In north-central Oklahoma, 41 miles of 69-kV line will be converted to 138-kV from Cottonwood to
Crescent and from Cashion to Dover. In western Oklahoma, 44 miles of 69-kV line from Anadarko to Franklin will be
converted to 138-kV. In southwestern Oklahoma, the 33-mile, Lindsay Flood Tap–Cornville 69-kV line will be converted to
138-kV. In central Oklahoma, 32 miles of 69-kV line will be converted to 138-kV in the Cushing area.
In Kansas, there will be a 48-mile rebuild of a 115-kV line from St. John to Medicine Lodge and 32 miles of 138-kV line from
Medicine Lodge to Harper in south-central Kansas in the first five years of the assessment period. During the last five years
of the assessment period, Kansas entities plan to rebuild the 34-mile, Harper–Clearwater 138-kV line in this same area.
Kansas entities also plan to rebuild 41 miles of 115-kV line from Chapman–Abilene Energy Center to North Street in north-
central Kansas.
In the Texas Panhandle, a 45-mile, 69-kV line will be converted to 115-kV during the first five years of the assessment. In
east Texas during the same time period, 44 miles of 69-kV line will be converted to 138-kV. During the last five years of the
assessment period, these lines and an additional 35-mile line to Dallam are planned for conversion to 230-kV.
The following are considered to be interregional, interconnection-related projects:
STEGALL PROJECT
Add a 345/115-kV transformer at Basin Electric’s Stegall substation and build a 22-mile, 115-kV line from Stegall to Scotts
Bluff. This project will address low voltage at Victory Hill in southwestern Nebraska due to the loss of the Stegall 345/230-kV
transformer. This project is expected to be in-service in 2015.
MESSICK PROJECT
Add a new 500/230-kV transformer and substation at Messick. The transformer will tie together Entergy and Cleco’s
systems. The project addresses the overloads of the SWEPCO International Paper–Wallace and International Paper–
Mansfield 138-kV lines due to the loss of the Dolet Hills–Shreveport 345-kV. This project is expected to be in-service in
2015.
SHIPE ROAD–EAST ROGERS–KINGS RIVER PROJECT
This multi-stage project includes a new 345-kV line in northwestern Arkansas that will connect to the underlying 161-kV
system. The Kings River 161-kV termination to the existing system involves interconnecting to Entergy’s system. This project
is needed to address overloads on the 161-kV system in northwestern Arkansas due to the loss of the Flint Creek–Brookline
345-kV. This project is expected to be in-service in 2016.
GENTLEMAN–CHERRY COUNTY–HOLT PROJECT
This is a 345-kV, multi-line project running through a large portion of central Nebraska. The Cherry County–Holt 345-kV line
segment is proposed to interconnect with a Western Area Power Administration (WAPA) 345-kV line. This project is driven
by reliability and economic needs and the need to meet renewable policies in Nebraska and other areas in the SPP
footprint. This project is expected to be in-service in 2018.
SPP identified several reliability projects that were delayed but are expected to be in-service during the assessment period.
Mitigation plans and operator actions have been put into place to alleviate any reliability concerns.
In September 2012, the Centennial Wind Farm SPS was approved, eliminating the need to curtail the existing wind farms in
northwestern Oklahoma under the Category B contingency for the loss of either the Woodward District EHV or the loss of
Tatonga–Northwest 345-kV line. This SPS is scheduled for removal once the expansion to the Woodward District EHV
substation is completed in 2014. The plans are to expand the Woodward District EHV substation to a breaker and a half
scheme, install a second 345/138-kV transformer, and construct new 345-kV lines out of this substation that will facilitate
the operation of all wind farms presently connected to the system. These new 345-kV lines will connect to Hitchland, Tuco,
and Thistle.

NERC | 2013 Long-Term Reliability Assessment | December 2013
Page 147
In September 2011, the Ensign Wind Farm SPS was approved. The SPS was designed to detect an overload on the MKEC
Station–Cudahay 115-kV line that would then trip generation from the Ensign Wind Farm and alleviate the overload. This
SPS is scheduled to be removed in 2014. The construction of a second North Judson Large–Spearville line will eliminate the
single contingency exposure to overloading the MKEC Station–Cudahay line and make it possible to retire the SPS.
SPP RTO expects to implement its Day 2 market (i.e., Integrated Marketplace) for its RTO footprint on March 1, 2014. This
market will centralize unit commitment across 16 BA Areas and consolidate operations into a single BA—known as the SPP
RTO Consolidated BA. SPP RTO will provide a five‐minute, security‐constrained economic dispatch in order to provide
Real‐time balancing activities, while also providing centralized commitment of resources through the end of the operating
horizon. This structure will better allow SPP RTO to manage the variability of load and resources and provide additional
flexibility in dealing with short‐term reliability issues.
SPP RTO is also investigating centralizing the data gathering from several PMU systems within the footprint to enhance
reliability analysis and situational awareness. At this time, SPP RTO is in the early stages of investigating appropriate smart
grid programs.
Long-Term Reliability Issues
Current drought conditions in the western portion of the SPP RE Area are projected to continue into the assessment period.
As most of the SPP RE heavily water dependent resources are located in the eastern half of the footprint, is not expected to
experience significant drought conditions, this area is less affected by droughts.
SPP’s increase in installed variable generation, which is composed almost entirely of wind generation, will continue to cause
operational challenges. These challenges arise because local area transmission congestion can occur as transmission
projects are constructed and interconnected prior to completion of the planned transmission upgrades. In addition, SPP’s
reliability-focused studies are based on deterministic criteria and do not necessarily capture wind generation outlet
constraints given limited power flow models and current assumptions about reduced wind output. The SPP RTO
Consolidated BA will provide balancing benefits for the widespread installed wind generation. Impending unit retirements
are not expected to impact reliability outside of the local area. SPP RE has sufficient capacity and is expected to continue to
be sufficient despite resource retirements.
SPP’s Operational Planning group performs bi-annual system planning studies in order to capture potential reliability
impacts of retirements and retrofits. Analysis results that reveal reliability concerns are then passed to the SPP RTO long-
term planning group. This study process consists of the creation of weekly snapshots—through the next four years—that
take into account load forecasts, known transmission, and known generation outages. Local issues are reported to the SPP
Transmission Operators involved. Since SPP RE has sufficient capacity, the impacts of long-term maintenance outages are
expected to be more economic in nature. Based on the results of studies up to this point, it is expected that there will be
adequate time to perform necessary generator retrofits. These retrofits are expected to impact the economics of
generation supply more than the ability to reliably serve load across the Region. Local issues may require uneconomic
generation to be designated “must run” during long-term outages, but reliability is expected to be maintained.
Due to oil and natural gas drilling, parts of Texas, Oklahoma, Kansas, and New Mexico are experiencing substantial load
growth on the transmission system. From a transmission perspective, these loads are difficult to plan for because drilling
facilities can be quickly established, causing an unplanned increase in demand. This leaves very little time to complete
transmission projects to serve the pump loads when needed. Economic, regulatory, and geological issues can affect where,
when, and for how long new wells will be installed and operated. SPP and TOs rely on communication with entities adding
load to the transmission system to project where and to what extent this load growth will occur in the future. SPP is
enhancing applicable planning processes in order to plan transmission projects to support these loads.
Most of the EHV transmission system across North American and the SPP Region was constructed in the 30-year period
between 1950 and 1980, with little or no consideration to broader regional, interregional, or national needs. Because of
NERC | 2013 Long-Term Reliability Assessment | December 2013
Page 148
SPP’s geographic location in the Eastern Interconnection and ties with the Western Interconnection and ERCOT, SPP is
uniquely situated to play a key role in the strategic processes necessary to identify critical corridors via rightsizing key lines
during rebuilds, reconfiguring grid topology, and potential converting select lines from ac to dc operation to manage
congestion and improve overall grid efficiency across North America. Assessment and evaluation of this issue has just
begun; therefore, the 2013LTRA reference case does not consider the potential impacts of aging infrastructure replacement
and corridor planning in the SPP Region.
As noted in 2012LTRA, several HVdc lines are being planned to traverse the SPP Region. On April 9, 2013, FERC approved an
interconnection agreement between Tres Amigas, LLC and Southwestern Public Service Co. with SPP as a signatory. Phase I
of the Tres Amigas project is expected to consist of a 750-MW, two-node intertie between the Western and Eastern
Interconnections. Construction will include the expansion of Southwestern Public Service Co.’s Eddy County substation and
a 73-mile, 345-kV line. The project is planned to be operational in the summer of 2016.153
A Clean Line Energy project, the Plain–Eastern line, is a 3,500-MW capacity, 700-mile HVdc facility that will begin in western
Oklahoma and end in western Tennessee. 154 A second Clean Line Energy project, the Grain Belt Express Line,155 will consist
of an approximately 700-mile HVdc transmission line that will begin in western Kansas and extend eastward through
Missouri. Both of the Clean Line Energy projects remain in the planning stages.
As these projects move closer to construction and commercial operation, SPP may be faced with a large number of
transmission requests. SPP may not be able to approve all of the requests until additional transmission facilities are built.
However, SPP’s current processes should prevent any reliability impacts to the BES. The 2013LTRA reference case does not
consider the commercial realization of these projects.
SPP’s planning processes have identified a number of transmission projects needed for reliability purposes, and it is
expected that those projects will be completed as scheduled or mitigation plans will be developed. The most significant
transmission challenges facing portions of the SPP footprint are related to an increase in oil and gas drilling. New oil and gas
drilling facilities are built faster than they can be captured in SPP’s planning processes and models. SPP also continues to
have an influx of variable generation resources, leading to operational challenges. However, SPP is enhancing planning
processes to better capture the impacts of the oil and gas projects and variable generation. Given the Region’s generation
capacity, transmission infrastructure, and enhancements being made to processes and models, SPP is expected to be able
to meet any challenges—including environmental regulations—that may arise during the next decade.
153 Tres Amigas LLC. 154 Plains & Eastern Clean Line. 155 Grain Belt Express Clean Line.

TRE-ERCOT
NERC | 2013 Long-Term Reliability Assessment | December 2013
Page 149
TRE-ERCOT The Electric Reliability Council of Texas (ERCOT) is the Independent System Operator (ISO) for the ERCOT Interconnection and is located entirely in the state of Texas and operates as a single BA. ERCOT is a summer-peaking Region that is responsible for about 85 percent of the electric load in Texas and serves 23 million customers. The Texas Reliability Entity (Texas RE) is responsible for the RE functions described in the Energy Policy Act of 2005 for the ERCOT Region.
Planning Reserve Margins TRE-ERCOT-Summer 2014 2015 2016 2017 2018 2019 2020 2021 2022 2023
ANTICIPATED 13.74% 11.59% 10.34% 10.46% 9.34% 7.36% 6.44% 5.91% 5.11% 4.43% PROSPECTIVE 13.74% 11.59% 10.34% 10.46% 9.34% 7.36% 6.44% 5.91% 5.11% 4.43% ADJUSTED POTENTIAL 14.58% 12.71% 12.53% 12.71% 11.75% 9.98% 9.04% 8.49% 7.67% 6.97%
NERC REFERENCE - 13.75% 13.75% 13.75% 13.75% 13.75% 13.75% 13.75% 13.75% 13.75% 13.75%
TRE-ERCOT-Winter 2014 2015 2016 2017 2018 2019 2020 2021 2022 2023
ANTICIPATED 47.60% 44.33% 45.44% 43.76% 41.29% 40.42% 39.76% 38.60% 37.65% 36.81% PROSPECTIVE 47.60% 44.33% 45.44% 43.76% 41.29% 40.42% 39.76% 38.60% 37.65% 36.81% ADJUSTED POTENTIAL 48.73% 45.95% 48.26% 46.58% 44.31% 43.72% 43.03% 41.85% 40.87% 40.01%
NERC REFERENCE - 13.75% 13.75% 13.75% 13.75% 13.75% 13.75% 13.75% 13.75% 13.75% 13.75% Summer Winter
0%
3%
6%
9%
12%
15%
2014 2015 2016 2017 2018 2019 2020 2021 2022 2023
0%
10%
20%
30%
40%
50%
2014 2015 2016 2017 2018 2019 2020 2021 2022 2023
Cumulative 10-Year Planned Capacity Change
-1,000
0
1,000
2,000
3,000
4,000
5,000
2014 2015 2016 2017 2018 2019 2020 2021 2022 2023
MW
2013 Existing 2023 Planned 2023 Planned & Conceptual
TRE-ERCOT Capacity
(MW) Share (%) Capacity
(MW) Share (%) Change
(MW) Capacity
(MW) Share (%) Change
(MW)
Coal
17,806 24.5%
17,196 22.3% -610
18,046 20.8% 240
Petroleum
0 0.0%
0 0.0% 0
0 0.0% 0
Gas
48,089 66.1%
52,741 68.3% 4,652
59,891 68.9% 11,802
Nuclear
5,150 7.1%
5,150 6.7% 0
5,150 5.9% 0
Hydro
479 0.7%
479 0.6% 0
479 0.6% 0
Pumped Storage
0 0.0%
0 0.0% 0
0 0.0% 0
Geothermal
0 0.0%
0 0.0% 0
0 0.0% 0
Wind
918 1.3%
1,318 1.7% 399
2,472 2.8% 1,553
Biomass
211 0.3%
211 0.3% 0
211 0.2% 0
Solar
74 0.1%
124 0.2% 50
637 0.7% 564
TOTAL 72,727 100.0% 77,219 100.0% 4,491 86,886 100.0% 14,159

TRE-ERCOT
NERC | 2013 Long-Term Reliability Assessment | December 2013
Page 150
Demand, Resources, and Planning Reserve Margins
The ERCOT target reserve margin, adopted as the NERC Reference Margin Level, is 13.75 percent and is based on the loss-
of-load probability (LOLP) study that was completed in 2010. ERCOT’s target reserve margin has not changed since the
release of the 2012 long-term assessment. ERCOT stakeholders are reviewing an updated reserve margin value based on
the 2012 LOLP study156, and a decision by the ERCOT Board on the final value is expected by the end of 2013.157
The Anticipated Reserve Margin falls below the ERCOT Target Reserve Margin beginning in summer 2014. The depleting
Reserve Margin in ERCOT is due to generation resource additions not having kept pace with the higher than normal load
growth experienced in recent years. The generation market in ERCOT is unregulated and generators make resource
decisions based on market dynamics. Generation investors state that a combination of lack of long-term contracting with
buyers, low market heat rates, and low gas prices are hindering decisions to build new generation. For its part, the PUCT
and ERCOT are working through to study, and facilitate revisions to, market protocols and pricing rules to bolster the
reserve margin. To incent new generator construction, improvements such as increases in system-wide Energy Offer caps,
rising of Energy Offer floors, and adjustments to Emergency Response Service to include distributed generator participation,
are among the results so far. Several proposed initiatives focus on DR resources, such as revising market rules to stimulate
greater participation of weather-sensitive loads in the Emergency Response Service program. The PUCT has directed ERCOT
to draft rules for incorporation of an interim energy market funding solution called the Operating Reserve Demand Curve
(ORDC). The PUCT will continue efforts regarding possible setting of a mandated reserve margin level in the ERCOT region.
ERCOT expects tight reserves throughout the 10 year outlook. Based on current information regarding resource availability
and anticipated demand levels, there is a significant chance that ERCOT will need to declare an Energy Emergency Alert
(EEA) during a number of the future years and issue corresponding public appeals for conservation. The ERCOT system
would likely have insufficient resources available to serve customer demand, if a higher‐than‐normal number of forced
generation outages occur during a period of high demand or if record‐breaking weather conditions similar to the summer of
2011 lead to even higher‐than-expected peak demands. In these scenarios, the EEA declarations may be followed by a need
to institute rotating outages to maintain the integrity of the system as a whole.
Total Internal Demand (TID) and Net Internal Demand (NID) are forecasted to grow at a compounded annual rate of 1.38
percent during the assessment period. This forecast is lower than the compounded growth rate provided in the previous
LTRA of 2.3 percent for the 2012–2022 period. The reduction in year-on-year load forecast growth projections is the result
of changes in the Moody’s long-range economic forecast for the ERCOT Region. Moody’s low-case economic forecast is
used to provide forecasted non-farm employment values for 2013 through 2023 and a normal weather year is determined
based on actual weather data from 1998–2012. Reported peak demands represent the coincident demand for the ERCOT
Region. There are no expected changes in the footprint of the ERCOT Interconnection. There have been no significant
changes in the forecasting process since the previous LTRA.
Sharyland Utilities purchased Cap Rock Electric Cooperative and has begun to move load that was previously served in SPP
into ERCOT. There are no footprint changes associated with this load and transmission assets transfer. These loads are
already included in the ERCOT long-term load forecast.
Odessa North area (West Texas) experienced unprecedented load growth due to oil and natural gas production and mid-
stream processing. Recent reports indicate that the Midland–Odessa economy grew 13.5 percent in 2011 and retail sales
156 2012 ERCOT Loss of Load Study Assumptions and Methodology. 157 Stakeholders have voted at a Wholesale Market Subcommittee (WMS) meeting to increase the Target Reserve Margin (TRM) to 16.1 percent.
It has been reviewed and approved by the Technical Advisory Committee (TAC). In its July meeting, the ERCOT Board of Directors considered the revised TRM but decided to delay voting on a final TRM number. Presumably this delay would allow more time for the Public Utility Commission of Texas to complete its current projects related to Resource Adequacy in Texas. It is anticipated that a decision will be made by the end of 2013.

TRE-ERCOT
NERC | 2013 Long-Term Reliability Assessment | December 2013
Page 151
were up 26 percent. Surrounding counties are also experiencing increased economic activity and continue to drive high load
growth averaging 40 percent in the area yearly. Because of the economies associated with oil and natural gas exploration
and production in this area, load growth is expected to continue into the future. County-level forecast of economic and
demographic data was obtained from Moody’s and was incorporated in the ERCOT long-term load forecast.158
There are two DR services administered by ERCOT: Load Resources (LRs) and Emergency Response Service (ERS). Load
Resources (LRs) providing the Responsive Reserves ancillary service is a contractually committed Load-Modifying Demand
as a Capacity Resource to ERCOT. Emergency Response Service (ERS) is a 10-minute DR and distributed generation service
designed to be deployed in the late stages of a grid emergency, prior to shedding involuntary firm load, and represents
Load-Modifying Contractually Interruptible (Curtailable) Demand. All DR programs are counted as LMRs in ERCOT.
Load Resource participation serves as part of the system-wide procurement of the Responsive Reserve Service (RRS)159 used
for ancillary service and is limited to 50 percent of the total RRS requirement. Load Resources providing the Responsive
Reserves ancillary service is a contractually committed Demand-Side Load as a Capacity Resource to ERCOT. In 2012, ERCOT
increased the total RRS (provided by Generation Resources and Load Resources) participation cap from 2,300 to 2,800 MW
based on the analysis conducted by the ERCOT Dynamic Working Group. This cap is not expected to change, and ERCOT
therefore does not envision any significant change in the level of this DR product (current procurement is slightly below the
maximum 1,400 MW cap).
ERS is provided by loads and distributed generators that are contractually obligated to deploy in the event of notification by
ERCOT during system emergency conditions prior to shedding involuntary firm load. In its six-year history, ERS has grown
from zero MW to its current level of more than 500 MW; participation in the service has been increasing at a rate of
approximately 10 percent per year. However, ERS is subject to a cost cap imposed by the PUCT ($50 million annually), and
its growth through the assessment period could be affected by the cost cap. It is reasonable to expect the 10 percent
growth rate to continue and potentially increase throughout the next several years, but absent an increase in the cost cap
(which would require a rulemaking action), the procured capacity can be expected to level off somewhere below 1,000 MW
during the assessment period. Based on market participant projections, it is likely that there may be an increase in ERS
participation by distributed generation resources.
Utility savings, as measured and verified by an independent contractor, have exceeded the goals set by the utilities160. In a
recent assessment, utility programs implemented after electric utility industry restructuring in Texas had produced 270 MW
of peak demand reduction and 529 GWh of electricity savings in 2011 which exceeded the statewide legislative Energy
Efficiency goals for the ninth straight year161. Between 1999 and 2011, the utilities’ programs have produced 1,936 MW of
peak demand reduction and 4,639 GWh of electricity savings. This historical demand reduction is accounted for within the
load forecast and only the expected incremental portion, which is expected to increase from 392 MW in 2013 to 1,238 MW
in 2023, is included as a demand adjustment for the summer seasons during the assessment period.
In addition to the ERCOT-managed DR programs, several Transmission Service Providers (TSPs) have individual, contractual
programs with loads that can respond to instructions to reduce total energy usage. These programs were expected to
attract approximately 250 MW of additional DR capacity for the summer of 2013 and are subject to concurrent deployment
with existing ERCOT-directed DR programs, pursuant to agreements between ERCOT ISO and the TSPs.
DSM program amendments include updating the avoided cost calculations to account for the transition to a nodal market
design in the ERCOT; increasing the demand reduction goals to 30 percent of annual growth in demand beginning in 2013
158 Odessa North Congestion Update. 159 ERCOT Methodologies for Determining Ancillary Service Requirements. 160 Energy Efficiency Accomplishments of Texas Investor Owned Utilities - Calendar Year 2012. 161 Energy Efficiency Accomplishments of Texas Investor Owned Utilities - Calendar Year 2011.

TRE-ERCOT
NERC | 2013 Long-Term Reliability Assessment | December 2013
Page 152
and moving to four-tenths of summer-weather adjusted peak in subsequent years; setting the bonus at a maximum of 10%
of total net benefits; adding provisions for utility self-delivered programs; revising load management programs by requiring
more coordination with ERCOT; increasing the set-aside for targeted low-income programs to 10 percent of the utility’s
budget; formalizing the Energy Efficiency implementation project (EEIP) process; revising the customer protection
standards and applicable definitions to allow behavioral programs; and adding an opt-out provision for industrial customers
taking service at distribution voltage. These amendments constitute a competition rule subject to judicial review as
specified in Public Utility Regulatory Act (PURA) §39.001(e).162 PUCT Project Number 39674 is assigned to this proceeding.163
All of these programs and services are subject to regulatory uncertainty, which has increased as the PUCT has evaluated the
role of DR in the market design as it relates to resource adequacy. Among the options that have been considered are
expansion of Ancillary Services and conversion of ERS to an Ancillary Service procured in the Day-Ahead Market (instead of
three times per year for four-month contract terms, as is the case today).
ERCOT continues to monitor the continuing drought conditions. While reservoir levels are not expected to drop below
power plant physical intake limits during any given year, potential risks to generation capacity exist if Texas remains in
widespread drought conditions.
ERCOT has been notified that the Cobisa–Greenville gas-fired plant (1,792 MW), tentatively scheduled to be on-line by
2017, has been indefinitely delayed. ERCOT has not been notified of any other project deferments. However, the status of
Future-Planned gas-fired resources is being reviewed frequently; current market conditions caused by low natural gas
prices are not conducive to gas generation market investment. In order to gain additional insight into any impediments to
investment in generation resources in the ERCOT region, ERCOT commissioned the Brattle Group to conduct a review of
current market conditions and the impact on generation development.164
ERCOT was notified of two recent retirements, including the Lower Colorado River Authority’s 425 MW Ferguson natural
gas plant, which was taken out of service in September 2013. This capacity will be replaced by a 540 MW combined-cycle
gas-fired plant, expected to be in service by summer 2014. Additional retirements include two Leon Creek gas-fired units,
previously categorized as mothballed and permanently shut down in April 2013. Although there has been no formal
notification to ERCOT, the owner of the J. T. Deely coal-fired plant (845 MW) has publicly announced plans to retire the
plant by the end of 2018.165 This expected retirement is included in this assessment. Upon receipt of a notification of
retirement, ERCOT will study the potential impacts of the retirement, and will work with the resource owner to finalize
reliability-must-run contracts in the event that the unit is required to maintain system reliability. ERCOT will develop
analyses of reliability and market impacts of potential expected retirements as needed and make this information available
to market participants so that developers and investors can better assess future market opportunities.
Some ERCOT generators are considering the addition of thermal energy storage onto their resources to increase the
summer capability of the resources.166 In 2012, 36 MW of batteries came on-line in ERCOT, and developers are evaluating
opportunities to install additional batteries on the system. In addition, a number of compressed air energy storage (CAES)
projects are being proposed for ERCOT, such as the Chamisa project near Tulia, Texas.167 Furthermore, ERCOT created a
new category of seasonal outage resources.168 A Nodal Protocol Revision Request (NPRR) to modify the Protocols to allow
the Resource Entity to designate its resources to be mothballed in non-summer months but operational in summer
162 Public Utility Regulatory Act - Title II, Texas Utility Code. 163 PUCT Project Number 39674. 164 ERCOT Investment Incentives and Resource Adequacy (The Brattle Group). 165 Reuters - UPDATE 1-CPS Energy to shut 871-MW Texas coal-fired plant. 166 Generator Storage: Tapping Texas' Hidden, Flexible, Peak Capacity. 167 EPA Air Permits. 168 NPRR514, Seasonal Generation Resource (Luminant Wholesale Market Subcommittee).

TRE-ERCOT
NERC | 2013 Long-Term Reliability Assessment | December 2013
Page 153
months169 was approved by the ERCOT Board at the May meeting. Regarding behind-the-meter generation, ERCOT
surveyed Private Use Networks (PUN) Generator owners for updates to grid output capacity since conducting the last
operational data analysis for 2011. This generation source is now forecasted to supply 4,331 MW to the system.
ERCOT currently uses 8.7 percent as the Effective Load Carrying Capacity (ELCC) contribution of wind generation. This
capacity contribution was approved by the ERCOT Board of Directors in November 2010. The ELCC of wind generation is
determined as part of the evaluation of the target reserve margin for the ERCOT Region. Using a LOLP Monte Carlo model,
the reliability impacts of wind generation are compared to average dispatchable generation capacity of the ERCOT fleet to
determine the ratio of wind reliability benefits to that of a thermal unit. ERCOT currently assumes that 100 percent of solar
capacity is available on peak due to the small installed capacity amount (75 MW) and expects that the variability of these
resources would not adversely affect grid reliability. However, in anticipation of greater solar generation prevalence, ERCOT
is developing an estimate of the solar ELCC. For hydro, the peak capacity contribution is 88 percent based on a new
methodology being considered by stakeholders that uses the average capacity available during the 20 highest peak load
hours over each of the preceding three years. Biomass generation is assigned a peak capacity contribution value of 100
percent.
ERCOT has been incorporating variable resources into its operating procedures and has significant experience maintaining
operational reliability with significant and increasing levels of interconnected variable generation. Recently, ERCOT
implemented an additional procedure in the control room for large ramp periods using the ERCOT Large Ramp Alert System
(ELRAS) tool in the operator procedures. These tools and operating practices have been implemented to aid ERCOT in
managing the integration of variable resources and the reliability of the grid.
The ERCOT Region is a separate Interconnection with only asynchronous ties to SPP and Mexico’s Comisión Federal de
Electricidad (CFE). As such, ERCOT does not share reserves with other Regions. Presently, there are two asynchronous ties
between ERCOT and SPP with a total of 820 MW of transfer capability and three asynchronous ties between ERCOT and
Mexico with a total of 280 MW of transfer capability. The ERCOT Region does not rely on external resources to meet
demand under normal operating conditions; however, under emergency support agreements, it may request external
resources for emergency services over the asynchronous ties or by block transfer of discrete loads.
ERCOT includes imports of 410 MW from SPP and 218 MW from CFE, which represent 50 percent of the asynchronous tie
transfer capability to reflect emergency support arrangements. Of the imports from SPP, 48 MW is tied to a long-term
contract for a purchase of firm power from specific generation. In 2014, Sharyland Utilities will expand one of the dc ties
and increase its capacity by 150 MW, providing an additional 78 MW of imports from CFE. Including this addition, import
capacity provides 0.8-0.9 percent toward the target reserve margin calculation during peak demands.
Several SPP members own 317 MW of a power plant located in the ERCOT Region through 2020, resulting in a firm export
of that amount from ERCOT to SPP. There are no known nonfirm contracts signed or pending. In the future, switchable units
attached to both ERCOT and MISO may participate in the MISO capacity market. The Gateway and Frontier generators will
be able to participate in the Midwest ISO capacity auction in December 2013. If any of these resources are selected for
MISO from the auction, they will be excluded from ERCOT resources in future LTRAs.
Transmission and System Enhancements
The recently updated ERCOT future transmission projects list includes the additions or upgrades of 5,640 miles of 138-kV
and 345-kV transmission circuits, 7,063 MVA of 345/138-kV autotransformer capacity, and 10,416 Mvar of reactive
capability projects that are planned in the ERCOT Region between 2013 and 2022.
169 ERCOT Board Report.
TRE-ERCOT
NERC | 2013 Long-Term Reliability Assessment | December 2013
Page 154
In the Lower Rio Grande Valley (LRGV), a new 345-kV import line and an upgrade of the two existing 345-kV import lines are
part of a project to increase the overall import capability into the area by 2016. Additionally, a new 163-mile, 345-kV line
from the Lobo station, near Laredo, to the North Edinburgh station is expected to be completed by 2016. This new line will
provide a third 345-kV import circuit into the LRGV from outside of the area. These projects are needed to meet the load
growth demands in the area. Currently, demand in the LRGV is supported by the two existing 345-kV lines, three smaller
138-kV lines, and approximately 1,700 MW of natural gas generation at four plants. The area also has some hydro and wind
generation and an asynchronous tie with the Mexico system. Because the area is dependent on such a small number of
resources, maintenance outages must be carefully planned in order to be able to reliably serve the area. Similarly, the area
is vulnerable to contingency events in which multiple pieces of equipment are out due to maintenance or equipment
failure.
A new Cross Valley 345-kV, 106-mile line from the North Edinburg station, located on the west side of the LRGV, to the
Loma Alta station, located on the east side of the LRGV, is expected to be in-service before the summer peak of 2016. This
new line will support load growth in the cities, including Brownsville, along the eastern side of the LRGV. Part of the LRGV
import project includes the installation of a new composite core conductor on each of the existing 345-kV import lines into
the area. The reconductoring will occur while the lines are energized as they cannot be taken out of service for extended
periods of time due to the Region’s dependence on the import power they provide. This is accomplished by constructing a
temporary transmission circuit phase parallel to the actual line, bypassing the section the construction crews are working
on.
Elsewhere on the ERCOT system, the Competitive Renewable Energy Zone (CREZ) projects are expected to resolve the
West–North stability limit constraint once all of the transmission lines associated with the projects are in place by the end
of 2013.
Multiple transmission upgrades in the Odessa North area (West Texas) scheduled to be completed prior to the summer of
2013 are expected to reduce congestion and improve reliability in the area. Oncor is seeking approval to construct a new
138-kV, 80-mile transmission line from Permian Basin Switching Station to Culberson Switching Station, which is projected
to be in-service by summer 2016. This line will effectively create a transmission loop that serves existing customers and the
future load growth anticipated in the area.
Power imports into the Houston area are expected to be constrained until new import lines are constructed or new
generation is built within the area in the 10-year planning horizon. Currently, there is enough import capability and
generation to meet the demand in Houston. However, the anticipated load growth in the ERCOT Long-term Forecast for the
Houston region indicates that a new import path will most likely be needed before 2022. ERCOT will continue evaluating
Houston import options and ensure that the results are incorporated in short-term study horizons.
In West Texas, the revitalization of the Permian Basin oil fields has increased electric demand at unprecedented rates in
some areas, causing a substantial amount of congestion on some transmission elements. In South Texas, the development
of the Eagle Ford Shale fields has caused the need for transmission system improvements. Constraints in both areas are
expected to persist until the planned long-term solutions that are expected to be in-service between 2013 and 2015.170
In 2014, the existing Railroad dc tie connection between ERCOT and CFE will double in capacity to 300 MW. Additionally,
ERCOT has received requests to study two projects that would add asynchronous tie capacity between ERCOT and the
Eastern Interconnection. The Southern Cross project would connect on the eastern portion of the ERCOT system and add up
to 3,000 MW of tie capacity by 2016. The Tres Amigas project would add 1,500 MW of tie capacity in the Texas Panhandle
by 2017. These new lines will provide transmission access to several Regions adjacent to ERCOT, and the associated
170Details of the plans for the Permian Basin area can be found at: Presentation to ERCOT Regional Planning Group (Oncor - ODESSA UPDATE). Details of the plans for the Eagle Ford Shale area can be found at: ERCOT Meeting Minutes.

TRE-ERCOT
NERC | 2013 Long-Term Reliability Assessment | December 2013
Page 155
increase in import capability will improve resource adequacy in the Region. The additional dc tie capacity is being proposed
for commercial purposes.
There are no project delays or outages that are expected to impact long-term reliability during the assessment period.
Outage analysis in the Operations Planning and Operations horizons ensures that system outages, transmission, or
generation are only taken if they do not compromise system reliability.
By the end of 2013, dynamic reactive devices will be installed in four substations within ERCOT. Two devices are in the
North-Central weather zone, which includes the Dallas–Fort Worth area and are 600 Mvar capacitive and 530 Mvar reactive
and 300 Mvar capacitive and 265 Mvar reactive, respectively. Another device is being installed in the North weather zone
and is 300 Mvar capacitive and 100 Mvar reactive. The fourth device is being installed in the West weather zone and is 200
Mvar capacitive and 50 Mvar reactive. Based on the 2012 Report on Existing and Potential Electric System Constraints and
Needs, additional reactive devices will be needed by 2022.171 With these devices included, the ERCOT Region is projected to
add over 3,705 Mvar of reactive devices and 6,711 Mvar of capacitive devices by 2022.
A stability assessment indicated that an N-1-1 Element contingency (loss of two 345-kV circuits) in South Texas could
potentially depress the voltage below 0.8 per unit, if it occurred during peak load conditions. An existing UVLS scheme with
less than 300 MW of load in the area can improve the voltage recovery to prevent a cascading event. The Lobo–North
Edinburg 345-kV line project is planned to be in-service by 2016 to resolve this issue in the long term.172 Additionally, an
existing UVLS scheme with less than 200 MW of load in the Laredo area will prevent a local voltage collapse for an extreme
contingency.
There are no current plans to install SPS in lieu of planned bulk power transmission facilities. ERCOT is reviewing SPSs for
retirement-based exit criteria and anticipates that several are targeted prior to summer 2013.
As a part of the collaborative effort funded by DOE under the Synchrophasor Project, PMUs are being installed in ERCOT.
This fast-responding, new technology is an essential part of integrating renewables and assisting the control room with
wide-area monitoring. This effort has engaged various other entities, including ERCOT TSPs (ONCOR, American Electric
Power (AEP), and Sharyland), Electric Power Group (EPG) as the software application vendor, the Center for the
Commercialization of Electric Technology (CCET) as coordinator, and University of Texas at Arlington (UT-Arlington) as
research collaborator. A total of 33 PMUs are being installed in the ERCOT Region as a part of this project.
Additionally, FACTs, phase shifters, series compensated lines, STATCOMs, and SVCs are being used within the ERCOT
Interconnection. Houston and Dallas–Ft. Worth have SVCs to support a severe (i.e., NERC Category C) contingency, while
phase shifters are used to manage flows in local areas. Series compensated lines are being added to improve transfer limits
for CREZ and other import lines.
Some LSEs in the ERCOT Region have implemented smart grid products. Those LSEs and others are known to be expanding
existing products and evaluating new products and services. These smart grid products, many of which are enabled by
smart meter implementation, are based entirely on bilateral agreements between the LSEs and their customers and are
therefore not dispatchable by ERCOT. However, deployment of these services can potentially have a significant impact on
ERCOT operations and load forecasting. As such, ERCOT is taking an active approach toward collecting data on the products
and services in order to evaluate the MW values of their DR and price response actions.
Under PUCT rules, LSEs are required to provide ERCOT with “…complete information on load response capabilities that are
self-arranged or pursuant to bilateral agreements between LSEs and their customers.”173 ERCOT will request data from the
171 ERCOT: Report on Existing and Potential Electric System Constraints and Needs (December 2012). 172 ERCOT Presentation: Lower Rio Grande Valley. 173 PUC Substantive Rule 25.505 ()(5).

TRE-ERCOT
NERC | 2013 Long-Term Reliability Assessment | December 2013
Page 156
LSEs for customers enrolled in various DR and load management products. LSEs will submit the data to ERCOT beginning
with the summer of 2013, enabling ERCOT to evaluate the impact of retail response to various pricing events. Surveys can
then be repeated annually to provide a measurement of the growth of retail load response.
Long-Term Reliability Issues
ERCOT, as part of a long-term transmission planning study funded by DOE, has been reviewing the impact of extensive wind
generation added to the grid (49 GW by 2016). Additional analysis is ongoing.174 In 1999, as part of the restructuring of the
electric market, the Texas Legislature passed a law requiring retail electric providers to invest in, acquire, or purchase a
total of at least 2,800 MW of clean energy by 2009. In 2005, the Texas Legislature expanded this RPS to 5,880 MW by 2015
and 10,000 MW by 2025. ERCOT already surpassed this amount of installed renewable capacity (10,556 MW), and
developed many operational and planning tools to handle these additions to the grid.
The bulk of DR currently in ERCOT is large commercial and industrial load. It has provided more than the required MW
when called upon. Measurement and verification procedures for these programs are defined in the Performance
Monitoring section of the ERCOT Protocols.175 As the ERCOT market adds more DR in the future, potential unresponsiveness
will have to be addressed.
ERCOT is following the installation of distributed energy resources in the grid. Currently, the amount is not enough to be a
concern (less than 200 MW). As the ERCOT market adds more distributed energy resources in the future, the potential of
system reliability impacts will have to be addressed.
Drought and environmental regulation are the two emerging reliability issues of the highest level priority at ERCOT. Both of
these issues became focal points for the state in 2011 when the lack of rainfall and introduction of CSPAR came to the
frontlines.
ERCOT is working with generators to determine the generation limitations during extreme drought conditions. ERCOT
surveyed generators to identify the most at-risk resources. The last survey showed no current concern of drought, but the
Region continues to monitor the issue.176 The new Panda Sherman and Panda Temple Power plants will use recycled
sewage for cooling purposes to help conserve the state's water supply.
Drought could be a potential issue in any given year. Multi-year cycles of drought conditions increase the probability that
the following year will have more problems as the baseline storage has to be refilled in addition to having sufficient rainfall
for the current year’s needs. If multiple resources were unable to run due to lack of water to cool the units, resource
adequacy in that given year would be at risk. These affected generation resources would fall into the unavailable category,
resulting in a reduced reserve margin. Constant review and vigilance is taken by ERCOT in order to identify areas in which
resources are at risk of derating or shutdown. Depending on the location of the drought, local area transmission congestion
can result and must be relieved. If an extended drought occurs, additional transmission may need to be added to support
an affected area. The entire system would be impacted by additional pressure placed on other resources. The specific
location with the outage may have congestion problems to overcome in addition to voltage support issues. If additional
resources are added into an area that is historically known for drought, it can exacerbate the resource adequacy situation.
Also, an extended, multi-year drought would aggravate the problem.
Concerning environmental regulations, the EPA has proposed new regulations that, if implemented, may degrade the
economic viability of certain generation resources. Specifically, the Clean Water Act (Section 316(b)), the MATS, CSAPR, and
the Coal Combustion Residuals Disposal (CCDR) regulations may require retrofits, upgrades, or otherwise increase
production costs to a point at which retirement of units may be more plausible than continued operation. The near-term
174 ERCOT Panhandle Renewable Energy Zone Study 175 ERCOT Market Rules. 176 ERCOT 2013 Summer Presentation.
TRE-ERCOT
NERC | 2013 Long-Term Reliability Assessment | December 2013
Page 157
impact of environmental regulations on the ERCOT system was delayed due to the court stay of the CSAPR. Without that
stay, the regulations likely would have affected system reliability in 2012. If the court finds for the EPA and allows the rule
to stand, the CSAPR will probably impact unit availability. The MATS required compliance by 2015 (or within two years of
that date with possible compliance extensions). Other regulations (e.g., Clean Water Act (Section 316(b)) and CCDR) may
take effect later in this decade. During the 10-year horizon, Generator Owners whose cost of compliance is greater than or
equal to the present value of the future predicted stream of revenue associated with a certain generator may opt to retire
the unit.
Preliminary ERCOT studies that did not include CSAPR suggest that 9,800 MW of legacy gas units are at highest risk of
accelerated retirement. In addition, ERCOT completed an assessment of the proposed inclusion of Texas in the CSAPR. The
assessment found that, if the rule was implemented as scheduled on January 1, 2012, the generators’ compliance plans
indicated that 1,200 to 1,400 MW of generation would be unavailable year-round and an additional 1,800 to 4,800 MW
would be unavailable during the off-peak months. Preliminary ERCOT studies, which were performed prior to the issuance
of the CSAPR and assumed implementation of the Clean Air Transport Rule, suggest that coal plants within the Region
should continue to be economically viable to operate, unless low natural gas prices and increased carbon emission fees
occur with the pending regulations. Low natural gas prices are present now due to increased production or possible
production of shale plays within the continental United States. Gas plants in the ERCOT Region, facing the imposition of
closed-loop cooling tower requirements as a part of Section 316(b) of the Clean Water Act, are more likely to see less than
favorable economics for continued operation. In summary, the combined impact of sustained low natural gas prices, the
CSAPR, MATS rule, and other regulatory uncertainties may result in the retirement of both gas and solid-fuel units.
The PUCT has held a number of workshops and regulatory discussions regarding resource adequacy. Redevelopment of
existing generation sites would likely minimize the need for additional transmission investment. However, many legacy gas
plants are located within EPA air quality nonattainment zones. In addition, pipeline requirements of new generation may
exceed the capability of pipeline infrastructure at legacy gas plant locations. It is unclear when resource owners will finalize
their environmental compliance strategies due to the uncertainties in the implementation of environmental regulations and
the need to test the effectiveness of environmental control technologies; until these compliance strategies are evaluated in
aggregate, the impacts to system reliability cannot be fully quantified. If additional time is required for resource owners to
complete their strategies to comply with the MATS rule, they will need to inform the EPA and ERCOT well in advance of the
regulatory deadline in order to qualify for the four- or five-year extensions. It is unknown how changing market dynamics
will affect compliance strategies.
If implement and unaccompanied by accelerated development of new generation, these environmental regulations will
further decrease the reserve margin within the ERCOT Region. As noted above, the reserve margin in the ERCOT Region is
forecasted to fall below the required 13.75 percent level in 2014, even without these accelerated retirements. If potential
retirements occur as forecasted in ERCOT studies, reactive support or new import paths will be required in the Dallas–Fort
Worth and Houston metropolitan areas. If potential retirements occur as forecasted in ERCOT studies and incremental or
replacement generation is not constructed, ERCOT will face lower reserve margins, decreased ramping capability, and
increased transmission congestion. The unavailability of generation due to the CSAPR and MATS would increase capacity
insufficiency and the need for emergency actions (including rotating outages) not only during the peak months but also
during the off-peak months until retrofits or alternative resources were implemented.
ERCOT is working with Generation Owners to determine the impact of environmental rules on potential retirement of
generation. A study on environmental scenarios was completed when the draft Cross-State Air Pollution Rule (CSPAR) was
released in 2011.177 To address and mitigate reliability issues as conditions arise, ERCOT reviews the impact of the
177 2011 Long-Term Interim Report - Volume 2.

TRE-ERCOT
NERC | 2013 Long-Term Reliability Assessment | December 2013
Page 158
retirement of resources on the ERCOT grid and performs transmission reliability analyses. If the reliability analyses identify
any deficiencies, resources are given a reliability-must-run contract to temporarily keep them operational until the
implementation of the transmission projects to mitigate the deficiencies.
ERCOT will study the potential impacts of unit retirements and work with resource owners to finalize reliability-must-run
contracts in the event that units are required to maintain system reliability. ERCOT will develop analyses of reliability and
market impacts of potential expected retirements as needed and make this information available to market participants so
that developers and investors can accurately assess future market opportunities.
With respect to maintenance outage impacts caused by environmental control requirements, the ERCOT system has excess
generation in the shoulder months to handle such outages under most weather conditions. Reliability could be impacted in
situations of unseasonably warm weather and unplanned or planned resource outages. System reliability may be impacted
if unit outages for installation of environmental equipment enter into or go beyond the summer season. In 2011, ERCOT
conducted a study to quantify the impact of retrofits on reliability.178 A potential risk exists that not enough vendors are
available to serve all the markets under the time constraints given.
178 ERCOT retrofit impacts on reliability.

WECC
NERC | 2013 Long-Term Reliability Assessment | December 2013
Page 159
WECC The Western Electricity Coordinating Council (WECC) is responsible for coordinating and promoting BES reliability in the Western Interconnection. WECC’s 329 members, which include 39 BAs, represent a wide spectrum of organizations with an interest in the BES. Serving an area of nearly 1.8 million square miles and approximately 81 million people, it is geographically the largest and most diverse of the NERC Regional Reliability Organizations. WECC’s service territory includes the Canadian provinces of Alberta and British Columbia, the northern portion of Baja California in Mexico, and all or portions of the 14 western states in between.
Planning Reserve Margins
WECC-TOTAL-Summer 2014 2015 2016 2017 2018 2019 2020 2021 2022 2023
ANTICIPATED 31.18% 33.03% 30.72% 29.29% 28.02% 26.44% 26.02% 23.37% 21.76% 19.93% PROSPECTIVE 31.18% 33.03% 30.72% 29.29% 28.02% 26.44% 26.02% 23.37% 21.76% 19.93% ADJUSTED POTENTIAL 31.95% 35.39% 34.20% 33.68% 34.41% 34.03% 34.57% 32.16% 30.49% 28.64%
NERC REFERENCE - 14.70% 14.70% 14.70% 14.70% 14.70% 14.70% 14.70% 14.70% 14.70% 14.70%
WECC-TOTAL-Winter 2014 2015 2016 2017 2018 2019 2020 2021 2022 2023
ANTICIPATED 37.07% 37.61% 36.33% 35.83% 33.95% 32.06% 30.62% 28.69% 26.41% 24.72% PROSPECTIVE 37.07% 37.61% 36.33% 35.83% 33.95% 32.06% 30.62% 28.69% 26.41% 24.72% ADJUSTED POTENTIAL 37.83% 39.62% 39.46% 39.86% 40.35% 40.15% 39.47% 37.82% 35.44% 33.76%
NERC REFERENCE - 14.50% 14.50% 14.50% 14.50% 14.50% 14.50% 14.50% 14.50% 14.50% 14.50%
Summer Winter
0%
10%
20%
30%
40%
50%
2014 2015 2016 2017 2018 2019 2020 2021 2022 2023
0%
10%
20%
30%
40%
50%
2014 2015 2016 2017 2018 2019 2020 2021 2022 2023
Cumulative 10-Year Planned Capacity Change
-30369
1215182124
2014 2015 2016 2017 2018 2019 2020 2021 2022 2023
GW
2013 Existing 2023 Planned 2023 Planned & Conceptual
WECC-TOTAL Capacity
(MW) Share
(%) Capacity
(MW) Share
(%) Change
(MW) Capacity
(MW) Share
(%) Change
(MW)
Coal
38,798 19.7%
37,787 17.1% -1,011
37,787 16.0% -1,011
Petroleum
1,047 0.5%
1,047 0.5% 0
1,047 0.4% 0
Gas
89,870 45.6%
100,534 45.4% 10,664
111,762 47.3% 21,892
Nuclear
9,553 4.8%
9,553 4.3% 0
9,553 4.0% 0
Hydro
42,577 21.6%
44,131 19.9% 1,554
44,728 18.9% 2,152
Pumped Storage
4,441 2.3%
4,688 2.1% 248
4,688 2.0% 248
Geothermal
2,597 1.3%
3,602 1.6% 1,005
3,713 1.6% 1,116
Wind
5,381 2.7%
8,174 3.7% 2,793
9,544 4.0% 4,163
Biomass
1,279 0.6%
1,555 0.7% 276
1,582 0.7% 303
Solar
1,718 0.9%
10,343 4.7% 8,625
12,080 5.1% 10,361
TOTAL 197,261 100.0% 221,415 100.0% 24,155 236,484 100.0% 39,223

WECC
NERC | 2013 Long-Term Reliability Assessment | December 2013
Page 160
BOUNDARY CHANGE179
In 2013, there was a small change in the footprint of two of the WECC subregions. Valley Electric Association, Inc. moved
from Nevada Power within the DSW to the California ISO in the CALS subregion.
Planning Reserve Margins
The Planning Reserve Margins,180 or target margins, were derived using the 2014 load forecast and the same method as the
2013 Power Supply Assessment (PSA).181 The PSA uses a Building Block Method182 for developing the Planning Reserve
Margins and has four elements: Contingency reserves, Operating reserves, Reserves for forced outages, and Reserves for
one-year‐in‐10 weather events.
By the summer of 2023, the difference between WECC’s Anticipated Resources (212,078 MW) and WECC’s Net Internal
Demand (173,095 MW) is anticipated to be 38,983 MW (22.5 percent margin). As the expected resources exceed target
margins, it is reasonable to assume that only a portion of the reported resource additions will ultimately enter commercial
service within the planning horizon.
WECC does not have an interconnection‐wide formal Planning Reserve Margin standard. As previously mentioned, the
WECC annual PSA summer and winter reserve target margins are developed using a Building Block Method.
As depicted in the table at the beginning of this section, the Planning Reserve Margins for the WECC Region remain above
NERC Reference Margin Level throughout the 2014–2023 planning horizon. Individual subregions do drop below their
Reference Margins in future years, but the reported Conceptual resources will exceed these potential shortages.
In the resource adequacy process, each BA is responsible for complying with the resource adequacy requirements of the
state or provincial areas in which they operate. Some BAs perform resource adequacy studies as part of their Integrated
Resource Plans, which usually provide a 20‐year outlook. Other BAs perform resource adequacy studies that focus on the
very short term (i.e., one to two years), but most projections provide at least a 10‐year outlook. WECC’s PSA uses a study
period of 10 years and the same zonal reserve target margins throughout the entire period. These target margins are
applied as the NERC Reference Margin Level for each WECC subregion.
Similar to WECC’s PSA, resources that are energy‐only or energy‐limited (e.g., the portion of wind resources that is not
projected to provide generation at the time of peak) are not counted toward meeting resource adequacy in this
assessment. Also, resources such as distributed or behind‐the‐meter generation that are not monitored by the BA’s energy
management systems are excluded from the resource adequacy calculation.
Total Internal Demand for the summer, the peak season for the entire WECC Region, increased by 3.1 percent from 2011 to
2012, mostly due to warmer than normal temperatures in 2012. The Total Internal Demand for the summer season is
projected to increase by 1.7 percent per year for the 2014–2023 time frame, which is unchanged from the 1.7 percent
projected last year for the 2013–2022 period. The annual energy load is projected to increase by 1.5 percent per year for
the 2014–2023 time frame, which is a decrease from the 1.6 percent projected last year for the 2013–2022 period.
The WECC Total Internal Demand forecast includes summer DR that varies from 4,531 MW in 2014 to 5,273 MW in 2023.
The direct control DSM capability is located mostly in the CALN and CALS subregions, totaling 2,810 MW in 2014 and 3,162
179 For long-term planning, the WECC Region is divided into nine assessment areas: Alberta, Canada (AESO); California-North (CALN); Northwest
US (NORW); Basin (BASN); California-South (CALS); Rockies (ROCK); British Columbia, Canada (BC); Desert Southwest (DSW); WECC-Mexico (MEXW).
180 The NERC Reference Reserve Margins identified throughout the assessment are Planning Reserve Margins and firm load would not be disrupted to maintain these margins. Rather, the margins are reference points that indicate areas that have lower reserves and tighter margins. The tighter margins are not forecasts of resource shortages. However, areas with tighter margins have a higher possibility, although not likelihood, of resource shortages associated with extreme events such as record-setting temperature deviations.
181 WECC’s Power Supply Assessments. 182 Elements of the Building Block Target are detailed in NERC’s Attachment II: Long-Term Reliability Assessment – Methods and Assumptions.

WECC
NERC | 2013 Long-Term Reliability Assessment | December 2013
Page 161
MW in 2023. DSM programs in other subregions are also increasing. The most prevalent DR programs in WECC involve air-
conditioner cycling as well as interruptible load programs that focus on the demand of large water pumping operations and
large industrial operations (e.g., mining). Currently, the most significant DR development activity within WECC is taking
place in California; California ISO (CAISO) is actively engaged with stakeholders in developing viable wholesale DR products
with direct market participation capability. Also of note is CAISO’s new DR product implementation that facilitates the
participation of existing retail demand programs in the CAISO market. Further information regarding these initiatives is
available on CAISO’s website.183
Overall DR program growth has been rather static and is not expected to increase dramatically during the 10-year planning
horizon. The various DSM programs within WECC are treated as load modifiers that reduce Total Internal Demand when
calculating planning margins. In some situations, these programs may be activated by LSEs during high-power cost periods
but in general are only activated during periods in which local power supply issues arise. Generally, DR programs in WECC
have limitations, such as having a limited number of times they can be activated.184
All of the BAs within the Western Interconnection provided the generation data for this assessment, and WECC staff—
under the direction of the WECC Loads and Resources Subcommittee (LRS)—processed the data. The reported generation
additions generally reflect extractions from generation queues.
Distributed energy resources, including rooftop solar and behind‐the‐meter generation, currently represents an
insignificant portion of both the existing and planned resources. As the load served by these resources is not included in the
actual or forecast peak demands and energy loads, these resources are excluded from the resource adequacy calculation.
Since the 2012LTRA, expected available nonrenewable summer capacity has increased by 2,355 MW, and renewable
summer capacity (nameplate) has increased by 5,941 MW. Thermal plant additions were largely gas‐fired combined‐cycle
plants, while renewable additions were largely wind farms. Gross Future-Planned additions are expected to total 34,474
MW (including 10,664 MW natural gas-fired, 10,254 MW wind powered, and 10,665 MW solar resources), with Conceptual
additions totaling 19,497 MW (including 11,228 MW natural gas-fired, 5,029 MW wind powered, and 2,147 MW solar
resources).
A few utilities attributed coal‐fired plant retirements and fuel conversions to existing air emissions regulations. Based on
news media accounts and information related to western coal‐fired plant environmental regulation cost exposure,185 it is
expected that future LTRA information will report additional retirements and fuel conversions as more plant owners
establish their preferred approaches for addressing the recent Maximum Achievable Control Technology regulations.
California regulations essentially specify that existing long-term contracts with coal-fired plants will be allowed to run to
expiration, though not renewed.186 This regulation may result in the sale, retirement, or repowering of some power plants
during the assessment period. Due to the somewhat fluid situation in California regarding retirements associated with
once‐through cooling (OTC) regulations, potential associated capacity reductions have not been reported for this year’s
LTRA. Current information regarding the California OTC is available on the California Energy Commission’s website.187 It is
expected that any capacity reductions will be offset by new plants that may or may not be reflected in the current
Conceptual resources data.
183 California ISO Demand Response Initiatives. 184 NERC’s assessment process assumes that DR may be shared among LSEs, BAs, and subregions. However, DSM sharing is not a contractual arrangement. Consequently, reserve margins may be overstated as they do not reflect DR that could potentially be unavailable to respond to external energy emergencies. Energy efficiency and conservation programs vary by location and are generally offered by the LSEs. The reduction to demand associated with these programs is reflected in the load forecasts supplied by the BAs. 185 Environmental Controls and the WECC Coal Fleet. 186 CEC Emission Performance Standards. 187 CEC Once-Through Cooling.
WECC
NERC | 2013 Long-Term Reliability Assessment | December 2013
Page 162
The 2,250-MW San Onofre Nuclear Generating Station (SONGS) in southern California experienced premature wear in the
steam tubes for both of the plant’s units, which were shut down for repairs.188 In June of this year, Southern California
Edison, the majority owner and operator of the plant, announced that after considering options to repair the SONGS units,
it determined that none were cost-effective and the plant will be retired. 189
The Existing‐Certain and Future‐Planned resources projected for the 2014 summer peak period total 199,015 MW and
reflect the monthly shaping of variable generation and the seasonal ratings of conventional resources. The resources not
counted toward on‐peak capacity include 39,150 MW of variable generation derates and 6,678 MW of inoperable and
scheduled generation outages. The Expected Capacity modeling for wind resources is based on curves created using at least
five years of actual hourly wind generation data. The data is averaged into six four-hour blocks for each day of the week of
the year. Solar resource energy curves were created using up to five years of actual hourly solar generation data. The data is
averaged into three block curves for each day of the week of the year.190 Hydro generation is dispatched economically,
limited by expected annual energy generated during an adverse hydro year. Biomass and geothermal capabilities are based
on nominal plant ratings.
The individual BAs report 34,474 MW as the gross Future‐Planned capacity projected to in-service by the end of this
assessment period. Greater wind generation has resulted in an increased fluctuation in instantaneous generation and a
need for increased operating reserves to compensate for the wind‐induced fluctuations. Improved wind forecasting
procedures and reduced scheduling intervals have only partially addressed the wind variability issue. Increased wind
generation has also exacerbated high generation issues in the Bonneville Power Administration (BPA) area during light load
and high hydroelectric generation conditions. BPA is working on long‐term solutions to this issue and provides current
information regarding the issue on its website.191 Increased wind penetration is expected to worsen the operating reserve
situation. Solar generation has not yet reached a level sufficient to create significant operational issues.
WECC does not rely on imports from outside the Region when calculating peak demand reliability margins. The Region also
does not model exports to areas outside of WECC. However, imports may be scheduled across three back‐to‐back dc ties
with SPP and five back‐to‐back dc ties with the MRO. One WECC entity reports a 101 MW diversity exchange credit with its
counterpart in SPP, but the exchange is not reflected in this assessment. WECC does not model emergency generation as
being available to meet the NERC Reference Margin.
Inter‐subregional transfers are derived from resource allocation computer simulations that incorporate transmission
constraints among various path‐constrained zones within WECC.192 The WECC resource allocation model places
conservative transmission limits on paths between 19 load groupings (zones) when calculating the transfers between these
areas. These load zones were developed for WECC’s PSA studies. The aggregation of PSA load zones into WECC subregions
may obscure differences in adequacy or deliverability between zones within the subregion.
The resource data for the individual subregions includes transfers between subregions that either are plant‐contingent
transfers or reflect projected transfers with a high probability of occurrence. Plant‐contingent transfers represent both joint
plant ownership and plant‐specific transfers from one subregion to another. Projected transfers reflect the potential use of
seasonal demand diversity between the winter‐peaking Northwest and the summer‐peaking Southwest, as well as other
economy and short‐term purchases that may occur between subregions.
188 SONGS capacity was reported as Inoperable and excluded for this reliability assessment. 189 Information on the status of SONGS. 190 Details concerning the hourly blocks can be found in the Long-Term Reliability Assessment – Methods and Assumptions document. 191 BPA Wind Activities. 192 WECC reports feasible transfers, not contracted transfers. This is done to eliminate double counting of resources. This treatment is different
from the other NERC Assessment Areas.

WECC
NERC | 2013 Long-Term Reliability Assessment | December 2013
Page 163
While these transactions may not be contracted, they reflect a reasonable modeling expectation given the history and
extensive activity of the western markets, as well as the otherwise underused transmission from the Northwest to the other
subregions. When examining all Adjusted-Potential Resources, all subregions maintain adequate reserves (above respective
targets) throughout the assessment period.
Transmission and System Enhancements
WECC is spread over a wide geographic area, with significant distances between generation and load centers. In addition,
the northern portion of the assessment area is winter-peaking, while the southern portion of the assessment area is
summer‐peaking. Consequently, entities within the Western Interconnection may seasonally exchange significant amounts
of surplus electric energy. These conditions result in periodic full utilization of numerous transmission lines, which does not
adversely impact reliability. Due to the inter‐subregional transmission constraints, reliability in the Western Interconnection
is best examined at a subregional level.
The addition of 15,458 circuit miles of ac transmission line and 535 circuit miles of dc transmission have been reported
through 2023. A large number of transmission projects have been reported to WECC. Some of these projects are duplicative
in nature and may have a proposed path similar to another project. As WECC does not vet the new projects or identify
minimum transmission addition needs, reported additions may not closely reflect transmission additions that could occur
during the assessment period. A delay of these projects may impact the timing and location of resource additions but
should not adversely impact system reliability. The WECC Transmission Project Information Portal193 provides a single
location where interested parties can find basic information about major transmission projects in the Western
Interconnection.
WECC’s Transmission Expansion Planning Policy Committee’s (TEPPC) Subregional Coordination Group analyzed the
development status of the major reported transmission projects and identified 30 projects with a high probability of being
in service by 2023. Information regarding the projects is available in the group’s report 2022 Common Case Transmission
Assumptions (CCTA).194
To help monitor the impact of new generation resources on the transmission systems, individual entities within the
Western Interconnection have established generator interconnection requirements that include power flow and stability
studies to identify any adverse impact from proposed projects. In addition, WECC has established a review procedure that is
applied to larger transmission projects that may impact the interconnected system. The details of this review procedure are
located in WECC’s Project Coordination and Path Rating Processes.195 These processes identify potential deliverability issues
that may result in actions such as the implementation of system protection schemes designed to enhance deliverability and
to mitigate possible adverse power system conditions.
After the July 2 and August 10, 1996 disturbances that caused cascading transmission and generation outages and a
widespread loss of customer load within WECC, the technical groups evaluating those events recommended a number of
action items to enhance interconnected system reliability. One of those action items was that WECC member systems
evaluate the need for UVLS and report to WECC regarding the implementation of UVLS on their individual systems.
Other documents that supported the call for UVLS studies were the NERC’s Survey of Voltage Collapse Phenomenon
(published in August 1991), the NERC Planning Standards (approved in September 1997), and WECC’s Policy Regarding
Extreme Contingencies and Unplanned Events.196 The WECC policy, in particular, places strong emphasis on the application
193 WECC Transmission Project Information Portal. 194 2022 Common Case Transmission Assumptions (CCTA). 195 WECC's Project Coordination and Path Rating Processes. 196 WECC Policy Regarding Extreme Contingencies and Unplanned Events.

WECC
NERC | 2013 Long-Term Reliability Assessment | December 2013
Page 164
of Safety Nets to protect the system from unplanned events outside the performance levels defined under the WECC
Reliability Criteria. Under-voltage load shedding (UVLS) is one of the Safety Net schemes identified under the WECC policy.
To assist member systems on how to perform UVLS studies to comply with the WECC mandate, the Technical Studies
Subcommittee (TSS) formed an Under‐Voltage Load Shedding Task Force (UVLSTF) with the direction to:
Develop guidelines to help the member systems determine if they would benefit from UVLS as a Remedial Action
Scheme (RAS) or as a Safety Net;
Prepare application guidelines to design UVLS systems; and
Develop methodologies to study and implement UVLS.
WECC addressed the UVLS issue in the Under-Voltage Load Shedding Guidelines document, which was approved by WECC’s
TSS on April 28, 2010.197 The installation of additional UVLS will depend on currently undetermined actions by individual
system operators and LSEs.
The power transfer capabilities of most major subregion transmission interconnections within WECC are limited by system
stability constraints rather than by thermal limitations. These stability constraints are sensitive to system conditions and
may often be increased significantly at nominal cost by applying SPSs or RASs. In addition, transmission operators may
install SPSs or RASs to address localized transmission overloads related to single- and multiple-contingency transmission
outages. The future use of such relatively inexpensive schemes in lieu of costly transmission facility additions—and whether
they will be permanent or temporary additions—will depend on as‐yet‐undetermined system conditions.
LSEs within WECC are rapidly expanding the use of smart meters and the associated interface equipment. The impacts of
such facilities relative to power system reliability have not yet been quantified. Area entities are also taking steps to install
and interface with equipment that may morph into full‐fledged smart grid installations. The pace and extent of such
changes is presently unknown. CISO’s website presents its smart grid initiatives, which are typical of activities within the
assessment area.
Long-Term Reliability Issues
Reliability within the Western Interconnection may be adversely impacted by events that are independent of the planning
margin and transmission facility information presented in this assessment. Due to the fluid nature of entity responses to
these events, the timing and locations of potential impacts, if any, on service to customers cannot be ascertained with a
high level of certainty. Some specific events that have a potential for adverse impacts are discussed below.
A significant portion of the assessment area’s annual energy generation is from hydroelectric resources. Portions of the
hydroelectric resources are run-of-river facilities that are impacted in a relatively short time frame by reduced precipitation.
Other hydroelectric resources are associated with dams that may store enough water to support near-normal generation
for a few months to several years. In addition, much of the hydroelectric generation is located in areas with river run-offs
that are affected by local snow melt conditions. These varying conditions, combined with other factors such as maximum or
minimum river flow restrictions and other water-use requirements, such as irrigation, often result in complex hydroelectric
system operational planning processes that may significantly impact both energy production and peak hydroelectric
resource capability.
As noted previously, light load-period, minimum-generation conflicts exist between northwestern wind and hydro
generation. The unique Northwest condition, an economic issue rather than a reliability issue, could occur in other WECC
subregions if wind resource penetration increases to a presently unidentified extent. Solar penetration is less problematic
relative to low nighttime and weekend load issues and is not expected to be a concern during the assessment period.
197 WECC Under voltage Load Shedding Guidelines.

WECC
NERC | 2013 Long-Term Reliability Assessment | December 2013
Page 165
Another issue associated with the integration of variable resources relates to their impact on operating reserve
requirements. Various entities, including the California Energy Commission, have commissioned studies related to this
issue.198 To date, the adverse impacts associated with operating reserves appear to be largely limited to economic issues
but, conceivably, operating reserve ramp-rate limitations could lead to slight resource mix adjustments.
RPSs have resulted in significant increases in installed wind‐powered generation and planned wind and solar generation
additions. The largest proportion of these additions is due to California’s RPS, which requires that 33 percent of the state’s
annual energy usage be supplied by renewable resources by 2020. WECC’s TEPPC is actively evaluating long‐term regional
transmission needs that factor in the expanding role of these variable generation resources. Further information regarding
that work is available on WECC’s website.199
Due to limited size and program design, a lack of DR action during activation events has not been an issue and, due to the
limited growth in such programs, is generally not expected to be a significant issue during the assessment period. It should
be noted that CISO is actively engaging stakeholders in developing viable wholesale DR products with direct market
participation capability. CISO’s website presents current information about its DR initiative.200
Historically, distributed generation has not been a significant resource in WECC. While the assessment area has experienced
an increase in distributed solar generation, any associated impact has been essentially limited to the local power
distribution facilities. Further expansion of solar distributed generation is not expected to significantly impact the
interconnected power system.
WECC contains a significant number of coal‐fired power plants that may be affected by new emissions regulations. WECC
LRS has not studied the overall impact of environmental regulations; however, WECC TEPPC prepared a scenario analysis
that addresses a potential retirement of 5,400 MW of coal-fired resources.201 Additionally, some information regarding the
issue is available in NERC’s Special Reliability Scenario Assessment: Resource Adequacy Impacts of Potential U.S.
Environmental Regulations.202
In August 2011, the Canadian federal government published draft regulations that would require existing and new
coal‐fired units to reach CO2 emissions levels equivalent to natural gas‐fired, combined‐cycle plants. For existing plants, the
requirements enforceable once a plant reached the end of its useful life (approximately 45 years). Any new unit built after
2015 will need to reach the set emissions levels by 2025.
The two Canadian provinces within WECC, Alberta and British Columbia, will be impacted differently by this regulation. As
British Columbia has no coal‐fired generation or plans to build any coal-fired facilities, it will not be affected. This regulation
will affect the retirement of existing units in Alberta, as well as the addition of coal‐fired capacity. In Alberta, about 1,000
MW of existing coal‐fired capacity will reach the end of its useful life by 2020. The majority of this capacity is expected to
retire, as retrofitting to meet the required emissions levels is prohibitively expensive. The Alberta market, however, is
expected to manage the development of new generation to replace retired capacity during the next decade, and resource
adequacy is not expected to be significantly reduced.
The WECC‐Mexico subregion does not contain coal‐fired power plants. It is expected that future coal-fired plant
retirements and repowerings in other WECC subregions will occur on a schedule that meshes with associated resource and
transmission facility addition schedules.
198 Research Evaluation of Wind Generation, Solar Generation, and Storage Impact on the California Grid. 199 WECC Transmission Expansion Planning. 200 California ISO - Demand Response Initiative. 201 WGG Coal Retirement Case. 202 Resource Adequacy Impacts of Potential U.S. Environmental Regulations.

WECC
NERC | 2013 Long-Term Reliability Assessment | December 2013
Page 166
As noted in the Generation section of this assessment, the California State Water Resources Control Board’s policy on OTC
mitigation is intended to cause a substantial amount of California capacity to retire or be refitted to reduce environmental
impacts. Mechanisms are built into the OTC policy to consider any reliability concerns of California energy agencies or CISO.
The principal issues are associated with local reliability concerns that are not addressed in this WECC‐wide assessment. In
southern California, the air quality mandates imposed on the South Coast Air Quality Management District by the federal
Clean Air Act continue to place constraints on new power plant development and on repowering of existing OTC facilities.
The state energy agencies and CISO are assisting the California Air Resources Board to assess the minimum capacity
requirements of southern California and the need for offsets to facilitate permitting of these capacity additions. Such
capacity additions are closely related to OTC policy‐induced repowering or the retirement of older OTC facilities.
WECC staff has identified long-term reliability issues concerning changes in the mix of generation types expected in future
years through either resource retirements or additions. Many existing resources could be retired as environmental
standards increase. A related concern is the expected reliance on natural gas-fired generation used to replace these retired
units.
Generation retirements or repowerings in California that are associated with the OTC standard may be affected by the early
retirement of SONGS. This issue and others associated with the retirement of SONGS are being addressed by state
regulators and CISO.
Generation fueled by natural gas is expected to be the choice for most, if not all, future conventional generation. A
subsequent increase in demand could have an impact on fuel deliverability as pipelines may be fully contracted. Entities
with the Western Interconnection are actively studying the potential reliability impacts of dependence on natural gas-fired
generation.

Appendix I: List of Acronyms
NERC | 2013 Long-Term Reliability Assessment | December 2013
Page 167
Appendix I: List of Acronyms
Abbreviation Term
A/C Air Conditioning AEP American Electric Power AESO Alberta Electric System Operator (WECC subregion) AFC Available Flowgate Capability ASM Ancillary Services Market ATCLLC American Transmission Company, LLC ATR AREA Transmission Review (of NYISO) AWEA American Wind Energy Association BA Balancing Authorities BASN Basin (WECC subregion) BC British Columbia (WECC subregion) BCF Billion cubic feet BCFD Billion cubic feet per day CAGR Compound Annual Growth Rate CALN California-North (WECC subregion) CALS California-South (WECC subregion) CANW WECC-Canada (WECC subregion, includes AESO and BC) CFL Compact Fluorescent Light CMPA California-Mexico Power Area COI California-Oregon Intertie COS Coordinated Outage [transmission] System CPUC California Public Utilities Commission CRO Contingency Reserve Obligation CRPP Comprehensive Reliability Planning Process (of NYISO) DADRP Day-Ahead Demand Response Program DC Direct Current DCLM Direct Controlled Load Management DFW Dallas/Fort Worth DLC Direct Load Control DOE U.S. Department of Energy DSG Dynamics Study Group DSI Direct-served Industry DSM Demand-Side Management DSW Desert Southwest (WECC subregion) DVAR D-VAR® reactive power compensation system EDRP Emergency Demand Response Program EE Energy Efficiency EEA Energy Emergency Alert EECP Emergency Electric Curtailment Plan EIA Energy Information Agency (U.S. Department of Energy) EILS Emergency Interruptible Load Service (of ERCOT) EISA Energy Independence and Security Act of 2007 (USA) ELCC Effective Load-carrying Capability EMTP Electromagnetic Transient Program ENS Energy Not Served EOP Emergency Operating Procedure ERAG Eastern Interconnection Reliability Assessment Group ERCOT Electric Reliability Council of Texas ERO Electric Reliability Organization FCITC First Contingency Incremental Transfer Capability FCM Forward Capacity Market FERC U.S. Federal Energy Regulatory Commission FP Future-Planned FO Future-Other FRCC Florida Reliability Coordinating Council GADS Generating Availability Data System GDP Gross Domestic Product GGGS Gerald Gentleman Station Stability

Appendix I: List of Acronyms
NERC | 2013 Long-Term Reliability Assessment | December 2013
Page 168
Abbreviation Term
GHG Greenhouse Gas GRSP Generation Reserve Sharing Pool (of MAPP) GTA Greater Toronto Area GWh Gigawatt hours HDD Heating Degree Days HVac Heating, Ventilating, and Air Conditioning IA Interchange Authority ICAP Installed Capacity ICR Installed Capacity Requirement IESO Independent Electric System Operator (in Ontario) IOU Investor Owned Utility IPSI Integrated Power System Plan IRM Installed Reserve Margin IROL Interconnection Reliability Operating Limit IRP Integrated Resource Plan ISO Independent System Operator ISO-NE ISO New England, Inc. kV Kilovolts (one thousand volts) LaaRs Loads acting as a Resource LCR Locational Installed Capacity Requirements LDC Liquidated Damage Contract LFU Load Forecast Uncertainty LNG Liquefied Natural Gas LOLE Loss-of-load expectation LOLP Loss of load probability LOOP Loss of off-site power LRP Long Range Plan LSE Load-serving Entities LTRA Long-Term Reliability Assessment LTSG Long-term Study Group MAAC Mid-Atlantic Area Council Maf Million acre-feet MAIN Mid-America Interconnected Network, Inc. MAPP Mid-Continent Area Power Pool MCRSG Midwest Contingency Reserve Sharing Group MEXW WECC-Mexico (WECC Subregion) MISO Midwest Independent Transmission System Operator MPRP Maine Power Reliability Program MRO Midwest Reliability Organization MVA MegaVolt Ampere Mvar MegaVolt Ampere reactive MW Megawatts (millions of watts) MWEX Minnesota Wisconsin Export NB New Brunswick NDEX North Dakota Export Stability Interface NEEWS New England East West Solution NERC North American Electric Reliability Corporation NIETC National Interest Electric Transmission Corridor NOPSG Northwest Operation and Planning Study Group NORW Northwest (WECC subregion) NPCC Northeast Power Coordinating Council, Inc. NPDES National Pollutant Discharge Elimination System NPPD Nebraska Public Power District NSPI Nova Scotia Power Inc. NTSG Near-term Study Group NWPP Northwest Power Pool Area (WECC subregion) NYISO New York Independent System Operator NYPA New York Planning Authority NYRSC New York State Reliability Council, LLC OASIS Open Access Same Time Information Service

Appendix I: List of Acronyms
NERC | 2013 Long-Term Reliability Assessment | December 2013
Page 169
Abbreviation Term
OATT Open Access Transmission Tariff OP Operating Procedure OPA Ontario Power Authority OPPD Omaha Public Power District ORWG Operating Reliability Working Group OTC Operating Transfer Capability OVEC Ohio Valley Electric Corporation PA Planning Authority PACE PacifiCorp East PAR Phase Angle Regulators PC NERC Planning Committee PCAP Pre-Contingency Action Plans PCC Planning Coordination Committee (of WECC) PJM PJM Interconnection PRB Powder River Basin PRC Public Regulation Commission PRSG Planned Reserve Sharing Group PSA Power Supply Assessment PUCN Public Utilities Commission of Nevada QSE Qualified Scheduling Entities RA Resource Adequacy RAP Remedial Action Plan (of ERCOT) RAR Resource Adequacy Requirement RAS Reliability Assessment Subcommittee RC Reliability Coordinator RCC Reliability Coordinating Committee RFC ReliabilityFirst Corporation RFP Request For Proposal RGGI Regional Greenhouse Gas Initiative RIS Resource Issues Subcommittee RMR Reliability Must Run RMRG Rocky Mountain Reserve Group ROCK Rockies (WECC subregion) RP Reliability Planner RPM Reliability Pricing Mode RRS Reliability Review Subcommittee RSG Reserve Sharing Group RTEP Regional Transmission Expansion Plan (for PJM) RTO Regional Transmission Organization RTP Real-time Pricing RTWG Renewable Technologies Working Group SA Security Analysis SasKPower Saskatchewan Power Corporation SCADA Supervisory Control and Data Acquisition SCC Seasonal Claimed Capability SCD Security Constrained Dispatch SCDWG Short Circuit Database Working Group SCEC State Capacity Emergency Coordinator (of FRCC) SCR Special Case Resources SEMA Southeastern Massachusetts SEPA State Environmental Protection Administration SERC SERC Reliability Corporation SMUD Sacramento Municipal Utility District SOL System Operating Limits SPP Southwest Power Pool SPS Special Protection System SPS Special Protection Schemes SRIS System Reliability Impact Studies SRWG System Review Working Group STATCOM Static Synchronous Compensator STEP SPP Transmission Expansion Plan

Appendix I: List of Acronyms
NERC | 2013 Long-Term Reliability Assessment | December 2013
Page 170
Abbreviation Term
SVC Static Var Compensation TCF Trillion Cubic Feet TFCP Task Force on Coordination of Planning THI Temperature Humidity Index TIC Total Import Capability TID Total Internal Demand TLR Transmission Loading Relief TOP Transmission Operator TPL Transmission Planning TRE Texas Regional Entity TRM Transmission Reliability Margins TS Transformer Station TSP Transmission Service Provider TSS Technical Studies Subcommittee TVA Tennessee Valley Authority UFLS Under Frequency Load Shedding Schemes UVLS Under-voltage load shedding VArb Voltampere reactive VACAR Virginia and Carolinas (subregion of SERC) VER Variable energy resource VSAT Voltage Stability Assessment Tool WALC Western Area Lower Colorado WECC Western Electricity Coordinating Council WTHI Weighted Temperature-Humidity Index WUMS Wisconsin-Upper Michigan Systems

3353 Peachtree Road NE Suite 600, North Tower
Atlanta, GA 30326 (404) 446-2560 | www.nerc.com


![} v } u ] Z À ] } ( } ] Ç · 2018. 11. 28. · s Z ' î ì í í î ì í î î ì í ï î ì í ð î ì í ñ î ì í ò z î ì í í î ì í î î ì í ï î ì í ð î](https://static.documents.pub/doc/80x56/601e1b37d8b1f16a0800f14a/-v-u-z-2018-11-28-s-z-.jpg)
![E } ] ( } í Ç µ v î ì î í r î ì î î](https://static.documents.pub/doc/80x56/61d22598186b7f513908dfef/e-v-r-.jpg)


![$= X &DSWDLQ E ^&^ / v À ] ] } v o µ P î î v t î ï · K o ] À ] D Ì Ì v } · î ï ^^ U î î ì î î ] v } ] · ò î U ^^ î ì î î : } v D D Z } v · ñ K µ ( ] o](https://static.documents.pub/doc/80x56/5fd89c25f3a0516e76322c26/-x-dswdlq-e-v-v-o-p-v-t-k-o-d-oe.jpg)


