83
Social Desirability Bias in Smoking Cessation
i
TITLE: Effects of social desirability bias on self-report and non self-report
assessments during smoking cessation
BY: Jessica Forde, B.S.
2010
DIRECTED BY: Andrew J. Waters, Ph.D.
Associate Professor, Medical and Clinical Psychology
ABSTRACT
Social desirability response bias (SDR) is the tendency of respondents to respond in
a way that will be viewed favorably by others. Little research has examined the
effect of SDR in the context of cigarette smoking cessation. Adult smokers were
recruited for smoking cessation treatment. They completed self-report, biological,
and implicit attitude measures. SDR scores, assessed using the Balanced Inventory
of Desirable Responding (Paulus, 1991), were dichotomized by median split into
LOW (0-12) and HIGH (13+). Compared to LOW participants, HIGH participants
reported lower levels of cigarette craving and more negative attitudes toward
smoking. The groups did not exhibit different implicit attitudes toward smoking.
Averaged over sessions, the correlation between self-reported and implicit attitudes
toward smoking was significant in LOW participants only. In sum, SDR may affect
responses on some self-report measures used in smoking cessation research,
suggesting that researchers should rely more on biological or implicit methods of
assessment.
Social Desirability Bias in Smoking Cessation
ii
EFFECTS OF SOCIAL DESIRABILITY BIAS ON SELF-REPORT
AND NON SELF-REPORT ASSESSMENTS DURING SMOKING CESSATION
BY
JESSICA FORDE
Thesis submitted to the Faculty of the
Department of Medical and Clinical Psychology
Graduate Program of the Uniformed Services University
of the Health Sciences in partial fulfillment of the
requirements for the degree of Master of Science 2010
Social Desirability Bias in Smoking Cessation
iii
Table of Contents
Abstract …………………………………….……………………………………………….i
Title Page …………………………………………………………………………………..ii
Table of Contents …………………………………………………………………………iii
List of Tables ……………………………………………………………….……………..iv
List of Figures …………………………………………………………………..………....v
Introduction ………………………………………………………………………………...1
Specific Aims and Hypotheses ……….………………………………………………...14
Methods …………………………………………………………………………………...16
Procedure ………………………………………………………………………....18
Measures ……………………………..…………………………………………...21
Data Analyses …………………………………………………………………….27
Power Analyses …………………………………………………………………..30
Results ……………………………………………………………………………………..31
Discussion ………………………………………………………………………………...36
Implications ………………………………………………………………………..40
Limitations …………………………………………………………………………41
Future Directions ………………………………………………………………….43
References ………………………………………………………………………………...45
Tables ………………………………………………………………………………………57
Figures ……………………………………………………………………………………..68
Appendices ……………………………………………………………………………….75
Social Desirability Bias in Smoking Cessation
iv
List of Tables
Table 1: Summary of Literature on Associations Between SDR and Self-Report
Measures
Table 2: Study Assessment Timeline
Table 3: Power Calculations
Table 4: Differences in Explicit and Implicit Attitudes Toward Smoking for Low and
High BIDR Participants (Strategy 1)
Table 5: Differences in Self-Report and Biological Measure of Smoking for Low and
High BIDR Participants (Strategy 1)
Table 6: Differences in Self-Reported Craving for Low and High BIDR Participants
(Strategy 1)
Table 7: Correlations Between BIDR Scores and Explicit and Implicit Attitudes
Toward Smoking (Strategy 2)
Table 8: Correlations Between BIDR Scores and Self-Report and Biological
Measures of Smoking (Strategy 2)
Table 9: Correlations Between BIDR and Self-Reported Craving (Strategy 2)
Social Desirability Bias in Smoking Cessation
v
List of Figures
Figure 1: Possible effect of SDR on self-report measures and the association
between self-report and implicit measures (assuming that the effect of SDR is
similar across all participants high in SDR)
Figure 2: Possible effect of SDR on self-report measures and the association
between self-report and implicit measures (assuming that the effect of SDR
varies across participants high in SDR)
Figure 3: Possible effect of SDR on self-report measures and the association
between self-report and implicit measures (assuming that the effect of SDR is
largest in individuals with the most positive “true” attitudes)
Figure 4: Breakdown of study sample from eligibility to laboratory sessions (Week -2
through Quit Day) divided by abstinence and non-abstinence status
Figure 5: Differences in explicit and implicit attitudes for low and high BIDR
participants (Strategy 1)
Figure 6: Relationship between mean explicit and implicit attitudes toward smoking
for low and high BIDR (Strategy 1)
Figure 7: Relationship between mean self-reported smoking and biological measure
of smoking for low and high BIDR (Strategy 1)
Social Desirability Bias in Smoking Cessation 1
Introduction
Response Bias
Response bias is “the systematic tendency to respond to a range of
questionnaire items on some basis other than the specific item content” (Paulhus,
1991, p. 17). Types of response bias include omission bias (Cronbach, 1946),
careless response bias (Meehl & Hathaway, 1946), deviant response bias (Berg,
1967), consistent response bias (Dillehay & Jernigan, 1970), extremity response
bias (tendency to use extreme ratings; Peabody, 1962), acquiescence bias
(tendency to agree; Lentz, 1938), and social desirability response bias (Bernreuter,
1933; Vernon, 1934). Social desirability response bias (SDR) is the tendency of
respondents to respond in a way that will be viewed favorably by the researcher,
within the context of research studies. SDR can threaten validity of research results
and obscure the nature of relationships between the variables of interest. The effect
of SDR may be particularly impactful when assessing topics in which participants
may be motivated to misrepresent self-reported information, such as racism (Sigall &
Page, 1971), religious orientation (Batson, Naifeh, & Pate, 1978), sexual behaviors
(Sprecher, McKinney, & Orbuch, 1987), and drug use (Mieczkowski, 1990).
History of Social Desirability Research
SDR has been one of the most frequently studied response biases for over 50
years. A multitude of scales have been developed to measure SDR, from stand-
alone measures of social desirability (e.g., The Marlowe-Crowne Social Desirability
Scale; Crowne & Marlowe, 1960) to scales built into preexisting measures to correct
for the effects of SDR. Many frequently used personality assessments have scales
Social Desirability Bias in Smoking Cessation 2
built-in to detect deceptive responding, such as the Eysenck Personality
Questionnaire (EPQ; Eysenck & Eysenck, 1975) and the second edition of the
Minnesota Multiphasic Personality Inventory (MMPI-2; Butcher, Dahlstrom, Graham,
Tellegen, & Kaemmer, 1989).
Correlations between SDR measures tend to be low. In addition, factor
analyses strongly suggest that two different constructs are being measured with
SDR (Edwards & Edwards, 1991; Holden & Fekken, 1989; Sakeim & Gur, 1978;
Wiggins, 1964). Impression management (IM) captures the traditional notion of
social desirability, which is the deliberate and intentional attempt to present oneself
in a favorable way. The other construct is self-deceptive positivity (SDP), which is
the unintentional but overly positive presentation of oneself (Meehl & Hathaway,
1946; Sackeim & Gur, 1978). Evidence from factor analyses provide support for two
distinct constructs in SDR (Lanyon & Carle, 2007; Paulhus, 1984), however most
SDR scales currently in use do not specifically distinguish between IM and SDP.
Balanced Inventory of Desirable Responding (BIDR)
In the current study the Balanced Inventory of Desirable Responding (BIDR;
Paulhus, 1988) was chosen to assess SDR. The BIDR was originally developed in
response to the need for a scale that would directly measure both constructs of
SDR. It was based on the earlier work of Sackeim and Gur (1978), who had
proposed the division of the traditional concept of social desirability into conscious
(“other”) deception and unconscious (“self”) deception (Gur & Sackeim, 1979;
Sackeim & Gur, 1978).
Social Desirability Bias in Smoking Cessation 3
The BIDR consists of two subscales of 20 items each, an Impression
Management (IM) subscale and a Self-deceptive Enhancement (SDE) subscale.
Sample items of the IM subscale include „„I have received too much change from a
salesperson without telling him or her‟‟ and „„I have some pretty awful habits.‟‟
Sample items of the SDE subscale include „„I have not always been honest with
myself‟‟ and „„I never regret my decision.‟‟ Participants rate their agreement with
statements about themselves on a 7-point Likert scale, with 1 indicating not true and
7 indicating very true. The scales are counterbalanced with equal numbers of
positively and negatively keyed items. The BIDR can be scored either
dichotomously, with one point being given to responses of 6 or 7, or scored
continuously in which the raw score is used. It can yield an IM score, an SDE score,
or a combined total score of all 40 items (Paulhus, 1988).
Relationship with other measures of social desirability. The IM scale of
the BIDR has been found to positively correlate with commonly used lie scales.
Davies, French, and Keogh (1998) reported a correlation of .61 between the BIDR
IM scale and the lie scale of the revised Eysenck Personality Questionnaire (EPQ-
R), and the BIDR IM scale has been found to correlate highly with the MMPI-2 L
Scale (Paulhus, 1991). The Marlowe-Crown Social Desirability Scale (MCSDS;
Crowne & Marlowe, 1960), the most widely used measure of SDR, has been shown
to correlate at a level of .71 with the overall score of the BIDR (Paulhus, 1991). The
MMPI-2 K scale, which was designed as a subtle measure of SDR, is one of the few
scales to correlate significantly with the SDE scale of the BIDR (Paulhus, 1991).
Social Desirability Bias in Smoking Cessation 4
SDR and Self-report Measures
Research suggests that SDR can affect a variety of self-report measures,
such as self-reported behavior and self-reported attitudes or affect (Adams et al.,
2005; Bardwell & Dimsdale, 2008; Marissen, Franken, Blanken, van den Brink, &
Hendriks, 2005). Many behaviors and attitudes are socially driven, in that society is
more supportive of one behavior or attitude over another. In assessing these
behaviors and attitudes, self-report measures are likely to be affected by SDR and
influence interpretations of responses (Paulhus, 1991).
In the review of SDR studies below (see Table 1), the focus was on those
studies which examined both the relationship between SDR and self-report (SR)
measures (e.g., mood, craving) and the relationship between SDR and a non self-
report (NSR) measures (i.e., biological or implicit measures). These studies were
chosen because they enabled a comparison of the differential effects of SDR on SR
and NSR measures. Biological measures assess markers in the body and implicit
measures assess automatic cognitions, both of which should be outside the
conscious control of the participant. Therefore, examining these types of measures
is informative to understand whether SDR has the same effect on these measures
as it does on SR measures.
These articles were located through key word searches of SDR measures
and through searching relevant citations from articles located. Databases included
PsychInfo, Pubmed, and Google Scholar and was open to articles from 1900-
current. Studies were excluded that only looked at the effect of SDR on either SR or
NSR measures. To the best of the author‟s knowledge, the studies in Table 1
Social Desirability Bias in Smoking Cessation 5
represent the extent of literature available that has compared the effect of SDR on
SR and NSR measures. Some of the studies included in Table 1 also examined
whether SDR moderated the association between SR and NSR measures; however
this area of study is rather limited and is represented by the few studies in Table 1.
Previous research on these relationships is discussed below.
Influence of SDR on Self-reported Behavior
It has been long suspected that individuals are not always honest in self-
reported behavior, particularly when the behavior has the potential for social
disapproval (Crowne & Marlowe, 1960; Edwards, 1953, 1957). Adams et al. (2005)
examined the relationship between self-reported physical activity and objective
measures of physical activity to determine the role social desirability may play in
moderating the relationship between the two variables (see Table 1). Their results
indicated that discrepancies between the two activity reports were significantly
affected by social desirability scores and resulted in over-reporting of self-reported
activity energy expenditure and duration. Similarly, Ewert and Galloway (2009)
suggested that inconsistencies between expressed environmental concern and
actual environmental behaviors may be the result of social pressures to present a
positive expressed attitude toward environmental issues. However, an empirical
study has yet to be conducted to systematically examine this hypothesis. As these
highlighted studies suggest, SDR can potentially affect self-reported behavior in a
variety of research areas and complicate the interpretation of data. These results
underscore the importance of continued study of the utility of social desirability
scales.
Social Desirability Bias in Smoking Cessation 6
Influence of SDR on Self-reported Attitudes and Cognitions
Research also suggests that SDR can have a significant effect on self-
reported attitudes and thoughts, particularly ones which are driven by social
approval. SDR has been reported to be associated with self-reported attitudes and
cognitions, such as craving for drugs (Marissen et al., 2005; Rohsenow et al., 1992),
negative affect (Bardwell & Dimsdale, 2001; Klassen, Hornstra, & Anderson, 1975),
well-being (Diener, Suh, Smith, & Shao, 1995; Kozma & Stones, 1986), and self-
esteem (Mesmer-Magnus, Viswesvaran, Deshpande, & Joseph, 2006; Riketta,
2005). In light of this potential bias on self-report measures, research in recent
years has focused on finding measures which may be unaffected by SDR.
Influence of SDR on Implicit Measures of Attitudes and Cognitions
Research on the effect of SDR on self-reported behavior, attitudes, and
cognitions suggests that self-report assessments are limited by susceptibility to
impression management. Implicit measures are hypothesized to tap into thoughts
and feelings that may not be accessible to the individual and are, theoretically,
outside the realm of conscious control (Greenwald, McGhee, & Schwartz, 1998).
Dual process models of information processing posit that individuals process
information both in a controlled, deliberate manner as well as in a more automatic,
intuitive manner. These processes are thought to occur in parallel, and automatic
processes are hypothesized to occur rapidly without conscious awareness. Explicit,
or traditional self-report measures, are hypothesized to assess controlled processes,
whereas implicit measures are thought to assess automatic processes (Epstein,
Social Desirability Bias in Smoking Cessation 7
1994; Smith & DeCoster, 2001; Wilson, Lindsey, & Schooler, 2000). Therefore,
implicit measures may be less sensitive to SDR bias, particularly the conscious,
impression management component of SDR.
Little research has been conducted to examine the effect of SDR on implicit
measures or the effect of SDR on the relationship between self-report and implicit
measures. Historically, weak correlations have been reported between implicit and
explicit measures of the same constructs. One meta-analysis, which examined the
relationship between the Implicit Association Test and a variety of construct-related
self-report measures, reported a mean correlation (r) of .24 between the implicit and
explicit measures (Hofmann, Gawronski, Gschwendner, Le, & Schmitt, 2005). One
potential reason for this discrepancy which has been suggested is the differential
effect of SDR on automatic vs. controlled information processes. However, only a
few studies have been conducted to directly examine this question.
Egloff and Schmukle (2003) conducted a study to examine the role of social
desirability in the relationship between implicit and explicit measures of anxiety in
university students. Measures used were the State-Trait-Anxiety-Inventory (STAI;
Spielberger, Gorsuch, & Lushene, 1970), an Anxiety Implicit Association Test (IAT;
Greenwald et al., 1998), and the revised Social Desirability Scale-17 (SDS-17R;
Stoeber, 2001). As expected, SDS was not associated with the anxiety IAT effect. It
was hypothesized that scores on a social desirability scale would moderate the
relationship between implicit and explicit anxiety, however analyses indicated that
social desirability scores did not significantly moderate the association between the
implicit and explicit measures of anxiety.
Social Desirability Bias in Smoking Cessation 8
In their follow-up study, Egloff and Schmukle (2003) investigated whether
SDR would moderate the association between the implicit and explicit measures
when the two constructs of the BIDR were analyzed separately. For this study, the
STAI and explicit ratings of the IAT were used as the explicit measures, the IAT was
used as the implicit measure, and the Impression Management (IM) and Self-
Deceptive Enhancement (SDE) scales of the BIDR were used to measure social
desirability. Again, the SDR measures were not associated with the anxiety IAT
effect. In addition, the SDR measures did not significantly moderate the association
between the implicit and explicit measures.
It might be suggested that the topic of anxiety may not be socially driven
enough for the effects of SDR to be detected, particularly in the sample of university
students used in the Egloff and Schmukle (2003) studies. Additional research is
needed to examine the associations between SDR and implicit/explicit measures,
using a construct in which individuals may be more motivated to skew or
misrepresent their self-reported attitudes.
One research area that does have significant risk of SDR bias, the reporting
of drug use behavior, attitudes, and cognitions, has been examined in one study.
Marissen et al. (2005) examined the relationship between self-reported craving and
physiological responses to heroin cues in abstinent heroin abusers. Previous
research has reported low correlations between these two cue reactivity measures
(Robbins, Ehrman, Childress, & Obrien, 1997; Tiffany, 1990), which is similar to low
reported correlation between implicit and explicit measures. In this study, three self-
report measures of drug craving were utilized and compared with a measure of skin

Social Desirability Bias in Smoking Cessation 9
conductance to assess physiologic reactivity. The data indicated an association
between SDR and self-reported drug craving, revealing that social desirability
influences explicit measures of drug craving. Participants who had higher scores on
the SDR scale had significantly lower self-reported drug craving ratings, suggesting
that those individuals higher in SDR may underreport their true levels of drug
craving. While physiological measures are not implicit measures, in the traditional
definition of such, they are measures which should be outside the individual‟s control
and, therefore, should be less susceptible to conscious manipulation. Marissen et
al. (2005) did not find an association between SDR and the physiologic measure of
craving (i.e., skin conductance), indicating that the physiological measures used in
the study did not appear to be affected by SDR. As in the Egloff and Schmukle
(2003) study, SDR did not moderate the association between SR and NSR
measures (in this study, the self-reported craving and physiologic response).
Marissen et al. (2005) emphasized the importance of future research to further
illuminate the role that SDR may have in information reporting, particularly in socially
unacceptable behavior such as drug use.
SDR in Cigarette Smoking Cessation Research
Issues related to SDR are relevant in cigarette smoking research as well. As
smoking becomes less and less socially accepted, the incentive to misreport
smoking status or under-report use increases (Swanson, Rudman, & Greenwald,
2001; Sherman, Rose, & Koch, 2003). It has been suggested in previous studies
that the weak relationship between implicit and explicit attitudes toward cigarette
smoking is a result of efforts to consciously control explicit attitudes because of the
Social Desirability Bias in Smoking Cessation 10
stigmatization of smoking behavior in modern society (Swanson et al., 2001;
Sherman et al., 2003). Little research, however, has directly examined this
hypothesis. One area in smoking research for which SDR is particularly relevant is
tobacco use in pregnant women.
In a study by Boyd, Windsor, Perkins, and Lowe (1998), self-reported
smoking status was compared with status determined by salivary cotinine levels to
evaluate misclassifications rates of smoking status. Cotinine is the primary
metabolite of nicotine (the primary drug of addiction in tobacco), and therefore allows
for a physiologic measure of nicotine intake. Salivary cotinine is commonly used in
smoking research to validate self-reported use and abstinence, because it provides
an accurate measure of cigarette smoking (Ossip-Klein, et al., 1996). In the Boyd et
al. (1998) study, the misclassification rate for self-reported nonsmokers was 26.2%
based on cotinine levels. This value was compared to the 0-9% misclassification
rate found in the general public. Although SDR was not measured in this study, the
authors‟ interpretation of these results was that the significant increase in
misclassification might have been the result of social desirability bias, considering
the presence of strong negative societal opinions toward smoking during pregnancy
(Boyd et al., 1998). Presumably, those individuals who score highest on a measure
of SDR would be those who would be most likely to misreport their smoking.
Similarly, in a meta-analysis of assessment accuracy in adolescent smoking
conducted by Dolcini, Adler, and Ginsberg (1996), the authors examine factors that
might potentially influence the correlation between self-reported smoking and
biological markers of tobacco use in an adolescent population (e.g., cotinine, breath
Social Desirability Bias in Smoking Cessation 11
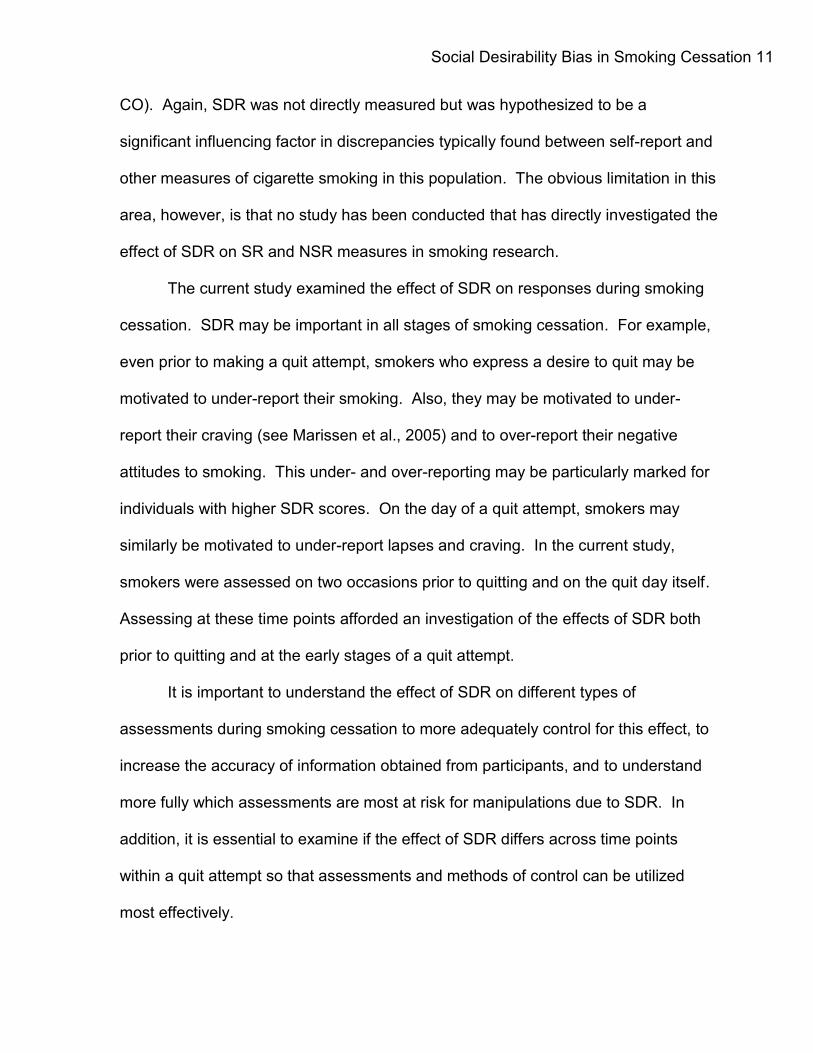
CO). Again, SDR was not directly measured but was hypothesized to be a
significant influencing factor in discrepancies typically found between self-report and
other measures of cigarette smoking in this population. The obvious limitation in this
area, however, is that no study has been conducted that has directly investigated the
effect of SDR on SR and NSR measures in smoking research.
The current study examined the effect of SDR on responses during smoking
cessation. SDR may be important in all stages of smoking cessation. For example,
even prior to making a quit attempt, smokers who express a desire to quit may be
motivated to under-report their smoking. Also, they may be motivated to under-
report their craving (see Marissen et al., 2005) and to over-report their negative
attitudes to smoking. This under- and over-reporting may be particularly marked for
individuals with higher SDR scores. On the day of a quit attempt, smokers may
similarly be motivated to under-report lapses and craving. In the current study,
smokers were assessed on two occasions prior to quitting and on the quit day itself.
Assessing at these time points afforded an investigation of the effects of SDR both
prior to quitting and at the early stages of a quit attempt.
It is important to understand the effect of SDR on different types of
assessments during smoking cessation to more adequately control for this effect, to
increase the accuracy of information obtained from participants, and to understand
more fully which assessments are most at risk for manipulations due to SDR. In
addition, it is essential to examine if the effect of SDR differs across time points
within a quit attempt so that assessments and methods of control can be utilized
most effectively.
Social Desirability Bias in Smoking Cessation 12
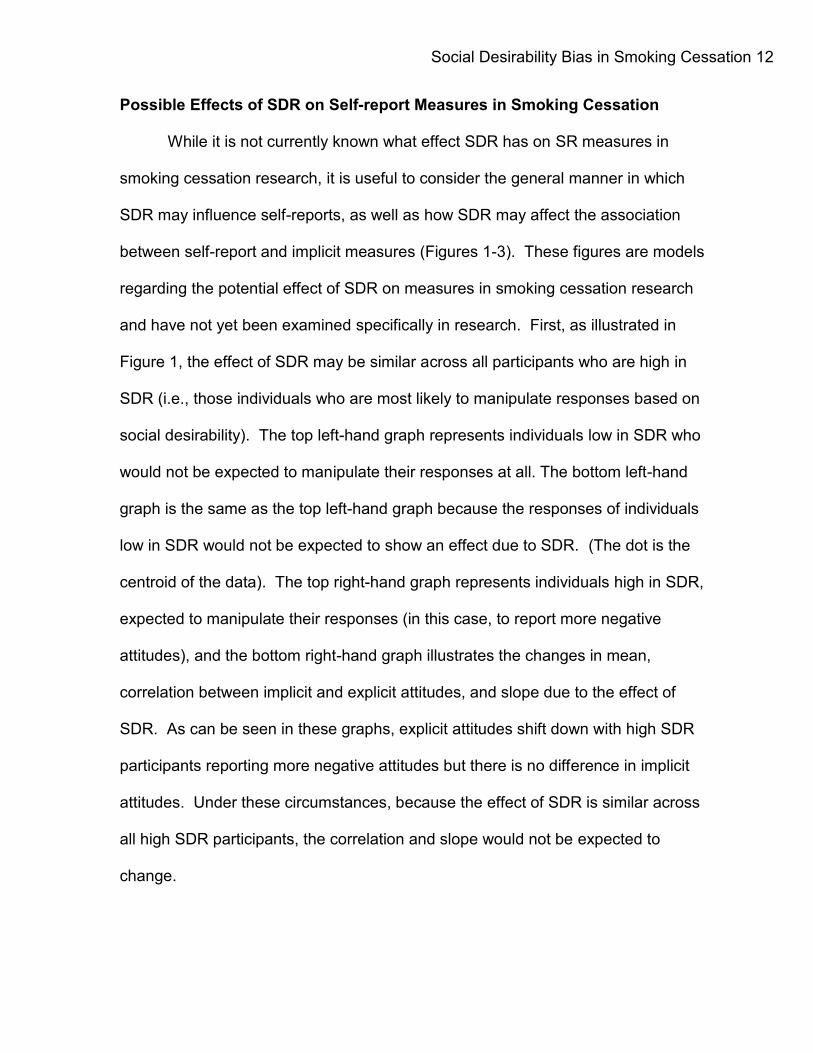
Possible Effects of SDR on Self-report Measures in Smoking Cessation
While it is not currently known what effect SDR has on SR measures in
smoking cessation research, it is useful to consider the general manner in which
SDR may influence self-reports, as well as how SDR may affect the association
between self-report and implicit measures (Figures 1-3). These figures are models
regarding the potential effect of SDR on measures in smoking cessation research
and have not yet been examined specifically in research. First, as illustrated in
Figure 1, the effect of SDR may be similar across all participants who are high in
SDR (i.e., those individuals who are most likely to manipulate responses based on
social desirability). The top left-hand graph represents individuals low in SDR who
would not be expected to manipulate their responses at all. The bottom left-hand
graph is the same as the top left-hand graph because the responses of individuals
low in SDR would not be expected to show an effect due to SDR. (The dot is the
centroid of the data). The top right-hand graph represents individuals high in SDR,
expected to manipulate their responses (in this case, to report more negative
attitudes), and the bottom right-hand graph illustrates the changes in mean,
correlation between implicit and explicit attitudes, and slope due to the effect of
SDR. As can be seen in these graphs, explicit attitudes shift down with high SDR
participants reporting more negative attitudes but there is no difference in implicit
attitudes. Under these circumstances, because the effect of SDR is similar across
all high SDR participants, the correlation and slope would not be expected to
change.
Social Desirability Bias in Smoking Cessation 13
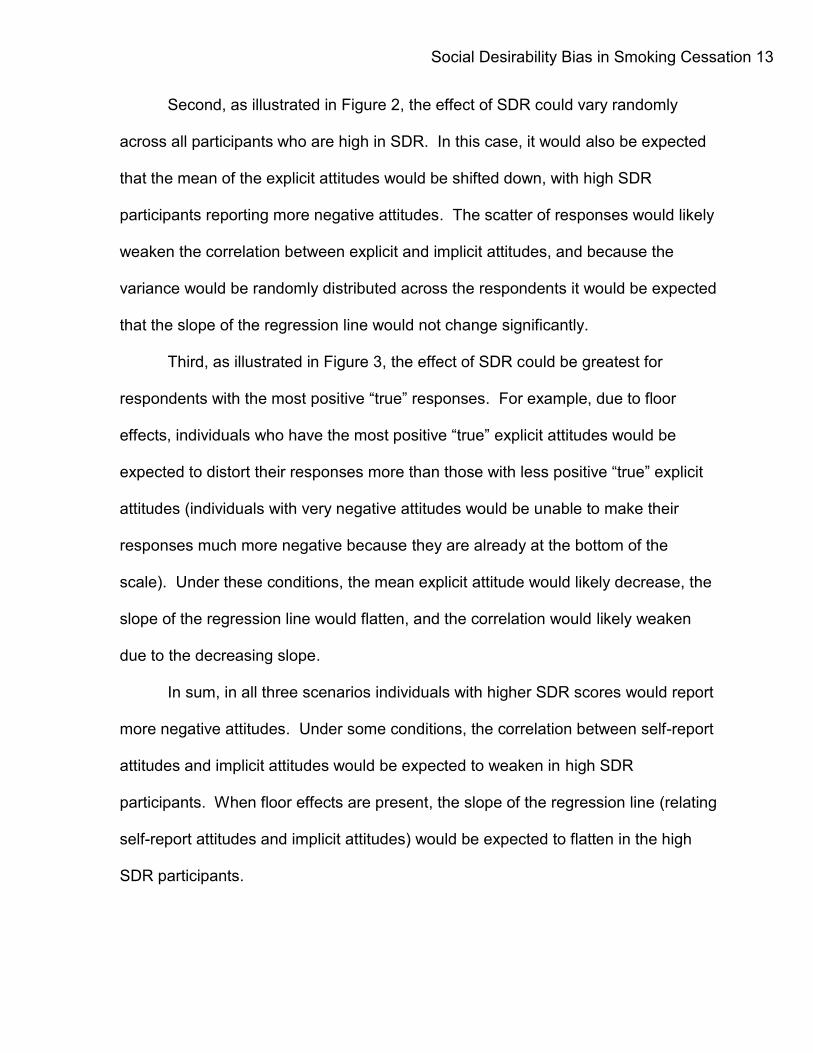
Second, as illustrated in Figure 2, the effect of SDR could vary randomly
across all participants who are high in SDR. In this case, it would also be expected
that the mean of the explicit attitudes would be shifted down, with high SDR
participants reporting more negative attitudes. The scatter of responses would likely
weaken the correlation between explicit and implicit attitudes, and because the
variance would be randomly distributed across the respondents it would be expected
that the slope of the regression line would not change significantly.
Third, as illustrated in Figure 3, the effect of SDR could be greatest for
respondents with the most positive “true” responses. For example, due to floor
effects, individuals who have the most positive “true” explicit attitudes would be
expected to distort their responses more than those with less positive “true” explicit
attitudes (individuals with very negative attitudes would be unable to make their
responses much more negative because they are already at the bottom of the
scale). Under these conditions, the mean explicit attitude would likely decrease, the
slope of the regression line would flatten, and the correlation would likely weaken
due to the decreasing slope.
In sum, in all three scenarios individuals with higher SDR scores would report
more negative attitudes. Under some conditions, the correlation between self-report
attitudes and implicit attitudes would be expected to weaken in high SDR
participants. When floor effects are present, the slope of the regression line (relating
self-report attitudes and implicit attitudes) would be expected to flatten in the high
SDR participants.
Social Desirability Bias in Smoking Cessation 14
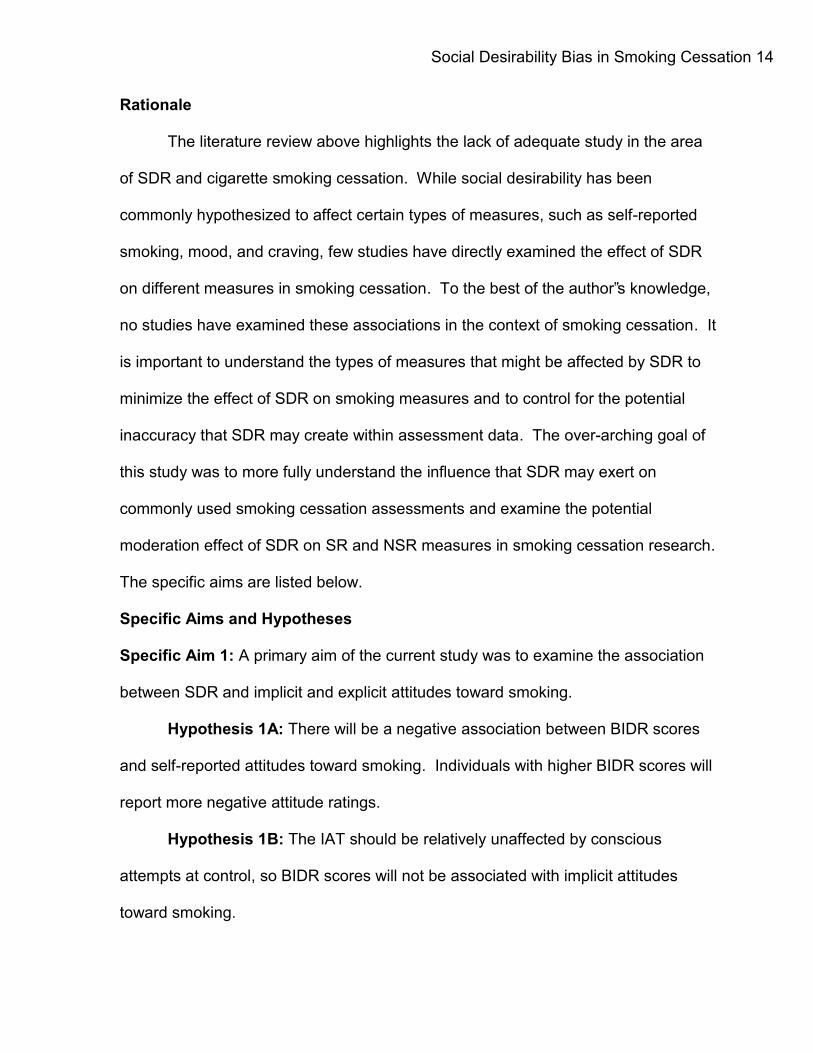
Rationale
The literature review above highlights the lack of adequate study in the area
of SDR and cigarette smoking cessation. While social desirability has been
commonly hypothesized to affect certain types of measures, such as self-reported
smoking, mood, and craving, few studies have directly examined the effect of SDR
on different measures in smoking cessation. To the best of the author‟s knowledge,
no studies have examined these associations in the context of smoking cessation. It
is important to understand the types of measures that might be affected by SDR to
minimize the effect of SDR on smoking measures and to control for the potential
inaccuracy that SDR may create within assessment data. The over-arching goal of
this study was to more fully understand the influence that SDR may exert on
commonly used smoking cessation assessments and examine the potential
moderation effect of SDR on SR and NSR measures in smoking cessation research.
The specific aims are listed below.
Specific Aims and Hypotheses
Specific Aim 1: A primary aim of the current study was to examine the association
between SDR and implicit and explicit attitudes toward smoking.
Hypothesis 1A: There will be a negative association between BIDR scores
and self-reported attitudes toward smoking. Individuals with higher BIDR scores will
report more negative attitude ratings.
Hypothesis 1B: The IAT should be relatively unaffected by conscious
attempts at control, so BIDR scores will not be associated with implicit attitudes
toward smoking.
Social Desirability Bias in Smoking Cessation 15
Hypothesis 1C: Scores on the explicit and implicit measures of attitudes
toward smoking will be weakly associated, and this association will be moderated by
scores on the BIDR. Specifically, as BIDR scores increase, the association between
explicit and implicit attitudes will weaken.
Specific Aim 2: A secondary aim of the current study was to examine the
association between SDR and reported smoking.
Hypothesis 2A: A negative association will be found between BIDR scores
and self-reported smoking. Individuals with higher BIDR scores will report that they
have smoked less.
Hypothesis 2B: Biological measures of smoking are not within the control of
participants. Therefore, BIDR scores will not be associated with cotinine levels in
saliva.
Hypothesis 2C: Self-reported smoking and biological measures of smoking
will be associated and this association will be moderated by BIDR scores.
Specifically, as BIDR scores increase, the association between self-reported use
and salivary cotinine will weaken.
Specific Aim 3: A tertiary aim of the current study was to examine the association
between SDR and self-reported craving for cigarettes at the time of the assessment.
Hypothesis 3A: There will be a negative association between BIDR scores
and self-reported craving. Individuals with higher BIDR scores will report lower
craving ratings.
The literature has suggested that SR measures may be more susceptible to
the effects of SDR than biological or implicit measures; however no studies have
Social Desirability Bias in Smoking Cessation 16
directly examined this relationship within the context of smoking cessation. It is
hypothesized that individuals higher in SDR will be motivated to under-report levels
of craving and rates of smoking and over-report negative attitudes toward smoking
because that would be most socially desirable within the context of smoking
cessation. However, individuals should not have control over implicit or biological
measures, so these measures should be unaffected by level of SDR. Also, previous
studies have failed to find a moderation effect of SDR on the relationship between
SR and NSR measures, so it is important to determine if there is such an effect of
SDR and if SDR is a potential explanation for the low levels of association
sometimes found between SR and NSR measures.
Methods
Parent study
The current study conducted analysis of adult smokers, recruited from the
Houston, Texas, metropolitan area, who were enrolled in a smoking cessation study.
The over-arching goal of the parent study is to examine the associations between
performance on cognitive assessments and subsequent relapse to smoking. The
parent study was approved by the Institutional Review Board of The University of
Texas, M. D. Anderson Cancer Center and by the USUHS IRB (see Appendix A for
IRB approval documents from M. D. Anderson and USUHS).
Participants
Participants for the parent study were 183 adult community-based cigarette
smokers in the Houston metropolitan area recruited via advertisements for smoking
cessation treatment. Participants were paid $25 for an orientation session, $50 for
Social Desirability Bias in Smoking Cessation 17
five laboratory sessions, and $15 for two phone assessments. Participants could
also optionally participate in a week-long ancillary study following their quit day in
which they completed daily random assessments on a personal digital assistant
(PDA). For these assessments, participants received $2.50 for each assessment
they completed. To qualify for the parent study, participants had to be 18-65 years
old; be a current smoker with a history of at least 10 cigarettes per day for the last
year; be motivated to quit within the next four weeks; have a home address and a
functioning home telephone number; be able to speak, read, and write in English at
an eight-grade literacy level; and have English as the first language.
Exclusion criteria included active substance abuse or dependence (other than
cigarettes); regular use of tobacco products other than cigarettes (cigars, pipes,
smokeless tobacco); use of nicotine replacement products; another household
member enrolled in the study; self-reported color-deficiency; breath CO < 10 ppm
(standard cut-off level indicating regular cigarette use; SRNT, 2002); pregnant or
breast feeding; indication of a current suicidal ideation or depression, as defined by
endorsement of at least "Several Days" for the item assessing suicidal ideation (item
2i) on the Patient Health Questionnaire (PHQ; Spitzer, Kroenke, Williams, 1999) or
endorsement of at least "More than half the days" on at least five of the PHQ items
which assess depressive symptoms (2a-h); or any other factor that, in the judgment
of the investigators, would likely preclude completion of the protocol (e.g., a physical
limitations that would hinder participant‟s ability to complete computerized tasks).
These criteria are based on prior research in smoking cessation (e.g., Waters et al.,
2007).
Social Desirability Bias in Smoking Cessation 18
Participants averaged 43.39 years of age (SD = 11.60), and 51 percent were
women. They smoked an average of 20.65 cigarettes per day (SD = 8.85) at
enrollment. Mean level of nicotine dependence, as assessed by scores on the
Fagerstrom Test of Nicotine Dependence (FTND; Heatherton, Kozlowski, Frecker, &
Fagerstrom, 1991), was 5.37 out of a possible 10 (SD = 2.28) indicating medium to
high nicotine dependence by standard cut-off scores (Heatherton et al., 1991).
Mean baseline breath CO level was 23.80 ppm (SD = 10.83), indicating that these
participants were heavy smokers, by the standard cut-off score of 10 ppm for a
regular smoker (SRNT, 2002).
Procedure
Participants were first screened via a phone interview in which a tobacco
history and demographic information were obtained and it was determined whether
they met inclusion/exclusion criteria. Upon preliminary qualification, participants
were asked to come in for the orientation session in which breath CO was measured
with a CO monitor and they completed the following measures to assess
qualification for enrollment in the study: the Rapid Estimate of Adult Literacy in
Medicine (REALM; Davis et al., 1991), the Shipley Institute in Living Scale (SILS;
Shipley, 1940), the Patient Health Questionnaire (PHQ; Spitzer, Kroenke, Williams,
1999),Section K (Non-alcohol psychoactive substance use disorders) of the Mini
International Neuropsychiatric Interview (MINI; Sheehan, et al., 1998), and the
Alcohol Use Disorders Identification Test (AUDIT; Saunders, Aasland, Babor, de la
Fuente, & Grant, 1993) to assess for alcohol use.

Social Desirability Bias in Smoking Cessation 19
At each of the five sessions, partipants completed a battery of computerized
cognitive tasks and questionnaires, including both self-report measures and explicit
and implicit cognitive tasks. Of interest in the current study are the Semantic
differential scale (SDS; Swanson et al., 2001), the Questionnaire of Smoking Use
(QSU; Cox, Tiffany, & Christen, 2001), and the Implicit Association Test (IAT;
Greenwald et al., 1998), all of which were administered at each of the laboratory
sessions. The sessions consisted of two pre-quit sessions (once when overnight
deprived of smoking and once when smoking normally), the quit day, one week after
the quit day, and at the end of treatment (one month). Biological measures of
smoking, cotinine and breath CO, were also collected at each of these sessions.
Table 2 shows the schedules for those assessments that were analyzed in the
current study.
Of the 183 individuals who attended an orientation session, 146 completed
the BIDR. The majority (n=120) completed the BIDR during one of the lab sessions.
Twenty-four completed the BIDR through the online survey tool or the mail after they
had concluded participation in the study. Two participants completed the BIDR but
the method of administration could not later be verified. Of the 146 participants who
completed the BIDR, 113 were eligible for the study (i.e., completed the orientation
session and signed the informed consent) and 33 were ineligible. The final sample
included 103 participants who had completed the BIDR and at least one laboratory
session (not including the orientation) (see Figure 4). Participants included in the
final sample were not significantly different from excluded individuals on any of the
baseline or demographic variables, including age, gender, race, nicotine
Social Desirability Bias in Smoking Cessation 20
dependence, motivation to quit smoking, or confidence in quitting smoking (all ps >
.10).
Treatment
Treatment consisted of self-help materials and smoking cessation counseling.
All participants received the same treatment.
Self-help materials. Participants received a standardized self-help manual
that utilizes a standard relapse prevention/coping skills approach. It is written at a
sixth grade reading level (U.S. Department of Health and Human Service, 2000).
Smoking cessation counseling. Counseling was based on standard and
recommended smoking cessation/relapse prevention procedures as described in
Treating Tobacco Use and Dependence Clinical Practice Guideline (Fiore et al.,
2006) and provided by one of two of the study‟s licensed, Master‟s-level counselors.
Counseling included: identifying high risk situations; coping with negative
affect/stress; weight management; techniques for obtaining social support; coping
with a partner/spouse who smokes; keys to success; relaxation techniques; and
coping with a lapse. Counselors integrated these topics into an overarching coping
skills/problem solving framework that was guided by each individual‟s unique
barriers and high-risk situations. Counseling sessions lasted approximately 10-20
minutes and occurred during the laboratory sessions.
Pharmacotherapy. Participants were instructed that they should not take
any pharmacotherapy during the course of the study.

Social Desirability Bias in Smoking Cessation 21
Measures
Orientation measures
The Rapid Assessment of Adult Literacy in Medicine. The REALM is a
screening instrument that assesses the ability to pronounce 66 common medical
words and body parts. It takes approximately 2-3 minutes to administer and score,
is highly correlated with other diagnostic literacy instruments, and has high validity
and reliability, with a test-retest reliability of .99 (Davis et al., 1991).
The Shipley Institute in Living Scale. The SILS is a widely used measure
that provides an estimate of a participant's IQ. It is composed of a vocabulary test in
which participants must identify out of a list of words which one means “the same or
nearly the same” as a target word. It also has an Abstract Thinking Test in which
participants must logically complete the provided sentence with numbers or letters.
It takes approximately 15-20 minutes to complete and 5 minutes to score (Shipley,
1940). Reliability is high with coefficients above .80 (Shipley, 1940), and it has
predictive validity with other measures of intelligence (Zachary, Paulson, & Gorsuch,
1985).
The Patient Health Questionnaire. The PHQ is a self-administered
diagnostic instrument that assesses mood, anxiety, alcohol, and recent psychosocial
stressors using the diagnostic criteria of the DSM-IV. The PHQ has diagnostic
validity and has high levels of agreement with independent diagnoses made by
mental health professionals (Spitzer et al., 1999).
The Mini International Neuropsychiatric Interview. The MINI is a brief,
self-report measure of psychiatric symptoms. Section K was used to assess non-
Social Desirability Bias in Smoking Cessation 22
alcohol drug abuse/dependence. It has good interrater reliability (kappas of .79 to
1.00 across scales) and test-retest reliability (kappas of .52 to 1.00 across scales),
as well as strong validity with other structured psychiatric interviews and high levels
of agreement with independent diagnoses made by mental health professionals
(values of .50 to .90 across scales) (Sheehan et al., 1998).
The Balanced Inventory of Desirable Responding. The BIDR is a 40-item
questionnaire that assesses Self-deceptive Enhancement (the tendency to give self-
reports that are honest but positively biased; SDE), and Impression Management
(deliberate self-presentation to an audience; IM) (Paulhus 1988). The BIDR can be
scored either dichotomously, with one point being given to responses of 6 or 7, or
scored continuously in which the raw score is used. It can yield an IM score, an
SDE score, or a combined total score of all 40 items. Research suggests that the
continuous scoring system yields higher validity and reliability, as well as convergent
validity with other SDR measures (Stober et al., 2002). Paulhus (1988) reported
coefficient alpha values of internal consistency ranging from .68 to .80 for SDE, .75
to .86 for IM, and .83 for the summed SD score. Test-retest correlations were
reported as .69 (SDE) and .65 (IM) over a 5-week period (Paulhus, 1988). Validity
correlates reported by Lanyon and Carle (2007) ranged from .30 to .58 and suggest
the scales have moderate divergent validity. In another study, a correlate of .18 was
reported, suggesting even stronger divergence (Davies et al., 1998). In a reliability
generalization study, Li and Bagger (2007) reported mean reliability estimates of .68
for SDE scores, .74 for IM scores, and .80 for overall scores; these estimates are
Social Desirability Bias in Smoking Cessation 23
comparable to those reported of other commonly used social desirability scales
(Beretvas, Meyers, & Leite, 2002).
Self-report Measures of Nicotine Use
Smoking diary. Self-reported smoking rate (number of cigarettes per day)
was recorded daily by participants on a smoking diary and was reported each week
at the laboratory session.
Biological Measures of Nicotine Use
Salivary cotinine. Cotinine is the primary metabolite of nicotine, and because
of cotinine‟s long half-life (approximately 17 hours), it can measure the intake of
nicotine over 2-3 days prior to collection. It is a common measure used to validate
self-reported abstinence and is considered the “gold standard” for measuring
nicotine exposure, with sensitivity and specificity levels over 90% (Ossip-Klein, et al.,
1996; SRNT Subcommittee for Biochemical Verification, 2002). Salivary cotinine
levels were measured through an enzyme immunoassay conducted by Salimetrics,
LLC in State College, PA.
Breath CO. Exhaled carbon monoxide (CO) levels were measured with a CO
monitor (Vitalograph, Lexena, KS) and were obtained at the beginning of each
experimental session. On the experimental session that required overnight tobacco
abstinence, participants had to have a CO level of less than or equal to 10 ppm,
because this level distinguishes between regular smokers and non-smokers (SRNT,
2002). Standard procedures were followed for maintenance of the CO monitor. The
monitor was calibrated from a cylinder of research gas with a known CO
concentration (about 50 ppm) every month (SRNT, 2002). Breath CO is a reliable
Social Desirability Bias in Smoking Cessation 24
and inexpensive measurement of smoke exposure (SRNT, 2002; Stewart, Stewart,
Stamm, & Seclen, 1976).
Explicit Cognitive Tasks
Semantic differential scale. The SDS is a measure of self-reported attitudes
to smoking. The measure consists of six semantic differential items which polar-
opposite adjective pairs (e.g., good-bad, ugly-beautiful) are presented to
participants. Items are rated for the concept of smoking on a 7-point scale, and
composite scores are calculated by scoring the 7-point scale from -3 to +3 and
summing the ratings (Swanson et al., 2001). SDS scales are reasonably accurate
and have strong associations with other measures that assess the same attitude
construct (Heise, 1969).
The Questionnaire of Smoking Urges. The QSU-Brief is a 10-item measure
of self-reported craving and was used to assess craving at the time of the test. It
provides two factor scores. Factor 1 reflects the participant‟s intention and desire to
smoke and anticipation of pleasure from smoking, and Factor 2 is indicative of the
participant‟s anticipation of relief from negative affect and nicotine withdrawal and
urgent need to smoke. A total score of the two factors can also be computed, and
this value was used in the current analyses (Cox et al., 2001). The QSU is sensitive
to abstinence and exposure to smoking-related cues (Morgan, Davies, & Willner,
1999), and has strong internal consistency (alpha of .97 for the total score) (Cox et
al., 2001).
Social Desirability Bias in Smoking Cessation 25
Implicit Cognitive Tasks
Implicit Association Task. The IAT is an implicit measure of attitude, as
measured through the strength of mental associations between two concepts.
Recent research has examined implicit attitudes of adult smokers and suggests that
implicit attitudes vary between smokers and non-smokers (Swanson et al. 2001), as
well as between smokers with different levels of nicotine dependence (Sherman et
al., 2003; Waters et al., 2007). Smokers with higher levels of nicotine dependence
have a less negative implicit attitude toward smoking (weaker association between
smoking and bad) than smokers with lower levels of nicotine dependence or non-
smokers (Waters et al., 2007). There is substantial support for the validity and
reliability of the IAT across multiple constructs, including smoking cessation
(Cunningham, Preacher, & Banaji, 2001).
Description of the IAT is taken from previous studies that have used the IAT
in smoking cessation research (Waters et al., 2010; Waters et al., 2007; Swanson et
al., 2001). In the current study, associations between smoking/not smoking and
good/bad were examined. The IAT consisted of seven blocks: (B1) Practice of
single categorization for the target concept (e.g., smoking / not smoking); (B2)
Practice of single categorization for the attribute concept (e.g., positive / negative);
(B3) Practice of combined categorization task (e.g., smoking + positive / not smoking
+ negative); (B4) Critical trials for the block 3 combined categorization; (B5) Practice
of single categorization for the target concept but with the response keys reversed
from the B1 assignment (e.g., not smoking / smoking); (B6) Practice of combined
categorization task (e.g. not smoking + positive / smoking + negative); (B7) Critical
Social Desirability Bias in Smoking Cessation 26
trials for the block 6 categorization task. The order of completion of the combined
categorization blocks (i.e., B3, B4, and B6, B7) was counterbalanced across
participants.
Following Swanson et al. (2001), pictures were used to capture the target
concepts of smoking vs. not smoking (see Appendix B for sample pictures used in
this study). For example, a smoking picture depicted cues for smoking (e.g., an
adult smoking), whereas a not smoking picture depicted the same scene but without
the smoking cues (e.g., an adult who is not smoking). Words were used to capture
positive and negative categories (Swanson et al., 2001). Positive words included
nice, pleasant, good; negative words include nasty, unpleasant, and bad. On each
trial, a stimulus (word or picture) was presented in the center of a computer monitor.
On the top of the screen were labels (on each side of the screen) to remind
participants of the categories assigned to each key for the current task. Participants
responded to the categorization task by pressing either an “R” key or the “L” key on
a computer keyboard. They were instructed to respond as quickly and as accurately
as possible.
In B1, B2, and B7, the program randomly selected items from the stimulus
lists. In B3, B4, B6, and B7, the program randomly selected items while alternating
trials that presented a smoking or a not smoking picture with trials that presented
either a positive or a negative word. If the participant responded correctly, then the
program proceeded to the next trial after an inter-trial interval of 150ms. If the
participant made an error, then a red “X” appeared below the stimulus and remained
Social Desirability Bias in Smoking Cessation 27
on the screen until the participant responded correctly. Participants were instructed
to correct their errors as quickly as possible by pressing the other key.
The scoring algorithm recommended by Greenwald and colleagues (2003)
was used to derive the IAT effect (Table 4). Data from all four combination blocks
(B3, B4, B6, B7) were used to compute the IAT effect. All response times > 10,000
msec were eliminated (< 0.1% of datapoints). The algorithm eliminates
assessments on which a participant had response times of less than 300 msec on
more than 10% of the trials (4 assessments in the current dataset). The computed
IAT effect, D, is similar to an effect-size measure (Greenwald, et al. 2003). The
internal (split-half) reliability of the IAT effect (D score) is adequate in a laboratory
(e.g., r = .91 in Waters et al., 2007) and EMA settings (e.g., r = 0.70 in Waters et al.,
2010).
Data Analysis
Two analytic strategies were used in the current study. In Strategy 1, BIDR
was coded as a dichotomous variable (Participants were split into 2 groups - “low”
BIDR scorers and “high” BIDR scorers - based on the median value). In Strategy 2,
the BIDR was coded as a continuous variable (Participants were not split into “low”
and “high”). BIDR scores were split into two groups (Strategy 1) to facilitate
presentation and interpretation of data. For example, by splitting participants into
two groups it is easy to visualize how the strength of association between SR and
NSR measures varies as a function of BIDR status (Figures 1-3).
The scores could also be split into 3 groups (a tertiary split would be a third
strategy). To investigate the potential utility of a tertiary split, a simulation study was
Social Desirability Bias in Smoking Cessation 28
conducted that assumed equal-sized groups, that the dependent variable was
normally distributed in the population, and that there was a linear relationship
between the two variables (dependent variable and BIDR scores) in the population.
This simulation suggested that there was little difference in power between a binary
and tertiary split (C. Olsen, personal communication, September 13, 2010). Given
that there is likely little to be gained from using a tertiary split (from the perspective
of statistical power), a binary split was preferred. This split (Strategy 1), in
conjunction with the use of continuous variables (Strategy 2), provides a
comprehensive analysis of the data.
To address hypotheses 1A, 1B, 2A, 2B, and 3A, planned t-tests were used to
examine if “low” and “high” BIDR scorers differed on self-report, biological, and
implicit measures (Strategy 1). Pearson‟s r was used to examine if BIDR was
associated with self-report, biological, and implicit measures (Strategy 2)
To address hypotheses 1C and 2C, Pearson‟s r was used to examine if self-
reported and biological/implicit measures were correlated within the “low” and “high”
groups (Strategy 1). In supplemental analyses, the two correlation coefficients
(derived from the two groups) were compared for significant difference from each
other, using the methods described in Howell (2010).
Hierarchical regression analyses also were conducted in which the SR
measure served as the dependent (criterion) variable and the NSR measure and
BIDR score served as predictor variables. The interaction term between the two
predictor variables, entered in a second step, tested whether a moderation effect
was present (Strategy 2). The interaction term assesses whether the regression
Social Desirability Bias in Smoking Cessation 29
coefficient, b (or slope), relating the NSR and SR measures is dependent on BIDR
scores (coded as a continuous variable). The null hypothesis is that the b value
does not vary by BIDR score. If the null hypothesis is rejected (i.e., there is a
significant interaction), then it can be concluded that the relationship (slope) between
the NSR and SR measures does vary according to BIDR score. This is the
preferred method of moderation analyses in this area of research (see Table 1), so
these regression analyses were chosen to maintain consistency and comparability
with the available studies that have examined the moderating role of SDR on the
relationship between SR and NSR measures. In addition, regression analysis has
been cited as a reliable and appropriate method to test for moderation effects
(McClelland & Judd, 1993).
Each hypothesis was examined for each of the three smoking states, when
smoking normally (NON session), when 12-hour abstinent but not trying to quit (AB
session), and when trying to quit (Quit Day; QD). Sixty-three participants were
abstinent at the QD session and 29 were coded as non-abstinent (Figure 4); in the
current analyses, the QD data was not broken down by whether or not participants
were able to achieve abstinence on that day, due to sample size concerns. In
addition, each hypothesis was examined for the mean of the three smoking statuses,
and this was the primary focus of the data analyses. For each participant, mean
scores were computed using data from completed sessions. In supplemental
analyses, correlations between BIDR scores and SR measures also were examined
to determine if they differed significantly between the states (i.e., AB, NON, and QD),
using methods described in Howell (2010).

Social Desirability Bias in Smoking Cessation 30
Previous studies have suggested that demographic variables such as age,
sex, and ethnicity, may be associated with socially desirable responding, suggesting
that there may be underlying cultural or cohort effects on rates of SDR (Warnecke et
al., 1997). Therefore, the analyses examined whether age, sex, and ethnicity were
associated with BIDR scores. If one of these variables was significantly associated
with BIDR scores, then it was to be included as a covariate in analysis.
There was no correction for multiple tests for two reasons. First, adjusting
alpha would reduce power to detect real differences in the population and increase
the probability of type II errors (i.e., failing to reject a false null hypothesis). A
reduction in power could not be offset by increasing the sample size because the
data were archival. Second, alpha was not adjusted to maintain consistency and
increase comparability with other studies. Specifically, investigators in previous
studies examining the relationship between SR, NSR, and SDR measures did not
adjust alpha for multiple tests (e.g., Adams et al., 2005; Egloff & Schmukle, 2003;
Marissen et al., 2005). This issue is addressed further in the discussion.
Power Analysis
Power analyses were computed using nQuery Advisor 6.01. All tests were 2-
tailed (alpha = .05). With the sample size, and taking into account attrition over time
(i.e., drop-out), using a t-test we had 80% power to detect a between-group effect
size (in the population) of ds = .56 to .59 (depending on state). Using Pearson‟s r
we had 80% power to detect a correlation in the population (rho) of .28 to .29
(depending on state). The study also has 80% power to detect an ∆R2 for the
interaction of .066 to.073 (in the population) (hypotheses 1C, 2C, 3C) (see Table 3).

Social Desirability Bias in Smoking Cessation 31
Results
Baseline and Demographic Variables
Across all participants (N = 146) the mean BIDR total score was 13.3 (SD =
6.2), which is comparable to research averages reported in Paulhus (1991) (total
score range of 11.7-16.2). BIDR total scores were dichotomized by median split into
a LOW group (0-12) (n = 72, M = 8.2, SD = 2.6) and a HIGH group (13+) (n = 74, M
= 18.2, SD = 4.3). The LOW and HIGH groups did not differ significantly for any of
the baseline variables assessed, including age (M = 42.1, SD = 12.6 vs. M = 43.1,
SD = 11.0; t(144) = -.48, p > .10), gender (56.6% male vs. 43.2% male; X(1) = 2.20,
p > .10), race distribution (White vs. Non-White) (69.4% White vs. 58.1% White; X(1)
= 1.05, p > .10), breath CO levels at Orientation visit (M = 23.6 ppm, SD = 11.3 vs.
M = 24.0 ppm, SD = 10.4 ppm; t(111) = -0.21, p > .10), or FTND scores (M = 5.3, SD
= 2.3 vs. M = 5.7, SD = 2.4; t(143) = -1.12, p > .10). Because demographic
variables were not associated with BIDR scores, these variables were not included
as covariates in later analyses.
Association Between SDR and Attitudes Toward Cigarette Smoking (Strategy 1)
Table 4 reports analyses conducted for Specific Aim 1, which concerned the
association between BIDR scores and attitudes to smoking. Significant differences
were found on SR attitudes toward smoking between LOW and HIGH groups (e.g.,
t(102) = 2.24, p = .03 for the mean of the three sessions). These findings support
hypothesis 1A that more negative attitudes toward smoking would be reported by
participants with higher BIDR scores. There were no significant between-group
(LOW vs. HIGH) differences on the IAT effect (e.g., t(103) = 0.46, p > .10 for the
Social Desirability Bias in Smoking Cessation 32
mean of the three sessions). These findings support hypothesis 1B that BIDR
scores would not be associated with IAT effect. These findings are illustrated in
Figure 5.
Table 4 reveals that significant correlations were found between SR and NSR
measures in the LOW group (e.g., r(53) = .29, p = .03 for mean of three sessions).
No significant correlations were found in the HIGH group (e.g., r(49) = .02, p > .10
for the mean of the three sessions). These data support hypothesis 1C that the
association between implicit and explicit attitudes is weaker in individuals with high
BIDR scores. This finding is illustrated in Figure 6.
Additional analyses were conducted to determine whether the correlations
(between SR and NSR measures) in the two groups were significantly different from
one another. These analyses test the null hypothesis that the correlations between
SR and NSR measures are equal in the two underlying populations (i.e., in the LOW
group and the HIGH group). Using a standard critical value of z = 1.96 (for a 95%
confidence interval), correlations between the LOW and HIGH groups were
significantly different at QD (z = 2.35, p = .02) but did not reach significance at the
mean of the three sessions (z = 1.91, p > .05).
Association Between SDR and Cigarette Smoking Rate and Intake (Strategy 1)
Table 5 reports analyses conducted for Specific Aim 2, which concerned the
association between BIDR scores and smoking rate and intake. There were no
significant between-group (LOW vs. HIGH) differences found for SR smoking (e.g.,
t(100) = -0.4, p > .10 for the mean of the three sessions). This finding did not
support hypothesis 2A that there would be a significant association between

Social Desirability Bias in Smoking Cessation 33
reported smoking and BIDR scores. There also were no significant differences for
cotinine levels between LOW and HIGH (e.g., t(103) = -1.57, p > .10 for the mean of
the three sessions). These findings support hypothesis 2B that BIDR scores would
not be associated with biological markers of smoking.
Table 5 reveals that several significant correlations were found between SR
smoking and cotinine levels in the LOW group (e.g., r(50) = .39, p = .08 for the mean
of the three sessions), but no significant correlations were found in the HIGH group
(e.g., r(49) = .16, p > .10 for the mean of the three sessions). These data support
hypothesis 2C that the association between SR and biological measures of smoking
is weaker in individuals with high BIDR scores. These findings are illustrated in
Figure 7.
Additional analyses were conducted to test whether the correlations
(between SR and NSR measures) were significantly different from one another.
Although correlations were significant in the LOW group at NON, AB, and at the
mean of the three sessions (Table 5), using a standard critical value of z = 1.96 (for
a 95% confidence interval) the correlations (between SR and NSR measures) were
not significantly different in the two groups (LOW and HIGH) at NON (z = 1.89, p >
.05), AB (z = 1.42, p > .1), or for the mean of the three sessions (z = 1.72, p > .05).
Association Between SDR and Craving for Cigarettes (Strategy 1)
Table 6 illustrates analyses conducted for Specific Aim 3, which concerned
the association between BIDR scores and craving. There was a significant
between-group (LOW vs. HIGH) difference found for SR craving (e.g., t(102) = 2.13,

Social Desirability Bias in Smoking Cessation 34
p = .04 for the mean of the three sessions). This finding supports hypothesis 3A that
individuals with higher BIDR scores would report significantly less craving.
SDR Scores as a Continuous Variable (Strategy 2)
Specific Aims 1-3 also were examined with the BIDR total score as a non-
dichotomized variable (i.e., not split into LOW and HIGH groups) (Tables 7-9).
Results were similar to those achieved through median split of the BIDR scores. For
example, for mean scores there was a significant association between BIDR and SR
attitudes toward smoking (r(102) = -.25, p = 0.01 for the mean of the three sessions)
but not for the IAT effect (r(103) = 0.00, p > .10 for the mean of the three sessions)
(Table7). No significant association was found between BIDR and reported smoking
(r(100) = .07, p > .10 for the mean of the three sessions), and the association
between BIDR and cotinine levels approached significance (r(104) = .19, p = .06 for
the mean of the three sessions) (Table 8). There was a significant association
between BIDR and SR craving (r(102) = -.21, p = .03) (Table 9).
The hypothesis that BIDR scores would moderate the relationship between
SR and NSR measures was examined using regression analyses. In these
analyses, all variables were continuous variables. The SR scores were entered as
the criteria. The implicit/biological scores and the BIDR score were entered as
predictors in the first step. In step two, the interaction term between both variables
was included in the equation. These analyses were conducted at each of the three
sessions and the mean of the three sessions. Tables 7 and 8 present the
unstandardized regression coefficients for the interaction terms. There was no
significant increment in explained variance from step 1 to step 2 for any of the

Social Desirability Bias in Smoking Cessation 35
analyses (i.e., no significant interactions). For example, when the mean explicit
attitude was the dependent variable, there was no significant increment in explained
variance from step 1 to step 2, ∆R2 = .01, F(1,100) = 1.11. p > .10 (IAT x BIDR: β = -
.29). When the mean SR smoking was the dependent variable, there was no
significant increment in explained variance from step 1 to step 2, ∆R2 = .00, F(1, 98)
= 0.31, p > .10 (Cotinine x BIDR: β = -.16).
Between-State Differences in Associations
Additional analyses were conducted to determine if correlations between
BIDR scores and SR measures, some of which were found to be significant during
initial analyses (Tables 7, 9), were significantly different across states. These
analyses tested the null hypothesis that the correlations between BIDR scores and
SR measures were equal in the two states. Because sample sizes varied across
states, the smaller of the two sample sizes was used when conducting these
analyses. For explicit attitudes, there was a significant difference in the correlations
between BIDR and explicit attitude for the NON vs. AB comparison (n = 99; t(96) = -
2.31, p = .02) but not for the AB and QD comparison (n = 92; t(89) = 1.49, p > .10),
or the NON and QD comparison (n = 92; t(89) = -0.56, p > .10). For self-reported
craving, there was a significant difference in the correlations between BIDR and
craving for the AB vs. QD comparison (n = 92; t(89) = -2.48, p = .02). The other
between-state comparisons did not reveal significant differences: NON vs. AB (n =
99; t(96) = -1.66, p > .10); NON vs. QD (n = 92; t(89) = -.70, p > .10).
Social Desirability Bias in Smoking Cessation 36
Discussion
The primary aim of this study was to examine the effect of socially desirable
responding (SDR) on self-report (SR) and non self-report (NSR) measures in
smoking cessation. A secondary aim was to examine whether or not SDR, as
measured by the Balanced Inventory of Desirable Responding, moderated the
relationship between these SR and NSR measures. The purpose of the study was
to more fully understand the influence of SDR on cigarette smoking cessation
assessments with the future goal of implementing ways to control for and to
minimize the effect of SDR on research assessments. Participants were assessed
twice prior to their quit day, once when 12-hours abstinent and once when smoking
as normally, as well as on their quit day. Primary outcome measures were smoking
rate, attitudes toward smoking, and craving.
The most interesting finding was that individuals with higher BIDR scores
reported more negative (less positive) attitudes and lower craving ratings than
individuals with lower BIDR scores. However, the same high BIDR individuals did
not exhibit a more negative IAT effect (Figure 5). Confidence in these findings is
increased by the fact that they were consistent across analyses (i.e., they were
observed when BIDR scores were coded as both dichotomous and continuous
variables). In addition, the LOW and HIGH group did not differ on any of the
baseline or demographic variables measured. The HIGH participants exhibited
slightly higher (non-significant) levels of nicotine self-administration (as assessed
through salivary cotinine levels), but they reported significantly lower levels of
craving at the NON and QD sessions. Because the two groups did not differ on
Social Desirability Bias in Smoking Cessation 37
nicotine use (i.e., cotinine level) or level of nicotine dependence (i.e., FTND scores),
they should be similarly addicted to nicotine and should be experiencing similar
levels of craving. This finding suggests that self-report measures in smoking
cessation may be sensitive to social desirability bias and that an implicit measure
(IAT effect) may be less sensitive to this bias.
Although, as noted above, hypotheses 1A, 1B and 3A were confirmed, there
was no evidence to support hypothesis 2A that individuals with higher BIDR scores
would under-report their smoking. The meaning of this null finding is not clear. It is
possible that some high BIDR participants may be inclined to exaggerate, rather
than under-report, their smoking; they may have thought that the experimenters
expected reports of heavy smoking, because participants were told not to quit until
quit-day, and therefore reported high levels of smoking. Alternatively, it is possible
that, in the context of smoking cessation, self-reported attitudes and craving are
more sensitive to social desirability bias than self-reported behaviors. Further
research examining the differential effect of SDR across a variety of constructs may
help to clarify this type of finding.
Moderation Effect of SDR
In contrast to the clear and consistent results reported above concerning the
associations between SDR and self-report/implicit measures, the study provided
mixed evidence that the associations between SR and NSR are dependent on BIDR
scores. For example, the correlations between explicit and implicit attitudes were
significant in LOW BIDR participants, but were not significant in HIGH BIDR
participants (see Figure 7). This result is consistent with hypotheses, as it was
Social Desirability Bias in Smoking Cessation 38
expected that higher levels of SDR would weaken the association between SR and
NSR measures due to deviance in the self-reported information. Moreover, Figure 7
appears to suggest that the sizes of the correlations are different in the two groups
(smaller in the HIGH BIDR group), and that the regression line is flatter in the HIGH
BIDR group (similar to the pattern depicted in Figure 3).
However, supplemental analyses revealed that the magnitude of the two
correlations was not significantly different (i.e., the null hypothesis that the
correlations were equal in two groups could not be rejected). Moreover, using
regression analysis there is no evidence that BIDR moderates the relationship
between the IAT and self-reported attitudes. The regression analysis tests whether
the slope between the IAT effect and self-reported attitude varies by the level of
BIDR scores. In sum, there is some evidence that the association between SR and
NSR measures is dependent on level of social desirability, given the significant of
correlations between SR and NSR measures in the LOW group but non-significance
of these correlations in the HIGH group. However, because these correlations were
not significantly different from each other and because regression analyses failed to
find any significant results, further research is required to confirm this finding and
conclude that SDR has any moderation effect on the relationship between SR and
NSR measures.
There are several explanations for why a clear-cut moderation effect may not
have been detected in this study. It has been suggested that statistically significant
interactions may be difficult to detect in moderation analyses due to lower levels of
statistical power, particularly when conducting non-experimental field studies using
Social Desirability Bias in Smoking Cessation 39
non-manipulated variables (McClelland & Judd, 1993). Similarly, large sample sizes
are often required to detect significant differences between two correlation
coefficients (Howell, 2010). These explanations suggest that future analyses
utilizing a larger sample size may be required to detect potential moderation effects.
In this respect, it is noteworthy that previous studies have similarly been unable to
detect robust moderation effects when assessed using multiple regression analysis
(Table 1). Perhaps there are other unidentified variables that may moderate this
relationship more robustly. In addition, it is possible that utilization of a SDR
measure less dependent on self-report may prove to be a stronger moderator of this
relationship.
Between-state Differences
As discussed previously, SDR may be important in all stages of smoking
cessation. It is therefore important to understand the effect of SDR both prior to
quitting and at the early stages of a quit attempt. While the effect of SDR at different
stages in the cessation process has not previously been examined in research,
preliminary analyses of these data indicate that the effect of SDR may vary prior to
quitting and during early stages of the quit attempt. These analyses suggest that the
association between SDR and self-reported attitudes was (significantly) stronger in
the NON session than the AB session. Perhaps high BIDR participants are less
likely to misrepresent their attitudes when abstinent because the impairment in
cognitive processing impairs the operation of the bias. The correlation between
SDR and craving is higher at quit day than when compared to abstinent (but pre-
quit), suggesting that individuals may be more inclined to misrepresent self-reported
Social Desirability Bias in Smoking Cessation 40
information during a quit attempt. This finding may be due to participants‟
assumptions that they would be expected to report lower levels of craving once they
have quit. However, additional studies are required to confirm these results.
Implications
The most important implication of the study is that self-report data in smoking
cessation research, specifically craving and attitudes toward smoking, may be more
valid in low SDR participants. This finding is particularly important for craving
because this measure is such a widely used assessment in cigarette smoking, and
other addiction, research. These results suggest that researchers should assess
and control for the effect of SDR if possible, something that has not been
consistently done in past research. The need to assess and control for SDR is likely
to apply in other clinical domains as well, in which individuals would be motivated to
misrepresent self-report information. The results of this study also suggest that
increased use of implicit assessments may be particularly useful in individuals high
in SDR. It may be potentially useful for those individuals low and high in SDR to
receive different assessments to maximize accuracy of data obtained through
assessment measures. In addition, future research examining the relationship
between implicit and explicit cognition to risk of relapse should consider the role of
SDR and control for its potentially misleading effect on assessment data.
It is also possible that tailoring the way self-report information is gathered
could be helpful in additionally controlling the degree of SDR. Richman, Kiesler,
Weisband, and Drasgow (1999) conducted a meta-analysis to examine the effect of
SDR across different types of assessment administration, including computer-
Social Desirability Bias in Smoking Cessation 41
administered questionnaires, traditional questionnaires, and interviews. They found
that individuals appeared less likely to distort their responses on computer-
administered questionnaires than in face-to-face assessments, particularly when
anonymity was stressed. The Richman et al. (1999) study suggests that
administration method should be considered, particularly for individuals higher in
SDR who may be more prone to misrepresent information, and that providing
anonymity and less face-to-face time during assessments may be beneficial to help
control the effect of SDR on self-report data.
Limitations
There are several limitations of the present study that should be noted. The
BIDR was not included in the initial research protocol, therefore not all participants
completed this measure and the sample size for this study was decreased.
However, according to power analyses conducted, the study was reasonably
powered to detect significant differences in both the correlational and moderation
analyses. In addition, there was modest attrition over time in the study leading to
different sample sizes at each session (approximately 1-10% across sessions).
Non-random attrition may lead to subtly different subsections of the sample at
different states which may complicate direct between-state comparisons. Likewise,
the degree of practice on the assessments is confounded by state (e.g., the QD
session is always the third session), so this difference may also complicate direct
between-state comparisons.
There was no control for multiple tests, and therefore the familywise error rate
is elevated above .05. However, two observations argue against the notion that the

Social Desirability Bias in Smoking Cessation 42
results are predominantly type I errors (a type I error occurs when the researcher
rejects the null hypothesis when the null hypothesis is, in reality, true). First, the
pattern of results obtained was consistent across the two analytic strategies (e.g.,
significant differences on SR measures but not NSR measures). For example, four
significant p values (p < .05) were found from the 10 tests that evaluated hypotheses
1A, 1B, 2A, 2B, and 1C for the mean data. The probability of obtaining two or more
significant results if all 10 null hypotheses were true is about 8% (using the binomial
distribution), and so it is unlikely that the majority of the observed findings (relating to
these hypotheses) are type I errors. Second, the results exhibited conceptual
consistency. That is, associations between SDR and other variables were only
found for SR measures in a manner that was consistent with hypotheses.
Nonetheless, these findings should be treated with caution pending replication.
Lastly, it is not easy to measure social desirability bias, so there have been
concerns as to whether a questionnaire measure, such as the BIDR, can truly
capture SDR. While the present data indicates that SDR was being measured in
this study, it is important to continually evaluate the validity and reliability of such
measures and continue to develop even more sophisticated measures to tap into
SDR.
Strengths
The study also had some notable strengths. This study is the first study, to
the best of the author‟s knowledge, to assess SDR and a battery of self-report and
implicit assessments in a smoking cessation context. Similarly, to the best of the
author‟s knowledge, it is the first study to provide evidence that explicit attitudes
Social Desirability Bias in Smoking Cessation 43
toward smoking are more sensitive to SDR (as assessed by BIDR) than implicit
attitudes within a cigarette smoking cessation context. Moreover, some study
measures (craving, attitudes, IAT effect) were assessed in both laboratory and field
settings (on a PDA). Therefore, in future research the generalizability of these
results to other settings can be examined.
Future Directions
As discussed previously, the BIDR can be scored using a continuous scoring
method (continuous in the sense that individual items on the BIDR are not
dichomotized but rather retained as numbers of a 1-7 scale, not in the sense that the
total score is a continuous variable) in addition to the dichotomous scoring (used in
this study). Little research has examined the difference between these two scoring
algorithms, however one study does suggest increased reliability and convergence
with other SDR measures using the continuous scoring method (Stober, Dette, &
Musch, 2002). Therefore, it may be useful to examine differences in the results
obtained with the continuous scoring method. In addition, it may be interesting to
examine the results if three dichotomized BIDR groups were to be used (i.e., low,
medium, and high BIDR).
Also, little research has examined the IM, SDE, and BIDR total scores
separately to assess how these different constructs of SDR may affect assessment
data differently. In the current study, the focus was on the BIDR total score,
because the BIDR is most often scored in this way. However, it will be interesting to
examine the differences among these three scores, particularly across different
measures and across the three smoking states examined in the current study.
Social Desirability Bias in Smoking Cessation 44
The data for the implicit measure of craving (e.g., attentional bias) have not
yet been examined, as it was outside the scope of the current study. This
examination will provide additional information to study the effect of SDR on implicit
cognitive measures.
Future research should examine if the effect of SDR is different across
measures and states, such as before and after a smoking quit attempt. The results
from this study suggest that the effect of SDR varies by assessment construct and
smoking status, so this is an important relationship that should be further explored
and elucidated. In addition, future research should examine if associations between
self-report measures and relapse are stronger in low SDR. Understanding this
relationship may aid in increasing researchers‟ ability to accurately assess risk of
relapse and predict relapse. Lastly, future research should examine if associations
between BIDR and self-report measures exist in settings more useful for predicting
real-world behaviors such as relapse (i.e., outside of the laboratory). Research on
assessment setting suggests that differences in the effect of SDR may occur in other
settings, so it would be important to understand how SDR is differentially effective in
the laboratory vs. the real world.

Social Desirability Bias in Smoking Cessation 45
References
Adams, S. A., Matthews, C. E., Ebbeling, C. B., Moore, C. G., Cunningham, J. E.,
Fulton, J., & Herbert, J. R. (2005). The effect of social desirability and social
approval on self-reports of physical activity. American Journal of
Epidemiology, 161(4), 389-398.
Bardwell, W. A., & Dimsdale, J. E. (2001). The Impact of Ethnicity and Response
Bias on the Self-Report of Negative Affect. Journal of Applied Biobehavioral
Research, 6(1), 27-38.
Batson, C. D., Naifeh, S. J., & Pate, S. (1978). Social desirability, religious
orientation, and racial prejudice. Journal for the Scientific Study of Religion,
17(1), 31-41.
Beretvas, S. N., Meyers, J. L., & Leite, W. L. (2002). A reliability generalization study
of the Marlowe-Crowne Social Desirability Scale. Educational and
Psychological Measurement, 62, 570-589.
Berg, I. A. (1967). The deviation hypothesis: A broad statement of its assumptions
and postulates. In I. A. Berg (Ed.), Response set in personality assessment
(pp. 146-190). Chicago, IL: Aldine.
Bernreuter, R. G. (1933). Validity of the personality inventory. Personality Journal,
11, 383-386.
Blake, B. F., Valdiserri, J., Neuendorf, K., & Nemeth, J. (2006). Validity of the SDS-
17 measure of social desirability in the American context. Personality and
Individual Differences, 40, 1625-1636.
Social Desirability Bias in Smoking Cessation 46
Boyd, N. R., Windsor, R., Perkins, L., & Lowe, J. B. (1998). Quality of measurement
of smoking status by self-report and saliva cotinine among pregnant women.
Maternal and Child Health Journal, 2(2), 77-83.
Butcher, J. N., Dahlstrom, W. G., Graham, J. R., Tellegen, A., & Kaemmer, B.
(1989). Minnesota Multiphasic Personality Inventory (MMPI-2). Manual for
administration and scoring. Minneapolis, MN: University of Minnesota Press.
Cox, L. S., Tiffany, S. T., & Christen, A. G. (2001). Evaluation of the brief
questionnaire of smoking urges (QSU-Brief) in laboratory and clinical settings.
Nicotine and Tobacco Research, 3(1), 3-6.
Cronbach, L. J. (1946). Response sets and test validity. Educational and
Psychological Measurement, 6, 475-494.
Crowne, D. P., & Marlowe, D. (1960). A new scale of social desirability independent
of psychopathology. Journal of Consulting Psychology, 24(4), 349-354.
Davies, M. F., French, C. C., & Keogh, E. (1998). Self-deceptive enhancement and
impression management correlates of EPQ-R dimensions. Journal of
Psychology, 132(4), 401-406.
Davis, T. C., Crouch, M. A., Long, S. W., Jackson, R. H., Bates, P., George, R. B., &
Bairnsfather, L. E. (1991). Rapid assessment of literacy levels of adult
primary care patients. Family Medicine, 23, 433-435.
Diener, E., Suh, E. M., Smith, H., & Shao, L. (1995). National differences in reported
subjective well-being: Why do they occur? Social Indicators Research, 34(1),
7-32.
Social Desirability Bias in Smoking Cessation 47
Dillehay, R. C., & Jernigan, L. R. (1970). The biased questionnaire as an instrument
of opinion change. Journal of Personality and Social Psychology, 15, 144-
150.
Dolcini, M., Adler, N., & Ginsberg, D. (1996). Factors influencing agreement between
self-reports and biological measures of smoking among adolescents. Journal
of Research on Adolescence, 6(4), 515-542.
Edwards, A. L. (1953). The relationship between the judged desirability of a trait and
the probability that the trait will be endorsed. Journal of Applied Psychology,
37, 90-93.
Edwards, A. L. (1957). The Social Desirability Variable in Personality and
Assessment and Research. New York, NY: Dryden.
Edwards, L. K., & Edwards, A. L. (1991). A principal-components analysis of the
Minnesota Multiphasic Personality Inventory factor scales. Journal of
Personality and Social Psychology, 60, 766-772.
Egloff, B., & Schmukle, S. (2003). Does social desirability moderate the relationship
between implicit and explicit anxiety measures? Personality and Individual
Differences, 35, 1697-1706.
Epstein, S. (1994). Integration of the cognitive and the psychodynamic unconscious.
American Psychologist, 49, 709-724.
Ewert, A., & Galloway, G. (2009). Socially desirable responding in an environmental
context: development of a domain specific scale. Environmental Education
Research, 15(1), 55-70.
Social Desirability Bias in Smoking Cessation 48
Eysenck H. J., & Eysenck S. B. (1975). Manual of the Eysenck Personality
Questionnaire. London, England: Hodder & Stoughton.
Fiore, M. C., Jaén, C. R., Baker, T. B., Bailey, W. C., Benowitz, N. L., Curry, S.
J., . . . Wewers, M. E. (2006). Clinical Practice Guideline for Treating Tobacco
Use and Dependence. Rockville, MD: U.S. Department of Health and Human
Services.
Greenwald, A. G., Nosek, B. A., & Banaji, M. R. (2003). Understanding and using
the Implicit Association Test: I. an improved scoring algorithm. Journal of
Personality and Social Psychology, 85(2), 197-216.
Greenwald, A. G., McGhee, D. E., & Schwartz, J. L. (1998). Measuring individual
differences in implicit cognition: the Implicit Association Test. Journal of
Personality and Social Psychology, 74, 1464–1480.
Gross T. M., Jarvik, M. E., & Rosenblatt, M. R. (1993). Nicotine abstinence produces
content-specific Stroop interference. Psychopharmacology, 110, 333–336.
Gur, R. C., & Sackeim, H. A. (1979). Self-deception: A concept in search of a
phenomenon. Journal of Personality and Social Psychology, 37(2), 147-169.
Hathaway, S. R., & McKinley, J. C. (1951). The Minnesota Multiphasic Personality
Inventory Manual. New York, NY: Psychological Corporation.
Heatherton, T. F., Kozlowski, L. T., Frecker, R. C., & Fagerstrom, K. O. (1991). The
Fagerstrom Test for Nicotine Dependence: a revision of the Fagerstrom
Tolerance Questionnaire. British Journal of Addiction, 86(9),1119-1127.
Heise, D. R. (1969). Some methodological issues in semantic differential
research. Psychological Bulletin, 72(6), 406-422.
Social Desirability Bias in Smoking Cessation 49
Hofmann, W., Gawronski, B., Gschwendner, T., Le, H., & Schmitt, M. (2005). A
meta-analysis on the correlation between the Implicit Association Test and
explicit self-report measures. Personality and Social Psychology Bulletin,
31(10), 1369-1385.
Holden, R. R., & Fekken, G. C. (1989). Three common social desirability scales:
friends, acquaintances, or strangers? Journal of Research in Personality, 23,
180–191.
Howell, D. C. (2010). Statistical Methods for Psychology (7th Ed.), Belmont,
Canada: Wadsworth/Cengage Learning.
Klassen, D., Hornstra, R. K., & Anderson, P. B. (1975). Influence of social
desirability on symptom and mood reporting in a community survey. Journal
of Consulting & Clinical Psychology, 43, 448-452.
Konstabel, K., Aavik, T., & Allik, J. (2006). Social desirability and consensual validity
of personality traits. European Journal of Personality, 20, 549-566.
Kozma, A., & Stones, M. J. (1986). Social desirability in measures of subjective well-
being: a systematic evaluation. Journal of Gerontology, 42(1), 56-59.
Kucera, H., & Francis, W. N. (1967). Computational analysis of present day
American English. Providence, RI: Brown University Press.
Lanyon, R. I., & Carle, A. C. (2007). Internal and external validity of scores on the
Balanced Inventory of Desirable Responding and the Paulhus Deception
Scales. Educational and Psychological Measurement, 67, 859-878
Lentz, T. F. (1938). Acquiescence as a factor in the measurement of personality.
Psychological Bulletin, 35, 659-671.

Social Desirability Bias in Smoking Cessation 50
Li, A., & Bagger, J. (2006). Using the BIDR to distinguish the effects of impression
management and self-deception on the criterion validity of personality
measures: A meta-analysis. International Journal of Selection and
Assessment, 14(2), 131-141.
Marissen, M., Franken, I., Blanken, P., van den Brink, W., & Hendriks, V. (2005).
The relationship between social desirability and different measures of heroin
craving. Journal of Addictive Diseases, 24(4), 91-102.
McClelland, G. H., & Judd, C. M. (1993). Statistical difficulties of detecting
interactions and moderator effects. Psychological Bulletin, 114(2), 376-390.
Meehl, P. E., & Hathaway, S. R. (1946). The K factor as a suppressor variable in the
Minnesota Multiphasic Personality Inventory. Journal of Applied Psychology,
30, 525-564.
Mesmer-Magnus, J., Viswesvaran, C., Deshpande, S., & Joseph, J. (2006). Social
desirability: the role of over-claiming, self-esteem, and emotional intelligence.
Psychology Science, 48(3), 336-356.
Mieczkowski, T. (1990). The accuracy of self-reported drug use: An evaluation and
analysis of new data. In R. Weisheit (Ed.), Drugs, Crime and the Criminal
Justice System. (pp. 275-302). Cincinnati, OH: Anderson Publishing.
Morgan, M. J., Davies, G. M., & Willner, P. (1999). The Questionnaire of
Smoking Urges is sensitive to abstinence and exposure to smoking-
related cues. Behavioral Pharmacology, 10(6-7), 619-626.
Social Desirability Bias in Smoking Cessation 51
Munafo, M., Mogg, K., Roberts, S., Bradley, B. P., & Murphy, M. (2003). Selective
processing of smoking-related cues in current smokers, ex-smokers and
never-smokers on the modified Stroop task. Journal of Psychopharmacology,
17, 310-316.
Murray, R. P., Connett, J. E., Lauger, G. G., & Voelker, H. T. (1993). Error in
smoking measures: effects of intervention on relations of cotinine and carbon
monoxide to self-reported smoking. American Journal of Public Health, 83(9),
1251-1257.
Nichols, D. S., & Greene, R. L. (1997). Dimensions of deception in personality
assessment: The example of the MMPI-2. Journal of Personality Assessment,
67, 251-266.
Ossip-Klein, D., Bigelow, G., Parker, S., Curry, S., Hall, S., & Kirkland S. (1996).
Classification and assessment of smoking behavior. Health Psychology, 5
(Suppl), 3-11.
Parrott, A.W. (1991). Performance tests in human psychopharmacology (1): test
reliability and standardization. Human Psychopharmacology: Clinical and
Experimental. 6, 1-9.
Paulhus, D. L. (1984). Two-component models of socially desirable responding.
Journal of Personality and Social Psychology, 45(3), 598-609.
Paulhus, D. L. (1988). Assessing self-deception and impression management in self-
reports: the Balanced Inventory of Desirable Responding. Vancouver, British
Columbia; University of British Columbia.
Social Desirability Bias in Smoking Cessation 52
Paulhus, D. L. (1991). Measurement and control of response bias. In J. P. Robinson,
P. R. Shaver, & L. S. Wrightsman (Eds.), Measures of Personality and Social
Psychological Attitudes (pp. 17-59). San Diego, CA: Academic Press.
Pauls, C. A., & Stemmler, G. (2003). Substance and bias in social desirability
responding. Personality and Individual Differences, 35, 263-275.
Peabody, D. (1962). Two components in bipolar scales: Direction and extremeness.
Psychological Review, 69, 65-73.
Peebles, J., & Moore, R. J. (1998). Detecting socially desirable responding with the
Personality Assessment Inventory: the positive impression management
scale and the defensiveness index. Journal of Clinical Psychology, 54(5),
621-628.
Richman, W., Kiesler, S., Weisband, S., & Drasgow, F. (1999). A meta-analytic
study of social desirability distortion in computer-administered questionnaires,
traditional questionnaires, and interviews. Journal of Applied Psychology,
84(5), 754-775.
Riketta, M. (2005). Gender and socially desirable responding as moderators of the
correlation between implicit and explicit self-esteem. Current Research in
Social Psychology, 11(2), 14-28.
Robbins, S. J., Ehrman, R. N., Childress, A. R., & Obrien, C. P. (1997). Relationship
among physiological and self-report responses produced by cocaine-related
cues. Addictive Behaviors, 22, 157-167.
Social Desirability Bias in Smoking Cessation 53
Rohsenow, D. J., Monti, P. M., Abrams, D. B., Rubonis, A. V., Niaura, R. S., Sirota,
A. D., & Colby, S. M. (1992). Cue elicited urge to drink and salivation in
alcoholics: relationship to individual differences. Advances in Behaviour
Research and Therapy, 14, 195-210.
Sackeim, H. A., & Gur, R. C. (1978). Self-deception, self-confrontation, and
consciousness. In G. E. Schwartz, & D. Shapiro (Eds.), Consciousness and
self-regulation: Advances in Research, (pp.139-197), New York, NY: Plenum.
Saunders, J. B., Aasland, O. G., Babor, T. F., de la Fuente, J. R., & Grant, M.
(1993). Development of the Alcohol Use Disorders Identification Test
(AUDIT): WHO collaborative project on early detection of persons with
harmful alcohol consumption. II. Addiction, 88, 791-804.
Sheehan, D. V., Lecrubier, Y., Sheehan, K. H., Amorim, P., Janavs, J., Weiller,
E., . . . Dunbar, G. C. (1998). The Mini-International Neuropsychiatric
Interview (M.I.N.I.): the development and validation of a structured diagnostic
psychiatric interview for DSM-IV and ICD-10. Journal of Clinical Psychiatry,
59(Suppl 20), 22-33.
Sherman, S. J., Rose, J. S., & Koch, K. (2003). Implicit and explicit attitudes toward
cigarette smoking: the effects of context and motivation. Journal of Social and
Clinical Psychology, 22, 13-39.
Shipley, W. C. (1940). A self-administering scale for measuring intellectual
impairment and deterioration. Journal of Psychology, 9, 371-377.
Sigall, H., & Page, R. (1971). Current stereotypes: A little fading, a little faking.
Journal of Personality and Social Psychology, 18, 247-255.
Social Desirability Bias in Smoking Cessation 54
Smith, E. R., & DeCoster, J. (2001). Dual-process models in social and cognitive
psychology: conceptual integration and links to underlying memory systems.
Personality and Social Psychology Review, 4, 108-131.
Spielberger, C. D., Gorsuch, R. L., & Lushene, R. E. (1970). STAI Manual for the
State-Trait Anxiety Inventory. Palo Alto, CA: Consulting Psychologists Press.
Spitzer, R. L., Kroenke, K., & Williams, J. B. (1999). Patient health questionnaire
study group. Validity and utility of a self-report version of PRIME-MD: The
PHQ primary care study group. Journal of the American Medical Association,
282, 1737-1744.
Sprecher, S., McKinney, K., & Orbuch, T. L. (1987). Has the double standard
disappeared?: An experimental test. Social Psychology Quarterly, 50(1), 24-
31.
SRNT Subcommittee on Biochemical Verification (2002). Biochemical verification of
tobacco use and cessation. Nicotine and Tobacco Research, 4, 149-159.
Stewart, R. D., Stewart, R. S., Stamm, W., & Seclen, R. P. (1976). Rapid
estimation of carboxyhaemoglobin level in fire fighters. Journal of the
American Medical Association, 235, 390-402.
Stoeber, J. (2001). The Social Desirability Scale-17 (SDS-17): convergent validity,
discriminant validity, and relationship with age. European Journal of
Psychological Assessment, 17(3), 222-232.
Stober, J., Dette, D. E., & Musch, J. (2002). Comparing continuous and dichotomous
scoring of the Balanced Inventory of Desirable Responding. Journal of
Personality Assessment, 78(2), 370-389.
Social Desirability Bias in Smoking Cessation 55
Strong, D. R., Greene, R. L., & Kordinak, S. T. (2002). Taxometric analysis of
impression management and self-deception in college student and personnel
evaluation settings. Journal of Personality Assessment, 78(1), 161-175.
Stroop, J. R. (1935). Studies of interference in serial verbal reactions. Journal of
Experimental Psychology, 18, 643-661.
Sutton, R. M., & Farrall, S. (2005). Gender, socially desirable responding and the
fear of crime. British Journal of Criminology, 45(2), 212-224.
Swanson, J. E., Rudman, L. A., & Greenwald, A. G. (2001). Using the Implicit
Association Test to investigate attitude-behaviour consistency for stigmatized
behaviour. Cognition and Emotion, 15, 207-230.
Tiffany, S. T. (1990). A cognitive model of drug urges and drug-use behavior: role of
automatic and nonautomatic processes. Psychological Review, 97, 147-168.
Van de Mortel, T. (2005). Faking it: social desirability response bias in self-report
research. Australian Journal of Advanced Nursing, 25(4), 40-48.
Vernon, P. E. (1934). The attitude of the subject in personality testing. Journal of
Applied Psychology, 18, 165-177.
Warnecke, R. B., Johnson, T. P., Chávez, N, Sudman, S., O‟Rourke, D. P., Lacey,
L., & Horm, J. (1997). Improving Question Wording in Surveys of Culturally
Diverse Populations. Annals of Epidemiology, 7, 334-342.
Waters, A. J., Carter, B. L., Robinson, J. D., Wetter, D. W., Lam, C. Y., & Cinciripini,
P. M. (2007). Implicit attitudes to smoking are associated with craving and
dependence. Drug and Alcohol Dependence, 91, 178-186.
Social Desirability Bias in Smoking Cessation 56
Waters, A. J., Miller, E. K., & Li, Y. (2010). Effect of extensive testing on the IAT
effect assessed in an Ecological Momentary Assessment study.
Psychological Reports, 106, 31-43
Wiggins, J. S. (1964). Convergences among stylistic response measures from
objective personality tests. Educational and Psychological Measurement, 24,
551-562.
Wilkerson, J., Nagao, D., & Martin, C. (2002). Socially desirable responding in
computerized questionnaires: when questionnaire purpose matters more than
the mode. Journal of Applied Social Psychology, 32(3), 544-559.
Wilson, T. D., Lindsey, S. & Schooler, T. Y. (2000). A model of dual attitudes.
Psychological Review, 107, 101-126.
Zachary, R. A., Paulson, M. J., & Gorsuch, R. L. (1985). Estimating WAIS IQ
from the Shipley Institute of Living Scale Using Continuously Adjusted Age
Norms. Journal of Clinical Psychology, 41(6), 820-831.

Table 1
Summary of Literature on Associations Between SDR and Self-Report/Non Self-Report Measures
Study N SDR Measure
SR measure (Use or Cognition)
Correlation (r) of SDR with SR measure
NSR measure (Use or Cognition)
Correlation (r) of SDR with NSR measure
Moderation effect
Notes
Rohsenow et al. (1992) Study 2
60 alcoholic males in first week of detox 28 alcoholic males in 4th week of inpatient VA tx
MCSD Cue-provoked craving (urge to drink)
-.07 (ns) Change in physiological response (salivation)
-.19* Significant correlation between SDR and outcome variable lost when ADS scores were added as a covariate
Rohsenow et al. (1992) Study 3
34 alcoholics in first week of inpatient VA tx
MCSD Cue-provoked craving (urge to drink)
-.12 (ns) Change in physiological response (salivation)
-.09 (ns)
Egloff & Schmuckle (2003) Exp.1
145 students (106 female, 39 male)
SDS-17R Self-reported anxiety (STAI)
-.01 (ns) Anxiety IAT -.05 (ns) ∆R2 = .003 (ns)
Egloff & Schmuckle (2003) Exp. 2
62 students (35 female, 25 male)
BIDR (IM, SDE)
Self-reported anxiety (STAI & IAT-e)
SDE & STAI: -46** SDE & IAT-e: -.36* (p<.01) IM & STAI: .09 (ns) IM & IAT-e: .09 (ns)
Anxiety IAT SDE & IAT: -.14 (ns) IM & IAT: .16 (ns)
STAI : IAT x SDE: ∆R2 = .001 (ns) IAT x IM: ∆R2 = .007 (ns) IAT-e: IAT x SDE: ∆R2 = .00 (ns) IAT x IM: ∆R2 = .008 (ns)
Social D
esirability Bias in Sm
oking Cessation 57
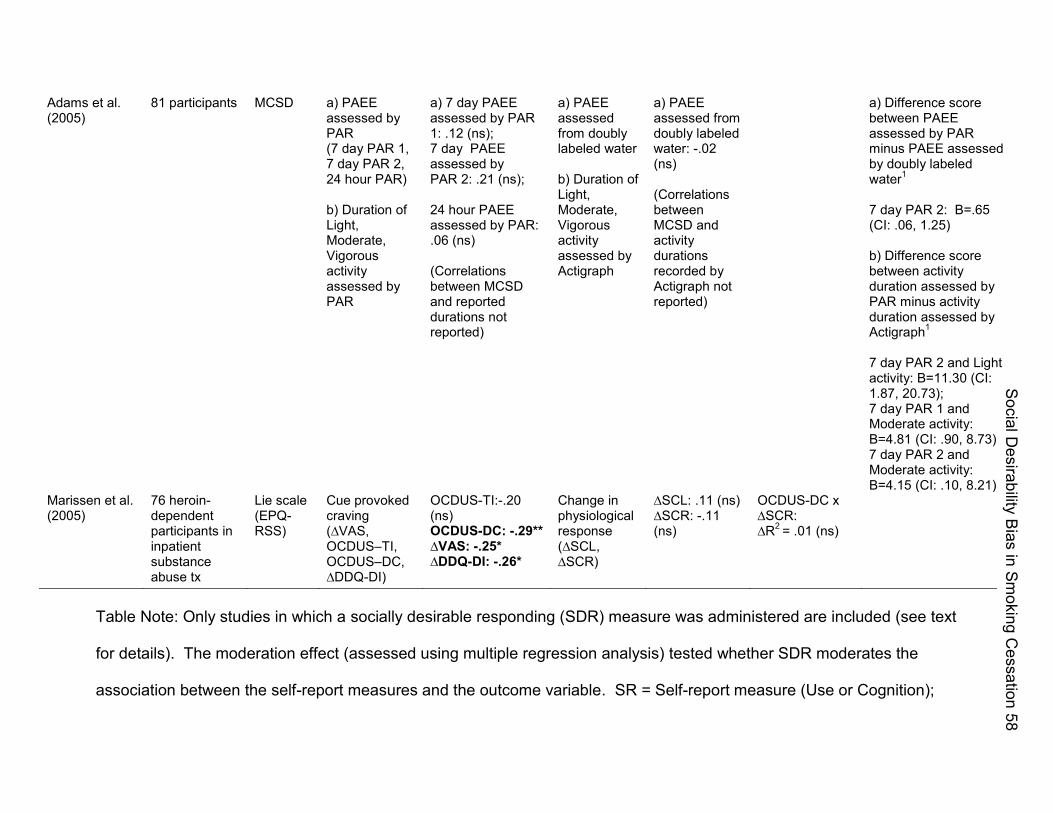
Adams et al. (2005)
81 participants MCSD a) PAEE assessed by PAR (7 day PAR 1, 7 day PAR 2, 24 hour PAR) b) Duration of Light, Moderate, Vigorous activity assessed by PAR
a) 7 day PAEE assessed by PAR 1: .12 (ns); 7 day PAEE assessed by PAR 2: .21 (ns); 24 hour PAEE assessed by PAR: .06 (ns) (Correlations between MCSD and reported durations not reported)
a) PAEE assessed from doubly labeled water b) Duration of Light, Moderate, Vigorous activity assessed by Actigraph
a) PAEE assessed from doubly labeled water: -.02 (ns) (Correlations between MCSD and activity durations recorded by Actigraph not reported)
a) Difference score between PAEE assessed by PAR minus PAEE assessed by doubly labeled water1 7 day PAR 2: B=.65 (CI: .06, 1.25) b) Difference score between activity duration assessed by PAR minus activity duration assessed by Actigraph1 7 day PAR 2 and Light activity: B=11.30 (CI: 1.87, 20.73); 7 day PAR 1 and Moderate activity: B=4.81 (CI: .90, 8.73); 7 day PAR 2 and Moderate activity: B=4.15 (CI: .10, 8.21)
Marissen et al. (2005)
76 heroin-dependent participants in inpatient substance abuse tx
Lie scale (EPQ-RSS)
Cue provoked craving (∆VAS, OCDUS–TI, OCDUS–DC, ∆DDQ-DI)
OCDUS-TI:-.20 (ns) OCDUS-DC: -.29** ∆VAS: -.25* ∆DDQ-DI: -.26*
Change in physiological response (∆SCL, ∆SCR)
∆SCL: .11 (ns) ∆SCR: -.11 (ns)
OCDUS-DC x ∆SCR: ∆R2 = .01 (ns)
Table Note: Only studies in which a socially desirable responding (SDR) measure was administered are included (see text
for details). The moderation effect (assessed using multiple regression analysis) tested whether SDR moderates the
association between the self-report measures and the outcome variable. SR = Self-report measure (Use or Cognition);
Social D
esirability Bias in Sm
oking Cessation 58
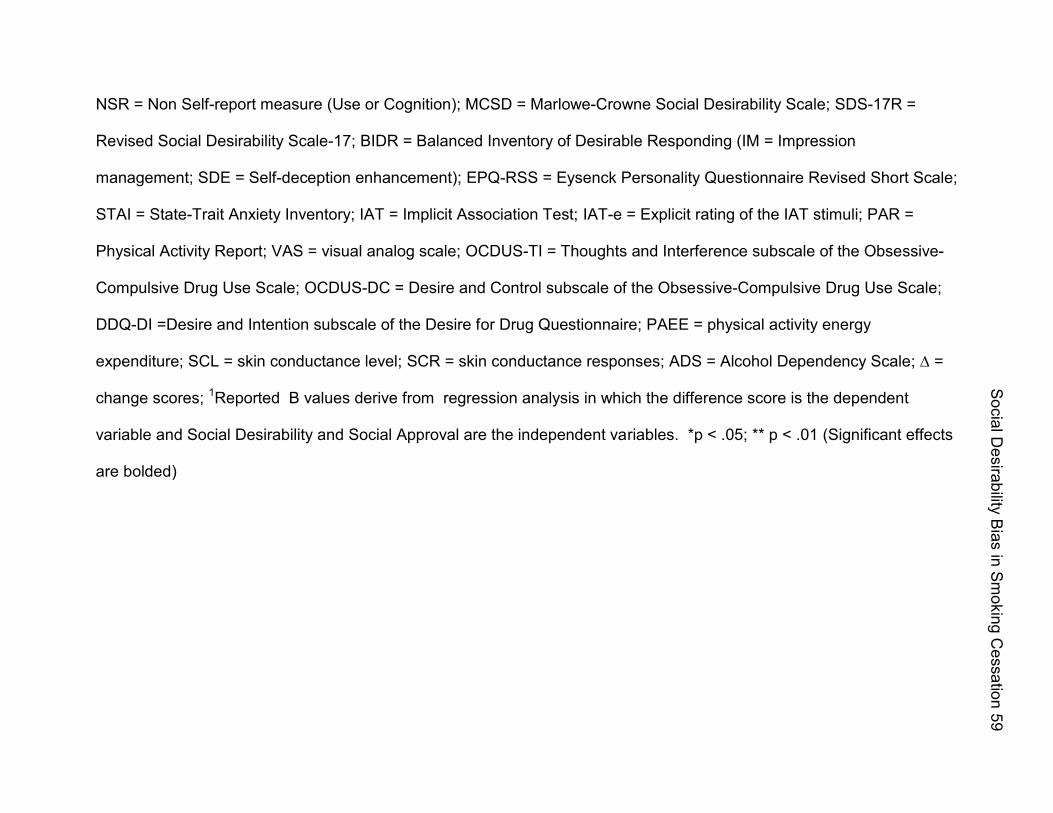
NSR = Non Self-report measure (Use or Cognition); MCSD = Marlowe-Crowne Social Desirability Scale; SDS-17R =
Revised Social Desirability Scale-17; BIDR = Balanced Inventory of Desirable Responding (IM = Impression
management; SDE = Self-deception enhancement); EPQ-RSS = Eysenck Personality Questionnaire Revised Short Scale;
STAI = State-Trait Anxiety Inventory; IAT = Implicit Association Test; IAT-e = Explicit rating of the IAT stimuli; PAR =
Physical Activity Report; VAS = visual analog scale; OCDUS-TI = Thoughts and Interference subscale of the Obsessive-
Compulsive Drug Use Scale; OCDUS-DC = Desire and Control subscale of the Obsessive-Compulsive Drug Use Scale;
DDQ-DI =Desire and Intention subscale of the Desire for Drug Questionnaire; PAEE = physical activity energy
expenditure; SCL = skin conductance level; SCR = skin conductance responses; ADS = Alcohol Dependency Scale; ∆ =
change scores; 1Reported B values derive from regression analysis in which the difference score is the dependent
variable and Social Desirability and Social Approval are the independent variables. *p < .05; ** p < .01 (Significant effects
are bolded)
Social D
esirability Bias in Sm
oking Cessation 59
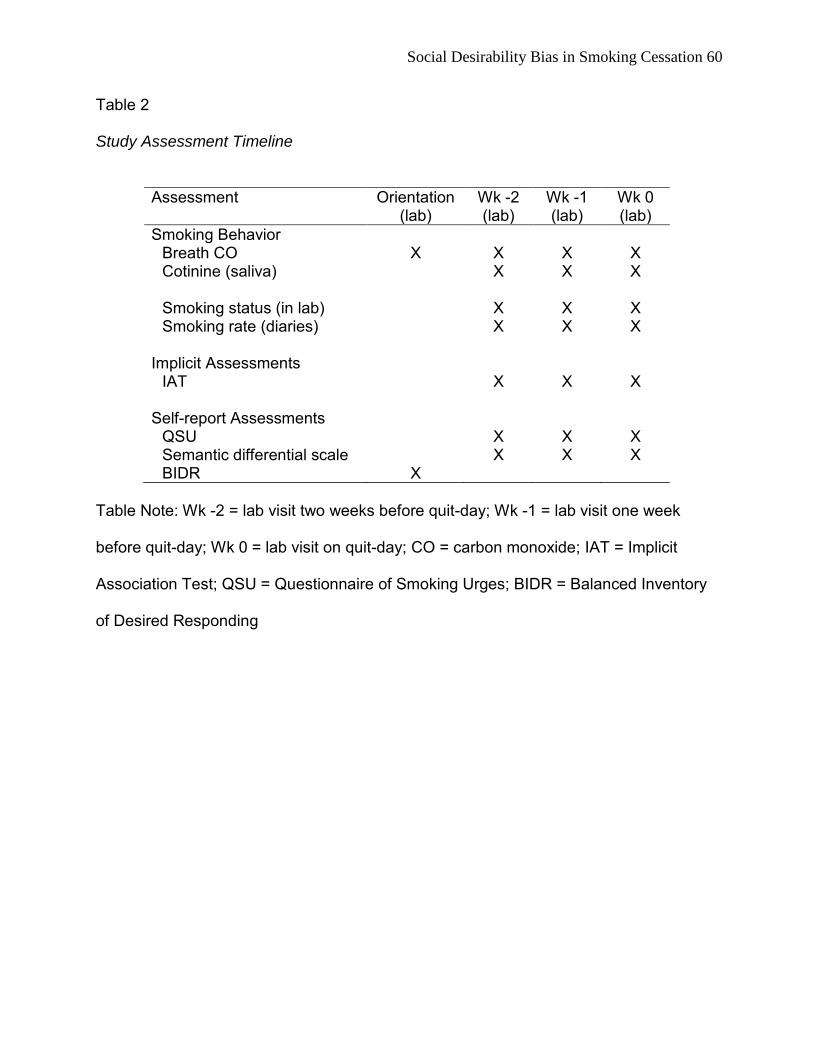
Social Desirability Bias in Smoking Cessation 60
Table 2
Study Assessment Timeline
Assessment Orientation (lab)
Wk -2 (lab)
Wk -1 (lab)
Wk 0 (lab)
Smoking Behavior Breath CO X X X X Cotinine (saliva) X X X
Smoking status (in lab) X X X Smoking rate (diaries) X X X
Implicit Assessments
IAT X X X Self-report Assessments
QSU X X X Semantic differential scale X X X BIDR X
Table Note: Wk -2 = lab visit two weeks before quit-day; Wk -1 = lab visit one week
before quit-day; Wk 0 = lab visit on quit-day; CO = carbon monoxide; IAT = Implicit
Association Test; QSU = Questionnaire of Smoking Urges; BIDR = Balanced Inventory
of Desired Responding
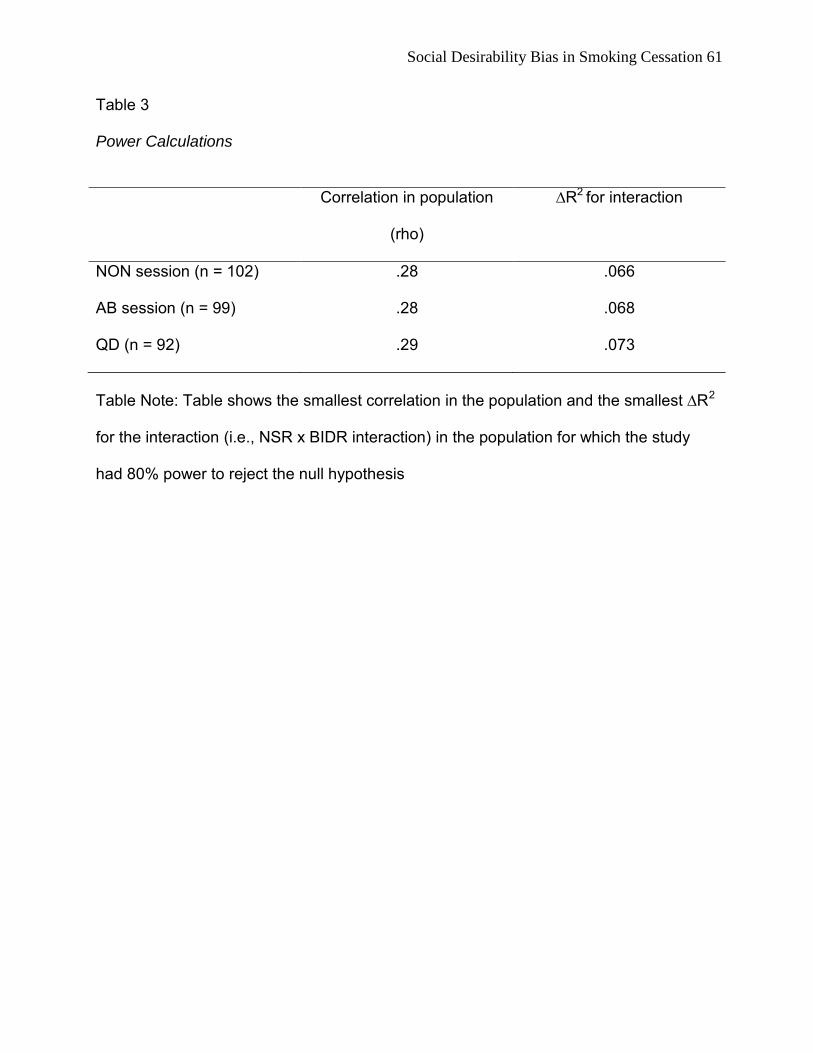
Social Desirability Bias in Smoking Cessation 61
Table 3
Power Calculations
Correlation in population
(rho)
∆R2 for interaction
NON session (n = 102) .28 .066
AB session (n = 99) .28 .068
QD (n = 92) .29 .073
Table Note: Table shows the smallest correlation in the population and the smallest ∆R2
for the interaction (i.e., NSR x BIDR interaction) in the population for which the study
had 80% power to reject the null hypothesis

Social D
esirability Bias in Sm
oking Cessation 2
Table 4
Differences in Explicit and Implicit Attitudes Toward Smoking for Low and High BfOR Participants (Strategy 1)
Correlation Correlation t-test: Low t-test: Low between between
SR Low BIDR High BIOR and High
NSR Low BIDR High BIOR and High SR and SRand
M (SO) M (SO) BIOR M(SO) M (SO) BIOR NSR (r) NSR (r) (t value) (t value)
Low BIDR High BIOR
NON Explicit -1.56 (1.12) -2.15 (1.00) 2.83- IAT effect -0.95 (0.51 ) -1.02 (0.46) .71 .05 .13 Attitudes
AB Explicit -1.85 (1.11 ) -1.92 (1.13) .31 IAT effect -0.91 (0.53) -0.95 (0.52) .33 .18 .06 Attitudes
QO Explicit -2.39 (0.82) -2.68 (0.61 ) 1.90* IAT effect -0.79 (0.59) -0.93 (0.49) 1.23 .32* -.02 Attitudes
Mean Explicit -1.93 (0.75) -2.26 (0.78) 2.24- IAT effect -0.89 (0.45) -0.94 (0.45) .46 .29* .02 AttITudes
Table Note: SR = Self-report measure; NSR = Non Self-report measure; BIDR = Balanced Inventory of Desirable
Respond ing; IAT = Implicit Association Test; Explicit Attitudes = Semantic Differentiation Scales (Range -3 to +3); Ns vary
from 102 (NON ) to 92 (QO); ·p<.05, "p<.01
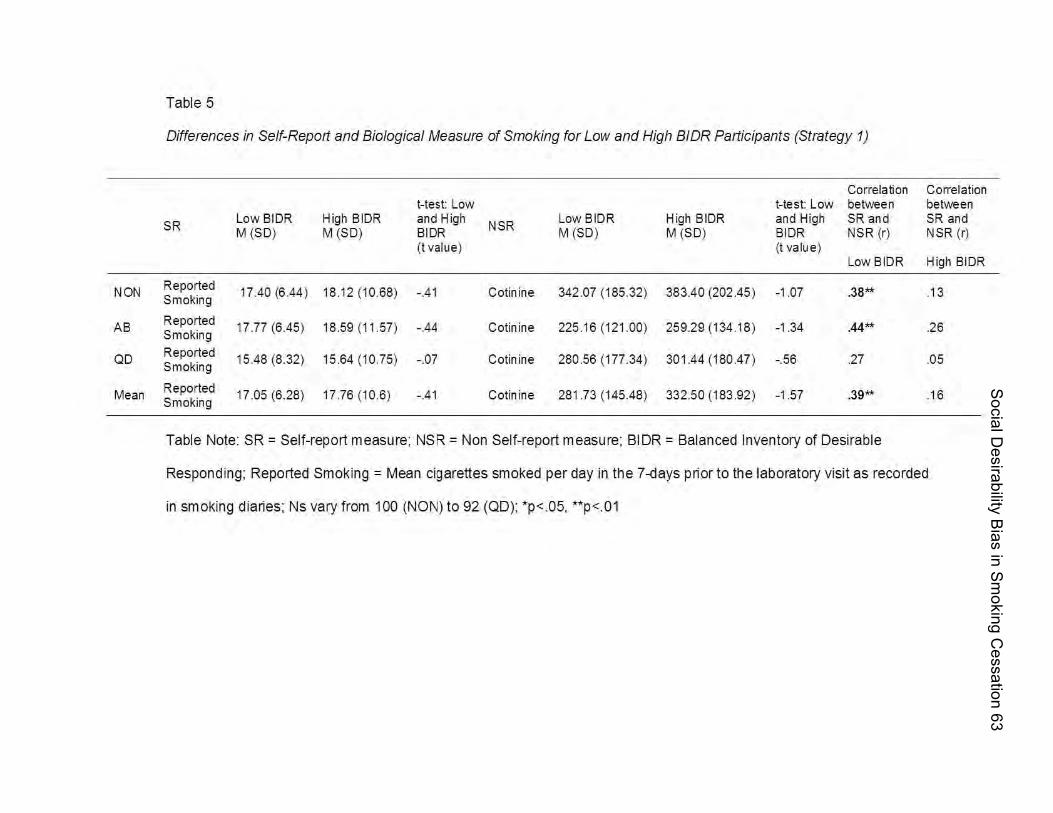
Social D
esirability Bias in Sm
oking Cessation 63
Table 5
Differences in Self-Report and Biological Measure of Smoking for Low and High B/DR Participants (Strategy 1)
Correlati on Correlation I-test: Low I-test: Low between between
5R Low BIDR High BIDR and High
N5R Low BIDR High BIDR and High SR and SR and
M (501 M (501 SloR M (50 1 M (501 SloR N5R (rl N5R (rl (t value) (t valu e)
Low BIDR High BIDR
NON Reported 17.40 (6.44 1 18 .1 2 (10.681 -.41 Cotinine 342 .07 (185.321 383.40 (202.45 1 -1.07 .38*'" .1 3 Smoking
AS Reported 17.77 (6.451 18.59 (11.571 -.44 Cotinine 225 .1 6 (121.001 259.29 (134 .1 81 -1.34 .44*'" .26 Smoking
Qo Reported 15.48 (8.321 15.64 (10.751 -.07 Cotinine 280.56 (177.341 301.44 (180.471 -.56 .27 .05 Smoking
Mean Reported 17.05 (6.281 17.76 (10.61 -.41 Cotinine 281.73 (145.481 332.50 (183 .92 1 -1.57 .39*'" .1 6 Smoking
Table Note: SR = Self-report measure; NSR = Non Self-report measure; BIDR = Balanced Inventory of Desirable
Responding; Reported Smoking = Mean cigarettes smoked per day in the 7 -days prior to the laboratory visit as recorded
in smoking dianes; Ns vary from 100 (NONI to 92 (QDI; · p<.05, "p<.01
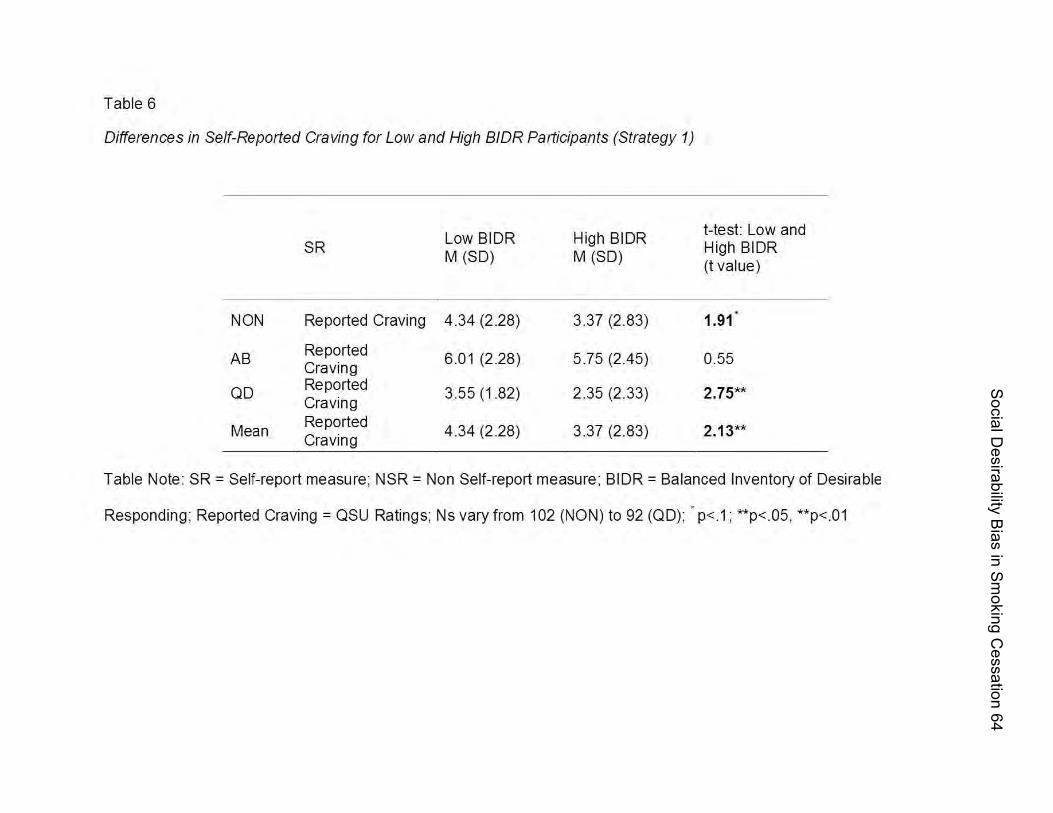
Social D
esirability Bias in Sm
oking Cessation 64
Table 6
Differences in Self-Reported Craving for Low and High BIDR Participants (Strategy 1)
SR
NON Reported Craving
AB Reported Craving
OD Reported Craving
Mean Reported Craving
Low BIDR M (SD)
4.34 (228)
6.01 (228)
3.55 (182)
4.34 (228)
High BIDR M (SD)
3.37 (283)
5.75 (245)
2.35 (233)
3.37 (283)
t-test: Low and High BIDR (t value)
1.91
0.55
Table Note: SR = Self-report measure; NSR = Non Self-report measure ; BIDR = Balanced Inventory of Desirable
Responding ; Reported Craving = OSU Ratings; Ns vary from 102 (NON) to 92 (OD); • p<1; **p<05, **p<01
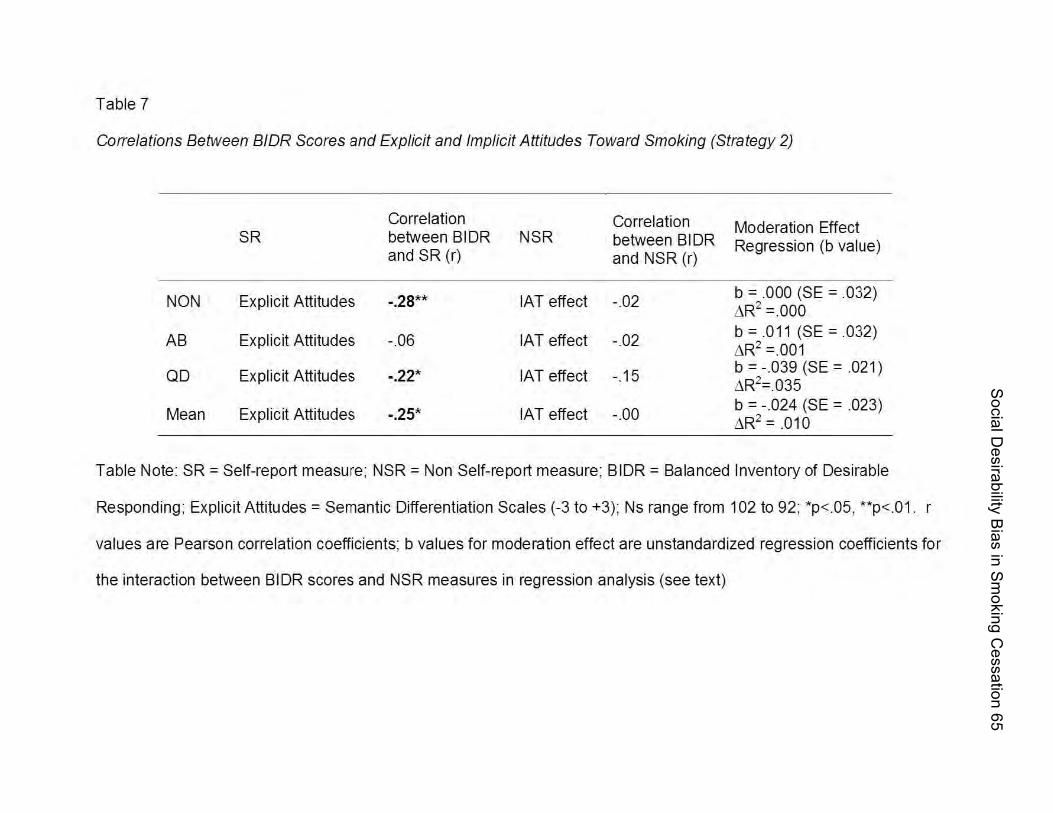
Social D
esirability Bias in Sm
oking Cessation 65
Table 7
COlTe/ations Between BIDR Scores and Explicit and Implicit Attitudes Toward Smoking (Strategy 2)
Correlation Correlation Moderation Effect SR between B I DR NSR between B I DR Regression (b value)
and SR (r) and NSR (r)
NON Explicit Attitudes -.28** IAT effect -.02 b =000 (SE =032) L'iR2 =000
AB Explicit Attitudes -06 IAT effect -.02 b = .011 (SE =032) L'iR2 =001
QD Explicit Attitudes -.22' IAT effect -.15 b = -039 (SE =021 ) L'iR2=.035
Mean Explicit Attitudes -.25' IAT effect -00 b = -.024 (SE =023) L'iR2 = .010
Table Note: SR = Self-report measure; NSR = Non Self-report measure; BIDR = Balanced Inventory of Desirable
Responding; Explicit Attitudes = Semantic Differentiation Scales (-3 to +3); Ns range from 102 to 92; *p< .05, **p< .01. r
values are Pearson correlation coefficients; b values for moderation effect are unstandardized regression coefficients for
the interaction between BIDR scores and NSR measures in regression analysis (see text)
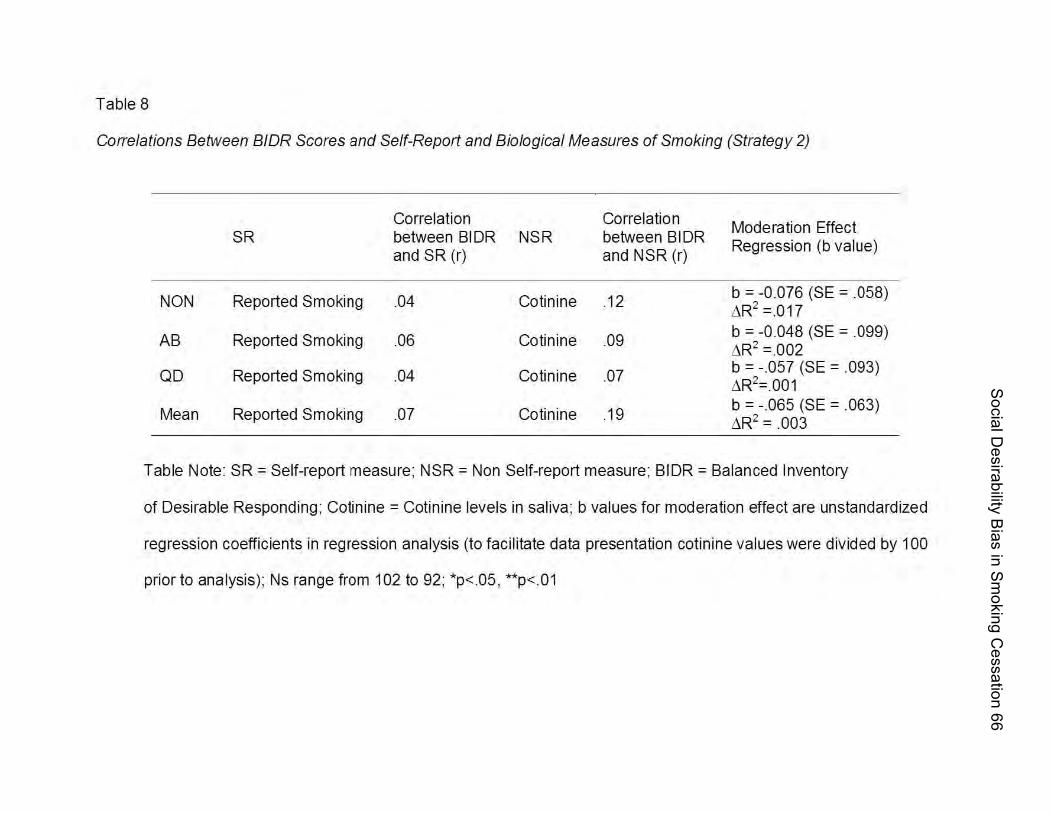
Social D
esirability Bias in Sm
oking Cessation 66
Table 8
COlTe/ations Between BIDR Scores and Self-Report and Biological Measures of Smoking (Strategy 2)
Correlation Correlation Moderation Effect
SR between BIDR NSR between B I DR Regression (b value)
and SR (r) and NSR (r)
NON Reported Smoking .04 Cotinine .12 b = -0.076 (SE =058) L'1R2 =.017
AB Reported Smoking .06 Cotinine .09 b = -0.048 (SE =099) L'1R2 =002
QD Reported Smoking .04 Cotinine .07 b = -.057 (SE =093) L'1R2=.001
Mean Reported Smoking .07 Cotinine .19 b = -065 (SE =063) L'1R2 = .003
Table Note: SR = Self-report measure; NSR = Non Self-report measure; BIDR = Balanced Inventory
of Desirable Responding; Cotinine = Cotinine levels in saliva; b values for moderation effect are unstandardized
regression coefficients in regression analysis (to facilitate data presentation cotinine values were div ided by 100
prior to analysis); Ns range from 102 to 92; *p<.05 , **p<.01
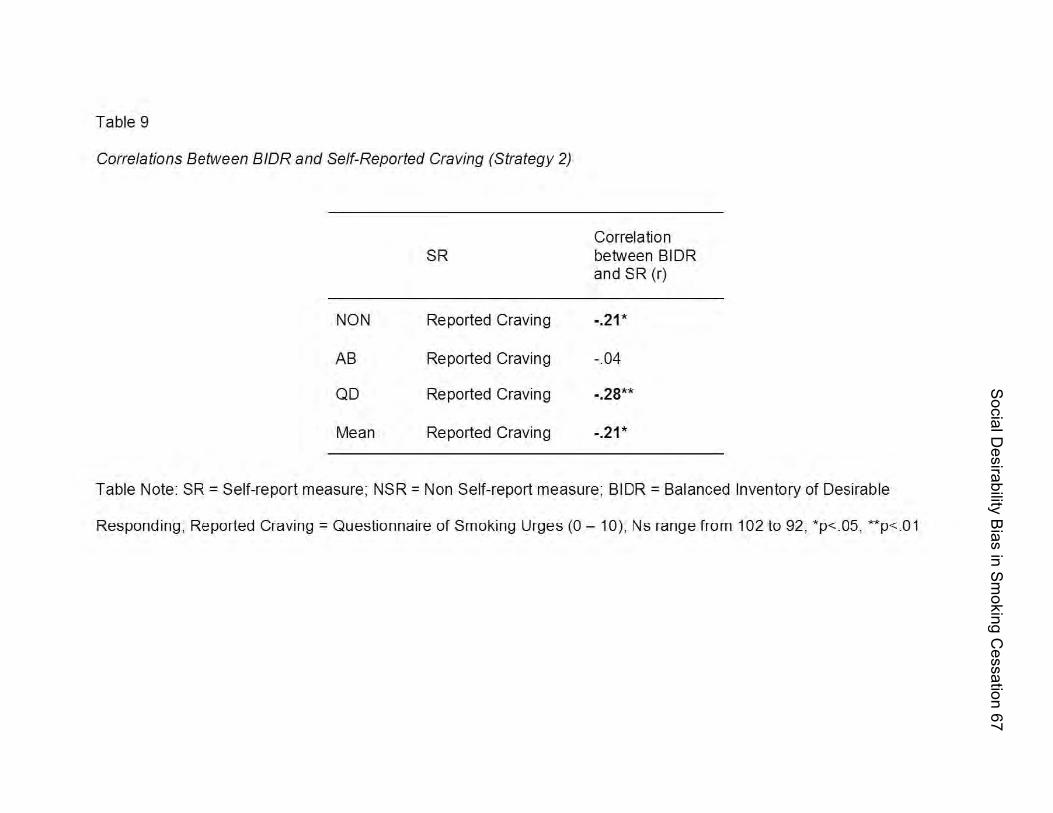
Social D
esirability Bias in Sm
oking Cessation 67
Table 9
Correlations Between BIDR and Self-Reported Craving (Strategy 2)
Correlation SR between B I DR
and SR (r)
NON Reported Craving -.21*
AB Reported Craving -.04
QD Reported Craving -.28**
Mean Reported Craving -.21 *
Table Note: SR = Self-report measure; NSR = Non Self-report measure; BIDR = Balanced Inventory of Desirable
Responding , Reported Craving = Questionnaire of Smoking Urges (0 - 10), Ns range from 102 to 92, · p<.05, ··p<.01

Social Desirability Bias in Smoking Cessation 68
Figure 1. Possible effect of SDR on self-report measures and the association between
self-report and implicit measures. The Figure assumes that the effect of SDR is similar
across all participants high in SDR (see text for details). b1 = original slope; b2 = slope
adjusted for the effect of SDR; r1 = original correlation between implicit and explicit
attitudes; r2 = correlation adjusted for the effect of SDR; M1 = original mean value
(centroid) of implicit and explicit attitudes; M2 = mean value adjusted for the effect of
SDR
“Low” SDR
Implicit Attitude
+
-
Explicit Attitude
...
. .
...... ..
“High” SDR
. . .... ... . . .
Implicit Attitude
+
-
Explicit Attitude
r2 = r1 b2 = b1M2 < M1
...
. .
...... .
Implicit Attitude
+
-
Explicit Attitude
r1
b1
.
Implicit Attitude
..
. .. .
..
....
+
-
r2
b2
Explicit Attitude
.
“Low” SDR
Implicit Attitude
+
-
Explicit Attitude
...
. .
...... ..
“Low” SDR
Implicit Attitude
+
-
Explicit Attitude
...
. .
...... ....
.. .
...... ..
“High” SDR
. . .... ... . . .
Implicit Attitude
+
-
Explicit Attitude
“High” SDR
. . .... ... . . .
Implicit Attitude
+
-
Explicit Attitude
r2 = r1 b2 = b1M2 < M1
...
. .
...... .
Implicit Attitude
+
-
Explicit Attitude
r1
b1
.
Implicit Attitude
..
. .. .
..
....
+
-
r2
b2
Explicit Attitude
.
r2 = r1 b2 = b1M2 < M1
...
. .
...... .
Implicit Attitude
+
-
Explicit Attitude
r1
b1
...
.. .
...... .
Implicit Attitude
+
-
Explicit Attitude
...
. .
...... .
Implicit Attitude
+
-
...
. .
...... .
...
. .
...... .
Implicit Attitude
+
-
Explicit Attitude
r1
b1
.
Implicit Attitude
..
. .. .
..
....
+
-
r2
b2
Explicit Attitude
..
. .. .
..
....
+
-
+
-
r2
b2
Explicit Attitude
.

Social Desirability Bias in Smoking Cessation 69
Figure 2. Possible effect of SDR on self-report measures and the association between
self-report and implicit measures. The Figure assumes that the effect of SDR varies
across all participants high in SDR (see text for details). b1 = original slope; b2 = slope
adjusted for the effect of SDR; r1 = original correlation between implicit and explicit
attitudes; r2 = correlation adjusted for the effect of SDR; M1 = original mean value
(centroid) of implicit and explicit attitudes; M2 = mean value adjusted for the effect of
SDR
“Low” SDR
...
. .
.....
“Low” SDR
. .
Implicit Attitude
+
-
Explicit Attitude
.
...
. .
...... .
Implicit Attitude
+
-
Explicit Attitude
r1
b1
.
r2 < r1 b2 = b1M2 < M1Implicit Attitude
..
. ...
.... .
..
b2
r2
Explicit Attitude
+
-
“High” SDR
Implicit Attitude
-
Explicit Attitude
...
.... ...
..+
“Low” SDR
...
. .
.....
“Low” SDR
. .
Implicit Attitude
+
-
Explicit Attitude
...
. .
.....
“Low” SDR
. .
...
. .
.....
“Low” SDR
. .
Implicit Attitude
+
-
Explicit Attitude
.
...
. .
...... .
Implicit Attitude
+
-
Explicit Attitude
...
. .
...... .
Implicit Attitude
+
-
...
. .
...... .
...
. .
...... .
Implicit Attitude
+
-
Explicit Attitude
r1
b1
.
r2 < r1 b2 = b1M2 < M1Implicit Attitude
..
. ...
.... .
..
b2
r2
Explicit Attitude
+
-
“High” SDR
Implicit Attitude
-
Explicit Attitude
...
.... ...
..+
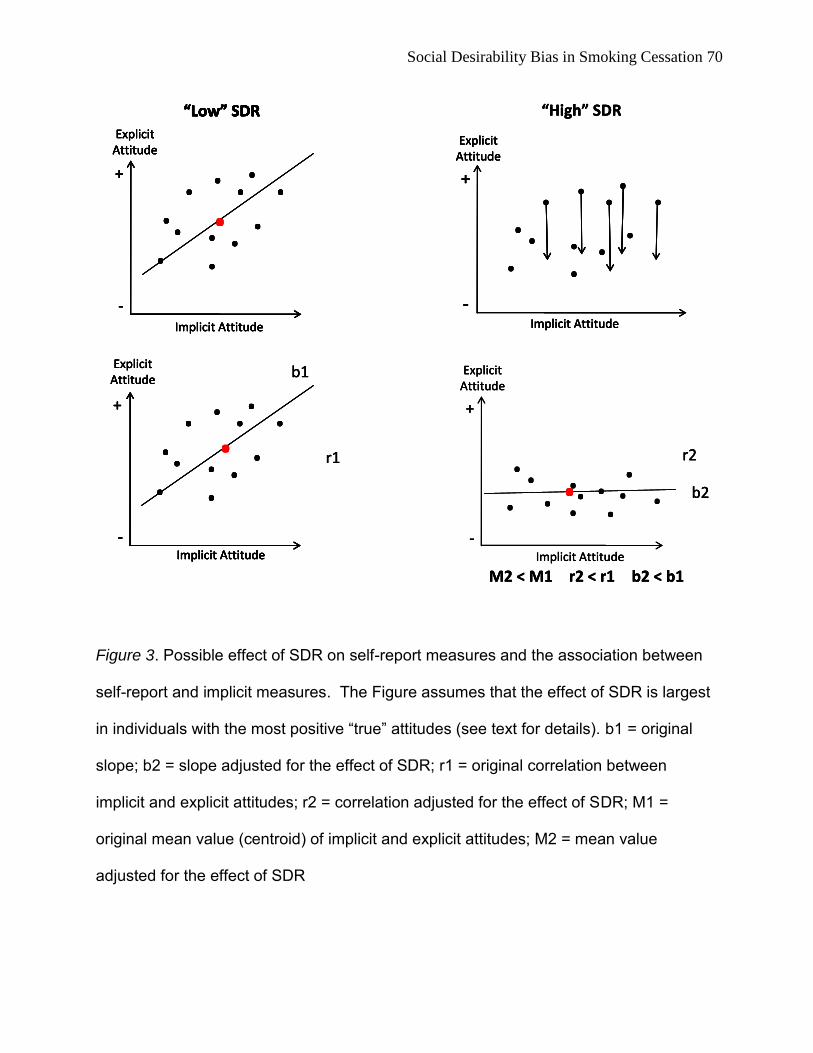
Social Desirability Bias in Smoking Cessation 70
Figure 3. Possible effect of SDR on self-report measures and the association between
self-report and implicit measures. The Figure assumes that the effect of SDR is largest
in individuals with the most positive “true” attitudes (see text for details). b1 = original
slope; b2 = slope adjusted for the effect of SDR; r1 = original correlation between
implicit and explicit attitudes; r2 = correlation adjusted for the effect of SDR; M1 =
original mean value (centroid) of implicit and explicit attitudes; M2 = mean value
adjusted for the effect of SDR
“Low” SDR
...
. .
.....
“Low” SDR
. .
Implicit Attitude
+
-
Explicit Attitude
.
“High” SDR
r2 < r1 b2 < b1M2 < M1
...
. .
...... .
Implicit Attitude
+
-
Explicit Attitude
r1
b1
. r2
b2
. ... . . .
Explicit Attitude
+
-
. . .. ..
Implicit Attitude
+
-
Explicit Attitude
. . .... ... . . .
Implicit Attitude
“Low” SDR
...
. .
.....
“Low” SDR
. .
Implicit Attitude
+
-
Explicit Attitude
.
“High” SDR
...
. .
.....
“Low” SDR
. .
Implicit Attitude
+
-
Explicit Attitude
...
.. .
.....
“Low” SDR
. .
Implicit Attitude
+
-
Explicit Attitude
...
. .
.....
“Low” SDR
. .
...
. .
.....
“Low” SDR
. .
Implicit Attitude
+
-
Explicit Attitude
.
“High” SDR
r2 < r1 b2 < b1M2 < M1
...
. .
...... .
Implicit Attitude
+
-
Explicit Attitude
r1
b1
. r2
b2
. ... . . .
Explicit Attitude
+
-
. . .. ..
Implicit Attitude
+
-
Explicit Attitude
. . .... ... . . .
Implicit Attitude
r2 < r1 b2 < b1M2 < M1
...
. .
...... .
Implicit Attitude
+
-
Explicit Attitude
...
. .
...... .
Implicit Attitude
+
-
...
. .
...... .
...
. .
...... .
Implicit Attitude
+
-
Explicit Attitude
r1
b1
. r2
b2
. ... . . .. ... . . .
Explicit Attitude
+
-
. . .. ..
Implicit Attitude
+
-
Explicit Attitude
Implicit Attitude
+
-
Explicit Attitude
. . .... ... . . .
. . .... ... . . .
. . .... . .... ... . . .. ... . . .
Implicit Attitude
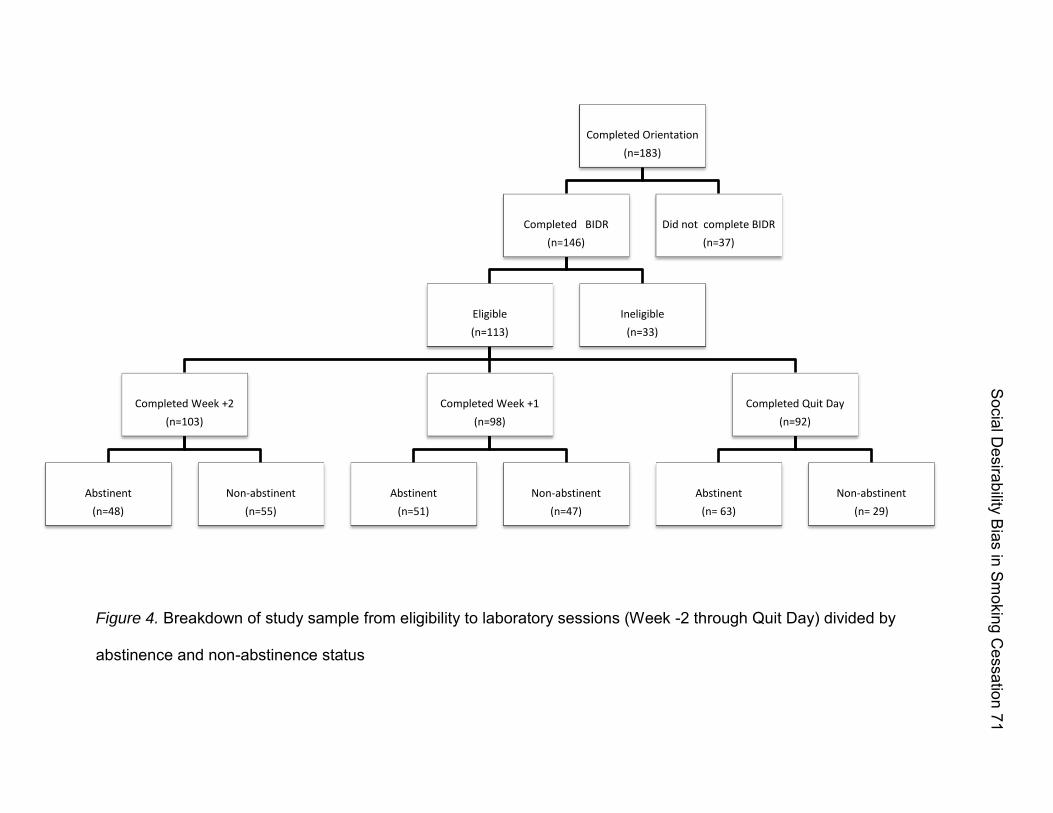
Figure 4. Breakdown of study sample from eligibility to laboratory sessions (Week -2 through Quit Day) divided by
abstinence and non-abstinence status
Completed Orientation
(n=183)
Completed BIDR
(n=146)
Eligible
(n=113)
Completed Week +2
(n=103)
Abstinent
(n=48)
Non-abstinent
(n=55)
Completed Week +1
(n=98)
Abstinent
(n=51)
Non-abstinent
(n=47)
Completed Quit Day
(n=92)
Abstinent
(n= 63)
Non-abstinent
(n= 29)
Ineligible
(n=33)
Did not complete BIDR
(n=37)
Social D
esirability Bias in Sm
oking Cessation 71

Figure 5. Differences in explicit and implicit attitudes for low and high BIDR participants (strategy 1); mean explicit
attitudes were significantly different between low and high BIDR participants, however mean implicit attitudes did
not differ significantly between these two groups.
Mean Explicit Attitude Mean Implicit Attitude
t = 2.24 p < .05
t = .46 ns, p > .6
Social D
esirability Bias in Sm
oking Cessation 72
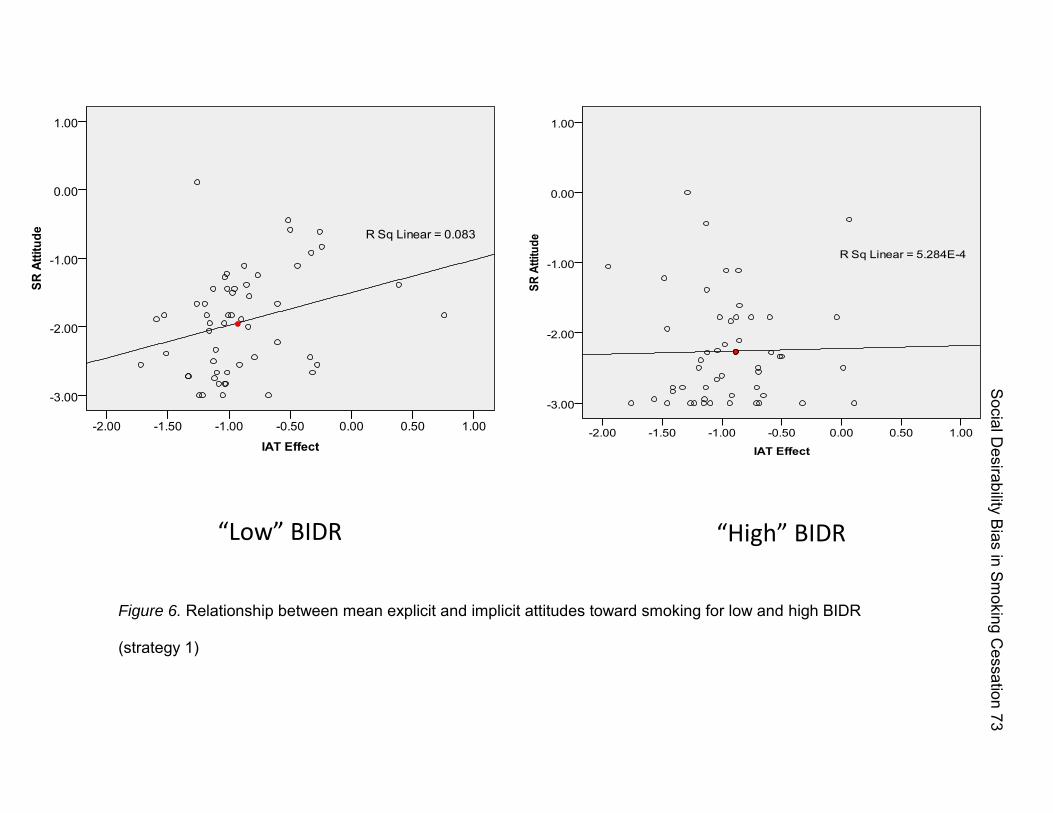
“Low” BIDR “High” BIDR
Figure 6. Relationship between mean explicit and implicit attitudes toward smoking for low and high BIDR
(strategy 1)
Social D
esirability Bias in Sm
oking Cessation 73

“Low” BIDR “High” BIDR
Figure 7. Relationship between mean self-reported smoking and biological measure of smoking for low and high BIDR
(strategy 1)
Social D
esirability Bias in Sm
oking Cessation 74

Social Desirability Bias in Smoking Cessation 75
Appendix A: IRB approval paperwork from M. D. Anderson Cancer Center
T1-£ lN1VfR<':[lY \ )'" Tfx;.:.;
~tfD .AN)ERSON CL\NC1:R CEN fill
Office of Protocol Research
Instiiutionai R ....... &ani (lRB) Unij 1"37 Phone 713-7ge·21133 Fax 713-7Q4.,j58\l
To: P'alJ Onciripini 0313"112009 From: Marion B. Olson OC: Sunetra MBrlinez. VocIOOa L BR-n. Evanna L Thompson. Veronica Roberts MOIIOC ProlDcol 10 It. 2005-0741 Prolocal Tl1Ie: Cognitive Processes in Smoking Cessation Version: 13
Subject IIdministratille IRB Approval - P rotocol 2005.{)74 I
On Tuesday. 03l3 1I2oo9. 1he Institutional R"';"w Board (IRB) " charoc desig""" reviewed ami awwved)l<lUr""";';;oo dated 0312712009 for Protocol 2005-0741
These Pages Inclwle:
. Protocol Body - Document header Date: 0312712009
ReW;ion induded lhe following changes: OlBrifyingl lhat 1he de-identified data wi be sent 10 Dr. Andrew Wala"s ami his slatislieal team at lhe Uniformed Services University of !he Hea~h Sciences.
Additional Revision HislDfY: Please note lltel along _lhis revision !he M. D. AndJeIson IRa approves lhe transfer of de-identified study data for analysis to IX. Andrew Wala"s. collaborator on this study. and his statisacal team at !he Uniformed Services University of !he Hea~h Sciences.
The revisioo can """" be implemented. Please info"" !he appropriate individuals ., your departmenl or se<:lion and the coltaborators of these changes.
Please infomn 1he appropiliaie individuals in your departmenllsedion and your col laborators of lltese revisians..
Please Note: This approval does nol atler or olltetwise change lhe continuing review date of !his protoool.
In !he evenl of any questions or concems. please oonlact lhe sender of this message at (713) 792-2003.
Marion B. Olson D3131120DIl 10:02:'17 11M
This is a lrepresentation of an electro:nic record th3f was signed eieclro:nicaUy and lbelow is the manifestation of that ""'ctronic si.gnatu..,:
IMarion B. Olson 0313112009 09:5 1:"14 A:M
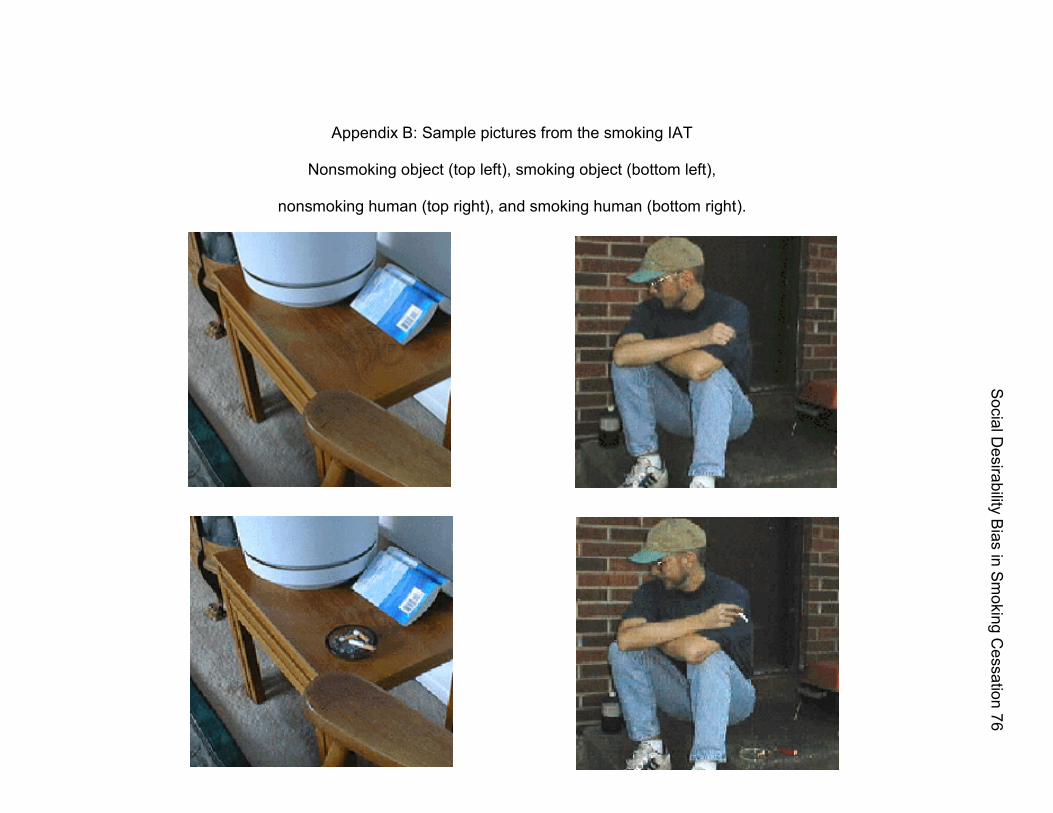
Appendix B: Sample pictures from the smoking IAT
Nonsmoking object (top left), smoking object (bottom left),
nonsmoking human (top right), and smoking human (bottom right).
Social D
esirability Bias in Sm
oking Cessation 76


