44
185 Katarzyna Zawaliñska Asset and Liability Management. The Institutional Approach to ALM by Commercial Banks in Poland: a Special Focus on Risk Management Warsaw, 1999

11 88 55Katarzyna ZawaliñskaAsset and L iabi l i ty Management.The Inst itut ional Approach to ALM by Commercia l Banks in Poland:a Specia l Focus on Risk Management
WW aa rr ss aa ww ,, 11 99 99 99

Materials published here have a working paper character. They can be subject to furtherpublication. The views and opinions expressed here reflect Authors’ point of view andnot necessarily those of CASE.
This paper was prepared for the research project "Sustaining Growth through ReformConsolidation" No. 181-A-00-97-00322, financed by the United States Agency forInternational Development (US AID) and CASE Foundation.
© CASE – Center for Social and Economic Research, Warsaw 1999
Graphic Design: Agnieszka Natalia Bury
DTP: CeDeWu – Centrum Doradztwa i Wydawnictw “Multi-Press” sp. z o.o.
ISSN 1506-1701, ISBN 83-7178-181-4
Publisher: CASE – Center for Social and Economic Researchul. Sienkiewicza 12, 00-944 Warsaw, Poland tel.: (4822) 622 66 27, 828 61 33, fax (4822) 828 60 69e-mail: [email protected]

Contents
Abstract 5
Introduction 6
Part 1. Theoretical and Practical Framework of ALM 7I.1. Key Concepts of Asset/Liability Management 7I.2. Banking Risk 8
Part 2. Balance Sheet Risk in the Polish Banking System 152.1. Interest Rate Risk 152.2. Credit Risk 162.3. Liquidity Risk 172.4. Foreign Exchange Risk 19
Part 3. Survey of ALM and Risk Management in the Polish BankingSector 20
3.1. The Survey Design 203.2. Empirical Results 213.3. Summary of the Survey Results 30
Part 4. Conclusions and Policy Implications 32
References 33
Tables and Figures 35

Katarzyna ZawaliñskaMA in EconomicsJunior Researcher at the CASE Foundation
Author graduated from the Warsaw University, Department of Economics in 1997. She hasalso completed a four-year program of study in undergraduate economics offered by theWarsaw University – Columbia University co-operative program. Her main area of interest ismacroeconomics and finance.
4
Studies & Analyses CASE Nr 185 – Katarzyna Zawaliñska

Abstract
According to the early evidence, privatization and consolidation of banks have astrong favorable impact on the advancement of ALM and risk management methods. Thispaper examines various approaches to ALM by commercial banks in Poland. It elaboratesresults of the empirical survey of ALM and risk management techniques applied by banksin Poland. The survey was conducted in Spring 1999. The analysis shows thatprivatization of banks contributes to the improvement of efficiency and to better riskmanagement. It creates a favorable climate for implementation of more advanced riskmanagement and measurement techniques. The size of the Polish private banks has alsoa positive effect on diverse methodology and sophistication of risk management. Theanalysis implies the need for a further consolidation of Polish financial institutions.Therefore, this paper reinforces arguments in support of accelerated privatization andconsolidation of the Polish banking system.
The author is especially grateful to Prof. Lucjan Or³owski (Sacred Heart University,USA) for his significant involvement in writing this paper. Additionally, the author wouldlike to express her gratitude to the following persons: Józef Wdowiak (Director of RiskDepartment in Bank Pekao SA), and to presidents of all the banks, which participated inthe survey: Bank PKO BP, Bank Gospodarstwa Krajowego, Bank Pekao SA, Bank RozwojuBudownictwa Mieszkaniowego SA, Bank Gospodarki ¯ywnoœciowej SA, Bank PocztowySA, Bank Ochrony Œrodowiska SA, Bank Handlowy w Warszawie SA, BankPrzemys³owo-Handlowy SA, Powszechny Bank Kredytowy SA, Bank Rozwoju ExportuSA, BIG Bank Gdañski SA, Bank Energetyki SA, Bank Inicjatyw Spo³eczno-EkonomicznychSA, Kredyt Bank PBI SA, Gospodarczy Bank Wielkopolski SA, Bank Wschodni SA, BankCZÊSTOCHOWA SA, INVEST-BANK SA, CUPRUM-BANK SA, Bank Unii GospodarczejSA, Warmiñsko-Mazurski Bank Regionalny SA, Lubelski Bank Regionalny SA, Ma³opolskiBank Regionalny SA, Mazowiecki Bank Regionalny SA, Ba³tycki Bank Regionalny SA,Dolnoœl¹ski Bank Regionalny SA, Rzeszowski Bank Regionalny SA, ABN AMRO BANKPolska SA, Raiffeisen-Centrobank SA, Westdeutche Landesbank Polska SA, Bank Œl¹skiSA, Bank Przemys³owy SA, LG Petro Bank SA.
5
Studies & Analyses CASE Nr 185 – Asset and Liability ...
Introduction
Asset/liability management (ALM) has been defined as "a planning procedure thataccounts for all assets and liabilities of a financial institution by rate, amount, and maturity.Its intent is to qualify and control risk. It focuses on the risk management of the netinterest margin for profit. ALM planning impacts directly on the volume, mix, maturity,rate sensitivity, quality, and liquidity of a bank’s assets and liabilities" [Woelfel, 1994]. Thisincludes setting integrated financial policy, structuring of loan repricing and maturityschedules, undertaking financial hedge positions, budgeting capital, and measuringinternal profitability. It also involves contingency planning and the analysis of the impactsof unexpected changes in interest rates, competition, and economic growth. All this is inorder to position a bank’s portfolio of loans and investments to maximize flexibility andreturn of a bank.
ALM requires banks to secure funds at particular rate of interest and to employ thesefunds at a yield in excess of the cost for maturity identical with that of the source of fund.To increase earnings, the management shall maintain a positive spread between the lowercost and the higher use of funds while maintaining similar maturities.
Balance-sheet risk is an integral part of ALM. It includes interest rates sensitivity,credit risk, liquidity risk, capital adequacy, foreign exchange risk and cost of funds risk.ALM attempts to produce an acceptable risk/reward ratio for a bank because of increasedcompetition and inflationary pressure on the pricing.
Since ALM plays a critical role in risk management, it is imperative that banksrecognize the ALM importance and apply effective risk management procedures.Effective implementation of advanced ALM techniques allows banks to hedge the risk andto maximize profitability in today's highly competitive markets for banking services.
Asset/liability management is a bank-specific control mechanism. Banks may applyeither standardized ALM techniques, or they may opt for using customized systems[Cole, Featherstone, 1997].
The main objective of this paper is to examine the ALM techniques used incommercial banks in Poland with special attention to risk management. The analysisallows for the assessment of safety, profitability and competitiveness of banking sector inPoland.
The paper consists of three main sections. Section I reviews theoretical foundationsand practical implications of assets/liability management, risk measurement andmanagement techniques. Section II examines the risk environment of commercial banksin Poland. The results of the survey of the Polish banking sector assessing ALM and risk
6
Studies & Analyses CASE Nr 185 – Katarzyna Zawaliñska

management are presented in Section III. The survey includes responses of 34 banksoperating in Poland. It was conducted in the second quarter of 1999 and it focused onvarious ALM and risk management techniques currently used. The study is summarizedwith suggestions for appropriate policies with respect of ALM and risk management in thePolish banking sector.
I. Theoretical and Practical Framework of ALM
This section demonstrates an overview of techniques used in ALM and riskmanagement. It presents classification of banking risk and defines various classes of risk.The analysis is aimed at providing a clear distinction between risk assessment and riskmanagement.
I.1 Key Concepts of Asset/Liability Management
The concept of the ALM was developed as a hedging reaction against the risk offinancial intermediation. As a discipline, ALM has been functioning since the beginning of1970s. At the initial stage, the management was based on the simple gap model thatanalyzes risk in terms of cash flows and the gaps or mismatches between assets andliabilities. As the experiences of financial institutions with risk management evolved, thecash flow gap models gradually gave way to duration gap models, which look more atthe market value of the bank's rate-sensitive assets and rate-sensitive liabilities (tochanges in interest rates) rather than just at the difference between them. At present,the rapid development in the ALM field is driven by such forces like: recent growth inthe capital markets, advancement in the theory and technology of risk analysis,education of financial intermediaries in the necessity as well as in implementation of ALM[Fabozzi, Konishi, 1998].
Fabozzi et al. (1998) identifies three requirements for a successful implementation ofALM. A thorough understanding of the ALM concept is the first among these requirements.It refers to a comprehensive recognition of the banking risk. Besides serving as a venuefor understanding the scope of risk, ALM allows for the quantifiable assessment andeffective management of various risk categories. Even in the absence of a formal ALMprogram, the understanding of these concepts provides a picture of the risk/rewardtrade-off in which the financial institutions are engaged. The second step or requirementfor the implementation of ALM is the development of an information system. Risk
7
Studies & Analyses CASE Nr 185 – Asset and Liability ...

management involves gathering and monitoring relevant data. The set of data alone islikely to provide valuable information about the degree of financial risk affecting theinstitution. The third step involves a design and implementation of the ALM decisionmaking process. The Asset Liability Committee (ALCO) usually carries out this process.
1.2 Banking Risk
Banking risk is an integral part of financial activities, and the management of risk iscentral to the bank financial management. As stated in the previous section, recognitionof various classes of risk is the first fundamental requirement for an effective asset/liabilitymanagement [Fabozzi, Konishi, 1998]. Therefore, this section demonstrates an overviewof various risk categories encountered by banking institutions, along with approaches tobank risk management. It elaborates the banking risk structure and presents the main riskmeasurement and management techniques.
1.2.1. Banking Risk ClassificationA useful definition of banking risk is provided by Saunders (1997). According to his
view, „banking risk is a probability that the actual return on banking investment will differfrom its expected return due to internal and/or external factors". The literature dividesbanking risk into six distinctively different categories: 1) Balance sheet risk, 2) Regulatoryrisk, 3) Technological risk, 4) Operational risk, 5) Strategic risk, and 6) Affiliation risk[Sinkey, 1998]. Only the balance sheet risk is scrutinized in this paper.
The balance sheet risk incorporates various types of portfolio risk recognition andassessment, which is particularly important to bank's management. The balance sheet risk(portfolio risk) in banking can be further classified into:
1) Interest rate risk – a risk resulting from changes in the level of interest ratesincurred by financial institution when the maturity of its assets and liabilities aremismatched.
2) Credit risk – a potential delinquency or default by borrower.3) Liquidity risk – inability to meet withdrawals and/or finance loans. 4) Foreign exchange risk – a risk that unexpected exchange rate changes can
negatively affect the value of assets and liabilities.5) Insolvency risk – a risk that a bank may not have enough capital to offset a sudden
decline in the value of its assets relative to its liabilities.6) Costs of fund risk – an unanticipated change in the costs of funds.
8
Studies & Analyses CASE Nr 185 – Katarzyna Zawaliñska

All these diverse types of portfolio risk require application of different tools andtechniques for its measurement and management. They are examined in the next section.
I.2.2. Balance Sheet Risk Measurement and Management Hedging and minimizing the risk are the main functions of risk management. In
general terms, risk management techniques can be grouped into three categories[Saunders, 1997]:
1. On-balance sheet matching of assets and liabilities in terms of repricing. For thattechniques such tools like GAP analysis and duration analysis are in use.
2. Off-balance sheet hedging of one or more risk categories. Among main tools hereare derivatives, financial futures, etc.
3. Securitization of assets. This technique takes the risk out of balance sheet byexchanging the assets into securities and selling them to investors.
All those risk management and measurement techniques are described in the nextsections with reference to particular types of risk.
Interest rate riskAmong the main tools used for interest rate risk measurement are GAP analysis,
duration analysis and the combination of the two. GAP measures the difference betweenrate-sensitive assets (RSA) and rate-sensitive liabilities (RSL) over a particular timehorizon. It provides a proxy measure of the bank interest income.
∆ r[GAP] = ∆ Net Interest Income = ∆ r [RSA-RSL]
The net interest income depends on the sign of the GAP, which is related to the directionof expected and unexpected interest rate changes. When the GAP is positive, the bank isprotected from increasing interest rates. When the GAP is negative, the bank gains fromdecreasing interest rates, assuming that they unexpectedly fall below the expected level.Table 1.1 summarizes the effects of the interest rates changes on the net interest income.
9
Studies & Analyses CASE Nr 185 – Asset and Liability ...
Table 1.1. Changes in Net Interest Income Due to Interest Rates Changes
GAP Interest rate changes Net Interest IncomeGAP positive increase increaseGAP positive decrease decreaseGAP negative increase decreaseGAP negative decrease increaseGAP = 0 increase nullGAP = 0 decrease null
Source: Œwiderski J. (1998)

Duration analysis is the second most commonly used technique of risk assessment.It examines the sensitivity of the market value of the bank's assets and liabilities to changesin interest rates. The technique is based on Maculay's concept of duration, whichmeasures the average lifetime of a security’s stream of cash payments. In technical terms,duration is the weighted-average time to maturity using the relative present values of cashpayments as weights – see Table 1.2.
Duration is expressed in years. The larger the numerical value of duration for an assetor liability (bank's total assets or liabilities), the more sensitive the price of that asset orliability (total assets or liabilities market value) is to changes in interest rates. Durationanalysis entails a comparison of the average duration of the bank assets to the averageduration of its liabilities. If the average duration of the bank's assets is longer than theaverage duration of its liabilities then the increase in interest rates causes the greater fallin the market value of the assets than in the value of liabilities. Consequently, the networth (assets minus liabilities) of the bank falls. By contrast, declining interest ratescontribute to a higher net worth of the bank.
In sum, both the duration and the GAP analysis are useful for the assessment of thebank exposure to interest rate risk.
For the purpose of interest-rate risk management, banks commonly apply a varietyof financial derivatives including interest-rate swaps, financial futures and options.Interest-rate swaps enable financial institutions that have a prevailing exposure to rate-sensitive assets rather than rate-sensitive liabilities to "swap" payment streams withfinancial institutions that have more rate-sensitive liabilities than rate-sensitive assets.Swaps do not require rearrangement of the banks’ balance sheet, thus they reduce theinterest-rate risk at relatively low cost. Financial futures and options may be preferred to
10
Studies & Analyses CASE Nr 185 – Katarzyna Zawaliñska
Table I.2. Duration analysisPercent changein market value of security = – (percentage-point change in interest rate ) *(Duration in years)
where: Duration is based on Maculay’s formula, n n D = ∑ τ [CPτ/(1+i)τ ] / ∑ [CPτ/(1+i)τ
τ=1 τ=1τ = time until cash payment is made; CPτ = cash payment (interest plus principal) at
time τ; i = interest rate; N = time to maturity of the security
Source: Mishkin (1989)

interest rate swaps since they normally entail lower transaction costs. However, they arestandardized and cannot be tailored to individual needs of banks that makes them lessflexible, thus disadvantageous in comparison to interest rate swaps.
Credit riskCredit risk is the uncertainty associated with a borrower’s loan repayment. If the
expected probability of default is d, then the expected probability of receiving payment is(1-d) [Sinkey, 1998]. Abstracting from a bank’s real resource costs such as salaries for loanofficers, processing costs, and other non-interest expenses, a profitable loan contractrate, r*, must compensate the lender for the time value of money, as reflected by the risk-free rate of interest, r, and the risk of default. The relationship can be presented in theform:
r* = (1+r/ 1-d) - 1.
The above equation captures the fundamental notion of a risk-return trade-off,namely, the bank profitable loan contract rate increases with its perception of theborrower’s probability of default (risk).
Banks must protect their interests by monitoring closely potential and existingborrowers. In order to diminish the probability of default, banks must screen out thegood credit risks from the bad ones. This reduces the danger of moral hazard [1], adverseselection [2] and asymmetric information [3] between the bank and the borrower. Oneway to accomplish effective screening is to collect reliable information from theprospective borrowers when they apply for a consumer or business loan. Other way ofcollecting and evaluating data on borrowers is by specialization in lending. Byconcentrating its lending on firms in specific industries, the bank becomes moreknowledgeable about these industries and is therefore better able to predict which firmswill be able to make timely payments on their debt. Banks must apply caution withrespect to specialization since there is a tradeoff between specialization anddiversification. Diversification is a risk management technique that enables them to
11
Studies & Analyses CASE Nr 185 – Asset and Liability ...
[1] Moral hazard results from a deceptive behavior on the part of the borrower or from the change in hisexpected behavior. For example, the borrower may engage in risky activities, which make it less likely that theloan will be repaid to the bank.
[2] Adverse selection occurs when the bank makes wrong decision by granting a loan to a risky client. Therisk is particularly increased when bank has too many high-risk borrowers.
[3] Asymmetric information – the information concerning a transaction which is unequally shared betweenthe parties to the transaction [Bannock et al., 1992]. In banking market, the borrower knows better whetherhe is capable of paying the credit back or not.

eliminate the concentration of risk. In addition to screening prospective clients, banks alsomonitor the existing borrowers, especially because they usually limit their borrowersfrom engaging in risky activities by putting written restrictions called covenants intoloans. By monitoring whether the borrowers are complying with the restrictivecovenants, banks can make sure that borrowers are not taking on risk at the bank’sexpense.
An additional way to obtain information about their borrowers is through long-termcustomer relationships. If a prospective borrower has had a checking account or savingsaccounts or other loans with the bank over a long period of time, the bank knows moreabout the borrower from his past activities and behavior.
Loan commitment is another way, which facilitates the long-term relationships andinformation gathering. It is a bank commitment to provide a firm, in specific period oftime, with loans up to a given amount in exchange for a commitment fee from theborrower that secures the loan. Loans available under such arrangements typically arepriced in one of two ways: 1) at a rate tied to the bank’s prime rate with no set maturityor 2) at a rate linked to a money-market rate, such as LIBOR or CD rate, with a fixedmaturity selected by borrower.
Among the main tools of credit risk management are collaterals, compensatingbalances and credit rationing. Collateral is a property promised to the lender as acompensation if the borrower defaults. Compensating balances, a form of collateral,require that a firm receiving a loan keeps certain minimum amount of funds in a checkingaccount at the bank. Credit rationing takes two forms. The first one occurs when a bankrefuses to loan any amount to a borrower, even when he is willing to pay a higher interestrate. The second one takes place when a bank restricts the size of the loan to less thanthe borrower would like. Credit rationing practices prevent adverse selection and moralhazard.
Liquidity riskLiquidity means the bank ability to meet withdrawals and to fund loans. Banks
maintain liquidity by either holding highly liquid assets, or by accessing the marketplace inorder to raise funds. Combination of these methods can be also applied. Raising funds inthe money market by purchasing them or in the capital market by issuing banks ownsecurities is not available to all banks since it requires that the bank has reputation,creditworthiness and market presence.
There are several ways to monitor and to evaluate bank liquidity. In day-to dayoperations banks manage liquidity by applying net liquidity statement. A net liquidityposition (the difference between sources and uses of liquidity) allows to monitor current
12
Studies & Analyses CASE Nr 185 – Katarzyna Zawaliñska

13
Studies & Analyses CASE Nr 185 – Asset and Liability ...
liquidity position closely [Saunders, 1997]. It provides a cash-flow measure of liquidity interms of a surplus or a deficit. Although a surplus indicates a liquidity cushion, the bankmust also consider the opportunity cost of such a position. Correspondingly, the bankmust consider the risk of running a liquidity deficit. A surplus (as a percentage of totalassets) of less than 3 to 5 percent is regarded as an early-warning signal [Sinkey, 1998].
Other ways of measuring liquidity exposure of the bank include: peer groupcomparison, application of liquidity index and measuring financing GAP and financingrequirements [Saunders, 1997]. Peer group comparison allows comparing banksfinancial ratios, such as current ratio [4], quick ratio [5] or cash ratio [6] and key financialstatement positions of the bank with banks of a similar size and geographical location.This analysis may signal inadequate liquidity position based on relative comparison.Liquidity index measures the potential losses from a sudden or fire-sale disposal of assets(premature sale) compared to a fair market value established under normal market sale.The greater the differences between immediate fire-sales asset price (Pi) and fair marketprice (Pi*) the less liquid the portfolio of assets.
nI = Σ [(wi) (Pi/Pi*)],
i
where: wi = the percent of each asset in the bank’s portfolio.
Financing GAP is the difference between a bank’s average loans and averagedeposits:
Financing GAP = Average loans - Average deposits.
A positive gap indicates excess of fund uses over funds sources. It has to be financedby reducing the banks cash position and other liquid assets and/or by borrowing in themoney market.
Thus:Financing GAP = - Liquid assets + borrowed funds.
This allows determining the relationship between the financing gap, the liquid assetsand the financing requirements (borrowed funds) as follows:
Financing GAP + Liquid assets = Financing Requirements.
[4] Current ratio = current assets/current liabilities.[5] Quick assets like cash, marketable securities, etc.[6] Cash ratio = cash/current liabilities.
A rising financing GAP can signal future liquidity problems for a bank since it mayindicate increased deposit withdrawals and rising loans due to increased exercise of loancommitments [Saunders, 1997].
In order to manage properly liquidity risk, banks must engage in liquidity planning asan integral part of bank financial forecasting. A carefully designed liquidity plan shouldconsists of the following components:
– specification of areas of managerial responsibility during the liquidity crisis; – list of those funds providers who are most likely to withdraw as well as the
seasonality schedule of fund withdrawals; – identification of the size of potential deposit and fund runoffs over various time
horizons in the future; – internal limits for separate subsidiaries and branches borrowings as well as bounds
for acceptable risk premiums to pay in each market; – sequencing of assets for disposal in anticipation of various degrees or intensities of
deposit/fund withdrawals. A carefully chosen combination of various liquidity management techniques and their
consistent application enable banks to diminish the overall liquidity risk.
Foreign exchange riskForeign exchange risk is a financial risk related to unexpected exchange rate
fluctuations. There are two sources of foreign-exchange risk: 1) holding long or shortpositions in foreign currencies and 2) holding assets and liabilities denominated in foreigncurrencies that are not equal [Sinkey, 1998].
Whether the bank gains or loses from unexpected changes in exchange rates dependson the value of its net exposure in a foreign currency, which measures the differencein book assets and liabilities denominated in foreign currency corrected by the net tradingposition in foreign currency. Sinkey (1998) expresses it as:
NET = [A(FX) -L(FX)] + NTP(FX)
where:NET = net exposure in a foreign currencyA(FX) = book assets denominated in foreign currency FXL(FX) = book liabilities denominated in foreign currency FXNTP(FX) = the net trading position in foreign currency FX = FX bought - FX sold.
When NET = 0, there is no foreign-exchange risk. When NET>0, the position isdescribed as "net long", which is vulnerable to unexpected depreciation in the value of the
14
Studies & Analyses CASE Nr 185 – Katarzyna Zawaliñska

foreign currency. When NET<0, the position is described as "net short", which isvulnerable to unexpected appreciation in the value of the foreign currency [Sinkey, 1998].
There are, in principle, two ways in which banks can manage the foreign riskexposure: on-balance-sheet hedging and off-balance-sheet hedging. Hedging on balancesheet consists of matching the bank's foreign asset and liability book. Banks can lock in apositive return or profit spread whichever direction exchange rates change over theinvestment period. Hedging with Forwards is an alternative method of hedging exchangerate risk (which allows for the balance sheet unchanged) by taking position in the forwardmarket for foreign currencies. The role of the forward foreign exchange contracts is tooffset the uncertainty regarding the future spot of rate on foreign currencies.
2. Balance Sheet Risk in the Polish Banking System
The previous section presented the concept of risk classification, measurement andmanagement. This section is aimed at examining the changes in the balance-sheet risk inthe Polish banking system over the last few years. The analysis is based on four balance-sheet risk categories: interest rate risk, credit risk, liquidity risk, and foreign exchange risk.
2.1. Interest Rate Risk
Interest rate risk, or risk stemming from volatility of interest rates, has become morepronounced in Poland since the end of 1996. It was exacerbated in 1997 by contagioneffects of the Czech and the Asian currency crises in the presence of the National Bankof Poland (NBP) willingness to stem the credit expansion. The restrictive monetary policyled to rising real interest rates. As documented by Figure II.1, the levels of nominal short-term interest rates at the end of 1995 and at the end of 1997 were comparable, althoughthe rate of inflation in 1997 was considerably lower than in 1995. The expanded volatilityof nominal rates signified the end of the period when interest rates volatility waspredictable. The large increase in real interest rates implied that the trend of interestrates became less predictable than before. Under these circumstances, banks and otherfinancial institutions became encouraged to apply better risk measurement andmanagement techniques [Konieczny, 1998].
Volatility of the interest rates has increased significantly since 1997. Particularly in1997, it was further triggered by more intense sales of securities by the banks in contrast
15
Studies & Analyses CASE Nr 185 – Asset and Liability ...
16
Studies & Analyses CASE Nr 185 – Katarzyna Zawaliñska
to the previous years [NBP, 1997]. The higher risk premium was associated with the lessliquid financial instruments (e.g. 5-year government securities) while more liquid shorterterm instruments (e.g. 52-week T-bills) became less risky, as implied by Table II.1. Theestimated loss from the investment of the amount of PLN 100 in 5-year governmentsecurities in 1998 reached PLN 21.6 (with the probability of 95 percent), while theestimated loss from the investment of the same amount in 2-year government securitieswas twice lower, reaching PLN 12.1. Foreign exchange loans, particularly those, whoserepayment did not require the currency exchange, were the least risky. The riskassociated with loans in foreign currencies that did require swaps to PLN, additionallycorrected by foreign exchange risk, essentially exceeded the risk of PLN loans[Konieczny, 1998].
On the one hand, the significant increase in interest rate risk had a deterioratingimpact on the credit risk. On the other hand, it also forced the bankers to grant loans tothe most efficient recipients. Apart from that, rising interest rates enhanced the demandfor risk hedging financial instruments that have been gradually introduced in Poland sincemid-1990s.
2.2. Credit Risk
The share of non-performing assets (NPA) in gross non-financial sector assets incommercial banks in Poland has been decreasing between 1993 and 1997 as evidencedin Table II.2. It amounted to 10.5 percent in 1998 and it was roughly the same as in 1997.By comparison, the share of substandard and doubtful assets (subcategories of NPA) intotal assets increased in 1998. Despite the unchanged share of non-performing assets in1998, the notional value of assets that served as a basis for creating loan-loss reservesincreased by PLN 1,281.0 million [NBP, 1999]. Their growth forced the banks to increasetheir reserves against loan losses, which in turn negatively affected profits.
The quality of foreign exchange assets relative to the PLN assets improved in 1998.The share of non-performing assets among foreign exchange assets was 7.1 percent whilethe share of non-performing assets in the amount of PLN assets was 11.5 percent. Thisreflects a decrease in the share of non-performing foreign exchange assets by 2.0percentage points and the increase in the share of non-performing PLN assets by 0.7percentage points comparing to 1997 – see Table II.2a.
As far as the quality of business assets are concerned, they showed a considerableimprovement in 1998, as implied by the decline in the share of non-performing assets

17
Studies & Analyses CASE Nr 185 – Asset and Liability ...
by 0.1 percentage point in the business sector. By contrast, the quality of householdassets worsened in the same year. The share of non-performing assets amonghouseholds increased between 1997 and 1998 from 5.4 to 6.4 percent as evidencedin Table II.2a.
The asset quality indicators are somewhat skewed. The significant shares of non-performing assets and lost assets in all assets of commercial banks from non-financialsector are biased by the past agreements, especially those made at the end of 1993. Theshare of non-performing assets at the end of 1998 due to the agreements made up to theend of 1993 amounted to 23.4 percent of total assets from non-financial sector. Thesimilar share for lost assets from non-financial sector amounted to 46.2 percent [NBP,1999]. That implies that the deterioration in quality of assets due to the agreements madein recent years is alarming. With respect to non-financial sector, in 1997 the share of non-performing assets in total assets from the year 1997 was 5.8 percent and for lost assetsthe share was 1.2 percent. In 1998, the shares for the year 1997 increased to 13.7 and3.4 percent respectively [NBP, 1999]. This drastic deterioration shows a strong, negativeimpact of rising real interest rates and expanding volatility of exchange rates and interestrates on asset quality in Poland.
Non-performing assets and lost assets from financial sector made up respectively 1.5and 1.2 percent of gross assets of the commercial banks in 1998 as evidenced in TableII.2b. Non-performing assets rose slower than the total assets from that sector (13.9versus 27.0 percent). However, due to the significant increase in lost assets, their sharein gross assets increased from 0.8 in 1997 to 1.2 percent in 1998.
In sum, the deteriorating quality of credits and the slower income growth contributedto the higher credit risk in the recent period. The current difficult conditions require amuch greater attention of banks in their credit risk management to the assessment ofcreditworthiness of borrowers, to monitoring the use of credit, and to the appropriateclassification of assets [NBP, 1999].
2.3. Liquidity Risk
The Polish banking system experienced a situation of excess liquidity prior to 1994.It was related to high interest rates, which did not encourage people to take credits. Butthe demand for credit began to grow very fast in the environment of declining interestrates. In addition, lower rates contributed to expanding maturity of fixed incomesecurities that began to appear in the Polish financial market. These factors contributedto the erasure of the excess liquidity in the banking system.
18
Studies & Analyses CASE Nr 185 – Katarzyna Zawaliñska
The fall in the liquidity between 1994 and 1996 is reflected by changes in the banks'liquidity ratios. Due to the growing demand for credit in 1996, some banks were not ableto gather deposits from non-financial sector as quickly as they gave credits to that sector.These banks had to borrow funds from financial sector. Consequently, their liabilities tofinancial sector rose faster than assets in this sector. It is demonstrated by the decreasingratio of financial sector net debt to total assets, which amounted to 11.5 percent in June1994 and 3.9 percent in June 1996 – see Table II.3.
Decreasing liquidity is further reflected by the change in the credit-to-deposits ratio.In December 1994 this ratio was 45.1 percent and in June 1996 increased to 52.6 percent.Selected banks gave more credits than they accumulated deposits. In some extreme cases,their credit-to-deposits ratios exceeded 200 percent. In a sharp contrast, several bankinginstitutions experienced a relatively faster growth of deposits, thus their credit-to-depositsratios declined in the same period. The fast expansion of credit induced banks to invest insecurities. This tendency contributed to a higher ratio of debt to total assets. The ratioincreased from 26.7 to 34.2 percent between the end of 1994 and June 1996. Togetherwith the fall in liquidity, the ratio of liquid assets to total assets also decreased, on averagefrom 47.0 to 45.7 percent at the same time period [¯u³awnik B., 1996].
The fall in liquidity forced banks to pay a more careful attention to the managementof assets and liabilities. The new financial instruments and the development of informationtechnology (IT) help the Polish banks to adjust the structure of assets and liabilities.
In 1998, the structure of assets and liabilities in the Polish banking system wascharacterized by the maturity mismatch between assets and liabilities that is a source ofpossible problems with liquidity. As demonstrated in Table III.4, the mismatch is in excessof liabilities with maturity up to one month, up to three month and up to one year overthe assets with similar maturities. There is also a mismatch in the excess of one-yearassets over one-year liabilities.
According to NBP (1999), the following factors contributed to the maturity mismatchof assets and liabilities in Poland:
– the term structure of liabilities, namely, the current and up to 1-year deposits fromnon-financial sector are excessive in relation to other deposits (less than one yeardeposits constitute 60.7 percent of net assets while long-term deposits are merely 1.2percent):
– the structure of assets, that consists mainly of over 1-year assets from non-financialsector and long term securities (18.6 and 9.1 percent respectively);
– financing a part of long-term assets by short-term liabilities.As shown in Table II.4, the GAP between assets and liabilities of maturity of up to one
month fell down between the end of 1997 and the end of 1998 (from –8.2 to –3.6

percent of net assets). Adversely, the GAP between assets and liabilities over 1-month to3-months, and over 3-moths to 1-year increased during the same time period. Thishappened mainly due to the increased role of debt among assets with the maturity of upto 1-month as a result of more active open market sales of 28-day T-bills by the NBP tobanks [NBP, 1999].
The shortage of long-term deposits is likely to persist in the future. According to theNBP report [NBP, 1999], the limited scale of long term deposits is attributable to:
– the low levels of wealth and income per capita in Poland, – the small interest rate spread between long-term and short-term deposits, – the new banking products playing role of long term sources of financing, which are
sometimes preferred to the long term deposits – this alternative actually offsets thedeposit shortage thus there is no negative effect on liquidity,
– the competitive yields on government securities, which are more preferable byhouseholds than the long term deposits.
In sum, the Polish banking system has been experiencing a gradual decrease inliquidity parallel to the increase in the liquidity risk. Nevertheless, the National Bank ofPoland [NBP, 1999] still claims the existence of structural excess liquidity in Poland, thatis the presence of "the excess of free sources, which can be effectively invested".
2.4. Foreign Exchange Risk
Polish banks operate in a relatively unstable exchange rate environment. Themovements of the PLN exchange rate directly affect foreign exchange risk exposureof Polish banks. An increase of the real interest rates in the beginning of 1997coupled with restrictive monetary policy and more stable economic conditionsencouraged foreign investment in PLN denominated fixed income securities. In orderto weaken the real appreciation of zloty, the NBP has conducted severalinterventions in foreign exchange markets since the beginning of 1997. The exchangerate regime has been altered as well. Namely, in February 1998, the RPP (MonetaryPolicy Council) of the NBP reduced the monthly rate of crawling devaluation from 1to 0.8 percent and, at the same time, widened the band of currency fluctuations from+/- 7 to +/- 10 percent. The move added flexibility to the Polish exchange ratesystem allowing the PLN to depreciate in nominal terms. In addition, there was atemporary shock of nominal PLN depreciation induced by the financial turmoil inRussia in August and September 1998. But the PLN began to quickly appreciate inreal terms at the end of 1998.
19
Studies & Analyses CASE Nr 185 – Asset and Liability ...

According to NBP (1999) the banks have extended their exposure in a foreigncurrency at the time of the PLN depreciation in terms of the leading internationalcurrencies. Correspondingly, they made their exposure in a foreign currency shorter attimes of the PLN appreciation. These adjustments appear to be highly sensitive andtransparent in Poland. Yet, the banks incur large losses from foreign currency exposureat times of unanticipated nominal shocks in exchange rates. Such deep shocks have beentriggered by the 1997/1998 Asian currency crisis and by the August/September 1998Russian payments crisis. They were rather effectively weathered off by the NBP whosemain operational committee (the RPP) decided to increase flexibility of the PLN exchangerate to weaken expectations of the future real appreciation and to increase the risk ofshort-term capital inflows. As a result, the stock of short-term portfolio capital was notsignificant enough to induce sudden reverse capital outflows at times of the Asian and theRussian financial crises.
3. Survey of ALM and Risk Management in the Polish Banking Sector
The preceding sections of the paper provide a theoretical background for the analysisof ALM in the Polish banking sector. The practical approach to the ALM and the riskmanagement in the Polish banking sector is examined on the basis of the survey of 34commercial banks conducted by the author in the second quarter of 1999. The surveyis aimed at investigating the various ALM techniques currently applied by commercialbanks. It enables to examine the existing institutional diversification among banksoperating in Poland.
3.1. The Survey Design
The questionnaire consisted of five areas: – bank characteristics and performance,– basic functions of the ALM department and the ALCO (Asset/Liability Committee), – risk measurement and management, – asset and liability management (ALM) techniques, – the bank’s Strengths-Weaknesses-Opportunities-Threats – (SWOT) analysis.
20
Studies & Analyses CASE Nr 185 – Katarzyna Zawaliñska

21
Studies & Analyses CASE Nr 185 – Asset and Liability ...
The bank characteristics and performance section focused on such categories as thebank size, tradition in performing banking activities, the ownership structure, and thetype of bank. In the section elaborating the ALM department and the ALCO, the surveyemphasized the experience and the main functions of top management and CEOs (ChiefExecutive Officers). The section on risk identification and management dealt withbankers’ perceptions of risk factors and their importance. This section examined variousrisk management techniques, including the scope of computer software applications forthis purpose. The next section ascertained the use of specific ALM techniques. Theanalysis of bank performance was enriched in the last section by SWOT analysisconducted by surveyed bankers.
3.2. Empirical Results
The questionnaire was presented to all 83 commercial banks operating in Poland [7]as of February 1999, and 34 banks responded to it (final survey response rate was 40,9percent). Among them, 28 were Polish [8] and 6 were foreign [9] banks. Amongrespondents, Polish private banks outnumbered state-chartered banks by three-to-one(7 state owned and 21 private) [10], consistently with the actual bank market structurein Poland.
3.2.1. Bank Characteristics and PerformanceThe average asset size for the 34 banks that responded to the survey was PLN
7,024.88 million, ranging from PLN 161.46 million to PLN 56,306.40 million [11] asindicated in Table III.1a. The mean asset size of the surveyed foreign banks amountedapproximately to a half of the mean asset size of all surveyed Polish banks. It amountedto PLN 3,267.28 million (for top ten Polish banks it was PLN 8,338.84 million and forother Polish banks it was PLN 7,547.42 million) – see Table III.1a.
Survey results show a high diversification in the size of assets among banks, asmeasured by the standard deviation from the mean level of total assets. Among all
[7] The questionnaires were mailed to the Chief Executive Officers.[8] Polish banks are defined as those with the share of the Polish capital exceeding 50%.[9] Foreign banks are defined as the banks in which the share of foreign capital exceeds 50%.[10] The ownership structure in all 83 commercial banks in Poland as of February 1999 was the following:
52 Polish banks (among them 13 state-owned and 39 private), and 31 foreign banks. [11] The asset size for the whole banking sector in Poland (83 banks) ranged from 33.8 million to 65,706.4
million PLN with a median of 1,048.5 million [NBP, 1999; Gazeta Bankowa, 1999].

standard deviations of the banks’ assets the highest was that for the group of "other Polishbanks". It amounted to PLN 17,802.43 million, which is more than twice larger than themean value of assets in that group. On the contrary, the groups of the foreign banks andof the ten largest private Polish banks are much more consolidated in terms of the size ofassets (standard deviations are PLN 4,571.3 million and PLN 6,315.21 millionrespectively, which is less than mean values of assets in both groups).
The high standard deviation in the group of other Polish banks implies that there is adiversified oligopoly structure in the Polish banking sector, where few large banks co-exist with a large number of small, undercapitalized banks. The analysis of banks sortedby asset size seems to confirm this finding – the group of banks with the largest assets ismuch smaller than the group of banks with the smallest amount of assets. Amongresponding banks, 47 percent have total assets not exceeding PLN 1 billion, 24 percenthave assets between PLN 1 and 10 billion, and 29 percent of the banks have assetsexceeding PLN 10 billion [12].
Similarly, there is also a significant dispersion of profitability among the surveyedbanks. The mean return on assets (ROA) for all surveyed banks was 1.82 percent andranged from 0.30 to 11.50 percent. The mean return on equity (ROE) was 16.43 percent,ranging from 2.86 to 40.20 percent as evidenced in Table III.1a [13].
Wide ranges of both ROA and ROE indicate significant differences in efficiency amongthe banks. Moreover, the survey results imply that large private Polish banks are moreefficient than the remaining Polish and foreign banks. As shown in Table III.1, both themean values of the ROA and ROE for the ten largest, private, Polish banks in the surveywere higher than for other Polish and for foreign banks. However, as measured by themedian values, average ROA of large private Polish banks and other Polish banks wereroughly equal, but the ROE for the other banks was larger than for the large Polish banks.
The mean capital ratio [14] for all banks was 19.77 percent and the ratio ranged fromthe extremely low 2.89 percent to the unreasonably high 48.33 percent. It can be furthernoted that only one among all surveyed banks did not satisfy the required minimum 8percent level of the capital ratio, and it was a Polish state owned bank [15]. The average
22
Studies & Analyses CASE Nr 185 – Katarzyna Zawaliñska
[12] This fact is even more visible in the whole Polish banking sector where in the group of commercialbanks with assets less than PLN 1 billion is 48.6 percent of banks, in the group of banks with assets betweenPLN 1 and 10 billion is 35.7 percent of the banks, and in the group of banks with the assets exceeding PLN 10billion is 15.7 percent of all commercial banks [Gazeta Bankowa, 1999].
[13] This compares to mean ROA of 1.52 percent and mean ROE of 17.65 for all commercial banks inPoland [Raport GB,1999].
[14] A ratio of capital to risk weighted assets is set by the Basle Committee at the level of 8%. This is alsoa required minimum level in the Polish banking system.
[15] In the whole banking sector in 1998, five banks had the capital ratio below the required 8 percent.

capital ratio for the ten biggest private Polish banks was lower than the average for allbanks in the survey – see Table III.1a.
Since there is a trade-off between profitability and solvency, the lower butsatisfactory level of the capital ratio implies higher efficiency of the large private Polishbanks. In general terms, the data prove a large diversification of Poland's banks in termsof their size, profitability and solvency, making it very difficult to find a commondenominator for the general assessment of the current state of the banking system.
A similar diversity exists in terms of the market concentration and the scale ofoperations. The number of branches among the surveyed banks ranges from 1 to 704,with the average of 70 among the Polish banks and 41 among foreign banks.Approximately half of the banks have from 1 to 10 branches, 35 percent have from 10 to100 branches, and 15 percent have 100 or more branches. Again, the data imply acoexistence of several national banks with a fairly large number of regional or localinstitutions in the Polish market.
3.2.2. Basic Functions of ALM Departments and Asset/Liability CommitteesThe survey shows that almost all banks have ALM departments. Among the surveyed
banks, only one bank reports having no formal ALM department, and it is a Polish bank.However, it is customary among the Polish banks that ALM functions are carried by avariety of departments ranging from Asset/Liability Departments, EconomicDepartments, Departments of Financial Policy, Treasury Departments, CapitalManagement Departments, Risk Management Departments to Credit Departments.There is clearly no uniformity in the organizational setting of ALM functions. In somebanks, several departments are involved in ALM. For example, in one bank four suchdepartments perform this task: the Credit Department, the Department ofDevelopment, the Department of Monetary Policy, and the Department of FinancialTransactions.
Most of the banks have both a formal ALM policy and an ALCO (Asset/LiabilityCommittee) as presented by data in Table III.1b. Nevertheless three or 9 percent of thesurveyed banks have no formal ALM policy, and only two have no ALCO. It is perplexingthat 10 percent of the largest private Polish banks report in the survey having no formalALM policy. However, all big private Polish banks as well as all the foreign banks reportedhaving ALCO. It seems puzzling that two banks that have ALCO report having no formalALM policy. There is also one small private Polish bank that reports having neither ALMpolicy nor ALCO.
In the prevailing number of cases, ALCO meets either once a week or twice a month.On average, this meeting frequency is higher than for example the one practiced by
23
Studies & Analyses CASE Nr 185 – Asset and Liability ...
24
Studies & Analyses CASE Nr 185 – Katarzyna Zawaliñska
American banks, where ALCO meets once a month for making strategic decisions.However, pricing committees meet more frequently there, at least on a weekly basis. Inthe case of Polish banks, more frequent meetings of ALCO may indicate either lessstrategic and more operational focus of ALCO or the lack of pricing and other similarcommittees.
The most important ALCO functions listed by the surveyed bankers include: liquidityrequirement management (in 97 percent of surveyed banks), risk management (94percent), followed by loan pricing (85 percent) and official statements on interest ratesforecasts (82 percent). Additional functions include: managing balance sheet structure, andstrategic decisions on capital, earnings, and solvency; reviewing financial plans, strategies andperformance; pricing the bank’s products, setting limits and fees; preparing economic andfinancial forecasts, budget plans, and financial analysis; controlling and reviewing investmentpolicy, security transactions and portfolios. The survey shows that ALCO concentrate on acombination of strategic decisions and, in the majority of cases, also on pricing decisions.A more operational approach is certainly consistent with a higher frequency of meetings.
The scope of ALCO functions is somewhat related to the experience of chiefexecutive officers and other top managers. The average experience of a CEO (measuredby a number of years of experience for chief executive officers involved with ALMDepartment or ALCO) was 4.09 years and ranged from 1 to 10 years. The mostexperienced, on average, were CEOs in foreign banks (5.33 years) and CEOs in the bigprivate Polish banks (4.64 years). The CEOs of the other surveyed, Polish banks are byfar less experienced, on average (3.55 years) as shown by the data in Table III.1b. All inall, these ranges imply that top executives of Poland's banks do not have long seniority orexperience record [16]. They might be still engaged in the process of learning andorganizing their strategic and operational activities. One of their key responsibilities is themanagement of financial risk.
3.2.3. Risk Measurement and ManagementThe first area of inquiry in this section was the risk perception by bankers. As
evidenced by the survey, the banks perceived the liquidity risk as the most importantcategory of risk. The liquidity risk is defined in the survey as a potential loss of liquiditydue to sudden withdrawals. It received a mean ranking of 1.53 [17]. As many as 59percent of the responding bankers ranked the liquidity risk as having the greatest
[16] The same is true for other officers in ALM Departments of the surveyed banks, where a meanexperience averaged three years and ranged from null to five years.
[17] All categories of risk were ranked on the scale from 1 to 5, where 1 indicates the most important riskand 5 the least important.

influence on the decisions of their bank. The credit risk was considered as the secondmost important risk factor by 54 percent of the surveyed banks. This risk was defined asa potential delinquency or default by borrowers and received the mean of 1.70. The thirdmost important risk was the interest rate risk, defined as the risk resulting from changesin the level of interest rates incurred by financial institution when the maturity of assetsand liabilities are mismatched. This risk scored on average 1.97 points from banks.Further ranks were obtained by the insolvency risk (2.12), cost of funds risk (2.85) andexchange rate risk (2.97) [18]. The ranking of risk factors by their relative importance isnot surprising under the current financial conditions in Poland. As discussed in the firstpart of the paper, both liquidity and interest rate risks have been increasing significantlysince 1996, thus they have become more critical for bankers. Credit risk is particularlyimportant for Polish banks since they are still burdened by old non-performing loans andcredits in their portfolios.
The second types of questions referred to the rating of factors contributing to the riskevaluation. The factors identified as dominant include interest volatility (listed by 53percent of the banks), and the state of the economy (listed by 35 percent of the banks).The competitive environment, changes in the banking law and the quality of personnelwere assigned a relatively lower importance, although they were viewed as critical to therisk position of the banks. Volatility of exchange rates was perceived as having a moderateimportance.
The third broad area of inquiry analyzed in this section refers to risk management andmeasurement. The survey implies that the foreign banks and the large private Polishbanks are more advanced in the use of the risk management and measurementtechniques than small private and big state owned banks are. Among the techniques andtools reported by surveyed banks the most popular were diversification of portfolio (94percent), followed by GAP analysis (88 percent) and simulation models (65 percent) – asshown in Table III.2. While all the foreign banks use the diversification and GAP analysis,respectively 93 percent and 86 percent of the Polish banks use these techniques.
The differences are even deeper when comparing the more advanced techniques ofrisk measurement and management. Thirty eight percent of all banks, mostly foreignbanks, use hedging with interest rate swaps and currency swaps. Half of foreign banks usethe interest rate swaps and 83 percent use currency swaps. Polish banks use thesetechniques less often. Interest rate swaps are used by 36 percent of all Polish banks andcurrency swaps are used by 29 percent of Polish banks. However, these techniques areapplied almost exclusively by large private Polish banks (67 percent of them use interest
25
Studies & Analyses CASE Nr 185 – Asset and Liability ...
[18] For definitions of the categories of balance-sheet risk see section I.

26
Studies & Analyses CASE Nr 185 – Katarzyna Zawaliñska
rate swaps while 56 percent use currency swaps comparing with 29 percent in case ofother Polish banks).
Further techniques are used by all surveyed banks in the following proportions:duration analysis (35 percent), hedging with financial futures (32 percent) and other typesof swaps (18 percent) (such as asset swaps, CIRS – interest rate-currency swaps, securityswaps, interest rate forwards, Fx. swaps). But again, the usage of the advancedtechniques varies among banks. In the group of the large private Polish banks, durationanalysis is used by 86 percent of respondents, simulation model is used by 89 percent,and 45 percent apply hedging with financial futures. Other Polish banks use thesetechniques to a lesser extent: duration analysis is applied by 25 percent of the banks,model is used in 58 percent of the banks and 18 percent of respondents hedge risk withfinancial futures. It is apparent that the big private Polish banks are able to apply advancedtechniques for risk management more often than the other Polish banks. Therefore theyare also better equipped to compete with foreign banks.
Foreign banks apply additional sophisticated techniques of risk management. Theyinclude such off-balance sheet products as hedging with interest swaps (reported by 50percent of foreign banks versus 36 percent of Polish banks), hedging with financial futures(50 percent versus 29 percent), and currency swaps (83 percent versus 29 percent), asevidenced in Table III.2.
There are other techniques, which are used rarely and only by a few surveyed banksoperating in Poland. Among them are various types of options (security options, exchangerate options), FRA, transactions Netta, buy-sell back, and sell-buyback [19]. The fact thatthe use of such techniques is not very popular may be explained to some extent by theirhigh costs and some institutional limits for their use.
In terms of on-balance sheet matching of assets and liabilities, the survey indicatesthat 88 percent of the banks apply gap analysis. The matching is accomplished by eitherrepricing interest rates on certificates of deposits (CD’s), by attracting new depositors,or by providing additional types of loans from outside of the current geographical market.Ninety four percent of all banks diversify their lending portfolio by providing additionaltypes of loans inside the current geographical market.
In terms of the loan structure of the surveyed banks, variable and adjustable loansprevail over the fixed rate loans (on average, 86.36 percent versus 13.64). Twenty sevenbanks (or 79 percent) claimed to have their own loan-pricing systems. It was usuallybased on reviewing the risk of creditor and of transaction. Creditor is analyzed in termsof the history of his previous credits, his current situation and his prospects for the future.
[19] Detailed description of these techniques goes beyond the scope of this paper and can be found in "TheNew Polgrave Dictionary of Money and Finance", The Macmillan Press Ltd., London, 1992.

Transactions are viewed in terms of sector risk structure, the duration of credit, totalcosts, total interests, and the net profit. The most usual loan-pricing method is called amethod of points. This method serves as basis for designing databases on creditors, e.g.RING (system of information on creditors).
Among all the banks, which use the GAP analysis, 93 percent measure 3-month gap,80 percent measure also 6-month gap and 67 percent measure 12-month gap. All threemeasured gaps had mostly negative signs, which means that the banks are protected frominterest rate decrease [20]. Duration analysis, which results from the GAP analysis, ishowever much less popular and used merely by 35 percent of surveyed banks. Banks,which measure the duration GAP do it usually for 3-month period (92 percent), fewer ofthem measure 6-month and 12-month duration GAP (67 percent). Most banks reporteda negative duration [21].
The reported most advanced risk management techniques include also simulation riskmanagement models. They are used by approximately two-third of the responding banks.Half of the banks uses one model, one-third uses two models, and two banks have morethan three models. Half of all respondents designed in-house models while 14 percentpurchased them (the rest of banks apply a combination of models designed in-house andpurchased).
There are some interesting relationships between the use of the risk managementmodels and bank characteristics. Results of the binary Probit model, presented in TableIII.3, indicate significant and positive relationship between the years of experience of theCEO and the use of risk management models. It suggests that the longer the CEO tenure,the more likely it be for a bank to use risk management software. A significant positiverelationship exists also between the use of risk management models and ROA, suggestingthat the banks which were able to apply risk management models (and generallyadvanced risk management techniques) achieved higher return on assets (as evidenced inTable III.3).
The application of risk models is directly related to risk awareness and the ability toevaluate it. The surveyed banks, which assigned higher ranking to all six categories of risk,were also more likely to have risk management models in place [22]. A significantnegative relationship exists between the asset size and the use of the models suggestingthat smaller banks are more likely to use the models (see Table III.3). However, due to
27
Studies & Analyses CASE Nr 185 – Asset and Liability ...
[20] But this statement is of limited significance, since many of banks did not answer the question aboutthe gap’s sign.
[21] Same as stated in the previous footnote.[22] Note that the closer to 1, the more important risk was (on the scale from 1 to 5), therefore the
averisk 6 coefficient in the Probit model has a negative sign.

positive correlation coefficient of 0.37 for Polish banks, this relationship can not beconfirmed.
A negative relationship between interest rate spread and the use of the riskmanagement models suggests that banks with active risk management techniques in placeexperience narrower interest rate spread between loans and deposit. The relationshipbetween ROE, ownership type, the age of bank, the years of experience of the CEO, thebank operating costs, the number of branches, and the use of the risk managementmodels were also examined. However, since the results did not indicate any significantrelationship between any of these variables and the use of risk management models, theyare omitted in this paper.
Further analysis of the survey pertains to interest rate margin between assets andliabilities, a major concern related to interest rate risk for financial institutions. The meanspread between deposits and loans for all banks was 7.9 percent, ranging from 4.4 to 10.87percent. Such a wide range indicates significant differences in pricing policies among banks.Usually foreign banks in transition economies experience a lower spread due to the absenceof non-performing loans from their balance sheet, however the surveyed foreign banksreported higher spread, 8.76 percent on average, ranging from 7 to 10.1 percent. Thespread at the Polish banks is on average approximately one percentage point lower, i.e. 7.69percent, but the range is wider (from 4.4 to 10.87 percent). This suggests that there aremore significant differences among Polish banks than in the group of foreign banks. Largeprivate Polish banks have lower spread than other Polish banks, and also a narrower rangeof the spread. This means that the large private Polish banks can more easily narrow theirinterest rate spread. This may be linked to better asset quality at big private Polish banks.
Banks were also asked to identify techniques used for lowering the costs of theiroperations. The most frequently listed included: budgeting (i.e. planning of costs for eachunit of the bank), increasing the productivity, rearrangements of workers, lowering thecost of funds, lowering fixed costs, monitoring and analyzing costs, implementation ofnew technologies, and personnel reductions.
3.2.4. Asset/Liability Management Asset/Liability Management was treated separately from the risk management.
Additionally, asset management techniques were distinguished from liability managementtechniques. In the questionnaire, the bankers were given the choice of ALM techniquesand they were asked to list the ones used in their banks.
The most commonly applied asset management techniques were loan product pricingand marketing, used by 85 percent of the banks. Further asset management techniques
28
Studies & Analyses CASE Nr 185 – Katarzyna Zawaliñska

ranked by the frequency of their use are investment techniques (59 percent), fees andpenalties (47 percent) and asset securitization and participation (29 percent) – asevidenced in Table III.4.
Generally, loan product pricing and marketing, fees and penalties, and investmenttechniques were more frequently mentioned by the foreign banks than by the Polishbanks (reported by 100, 67 and 83 percent of foreign banks respectively versus 82, 43,and 54 percent reported by Polish banks). Asset securitization and participation were morecommon among the Polish banks than among the foreign banks (32 versus 17 percent).The survey results for asset management techniques are summarized in Table III.4.
Most frequently mentioned liability management techniques included: match-fundedlending programs, analysis of the liability structure, analysis of fund use, analysis and forecastof costs of interests. The liability structure analysis was the most popular technique, usedby 94 percent of the banks followed by the analysis of fund use (59 percent) and match-funded lending program (32 percent). Foreign banks reported more frequent applicationof the above techniques than Polish banks did except for the analysis of fund use, whichis utilized by 33 percent of the foreign banks (versus 64 percent by the Polish banks). Thesurvey results for liability management techniques are summarized in Table III.5.
3.2.5. Bank SWOT AnalysisThe SWOT (Strengths-Weaknesses-Opportunities-Threats) analysis was added to the
questionnaire in order to enrich the examination of the Polish banking sector by thesurveyed bankers evaluation of their own institutions.
The results of SWOT analysis indicated some additional differences between theforeign banks and the Polish banks, as well as between big private Polish banks comparedwith other Polish banks. Most of the Polish banks listed as their strengths a well-developednetwork of branches, quality of the personnel, and recognizable name of the bank. Thebiggest Polish banks named also IT, high efficiency and good quality of assets. The foreignbanks listed a good credit quality, high liquidity and flexibility, IT, marketing and a goodquality of service.
Banks were somewhat reluctant to name their weaknesses. The largest private Polishbanks most frequently identified: a lack of central information system, lower profits fromthe exchange rate transactions, and lack of separation between retail and investmentactivities. Other Polish banks enumerated: lack of own funds, decreasing profits, highcosts, low quality of an old credit portfolio, underdevelopment of IT, risk management,insufficient diversification of deposit products. Foreign banks named: limited offer ofbanking products for the companies operating in the Polish market, limited scale ofbanking activities, and increasing competition from other foreign banks.
29
Studies & Analyses CASE Nr 185 – Asset and Liability ...

The large private Polish banks see their opportunities primarily in: retail banking,expected increasing demand for the financial services, mortgage lending, high and stableeconomic growth, the improvement of operating conditions for companies, and higherdiversification of the distribution channels for banking activities. Other Polish banks seetheir opportunities in: possible consolidation or merger with another bank, finding thestrategic investor, finding new clients, development of a better and broader product offer,focus on particular sectors benefiting from favorable economic conditions, economicstability, and the development of IT. Foreign banks see opportunities in their flexibility,servicing foreign exchange transactions, and specialization abilities.
Among the threats recognized by the biggest private Polish banks are: decreasing ofprofit margins, increased competition from foreign banks, mergers and acquisitions, anincreasing role of the new financial intermediaries, possibility of introduction of the Tobintax, lower profits from the exchange rate transactions. Other Polish banks are also afraidof the increasing competition from foreign banks and other financial intermediaries. Theysee threats in bad risk management, in decreasing profit margins, in bad conditions ofparticular sectors struggling to survive, in lower economic growth and also in theintroduction of the Tobin tax. Foreign banks are afraid mainly of decreasing profit margin,and of competition from other financial intermediaries in the Polish market.
On the one hand, ten largest private Polish banks outperform the other Polish banks(in opinion of the surveyed bankers) especially in the area of IT development, creditquality and risk management (which is also listed as threat by other banks). On the otherhand, foreign banks feel stronger than Polish banks in the similar areas i.e. credit quality,the development of IT and foreign exchange transactions. The threats of decreasing profitmargins and of the increasing competition from other financial intermediaries arecommon for all the surveyed banks.
3.3. Summary of the Survey Results
The sample of 34 banks that responded to the questionnaire seems to be an adequaterepresentation since its main characteristics are consistent with those of the whole Polishbanking sector composed of 83 commercial bank. However, due to some limitations suchas the small representation of foreign banks in the survey, the author applied cautionwhile comparing the Polish banks with the foreign banks. Nevertheless, the survey resultsare statistically valid and significant.
The survey results show a high diversification in the size of assets among banks. Onaverage, the foreign banks are smaller and less diversified (as for size of assets) than Polish
30
Studies & Analyses CASE Nr 185 – Katarzyna Zawaliñska

banks. The asset size of the Polish banks shows a huge spread. This may imply that thereis a diversified oligopoly structure in the Polish banking sector where few large banks co-exist with a fairly large number of small, vulnerable banks.
As the survey indicates, the large private Polish banks seem to be more efficient thanother Polish banks. The mean values of the ROA and ROE for the top ten private Polishbanks were higher than for the other Polish banks. Surprisingly, the ten largest privatePolish banks in the survey outperformed the foreign banks by ROA and ROE.
The survey demonstrates that the presence of ALCO has become a rule for mostPolish banks, with exception of some state-owned banks. By contrast, all top ten privatePolish banks as well as all foreign banks have ALCO. A high frequency of ALCO meetings(once a week or twice a month) may indicate either less strategic or more operationalfocus of the committee or the lack of pricing and other committees, which makedecisions on a more frequent basis. The most important ALCO functions include liquiditymanagement and risk management followed by loan pricing and by formal interest rateforecasts.
The analysis of risk awareness and management yields interesting conclusions. Theliquidity risk was the most important category of risk perceived by bankers. This risk wasalso indicated as having the greatest influence on the bank's pricing decisions. The creditrisk was considered as the second most important risk factor. Such ranking of risks can beattributed to the significant increase in both liquidity risk and interest rates risk between1996 and 1999 hence their significance to bankers. The reason that the credit risk isespecially important to Polish banks may be explained by the fact that many of them arestill burdened by old non-performing or lost loans in their portfolios.
The most frequently used risk management techniques reported in the survey areportfolio diversification, GAP analysis and simulation models.
Generally, the survey implies that foreign banks and large private Polish banks aremuch more advanced in the use of advanced risk management and measurementtechniques than small private and big state owned banks are. Above all, foreign banks usemore often off-balance sheet products hedging risk with interest swaps, financial futuresand currency swaps. Large private Polish banks are also likely to apply these advancedtechniques.
The survey revealed some interesting relationships among the use of advanced riskmanagement techniques (as e.g. risk management models) and bank activities. There is asignificant and positive relationship between CEO years of experience and the use of riskmanagement models. Positive significant relationship exists also between ROA and usethe of risk management models suggesting that their use positively affects profitability.Banks that demonstrated the risk awareness and the ability to evaluate risk were morelikely to apply risk management models. In the survey, the banks, which evaluated all six
31
Studies & Analyses CASE Nr 185 – Asset and Liability ...

categories of risk higher than other banks were also more likely to have risk managementmodels. In addition, the length of experience of the CEO in ALM and in ALCO activitiesseems to have a direct effect on the quality of risk management. In terms of thisexperience, foreign banks and large private Polish banks outranked other surveyed Polishbanks whose CEOs were less experienced.
A crucial part of the survey concerned ALM. Asset management techniques wereinvestigated separately from liability management techniques. Among asset managementtechniques loan product pricing and marketing was the most common one. Techniquesused for liability management include match-funded lending program, liability structureanalysis, analysis of fund use, and analysis and forecast of interest rates.
Results of SWOT analysis indicated some additional differences between the Polishand the foreign banks as well as between large private Polish banks versus other Polishbanks. The top ten private Polish banks consider themselves superior to the other Polishbanks in the development of IT, credit quality and risk management while foreign banksoutperform all Polish banks in not only in these areas but also in foreign exchangetransactions.
The fear of decreasing profit margins and increased competition from other financialintermediaries is a common threat among banks.
4. Conclusions and Policy Implications
The main conclusion from the paper is that only the strongest, the most solvent andbest-managed banks will survive the competitive environment of the increasingly openfinancial system in Poland. Big private Polish banks seam to be better equipped to facecompetition than small private and big state-owned ones for several reasons. Largeprivate Polish banks can more easily apply technology-based cost savings in order toimprove net interest margins. Generally, the falling interest rates are favorable for theimprovement in net interest margins since banks reduce the interest rate that it pays fordeposits before the average rate of return earned on loans and investments declines.Adversely, rising interest rates contribute to net interest margin deterioration.
The large private Polish banks are also better managed. They have more experiencedpersonnel thus they can afford to implement IT and more advanced ALM techniques.Therefore, this paper provides yet another argument in support of acceleratedprivatization and consolidation of the Polish banking system.
32
Studies & Analyses CASE Nr 185 – Katarzyna Zawaliñska

References
Bannock G., Baxter R.E, Davis E., (1992). "Penguin dictionary of economics". PenguinBooks, fifth edition.
Cole Ch. A., Featherstone A.M., (1997). "Assets/Liability Management in KansasBanks". Paper presented at the 1997 WAEA meeting, Kansas State University.
Crane K., Tabernacki Z. (1997). "The Outlook for Financial Markets Developmentin Poland". prepared for U.S.–Polish Economic Roundtable, Polanica, Poland, October6-8, 1997.
The Economist (1998). "Polish banks". Fear of foreigners, Finance and Economicssection, June 20th 1998.
Fabozzi F.J., Konishi A. (1998). "Zarz¹dzanie aktywami i pasywami". Zwi¹zek BankówPolskich, Warszawa.
Fink G., Haiss P. (1997). "Financial Market Reform in Eastern Europe". Fink G, Haiss P., Or³owski L., Salvatore D. (1998). "Central European Banks and Stock
Exchanges: Capacity Building and Institutional Development". European ManagementJournal, Vol. 16, No. 4, pp. 431-446.
Gazeta Bankowa (1999). "Aktywa i pasywa banków". 27 luty – 5 marca 1999. Gazeta Bankowa (1999a). "Najlepsze banki 1999". 29 maj – 4 czerwca 1999.GINB (1998). "Synteza sytuacji finansowej banków w 1997 r.". Generalny Inspektorat
Nadzoru Bankowego, Warszawa, marzec 1998.GINB (1997). "Synteza sytuacji finansowej banków w okresie I–IX 1997 r.". Generalny
Inspektorat Nadzoru Bankowego, Warszawa, grudzieñ 1997.Go³ajewska M., Wyczañski P. (1997). "Sytuacja finansowa banków w 1997 r.".
Materia³y i Studia, Zeszyt nr 76, NBP.Konieczny P. (1998). "Trudniejszy rynek". Gazeta Bankowa, 4.01.1998 r.Lepczyñski B., Paw³owicz L. (1997). "Sklasyfikowana dwudziestka". Rzeczpospolita,
30.06.1997.Mishkin F. S. (1989). "The Economics of Money, Banking, and Financial Markets". 2nd
ed., Scott, Foresman and Company, Glenview, Illinois, Boston, London.NBP (1999). "Ocena Sytuacji Ekonomicznej Banków w 1998 r.". Warszawa,
marzec 1999 r."The New Polgrave Dictionary of Money and Finance" (1992). The Macmillan Press
Ltd., London.
33
Studies & Analyses CASE Nr 185 – Asset and Liability ...

Rose P. (1997). "Zarz¹dzanie bankiem komercyjnym". Zwi¹zek Banków Polskich,Warszawa.
Saunders A. (1997). "Financial Institutions Management: A Modern Perspective". 2nded., Irwin/McGraw Hill Co., Boston, Massachusetts.
Sinkey J. F. Jr (1998). "Commercial Bank Financial Management". 5th ed., PrenticeHall, Inc., Upper Saddle River, New Jersey
Œwiderski J. (1998). "Finanse banku komercyjnego". Biblioteka Mened¿era iBankowca, Warszawa.
Woelfel Ch. J, (1994). "Encyclopedia of Banking & Finance". Tenth Edition, ProbusPublishing Company, Chicago, 1994.
¯u³awnik B. (1998). "Rachunek wyników". Gazeta Bankowa, 18.01.1998, Warszawa.¯u³awnik B. (1996). "Koniec potopu". Gazeta Bankowa, 24.09.1996.
34
Studies & Analyses CASE Nr 185 – Katarzyna Zawaliñska

35
Studies & Analyses CASE N
r 185 – Asset and Liability ...
Figure II.1. Short term interest rates in Poland between 1995 and 1997
0%
5%
10%
15%
20%
25%
30%
35%
1995Q1
1995Q2
1995Q3
1995Q4
1996Q1
1996Q2
1996Q3
1996Q4
1997Q1
1997Q2
1997Q3
years
inte
rest
ra
tes
InflationCPI changes
Discount rate Government securities
T-bills
Source: IFS

36
Studies & Analyses CASE Nr 185 – Katarzyna Zawaliñska
Table II.1. Approximation of risk premium of the main financial instruments during oneyear in 1998
Financial instruments Risk evaluation in % per PLN 100(confidence level 95%)
WIBOR 1M 6.4652-weeks T-Bills 4.402-year government securities 12.105-year government securities 21.60exchange rate USD/PLN 13.59exchange rate DEM/PLN 18.91LIBOR 1 M 0.11FIBOR 1M 0.90
Source: Konieczny P. (1998)
Table II.2 The share of non-performing assets in gross non-financial sector assets incommercial banks in Poland (end-year)
1993 1994 1995 1996 1997 1998Share of non-performingassets in gross assets: 31.0 28.5 20.9 13.2 10.5 10.5 substandard 7.5 5.9 5.4 4.1 3.9 4.0 doubtful 6.4 5.7 5.4 1.7 1.2 1.8 lost 17.1 16.9 12.0 7.4 5.4 4.7
Source: NBP (1999)
Table II.2a. The share of non-performing assets in gross non-financial sector assets incommercial banks in Poland
Share of non-performing …in gross assets:
12.1997 12.1998
assets 10.5 10.5foreign exchange assets 9.1 7.1PLN assets 10.8 11.5household assets 5.4 6.4business assets 11.6 11.5
Source: NBP (1999)

37
Studies & Analyses CASE Nr 185 – Asset and Liability ...
Table II.2b. Gross assets from financial sector in commercial banks in Poland
Structurein %1998
Nominalchange in 1998
(%)
Real change in1998 (%)
Gross assets fromfinancial sector
100 27.0 16.9
Share of non-performingassets in gross assets:
1.5 13.9 4.9
lost assets 1.2 104.3 88.1
Source: NBP (1999)
Table II.3. Liquidity in 35 banks with the largest own capital
Net debt in financialsector in total assets
Credits/Deposits
35 Banks with the largest owncapital
XII 1994 VI 1996 XII 1994 VI 1996
SUM 11.5% 3.9% 45.1% 52.6%
Dept instruments intotal assets
Liquid assets / Totalassets
35 Banks with the largest owncapital
XII 1994 VI 1996 XII 1994 VI 1996
SUM 26.7% 34.2% 47.0% 45.7%
Source: ¯u³awnik B. (1996)

38
Studies & Analyses CASE N
r 185 – Katarzyna Zawaliñska
Table II.4. Structure of Assets and Liabilities maturity
12.1997 6.1998 12.1998
Assets* Liabilities* GAP* Assets* Liabilities* GAP* Assets* Liabilities* GAP*
Up to 1-month 32,9% 41,1% -8,2% 35,5% 41,0% -5,5% 40,1% 43,7% -3,6%
Between1-moth and 3-month
7,5% 12,7% -5,2% 6,6% 13,0% -6,4% 5,0% 12,7% -7,7%
Between3-month and 1-year
16,0% 17,8% -1,8% 14,1% 17,7% -6,4% 13,4% 17,2% -3,8%
Over 1-year 31,0% 6,7% 24,3% 29,8% 6,1% 23,7% 28,9% 6,9% 22,0%
Others 12,6% 21,7% -9,1% 14,0% 22,2% -8,2% 12,6% 19,5% -6,9%
*Assets = Assets as % of net assets, Liabilities = Liabilities as % of net assets, GAP = GAP as % of net assets
Source: NBP, (1999)

39
Studies & Analyses CASE N
r 185 – Asset and Liability ...
Table III.1a. Comparison of selected indicators of 34 surveyed banks
Assets Capital ratioAll
surveyedbanks
10 BPP*banks
Other**Polishbanks
Foreign***banks
Allsurveyed
banks
10 BPP*banks
Other**Polishbanks
Foreign***banks
Mean 7 024.88 8 338.84 7 547.42 3 267.28 19.77 14.65 23.41 17.39Std. Err. 2 304.39 1 997.04 4 196.07 1 866.23 1.82 1.82 2.96 2.55Median 1 166.10 10 889.50 512.46 1 553.00 15.32 13.95 20.19 13.99St..Dev. 13 436.80 6 315.21 17 802.43 4 571.30 10.60 5.76 12.56 6.24Min. 161.46 549.00 161.46 564.00 2.89 8.13 2.89 11.90Max. 56 306.40 17744.4 56306.4 12530.4 48.33 28.7 48.33 26.2
ROA ROEAll
surveyedbanks
10 BPP*banks
Other**Polishbanks
Foreign***banks
Allsurveyed
banks
10 BPP*banks
Other**Polishbanks
Foreign***banks
Mean 1.82 2.52 1.47 1.28 16.43 18.17 15.88 12.23Std. Err. 0.35 1.02 0.23 0.12 1.71 3.15 2.71 2.66Median 1.41 1.55 1.54 1.30 15.77 15.80 15.85 10.28St..Dev. 1.94 3.24 0.93 0.30 9.55 9.97 10.83 6.51Min. 0.30 0.30 0.00 0.87 2.86 6.22 0.00 6.48Max. 11.5 11.5 3.6 1.6 40.2 40.2 36.66 23
* Ten biggest private Polish banks in the survey** Other Polish banks in the survey*** Foreign banks in the surveySource: Survey
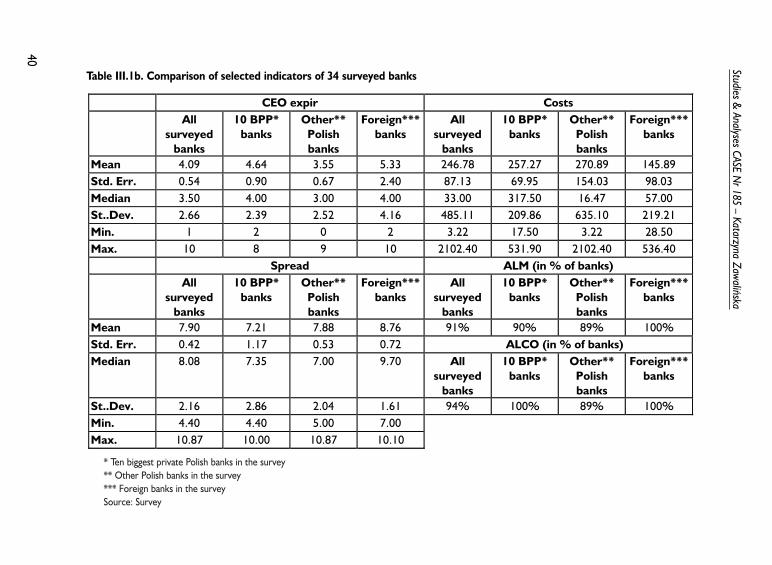
40
Studies & Analyses CASE N
r 185 – Katarzyna Zawaliñska
Table III.1b. Comparison of selected indicators of 34 surveyed banks
CEO expir CostsAll
surveyedbanks
10 BPP*banks
Other**Polishbanks
Foreign***banks
Allsurveyed
banks
10 BPP*banks
Other**Polishbanks
Foreign***banks
Mean 4.09 4.64 3.55 5.33 246.78 257.27 270.89 145.89Std. Err. 0.54 0.90 0.67 2.40 87.13 69.95 154.03 98.03Median 3.50 4.00 3.00 4.00 33.00 317.50 16.47 57.00St..Dev. 2.66 2.39 2.52 4.16 485.11 209.86 635.10 219.21Min. 1 2 0 2 3.22 17.50 3.22 28.50Max. 10 8 9 10 2102.40 531.90 2102.40 536.40
Spread ALM (in % of banks)All
surveyedbanks
10 BPP*banks
Other**Polishbanks
Foreign***banks
Allsurveyed
banks
10 BPP*banks
Other**Polishbanks
Foreign***banks
Mean 7.90 7.21 7.88 8.76 91% 90% 89% 100%Std. Err. 0.42 1.17 0.53 0.72 ALCO (in % of banks)Median 8.08 7.35 7.00 9.70 All
surveyedbanks
10 BPP*banks
Other**Polishbanks
Foreign***banks
St..Dev. 2.16 2.86 2.04 1.61 94% 100% 89% 100%Min. 4.40 4.40 5.00 7.00Max. 10.87 10.00 10.87 10.10
* Ten biggest private Polish banks in the survey** Other Polish banks in the survey*** Foreign banks in the surveySource: Survey

41
Studies & Analyses CASE N
r 185 – Asset and Liability ...
Table III.2. Techniques Used for Risk Measurement and Management
All surveyed banks Ten biggest privatePolish banks
Other Polishbanks
All surveyed Polishbanks
Foreign banks
Frequency % Frequency % Frequency % Frequency % Frequency %Dyverisfication of portfolio
32 94% 9 90% 17 94% 26 93% 6 100%
GAPanalysis
30 88% 7 70% 17 94% 24 86% 6 100%
Durationanalysis
12 35% 10 86% 4 25% 10 36% 2 33%
Simulationmodels
22 65% 20 89% 10 58% 20 71% 2 33%
Hedging withinterest ratesswaps
13 38% 10 67% 5 29% 10 36% 3 50%
Hedging withfinancial futures
11 32% 8 45% 3 18% 8 29% 3 50%
Currency SWAPS 13 38% 8 56% 5 29% 8 29% 5 83%
Other SWAPS 6 18% 6 18% 6% 18%
1. Asset swaps2. CIRS – interest rate – currency swaps3. Securuty swaps4. Interest rate Forward5. Fx swaps
Source: Survey
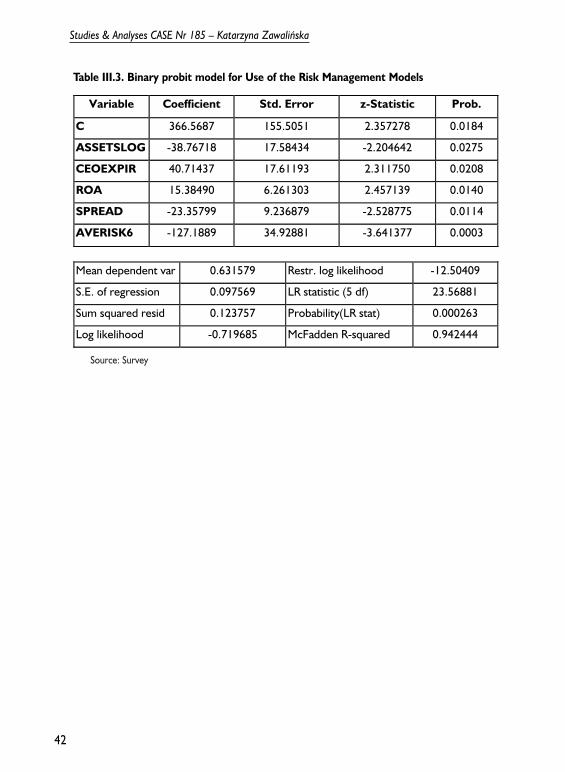
42
Studies & Analyses CASE Nr 185 – Katarzyna Zawaliñska
Table III.3. Binary probit model for Use of the Risk Management Models
Variable Coefficient Std. Error z-Statistic Prob.
C 366.5687 155.5051 2.357278 0.0184
ASSETSLOG -38.76718 17.58434 -2.204642 0.0275
CEOEXPIR 40.71437 17.61193 2.311750 0.0208
ROA 15.38490 6.261303 2.457139 0.0140
SPREAD -23.35799 9.236879 -2.528775 0.0114
AVERISK6 -127.1889 34.92881 -3.641377 0.0003
Mean dependent var 0.631579 Restr. log likelihood -12.50409
S.E. of regression 0.097569 LR statistic (5 df) 23.56881
Sum squared resid 0.123757 Probability(LR stat) 0.000263
Log likelihood -0.719685 McFadden R-squared 0.942444
Source: Survey

43
Studies & Analyses CASE Nr 185 – Asset and Liability ...
Table III.4. Techniques Used for Asset
TypeAll banks Polish banks Foreign banks
Frequency % Frequency % Frequency %
Loean pricing 29 85% 23 82% 6 100%
Fees andpenalties
16 47% 12 43% 4 67%
Investments 20 59% 15 54% 5 83%
Assetssecuritizationandparticipation
10 29% 9 32% 1 17%
Other 2 6%
1. Analysis and Pricing of Investment Portfolios2. Analysis of Assets due to sources of financing
Source: Survey
Table III.5. Techniques Used for Liability Management
TypeAll banks Polish banks Foreign banks
Frequency % Frequency % Frequency %
Match FundedLendingProgram
11 32% 9 32% 2 33%
StructureAnalysis
32 94% 26 93% 6 100%
Analysis ofFunds Use
20 59% 18 64% 2 33%
Other: 2 6% 2 7%
1. Analysis and forcast of costs of interests
Source: Survey

44
171 Ma³gorzata Markiewicz, Urban Górski, Marta Dekhtiarchuk, Monetary Policy inUkraine in 1996-1999
172 Ïàâåë Êîâàëåâ, Àëåêñåé Øàïîâàëîâ, Îñíîâíûå òåíäåíöèè ôèñêàëüíîéïîëèòèêè íà Óêðàèíå â 1994-1998 ãã.
173 Magdalena Tomczyñska, European Union Financial Transfers to ApplicantCountries
174 Ðîáåðò Áðóäçûíüñêè, Ìàðåê Äîìáðîâñêè, Ðîìàí Ìîãèëåâñêèé,Ýêîíîìè÷åñêèé êðèçèñ â Êûðãûçñòàíå â êîíöå 1998 ãîäà. Ïðè÷èíû è ïóòèâûõîäà
175 Mateusz Walewski, A Short Play on the Idea of the Laffer Curve in TransitionEconomies
176 Ìàðåê Ãóðà, Ìèõàë Ðóòêîâñêè,  ïîèñêàõ ðåôîðìû ïåíñèîííîé ñèñòåìû âÏîëüøå: «Áåçîïàñíîñòü â ðàçíîîáðàçèè»
177 Georges de Menil, Stephane Hamayon, Mihai Seitan, Romania's Pension System:The Weight of the Past
178 Katarzyna Zawaliñska, Agriculture of the Czech Republic, Hungary and Poland inPerspective of Joining Common Agricultural Policy � With Some Fiscal Remarks
179 Êàçèìåæ Êë¸ö, Áàíêîâñêèå ñèñòåìû Óêðàèíû, Êûðãûçñòàíà è Ãðóçèè â1991�1998 ãîäàõ. Èíñòèòóöèîíàëüíûé àíàëèç
180 Pavel �tìpánek, Ondøej Schneider, Present and Future Fiscal Policy Problems inthe Czech Republic
181 Krzysztof Po³omski, Tax System in Selected Transition Economies. An overview
182 Stanis³aw Gomu³ka, Comparative Notes on Pension Developments and Reformsin the Czech Republic, Hungary, Poland and Romania
183 Eugeniusz Kwiatkowski, Pawe³ Kubiak, Tomasz Tokarski, Procesy dostosowawczena rynku pracy jako czynnik konsolidacji reform rynkowych w Polsce
184 Mateusz Walewski, Restrukturyzacja tradycyjnych bran¿ przemys³owych wkrajach Europy Zachodniej � wybrane przyk³ady
185 Katarzyna Zawaliñska, Asset and Liability Management. The Institutional Approachto ALM by Commercial Banks in Poland: a Special Focus on Risk Management


