20
Internal Model – Advanced Uses Asset Management in General Insurance Internal Model Industry Forum AIG

Internal Model – Advanced Uses
Asset Management in General Insurance
InternalModelIndustryForum AIG

2
Contents
Introduction 4
Insurance industry uses of internal models 5
Model use description 7
Outputs of the internal model used in the reinsurance optimisation 8
Model use case study: treaty cancellation 9
Breakeven return periods between reinsurance premium and reinsurance recoveries 10
Impact on company’s risk appetite 11
Impact on Risk Adjusted Profits – our common currency 12
Model capabilities necessary to enable the use 13
Model limitations 14
Conclusion 16
About the authors 17
About the Internal Model Industry Forum and IRM 18
©2016 The Institute of Risk Management.
All rights reserved. No part of this publication may be reproduced, stored in a retrieval system or transmitted
in any form or by any means, electronic, mechanical, photocopying, recording or otherwise without the
express permission of the copyright owner. Permission will generally be granted for use of the material from
this document on condition that the source is clearly credited as being the Institute of Risk Management.
IRM does not necessarily endorse the views expressed or products described by individual authors within
this document.
3
ForewordOne of the key Solvency II principles is that insurers’ internal capital
models must be embedded at the heart of risk and capital evaluation and
they must be used as a key input to a wide range of business and strategic
decisions. However, one particular area of challenge/opportunity for the
industry is about consistently identifying the capabilities insurers will need
to support uses of the model that go beyond solvency calculations as well
as finding ways to share best practices.
Within this context, this booklet provides a practical perspective of using
internal capital models to support decisions relating to asset management
in general insurance. This case study is one of a series that is being
published following research by our ‘Flexibility and Advanced Uses of
Internal Models’ IMIF workstream. I would like to thank Raphael Borrel for
his leadership of that workstream, our authors Yoon-Kwong Loh, Guillermo
Donadini, Jeremy Baldwin, Christophe Travalletti and Laurence Dunkling
for agreeing to share their experience in this field and AIG for their
support.”
The Internal Model Industry Forum (IMIF) has produced a series of
documents offering guidance and sharing best practice on the validation
and use of insurers’ internal risk models. We are a market-wide initiative
aiming to ensure that these models create value for the business beyond
regulatory compliance.
José MoragoIRM Chairman and Founder of the Internal Model Industry Forum

4
Introduction The IMIF work-stream on ‘Flexibility and Advanced Uses of Internal Models’ was set up to allow insurance firms to share
insights on how they use internal risk models for business purposes beyond Solvency II compliance and how these various
uses are communicated and embedded into the business.
Internal risk models can potentially provide helpful input or support to a range of business decisions and processes but it
is vital that their use is appropriate and their limitations – and the impact of these limitations – properly understood by all
those involved. This requirement extends beyond the risk modelling team to any part of management that might use or
rely on the models, and also potentially to other interested parties like board members, regulators and investors.
A recent survey conducted by IMIF asked firms how those involved with these wider business decisions understood the
limitations of the internal model. The results – shown in Chart 1 below – showed that there is significant scope for better
understanding.
Chart 1: To what degree are the impacts of the limitations of the model on its intended use understood by all
required business decision makers? (Source: IMIF 2015)
To assist in this matter this work-stream intends to publish a number of case studies that will highlight:
• model capabilities and functionalities that can be built to enable specific model uses;
• model limitations, and their impact on the model use, on the reliability of the consequent management information
and on managing the resulting implications;
• practical examples of the uses of internal models
Ultimately, this work-stream will draw the key points from these case studies to publish a booklet to provide general
guidance on using models for different purposes. It will also provide a framework to document the model use, and its
limitations at use level. This will be available from the IMIF’s web page1.
1 www.theirm.org/knowledge-and-resources/thought-leadership/creating-value-through-internal-models/documents-and-resources.aspx
They do not know what the limitations are
They know what the limitations are but
their impacts are not understood
They somewhat understand the impact of
the limitations
They understand the impact of the
limitations on each relevant use
25%
12%
16%41%
5
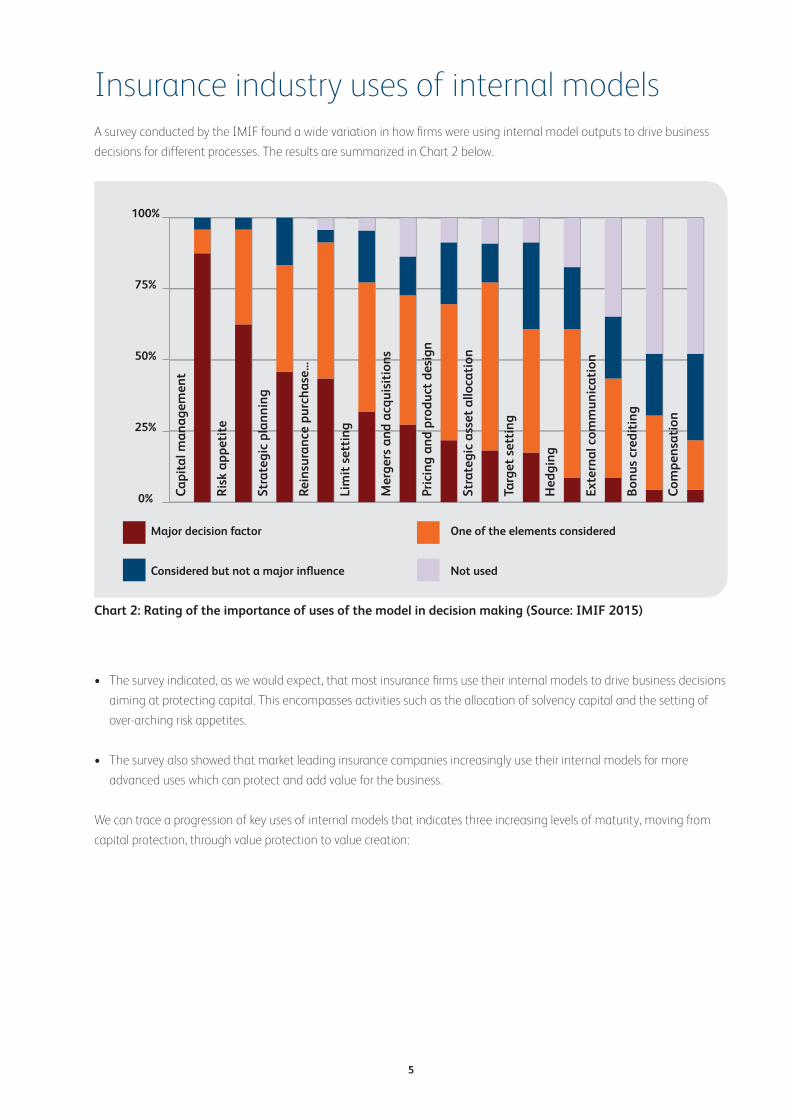
Insurance industry uses of internal modelsA survey conducted by the IMIF found a wide variation in how firms were using internal model outputs to drive business
decisions for different processes. The results are summarized in Chart 2 below.
Chart 2: Rating of the importance of uses of the model in decision making (Source: IMIF 2015)
• The survey indicated, as we would expect, that most insurance firms use their internal models to drive business decisions
aiming at protecting capital. This encompasses activities such as the allocation of solvency capital and the setting of
over-arching risk appetites.
• The survey also showed that market leading insurance companies increasingly use their internal models for more
advanced uses which can protect and add value for the business.
We can trace a progression of key uses of internal models that indicates three increasing levels of maturity, moving from
capital protection, through value protection to value creation:
100%
75%
50%
25%
0%
Major decision factor One of the elements considered
Considered but not a major influence Not used
Cap
ital
man
agem
ent
Ris
k ap
peti
te
Stra
tegi
c pl
anni
ng
Rein
sura
nce
purc
hase
...
Lim
it s
etti
ng
Mer
gers
and
acq
uisi
tion
s
Pric
ing
and
prod
uct
desi
gn
Stra
tegi
c as
set
allo
cati
on
Targ
et s
etti
ng
Hed
ging
Exte
rnal
com
mun
icat
ion
Bon
us c
redi
ting
Com
pens
atio
n

6
• Economic and Solvency capital
assessment and allocation.
• Understand capital implications
of business and strategic
decisions to make informed
choices.
• Setting of over arching appetites
such as capital buffers and
exposure limits.
• Reinsurance purchase
• Setting and monitoring risks
against multi point target risk
appetites (including performance
metrics such as earnings at risk)
• Support business plan
• ORSA
• Setting risk adjusted performance
targets for lines of business.
• Identifying more efficient uses
of capital that increase value
creation
• Setting and monitoring asset
allocation strategy
• Product pricing
• Reinsurance optimization
Supported by its survey and case study results, the work stream concluded that the current status quo for uses of internal
models is bound by constraints that can be generalized as follows:
• The level of reliance that the management of a firm will place on a model is largely dependent on the level of maturity
of this model.
• The uses of an internal model are expected to vary according to the scope, capabilities and limitations of the model.
The table below provides examples of key capabilities that can typically be expected for different model maturity levels
together with the typical uses of the model.
• Focus on the assessment of tail
losses
• Necessity to model dependencies
between risks
• Need to have a comprehensive
coverage of risks
• Multi point risk distribution
including tail
• One year and multi year view of
risk and capital
• Ability to measure impact of risks
on P&L and B/S
• Model granularity
• Ability to run the model with
different parameters for scenario
testing
• Ability to model different business
mix & scenarios
• Risk adjusted performance
measurement
• Flexibility and response time to
support management decisions
• Ability to measure value creation
• Requires more precision and
granularity of outputs
In this case study, our authors from AIG outline how they are using their internal model to support asset management
business decisions. This demonstrates how the internal model can be used for value creation.
Capital Protection
Capital Protection
Value Protection
Value Protection
Value Creation
Value Creation

7
Internal model and asset managementAIG Europe Limited (AEL) is one of the largest pan-European insurance company and the largest US-based property
and casualty insurer in Europe. In 2015, AEL wrote £3.5b in net written premiums across all major general insurance
classes with a particular focus on commercial lines which accounts for 76% of total net premiums written. AIG Europe
uses its internal model to support various enterprise-level, profit centre and business function decision making. The Asset
Management Group (AMG) is the investment function of AIG which operates on an arm’s length basis as a separate entity
from the insurance business. AMG is one of the key users of the internal model and is one of the key supporters of the
capital team alongside other departments such as Reinsurance, Data Science and Finance.
For most general insurance companies, their capital requirement will be driven by the same risks which they undertake
to generate profits. As underwriting profits and investment returns forms the bulk of an insurer’s profits, this means that
insurance risk and market risk are the key risk drivers of a firm’s capital requirements. It is therefore pivotal that the risk-
reward trade-off for these two risks are optimised. Whilst there is acceptance that it is more difficult to optimise insurance
risk due to various factors, including the fact that unlike investment assets there is no single quoted price for any particular
general insurance liabilities, it has been market practice to optimise a firm’s market risk using computer models since the
introduction of modern portfolio theory in the 1950s. An internal model constructed on a total balance sheet approach
therefore provides an enhanced platform to perform such modelling as it would have a more accurate and complete model
of the insurer’s liabilities.
We recognised the need to monitor our market risk on a more frequent basis as asset values fluctuate in real time and
are therefore more volatile than our liabilities. For this reason, we have embedded a daily market risk monitoring report
which reports the 1-in-200 year value-at-risk (VaR) of our £9bn portfolio of investible assets by asset categories and is
benchmarked against our market risk appetite to ensure that management has sufficient time to react before our risk
appetite is breached.
Our annual Strategic Asset Allocation (SAA) is a cooperative effort between AMG’s Analytics team, the capital team and
various other functions of the company. As an independent unit, AMG’s Analytics team already has the capability to
perform the SAA exercise on its own. However the internal model adds value to the process by quantifying its impact on
capital and to provide a more accurately view of our company’s insurance risk profile through its capability to:
• Model natural and man-made catastrophes explicitly;
• Model reinsurance recoveries explicitly; and
• Capture the inherent uncertainty (parameter and process risks) of the liability itself.
As a pan-European insurance company AIG Europe is exposed to liabilities denominated in multiple currencies. With
improved modelling capabilities, we implemented a FX Management Framework in 2015 which moved beyond asset-
liability matching to also address the currency risk associated with AIG Europe’s excess assets. Using the internal model, we
hold surplus assets in a risk balanced allocation across our major currencies. The primary purpose of this is to significantly
reduce AIG Europe’s capital surplus FX volatility. This ensures that AIG Europe would have sufficient EUR and USD assets to
meet exposure to potential non-GBP adverse losses.

8
Model use descriptionIn late 2013, the internal model moved from a project-based workstream to a business-as-usual approach. The existence
of the internal model represents a significant leap in asset-liability modelling capability for the firm as both asset and
liabilities are stochastically modelled under a total balance sheet approach. Before this, the Investment Analytics team
modelled liability cashflows as negative fixed income bonds which means that only volatility due to economic variables
(e.g. interest rates and FX movements) are captured but not the inherent uncertainty (parameter and process risks) of the
liability itself. Since then, AIG has embedded various asset management uses which are interlinked with the internal model
as the central analysis tool.
At around the same time, the asset management function completed the roll-out of the Investments Data Repository
(IDR). IDR is the global data warehouse for master data across the firm’s asset portfolio. It is the “single version of the
truth” for investment assets and is assembled from numerous sources.
The availability of these two technology implementations created a unique opportunity for AIG Europe to better embed an
integrated Internal Model uses for asset management. These uses can be broadly categorised into five areas:
A. Risk appetite/risk profile reporting
B. Daily market risk monitoring
C. Strategic Asset Allocation (SAA) & Tactical Asset Allocation (TAA)
D. Investment Risk-adjusted Profits (RAP)
E. Foreign Exchange (FX) Management Framework
IDR
A) RiskAppetite/
Risk Profile
InternalModel
B) DailyMarket RiskMonitoring
D) Investment
RAP
C) SAA andTAA
Liabilityrisk profile
ESG
E) FXManagement
Framework
9
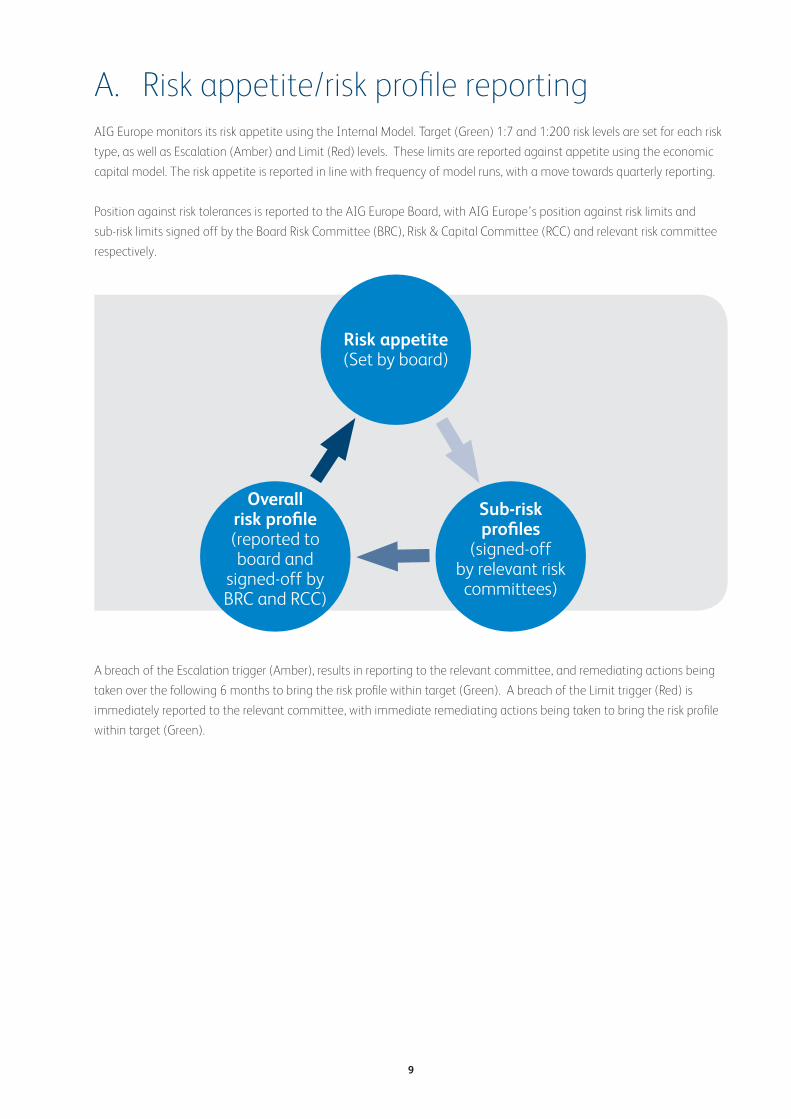
A. Risk appetite/risk profile reportingAIG Europe monitors its risk appetite using the Internal Model. Target (Green) 1:7 and 1:200 risk levels are set for each risk
type, as well as Escalation (Amber) and Limit (Red) levels. These limits are reported against appetite using the economic
capital model. The risk appetite is reported in line with frequency of model runs, with a move towards quarterly reporting.
Position against risk tolerances is reported to the AIG Europe Board, with AIG Europe’s position against risk limits and
sub-risk limits signed off by the Board Risk Committee (BRC), Risk & Capital Committee (RCC) and relevant risk committee
respectively.
A breach of the Escalation trigger (Amber), results in reporting to the relevant committee, and remediating actions being
taken over the following 6 months to bring the risk profile within target (Green). A breach of the Limit trigger (Red) is
immediately reported to the relevant committee, with immediate remediating actions being taken to bring the risk profile
within target (Green).
Risk appetite(Set by board)
Sub-risk profiles
(signed-off by relevant risk committees)
Overall risk profile(reported to board and
signed-off by BRC and RCC)

10
B. Daily market risk monitoringThe purpose of the Market Risk report is to:
• Report the 1-in-200 year market risk VaR at the European entity, asset cluster and portfolio level.
• To monitor these against the market risk appetite which is a sublimit of AIG Europe’s risk appetite framework.
• And to do so on a daily basis as asset market values changes in real time, as opposed to liability movements which is
updated on a quarterly basis by Corporate Actuarial.
* Figures are purely for illustration purposes.
As an embedded risk report, the Market Risk report is automated to minimise manual interventions within IDR which
is circulated to senior management and portfolio managers on a daily basis. Asset prices are updated daily and made
available in the report the next day (i.e. a T+1 basis) whereas the market risk charge is updated on a monthly basis.
For close of business: As of 31/12/2015 USD/GBP: 1.44335 EUR/GBP: 1.26938
Cluster AEL Inv Plan Class
Market Value GBP MM
Risk Charge (%)
Risk Charge GBP MM
Target Amber Escalation Threshold
Red Limit Threshold
Target vs Risk Charge
Amber Escalation Threshold vs Risk Charge
Red Limit Threshold vs Risk Charge
Status
Cash & Equiv Cash & Equiv 2,000 (1.00%) (20)Total 2,000 (1.00%) (20) 0 0 20 20 OK
Level 1 ERM Risk Free 1,000 1.00% 10High Grade AAA 1,000 5.00% 50High Grade AA 1,000 7.50% 75High Grade A 1,000 10.00% 100High Grade BBB 1,000 15.00% 150High Yield 1,000 22.00% 220Total 6,000 10.08% 605 700 735 95 130 OK
Level 2 CDO - CLO 250 15.00% 38RMB 250 25.00% 63CMB 250 20.00% 50Total 750 20.00% 150 200 210 50 60 OK
Level 3 Equity 125 25.00% 31Real Estate 125 25.00% 31Total 250 23.40% 63 100 105 38 43 OK
Total 9,000 8.86% 798 1,000 1,050 203 253 OK
InvestmentData
Repository(IDR)
Asset MarketValues
Checked by Internal Control
Team
Risk Charge currently updated
monthly
Circulated Daily
Asset Compositionis sent to ECM weekly
Market Risk Charge
Daily Market Risk Report
Circulation to Senior
Management, Asset Portfolio
Igloo Kernel
Solvency IIInternal Model

11
C. Strategic Asset Allocation (SAA) and Tactical Asset Allocation (TAA)Strategic Asset Allocation: Trade-off between risk and return
Our annual SAA is a co-operative effort between AMG’s Analytics team, actuarial, finance, science, ERM ad the capital
team. The Analytics team would first perform their modelling to generate a set of efficient portfolios which is then checked
by the capital team for capital affordability.
AIG Europe SAA Efficient Frontier
Expe
cted
Ret
urn
Risk/Volatility
OptimumPortfolio
Lending
Borrowing
AMG Analytics
Actuarial
FinanceScience
ERM ERM & ECM
SAA
Under Capital Asset Pricing Model (CAPM) theory, an efficient frontier is a set of portfolios such that no other portfolio
exists with a higher expected return but with the same level of risk. It assumes that the risk-return profile of a portfolio can
be optimised – an optimal portfolio displays the highest return earned in excess of the risk-free rate per unit of volatility.
This is traditionally the portfolio with the highest Sharpe ratio that is on the efficient frontier. Traditionally the Sharpe ratio
is based on the standard deviation. Using the internal model we have modified this approach to be based on the market
risk charge derived through the process set out above.
12
Tactical Asset Allocation: What do you do when interest rates and credit spreads start to rise?
That was the question which was posed by senior management towards the second half of 2015 just before the Federal
Reserve raised US interest rates for the first time since 2006 on 16 December 2015.
Working with the Investment Analytics team, we recommended a portfolio under a rising interest rate and credit spread
scenario which is optimised on both an internal measure and on SII capital. First the Analytics team generated a set of
efficient portfolios under the specified scenario. The same set of portfolios is then run through the internal model to test for
convergence.
There are two key differences between the optimisation performed by the internal model and the New York-based
Investment Analytics team:
1. The analytics team plots efficient frontiers based on trade-offs between:
• Surplus Return = E(Rportfolio ) – E(Rbaseline)
• Surplus Volatility = SD(Rportfolio ) – SD(Rbaseline)
Whereas the internal model optimises with respect to expected return and capital;
2. The Investment Analytics team models liability cashflows as negative fixed income bonds which means that only
volatility due to economic variables (e.g. discounting and currency movements) are captured.
The internal model improves on this by:
• Modelling natural and man-made catastrophes explicitly;
• Modelling reinsurance recoveries explicitly; and
• Capturing the inherent uncertainty (parameter and process risks) of the liability itself.
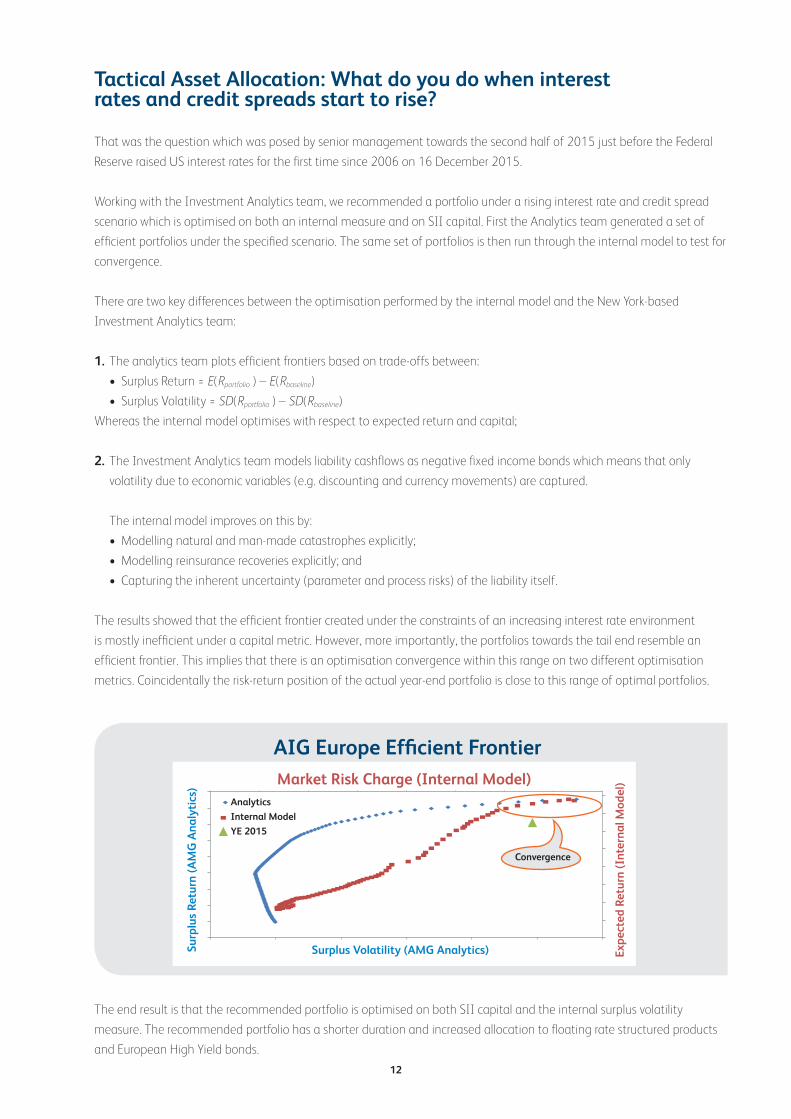
The results showed that the efficient frontier created under the constraints of an increasing interest rate environment
is mostly inefficient under a capital metric. However, more importantly, the portfolios towards the tail end resemble an
efficient frontier. This implies that there is an optimisation convergence within this range on two different optimisation
metrics. Coincidentally the risk-return position of the actual year-end portfolio is close to this range of optimal portfolios.
The end result is that the recommended portfolio is optimised on both SII capital and the internal surplus volatility
measure. The recommended portfolio has a shorter duration and increased allocation to floating rate structured products
and European High Yield bonds.
AIG Europe Efficient FrontierMarket Risk Charge (Internal Model)
Surp
lus
Retu
rn (A
MG
Ana
lyti
cs)
Surplus Volatility (AMG Analytics)
Analytics
Internal Model
YE 2015
Expe
cted
Ret
urn
(Int
erna
l Mod
el)
Convergence

13
D. Investment Risk-adjusted Profits (RAP), our “common currency”AIG has developed a global Risk-Adjusted Profit (RAP) framework for the purpose of ensuring an adequate return is
provided to investors, commensurate with the risk taken on the business. RAP helps to identify areas of the business for
growth, and those to be cut back, by making an allowance for the relative riskiness of each segment in budgeting and
performance measurement processes. It incentivises effective risk management processes.
Perhaps more importantly, RAP provides a “common currency” to measure economic profits across all AIG business.
Building on the daily market risk reporting work described earlier, RAP can now be applied to asset management through
the following formula:
RAP=Investment Income- Risk Charge % x Market Value x (Levered)Cost of Capital Rate%
When used together with the SAA process, this is another metric which can be used to provide a numerical comparison
between portfolios.
E. Foreign Exchange (FX) Management FrameworkAIG Europe holds its net asset position (capital resources) in each major currency in proportion to the currency breakdown
of its business risk’s contribution at the capital setting percentile, as calculated by AEL’s Internal Model. The primary
purpose of this is to significantly reduce AIG Europe’s capital surplus FX volatility.
AIG Europe does not optimise its currency risk with respect to the Standard Formula requirement as this would require us
to hold all of our assets in excess of liabilities in our reporting currency, namely GBP, rather than in the currencies of the
underlying liabilities. This approach to modelling currency risk has been described as being “counter-intuitive” by an EIOPA
QIS5 report.
As shown below, moving to such a framework ensures that AIG Europe would have sufficient EUR and USD assets to meet
exposure to potential non-GBP liabilities from adverse losses e.g. (catastrophe) exposure gained through the UK branch
of Lexington, our US-based surplus-lines insurance company. As it involved a significant reduction in our GBP holdings, it
would also act as a natural hedge against currency volatility due to Brexit (the UK exiting the EU).
* Figures are purely for illustration purposes
This FX Framework has been rolled out across AIG such that each regulated insurance entities would be required to hold
capital in each currency to match the binding capital requirements arising in that specific currency.
% of Capital held in major currencies
Before After (1-in-200)
GBP 90%
EUR10%
Others 5%
GBP 40%
EUR 40%
USD 15%
14
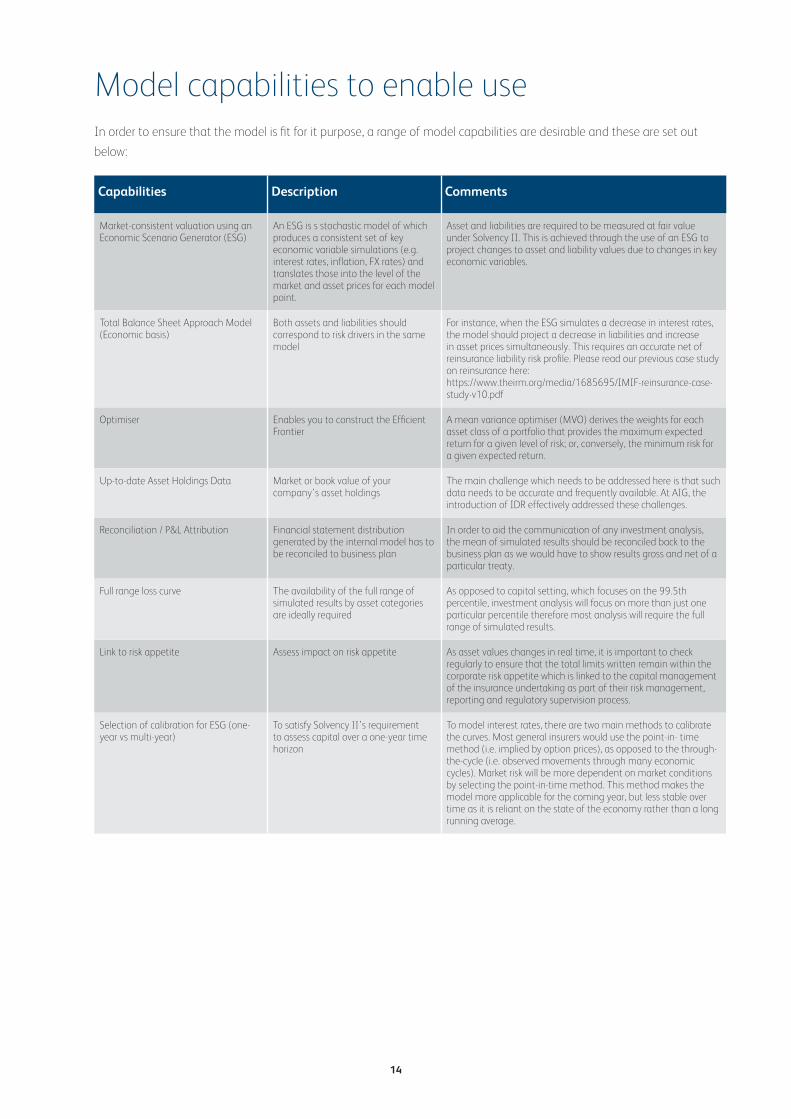
Model capabilities to enable useIn order to ensure that the model is fit for it purpose, a range of model capabilities are desirable and these are set out
below:
Capabilities Description Comments
Market-consistent valuation using an Economic Scenario Generator (ESG)
An ESG is s stochastic model of which produces a consistent set of key economic variable simulations (e.g. interest rates, inflation, FX rates) and translates those into the level of the market and asset prices for each model point.
Asset and liabilities are required to be measured at fair value under Solvency II. This is achieved through the use of an ESG to project changes to asset and liability values due to changes in key economic variables.
Total Balance Sheet Approach Model (Economic basis)
Both assets and liabilities should correspond to risk drivers in the same model
For instance, when the ESG simulates a decrease in interest rates, the model should project a decrease in liabilities and increase in asset prices simultaneously. This requires an accurate net of reinsurance liability risk profile. Please read our previous case study on reinsurance here:https://www.theirm.org/media/1685695/IMIF-reinsurance-case-study-v10.pdf
Optimiser Enables you to construct the Efficient Frontier
A mean variance optimiser (MVO) derives the weights for each asset class of a portfolio that provides the maximum expected return for a given level of risk; or, conversely, the minimum risk for a given expected return.
Up-to-date Asset Holdings Data Market or book value of your company’s asset holdings
The main challenge which needs to be addressed here is that such data needs to be accurate and frequently available. At AIG, the introduction of IDR effectively addressed these challenges.
Reconciliation / P&L Attribution Financial statement distribution generated by the internal model has to be reconciled to business plan
In order to aid the communication of any investment analysis, the mean of simulated results should be reconciled back to the business plan as we would have to show results gross and net of a particular treaty.
Full range loss curve The availability of the full range of simulated results by asset categories are ideally required
As opposed to capital setting, which focuses on the 99.5th percentile, investment analysis will focus on more than just one particular percentile therefore most analysis will require the full range of simulated results.
Link to risk appetite Assess impact on risk appetite As asset values changes in real time, it is important to check regularly to ensure that the total limits written remain within the corporate risk appetite which is linked to the capital management of the insurance undertaking as part of their risk management, reporting and regulatory supervision process.
Selection of calibration for ESG (one-year vs multi-year)
To satisfy Solvency II’s requirement to assess capital over a one-year time horizon
To model interest rates, there are two main methods to calibrate the curves. Most general insurers would use the point-in- time method (i.e. implied by option prices), as opposed to the through-the-cycle (i.e. observed movements through many economic cycles). Market risk will be more dependent on market conditions by selecting the point-in-time method. This method makes the model more applicable for the coming year, but less stable over time as it is reliant on the state of the economy rather than a long running average.

15
Limitation Link to Model Capabilities
Comments
Model Risk Links to all model capabilities
Model risk exists where there is an over-reliance on models when making business decisions which then leads to unexpected losses due to a model’s limitations and simplification. Conversely, the failure to use existing models and over-relying on expert judgements instead can also be viewed as type of model risk.
Negative Interest Rates
Market-consistent Valuation using an Economic Scenario Generator (ESG)
Several major Central Banks has been forced to break the zero-bound view and adopt negative interest rates. Therefore it is irrational to impose a zero-bound view (i.e. no negative interest rates) on interest rate paths simulated by ESGs. ESGs have the ability to simulate negative interest rates through its Libor Market Model+ (LMM+) module which AIG Europe has now adopted.
Linear correlation assumptions
Market-consistent Valuation using an Economic Scenario Generator (ESG)
The dependency structure of most ESGs assumes that correlations are linear, meaning that the same correlations apply to economic variables in all circumstances. In reality, the performance of asset classes becomes significantly correlated under extreme stress. If the option to apply a different dependency structure is not available in the ESG, the standalone simulated distributions for asset classes could be exported into the firm’s capital modelling platform where such modelling would be more easily performed.
Index representation
Market-consistent Valuation using an Economic Scenario Generator (ESG)
Certain asset categories are only modelled through indexation by ESG providers. Often we would have to assume that the equity or real estate series available within the ESG (e.g. FTSE100 index, UK house price index) are representative of those held by the company.
Reinvestment yields
Market-consistent Valuation using an Economic Scenario Generator (ESG)
In modelling future performance, the assumption that re-investment of insurance-generated cash flows will occur at the current portfolio yield is often made. If there is a strong view on yield direction over the modelling time horizon, then this should be incorporated into the re-investment modelling
Granularity Market-consistent Valuation using an Economic Scenario Generator (ESG)
Asset holding might have to be grouped together into a model point depending on the capabilities of the ESG. Often the credit spread model is aligned to reflect the average grade of bond and duration of a portfolio.
Limitations of the Value-at-Risk (VaR)
Total Balance Sheet Approach Model (Economic basis)
The limitations of VAR are well documented. Practitioners have come up with various ways to address its shortcomings depending on the purpose of its use. Users are advised to investigate if using a Tail-VAR (TVAR) or a transformed method would be better suited for the work they are undertaking.
Temporal mismatch
Total Balance Sheet Approach Model (Economic basis)
As assets values are available on a daily basis whereas liability values are only available quarterly, there would usually be a mismatch with regards to the timing of data and parametrization updates.
Frequency of update of ESG
Up-to-date Asset Holdings Data
An ESG update is a time-consuming exercise and this is often an issue about resourcing. Therefore, up-to-date asset values are often more readily available than an updated ESG. Therefore, the ESG should at a minimum be updated an annual basis. However, the speed with which the economic landscape changes can be rapid. Given sufficient resourcing, ESGs for general insurers should move towards a quarterly update.
Marked-to-market or Marked-to-model
Reconciliation / P&L Attribution
Where a marked-to-market value is unavailable, a marked-to-model value needs to be obtained either through a discounted cash flow model or through scenario analysis. This is usually necessary for private placements, real estate, structured products, certain derivatives and other exotic instruments where a quoted price is usually not readily available.
Planned FX movement
Reconciliation / P&L Attribution
The view about future rate movements may or may not be included within the ESG output. The standard setting of most ESGs is to allow for a planned FX movement reflecting the provider’s view of the future changes in pairwise currencies. However this could be overwritten in the internal model through scaling mechanisms. A “no planned FX movement” approach” helps provide consistent messaging internally about planned profit over the year in the same way the business plan doesn’t plan for a profit or loss from currency. This is not an unreasonable approach as currency risk is an unrewarded risk.
The weighting of past losses in parameterisation
Full range loss curve Historical-simulation models differ primarily in the span of time they include and the relative weights they assign to the immediate and more distant past. These differences become critical in periods of stress. The longer the look-back period, the more conservative the model; but the model also becomes less reactive to recent events. Put another way, the shorter the look back, the more likely it is that the model will provide early-warning signals – though these more reactive models also create faster change in front-office risk limits, making compliance more challenging.
Model limitationsEven the best models represent a simplified version of reality and its outputs would require significant sense checks by subject
matter experts and stakeholders. In a world of increasing modelling capabilities, a balance has to be achieved whereby model
outputs and expert judgements work hand-in-hand to achieve better decision making results. Therefore, it is important to not
treat an internal model like a black box and to continuously seek to understand its capabilities and limitations. In our opinion,
the best way to avoid over-reliance on models is to actively use a model and to gain feedback on its result.
Nevertheless the principle of proportionality has to be observed as the time (and cost) of further development may outweigh
the benefits. A range of common limitations are set out below, with a link to the affected model capabilities set out above.
16
ConclusionAs set out in this paper, various market risk analysis could be perform which not only utilises the capabilities of the ESG, but
other parts of the internal model to ensure that the overall risk profile of the company, particularly on the liabilities side, is
captured. This ensures that the risk reporting and asset allocation, amongst other work, pays sufficient regards to asset-
liability matching beyond the mean. For instance, there is an on-going global implementation of an FX framework which
will see AIG entities hold capital in each currency at the capital setting percentile. This ensures that we will have sufficient
funds in our major currencies if adverse events, such catastrophes, were to occur without the need to force sell to maintain
liquidity.
Furthermore, whilst risk-adjusted profit or economic profit frameworks already exist in most companies, in one form or
another, they are usually only applied to assess its insurance business when it could be expanded to investment and
reinsurance etc. Together, they form a useful “common currency” which is understood company-wide hence allowing for a
meaningful comparison between initiatives in different functions.
17
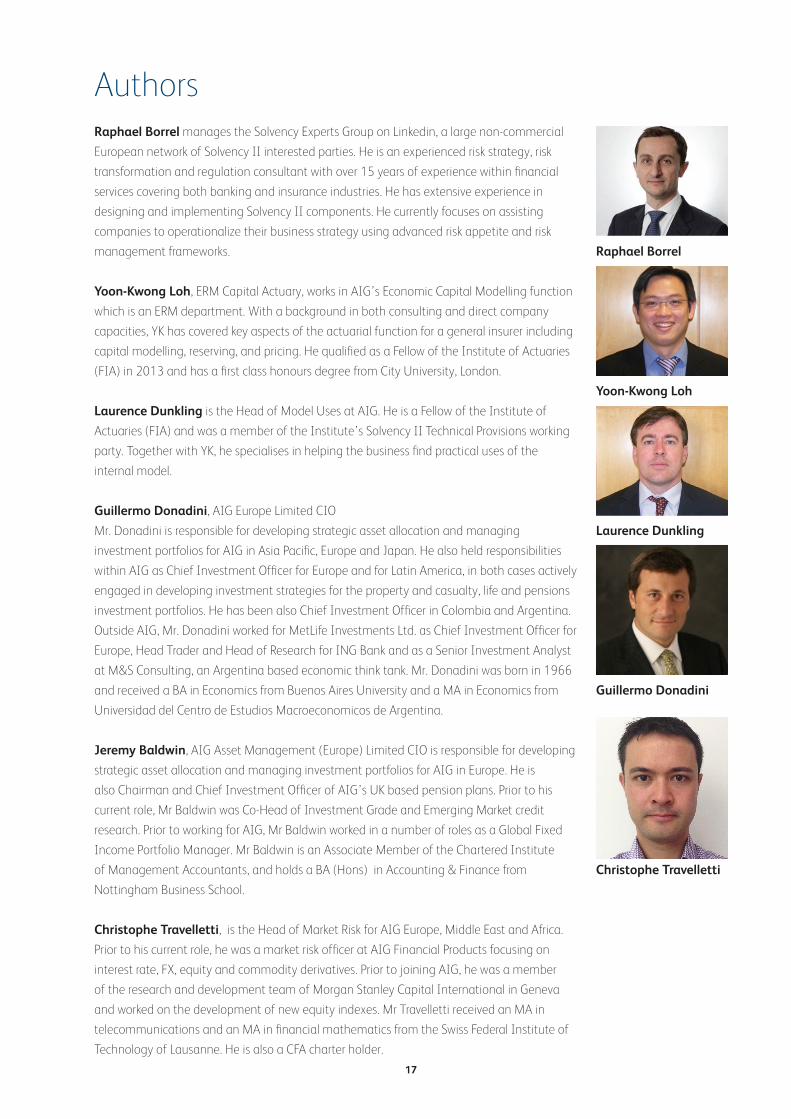
Authors Raphael Borrel manages the Solvency Experts Group on Linkedin, a large non-commercial
European network of Solvency II interested parties. He is an experienced risk strategy, risk
transformation and regulation consultant with over 15 years of experience within financial
services covering both banking and insurance industries. He has extensive experience in
designing and implementing Solvency II components. He currently focuses on assisting
companies to operationalize their business strategy using advanced risk appetite and risk
management frameworks.
Yoon-Kwong Loh, ERM Capital Actuary, works in AIG’s Economic Capital Modelling function
which is an ERM department. With a background in both consulting and direct company
capacities, YK has covered key aspects of the actuarial function for a general insurer including
capital modelling, reserving, and pricing. He qualified as a Fellow of the Institute of Actuaries
(FIA) in 2013 and has a first class honours degree from City University, London.
Laurence Dunkling is the Head of Model Uses at AIG. He is a Fellow of the Institute of
Actuaries (FIA) and was a member of the Institute’s Solvency II Technical Provisions working
party. Together with YK, he specialises in helping the business find practical uses of the
internal model.
Guillermo Donadini, AIG Europe Limited CIO
Mr. Donadini is responsible for developing strategic asset allocation and managing
investment portfolios for AIG in Asia Pacific, Europe and Japan. He also held responsibilities
within AIG as Chief Investment Officer for Europe and for Latin America, in both cases actively
engaged in developing investment strategies for the property and casualty, life and pensions
investment portfolios. He has been also Chief Investment Officer in Colombia and Argentina.
Outside AIG, Mr. Donadini worked for MetLife Investments Ltd. as Chief Investment Officer for
Europe, Head Trader and Head of Research for ING Bank and as a Senior Investment Analyst
at M&S Consulting, an Argentina based economic think tank. Mr. Donadini was born in 1966
and received a BA in Economics from Buenos Aires University and a MA in Economics from
Universidad del Centro de Estudios Macroeconomicos de Argentina.
Jeremy Baldwin, AIG Asset Management (Europe) Limited CIO is responsible for developing
strategic asset allocation and managing investment portfolios for AIG in Europe. He is
also Chairman and Chief Investment Officer of AIG’s UK based pension plans. Prior to his
current role, Mr Baldwin was Co-Head of Investment Grade and Emerging Market credit
research. Prior to working for AIG, Mr Baldwin worked in a number of roles as a Global Fixed
Income Portfolio Manager. Mr Baldwin is an Associate Member of the Chartered Institute
of Management Accountants, and holds a BA (Hons) in Accounting & Finance from
Nottingham Business School.
Christophe Travelletti, is the Head of Market Risk for AIG Europe, Middle East and Africa.
Prior to his current role, he was a market risk officer at AIG Financial Products focusing on
interest rate, FX, equity and commodity derivatives. Prior to joining AIG, he was a member
of the research and development team of Morgan Stanley Capital International in Geneva
and worked on the development of new equity indexes. Mr Travelletti received an MA in
telecommunications and an MA in financial mathematics from the Swiss Federal Institute of
Technology of Lausanne. He is also a CFA charter holder.
Raphael Borrel
Yoon-Kwong Loh
Laurence Dunkling
Guillermo Donadini
Christophe Travelletti
18
The Internal Model Industry Forum This document has been produced by the Internal Model Industry Forum (IMIF). The
Institute of Risk Management (IRM) set up the IMIF in 2014 to address the key questions
and challenges that insurers face in the use, understanding and validation of internal risk
models. It is designed to work in a collaborative way to develop and share good practice
to ensure that these models add value to the organisation and support regulatory
compliance. IMIF now has over 300 members and we have run a series of Forum meetings
to explore key issues. A number of workstreams are also undertaking research and we aim
to publish the results along with other useful resources and guidance.
The IMIF work is led by a steering committee comprising modelling experts from insurers
alongside representatives from EY, KPMG, LCP, Milliman, PWC, the Institute and Faculty of
Actuaries and the Bank of England Prudential Regulation Authority.
As the leading organisation promoting education and professional development in all
aspects of risk management, IRM is pleased to be able to support this industry initiative to
share good practice
More information about the IMIF and its work can be found on the IRM website
www.theirm.org
Who are the IRM? This work has been supported by members of IRM, which has provided leadership and
guidance to the emerging risk management profession for over 25 years. Through its
training, qualifications and thought leadership work, which includes seminars, special
interest and regional groups, IRM combines sound academic work with the practical
experience of its members working across diverse organisations worldwide. IRM would like
to thank everyone involved in the IMIF project.
InternalModelIndustryForum

19

InternalModelIndustryForum
IRMT: +44(0) 20 7709 9808
www.theirm.org
Institute of RiskManagement2nd Floor, Sackville House
143-149 Fenchurch Street
London
EC3M 6BN
United Kingdom


