ASSET MANAGEMENT PERFORMANCE BENCHMARKING in the WATER INDUSTRY Sandy Muir, BE (Civil) MIE Aust Principal Consultant, i-business Consulting December 2004 Background In 2003, The Water Services Association of Australia (WSAA) developed an Asset Management Assessment Framework to benchmark and identify potential improvement in key areas of asset management. The framework invited authorities to undertake a self-assessment of their asset management processes on-line. These results were then reviewed and validated by external audit teams. Following the self-assessment and auditing process the results were collated in a central database and used to produce confidential benchmark results. To assist in the identification of potential improvements each participating authority was presented with a report identifying where the authority stands relative to other participants. The principal measure of project success was to identify improvements in asset management practices for participating authorities and the Water Industry in general. Using this framework the Project was initiated by WSAA and a consortium of consultants appointed. This consortium was lead by Maunsell Australia and supported by Cardno MBK. The Program The consortium was responsible for: • Undertaking the individual audits of the self assessments; • Compilation of benchmark results; • Identification of areas for potential improvements in Asset Management for each authority; and • Facilitating a best practice workshop to assist in sharing information on best practice identified throughout the project. This was delivered by: 1. Facilitating a kick-off workshop to explain the process to participants; 2. Providing a telephone and email ‘hotline’ to provide ongoing support during the self- assessment period; 3. Self-assessment undertaken by the water authorities; 4. Undertaking onsite audits of the self- assessments to ensure consistency of benchmarks; 5. Undertaking international research to identify opportunities for asset management improvement; 6. Compilation of industry asset management best practices into a single industry report; and 7. Identification of individual improvements for each authority. WSAA Benchmarking Framework The project delivered, through benchmarking, the status of each authority against the current best practice in the Australasian water industry in the following asset management functions: • Corporate Policy and Business Planning; • Asset Capability Planning; • Asset Acquisition; • Asset Operations; • Asset Maintenance; and • Asset Replacement and Rehabilitation. The functions have been broken down by identification of processes and sub-processes. Within the sub-processes a series of measures appropriate to each sub-process were defined. The six functions described above account for 600 measures.
Transcript
ASSET MANAGEMENT PERFORMANCE BENCHMARKING
in the
WATER INDUSTRY
Sandy Muir, BE (Civil) MIE Aust Principal Consultant, i-business Consulting
December 2004
Background
In 2003, The Water Services Association of Australia (WSAA) developed an Asset Management Assessment Framework to benchmark and identify potential improvement in key areas of asset management. The framework invited authorities to undertake a self-assessment of their asset management processes on-line. These results were then reviewed and validated by external audit teams. Following the self-assessment and auditing process the results were collated in a central database and used to produce confidential benchmark results. To assist in the identification of potential improvements each participating authority was presented with a report identifying where the authority stands relative to other participants. The principal measure of project success was to identify improvements in asset management practices for participating authorities and the Water Industry in general. Using this framework the Project was initiated by WSAA and a consortium of consultants appointed. This consortium was lead by Maunsell Australia and supported by Cardno MBK.
The Program
The consortium was responsible for:
• Undertaking the individual audits of the self assessments;
• Compilation of benchmark results;
• Identification of areas for potential improvements in Asset Management for each authority; and
• Facilitating a best practice workshop to assist in sharing information on best practice identified throughout the project.
This was delivered by: 1. Facilitating a kick-off workshop to explain the
process to participants;
2. Providing a telephone and email ‘hotline’ to provide ongoing support during the self-assessment period;
3. Self-assessment undertaken by the water authorities;
4. Undertaking onsite audits of the self-assessments to ensure consistency of benchmarks;
5. Undertaking international research to identify opportunities for asset management improvement;
6. Compilation of industry asset management best practices into a single industry report; and
7. Identification of individual improvements for each authority.
WSAA Benchmarking Framework
The project delivered, through benchmarking, the status of each authority against the current best practice in the Australasian water industry in the following asset management functions:
• Corporate Policy and Business Planning;
• Asset Capability Planning;
• Asset Acquisition;
• Asset Operations;
• Asset Maintenance; and
• Asset Replacement and Rehabilitation.
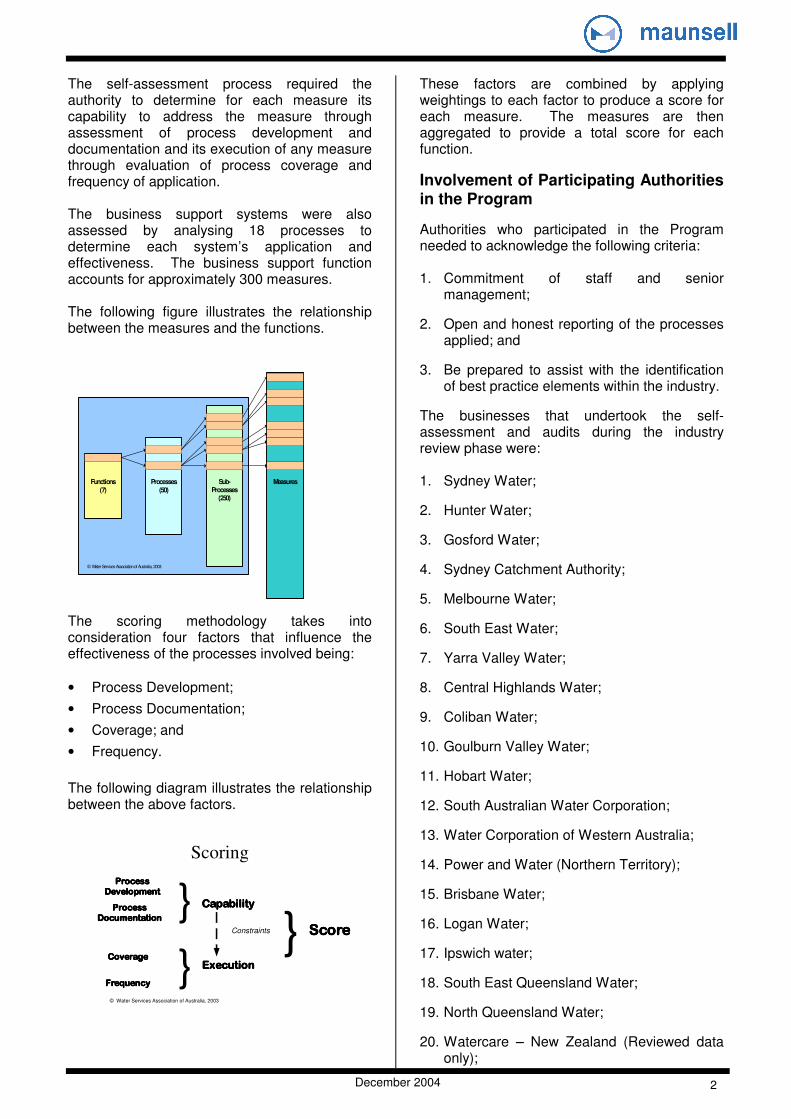
The functions have been broken down by identification of processes and sub-processes. Within the sub-processes a series of measures appropriate to each sub-process were defined. The six functions described above account for 600 measures.
The self-assessment process required the authority to determine for each measure its capability to address the measure through assessment of process development and documentation and its execution of any measure through evaluation of process coverage and frequency of application. The business support systems were also assessed by analysing 18 processes to determine each system’s application and effectiveness. The business support function accounts for approximately 300 measures. The following figure illustrates the relationship between the measures and the functions.
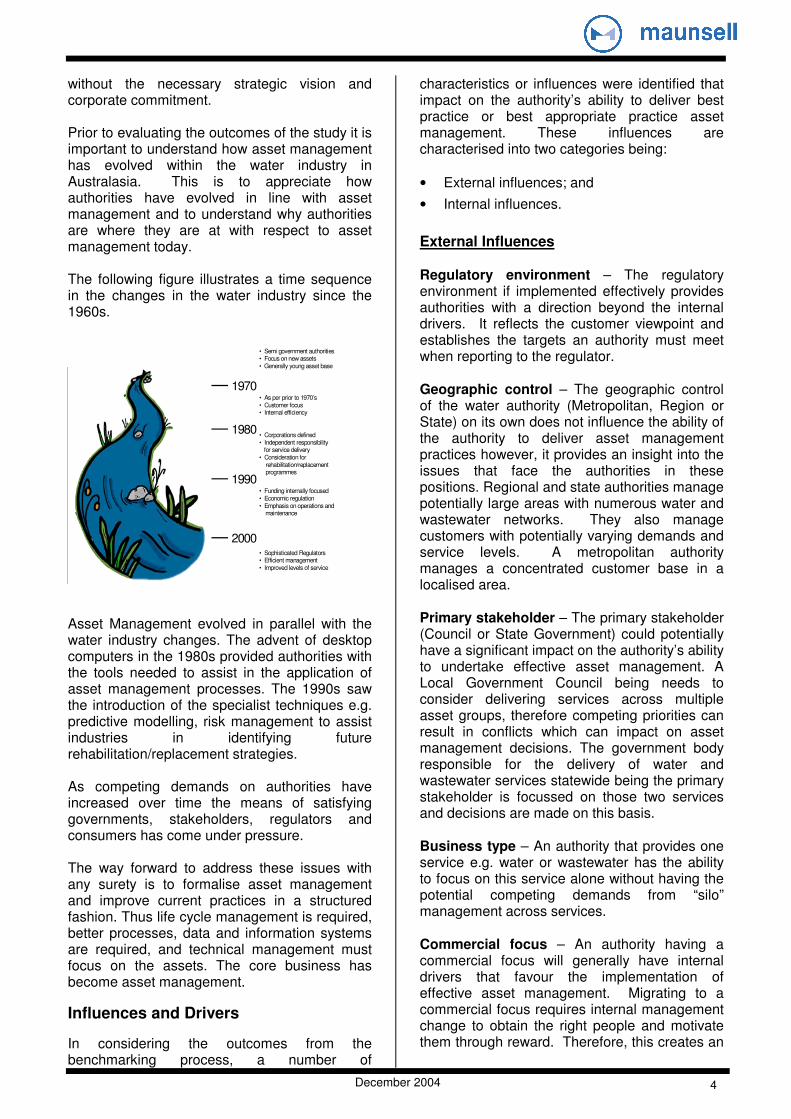
The scoring methodology takes into consideration four factors that influence the effectiveness of the processes involved being:
• Process Development;
• Process Documentation;
• Coverage; and
• Frequency.
The following diagram illustrates the relationship between the above factors.
These factors are combined by applying weightings to each factor to produce a score for each measure. The measures are then aggregated to provide a total score for each function.
Involvement of Participating Authorities in the Program
Authorities who participated in the Program needed to acknowledge the following criteria: 1. Commitment of staff and senior
management;
2. Open and honest reporting of the processes applied; and
3. Be prepared to assist with the identification of best practice elements within the industry.
The businesses that undertook the self-assessment and audits during the industry review phase were: 1. Sydney Water;
2. Hunter Water;
3. Gosford Water;
4. Sydney Catchment Authority;
5. Melbourne Water;
6. South East Water;
7. Yarra Valley Water;
8. Central Highlands Water;
9. Coliban Water;
10. Goulburn Valley Water;
11. Hobart Water;
12. South Australian Water Corporation;
13. Water Corporation of Western Australia;
14. Power and Water (Northern Territory);
15. Brisbane Water;
16. Logan Water;
17. Ipswich water;
18. South East Queensland Water;
19. North Queensland Water;
20. Watercare – New Zealand (Reviewed data only);
December 2004 3
21. Metrowater (New Zealand);
22. Seattle Public Utilities, USA (Reviewed data only); and
23. King County (USA).
Benchmark Methodology
Each authority completed the self-assessment and the outputs audited by the consortium to provide an independent validated result. The results were incorporated into the WSAA benchmarking database. The consortium then audited this self-assessment process to ensure:
• Consistency of understanding of the measurement methods across the authority with respect to the processes assessed;
• Assessment results accord with WSAA accredited audit requirements;
• The results were appropriate for input to the WSAA benchmarking database as a data set for relative benchmarking of asset management processes in the industry; and
• Improvement plans were prepared that provided direction to each water authority in achieving best appropriate practice.
Prior to the on-site audit, the consortium issued a questionnaire to each authority. The objective of the questionnaire was to assist the team attending the site to understand the business with respect to its functions, asset base being managed and the business drivers and priorities. The sample size was approximately 20% to 30% of measures for all businesses and covered all functions including business support systems. However, since the focus was on the measures with the greatest impact with respect to score, the measures reviewed represented 40% to 50% of the total score.
Each authority was provided, through a report, advice on opportunities for improvements in asset management practices to bridge any gap in achieving best appropriate practice for the authority. The improvements were identified by examining the processes and sub-processes for gaps and examining the trends across processes and functions e.g. configuration management.
Where an authority had an existing improvement programme, the programme was confirmed and additions to the improvement programme recommended where the audit team leader thought appropriate. The authority report was refined and finalised with the report incorporating benchmarking outcomes. The benchmarking results were identified:
• Against the total database set for each business; and
• Against a more select set of peer businesses nominated by each business.
The size of the selected dataset was such that anonymity was achieved and the data enabled meaningful comparison between authorities.
Project Timeframe
The self-assessments commenced in February and continued through to late March. Following this the audits were conducted by the audit teams and benchmark results compiled.
Feb
Project Initiation
Participants workshop
Self Assessment
Audit
First Audit Date
Second Audit Date
Third Audit Date
Fourth Audit Date
Fifth Audit Date
Sixth Audit Dates
Reporting
Draft Benchmark Reports finalised
Best Practice Workshop
Industry Report
MayMar Apr
Feb - May
9th Feb
22nd March
27th – 28th June
3rd June
5thApril
19th April
3rd May
17th May
June
24th & 31st May
July
Oct.
At the completion of the audits (June 2004) a 2-day best practice workshop was held. This forum was used to share best practice examples with all participating authorities.
Evolution of Asset Management in the Water Industry
Asset management is now a fundamental activity of authorities charged with delivering services, such as water and wastewater management. Historically, asset management was undertaken by water authorities in an informal fashion
December 2004 4
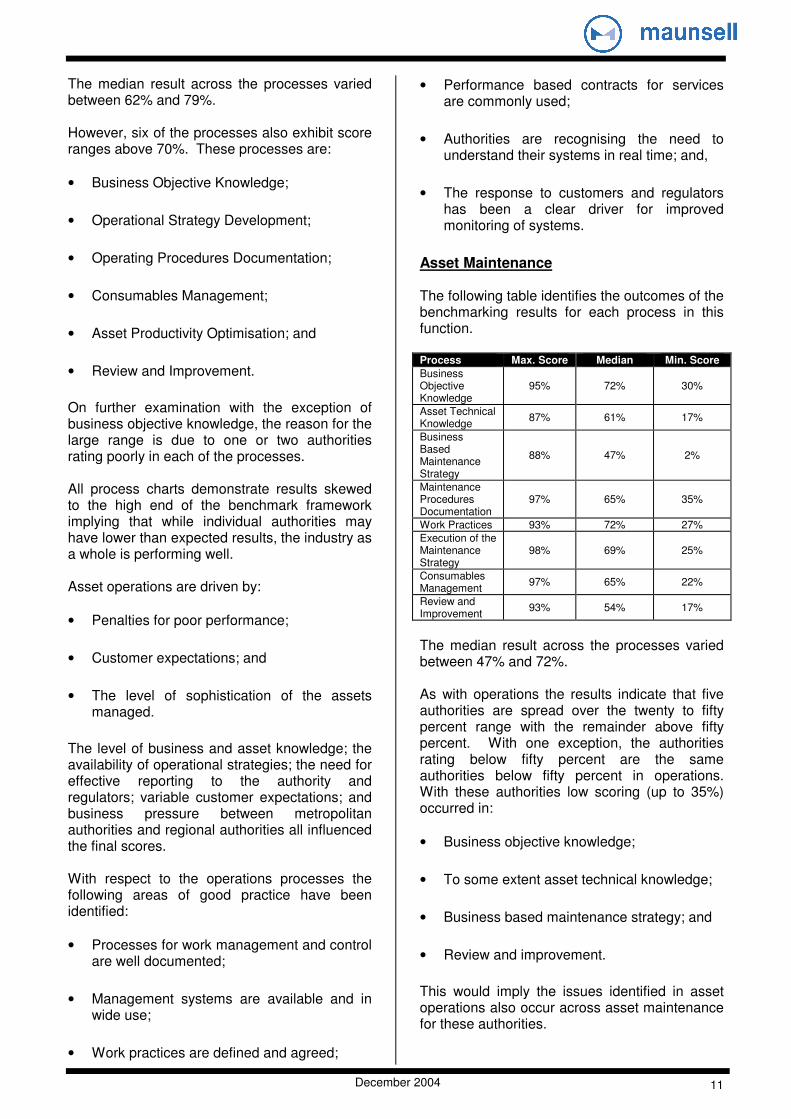
without the necessary strategic vision and corporate commitment. Prior to evaluating the outcomes of the study it is important to understand how asset management has evolved within the water industry in Australasia. This is to appreciate how authorities have evolved in line with asset management and to understand why authorities are where they are at with respect to asset management today. The following figure illustrates a time sequence in the changes in the water industry since the 1960s.
2000
1990
1980
1970
• Semi government authorities• Focus on new assets• Generally young asset base
• As per prior to 1970’s• Customer focus• Internal efficiency
• Funding internally focused• Economic regulation• Emphasis on operations and
maintenance
• Sophisticated Regulators• Efficient management• Improved levels of service
Asset Management evolved in parallel with the water industry changes. The advent of desktop computers in the 1980s provided authorities with the tools needed to assist in the application of asset management processes. The 1990s saw the introduction of the specialist techniques e.g. predictive modelling, risk management to assist industries in identifying future rehabilitation/replacement strategies. As competing demands on authorities have increased over time the means of satisfying governments, stakeholders, regulators and consumers has come under pressure. The way forward to address these issues with any surety is to formalise asset management and improve current practices in a structured fashion. Thus life cycle management is required, better processes, data and information systems are required, and technical management must focus on the assets. The core business has become asset management.
Influences and Drivers
In considering the outcomes from the benchmarking process, a number of
characteristics or influences were identified that impact on the authority’s ability to deliver best practice or best appropriate practice asset management. These influences are characterised into two categories being:
• External influences; and
• Internal influences.
External Influences Regulatory environment – The regulatory environment if implemented effectively provides authorities with a direction beyond the internal drivers. It reflects the customer viewpoint and establishes the targets an authority must meet when reporting to the regulator. Geographic control – The geographic control of the water authority (Metropolitan, Region or State) on its own does not influence the ability of the authority to deliver asset management practices however, it provides an insight into the issues that face the authorities in these positions. Regional and state authorities manage potentially large areas with numerous water and wastewater networks. They also manage customers with potentially varying demands and service levels. A metropolitan authority manages a concentrated customer base in a localised area. Primary stakeholder – The primary stakeholder (Council or State Government) could potentially have a significant impact on the authority’s ability to undertake effective asset management. A Local Government Council being needs to consider delivering services across multiple asset groups, therefore competing priorities can result in conflicts which can impact on asset management decisions. The government body responsible for the delivery of water and wastewater services statewide being the primary stakeholder is focussed on those two services and decisions are made on this basis. Business type – An authority that provides one service e.g. water or wastewater has the ability to focus on this service alone without having the potential competing demands from “silo” management across services. Commercial focus – An authority having a commercial focus will generally have internal drivers that favour the implementation of effective asset management. Migrating to a commercial focus requires internal management change to obtain the right people and motivate them through reward. Therefore, this creates an
December 2004 5
opportunity to improve asset management processes. Size of Customer Base – The size of the customer base impacts on the availability of funds and the resources required to meet the business needs. The larger the customer base, the greater the potential funds allocated to service delivery. Density of customer base (sparse/ concentrated) – An authority’s ability to deliver services will be effected by the number of schemes and the distance between schemes. Availability and quality of contractors may also be an issue with remote schemes therefore impacting on the available processes. Rate of growth of customer base – The rate of growth has a potentially marked impact on an Authority. In an authority experiencing high growth a primary focus will be on new assets resulting from growth and therefore providing processes that respond to these needs e.g. demand analysis, asset acquisition. However, if these processes are not in place the high growth will have a significant impact on the authority’s ability to respond while providing existing services. A declining customer base will present its own problems. While demand analysis may not be an issue, sustainability and maintaining the existing asset base may be. There may also be an issue for planning for asset disposal where assets become redundant over time. Customer expectations – The expectations of customers may in some instances impact on the authority by exerting pressures to deliver higher levels of service at current expenditure levels. This is particularly true when examining the differences between metropolitan and rural authorities and passive and active customers. Current issues (e.g. ageing infrastructure) – The current issues faced by an authority will have a significant impact on the business drivers. If an authority is experiencing ageing infrastructure, its challenge is to respond to this issue in an appropriate manner to reduce the potential burden the issue has on its customers. This has the effect of shifting resources from other processes. Age of authority – The age of an authority appears to constrain the authority’s ability to perform. This is due to recognising when the authority came into existence and for what purpose. A young authority appears to have
greater flexibility as it was created with a specific vision and is free from the history of other authorities. As a result the culture reflects the initial vision with the authority being “unconstrained” from historical activities and the political environment created in the past.
Internal Influences Corporate acceptance of asset management – This one issue has the ability to drastically impact on the ability of an authority to deliver effective asset management. Failure to accept asset management as a corporate activity will result in an inability to deliver services and establish processes across the business. Achieving corporate acceptance permits process improvements to occur with the main outcome being cultural change. Assigned accountability and responsibility – The implementation of asset management processes requires authorities to assign accountability and responsibility to individuals within the business. It provides the authority with a level of confidence that business processes are being maintained. Available asset management framework – An asset management framework is required within a business to ensure all processes are effective and provided to achieve a specific goal. The framework provides a vision for asset management as well as an asset management policy and strategy for achieving the desired outcomes. Quality control – This process is required to ensure that processes are documented and audited periodically to ensure the processes are implemented and effective. Data availability – An authority requires the availability of data to make effective decisions. The effectiveness of the asset management processes and practices will be limited by the availability of data. Sophistication of processes – Depending on the characteristics of the authority and its business needs, the need to invest in sophisticated processes should be assessed. Communications – Sound communications across an authority ensures consistent processes are implemented and staff are informed on the reasons for the process and the expected benefits. Communicating the business goals empowers staff to provide input into strategic and operational decisions to improve
December 2004 6
the business activities and achieve business outcomes. Effective use of available systems – Authorities have invested significant resources into the purchase of systems to support their business processes. Effective use of these systems will assist them to achieve the desired level of asset management. Ineffective use however will limit the authorities capabilities.
General Observations
Asset Management Practices A number of observations about asset management practices within the industry have been identified following the audits: Highlights
• The industry is migrating towards a more commercial environment, driven through regulatory control with a focus on customer satisfaction.
• There is an apparent mind shift by personnel to accept asset management into the operating and business environment. There appears to be a ‘willingness to progress’.
• Recognition that reporting is required both external and internal. Information flows are more transparent with effective internal communications through the various levels of the business.
• The business planning process involves input from all levels of the business and effort is being made by corporate to include this input and feed back to personnel.
• The effective use of skills matrices and the training programs ensure staff are skilled and focussed on delivery of both their performance and the business goals.
• Authorities are prepared to invest in systems that will support them.
• The application of business rules to assist decision making.
• There is recognition of the need to align operations and maintenance with the business objectives; to establish business-based strategies that will influence operations and maintenance
• Authorities have demonstrated their willingness to progress by successfully implementing advanced techniques such as risk management and risk control processes. This also includes processes such as triple bottom line reporting and quality management.
• One of the primary observations was the successful stakeholder buy-in. In particular, the internal buy-in achieved by the leading authorities. The buy-in is across all levels of the business, from management through to operational staff. They have achieved success in an area that many industries have yet to experience.
Concerns • Some authorities have yet to progress with
asset management and appear to be struggling both in operational and strategic aspects of asset management. The operational aspects include availability of data and understanding.
• Limited buy-in for asset management in the corporate area leads to a misalignment of corporate objectives and operating practices and limited ability of the organisation to progress further.
• In the local government environment, some authorities appear to be constrained by a Councils need to focus on multiple service lines and make decisions across these services.
• There is also a belief that systems will provide the ‘solution’ to the business needs. The reality is, the system will support the business well if implemented effectively however, the system itself is not a ‘solution’.
• At the technical level there is still a lack of understanding of asset performance, in particular, asset failure and its impact on the end of asset life. Post completion (construction/operation) reviews could assist in overcoming this issue.
• The relationship between operation expenditure and capital expenditure needs to be identified. This is a long-term improvement that will take significant effort by the authorities to understand the inter-relationships and manage the outcomes.
December 2004 7
Project Observations
During the project, the consortium recognised a number of observations worthy of comment. The observations are identified under the following process categories:
• Accreditation;
• Pre audit preparation;
• Self assessment;
• Audit;
• Post audit; and
• Project Execution.
• The accreditation process reduced the chance for misinterpretation by the auditors of the meaning and interpretation of the measures. The adoption of a policy by WSAA to accredit only experienced asset management practitioners assisted in providing consistency, certainty and confidence in the final outcome.
• The process of self-assessment and the detail in the WSAA model required significant commitment by each water authority to complete a truly representative assessment.
• To ensure the correct response to the measures, authorities spent significant time interpreting them. Most authorities committed at least one person month to the self-assessment process.
• During the audit process it was apparent that the focus of some individuals within the water authorities during the self-assessment process was on the achievement of a good score, whereas others used the opportunity to define needed improvements. The audit process was able to identify and correct this anomaly.
• Despite the effort undertaken by authorities there was some misinterpretation of the intent of some measures. The audit process assisted the authorities to consistently interpret these measures.
• The best responses were obtained from authorities where a cross section of the authority’s staff and contractors were involved in the assessment. This provided responses that were representative of the authority’s view rather than an individual’s view and also gave authority personnel the
opportunity to learn more about different aspects of the business.
• Some authority personnel tended to relate the scoring of support systems scoring as a factor in their performance. The audit process assisted in correcting this belief.
• The audit interview process incorporating Aquamark to review the self-assessments was found to be an effective approach to auditing. Aquamark allowed the interviews to be focussed and gave authority staff the opportunity to review their previous responses.
• The use of the Aquamark web process enhanced the self-assessment and audit processes. Those authorities that used the comments field in Aquamark placed themselves in a sound position to respond during the audit process.
• During the audit process it became apparent that authorities were often conservative in their self-assessment. This resulted in measure scores being corrected. On average approximately eight to twelve percent of all measure scores need adjusting up or down.
• Authorities were keen for feedback on their performance following the audits. During the audit process, authorities took the opportunity to analyse the results and identify the improvements or consolidate the findings into existing improvement programs.
• While the audit process was completed within the timeframe, it was achieved through significant understanding, collaboration and co-operation between all parties driven by a common desire to achieve the outcomes.
• The WSAA framework will reinforce the business focus and priorities identified in the improvement programs. Authorities are now in a position to repeat the exercise as part of the monitoring of the improvement program.
• The WSAA framework has provided an opportunity to identify and improve elements of asset management industry wide e.g. configuration management.
December 2004 8
• The WSAA framework provides the necessary information to focus and more clearly define industry wide the asset management improvements required.
Detailed Analysis – General Observations
The following observations were made based on the results of the 23 authorities, across the seven functions.
Function Max. Score Median Min. Score
Corporate Policy and Business Planning
84% 57% 30%
Asset Capability Forward Planning
90% 63% 29%
Asset Acquisition
85% 65% 39%
Asset Operations
85% 70% 28%
Asset Maintenance
92% 61% 28%
Asset Replacement and Rehabilitation
89% 60% 33%
Business Systems
76% 50% 38%
The above results are illustrated in the following chart.
As can be observed from the above chart, the median across the seven functions varies between 50% for business support systems and 70% for asset operations. The overall results agree with our expectations however an unusual outcome from the above chart is the range of results and the low minimum results associated with asset operations and maintenance. These are core activities of the water authorities and the expectation is that the outcome would have been a concentrated set of data points around the median with minimal spread.
The primary observations arising from the data analysis are:
• The highest performing processes in the upper 25% were:
Function Process Median
Score
Asset operations Work control and execution
79
Asset operations Asset operational monitoring
79
Asset operations Business objective knowledge
76
Corporate policy and business planning
Asset financial management
75
Asset replacement and rehabilitation
Business objective knowledge
75
Asset maintenance Business objective knowledge
72
Asset maintenance Work practices
72
• The lowest performing processes in the lower 25% were:
Function Process Median
Score
Asset replacement and rehabilitation
Asset risk / replacement options
59
Corporate policy and business planning
Risk Management 58
Corporate policy and business planning
Levels of Service, regulatory
58
Asset replacement and rehabilitation
End of economic life identification
57
Corporate policy and business planning
Sponsorship to innovation
56
Asset maintenance Review and improvement
54
Corporate policy and business planning
Quality management 51
Corporate policy and business planning
Triple bottom line management
50
Asset replacement and rehabilitation
Review and improvement
48
Asset maintenance Business based maintenance strategy
47
Corporate policy and business planning
Configuration management
40
• Those authorities that performed well, consistently appeared in the upper 25% for function and process;
• Those authorities who performed in the upper 25% are subject to the following influences:
- Large metropolitan authorities - Strong regulated environment - Large concentrated customer base - High customer expectations - Commercial focus
- Influenced by ageing infrastructure
December 2004 9
• The authorities that were the lowest performing consistently appeared in the lower 25% for function and process;
• Those authorities in the lower 25% are subject to the following influences:
- Localised primary stakeholder base
- Younger infrastructure
• The authorities that scored well for review and audit across operations, maintenance and asset replacement/rehabilitation also scored well for the other processes in these functions;
• The authorities that appeared in the upper 25% also demonstrated an effective use of the core business systems in particular:
• The authorities that appeared in the lower 25% demonstrated poor results with respect to business systems.
Corporate Policy and Business Planning The following table identifies the outcomes of the benchmarking results for each process in this function. Process Max. Score Median Min. Score
Triple Bottom Line Management
81% 50% 16%
Life Cycle ‘Best Value’ Decision Making
97% 61% 31%
Asset Financial Management
84% 75% 31%
Risk Management
89% 58% 18%
Level of Service Regulatory Interface
98% 58% 17%
People 90% 61% 37%
Asset Management Strategic Plan
95% 61% 13%
Quality Management
100% 51% 0%
Configuration Management
82% 40% 0%
Audit and Review
100% 69% 0%
Sponsorship of and Commitment to Innovation
89% 56% 26%
Corporate policy and business planning is driven by regulation and stakeholder requirements.
Available resources and the scope of services and assets also have an impact on the quality of this function. Authorities exposed to regulation or stakeholder input have by and large developed superior processes. The scores reflect a variable level of recognition of asset management at corporate level across the authorities. This is influenced by the existing culture and the commitment to change. The following elements were identified as good practice used by a number of the authorities:
• Business planning with asset management input has been widely adopted as an annual structured process with milestones and responsibilities within asset management areas defined;
• Business objectives dissemination – the process of making asset management staff aware of business objectives has been formalised in authorities;
• Financial management of assets has been improved. Valuations are being used to identify renewals commitments and life cycle costing has been enhanced; and
• Governance issues are addressed in a fashion that recognises liabilities at corporate level.
Many authorities while recognising the need for quality management were sceptical about resourcing the implementation to a level of achieving ISO-certification or the equivalent.
Asset Capability and Resource Planning The following table identifies the outcomes of the benchmarking results for each process in this function. Process Max. Score Median Min. Score
Demand Projection
94% 67% 27%
Level of Service Projection
96% 61% 18%
Planning for Optimised Assets
94% 66% 36%
Good practice areas included:
• Demand projection processes are well understood and effective. The understanding of growth impacts and changes in demand are well defined;
December 2004 10
• Formal processes are used to access stakeholder acceptable projections to ensure growth is accommodated; and
• Where there is a need to consult with the community (e.g. major projects) the processes adopted are generally of a high standard.
The greatest spread was exhibited in Level of Service Projection. State regulation and available resources impact on asset capability and forward planning. The requirement to understand demand projections and have sound processes in place is dependent on the growth potential in the authority’s region. Those authorities within high growth areas tended to exhibit superior demand analysis processes while authorities in low growth or no growth areas tended not to have a need for the resources or processes required to undertake demand projections. The lack of understanding of the impact of changes in levels of service across the business and the future expectations for levels of service also affected the outcomes. In discussion with authorities, it was emphasised that the influence of the regulator and other drivers such as water quality had a greater impact on the service levels than community expectations. Therefore, it was thought that service levels were well established and were not likely to change significantly. This had a marked influence on the outcomes of level of service projections.
Asset Acquisition The following table identifies the outcomes of the benchmarking results for each process in this function. Process Max. Score Median Min. Score
Business Objective Input and Knowledge
97% 69% 26%
Equipment/ Product/ Design Standards
86% 62% 28%
Concept and Detailed Design
94% 65% 37%
Procurement-Best Value
92% 66% 36%
Asset Acceptance Procedures
88% 62% 35%
The better aspects are:
• Concept and detailed design rely on standards and codes that are well documented, understood and universally adopted. The WSAA standard specifications would be included in this list.
• Contract control is well understood, documented, and there is clear understanding of what is required to be delivered and how it can best be delivered; and
• There are formalised processes for procurement of services or materials and governance requirements ensure these are relevant and current.
Primarily the extent of capital programs, the age of the asset base and the rate of development in an area drive asset acquisition and asset replacement and rehabilitation. Those authorities with significant growth to manage have established better processes to control the provision and capture of information on the assets. Scores have been affected by the quality of control over external suppliers, the ability to demonstrate best value in procurement, and the management of information gathered as part of acquisition e.g. asset handover.
Asset Operation The following table identifies the outcomes of the benchmarking results for each process in this function. Process Max. Score Median Min. Score
Business Objective Knowledge
94% 76% 23%
Asset Knowledge
77% 63% 25%
Operational Strategy Development
94% 63% 17%
Operating Procedures Documentation
85% 63% 14%
Work Practices 88% 69% 40%
Work Control and Execution
94% 79% 39%
Consumables Management
100% 70% 11%
Asset Operational Monitoring
91% 79% 35%
Asset Productivity Optimisation
84% 62% 8%
Review and Improvement
85% 63% 7%
December 2004 11
The median result across the processes varied between 62% and 79%. However, six of the processes also exhibit score ranges above 70%. These processes are:
• Business Objective Knowledge;
• Operational Strategy Development;
• Operating Procedures Documentation;
• Consumables Management;
• Asset Productivity Optimisation; and
• Review and Improvement.
On further examination with the exception of business objective knowledge, the reason for the large range is due to one or two authorities rating poorly in each of the processes. All process charts demonstrate results skewed to the high end of the benchmark framework implying that while individual authorities may have lower than expected results, the industry as a whole is performing well. Asset operations are driven by:
• Penalties for poor performance;
• Customer expectations; and
• The level of sophistication of the assets managed.
The level of business and asset knowledge; the availability of operational strategies; the need for effective reporting to the authority and regulators; variable customer expectations; and business pressure between metropolitan authorities and regional authorities all influenced the final scores. With respect to the operations processes the following areas of good practice have been identified:
• Processes for work management and control are well documented;
• Management systems are available and in wide use;
• Work practices are defined and agreed;
• Performance based contracts for services are commonly used;
• Authorities are recognising the need to understand their systems in real time; and,
• The response to customers and regulators has been a clear driver for improved monitoring of systems.
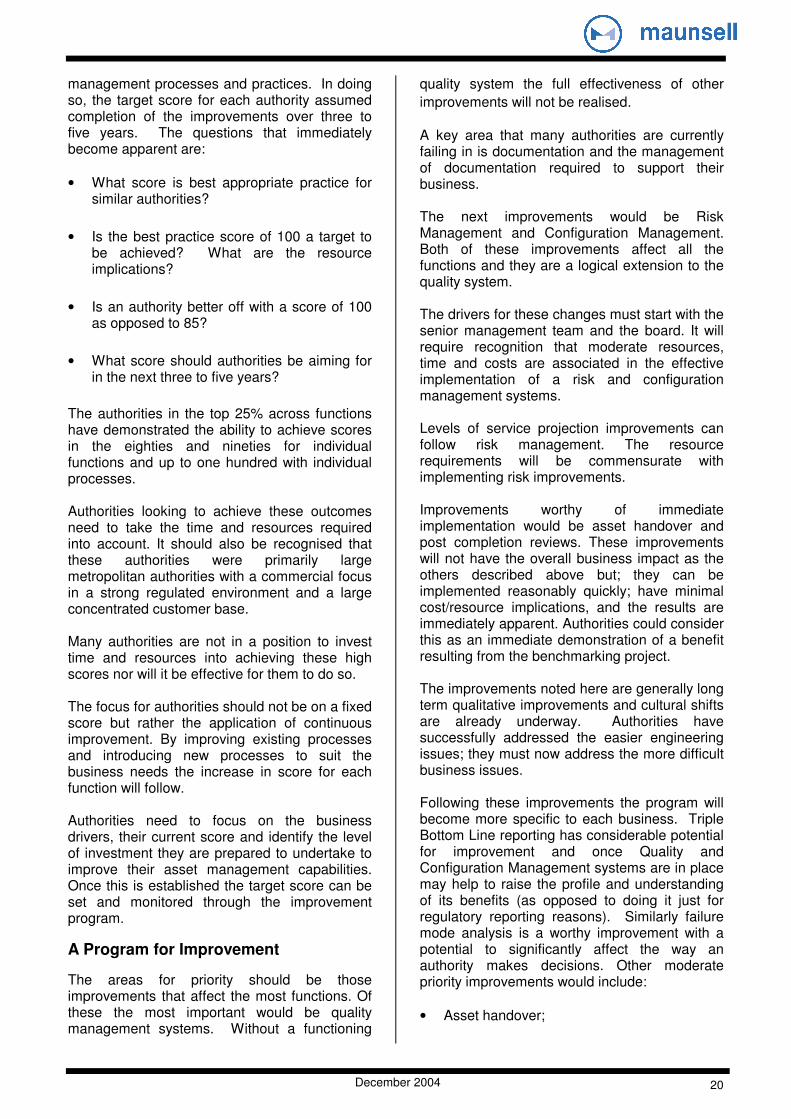
Asset Maintenance The following table identifies the outcomes of the benchmarking results for each process in this function. Process Max. Score Median Min. Score
Business Objective Knowledge
95% 72% 30%
Asset Technical Knowledge
87% 61% 17%
Business Based Maintenance Strategy
88% 47% 2%
Maintenance Procedures Documentation
97% 65% 35%
Work Practices 93% 72% 27%
Execution of the Maintenance Strategy
98% 69% 25%
Consumables Management
97% 65% 22%
Review and Improvement
93% 54% 17%
The median result across the processes varied between 47% and 72%. As with operations the results indicate that five authorities are spread over the twenty to fifty percent range with the remainder above fifty percent. With one exception, the authorities rating below fifty percent are the same authorities below fifty percent in operations. With these authorities low scoring (up to 35%) occurred in:
• Business objective knowledge;
• To some extent asset technical knowledge;
• Business based maintenance strategy; and
• Review and improvement.
This would imply the issues identified in asset operations also occur across asset maintenance for these authorities.
December 2004 12
The following areas of good practice have been identified:
• Processes for work management and control are well documented;
• Management systems are available and in wide use;
• Work practices are defined and agreed;
• Performance based contracts for services are commonly used; and,
• Maintenance strategies are being successfully implemented.
Business based maintenance strategy The results identify two distinct groups of authorities. The first group of nine authorities achieved results between 67% and 88%. This group consists of metropolitan authorities with large customer bases. These authorities generally performed well in corporate policy and business planning demonstrating effective strategic processes and aligning these processes with the maintenance strategy. The size of the authority is likely to be a factor in the success of this group as they are able to provide resources to the production of strategies. Where maintenance strategies exist, there has been an emphasis on executing the strategies. However, the linkage between the business objectives and a maintenance strategy to support the business objectives is still being developed.
Asset Replacement and Rehabilitation The following table identifies the outcomes of the benchmarking results for each process in this function. Process Max. Score Median Min. Score
Business Objective Knowledge
99% 75% 21%
Asset Risk and Replacement Options
89% 59% 27%
Identification of End of Economic Life
88% 57% 31%
Acquisition of Replacement and Rehabilitation Assets
89% 64% 32%
End of Economic Life Projection and Replacement/ Rehabilitation Capex
95% 63% 31%
Process Max. Score Median Min. Score
Review and Improvement
90% 48% 18%
• The median result across the processes varied between 48% and 75%.
There is also a significant range of results in the following processes:
• Business objective knowledge; and
• Review and improvement.
The range of the business objective knowledge is impacted on by the results of one authority scoring 21%. Removing this authority’s score would bring the range in alignment with the other processes. The range of the review and improvement process is impacted on by one authority scoring 90%. Despite the large range the process for improving Business Objective Knowledge is being undertaken well in comparison to the other processes. The processes while being implemented well in comparison to other processes across other functions are not being implemented as well as would be liked are:
• Asset Risk and Replacement Options;
• Identification of End of Economic Life;
• End of Economic Life Projection; and
• Review and Improvement.
The results were impacted on by the lack of failure data, limited understanding of failure for different asset groups and the lack of application of risk across the authorities. Due to these limitations there is also a lack of ability to predict the end of life for assets.
Business Support Systems Business Support Systems are driven by cost, availability and perceived business need. The scoring reflects the current relevance of available information systems. The systems most used by authorities are:
• Water distribution system hydraulic modelling;
December 2004 13
• Sewer transportation system hydraulic modelling;
• Water quality monitoring, modelling and reporting systems;
• Asset registers;
• GIS;
• Customer service system;
• SCADA;
• Maintenance management system;
• Stores; and
• Asset based costing system.
The more advanced authorities also used the following systems:
• Real time modelling;
• Water source modelling;
• Waste receiving environment modelling;
• Asset condition/failure likelihood systems; and
• Risk management systems.
It should also be noted that the technical information library was also a valuable system used by authorities. An analysis of the results at the measures level (using all the authorities as data) however reveals that some measures have a very high score whereas some are generally low. Those measures that consistently score well (i.e. scores over 60%) include:
• Capacity;
• Data/information security; and
• System reliability and availability.
The following functions generally scored poorly (i.e. scores generally below 40%):
• Data/information verification;
• System interconnectivity;
• Ad hoc reporting/search;
• Standard reporting;
• User documentation/on line help;
• Functional spec and software listing; and
• Review and Improvement.
This would tend to suggest that the business systems (which are mostly software based) are being utilised with good capacity to grow and utilise the authority’s computer network / data backup systems. The scoring indicates that the user is not supported sufficiently to maximise the effectiveness of the systems.
International Research – Benchmarking
To support this benchmarking process, it was considered appropriate to undertake specific research on overseas activities specifically related to benchmarking processes and the status of asset management processes. With respect to benchmarking the primary objective was to seek out organisations or countries using benchmarking for monitoring the performance of the industry. The primary objective of the asset management research was to seek out best practice processes in other countries and in other industries. The following provides a discussion on recent international benchmarking activities. The information was collected mainly via correspondence with our overseas offices, internet search and a questionnaire that was distributed and completed by the relevant organisations. The countries included in the research were:
• Scandinavia (Denmark, Finland and Norway);
• The Netherlands;
• Germany;
• United States; and
• Canada.
December 2004 14
The international research indicates that of the benchmarking identified, the focus is output based and related to efficiency and effectiveness of the industry in the specific country. There is not a focus on the inputs or processes associated with asset management as recognition of the significance in delivering the outputs required. It also appears that where the benchmarking is undertaken, it is still in its infancy and as such does not recognise the importance of asset management and its processes as a key input to delivering efficient and effective services.
International Research – Asset Management
Local government (including water and wastewater) Additional research across industries in Australia and New Zealand with respect to asset management processes identified the following: INGENIUM (formerly ALGENZ, the Association of Local Government Engineers), New Zealand has been driving improvements in asset management in New Zealand for over a decade. Local government in New Zealand is also responsible for the management of water and wastewater. INGENIUM has assisted the industry by producing the following guidelines:
• International Infrastructure Management Manual, 2002 – Version 21;
• Creating Value through Customer Consultation, 2003;
• New Zealand Infrastructure Valuation and Depreciation guidelines;
• Optimised Decision Making Manual (in development);
• New Zealand National Contract Management Manual, 2002; and
• Customer Agreement Guidelines for Water Services.
1 In conjunction with the Institute of Public Works
Engineers, Australia (IPWEA)
This effort has generated significant improvements in asset management processes such as:
• Customer consultation;
• Definition and understanding of service levels;
• Condition assessments;
• Risk management;
• Asset handover;
• Appropriate use of systems and data; and
• Long term planning.
In addition to the above, significant effort has been generated through the RIMS (Road Infrastructure Management Systems) group, which has resulted in clear understanding of road pavement failure modes and the use of predictive models to analyse, and model road networks with the primary objective of long term budget development and understanding the relationship between the budgets and the future condition of the road network. The work undertaken by the RIMS group has also been emulated over the past decade through AustRoads and RTA NSW in Australia.
Power Sector The power sector demonstrates significant capability in configuration management. It also demonstrates sound processes for data management and use of systems including GIS and SCADA to analyse current loadings on the system. Tracking of maintenance and the use of maintenance management systems is also a high priority in understanding how assets are performing. For mechanical and electrical assets, the power sector uses such tools as vibration analysis and infra-red thermography to monitor the condition and identify problems.
Research Summary Based on the above research there is an opportunity for WSAA to facilitate cross pollination of ideas across industries.
December 2004 15
Industries with different drivers have established best practice in processes that the water industry has yet to implement eg. configuration management and predictive modelling. The opportunity is available for the water industry to expand its asset management capabilities by learning from other industries.
Opportunities for Improvement
The broad areas for improvement for water authorities across the industry are:
• Triple Bottom Line Management;
• Configuration Management;
• Quality Management;
• Risk Management;
• Levels of Service Projection;
• Asset Handover Process Improvement;
• Post Completion Reviews (Lessons Learnt);
• Maintenance Strategy Development;
• Understanding the relationships between capital Expenditure and Maintenance Funding;
• Understanding the relationship between Maintenance Cost and Asset Condition;
• Failure Mode Identification;
• Improve the understanding of Condition and its impact on Probability of Failure;
• Improve understanding of Economic Life; and
• Business Support Systems.
Triple Bottom Line Management Triple Bottom Line (TBL) processes require a cultural shift in most authorities to permit effective implementation. TBL is a relatively new concept however some water authorities have implemented Triple Bottom Line very well corporately. The rules and understanding across the organisation are well understood and evident in the way the business operates. Where the
gap appears is the application of TBL concepts at the operational level. The difficulty in identifying and quantifying benefits associated with social and environmental factors makes it difficult for people to apply in certain processes e.g. capital project justification. To improve the application of TBL at the operational level Water Authorities need to:
• Define business rules at the asset management level;
• Make staff aware of the business objectives for TBL;
• Introduce processes and associated documentation to apply TBL;
• Provide check-lists and guide-lines to staff implementing the concepts;
• Train staff in the use of the TBL processes; and
• Audit the processes to ensure they are being implemented effectively.
Configuration Management Configuration Management is a process not well understood by the industry. Configuration Management relates to the following:
• Identification of changes to an asset;
• Recording of changes;
• Control of changes;
• Verifying changes; and
• Reporting and communicating changes.
Configuration Management can be applied at the sub-process level, process level and cross function level. Therefore, improving this item will have the effect of considerably improving an authority’s asset management score for each function. For example, at the micro level, the need to modify the operation of a pump station requires the following actions to be undertaken:
December 2004 16
• Modify the operations manual;
• Review and modify maintenance procedures to address the changes in operation;
• Review and modify the spares requirements for the pump station;
• Modify and monitor the performance of the pump station;
• If the operational changes require physical changes to the pump station (e.g. introduction of a second or third pump) then modify the existing plans and records for the pump station; and
• Review and modify the renewal strategy for the pump station based on the change in operations and the change in usage of the assets in the pump station.
At the macro level, Configuration Management requires an information flow and feed-back process to ensure that information generated through undertaking high level functions is fed back into the corporate processes to ensure issues that were raised in one function are addressed in previous functions. For example, the operation of a new treatment plant identifies problems with the treatment process. Resulting discussions indicate that the problem can be attributed to the design. This information and the subsequent rectification should be documented and provided in a ‘lessons learnt’ directory of the management system to ensure that if applying the same treatment process elsewhere, the same problems do not re-occur. Configuration Management requires strict processes and discipline to ensure it is always undertaken as part of a quality framework. Depending on the extent of sub-processes involved and the level of detail this can drain an authority of available resources so care should be taken to initially implement the processes at a high level before implementing the processes at a detailed level. Configuration Management is used extensively in the telecommunications, power and aerospace industries and is an integral part of their operations. This is due to the potential loss of life that could result from the re-configuring of a system and not providing feed back to all operations and maintenance personnel.
While some aspects of a water authority could have similar consequences being loss of life, the clear driver for undertaking Configuration Management is cost savings resulting from lessons learnt and operational efficiencies from reduced call outs and improved planning, design and construction.
Quality Management Several of the authorities demonstrated sound quality management procedures coupled with their business management systems. They also demonstrated sound procedures with respect to the planning, design and construction processes and sub-processes. However, many authorities were lacking the procedures necessary to support the operational aspects of the business. This included:
• Asset handover and acceptance;
• Data capture and ongoing management;
• Operations documentation;
• Work order generation and tracking; and
• Documentation of processes supporting asset replacement/rehabilitation.
The main issue identified by the authorities was the understanding of the level of documentation and the management of documentation required to support their business. In this instance as in the case of Risk Management and Configuration Management, introducing quality management procedures will greatly influence the scores across the functions.
Risk Management While several of the authorities in the benchmarking process demonstrated effective management of risk, there were still authorities that have yet to develop or apply infrastructure risk management practices to a level that will generate benefits to the authority e.g.
• Risk mitigation;
• Safer operational environment;
• Reliable operations;
• Improved renewal programs;
December 2004 17
• Improved maintenance programs;
• Reduced liability; and
• Improved public image.
To advance risk management processes, an authority is required to:
• Introduce and adopt a risk management policy;
• Implement a risk management framework and plan;
• Identify and quantify risks;
• Assign responsibilities to manage risks;
• Develop risk management procedures;
• Develop risk treatment strategies;
• Monitor, record and report risks;
• Introduce controls to mitigate risks;
• Implement risk management programmes for projects; and
• Audit the risk management programmes.
Many of the authorities in the WSAA project apply elements of the above. Many authorities however, have resisted the need to quantify risk in dollar terms. The introduction of effective risk management processes will influence the outcomes of the WSAA framework across functions. Therefore, significant gains in score can be achieved.
Levels of Service Projection Regulated water authorities actively engage the regulator in discussions on issues related to service levels and the impacts on the business. Potentially however, this is based on perception as opposed to quantifying the costs associated with providing the service levels. Authorities do however understand the costs at a high level to provide existing services. Many of the service levels provided today have been established by external bodies e.g.
regulators, government agencies, World Health Organisation and others. A key assumption identified by authorities was that service levels were projected on the basis that the service levels currently provided would be maintained. The benchmarking identified that there is not enough consideration for the potential for change in service levels. Customer consultation with respect to acceptance of service levels has in the past been limited. There is a direction in the industry driven by regulation towards engaging customers in debate to understand their requirements with the objective of agreeing and providing an appropriate level of service. The issues highlighted through the benchmarking process is identifying potential changes in service levels and managing the impacts of change. This requires customer and regulator consultation and a sound understanding of the ability of the existing asset base to deliver the expected service levels.
Asset Handover Process Improvement Most authorities fail to have a rigid Asset Handover Process in place to assist in the capture of asset related data. This results in the authority expending additional resources to capture the data as required. Asset Handover falls into three primary categories:
• Developer related projects;
• Internal projects;
• Internal procurement of assets.
Some authorities have introduced handover processes that require contractors/developers to provide the asset related data as part of the contract. Allowances have been made for smaller contractors who do not have the necessary skills to provide information. In this instance the authority collects and records the information. The processes undertaken for external projects should be replicated for internal projects and asset procurement. However, depending on the organisational structure and the available resources this does not always occur or
December 2004 18
information is not passed onto the personnel required to complete the data input and management.
Post completion reviews (Lessons Learnt) Few authorities undertake a Post Completion Review of their assets once the assets have been operating for a period of time. Consequentially, the potential for repeating the same issues is, and historically has been, high. Introducing a ‘lessons learnt’ process will alleviate the problems encountered in operations as a result of previous planning, design or construction. The lessons learnt process should be implemented in all phases of the asset’s life e.g. planning, design, construction, and operations. This could entail the creation of a knowledgebase for recording all issues generated through these phases so issues are not repeated.
Maintenance Strategy Development Historically maintenance has been undertaken based on:
• Historical events;
• Knowledge of the personnel;
• Consultant advice; and
• Knowledge of the contractors.
In undertaking maintenance there is a need for the maintainers both internal and external to understand the business objectives and program maintenance accordingly. Some authorities have developed processes to ensure that contractors understand the business objectives while many authorities are still relying on the contractors or internal staff to undertake the necessary maintenance. The business based maintenance strategy is required to ensure the assets are being maintained appropriately while delivering the objectives of the business.
Understanding the relationship between Capital Expenditure and Maintenance Funding A critical factor in long term planning is the relationship between capital expenditure and the
associated maintenance funding required to support the future capital expenditure. This is an issue common to all industries and as yet not resolved. The reasons are generally related to the scope and quantities of asset types managed by the authorities and the lack of cost data supporting the maintenance activities. In the past rules of thumb have been used to accommodate the lack of data e.g. building maintenance is between 1 and 4 percent of replacement value depending on the building’s function. These rules, while providing base information for authorities to use, have considerable impact on the business and its future operations. Therefore, it would be considered appropriate for WSAA to research the relationship with the view to providing guidelines back to the industry on the outcomes. This would provide a level of confidence for water authorities to move forward with their long term planning.
Understanding the relationship between Maintenance Cost and Asset Condition Many authorities undertake condition assessments on the assets with the view to identifying future works. However, a relationship also exists between the asset’s condition and the maintenance required to support the asset in its condition. This has an impact on the maintenance expenditure. Without understanding the relationship between maintenance cost and asset condition an authority is unable to introduce effective maintenance strategies as an option to sustain the asset in its current condition. Therefore, the simplest option is to program works to address the issue. This however, may not be the most cost effective outcome. WSAA could research this relationship to identify potential maintenance cost – asset condition curves to be used by water authorities in their maintenance analysis and strategy development. This would also require WSAA to identify the type of maintenance required for assets in a given condition as a supporting mechanism to the identification of maintenance costs.
Failure Mode Identification Most water authorities have yet to record or understand the failure modes associated with the assets as they age. Individuals within the
December 2004 19
organisation who are responsible for the ongoing operations will usually understand the asset’s mode of failure. However, this information is not necessarily recorded or passed onto the people responsible for developing asset strategies. By recording and understanding the failure modes, an authority will be in a sound position to:
• Refine its maintenance strategy;
• Reconfigure operations if this is a cause;
• Understand and respond to the risks associated with the failures; and
• Refine the renewal strategies based on the failure modes.
Improve the understanding of Condition and its Impact on Probability of Failure Many authorities have undertaken condition assessments with a view to identifying future works. However, they generally do not link the condition assessment to understanding or mitigating their risks. Inherently, there is a direct relationship between the condition of the assets and the business risks. By understanding the condition of the assets and linking the condition to probability of failure, an authority will be in a better position to identify and prioritise the business risks. This would result in improved long term planning outcomes and a better understanding of future liabilities. This process could be undertaken by the development of probability of failure vs. condition curves by asset type. This work would have to be undertaken by an organisation such as WSAA that would have access to the international research and contacts necessary to complete the research.
Improve Understanding of Economic Life Water authorities generally focus on the technical life of their assets, not the economic life. The knowledge of economic life is critical for the development of long term plans for replacement and rehabilitation. Economic life is determined by evaluating the technical life against factors such as:
• Supply contracts;
• Demand factors;
• Technological change;
• Legislative change;
• Operations practices;
• Renewal programs; and
• Other engineering issues.
As the economic life is an input into other processes e.g. risk, depreciation, predictive modelling, renewal annuities it is an important factor in the operations of a water authority. Unfortunately, in many authorities, the data required is either unavailable or based on anecdotal advice.
Business Support Systems The business support systems can be improved in most authorities and some authorities have active programs for improvement. Generally each authority needs to recognise its own requirements for systems and the processes these systems support. They can then embark on a selective improvement program. Clearly the beneficial areas for improvement are:
• Improved documentation on the use of the systems;
• Improved rigour in data collection/validation; and
• Understanding the information flow between business systems.
The primary way to do this and improve the business support systems score is via general improvements such as configuration management, quality systems and risk management. By applying these improvements to the existing business systems it will have a significant improvement in the way the authority uses the information.
Where should Authorities be?
Through the benchmarking process, each authority was provided with an improvement program to assist them to improve in asset
December 2004 20
management processes and practices. In doing so, the target score for each authority assumed completion of the improvements over three to five years. The questions that immediately become apparent are:
• What score is best appropriate practice for similar authorities?
• Is the best practice score of 100 a target to be achieved? What are the resource implications?
• Is an authority better off with a score of 100 as opposed to 85?
• What score should authorities be aiming for in the next three to five years?
The authorities in the top 25% across functions have demonstrated the ability to achieve scores in the eighties and nineties for individual functions and up to one hundred with individual processes. Authorities looking to achieve these outcomes need to take the time and resources required into account. It should also be recognised that these authorities were primarily large metropolitan authorities with a commercial focus in a strong regulated environment and a large concentrated customer base. Many authorities are not in a position to invest time and resources into achieving these high scores nor will it be effective for them to do so. The focus for authorities should not be on a fixed score but rather the application of continuous improvement. By improving existing processes and introducing new processes to suit the business needs the increase in score for each function will follow. Authorities need to focus on the business drivers, their current score and identify the level of investment they are prepared to undertake to improve their asset management capabilities. Once this is established the target score can be set and monitored through the improvement program.
A Program for Improvement
The areas for priority should be those improvements that affect the most functions. Of these the most important would be quality management systems. Without a functioning
quality system the full effectiveness of other
improvements will not be realised. A key area that many authorities are currently failing in is documentation and the management of documentation required to support their business. The next improvements would be Risk Management and Configuration Management. Both of these improvements affect all the functions and they are a logical extension to the quality system. The drivers for these changes must start with the senior management team and the board. It will require recognition that moderate resources, time and costs are associated in the effective implementation of a risk and configuration management systems. Levels of service projection improvements can follow risk management. The resource requirements will be commensurate with implementing risk improvements. Improvements worthy of immediate implementation would be asset handover and post completion reviews. These improvements will not have the overall business impact as the others described above but; they can be implemented reasonably quickly; have minimal cost/resource implications, and the results are immediately apparent. Authorities could consider this as an immediate demonstration of a benefit resulting from the benchmarking project. The improvements noted here are generally long term qualitative improvements and cultural shifts are already underway. Authorities have successfully addressed the easier engineering issues; they must now address the more difficult business issues. Following these improvements the program will become more specific to each business. Triple Bottom Line reporting has considerable potential for improvement and once Quality and Configuration Management systems are in place may help to raise the profile and understanding of its benefits (as opposed to doing it just for regulatory reporting reasons). Similarly failure mode analysis is a worthy improvement with a potential to significantly affect the way an authority makes decisions. Other moderate priority improvements would include:
• Asset handover;
December 2004 21
• Business based Maintenance Strategy Development; and
• Improving the understanding of Economic Life.
The following improvements are inter-related, as the outputs from one will assist in the understanding of another. The improvements are:
• Understanding condition and its impact on probability of failure;
• Understanding the Relationship between Maintenance Cost and Asset Condition; and
• Improving the Understanding between Capital Expenditure and Maintenance Funding;
These improvements have a long-term focus as the resource requirements are demanding from both WSAA and the authorities and the costs high. The return however, will be significant with respect to the industry’s ability to base decisions on sound knowledge of asset performance. The review and improvement of asset management processes within authorities needs to be undertaken via a formalised process. This should include the identification, prioritisation and management of actions. The WSAA framework provides the necessary tools to achieve this process.
Summary
The WSAA benchmarking project has assisted authorities to understand their current asset management capability. It has also allowed both WSAA and the industry to identify the potential improvements required to improve asset management both within authorities and across the industry. The benchmarking process has identified improvements for:
• Individual authorities; and
• Industry as a whole.
The improvements for individual authorities have been documented in the authority reports however; the following are principles that should be applied based on observations identified in this report. If an authority wishes to make substantial gains it will be necessary for them to:
• Improvements across the functions - focus on strategic processes such as risk management and review and audit;
• Implement review and audit processes in the Operations, Maintenance and Replacement and Rehabilitation functions;
• Improve the strategic processes in the individual functions;
• Implement a business management system that can be used to communicate processes across the business;
• Purchase and implement core business systems and invest in the resources to utilise the systems; and
• Obtain the data necessary to allow the required outputs to be generated. E.g. Risk data, condition, performance.
In undertaking the above actions it should be recognised that improvements should be undertaken across processes and functions by implementing across the business. Stakeholder buy-in is an important action in this program. Failure to obtain buy-in will slow the improvement program significantly as the improvements will be focused on a few actions being resourced by a few people. Each water authority is now in a position to implement its improvement program and monitor its performance with respect to asset management, while WSAA is now in a position to provide guidance in key areas such as Configuration Management to assist the industry to progress asset management as a whole. Key activities that WSAA could undertake to assist the water industry to progress include:
• Provision of guidelines addressing:
- Configuration Management; - Risk Management including the
relationship between condition and probability;
- Reliability Centred Maintenance (RCM) and Failure Modes Effects and Criticality Analysis (FMECA) in the water industry;
- Relationship between asset types and maintenance curves; and
- Good practice in Asset Handover and project Completion Review processes.
• Generation of standard fault codes by asset type;
December 2004 22
• Develop economic lives and variances using water authority data;
• Identify and distribute guidelines/data on the relationship between maintenance cost and capital expenditure; and
• Review of existing guidelines for TBL by WSAA and development of a template or promotion of existing guidelines for use across the industry.
• Provision of framework for good practice in quality management at different business levels.
• Provision of framework with methodologies for communication with stakeholders and models to analyse the impacts of changing service levels with the cost of service delivery.