Paths Asset Management Plan 2016 Regional Shared Use Paths Paths in Distributor Roads Paths in Local Streets Condition Rated 3 Paths Damaged Paths Repairing & Maintaining Paths Rev 5 Scenario 2 Version 2 March 2016
Transcript
Paths
Asset Management Plan 2016
Regional Shared Use Paths Paths in Distributor Roads Paths in Local Streets
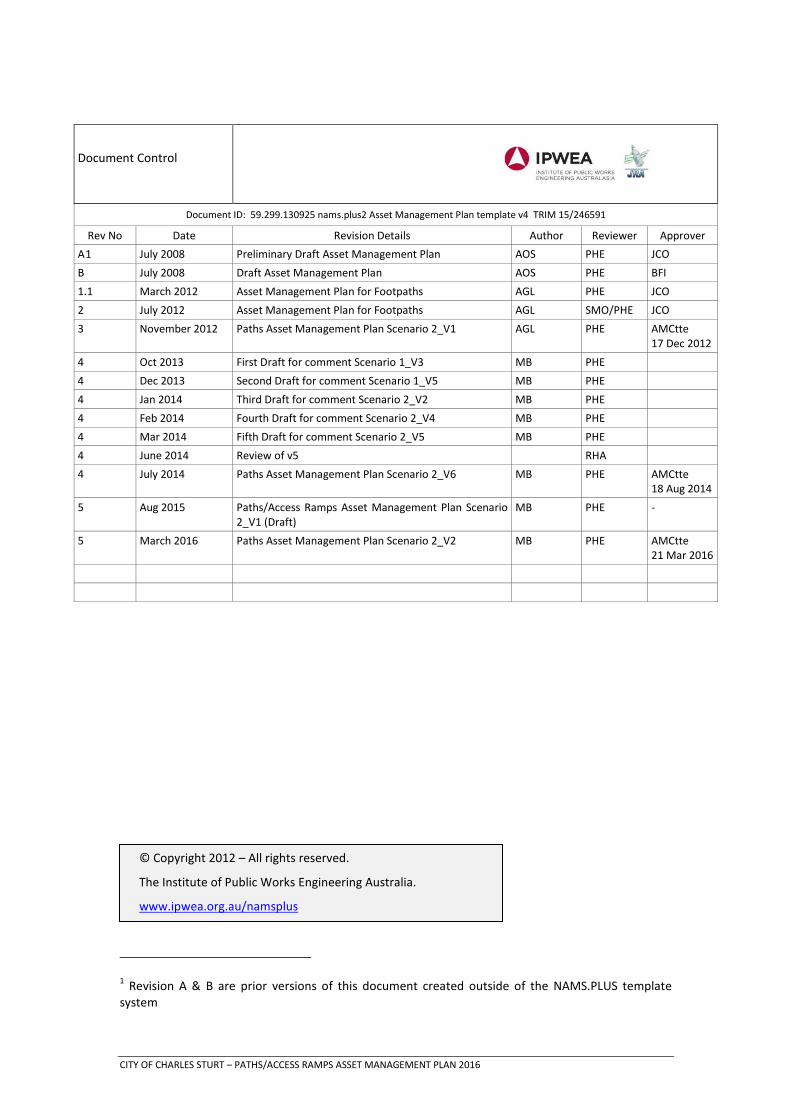
Document ID: 59.299.130925 nams.plus2 Asset Management Plan template v4 TRIM 15/246591
Rev No Date Revision Details Author Reviewer Approver A1 July 2008 Preliminary Draft Asset Management Plan AOS PHE JCO B July 2008 Draft Asset Management Plan AOS PHE BFI 1.1 March 2012 Asset Management Plan for Footpaths AGL PHE JCO 2 July 2012 Asset Management Plan for Footpaths AGL SMO/PHE JCO 3 November 2012 Paths Asset Management Plan Scenario 2_V1 AGL PHE AMCtte
17 Dec 2012 4 Oct 2013 First Draft for comment Scenario 1_V3 MB PHE 4 Dec 2013 Second Draft for comment Scenario 1_V5 MB PHE 4 Jan 2014 Third Draft for comment Scenario 2_V2 MB PHE 4 Feb 2014 Fourth Draft for comment Scenario 2_V4 MB PHE 4 Mar 2014 Fifth Draft for comment Scenario 2_V5 MB PHE 4 June 2014 Review of v5 RHA 4 July 2014 Paths Asset Management Plan Scenario 2_V6 MB PHE AMCtte
18 Aug 2014 5 Aug 2015 Paths/Access Ramps Asset Management Plan Scenario
2_V1 (Draft) MB PHE -
5 March 2016 Paths Asset Management Plan Scenario 2_V2 MB PHE AMCtte 21 Mar 2016
1 Revision A & B are prior versions of this document created outside of the NAMS.PLUS template system
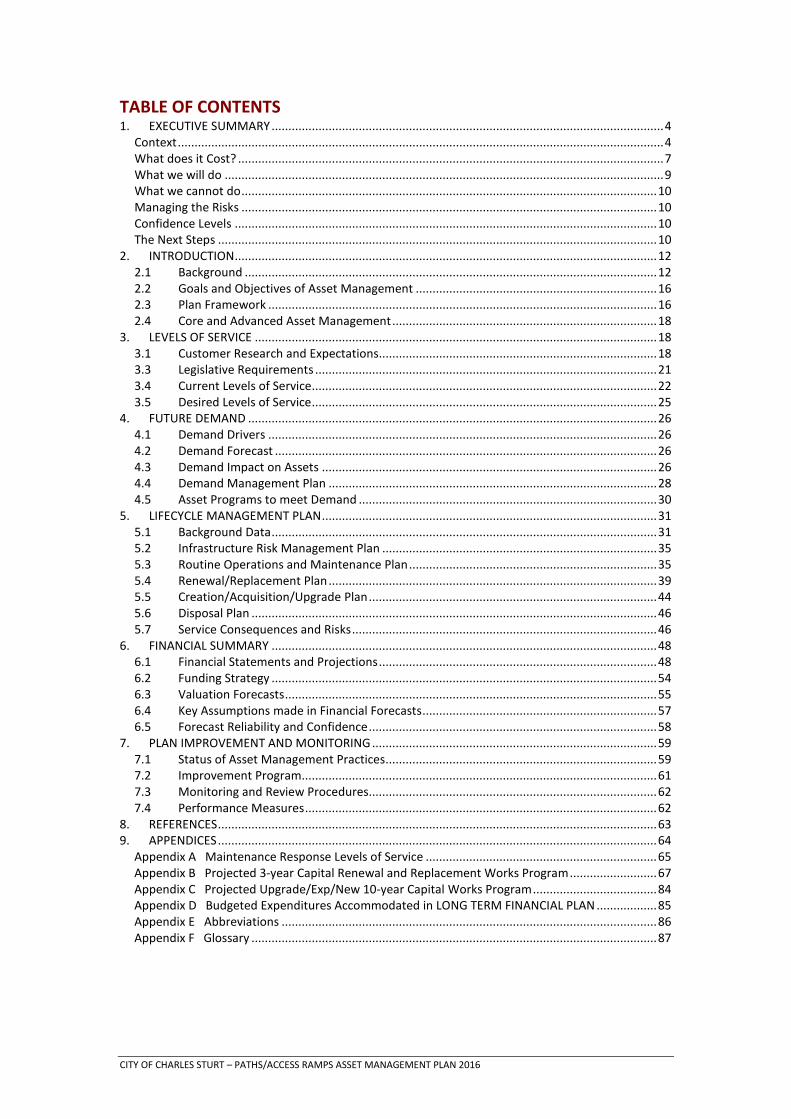
TABLE OF CONTENTS 1. EXECUTIVE SUMMARY ..................................................................................................................... 4
Context ................................................................................................................................................. 4 What does it Cost? ............................................................................................................................... 7 What we will do ................................................................................................................................... 9 What we cannot do ............................................................................................................................ 10 Managing the Risks ............................................................................................................................ 10 Confidence Levels .............................................................................................................................. 10 The Next Steps ................................................................................................................................... 10
2. INTRODUCTION .............................................................................................................................. 12 2.1 Background ........................................................................................................................... 12 2.2 Goals and Objectives of Asset Management ........................................................................ 16 2.3 Plan Framework .................................................................................................................... 16 2.4 Core and Advanced Asset Management ............................................................................... 18
3. LEVELS OF SERVICE ........................................................................................................................ 18 3.1 Customer Research and Expectations ................................................................................... 18 3.3 Legislative Requirements ...................................................................................................... 21 3.4 Current Levels of Service ....................................................................................................... 22 3.5 Desired Levels of Service ....................................................................................................... 25
5. LIFECYCLE MANAGEMENT PLAN .................................................................................................... 31 5.1 Background Data ................................................................................................................... 31 5.2 Infrastructure Risk Management Plan .................................................................................. 35 5.3 Routine Operations and Maintenance Plan .......................................................................... 35 5.4 Renewal/Replacement Plan .................................................................................................. 39 5.5 Creation/Acquisition/Upgrade Plan ...................................................................................... 44 5.6 Disposal Plan ......................................................................................................................... 46 5.7 Service Consequences and Risks ........................................................................................... 46
6. FINANCIAL SUMMARY ................................................................................................................... 48 6.1 Financial Statements and Projections ................................................................................... 48 6.2 Funding Strategy ................................................................................................................... 54 6.3 Valuation Forecasts ............................................................................................................... 55 6.4 Key Assumptions made in Financial Forecasts ...................................................................... 57 6.5 Forecast Reliability and Confidence ...................................................................................... 58
7. PLAN IMPROVEMENT AND MONITORING ..................................................................................... 59 7.1 Status of Asset Management Practices ................................................................................. 59 7.2 Improvement Program.......................................................................................................... 61 7.3 Monitoring and Review Procedures...................................................................................... 62 7.4 Performance Measures ......................................................................................................... 62
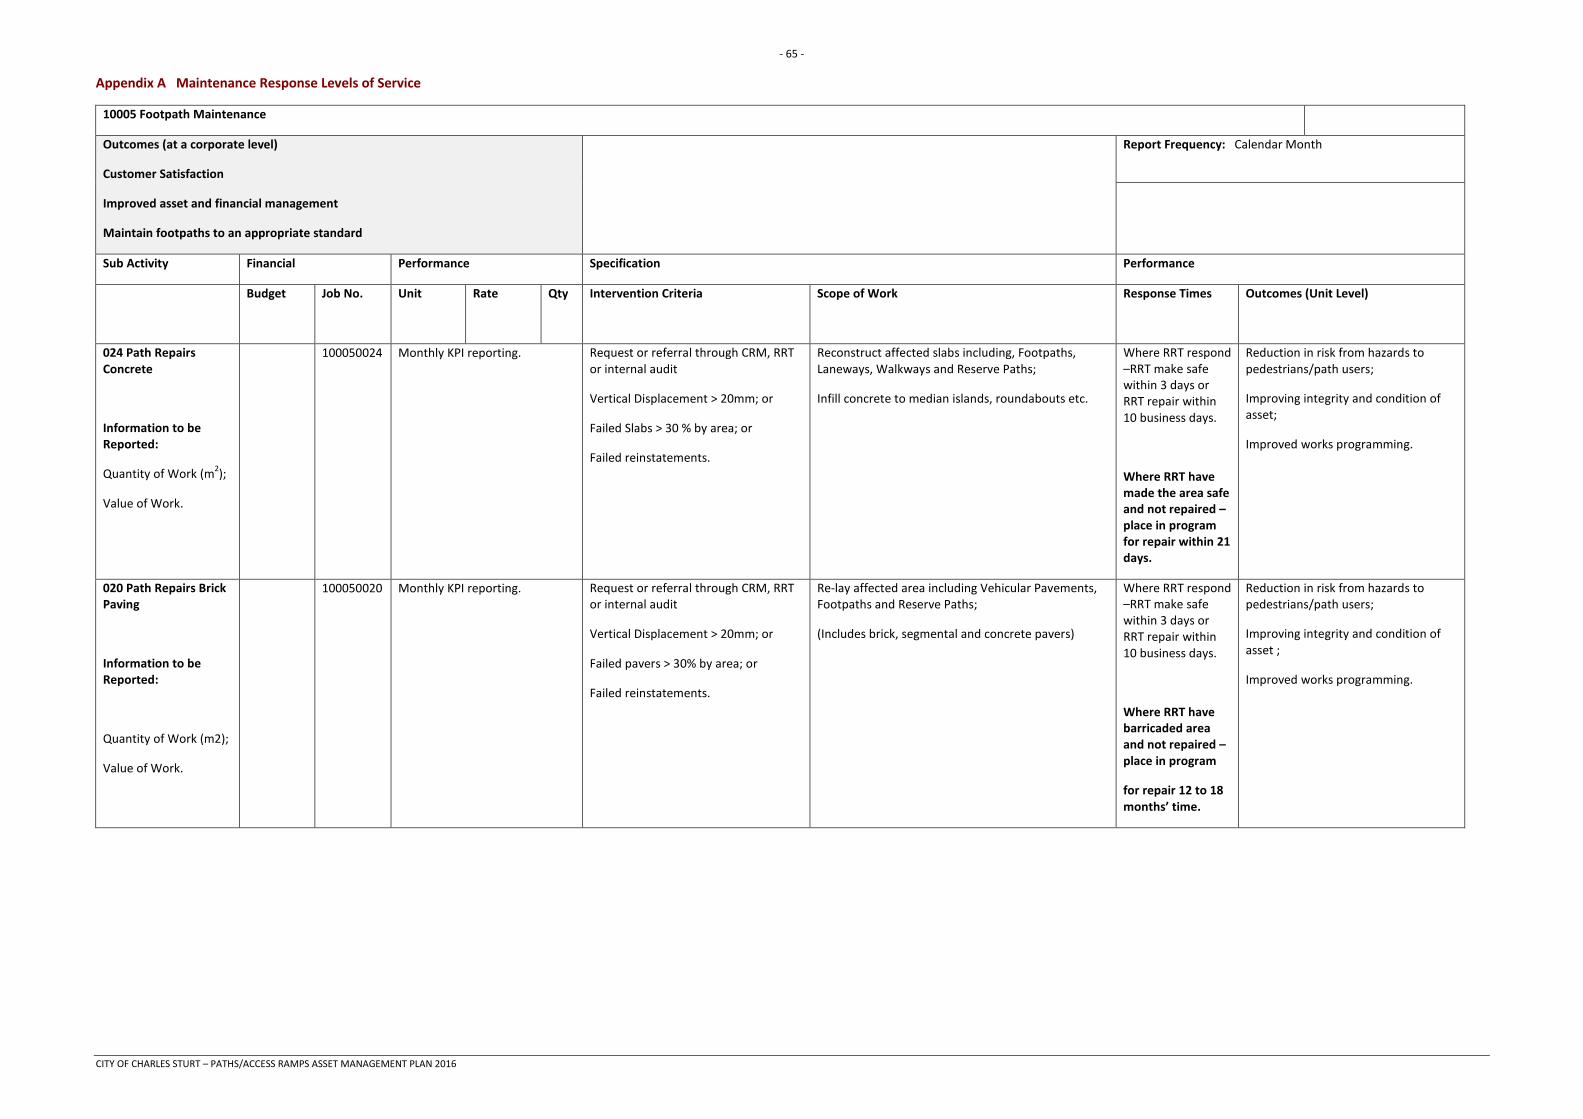
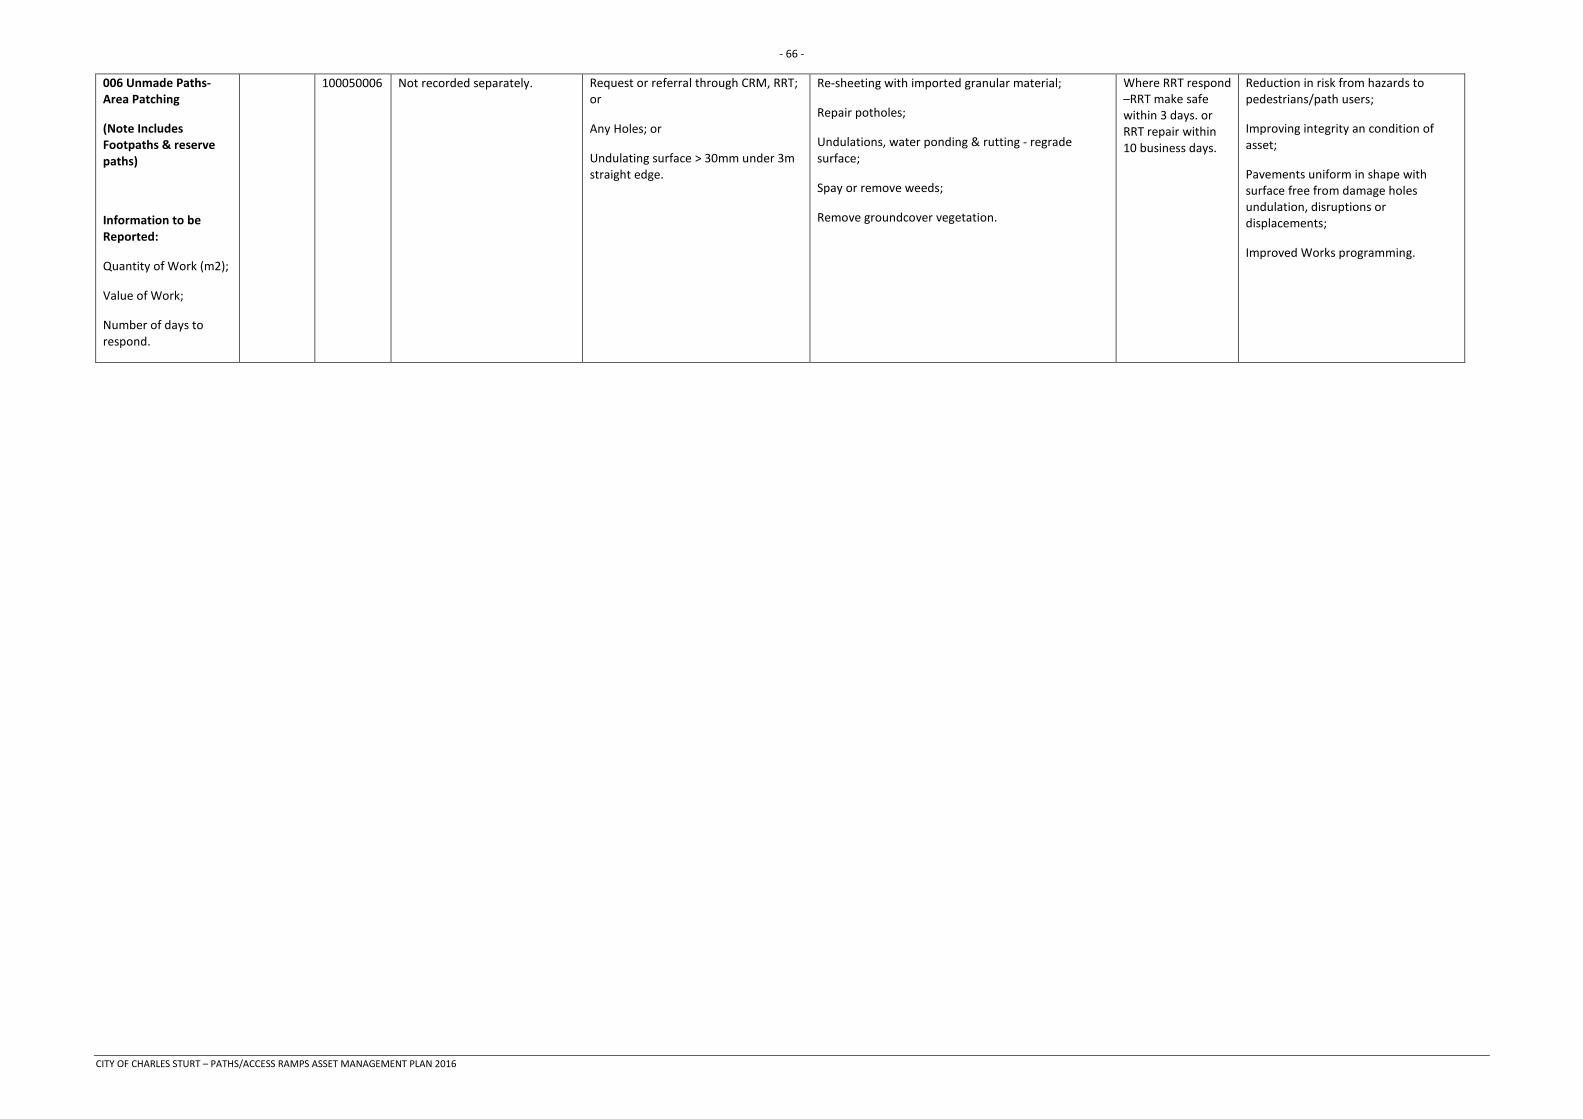
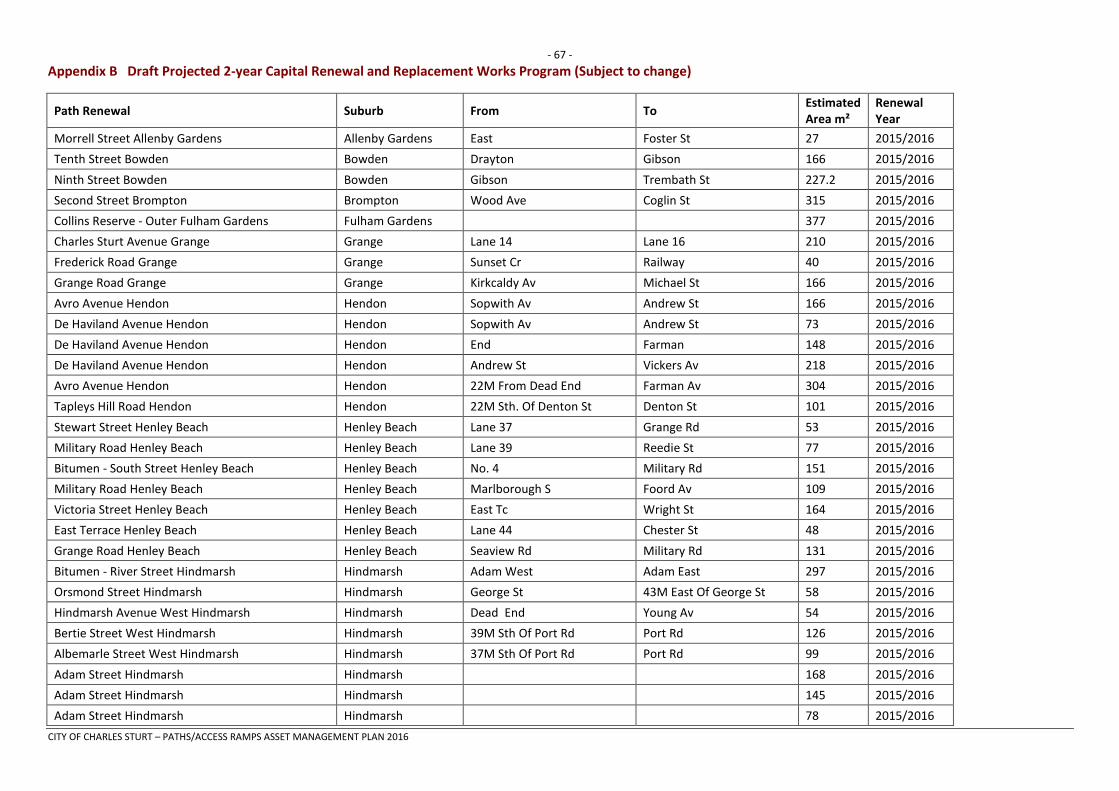
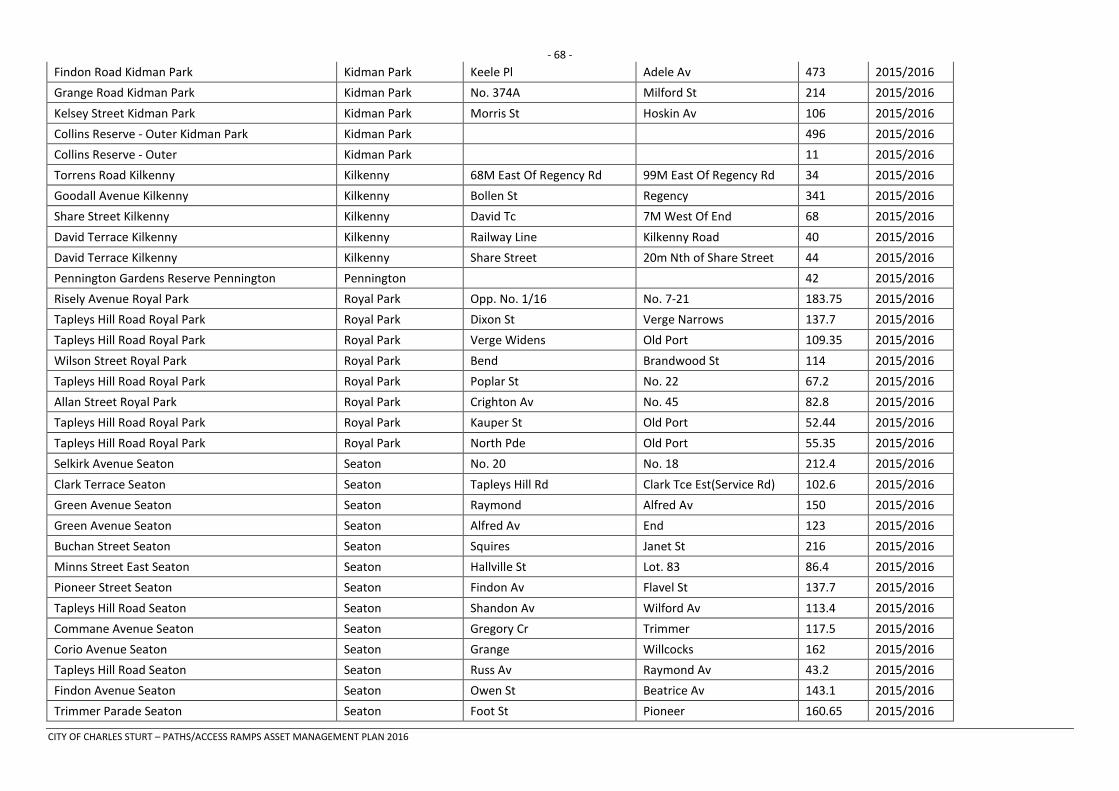
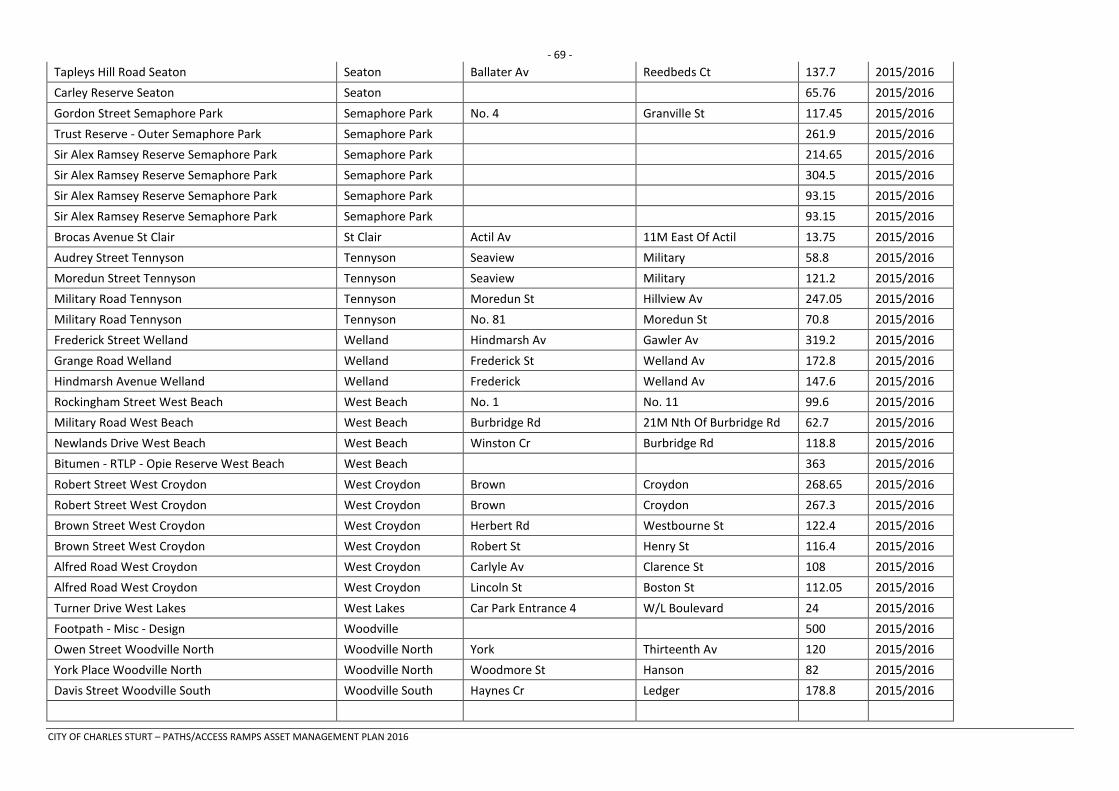
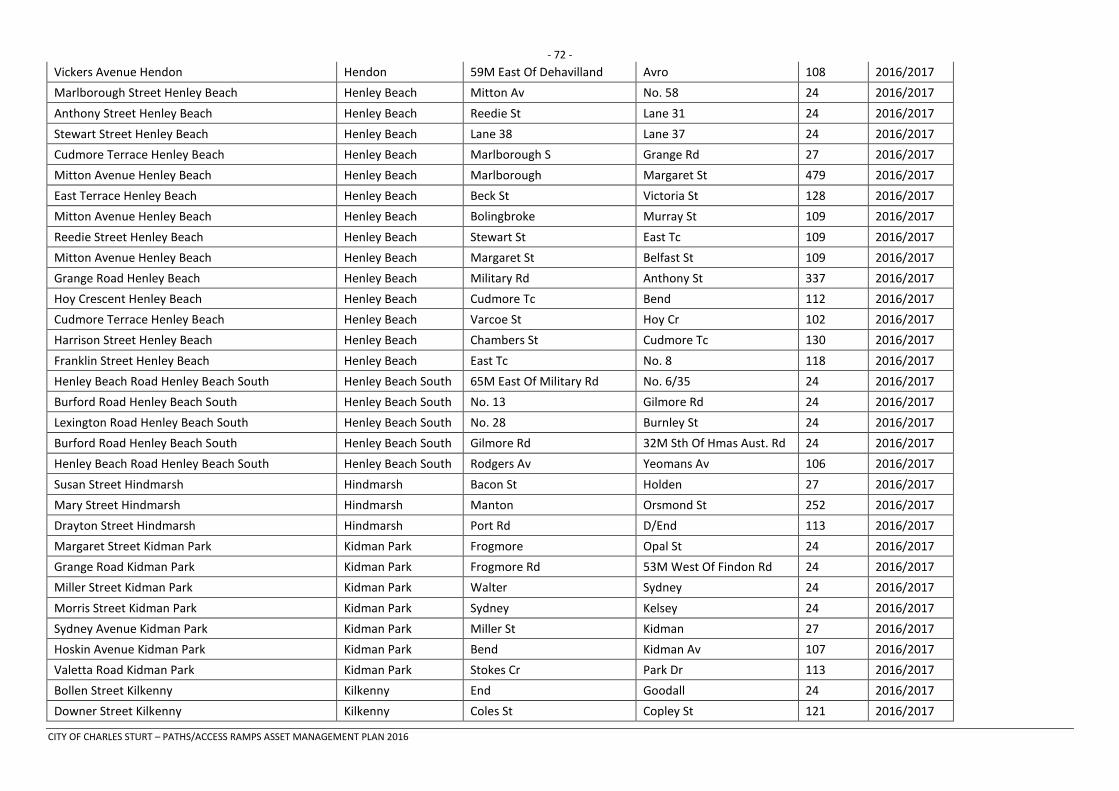
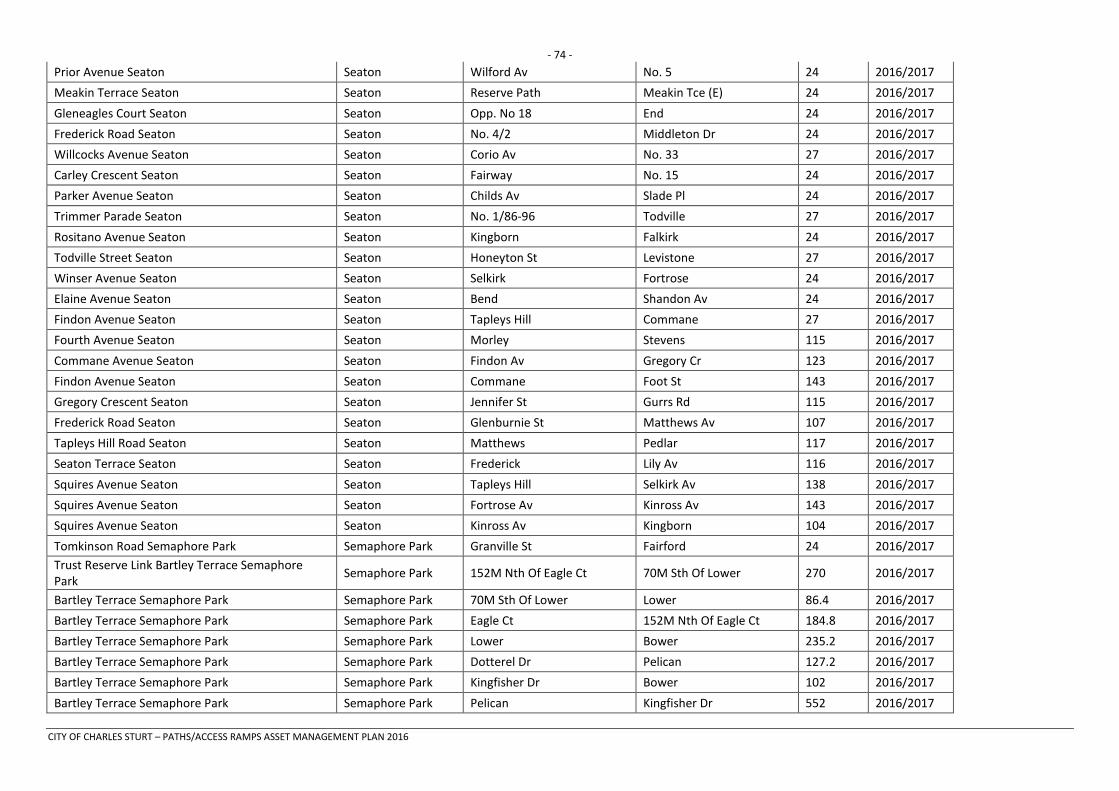
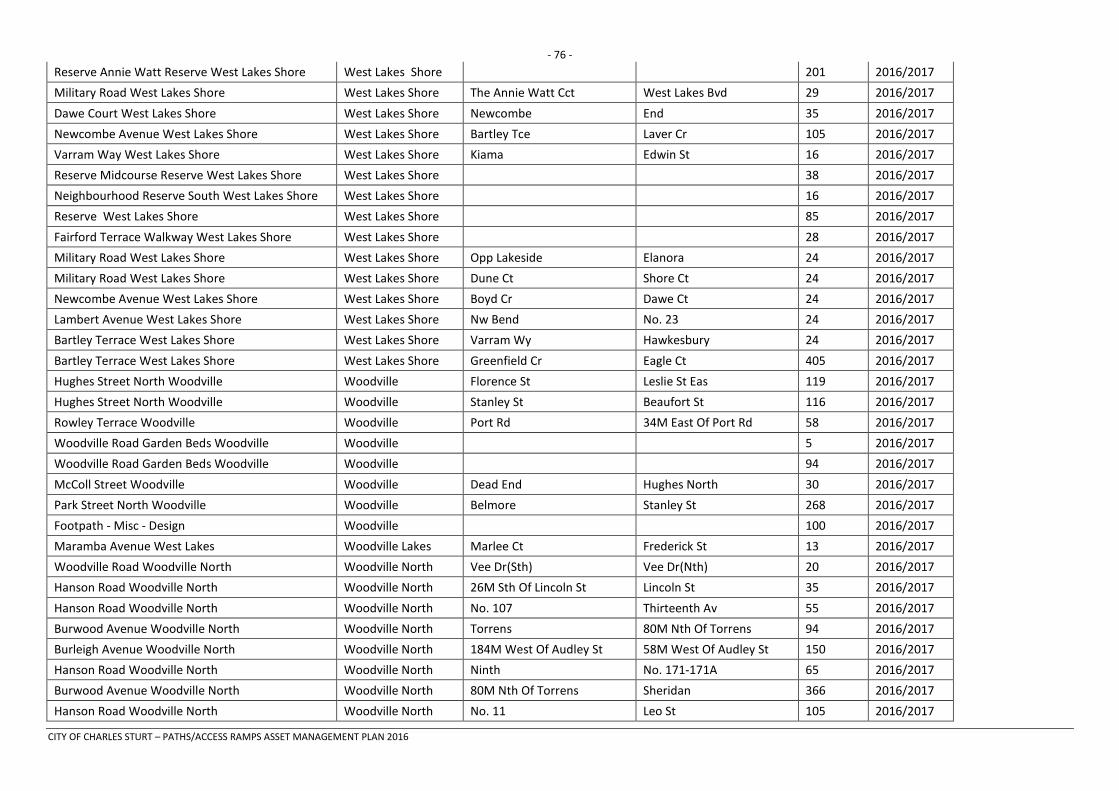
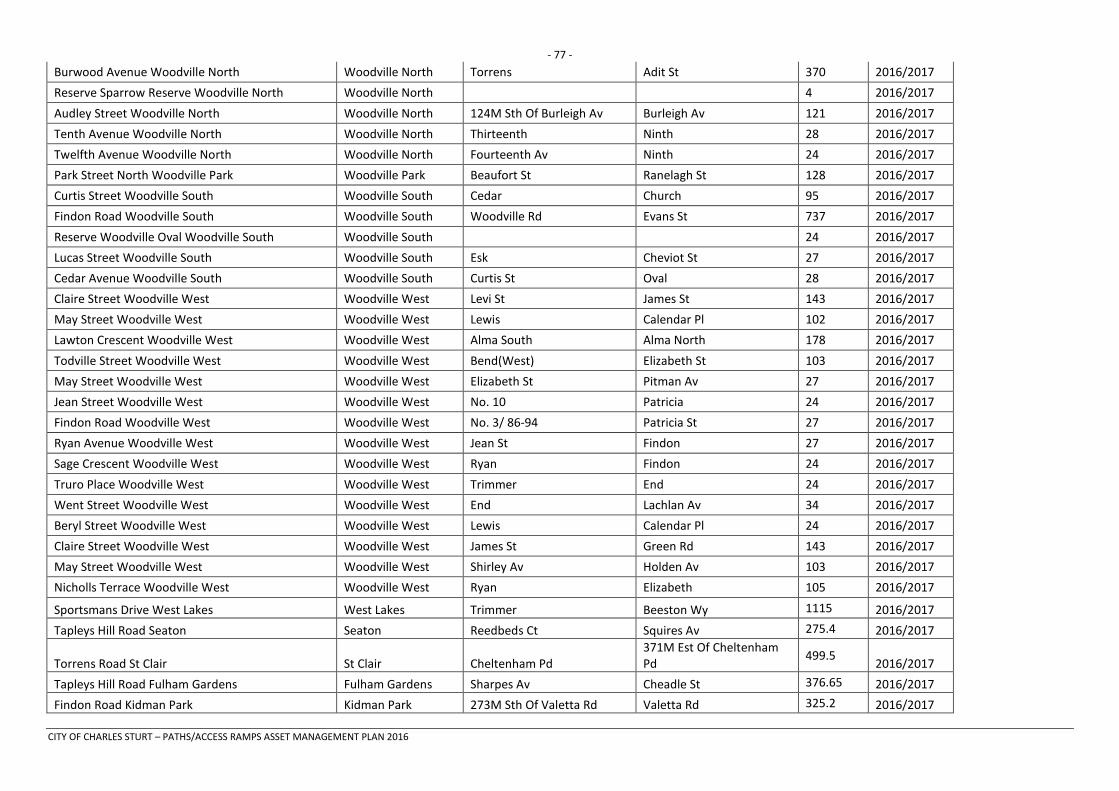
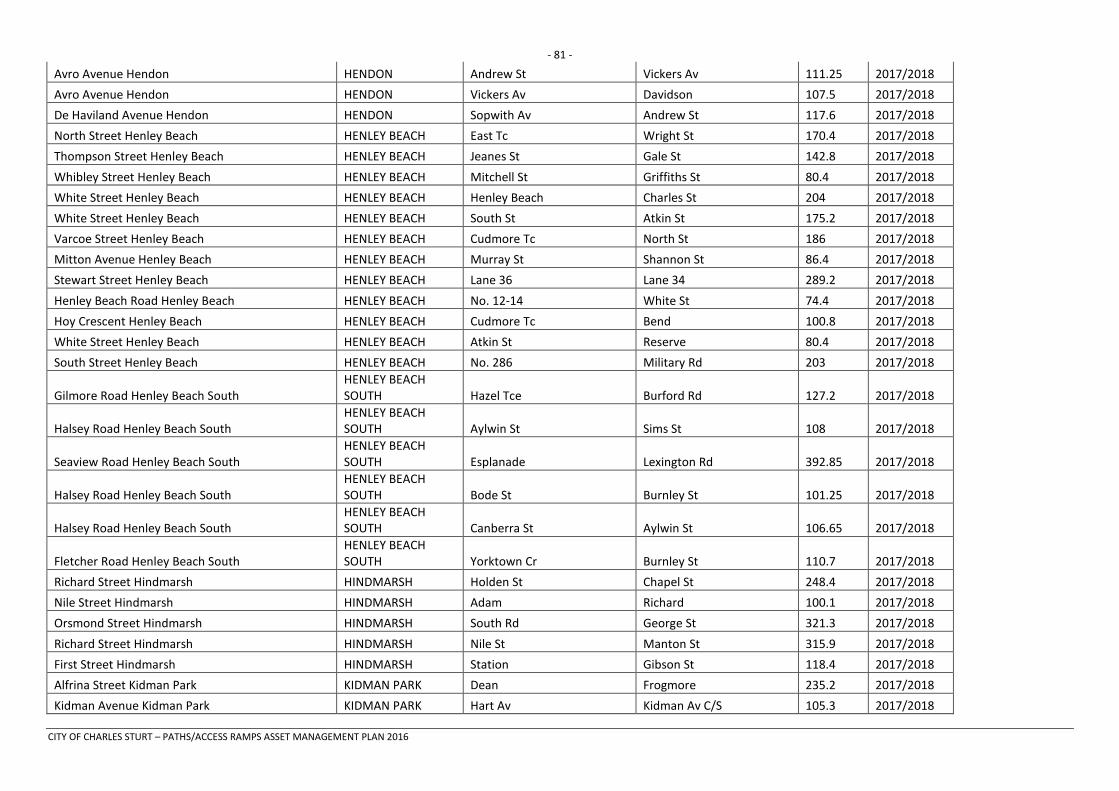
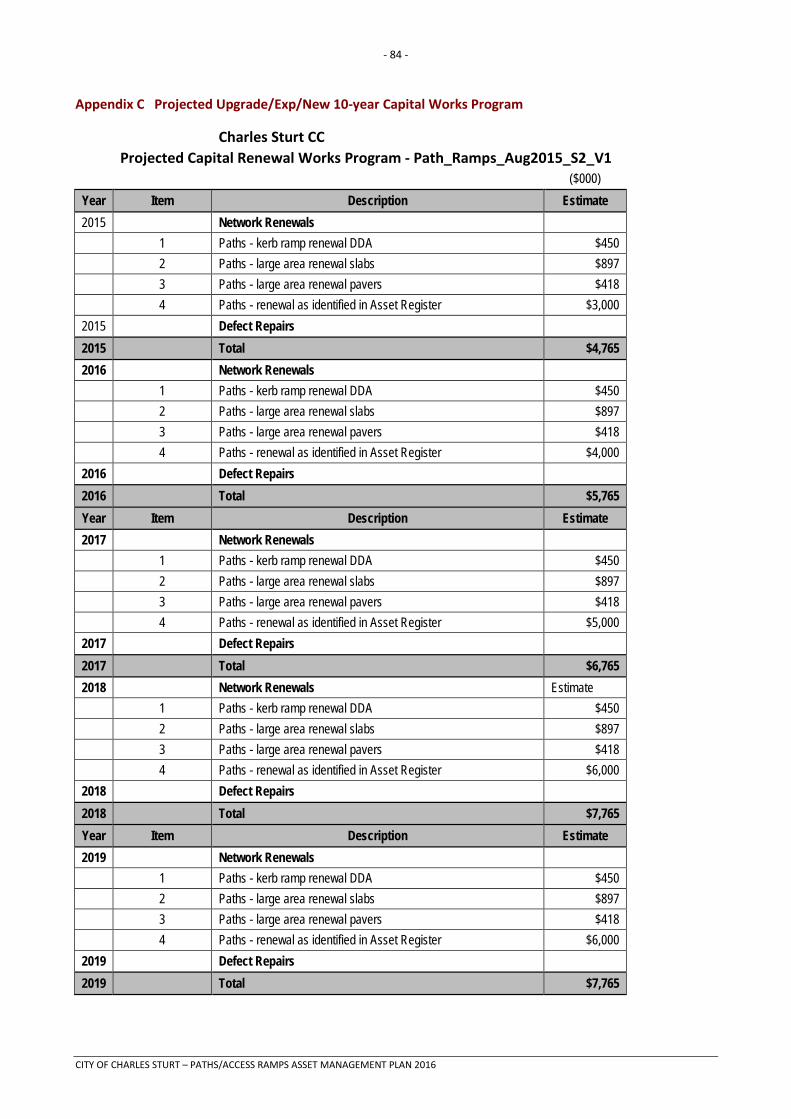
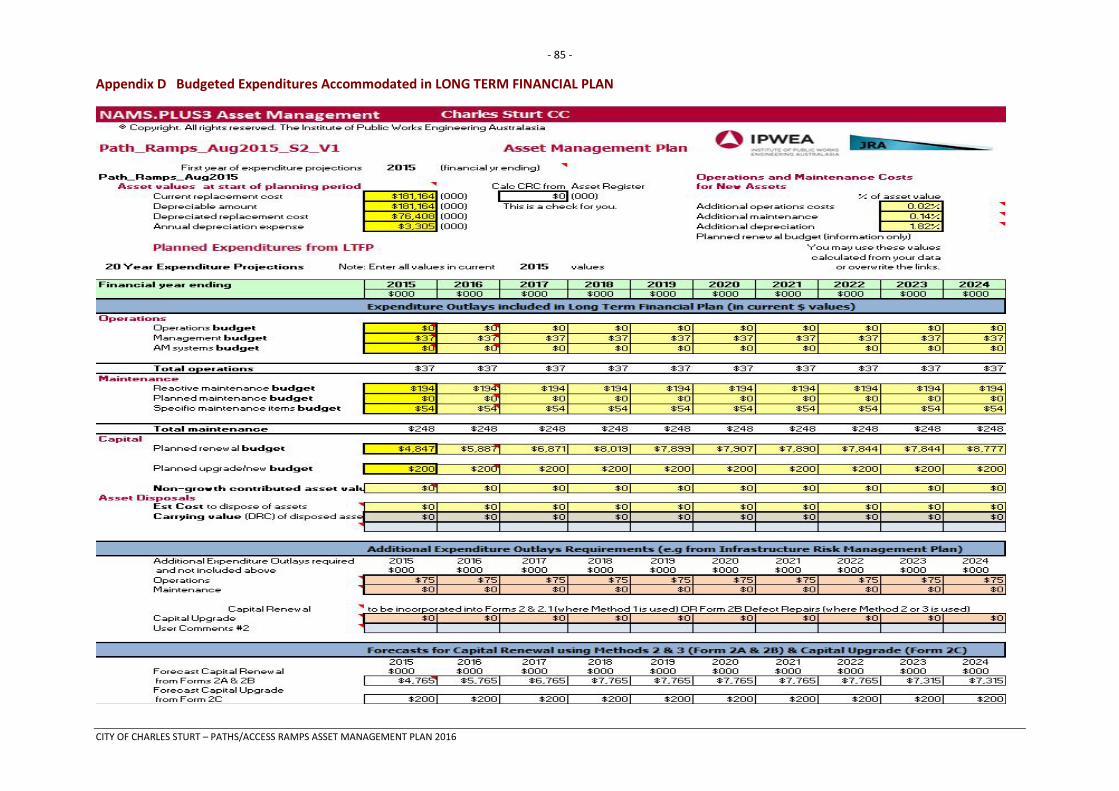
Appendix A Maintenance Response Levels of Service ..................................................................... 65 Appendix B Projected 3-year Capital Renewal and Replacement Works Program .......................... 67 Appendix C Projected Upgrade/Exp/New 10-year Capital Works Program ..................................... 84 Appendix D Budgeted Expenditures Accommodated in LONG TERM FINANCIAL PLAN .................. 85 Appendix E Abbreviations ................................................................................................................ 86 Appendix F Glossary ......................................................................................................................... 87
CITY OF CHARLES STURT – PATHS/ACCESS RAMPS ASSET MANAGEMENT PLAN 2016
- 4 -
1. EXECUTIVE SUMMARY
Context
The City of Charles Sturt embraces some of Adelaide’s oldest suburban developments with residential and business facilities dating back many years. Over time the area has grown to include many diverse services utilising a mixture of civil infrastructure and ‘green’ assets. The City has grown in size and density, as has the demand for services and in the coming years these demands will be reflect the State’s 30 Year Plan for Greater Adelaide. Asset age and intervening investment ensure that condition and service continue to provide our community with a complex challenge. Asset Management Plans provide balance between investment and growth and maintenance.
This Asset Management Plan contributes to achieving the appropriate balance of social, cultural, environmental and economic services; the keys to sustainability. Whilst asset planning is about the
condition of assets, at the forefront to this planning is our community expectation of these assets, the current and future users.
Historical Context
Paths are important to local neighbourhoods, enabling ease of movement by commuters to move around local areas. They provide access to shopping, transport, schools and playgrounds within the immediate area. Footpaths have traditionally been asphalt or dolomite up to the late 60’s at which time un-reinforced concrete became a popular material choice. In recent years the materials of choice moved to clay and concrete block paving both of which contribute to improved neighbourhood amenity, the
exception being in some historical areas where asphalt paths are more sympathetic to the historical character.
Asphalt paths have the shortest service life, typically less than 25-years and are susceptible to damage by tree roots. This material type is relatively easy to maintain, and has low costs for repair and renewal. Asphalt footpaths are not normally used in residential neighbourhoods due to their “industrial” feel; the exception being in local historical areas. They continue to be used for new “shared use paths” and bicycle routes as they provide a smoother ride than other surfaces. Asphalt paths are an acceptable type of path through park areas and are sometimes constructed on low volume routes.
Plain concrete paths were widely introduced during the 70’s and 80’s in new estates of that time. They have been serviceable and have a very long life of 60 years or more. Like Asphalt, these paths are susceptible to tree roots, which generally lift a whole slab of concrete. An advantage with concrete paths is these trip hazards can be ground down and removed (temporarily). This may occur several times, thus increasing their useful service lives. The grinding often looks untidy and of a different colour so is not well liked by residents. Plain concrete is easy and relatively low cost to repair, and matches in with older work very well. Coloured and pattern concrete as well as pebble “washed” finish concrete paths have been used in certain areas to leverage the benefits of concrete, and increase the amenity of streets. However, damage in this type of concrete is very expensive to repair and rarely matches in with older work.
Brick (clay) pavers have been available for many years and have been used to accent “special” areas. They are more expensive to install than bitumen and concrete paths. With pre-cast coloured concrete pavers now readily available concrete pavers have become the material of choice for footpath construction. If laid correctly, with side support and bedding, on stable ground, they have an estimated useful life of 50 years. Pavers are an attractive solution, as various colour combinations may be used and they add a warm ambience to a neighbourhood. Pavers can be removed in sections and re-laid easily, saving costs and also preserving the colour. This has proved a big benefit for developing areas. Again they are susceptible to tree routes, but can be re-laid to suit new levels. They also tend to have multiple, low trip hazards which may be a problem to some older or infirm people. Pavers are not suitable for small wheeled recreational devices, such as roller skates etc.
CITY OF CHARLES STURT – PATHS/ACCESS RAMPS ASSET MANAGEMENT PLAN 2016
- 5 -
Paths have been constructed over many years and new ones continue to be constructed. They have often been constructed as part of development cycles which tend to show a ‘boom and bust’ nature.
Examples are: • Baby Boomers building boom of the late 50,
60’s and early 70’s where residential development occurred throughout the city.
• Construction of West Lake’s where development and building of paths was concentrated in a few years.
• Upgrade of footpaths on arterial roads in the late 70’s as part of road widening.
This now has implications as many of these paths are reaching the end of their theoretical Estimated Useful Life (EUL) in a similar uneven manner to which they were originally constructed. The condition data collected in 2013 confirms this.
Hierarchy for Paths
Paths are arranged in a hierarchical system as described below:
Local Access Streets
Paths in local streets are generally used for access from the roadway and to neighbouring properties. Traditionally they have only been 900mm to 1200mm wide and current footpath policy stipulates installation only on one side of the street and not less than 1400mm wide (Based on paver block dimension).
Collector Roads
Much like the Collector Road they are paired with, paths in this level of hierarchy generally link residential areas to more major roads and to local community facilities such as schools, churches, halls and local shops. Due to increased vehicle traffic along these roads, the paths are best located next to front fences to increase the separation between busier roadways.
Distributor Roads
Paths located next to Distributor Roads are similar to those with Collector Roads, but usually have greater foot traffic and may include bus stops. With increased vehicle traffic, often with higher speed, it is highly desirable for these to be located next to front fences to increase the separation distance on these busier roads. Due to pedestrian demand, these paths often exceed the minimum width of 1400mm.
Arterial Roads
Paths located next to Arterial Roads have many functions, including access to commuter facilities, local and district shops as well as community facilities. Ideally they should be located well away from vehicle traffic, but due to the continued increased demand for motor vehicles, are now often located on narrow verges (3500mm wide) and are not safe, have low amenity and are difficult to keep clean and to maintain. These paths are often paved areas for the full width of the verge, but should have a minimum width of 1800mm.
Reserves
Paths through Reserves, including shared use paths, are connectors through parks and along linear routes such as the River Torrens and railway corridor. These paths serve both cycling and pedestrian routes, often for daily commuter use, but also for recreation. Walking paths are usually 1500mm in width and shared paths can be up to width of 3000mm with additional clearances along edges where required. They are designed to allow cyclists to pass, in both directions. For the purposes of this Asset Management Plan, reserve paths are included in the same context as Local Roads category.
Paths Level of Service
The paths service is evaluated using three triggers for renewal. These are Condition, Function and Capacity. There has been no work done on determining changes to Function, or Capacity in the past 12-months.
A comprehensive audit of the entire path network was undertaken in 2013 to determine the total amount of the assets in the network and the condition of that asset class. The results from this audit are described below.
In summary, the path network length is:
Asphalt Paths 46.3 km Concrete Paths 823.6km Clay Paver Paths 28.6 km Concrete Paver Paths 111.4 km Other Paths. (Unmade) 249.5 km Exposed Aggr 1.4 km Granite 0.58 km Recycled Rubber 0.027 km Rubble 16.9 km Total 1,278.57 km
CITY OF CHARLES STURT – PATHS/ACCESS RAMPS ASSET MANAGEMENT PLAN 2016
- 6 -
What have we achieved?
The change in the condition of the path asset is shown in the Pie Charts below. The percentage of paths in Condition Rating 4 or 5 (poor/ red) has decreased from 14% to 3%. These are paths which should be replaced in the short term (1 to 4 years). The percentage of paths in Condition Rating 3 (fair/ orange) has increased from 51% to 60%. These are paths which will be serviceable (with additional maintenance requirements) for the short term, but will require replacement in the medium term (5 to 15-years). The percentage of paths with Condition Rating 1 or 2 (good/ green) has increased from 33% to 37%.
Path condition identified in 2012 Asset Management Plan revision.
Path condition identified in 2014 Asset Management Plan revision.
The current path condition. Since the 2014 we have:
Decrease in Poor from 16% to 3%
Increase in Good from 33% to 37%
Increase in Fair from 51% to 60%
This shows that our current path asset renewal strategy is having the desired affect
As part of the consolidation of data and update of the Path AMP, Pram Ramps are now included in the Asset Database.
The chart below shows the current condition of pram ramps within the City.
There is a program in place to up-grade and renew pram ramps to achieve the Disability Discrimination Act requirements to have all pram ramps DDA compliant by 2021.
The chart below shows a combined condition rating for all Paths and Pram Ramps.
16%
51%
33% Poor
Fair
Good
Post 2013 Audit
3%
60%
37%
Poor
Fair
Good
Path condition as at August 2015
21%
40%
39%
Poor
Fair
Good
Access Ramps Condition
CITY OF CHARLES STURT – PATHS/ACCESS RAMPS ASSET MANAGEMENT PLAN 2016
- 7 -
The Pie Charts demonstrate that the current endorsed Long Term Financial Plan budgeted expenditure, informed from previous condition audits, is adequate for maintaining the path assets with a sustainable level of service which would see renewal occur as paths and ramps dropped from a condition 3 to a condition 4.
What does it Cost?
These infrastructure assets have a replacement value of $181M. This includes access ramps which have a replacement value of $8.8M.
The projected outlays to provide the services covered by this Asset Management Plan includes operations, maintenance, and renewal of existing assets. Over the immediate 10-year planning period the expenditure is forecast to be $76.4M or $7.6M on average per year (in 2015/16 dollars).
The annual forecast expenditure on path and access ramp assets is summarised for the 2015/16 as:
Maintenance Customer response (trip hazards) $194,000 Total Maintenance $194,000
Renewals Whole Paths $3,000,000 Project manager $75,000 Large area slab renewal $897,000 Large area paver renewal $418,000 Access ramp renewal $450,000
Total Renewals $4,840,000
New Customer Requests $200,000 Strategic New $235,000 Total New $435,000
Total Annual Expenditure $5,469,000
The renewal for Whole Paths and Access Ramps is forecast to increase from $3,450,000 in 2015/16 to $6,450,000 by 2018/19 and remain at that level until 2023/24 (when it again escalates to $8,450,000). The 4-Year Whole Paths and Access Ramp renewal program in this Asset Management Plan contains paths in condition:
• 2015/16, 2016/17 condition 4 (South Road T2T project has impinged on the renewal of Condition 4 and 5 paths in areas immediately adjacent to this project. These paths have been identified and will be renewed at the finish of the T2T project).
• 2017/18 condition 4 & 3 • Beyond 2018 condition 3. • Starting in 2017/18 an intervention strategy on
condition 3 paths, which have been identified as approaching condition 2 will be implemented to return these paths to level 2 at low cost.
• Condition 3 paths which have been identified as approaching condition 4 will be listed for renewal.
• Additionally in any year, when opportunities arise (such as when DPTI is undertaking major road works) to renew path assets in line with these works. These will be added to the program and other works deferred for a year on an agreed basis.
The intention is to remove all condition 5 paths from the network and intervene as paths change from condition 3 to condition 4. We do not propose to change this renewal trigger until we have a better understanding about the service levels our community expects from paths.
The Asset Management Plan includes condition auditing of the asset base once every 6 years or one sixth of the path assets each year for an additional cost of $25,000 annualised cost.
The funding provided in the Long Term Financial Plan which was endorsed by Council in 2014 is $78.6M or $7.8M per year (on average) over the immediate 10-year period which is 103% of the cost of providing the service. This is on average a surplus of $2,250 per year which we recommend retaining due to uncertainties around the level of urban renewal and densification; and building extension and restoration activity within the city. The recommended spend is shown in the graph below.
5%
60%
35%
Poor
Fair
Good
Combined Paths & Access Ramps as a % of Total Renewal Cos
CITY OF CHARLES STURT – PATHS/ACCESS RAMPS ASSET MANAGEMENT PLAN 2016
- 8 -
This Asset Management Plan uses the estimated useful life of an asset derived from actual path condition data. This improves the estimate of the remaining life of each path before it needs to be renewed.
The first run using this Method improved the distribution of the renewal expenditure, enabling the current Long Term Financial Plan (LTFP) to be modified to accommodate the renewal required. The expenditures were ‘smoothed’ for graduated increase each year with the total overall expenditure for the immediate 10-year period equal to the first run amount.
Provision has been made through the Long Term Financial Plan for significant increases the average annual expenditure in line with the forecasts in this Path and Access Ramp Asset Management Plan.
CITY OF CHARLES STURT – PATHS/ACCESS RAMPS ASSET MANAGEMENT PLAN 2016
Cond 3 Current Condition 3 expected to be condition 4 by 2020
Other Paths on DPTI Roads plus strategic plans
• The value of Access Ramps has been included in this Asset Management Plan (this is $8,800,000). • Review options to reduce the maintenance backlog which currently sits at just over 2-years between a maintenance request being received and the maintenance
undertaken. • Operation, maintenance, renewal and upgrade of paths to meet service levels set in annual budgets through the 4-year Whole Path renewal program to reduce
condition 5 and 4 paths. • Renew all residential and commercial area asphalt footpaths to a minimum standard required under Disability Discrimination Act, with materials of a more durable
and aesthetic nature within the 10-year planning period. • Renew paths along routes determined as Major Roads, Access footpaths and Shared use paths as they fall due under the Asset Management Plan.
CITY OF CHARLES STURT – PATHS/ACCESS RAMPS ASSET MANAGEMENT PLAN 2016
- 10 -
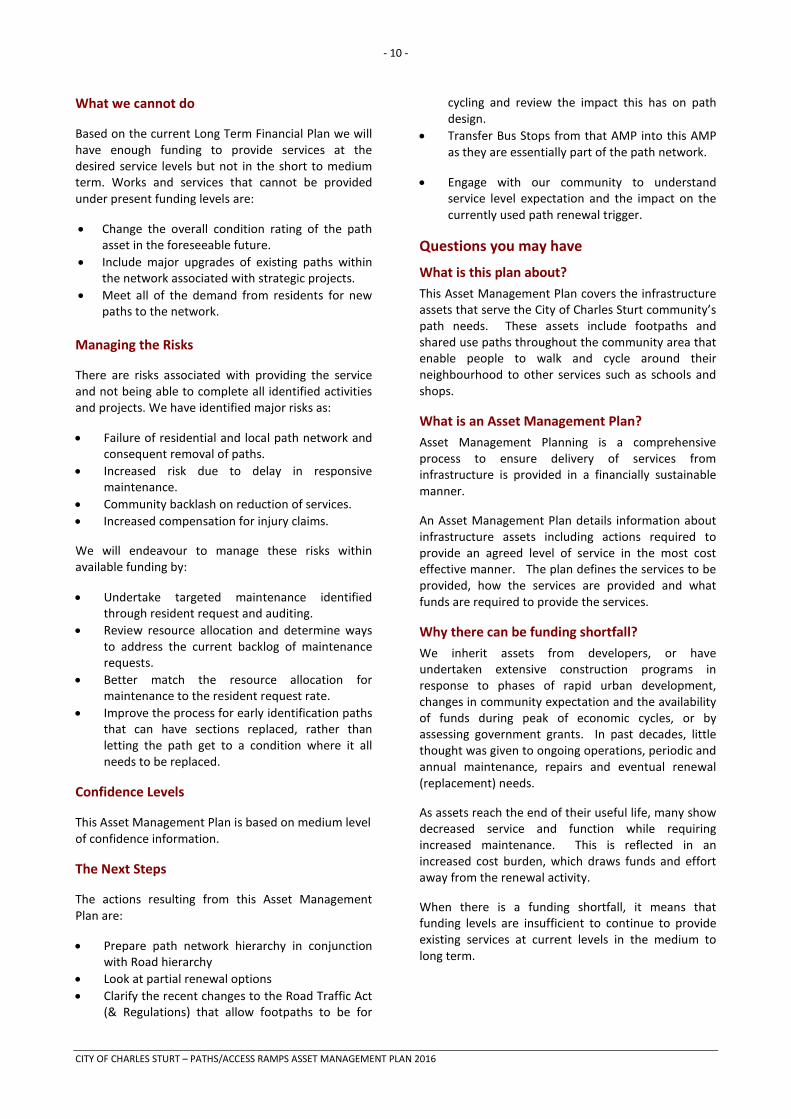
What we cannot do
Based on the current Long Term Financial Plan we will have enough funding to provide services at the desired service levels but not in the short to medium term. Works and services that cannot be provided under present funding levels are:
• Change the overall condition rating of the path asset in the foreseeable future.
• Include major upgrades of existing paths within the network associated with strategic projects.
• Meet all of the demand from residents for new paths to the network.
Managing the Risks
There are risks associated with providing the service and not being able to complete all identified activities and projects. We have identified major risks as:
• Failure of residential and local path network and consequent removal of paths.
• Increased risk due to delay in responsive maintenance.
• Community backlash on reduction of services. • Increased compensation for injury claims.
We will endeavour to manage these risks within available funding by:
• Undertake targeted maintenance identified through resident request and auditing.
• Review resource allocation and determine ways to address the current backlog of maintenance requests.
• Better match the resource allocation for maintenance to the resident request rate.
• Improve the process for early identification paths that can have sections replaced, rather than letting the path get to a condition where it all needs to be replaced.
Confidence Levels
This Asset Management Plan is based on medium level of confidence information.
The Next Steps
The actions resulting from this Asset Management Plan are:
• Prepare path network hierarchy in conjunction with Road hierarchy
• Look at partial renewal options • Clarify the recent changes to the Road Traffic Act
(& Regulations) that allow footpaths to be for
cycling and review the impact this has on path design.
• Transfer Bus Stops from that AMP into this AMP as they are essentially part of the path network.
• Engage with our community to understand service level expectation and the impact on the currently used path renewal trigger.
Questions you may have
What is this plan about? This Asset Management Plan covers the infrastructure assets that serve the City of Charles Sturt community’s path needs. These assets include footpaths and shared use paths throughout the community area that enable people to walk and cycle around their neighbourhood to other services such as schools and shops.
What is an Asset Management Plan? Asset Management Planning is a comprehensive process to ensure delivery of services from infrastructure is provided in a financially sustainable manner.
An Asset Management Plan details information about infrastructure assets including actions required to provide an agreed level of service in the most cost effective manner. The plan defines the services to be provided, how the services are provided and what funds are required to provide the services.
Why there can be funding shortfall? We inherit assets from developers, or have undertaken extensive construction programs in response to phases of rapid urban development, changes in community expectation and the availability of funds during peak of economic cycles, or by assessing government grants. In past decades, little thought was given to ongoing operations, periodic and annual maintenance, repairs and eventual renewal (replacement) needs.
As assets reach the end of their useful life, many show decreased service and function while requiring increased maintenance. This is reflected in an increased cost burden, which draws funds and effort away from the renewal activity.
When there is a funding shortfall, it means that funding levels are insufficient to continue to provide existing services at current levels in the medium to long term.
CITY OF CHARLES STURT – PATHS/ACCESS RAMPS ASSET MANAGEMENT PLAN 2016
- 11 -
What options do we have? Resolving the funding shortfall involves several steps:
1. Improving asset knowledge so that data accurately records the asset inventory, how assets are performing and when assets are not able to provide the required service levels,
2. Improving our efficiency in operating, maintaining, renewing and replacing existing assets to optimise life cycle costs,
3. Identifying and managing risks associated with providing services from infrastructure,
4. Making trade-offs between service levels and costs to ensure that the community receives the best return from infrastructure,
5. Identifying assets surplus to needs for disposal to make saving in future operations and maintenance costs,
6. Consulting with the community to ensure that path services and costs meet community needs and are affordable,
7. Developing partnership with other bodies such as state government and developers, where available to provide services,
8. Seeking additional funding from governments and other bodies to better reflect a ‘whole of government’ funding approach to infrastructure services.
What happens if we don’t manage a shortfall? For paths, the service level reduction may include rougher surfaces, patching and grinding trip points, lower standards of materials and ultimately, the removal of some paths from the footpath network.
What can we do? We can develop options, costs and priorities for future paths services, consult with the community to plan future services to match the community service needs with ability to pay for services and maximise community benefits against costs
What can you do? We will be pleased to consider your thoughts on the issues raised in this Asset Management Plan and suggestions on how the organisation may change or reduce its path mix of services to ensure that the appropriate level of service can be provided to the community within available funding.
This Asset Management Plan is prepared to demonstrate responsive management of assets (and services provided from assets), compliance with regulatory requirements, and to communicate funding needed to provide the required levels of service over a 20-year planning period.
The Asset Management Plan follows the format for Asset Management Plans recommended in Section 4.2.6 of the International Infrastructure Management Manual2.
The Asset Management Plan is to be read with the organisation’s Asset Management Policy, Asset Management Strategy and the following associated planning documents:
• City of Charles Sturt Community Plan 2013-2027 2017 – A city where people come first • City of Charles Sturt Corporate Plan 2013-2017 – A city where people come first • City of Charles Sturt Asset Accounting Policy • City of Charles Sturt Asset Fund Policy • City of Charles Sturt Environmental Sustainability Policy • City of Charles Sturt Living Green toward 2020 • City of Charles Sturt Engineering & Open Space Guidelines • City of Charles Sturt Strategy for Walking and Cycling.
2 IPWEA, 2011, Sec 4.2.6, ExAsset Management Planle of an Asset Management Plan Structure, pp 4|24 – 27.
CITY OF CHARLES STURT – PATHS/ACCESS RAMPS ASSET MANAGEMENT PLAN 2016
- 13 -
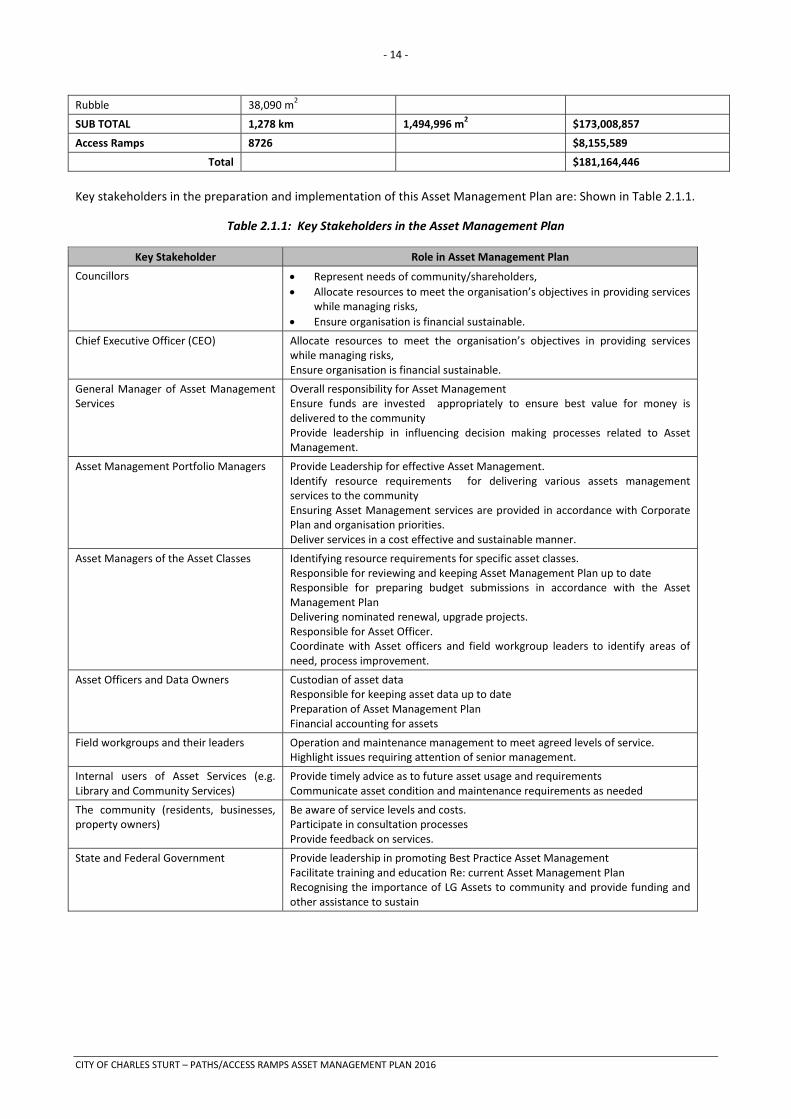
The infrastructure assets covered by this Asset Management Plan are shown in Table 2.1. These assets are used to provide transport and recreational services to its community.
Table 2.1: Assets covered by this Plan
Asset Category Dimension Replacement Value
Local Street Paths (Inc. Reserves)
Length (km) Area (m2)
Rubble 10.8 km 23,421 m2
Recycled Rubber 0.027 km 38 m2
Bitumen 40 km 85,998 m2
Clay Paver 17.5 km 29,725 m2
Concrete 617 km 812,123 m2
Concrete Paver 73.6 km 117,516 m2
Granite 0.58 km 3061 m2
Exposed Aggregate 0.47 km 750 m2
Unmade (Earth) 234 km
TOTAL 995 km 1,072,895 m2 $123,740,450
Collector Road Paths
Exposed Aggregate 0.689 km 1156 m2
Bitumen 0.071 km 129 m2
Clay Paver 0.715 km 986 m2
Concrete 62.4 km 81,062 m2
Concrete Paver 14.3 km 21,472 m2
Unmade (Earth) 7.2 km
TOTAL 85.6 km 104,807 m2 $12,298,253
Distributor Road Paths
Rubble 3.3 km 7,715 m2
Bitumen 0.8 km 1,843 m2
Clay Paver 3 km 6,095 m2
Concrete 37 km 52,734 m2
Concrete Paver 6.1 km 12,198 m2
Unmade (Earth) 3.1 km
TOTAL 53.4 km 80,586 m2 $9,300,052
Arterial Roads Paths
Rubble 2.77 km 6,953 m2
Bitumen 5.1 km 11,534 m2
Clay Paver 7.3 km 27,125 m2
Concrete 106 km 153,319 m2
Concrete Paver 17.2 km 37,267 m2
Exposed Aggregate 0.239 km 478 m2
Unmade (Earth) 5.2 km
TOTAL 144 km 236,706 m2 $27,670,102
NETWORK TOTALS
Concrete Path 1,099,240 m2
Concrete Paver 188,465 m2
Bitumen 99,503 m2
Clay Paver 63,959 m2
Exposed Aggregate 2,385 m2
Granite 3061 m2
CITY OF CHARLES STURT – PATHS/ACCESS RAMPS ASSET MANAGEMENT PLAN 2016
- 14 -
Key stakeholders in the preparation and implementation of this Asset Management Plan are: Shown in Table 2.1.1.
Table 2.1.1: Key Stakeholders in the Asset Management Plan
Key Stakeholder Role in Asset Management Plan
Councillors • Represent needs of community/shareholders, • Allocate resources to meet the organisation’s objectives in providing services
while managing risks, • Ensure organisation is financial sustainable.
Chief Executive Officer (CEO) Allocate resources to meet the organisation’s objectives in providing services while managing risks, Ensure organisation is financial sustainable.
General Manager of Asset Management Services
Overall responsibility for Asset Management Ensure funds are invested appropriately to ensure best value for money is delivered to the community Provide leadership in influencing decision making processes related to Asset Management.
Asset Management Portfolio Managers Provide Leadership for effective Asset Management. Identify resource requirements for delivering various assets management services to the community Ensuring Asset Management services are provided in accordance with Corporate Plan and organisation priorities. Deliver services in a cost effective and sustainable manner.
Asset Managers of the Asset Classes Identifying resource requirements for specific asset classes. Responsible for reviewing and keeping Asset Management Plan up to date Responsible for preparing budget submissions in accordance with the Asset Management Plan Delivering nominated renewal, upgrade projects. Responsible for Asset Officer. Coordinate with Asset officers and field workgroup leaders to identify areas of need, process improvement.
Asset Officers and Data Owners Custodian of asset data Responsible for keeping asset data up to date Preparation of Asset Management Plan Financial accounting for assets
Field workgroups and their leaders Operation and maintenance management to meet agreed levels of service. Highlight issues requiring attention of senior management.
Internal users of Asset Services (e.g. Library and Community Services)
Provide timely advice as to future asset usage and requirements Communicate asset condition and maintenance requirements as needed
The community (residents, businesses, property owners)
Be aware of service levels and costs. Participate in consultation processes Provide feedback on services.
State and Federal Government Provide leadership in promoting Best Practice Asset Management Facilitate training and education Re: current Asset Management Plan Recognising the importance of LG Assets to community and provide funding and other assistance to sustain
Rubble 38,090 m2
SUB TOTAL 1,278 km 1,494,996 m2 $173,008,857
Access Ramps 8726 $8,155,589
Total $181,164,446
CITY OF CHARLES STURT – PATHS/ACCESS RAMPS ASSET MANAGEMENT PLAN 2016
- 15 -
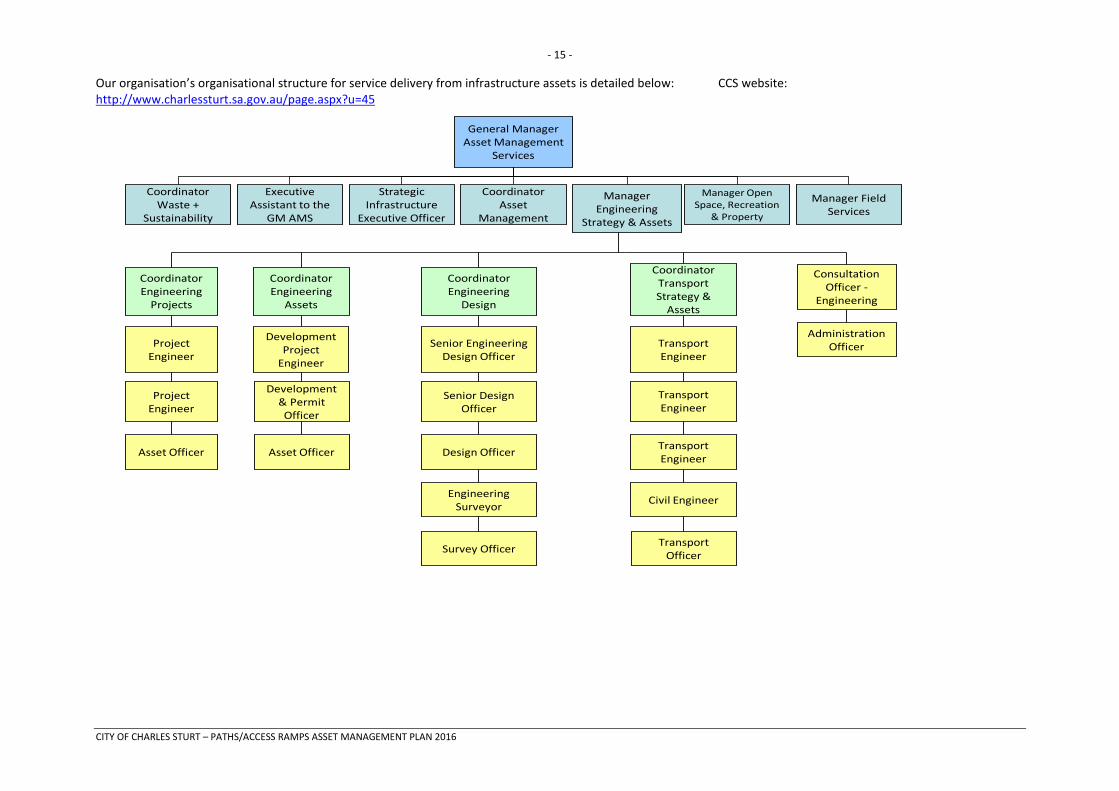
Our organisation’s organisational structure for service delivery from infrastructure assets is detailed below: CCS website: http://www.charlessturt.sa.gov.au/page.aspx?u=45
General Manager Asset Management
Services
Coordinator Waste +
Sustainability
Executive Assistant to the
GM AMS
Strategic Infrastructure
Executive Officer
Coordinator Asset
Management
Manager Open Space, Recreation
& Property
Manager Field Services
Manager Engineering
Strategy & Assets
Administration Officer
CoordinatorEngineering
Projects
Coordinator Engineering
Assets
Coordinator Engineering
Design
Coordinator Transport Strategy &
Assets
Consultation Officer -
Engineering
Development Project
Engineer
Development & Permit Officer
Asset Officer
Transport Engineer
Transport Engineer
Transport Engineer
Civil Engineer
Transport Officer
Project Engineer
Project Engineer
Asset Officer
Senior Engineering Design Officer
Senior Design Officer
Design Officer
Engineering Surveyor
Survey Officer
CITY OF CHARLES STURT – PATHS/ACCESS RAMPS ASSET MANAGEMENT PLAN 2016
The organisation exists to provide services to its community. Some of these services are provided by infrastructure assets. We have acquired infrastructure assets by ‘purchase’, by contract, construction by our staff and by donation of assets constructed by developers and others to meet increased levels of service.
Our goal in managing infrastructure assets is to meet the defined level of service (as amended from time to time) in the most cost effective manner for present and future consumers. The key elements of infrastructure asset management are:
• Providing a defined level of service and monitoring performance, • Managing the impact of growth through demand management and infrastructure investment, • Taking a lifecycle approach to developing cost-effective management strategies for the long-term that
meet the defined level of service, • Identifying, assessing and appropriately controlling risks, and • Having a long-term financial plan which identifies required, affordable expenditure and how it will be
financed.3 • Sustainability - “meeting the needs of the present without compromising the ability of future generation
to meet their own needs.” (World Commission on Environment and Development. (1987). Our Common Future. The Bruntland Commission, UNESCO)
2.3 Plan Framework
Key elements of the plan are
• Levels of service – specifies the services and levels of service to be provided by the organisation, • Future demand – how this will impact on future service delivery and how this is to be met, • Life cycle management – how we will manage our existing and future assets to provide defined levels of
service, • Financial summary – what funds are required to provide the defined services, • Asset management practices, • Monitoring – how the plan will be monitored to ensure it is meeting the organisation’s objectives, • Asset management improvement plan.
A road map for preparing an Asset Management Plan is shown below.
3 Based on IPWEA, 2011, IIMM, Sec 1.2 p 1|7.
CITY OF CHARLES STURT – PATHS/ACCESS RAMPS ASSET MANAGEMENT PLAN 2016
- 17 -
Road Map for preparing an Asset Management Plan Source: IPWEA, 2006, IIMM, Fig 1.5.1, p 1.11.
IS THE PLAN AFFORDABLE?
CORPORATE PLANNINGConfirm strategic objectives and establish AM policies, strategies & goals. Define responsibilities & ownership.Decide core or advanced AM Pan.Gain organisation commitment.
REVIEW/COLLATE ASSET INFORMATIONExisting information sourcesIdentify & describe assets.Data collectionCondition assessmentsPerformance monitoringValuation Data
IMPROVEMENT PLANAssess current/desired practicesDevelop improvement plan
ITERATIONReconsider service statementsOptions for fundingConsult with CouncilConsult with Community
DEFINE SCOPE & STRUCTURE OF PLAN
INFO
RM
ATI
ON
MA
NA
GE
ME
NT,
and
DA
TA IM
PR
OV
EM
EN
T
AM PLAN REVIEW AND
AUDIT
IMPLEMENT IMPROVEMENT
STRATEGY
ANNUAL PLAN / BUSINESS PLAN
INFO
RM
ATI
ON
MA
NA
GE
ME
NT,
and
DA
TA IM
PR
OV
EM
EN
T
CITY OF CHARLES STURT – PATHS/ACCESS RAMPS ASSET MANAGEMENT PLAN 2016
- 18 -
2.4 Core and Advanced Asset Management
This Asset Management Plan is prepared as a ‘core plus’ Asset Management Plan over a 20-year planning period in accordance with the International Infrastructure Management Manual4. It is prepared to meet minimum legislative and organisational requirements for sustainable service delivery and long term financial planning and reporting. Core asset management is a ‘top down’ approach where analysis is applied at the ‘system’ or ‘network’ level. The input information is more sophisticated than previous AMP’s and provides a range of options, such as intervention on better condition 3 paths and options to include work associated with external factors.
Future revisions of this Asset Management Plan will move towards ‘advanced’ asset management using a ‘bottom up’ approach for gathering asset information for individual assets to support the optimisation of activities and programs to meet agreed service levels. The City of Charles Sturt has recently implemented a centralised Asset Management Information System that includes consolidated asset registers and a works planning system. It is envisaged that this system will be a pivotal tool in the journey from core to advanced Asset Management Planning.
3. LEVELS OF SERVICE
3.1 Customer Research and Expectations
Harrison Research undertook a Customer Satisfaction survey for the Council in 2010. This survey polls a sample of residents on their level of satisfaction with Council’s services. The most recent customer satisfaction survey reported satisfaction levels for the following services.
Table 3.1: Community Satisfaction Survey Levels
Performance Measure Satisfaction Level
Very Satisfied
Fairly Satisfied
Satisfied Somewhat satisfied
Not satisfied
Footpaths are well maintained √
Cycle paths are well maintained √
This information was confirmed in 2012 and 2013 during consultation for the development of the Community Plan 2013 – 2027 and Corporate Plan and used in allocation of resources in subsequent budgets.
4 IPWEA, 2011, IIMM.
CITY OF CHARLES STURT – PATHS/ACCESS RAMPS ASSET MANAGEMENT PLAN 2016
- 19 -
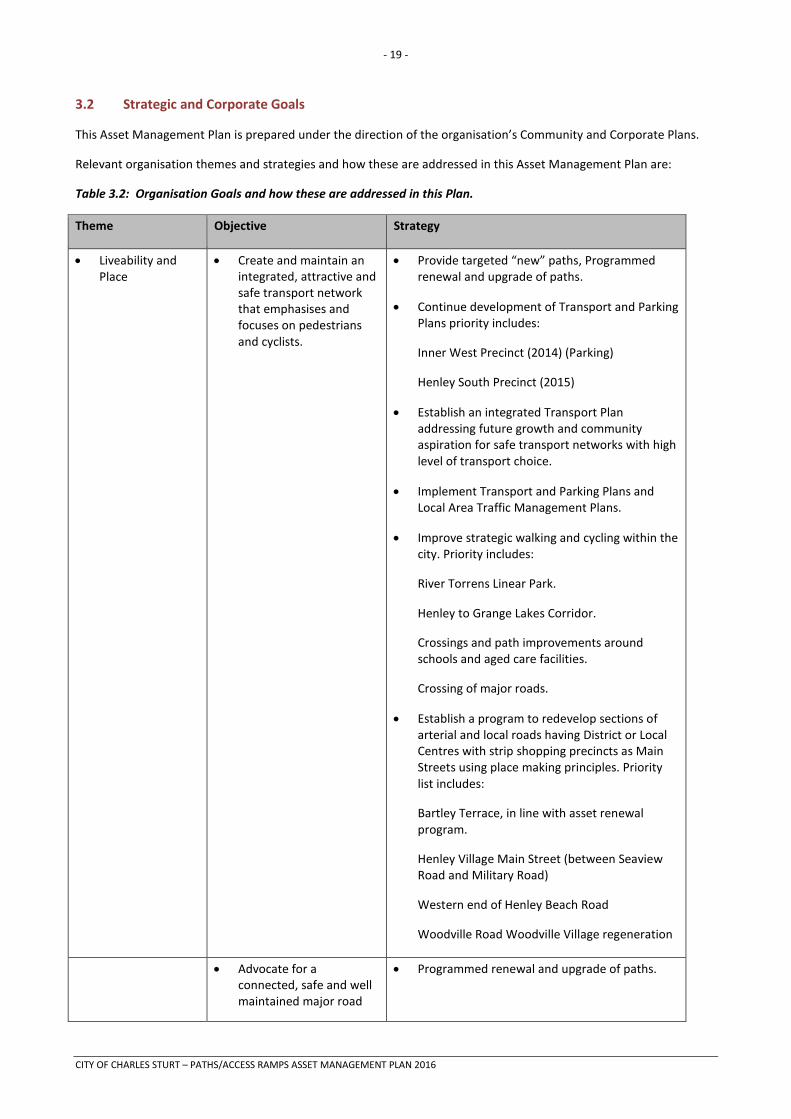
3.2 Strategic and Corporate Goals
This Asset Management Plan is prepared under the direction of the organisation’s Community and Corporate Plans.
Relevant organisation themes and strategies and how these are addressed in this Asset Management Plan are:
Table 3.2: Organisation Goals and how these are addressed in this Plan.
Theme Objective Strategy
• Liveability and Place
• Create and maintain an integrated, attractive and safe transport network that emphasises and focuses on pedestrians and cyclists.
• Provide targeted “new” paths, Programmed renewal and upgrade of paths.
• Continue development of Transport and Parking Plans priority includes:
Inner West Precinct (2014) (Parking)
Henley South Precinct (2015)
• Establish an integrated Transport Plan addressing future growth and community aspiration for safe transport networks with high level of transport choice.
• Implement Transport and Parking Plans and Local Area Traffic Management Plans.
• Improve strategic walking and cycling within the city. Priority includes:
River Torrens Linear Park.
Henley to Grange Lakes Corridor.
Crossings and path improvements around schools and aged care facilities.
Crossing of major roads.
• Establish a program to redevelop sections of arterial and local roads having District or Local Centres with strip shopping precincts as Main Streets using place making principles. Priority list includes:
Bartley Terrace, in line with asset renewal program.
Henley Village Main Street (between Seaview Road and Military Road)
Western end of Henley Beach Road
Woodville Road Woodville Village regeneration
• Advocate for a connected, safe and well maintained major road
• Programmed renewal and upgrade of paths.
CITY OF CHARLES STURT – PATHS/ACCESS RAMPS ASSET MANAGEMENT PLAN 2016
- 20 -
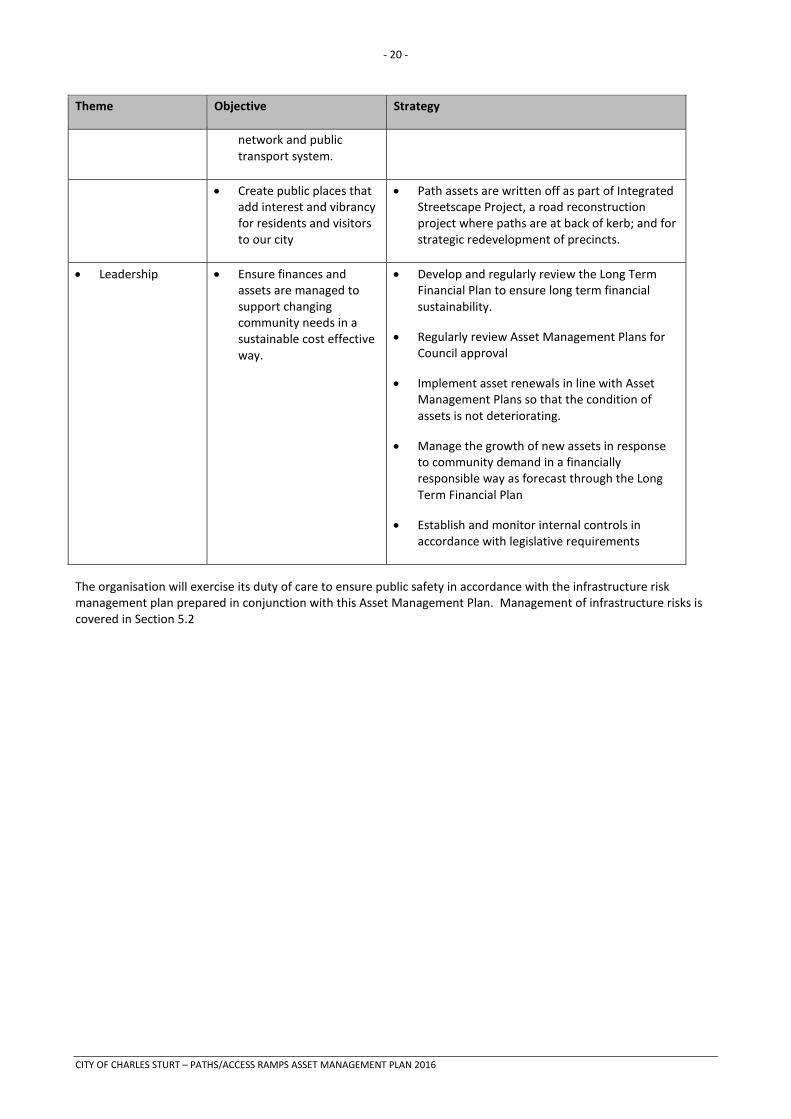
Theme Objective Strategy
network and public transport system.
• Create public places that add interest and vibrancy for residents and visitors to our city
• Path assets are written off as part of Integrated Streetscape Project, a road reconstruction project where paths are at back of kerb; and for strategic redevelopment of precincts.
• Leadership • Ensure finances and assets are managed to support changing community needs in a sustainable cost effective way.
• Develop and regularly review the Long Term Financial Plan to ensure long term financial sustainability.
• Regularly review Asset Management Plans for Council approval
• Implement asset renewals in line with Asset Management Plans so that the condition of assets is not deteriorating.
• Manage the growth of new assets in response to community demand in a financially responsible way as forecast through the Long Term Financial Plan
• Establish and monitor internal controls in accordance with legislative requirements
The organisation will exercise its duty of care to ensure public safety in accordance with the infrastructure risk management plan prepared in conjunction with this Asset Management Plan. Management of infrastructure risks is covered in Section 5.2
CITY OF CHARLES STURT – PATHS/ACCESS RAMPS ASSET MANAGEMENT PLAN 2016
- 21 -
3.3 Legislative Requirements
We have to meet many legislative requirements including Australian and State legislation and State regulations. These include:
Table 3.3: Legislative Requirements
Legislation Requirement
South Australian Local Government Act 1999
Sets out role, purpose, responsibilities and powers of local governments including the preparation of a long term financial plan supported by Asset Management Plans for sustainable service delivery.
South Australian State Records Act 1997
To ensure the City of Charles Sturt records and stores all relevant information as set out by the State Government of SA
Environment Protection Act 1993 To ensure that all reasonable and practicable measures are taken to protect, restore and enhance the quality of the environment having regard to the principles of ecologically sustainable development
Occupational Health, Safety and Welfare Act 1986
To take a constructive role in promoting improvements in occupational health, safety and welfare practices and assisting in the preservation of public health and safety in all undertakings of the organisation.
Development Act 1993 An act to provide for planning and regulate development in the state; to regulate the use and management of land and building and for other purposes
Public And Environmental Health Act 1987
An Act Dealing With Public And Environmental Health; To Repeal The Health Act 1935, The Noxious Trades Act 1934 And The Venereal Diseases Act 1947; And For Other Purposes.
Disability Discrimination Act 1992 Provides protection for everyone in Australia against discrimination based on disability. It encourages everyone to be involved in implementing the Act and to share in the overall benefits to the community and the economy that flow from participation by the widest range of people.
Australian Road Rules An act which gives road authorities in each state delegated power to establish standards for all aspects of roadways, including paths and shared use paths.
CITY OF CHARLES STURT – PATHS/ACCESS RAMPS ASSET MANAGEMENT PLAN 2016
- 22 -
3.4 Current Levels of Service
We have defined service levels in two terms.
Community Levels of Service measure how the community receives the service and whether the organisation is providing community value.
Community levels of service measures used in the Asset Management Plan are:
Quality How good is the service? Function Does it meet users’ needs? Capacity/Utilisation Is the service over or under used?
Technical Levels of Service - Supporting the community service levels are operational or technical measures of performance. These technical measures relate to the allocation of resources to service activities that the organisation undertakes to best achieve the desired community outcomes and demonstrate effective organisational performance.
Technical service measures are linked to annual budgets covering:
• Operations – the regular activities to provide services such as opening hours, cleansing frequency, mowing frequency, etc.
• Maintenance – the activities necessary to retain an asset as near as practicable to an appropriate service condition (e.g. road patching, unsealed road grading, building and structure repairs),
• Renewal – the activities that return the service capability of an asset up to that which it had originally (e.g. frequency and cost of road resurfacing and pavement reconstruction, pipeline replacement and building component replacement),
• Upgrade – the activities to provide an higher level of service (e.g. widening a road, sealing an unsealed road, replacing a pipeline with a larger size) or a new service that did not exist previously (e.g. a new library).
Asset managers plan, implement and control technical service levels to influence the customer service levels.5
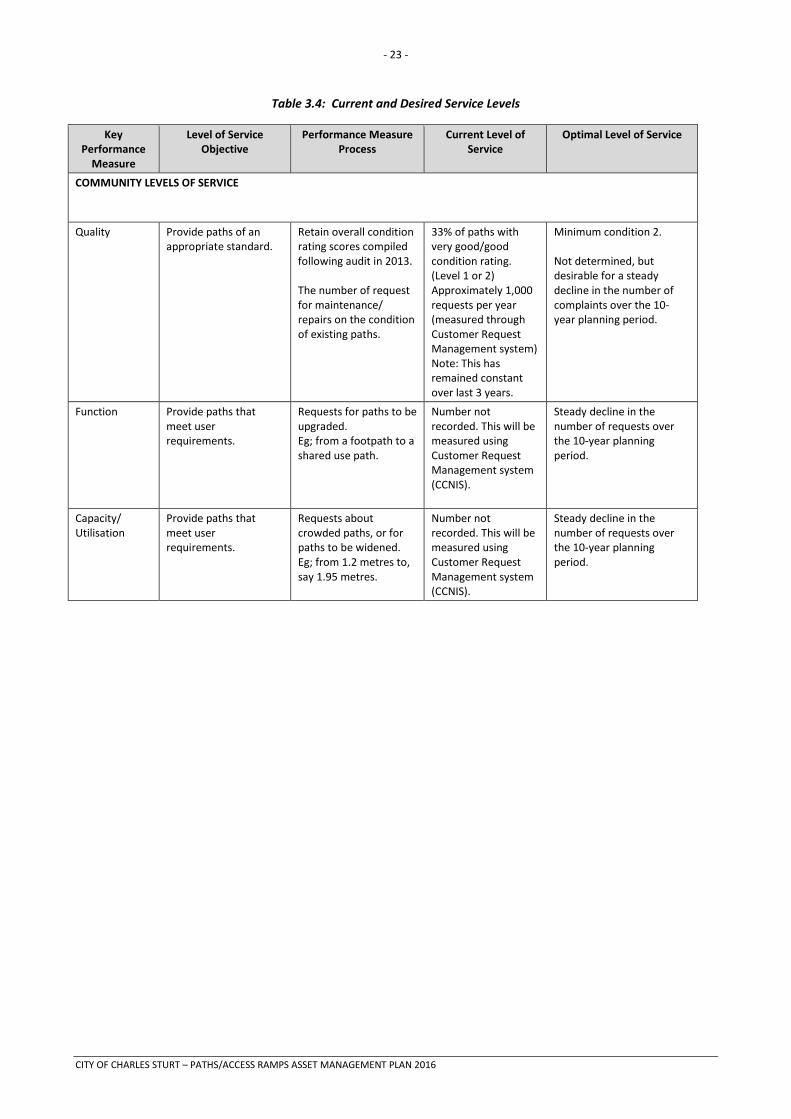
Our current service levels are detailed in Table 3.4.
5 IPWEA, 2011, IIMM, p 2.22
CITY OF CHARLES STURT – PATHS/ACCESS RAMPS ASSET MANAGEMENT PLAN 2016
- 23 -
Table 3.4: Current and Desired Service Levels
Key Performance
Measure
Level of Service Objective
Performance Measure Process
Current Level of Service
Optimal Level of Service
COMMUNITY LEVELS OF SERVICE
Quality Provide paths of an appropriate standard.
Retain overall condition rating scores compiled following audit in 2013. The number of request for maintenance/ repairs on the condition of existing paths.
33% of paths with very good/good condition rating. (Level 1 or 2) Approximately 1,000 requests per year (measured through Customer Request Management system) Note: This has remained constant over last 3 years.
Minimum condition 2. Not determined, but desirable for a steady decline in the number of complaints over the 10-year planning period.
Function Provide paths that meet user requirements.
Requests for paths to be upgraded. Eg; from a footpath to a shared use path.
Number not recorded. This will be measured using Customer Request Management system (CCNIS).
Steady decline in the number of requests over the 10-year planning period.
Capacity/ Utilisation
Provide paths that meet user requirements.
Requests about crowded paths, or for paths to be widened. Eg; from 1.2 metres to, say 1.95 metres.
Number not recorded. This will be measured using Customer Request Management system (CCNIS).
Steady decline in the number of requests over the 10-year planning period.
CITY OF CHARLES STURT – PATHS/ACCESS RAMPS ASSET MANAGEMENT PLAN 2016
- 24 -
Key Performance Measure
Level of Service Objective
Performance Measure Process
Current Level of Service
Optimal Level of Service
TECHNICAL LEVELS OF SERVICE
Operations To ensure services provided are best value for money.
Number of requests for maintenance on path condition and hazards.
Predominantly adhoc based on Customer Management system or referral from Elected Members.
Paths managed taking all asset data and customer requests into account, with priority based on condition rating in the Asset Register.
Budget (See Notes 1 & 2 below)
$37,000 ($158,000)
Maintenance Ensure that the path assets are well maintained.
The number of square metres of failed path replaced each year under large area maintenance programs. The average unit rate cost.
Undertake large area maintenance of paths that have vertical displacement > 20mm or failed slabs > 30% by area, or areas of cracking. Note: current waiting time is approximately 18 months. Note: current unit rate costs have been established by review of actual costs achieved in recent years. There has been a reduction in costs which has reduced the assets total value
Undertake large area maintenance of paths that have vertical displacement > 20mm or failed slabs > 30% by area, or areas of cracking, in a time frame that meets community expectation. Note: Work is required to determine what community see as an acceptable waiting time before repair. Note: current unit rate costs have been established by review of actual costs achieved in recent years. There has been a reduction in costs which has reduced the assets total value
Budget (See Notes 1 & 3 below)
$248,000 ($1,272,000)
Renewal Maintain a safe network of connected walking and cycling routes.
The number of square metres path replaced each year through path renewal capital projects. The average unit rate cost.
Condition 5 paths are replaced using customer requests to assist with priority selection on an annual basis.
Step 1: All condition 5 paths are removed from the network. Step 2: All condition 4 paths are removed from the network.
Budget (See Notes 1 & 4 below)
$4,840,000 ($490,000)
CITY OF CHARLES STURT – PATHS/ACCESS RAMPS ASSET MANAGEMENT PLAN 2016
- 25 -
Key Performance Measure
Level of Service Objective
Performance Measure Process
Current Level of Service
Optimal Level of Service
Upgrade/New Develop a safe network of well-connected walking and cycling routes. Legislative requirement for Disability Discrimination Act access.
The number of square metres path replaced each year through path upgrade/new capital projects. Note: This excludes inherited path assets. The average unit rate cost.
Predominantly adhoc based on CRM or referral from elected members.
All walking and cycling desire routes are paved with a path meeting current Australian Standards and compliant with relevant legislative requirements.
Budget (See Notes 1 & 5 below)
$436,000 ($721,000)
Total Budgets (See Notes 1 & 6 below)
$5,561,000 ($2,641,000)
Notes: Explanation of Financials in Levels of Service
In 2015/16 there are forecast to be, 1. Current forecast are in BOLD with the 2012 Asset Management Plan forecast expenditure in (brackets). 2. In 2012 we allocated $158,000 for operations. During the year we have investigated the expenditure and
found that we have management costs of $37,000 and we are proposing condition audits of part of network (on a 6 year basis) for $25,000 (commencing 2015/16) This will appear in future revisions of the Asset Management Plan as $62,000. The operational Total is $37,000.
3. In 2012 we allocated $1,272,000 for Maintenance. During the year we have investigated this expenditure and found we spend $194,570 on reactive maintenance (responding to customer requests by removing trip hazards) and $53,780 on sweeping paths. This totals $278,000.
4. In 2012 we allocated $490,000 for Renewals and $721,000 for up-grades being a total of $1,211,000. There has been a change in definition for upgrade which has effectively redefined them as renewal works. The Condition Audit also found substantial reduction in condition of the Path asset accelerating the need for an increase in Renewals. The Renewals is now made up of:- Path Renewal $3,000,000 Capitalised Project Manager $75,000 Large Area Slab Renewal $897,000 Large Area Paver Renewal $418,000 Kerb Ramp Renewal $450,000 Total Renewal is $4,840,000 (which is included in proposed revised LTFP of 2014)
5. In 2012 this amount included upgrades. The redefinition has moved these to Renewals. The amount allocated for New Paths is consistent with historical expenditure. The New Path total is $436,000.
6. The overall forecast expenditure on Paths Assets has risen from $3,884,777 (2014) to $4,883,112 (2015)
3.5 Desired Levels of Service
At present, indications of desired levels of service are obtained from various sources including residents’ feedback to Councillors and staff, service requests and correspondence. We have yet to fully quantify desired levels of service. This will be done in future revisions of this Asset Management Plan.
CITY OF CHARLES STURT – PATHS/ACCESS RAMPS ASSET MANAGEMENT PLAN 2016
- 26 -
4. FUTURE DEMAND
4.1 Demand Drivers
Drivers affecting demand include population change, changes in demographics, seasonal factors, vehicle ownership rates, consumer preferences and expectations, technological changes, economic factors, agricultural practices, environmental awareness, etc.
4.2 Demand Forecast
The present position and projections for demand drivers that may impact future service delivery and utilisation of assets were identified and are documented in Table 4.3.
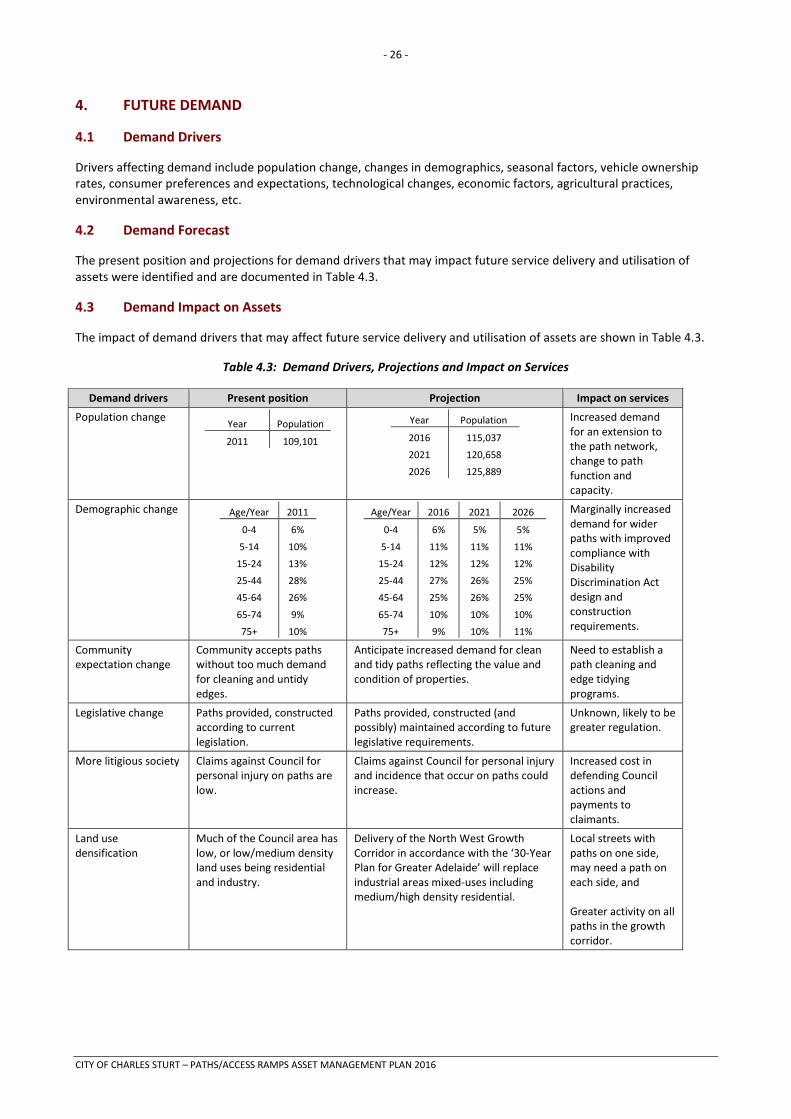
4.3 Demand Impact on Assets
The impact of demand drivers that may affect future service delivery and utilisation of assets are shown in Table 4.3.
Table 4.3: Demand Drivers, Projections and Impact on Services
Demand drivers Present position Projection Impact on services
Population change Year Population
2011 109,101
Year Population
2016 115,037
2021 120,658
2026 125,889
Increased demand for an extension to the path network, change to path function and capacity.
Demographic change Age/Year 2011
0-4 6%
5-14 10%
15-24 13%
25-44 28%
45-64 26%
65-74 9%
75+ 10%
Age/Year 2016 2021 2026
0-4 6% 5% 5%
5-14 11% 11% 11%
15-24 12% 12% 12%
25-44 27% 26% 25%
45-64 25% 26% 25%
65-74 10% 10% 10%
75+ 9% 10% 11%
Marginally increased demand for wider paths with improved compliance with Disability Discrimination Act design and construction requirements.
Community expectation change
Community accepts paths without too much demand for cleaning and untidy edges.
Anticipate increased demand for clean and tidy paths reflecting the value and condition of properties.
Need to establish a path cleaning and edge tidying programs.
Legislative change Paths provided, constructed according to current legislation.
Paths provided, constructed (and possibly) maintained according to future legislative requirements.
Unknown, likely to be greater regulation.
More litigious society Claims against Council for personal injury on paths are low.
Claims against Council for personal injury and incidence that occur on paths could increase.
Increased cost in defending Council actions and payments to claimants.
Land use densification
Much of the Council area has low, or low/medium density land uses being residential and industry.
Delivery of the North West Growth Corridor in accordance with the ‘30-Year Plan for Greater Adelaide’ will replace industrial areas mixed-uses including medium/high density residential.
Local streets with paths on one side, may need a path on each side, and Greater activity on all paths in the growth corridor.
CITY OF CHARLES STURT – PATHS/ACCESS RAMPS ASSET MANAGEMENT PLAN 2016
- 27 -
Demand drivers Present position Projection Impact on services
Urban consolidation Much of the Council area has low, or low/medium density residential land uses with older housing stock not suited to current expectations.
Increasing demolition of houses and subdivision into 2-3 allotments, most applicable outside the growth corridor.
Installation of utility services under paths causing loss of integrity of path structure, damage, poor reinstatement, or not reinstated.
Telecommunication advances
Properties serviced primarily by the Telstra network with some other minor companies.
Installation of National Broadband Network.
Installation under paths causing loss of integrity of path structure, damage, poor reinstatement, or not reinstated.
Transport changes Very high use of motor vehicles for most trips.
High cost motor vehicle trips substituted with active alternatives, especially for local trips and the journey.
Increased demand for an extension to the path network, change to path function and capacity.
Lifestyle changes Community just becoming aware of health benefits of physical activity such as walking and cycling starting to undertake more of these activities.
Increasing recreational walking and cycling and public life activities on the path network.
Change in path function and capacity, and Increased demand for responsive maintenance, repairs and establishing cleaning and tidying services.
Council financial sustainability
Council Long Term Financial Plan has been able to meet the required budgets to deliver most components to manage the path assets.
Limited revenue growth in Council rates and reduced size of grants from other tiers of government not matching required asset expenditures.
Decreased ability to fund timely renewal and upgrade of poor/very poor condition asset, and Increased need for maintenance and repairs.
Council operational & services priority changes
Local government is inheriting services from State and Federal governments, and taking up new operations and services in response to community demand.
This trend is likely to accelerate, but there is limited revenue growth to fund them placing pressure on all operations and services including asset provision and maintenance.
Decreased ability to fund timely renewal and upgrade of poor/very poor condition asset, and Increased need for maintenance and repairs.
Ageing workforce CCS employs approximately 168 field staff with a median age of 47 years.
Many of these staff and their skills will be lost. Increased shortage of skilled people to replace them.
Inefficient operations and services decreasing responsiveness, and Increasing risk of poor workmanship requiring return visits.
CITY OF CHARLES STURT – PATHS/ACCESS RAMPS ASSET MANAGEMENT PLAN 2016
- 28 -
Demand drivers Present position Projection Impact on services
Environmental sustainability
Paths are constructed to withstand existing environmental conditions.
More frequent extreme weather events and increased exposure to radiation effects.
More rapid deterioration of paths, increasing frequency of inspections and maintenance and repairs.
4.4 Demand Management Plan
Demand for new services will be managed through a combination of managing existing assets, upgrading of existing assets and providing new assets to meet demand and demand management. Demand management practices include non-asset solutions, insuring against risks and managing failures.
Non-asset solutions focus on providing the required service without the need for the organisation to own the assets and management actions including reducing demand for the service, reducing the level of service (allowing some assets to deteriorate beyond current service levels) or educating customers to accept appropriate asset failures6. Examples of non-asset solutions include providing services from existing infrastructure such as aquatic centres and libraries that may be in another community area or public toilets provided in commercial premises.
Opportunities identified to date for demand management are shown in Table 4.4. Further opportunities will be developed in future revisions of this Asset Management Plan.
Table 4.4: Demand Management Plan Summary
Demand Driver Impact on Services Demand Management Plan
Population change Increased demand for an extension to the path network, change to path function and capacity.
All redevelopment sites required to renew paths with upgraded paths suitable for the proposed function and capacity. Review current development and transport documents for impacts on walking and cycling through a ‘Walking & Cycling Strategy”.
Demographic change Increased width of paths and better compliance with Disability Discrimination Act design and construction requirements.
Increase basic widths of paths to suit two people with walking aids, or other mobility devices, so they can move along a path together. Improve controls and monitoring of building activities and associated driveway crossovers to ensure Disability Discrimination Act compliance in the walking/cycling area.
Community expectation change
Need to establish a path cleaning and edge tidying programs.
Investigate what needs to be done and how these additional services can be resourced. Encourage the community to take responsibility for verge area outside their properties.
Legislative change Unknown, likely to be greater regulation.
Be aware of any proposed changes to legislation, or introduction of new legislation that may impact on paths, and advocate for reasonableness of intent and impact.
More litigious society Increased cost in defending Council actions and payments to claimants.
Improve work recording and retrieval systems. Improve the responsiveness and timelines of maintenance and repair activities.
6 IPWEA, 2011, IIMM, Table 3.4.1, p 3|58.
CITY OF CHARLES STURT – PATHS/ACCESS RAMPS ASSET MANAGEMENT PLAN 2016
- 29 -
Demand Driver Impact on Services Demand Management Plan
Land use densification Local streets with paths on one side, may need a path on each side, and Greater activity on all paths in the growth corridor.
All redevelopment sites required to renew paths with upgraded paths suitable for the proposed function and capacity. Review development transport strategies for clear understanding of walking and cycling needs associated with the level of density and how they integrate with the surrounding areas.
Urban consolidation Installation of utility services under paths causing loss of integrity of path structure, damage, poor reinstatement, or not reinstated.
Seek Council endorsements of the ‘North west Growth Corridor transport Study” and further development the recommendations therein. For areas outside the Growth Corridors, monitor the level of urban consolidation for triggers to upgrade existing paths, or construct new paths. Seek Memorandum of Understanding dealing with operational and communication procedures and works specifications with the service providers.
Telecommunication advances
Installation under paths causing loss of integrity of path structure, damage, poor reinstatement, or not reinstated.
Monitor activities and follow up any poor workmanship, including re-inspection within 12 months. Seek Memorandum of Understanding dealing with operational and communication procedures and works specifications with the service providers.
Transport changes Increased demand for an extension to the path network, change to path function and capacity.
Raise the priority of path renewal, or upgrade on the walking & cycling routes used by commuters. Where there are walking routes between public transport stops, install new paths linking the stops. Both these actions will require guidance through a ‘Walking & Cycling Strategy’.
Lifestyle changes Change in path function and capacity, and Increased demand for responsive maintenance, repairs and establishing cleaning and tidying services.
Raise the priority of path renewal, or upgrade on the walking and cycling routes used by commuter. This action will require guidance through a ‘Walking & Cycling Strategy’. Investigate what needs to be done and how these additional services can be resourced.
Council financial sustainability
Decreased ability to fund timely renewal and upgrade of poor/very poor condition asset, and Increased need for maintenance and repairs.
Advocate the importance of the path network to community wellbeing, personal health and prosperity.
Council operational & services priority changes
Decreased ability to fund timely renewal and upgrade of poor/very poor condition asset, and Increased need for maintenance and repairs.
Advocate the importance of the path network to community wellbeing, personal health and prosperity.
CITY OF CHARLES STURT – PATHS/ACCESS RAMPS ASSET MANAGEMENT PLAN 2016
- 30 -
Demand Driver Impact on Services Demand Management Plan
Ageing workforce Inefficient operations and services decreasing responsiveness, and Increasing risk of poor workmanship requiring return visits.
Ensure that the Council works area is known for its ‘Constructive’ behavioural culture so we are a workplace of choice. Identify ways to improve employee training.
Environmental sustainability
More rapid deterioration of paths, increasing frequency of inspections and maintenance and repairs.
Establish an ‘Environmental Framework’ for material selection and work practices.
Since the Path Asset Management Plan 2012 we have investigated many of the new development precincts to better understand what drivers these area will have on path demand.
We have also undertaken the North-West Corridor Transport Study and three Transport and Parking Plans (TPP’s) in Woodville South, Welland and Henley Beach areas to determine what additional demands are there from existing residents.
We are currently preparing a Walking and Cycling Strategy as the first part of a new Integrated Transport Plan for the City.
4.5 Asset Programs to meet Demand
The new assets required to meet growth will be acquired free of cost from land developments and constructed/acquired by the organisation. New assets constructed/acquired by the organisation are discussed in Section 5.5. The cumulative projected value of new contributed and constructed asset values are summarised in Figure 1.
Figure 1: Upgrade and New Assets to meet Demand
Acquiring these new assets will commit the organisation to fund ongoing operations, maintenance and renewal costs for the period that the service provided from the assets is required. These future costs are identified and considered in developing forecasts of future operations, maintenance and renewal costs in Section 5.
The above graph is cumulative total of assets built by council at a constant rate of $200,000 per annum and 0.2% per annum growth by developers.
CITY OF CHARLES STURT – PATHS/ACCESS RAMPS ASSET MANAGEMENT PLAN 2016
- 31 -
5. LIFECYCLE MANAGEMENT PLAN
The lifecycle management plan details how the organisation plans to manage and operate the assets at the agreed levels of service (defined in Section 3) while optimising life cycle costs.
5.1 Background Data
5.1.1 Physical parameters
The total length of assets covered by this Asset Management Plan are shown in Table 2.1. Below indicates area in square metres. This is the basis of valuation of these assets (area x unit rate)
Asphalt Paths 90,053 m2
Concrete Paths 1,097,754 m2
Clay Paver Paths 56,612 m2
Concrete Paver Paths 184,263 m2
Other Paths (e.g. rubble) 32,652 m2
NOTE: Approximately 12 km of footpath in the Path Asset Management Plan 2012 was verge area where there are walking ‘desire’ lines. These were included as having a value in that revision of the Asset Management Plan, but are now excluded as having no value. This has contributed to the lower valuation.
These paths have been constructed over many years with a very large number of mainly concrete paths being built in the residential “boom” years that occurred in this Council area, from the mid 1960’s to mid 1970’s.
The age profile of the assets included in this Asset Management Plan is shown in Figure 2. (Note the works program generated by this Asset Management Plan is based on condition rating not age).
The spike shown in 1980 on Figure 2 is due to on the construction of West Lakes area and the River Torrens Linear Park .
The spike in 1990/ 91 on Figure 2 is due to on construction of major arterial road paths..
Figure 2: Asset Age Profile
CITY OF CHARLES STURT – PATHS/ACCESS RAMPS ASSET MANAGEMENT PLAN 2016
- 32 -
The current predictions for renewals are based on the 2013 audit of path assets and not age related. The above graph illustrates that renewals in the coming 10-years are expected to peak and then reduce in the years beyond the scope of this current Asset Management Plan.
Plans showing the path assets are available through council’s Dekho system.
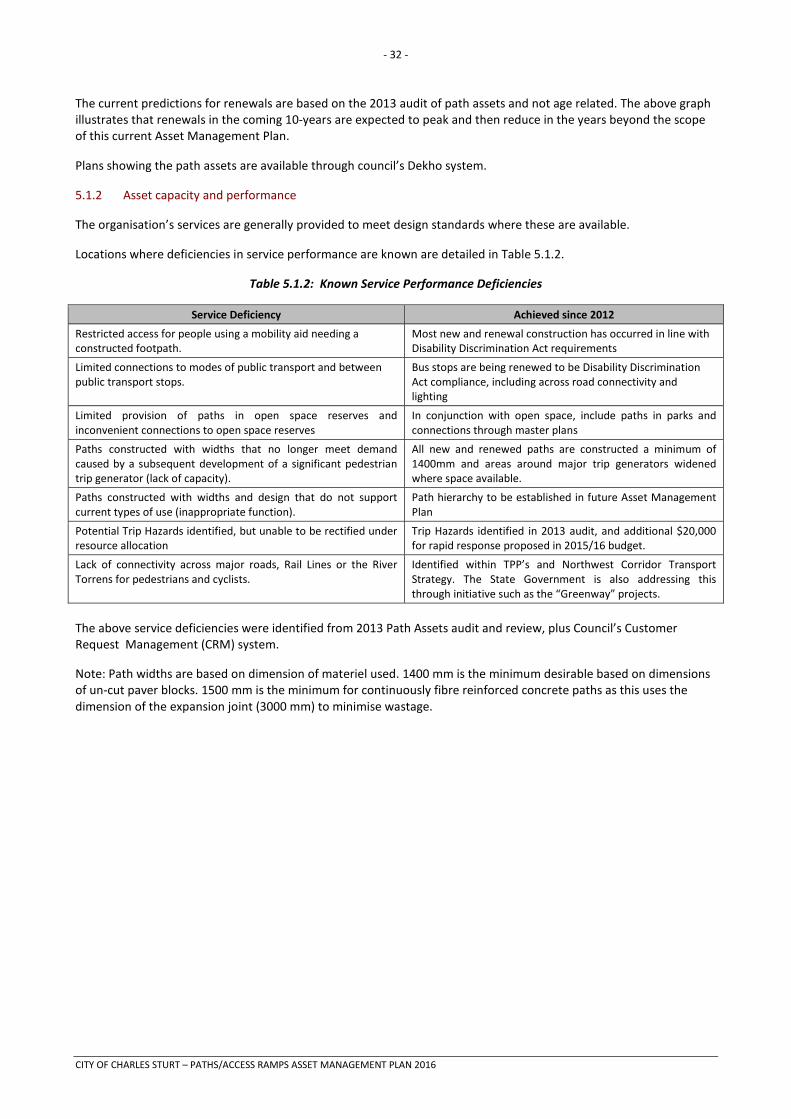
5.1.2 Asset capacity and performance
The organisation’s services are generally provided to meet design standards where these are available.
Locations where deficiencies in service performance are known are detailed in Table 5.1.2.
Table 5.1.2: Known Service Performance Deficiencies
Service Deficiency Achieved since 2012
Restricted access for people using a mobility aid needing a constructed footpath.
Most new and renewal construction has occurred in line with Disability Discrimination Act requirements
Limited connections to modes of public transport and between public transport stops.
Bus stops are being renewed to be Disability Discrimination Act compliance, including across road connectivity and lighting
Limited provision of paths in open space reserves and inconvenient connections to open space reserves
In conjunction with open space, include paths in parks and connections through master plans
Paths constructed with widths that no longer meet demand caused by a subsequent development of a significant pedestrian trip generator (lack of capacity).
All new and renewed paths are constructed a minimum of 1400mm and areas around major trip generators widened where space available.
Paths constructed with widths and design that do not support current types of use (inappropriate function).
Path hierarchy to be established in future Asset Management Plan
Potential Trip Hazards identified, but unable to be rectified under resource allocation
Trip Hazards identified in 2013 audit, and additional $20,000 for rapid response proposed in 2015/16 budget.
Lack of connectivity across major roads, Rail Lines or the River Torrens for pedestrians and cyclists.
Identified within TPP’s and Northwest Corridor Transport Strategy. The State Government is also addressing this through initiative such as the “Greenway” projects.
The above service deficiencies were identified from 2013 Path Assets audit and review, plus Council’s Customer Request Management (CRM) system.
Note: Path widths are based on dimension of materiel used. 1400 mm is the minimum desirable based on dimensions of un-cut paver blocks. 1500 mm is the minimum for continuously fibre reinforced concrete paths as this uses the dimension of the expansion joint (3000 mm) to minimise wastage.
CITY OF CHARLES STURT – PATHS/ACCESS RAMPS ASSET MANAGEMENT PLAN 2016
- 33 -
5.1.3 Asset condition
Condition is monitored on a 5-year basis, supplemented by inspection by staff in the field. As shown in the Pie Chart in Section 1, Path condition has deteriorated in past 5-years, due to underfunded renewal program .
The condition profile of our assets is shown in Figure 3.
Fig 3: Asset Condition Profile
Table 5.1.3: Simple Condition Grading Model
Condition Grading Description of Condition
1 Very Good: only planned maintenance required
2 Good: minor maintenance required plus planned maintenance
3 Fair: significant maintenance required
4 Poor: significant sections of renewal/rehabilitation required
5 Very Poor: physically unsound and/ beyond rehabilitation
3%
60%
37%
Poor
Fair
Good
Path condition as at August 2015
CITY OF CHARLES STURT – PATHS/ACCESS RAMPS ASSET MANAGEMENT PLAN 2016
- 34 -
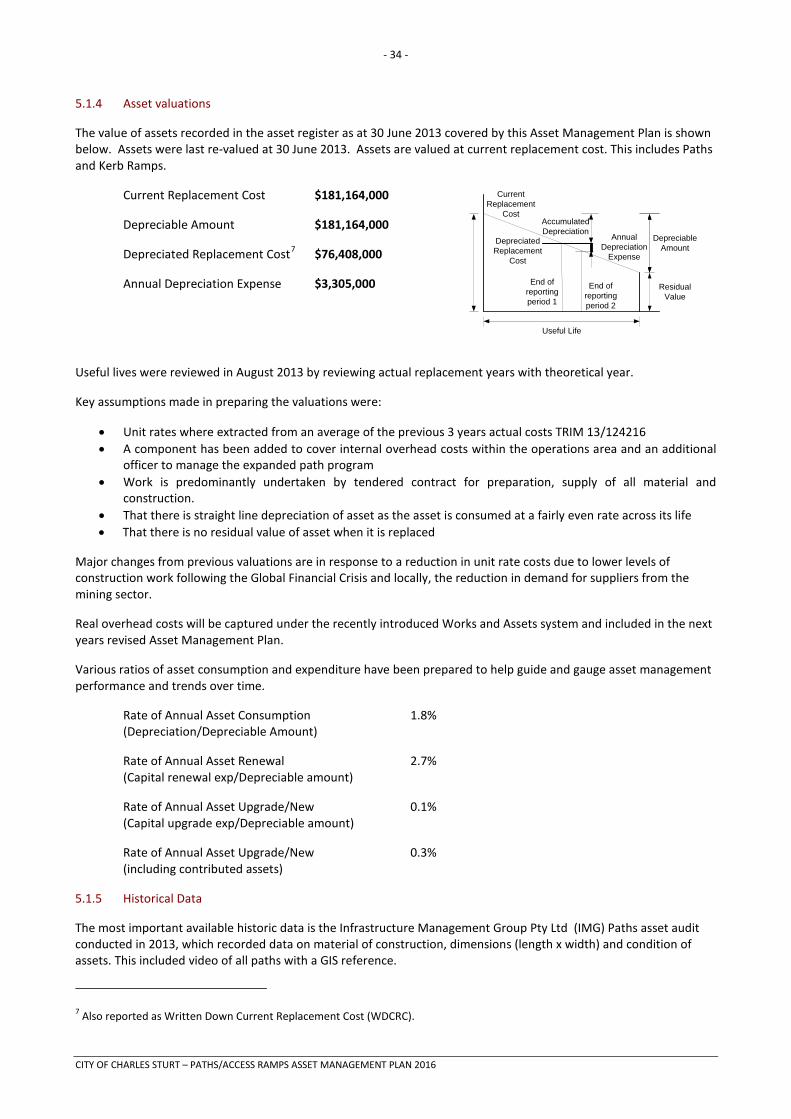
5.1.4 Asset valuations
The value of assets recorded in the asset register as at 30 June 2013 covered by this Asset Management Plan is shown below. Assets were last re-valued at 30 June 2013. Assets are valued at current replacement cost. This includes Paths and Kerb Ramps.
Current Replacement Cost $181,164,000
Depreciable Amount $181,164,000
Depreciated Replacement Cost7 $76,408,000
Annual Depreciation Expense $3,305,000
Useful lives were reviewed in August 2013 by reviewing actual replacement years with theoretical year.
Key assumptions made in preparing the valuations were:
• Unit rates where extracted from an average of the previous 3 years actual costs TRIM 13/124216 • A component has been added to cover internal overhead costs within the operations area and an additional
officer to manage the expanded path program • Work is predominantly undertaken by tendered contract for preparation, supply of all material and
construction. • That there is straight line depreciation of asset as the asset is consumed at a fairly even rate across its life • That there is no residual value of asset when it is replaced
Major changes from previous valuations are in response to a reduction in unit rate costs due to lower levels of construction work following the Global Financial Crisis and locally, the reduction in demand for suppliers from the mining sector.
Real overhead costs will be captured under the recently introduced Works and Assets system and included in the next years revised Asset Management Plan.
Various ratios of asset consumption and expenditure have been prepared to help guide and gauge asset management performance and trends over time.
Rate of Annual Asset Consumption 1.8% (Depreciation/Depreciable Amount)
Rate of Annual Asset Renewal 2.7% (Capital renewal exp/Depreciable amount)
Rate of Annual Asset Upgrade/New 0.1% (Capital upgrade exp/Depreciable amount)
Rate of Annual Asset Upgrade/New 0.3% (including contributed assets)
5.1.5 Historical Data
The most important available historic data is the Infrastructure Management Group Pty Ltd (IMG) Paths asset audit conducted in 2013, which recorded data on material of construction, dimensions (length x width) and condition of assets. This included video of all paths with a GIS reference.
7 Also reported as Written Down Current Replacement Cost (WDCRC).
Residual Value
Depreciable Amount
Useful Life
Current Replacement
Cost
End of reporting period 1
Annual Depreciation
Expense
End of reporting period 2
Accumulated Depreciation
Depreciated Replacement
Cost
CITY OF CHARLES STURT – PATHS/ACCESS RAMPS ASSET MANAGEMENT PLAN 2016
- 35 -
Infrastructure Management Group Pty Ltd Since 1996 supplied asset assessment services to over 150 councils, many state road authorities and numerous international governments .Other reference material included financial data of 3 previous year’s works programs from which unit rates have been derived.
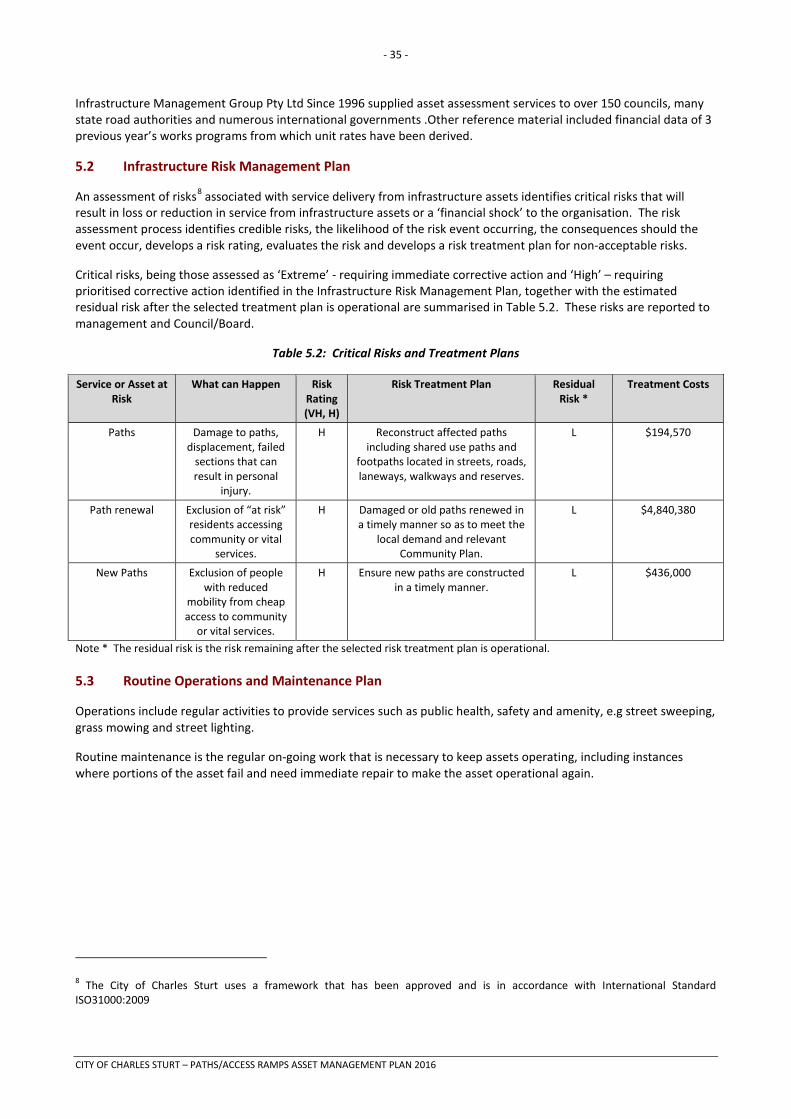
5.2 Infrastructure Risk Management Plan
An assessment of risks8 associated with service delivery from infrastructure assets identifies critical risks that will result in loss or reduction in service from infrastructure assets or a ‘financial shock’ to the organisation. The risk assessment process identifies credible risks, the likelihood of the risk event occurring, the consequences should the event occur, develops a risk rating, evaluates the risk and develops a risk treatment plan for non-acceptable risks.
Critical risks, being those assessed as ‘Extreme’ - requiring immediate corrective action and ‘High’ – requiring prioritised corrective action identified in the Infrastructure Risk Management Plan, together with the estimated residual risk after the selected treatment plan is operational are summarised in Table 5.2. These risks are reported to management and Council/Board.
Table 5.2: Critical Risks and Treatment Plans
Service or Asset at Risk
What can Happen Risk Rating (VH, H)
Risk Treatment Plan Residual Risk *
Treatment Costs
Paths Damage to paths, displacement, failed
sections that can result in personal
injury.
H Reconstruct affected paths including shared use paths and
footpaths located in streets, roads, laneways, walkways and reserves.
L $194,570
Path renewal Exclusion of “at risk” residents accessing community or vital
services.
H Damaged or old paths renewed in a timely manner so as to meet the
local demand and relevant Community Plan.
L $4,840,380
New Paths Exclusion of people with reduced
mobility from cheap access to community
or vital services.
H Ensure new paths are constructed in a timely manner.
L $436,000
Note * The residual risk is the risk remaining after the selected risk treatment plan is operational. 5.3 Routine Operations and Maintenance Plan
Operations include regular activities to provide services such as public health, safety and amenity, e.g street sweeping, grass mowing and street lighting.
Routine maintenance is the regular on-going work that is necessary to keep assets operating, including instances where portions of the asset fail and need immediate repair to make the asset operational again.
8 The City of Charles Sturt uses a framework that has been approved and is in accordance with International Standard ISO31000:2009
CITY OF CHARLES STURT – PATHS/ACCESS RAMPS ASSET MANAGEMENT PLAN 2016
- 36 -
5.3.1 Operations and Maintenance Plan
Operations activities affect service levels including quality and function through street sweeping and grass mowing frequency, intensity and spacing of street lights and cleaning frequency and opening hours of building and other facilities.
Maintenance includes all actions necessary for retaining an asset as near as practicable to an appropriate service condition including regular ongoing day-to-day work necessary to keep assets operating, e.g road patching but excluding rehabilitation or renewal. Maintenance may be classifies into reactive, planned and specific maintenance work activities.
Reactive maintenance is unplanned repair work carried out in response to service requests and management/supervisory directions.
Planned maintenance is repair work that is identified and managed through a maintenance management system (MMS). MMS activities include inspection, assessing the condition against failure/breakdown experience, prioritising, scheduling, actioning the work and reporting what was done to develop a maintenance history and improve maintenance and service delivery performance.
Specific maintenance is replacement of higher value components/sub-components of assets that is undertaken on a regular cycle including repainting, replacing air conditioning units, etc. This work falls below the capital/maintenance threshold but may require a specific budget allocation.
Actual past maintenance expenditure is shown in Table 5.3.1.
Table 5.3.1: Maintenance Expenditure Trends
Year Maintenance Expenditure
Planned and Specific Unplanned
2012/13 $1,053,000 $219,000
2013/14 $53,777 $94,570
2014/15 $116,131 $124,757 Planned maintenance work is currently 36% of total maintenance expenditure.
The difference between the 2012/13 year and 2013/14 year is due to the accounting procedure used. A large amount of the planned maintenance has now been reallocated as renewal work in the large area renewal budget line. This is work undertaken by Field Services crew which is greater than $5,000 in value on a single asset and improves the service life of the asset by at least 1 year. This is now capitalised as renewal expenditure.
Due to increased customer requests and identified defects from the recent audit, maintenance expenditure levels are considered to be in-adequate to meet projected service levels. Where maintenance expenditure levels are such that will result in a lesser level of service, the service consequences and service risks have been identified and service consequences highlighted in this Asset Management Plan and service risks considered in the Infrastructure Risk Management Plan. Maintenance expenditure levels and renewals expenditure have been reviewed and increased as appropriate.
Assessment and prioritisation of reactive maintenance is undertaken by the organisation’s staff using experience and judgement.
CITY OF CHARLES STURT – PATHS/ACCESS RAMPS ASSET MANAGEMENT PLAN 2016
- 37 -
5.3.2 Operations and Maintenance Strategies
The organisation will operate and maintain assets to provide the defined level of service to approved budgets in the most cost-efficient manner. The operation and maintenance activities include:
Scheduling operations activities to deliver the defined level of service in the most efficient manner. Undertaking maintenance activities through a planned maintenance system to reduce maintenance costs and
improve maintenance outcomes. Undertake cost-benefit analysis to determine the most cost-effective split between planned and unplanned maintenance activities (50 – 70% planned desirable as measured by cost).
Maintain a current infrastructure risk register for assets and present service risks associated with providing
services from infrastructure assets and reporting Very High and High risks and residual risks after treatment to management and Council if required.
Review current and required skills base and implement workforce training and development to meet required
operations and maintenance needs, Review asset utilisation to identify underutilised assets and appropriate remedies, and over utilised assets and
customer demand management options, Maintain a current hierarchy of critical assets and required operations and maintenance activities, Develop and regularly review appropriate emergency response capability, Review management of operations and maintenance activities to ensure the organisation is obtaining best value
for resources used. Asset hierarchy
An asset hierarchy provides a framework for structuring data in an information system to assist in collection of data, reporting information and making decisions. The hierarchy includes the asset class and component used for asset planning and financial reporting and service level hierarchy used for service planning and delivery.
The organisation’s service hierarchy is shown is Table 5.3.2.
Table 5.3.2: Asset Service Hierarchy
Service Hierarchy Service Level Objective
N/A N/A NOTE: All assets in this group are serviced based on safety and risk, no hierarchy for service currently applies. Refer to service levels in table 3.4. In future years it is intended to apply a path hierarchy to reflect areas of more intensive use, such as around shopping precinct, schools, hospitals and retirement homes. Critical Assets
Critical assets are those assets which have a high consequence of failure but not necessarily a high likelihood of failure. By identifying critical assets and critical failure modes, organisations can target and refines investigative activities, maintenance plans and capital expenditure plans at the appropriate time.
Operations and maintenances activities may be targeted to mitigate critical assets failure and maintain service levels. These activities may include increased inspection frequency, higher maintenance intervention levels, etc. Critical assets failure modes and required operations and maintenance activities are detailed in Table 5.3.2.1.
CITY OF CHARLES STURT – PATHS/ACCESS RAMPS ASSET MANAGEMENT PLAN 2016
- 38 -
Table 5.3.2.1: Critical Assets and Service Level Objectives
What has been achieved since Path Asset Management Plan
2012
Disability access Aged person mobility Regionally strategic routes Retail precincts Public transport connections Other higher activity paths
Failure resulting in inability for users to conduct daily business. Injury risk to elderly and people with reduced mobility.
Maintenance and repairs in accordance with agreed response and service levels
222 Access Ramps have been upgraded to Disability Discrimination Act compliance 35 bus stops have been made Disability Discrimination Act compliant 937 trip hazards on paths have been attended to
Standards and specifications
Maintenance work is carried out in accordance with the following Standards and Specifications.
• Austroads ‘Guide to Road Design’ Parts 6, 6A, 6B and ‘Cycling Aspects of Austroads Guides’
• Disability Discrimination Act 1992, including the Public Transport Regulations
• Councils Internal Standards including NATSPEC specification.
5.3.3 Summary of future operations and maintenance expenditures
Future operations and maintenance expenditure is forecast to trend in line with the value of the asset stock as shown in Figure 4. Note that all costs are shown in current 2013/14 dollar values (i.e. real values).
Figure 4: Projected Operations and Maintenance Expenditure
The above graph illustrates the proposed forward budget for operations and maintenance based on the business rule that any work which exceeds $5,000 on one asset and improves its service life by at least 1 year will be classified as renewal work and capitalised. This graph shows substantial reduction in maintenance and operational cost from the Path Asset Management Plan 2012, due to the effect of this rule and the transfer of costs to the Capital Renewal budget line.
CITY OF CHARLES STURT – PATHS/ACCESS RAMPS ASSET MANAGEMENT PLAN 2016
- 39 -
Deferred maintenance, i.e. works that are identified for maintenance and unable to be funded are to be included in the risk assessment and analysis in the infrastructure risk management plan.
Maintenance is funded from the operating budget where available. This is further discussed in Section 6.2.
5.4 Renewal/Replacement Plan
Renewal and replacement expenditure is major work which does not increase the asset’s design capacity but restores, rehabilitates, replaces or renews an existing asset to its original or lesser required service potential. Work over and above restoring an asset to original service potential is upgrade/expansion or new works expenditure.
5.4.1 Renewal plan
Assets requiring renewal/replacement are identified from one of three methods provided in the ‘Expenditure Template’.
Method 1 uses Asset Register data to project the renewal costs using acquisition year and useful life to determine the renewal year, or
Method 2 uses capital renewal expenditure projections from external condition modelling systems (such as Pavement Management Systems), or
Method 3 uses a combination of average network renewals plus defect repairs in the Renewal Plan and Defect Repair Plan worksheets on the ‘Expenditure template’.
Discussion
The 2012 revision of the Asset Management Plan used 2008 condition data and Method 2 based on long term financial provision being adjusted in accordance with the Local Government Price Index.
The 2013 condition audit allowed us to use Method 1 which is summarised by the aged profile in Figure 2 in section 5.1.1 (which is reproduced below). That graph shows that in 1980 about $18M worth of paths were constructed in that one year. To expect to replace them all in one year is not sustainable. It is evident that Council is not able to manage the renewal of paths based on their age, i.e. Method 1.
Instead we have used Method 2 in this Asset Management Plan. This allows us to use the estimated useful life of an asset. The Asset Management Plan 2012 contained generic useful life. Due to the increased reliance on the useful life, we reviewed actual path condition within Charles Sturt to determine actual useful lives based on observation. We also undertook a “Peer Review” of adjacent South Australian Councils to see what they are using. It was concluded that the table of useful lives can be substantiated as being applicable in Charles Sturt. This is Table 5.4.1 below.
CITY OF CHARLES STURT – PATHS/ACCESS RAMPS ASSET MANAGEMENT PLAN 2016
- 40 -
Table 5.4.1: Useful Lives of Assets
Asset (Sub)Category Useful life
Rubble 15 years
Bitumen 25 years
Concrete 60 years
Pavers – Concrete 50 years
Pavers - Clay 50 years
Pavers – Boutique/Special/Granite 40 years
Access Ramps 25 years
The useful lives of footpath materiel will be reviewed in the next major revision as actual field data is showing they may be incorrect.
The condition of each path determined by the 2013 audit was used to improve the estimate of the remaining life of each path. The below graph indicates current condition ratings and footpath replacement valuations.
Figure 5
It was evident that there needed to be an improved distribution of renewal expenditure using this method, but there remained a high degree of annual variance so we have smoothed the expenditure for graduated increase in expenditure each year. This is shown in Figure 5.
A more detailed discussion of other considerations influencing path renewals are in section 5.4.2 and 5.4.3.
CITY OF CHARLES STURT – PATHS/ACCESS RAMPS ASSET MANAGEMENT PLAN 2016
- 41 -
5.4.2 Renewal and Replacement Strategies
Council will plan capital renewal and replacement projects to meet level of service objectives and minimise infrastructure service risks by:
Planning and scheduling renewal projects to deliver the defined level of service in the most efficient manner, Undertaking project scoping for all capital renewal and replacement projects to identify:
o the service delivery ‘deficiency’, present risk and optimum time for renewal/replacement, o the project objectives to rectify the deficiency, o the range of options, estimated capital and life cycle costs for each options that could address the
service deficiency, o and evaluate the options against evaluation criteria adopted by the organisation, and o select the best option to be included in capital renewal programs,
Using ‘low cost’ renewal methods (cost of renewal is less than replacement) wherever possible, Maintain a current infrastructure risk register for assets and service risks associated with providing services from
infrastructure assets and reporting Very High and High risks and residual risks after treatment to management and the Council,
Review current and required skills base and implement workforce training and development to meet required construction and renewal needs,
Maintain a current hierarchy of critical assets and capital renewal treatments and timings required , Review management of capital renewal and replacement activities to ensure the organisation is obtaining best
value for resources used. Renewal ranking criteria
Asset renewal and replacement is typically undertaken to either:
Ensure the reliability of the existing infrastructure to deliver the service it was constructed to facilitate (e.g replacing a bridge that has a 5 t load limit), or
To ensure the infrastructure is of sufficient quality to meet the service requirements (e.g roughness of a road).9 It is possible to get some indication of capital renewal and replacement priorities by identifying assets or asset groups that:
Have a high consequence of failure, Have a high utilisation and subsequent impact on users would be greatest, The total value represents the greatest net value to the organisation, Have the highest average age relative to their expected lives, Are identified in the Asset Management Plan as key cost factors, Have high operational or maintenance costs, and Where replacement with modern equivalent assets would yield material savings.10
The ranking criteria used to determine priority of identified renewal and replacement proposals is detailed in Table 5.4.2.
9 IPWEA, 2011, IIMM, Sec 3.4.4, p 3|60. 10 Based on IPWEA, 2011, IIMM, Sec 3.4.5, p 3|66.
CITY OF CHARLES STURT – PATHS/ACCESS RAMPS ASSET MANAGEMENT PLAN 2016
- 42 -
Table 5.4.2: Renewal and Replacement Priority Ranking Criteria
Criteria Weighting When Road Reconstruction will excessively damage the existing path 4 Addressing special needs of people with a disability; the aged; or others using mobility aids
4
Where there are coexisting concentrations of pedestrian and motor vehicle traffic and potential for conflict
4
In land use areas/precincts generating high trip demand (examples being near shops, schools and community facilities)
3
Located in areas where crowds use paths from time to time (walking distance of large sporting and entertainment venues – examples being, Hindmarsh Soccer stadium, Adelaide Entertainment Centre)
3
Forming part of a regional asset used by many visitors (in State or Council strategy or Development Plan – examples being the River Torrens Linear Park, Coast Park, Grange Lakes)
3
Providing access to public transport 3 Along arterial road, local distributors and collector streets 2 In, or next to precinct redevelopment areas 2 Paths in local access streets and reserves 1 *Note: 4 is the highest ranking with the greatest weight. These weightings are consistent with those used in the Path Asset Management Plan 2012. Renewal and replacement standards
Renewal work is carried out in accordance with the following Standards and Specifications.
• AS1428.1
• Austroads ‘Guide to Road Design’ Parts 6, 6A, 6B and ‘Cycling Aspects of Austroads Guides’
• Disability Discrimination Act 1992, including the Public Transport Regulations
• Councils Internal Standards including NATSPEC specification.
5.4.3 Summary of future renewal and replacement expenditure
Projected future renewal and replacement expenditures are forecast to increase over time as the asset stock increases from growth. The expenditure is summarised in Fig 5. Note that all amounts are shown in real values. Capital projects are typically undertaken to either:
Ensure the reliability of the existing infrastructure to deliver the service it was constructed to facilitate (e.g replacing a bridge that has a 5 t load limit), or To ensure the infrastructure is of sufficient quality to meet the service requirements (e.g roughness of a road).11
We currently consider two sets of criteria to prioritise our capital projects:
Benefit To ensure capital works projects that deliver significant benefit to the community proceed, a benefit ranking is applied to determine the priority of all projects. This criteria is detailed in Table 5.4.2. Applying the benefit ranking criteria produces a score out of 35.
11 IPWEA, 2011, IIMM, Sec 3.4.4, p 3|60.
CITY OF CHARLES STURT – PATHS/ACCESS RAMPS ASSET MANAGEMENT PLAN 2016
- 43 -
Table 5.4.3: Capital Works Priority Ranking Criteria
2 Implied Implied Good practice Moderate 25 – 50 people
Minor Minor
3 Specifically mentioned
Specifically mentioned
Australian standard
High 50 – 100 people
Moderate Moderate
4 Specifically mentioned x 2
Specifically mentioned x 2
Contractual obligation
Extreme 100 – 250 people
Significant Significant
5 Specifically mentioned > 2
Specifically mentioned > 2
Legal requirement
Almost certain
> 250 people Major Major
Asset Condition and Performance We must ensure the appropriate condition and performance standards are maintained throughout the organisation’s network of assets. Priority is therefore given to projects delivering renewal works over asset upgrades and new assets. Capital projects are submitted for approval having considered the above criteria which assists the Asset Management Committee in its decision making process. The recent audit of Paths and review of asset life expectancy has highlighted the need to substantially increase the renewal expenditure on this asset class.
The projected renewal budget (Fig 5 below) required to meet the 5 and 10-year renewal program has been smoothed out to allow a more consistent spend over the life of this Asset Management Plan and also to allow a ramp up of personnel to deliver this increased program.
The projected capital renewal and replacement program is shown in Appendix B.
Fig 5: Projected Capital Renewal and Replacement Expenditure
The above graph indicates that all of the renewal program is for paths in their first generation (they have not previously been replaced).
CITY OF CHARLES STURT – PATHS/ACCESS RAMPS ASSET MANAGEMENT PLAN 2016
- 44 -
Deferred renewal and replacement, i.e. those assets identified for renewal and/or replacement and not scheduled in capital works programs are to be included in the risk analysis process in the risk management plan.
Renewals and replacement expenditure in the organisation’s capital works program will be accommodated in the long term financial plan. This is further discussed in Section 6.2.
5.5 Creation/Acquisition/Upgrade Plan
New works are those works that create a new asset that did not previously exist, or works which upgrade or improve an existing asset beyond its existing capacity. They may result from growth, social or environmental needs. Assets may also be acquired at no cost to the organisation from land development. These assets from growth are considered in Section 4.4.
5.5.1 Selection criteria
New assets and upgrade/expansion of existing assets are identified from various sources such as councillor or community requests, proposals identified by strategic plans or partnerships with other organisations. Candidate proposals are inspected to verify need and to develop a preliminary renewal estimate. Verified proposals are ranked by priority and available funds and scheduled in future works programmes. The priority ranking criteria is detailed below.
Table 5.5.1: New Assets Priority Ranking Criteria
Criteria Weighting When Road Reconstruction provides an opportunity to construct upgraded, or new paths.
4
Addressing special needs of people with a disability; the aged; or others using mobility aids
4
Being a ‘missing link’ between existing paths and open space areas 4 Where there are coexisting concentrations of pedestrian and motor vehicle traffic and potential for conflict
4
Providing access to public transport as required in the Disability Discrimination Act Public Transport Regulations.
3
In land use areas/precincts generating high trip demand (examples being near shops, schools and community facilities)
3
Located in areas where crowds use paths from time to time (walking distance of large sporting and entertainment venues – examples being AAMI stadium, Hindmarsh Soccer stadium, Adelaide Entertainment Centre)
3
Forming part of a regional asset used by many visitors (in State or Council strategy or Development Plan – examples being the River Torrens Linear Park, Coast Park, Sportsmans Drive)
3
Along arterial road, local distributors and collector streets 2 In, or next to precinct redevelopment areas 2 Paths in local access streets and reserves 1 The weighting is consistent with the Path Asset Management Plan 2012.
CITY OF CHARLES STURT – PATHS/ACCESS RAMPS ASSET MANAGEMENT PLAN 2016
- 45 -
5.5.2 Capital Investment Strategies
The organisation will plan capital upgrade and new projects to meet level of service objectives by:
Planning and scheduling capital upgrade and new projects to deliver the defined level of service in the most efficient manner, Undertaking project scoping for all capital upgrade/new projects to identify:
o the service delivery ‘deficiency’, present risk and required timeline for delivery of the upgrade/new asset,
o the project objectives to rectify the deficiency including value management for major projects, o the range of options, estimated capital and life cycle costs for each options that could address the
service deficiency, o management of risks associated with alternative options, o and evaluate the options against evaluation criteria adopted by Council/Board, and o select the best option to be included in capital upgrade/new programs,
Reviewing current and required skills base and implement training and development to meet required construction and project management needs, Reviewing management of capital project management activities to ensure the organisation is obtaining best value for resources used.
Standards and specifications for new assets and for upgrade/expansion of existing assets are the same as those for renewal shown in Section 5.4.2.
5.5.3 Summary of future upgrade/new assets expenditure
Projected upgrade/new asset expenditures are summarised in Fig 6. The projected upgrade/new capital works program is shown in Appendix C. All amounts are shown in real values.
Fig 6: Projected Capital Upgrade/New Asset Expenditure
The Capital upgrade/ new expenditure has been retained at $436,000 per year after 2014, being the historic allowance for new paths to be constructed in response to resident requests and changing circumstance.
Expenditure on new assets and services in the capital works program will be accommodated in the Long Term Financial Plan but are still subject to Council approval through the budget process. This is further discussed in Section 6.2.
CITY OF CHARLES STURT – PATHS/ACCESS RAMPS ASSET MANAGEMENT PLAN 2016
- 46 -
5.6 Disposal Plan
Disposal includes any activity associated with disposal of a decommissioned asset including sale, demolition or relocation. Assets identified for possible decommissioning and disposal are shown in Table 5.6, together with estimated annual savings from not having to fund operations and maintenance of the assets. These assets will be further reinvestigated to determine the required levels of service and see what options are available for alternate service delivery, if any. Any revenue gained from asset disposals is accommodated in the organisation’s long term financial plan.
Where cash-flow projections from asset disposals are not available, these will be developed in future revisions of this Asset Management Plan. Increasingly, we incur greater costs in relation to asset disposals. These costs include the treatment of contaminated soils removed from sites, electronic goods, items containing gas(es) and other environmentally sensitive disposals.
Note: The preparation of this Path Asset Management Plan does not take into account paths requiring renewal or upgrade due to other work (such as road work), or strategic decisions (such as precinct redevelopment) which require the remaining life of the path to be shortened and the path written off to coincide with these activities.
These decisions can only be made through the 4 year capital works program which would allow accelerated depreciation to a zero residual value for the asset.
5.7 Service Consequences and Risks
The organisation has prioritised decisions made in adopting this Asset Management Plan to obtain the optimum benefits from its available resources. Decisions were made based on the development of 3 scenarios of Asset Management Plans.
Scenario 1 - What we would like to do based on asset register data
Scenario 2 – What we should do with existing budgets and identifying level of service and risk consequences (i.e. what are the operations and maintenance and capital projects we are unable to do, what is the service and risk consequences associated with this position). This may require several versions of the Asset Management Plan.
Scenario 3 – What we can do and be financially sustainable with Asset Management Plan matching a Long Term Financial Plan.
The development of scenario 1 and scenario 2 Asset Management Plan provides the tools for discussion with the Council and community on trade-offs between what we would like to do (scenario 1) and what we should be doing with existing budgets (scenario 2) by balancing changes in services and service levels with affordability and acceptance of the service and risk consequences of the trade-off position (scenario 3).
CITY OF CHARLES STURT – PATHS/ACCESS RAMPS ASSET MANAGEMENT PLAN 2016
- 47 -
5.7.1 What we cannot do
There are potentially some operations and maintenance activities and capital projects that are unable to be undertaken within the next 10-years. These include:
• Renewal of some residential area paths
• Upgrade of part of River Torrens Linier Path to current shared use standard.
• New Cycleway and shared use paths along major arterials.
• Replacement of Older Asphalt paths with modern block paving.
5.7.2 Service consequences
Operations and maintenance activities and capital projects that cannot be undertaken will maintain or create service consequences for users. These include:
• Some lack of connectivity for walking and cycling activities.
• Deterioration of residential streetscapes.
• Increase in area maintenance costs in residential streets.
5.7.3 Risk consequences
The operations and maintenance activities and capital projects that cannot be undertaken may maintain or create risk consequences for the organisation. These include:
• Increased trip hazards in residential streets.
• Increased customer complaints regarding lack of renewal of paths.
These risks have been included with the Infrastructure Risk Management Plan summarised in Section 5.2 and risk management plans actions and expenditures included within projected expenditures.
CITY OF CHARLES STURT – PATHS/ACCESS RAMPS ASSET MANAGEMENT PLAN 2016
- 48 -
6. FINANCIAL SUMMARY
This section contains the financial requirements resulting from all the information presented in the previous sections of this Asset Management Plan. The financial projections will be improved as further information becomes available on desired levels of service and current and projected future asset performance.
6.1 Financial Statements and Projections
The financial projections are shown in Fig 7 for projected operating (operations and maintenance) and capital expenditure (renewal and upgrade/expansion/new assets). Note that all costs are shown in real values.
The current budgeted figures (solid black line) show renewals expenditure peaking in 2024, at the peripheral of this plan. Construction dates for this period are 1964 or earlier and often are not fully known. The projected Capital Renewal is based on a condition rating until 2024 and a smoothed year of construction. Essentially the condition rating and unknown year of construction in the first 10 years have bought forward the 2024 peak into earlier years of the program
Fig 7: Projected Operating and Capital Expenditure
6.1.1 Sustainability of service delivery
There are four key indicators for service delivery sustainability that have been considered in the analysis of the services provided by this asset category, these being the asset renewal funding ratio, long term life cycle costs/expenditures and medium term projected/budgeted expenditures over 5 and 10-years of the planning period.
Asset Renewal Funding Ratio
Asset Renewal Funding Ratio12 104% over the whole of life of this Asset Management Plan.
CITY OF CHARLES STURT – PATHS/ACCESS RAMPS ASSET MANAGEMENT PLAN 2016
- 49 -
The Asset Renewal Funding Ratio is the most important indicator and reveals that over the next 10-years, the organisation is forecasting that it will have 104% of the funds required for the optimal renewal and replacement of its assets.
Long term - Life Cycle Cost
The life cycle costs and life cycle expenditure comparison highlights any difference between present outlays and the average cost of providing the service over the long term. If the life cycle expenditure is less than that life cycle cost, it is most likely that outlays will need to be increased or cuts in services made in the future.
Knowing the extent and timing of any required increase in outlays and the service consequences if funding is not available will assist organisations in providing services to their communities in a financially sustainable manner. This is the purpose of the Asset Management Plans and long term financial plan.
Life cycle costs (or whole of life cost) are the average costs that are required to sustain the service levels over the asset life cycle. Life cycle costs include operations and maintenance expenditure and asset consumption (depreciation expense). The life cycle cost for the services covered in this Asset Management Plan is $3,669,000 per year (average operations and maintenance expenditure plus depreciation expense).
The projected expenditures in this 20-year Asset Management Plan is 209% of the cost of the assets for their whole life. This is due to the “lumpy” nature of development in the 50’s, 60’s and 70’s, with these paths representing 50% of asset base and being due for renewal in this 20 year period.
This is explained by looking at Figure 2 Age Profile of Paths. This clearly shows that the majority of paths were constructed in the period 1960 to 1975 and are due for renewal in the current Asset Management Plan 10-year horizon. Beyond this period, renewal activity is expected to decrease significantly.
Medium term – 10-year financial planning period
This Asset Management Plan identifies the projected operations, maintenance and capital renewal expenditures required to provide an agreed level of service to the community over a 10-year period. This provides input into 10-year financial and funding plans aimed at providing the required services in a sustainable manner.
These projected expenditures may be compared to budgeted expenditures in the 10-year period to identify any funding shortfall. In a core Asset Management Plan, a gap is generally due to increasing asset renewals for ageing assets.
The projected operations, maintenance and capital renewal expenditure required over the 10-year planning period is $7,439,000 on average per year.
The currently endorsed Long Term Financial Plan (2014/15) for operation, maintenance and capital renewal funding for the paths assets is $7,664,000 on average per year giving a 10-year average funding surplus of $2,250 per year. This indicates that the Council expects to have 103% of the projected expenditures needed to provide the services documented in this revision of the Asset Management Plan.
Short term – 5-year financial planning period
These projected expenditures may be compared to budgeted expenditures in the 5-year period to identify any funding shortfall. In a core Asset Management Plan, a gap is generally due to increasing asset renewals for ageing assets.
The projected operations, maintenance and capital renewal expenditure required over the 5-year planning period is $6,927,000 on average per year.
The currently endorsed Long Term Financial Plan (2014/15) for operation, maintenance and capital renewal funding for the paths assets is $6,990,000 on average per year giving a 10-year funding surplus of $12,600 per year. This indicates that the Council expects to have 101% of the projected expenditures needed to provide the services documented in this revision of the Asset Management Plan.
CITY OF CHARLES STURT – PATHS/ACCESS RAMPS ASSET MANAGEMENT PLAN 2016
- 50 -
Asset management financial indicators
Figure 7A shows the asset management financial indicators over the 10-year planning period and for the long term life cycle.
Figure 7A: Asset Management Financial Indicators
Note: This graph illustrates the short to medium term planned expenditure exceeds the long term (all of life) expenditure requirement by approximately 1.5 times. The expectation is after the medium term (life of this Path Asset Management Plan); the expenditure requirements for Path assets will decrease.
Providing services from infrastructure in a sustainable manner requires the matching and managing of service levels, risks, projected expenditures and financing to achieve a financial indicator of approximately 1.0 for the first years of the Asset Management Plan and ideally over the 10-year life of the Long Term Financial Plan.
Figure 8 shows the projected asset renewal and replacement expenditure over the 20-years of the Asset Management Plan. The projected asset renewal and replacement expenditure is compared to renewal and replacement expenditure in the capital works program, which is accommodated in the long term financial plan
CITY OF CHARLES STURT – PATHS/ACCESS RAMPS ASSET MANAGEMENT PLAN 2016
- 51 -
Figure 8: Projected and LONG TERM FINANCIAL PLAN Budgeted Renewal Expenditure
Table 6.1.1 shows the shortfall between projected renewal and replacement expenditures and expenditure accommodated in the Current long term financial plan. Budget expenditures accommodated in the long term financial plan or extrapolated from current budgets are shown in Appendix D.
Table 6.1.1: Projected and LONG TERM FINANCIAL PLAN Budgeted Renewals and Financing Shortfall
Year End June 30
Projected Renewals ($'000)
LTFP Renewal Budget ($'000)
Renewal Financing Shortfall (- gap,
+ surplus) ($'000)
Cumulative Shortfall (- gap, + surplus)
($'000)
2015 $4,765 $4,847 $82 $82
2016 $5,765 $5,887 $122 $204
2017 $6,765 $6,871 $106 $310
2018 $7,765 $8,019 $254 $564
2019 $7,765 $7,899 $134 $698
2020 $7,765 $7,907 $142 $840
2021 $7,765 $7,890 $125 $965
2022 $7,765 $7,844 $79 $1,044
2023 $7,315 $7,844 $529 $1,573
2024 $7,315 $8,777 $1,462 $3,035
2025 $6,970 $8,844 $1,874 $4,909
CITY OF CHARLES STURT – PATHS/ACCESS RAMPS ASSET MANAGEMENT PLAN 2016
- 52 -
2026 $6,970 $9,844 $2,874 $7,783
2027 $6,970 $9,844 $2,874 $10,657
2028 $6,970 $9,844 $2,874 $13,531
2029 $6,970 $9,844 $2,874 $16,405
2030 $6,970 $9,844 $2,874 $19,279
2031 $6,970 $9,844 $2,874 $22,153
2032 $6,970 $9,844 $2,874 $25,027
2033 $6,970 $9,844 $2,874 $27,901
2034 $6,970 $9,844 $2,874 $30,775
Note: A negative shortfall indicates a financing gap, a positive shortfall indicates a surplus for that year. Providing services in a sustainable manner will require matching of projected asset renewal and replacement expenditure to meet agreed service levels with the corresponding capital works program accommodated in the long term financial plan.
A gap between projected asset renewal/replacement expenditure and amounts accommodated in the LONG TERM FINANCIAL PLAN indicates that further work is required on reviewing service levels in the Asset Management Plan (including possibly revising the LONG TERM FINANCIAL PLAN) before finalising the Asset Management Plan to manage required service levels and funding to eliminate any funding gap.
The LTFP is providing just sufficient funding over the term of this plan to manage Path and Ramp renewal at current service levels.
We will manage the ‘gap’ by developing this Asset Management Plan to provide guidance on future service levels and resources required to provide these services, and review future services, service levels and costs with the community.
CITY OF CHARLES STURT – PATHS/ACCESS RAMPS ASSET MANAGEMENT PLAN 2016
- 53 -
6.1.2 Projected expenditures for long term financial plan
Table 6.1.2 shows the projected expenditures for the 10-year long term financial plan.
Expenditure projections are in 2013 real values.
Table 6.1.2: Projected Expenditures for Long Term Financial Plan ($000)
Year Operations ($000) Maintenance ($000) Projected Capital
Renewal ($000) Capital Upgrade/
New ($000) Disposals
($000)
2015 $112 $248 $4,765 $200 $0
2016 $112 $249 $5,765 $200 $0
2017 $112 $250 $6,765 $200 $0
2018 $112 $250 $7,765 $200 $0
2019 $112 $251 $7,765 $200 $0
2020 $113 $252 $7,765 $200 $0
2021 $113 $253 $7,765 $200 $0
2022 $113 $253 $7,765 $200 $0
2023 $113 $254 $7,315 $200 $0
2024 $113 $255 $7,315 $200 $0
2025 $113 $256 $6,970 $200 $0
2026 $113 $257 $6,970 $200 $0
2027 $113 $257 $6,970 $200 $0
2028 $114 $258 $6,970 $200 $0
2029 $114 $259 $6,970 $200 $0
2030 $114 $260 $6,970 $200 $0
2031 $114 $260 $6,970 $200 $0
2032 $114 $261 $6,970 $200 $0
2033 $114 $262 $6,970 $200 $0
2034 $114 $263 $6,970 $200 $0
CITY OF CHARLES STURT – PATHS/ACCESS RAMPS ASSET MANAGEMENT PLAN 2016
- 54 -
6.2 Funding Strategy
After reviewing service levels, as appropriate to ensure ongoing financial sustainability, projected expenditures identified in Section 6.1.2 will be accommodated in the organisation’s 10-year long term financial plan.
We currently consider two sets of criteria to prioritise our budget bids for any capital project:
Benefit To ensure capital works projects that deliver significant benefit to the community proceed, a benefit ranking is applied to determine the priority of all projects. This criteria is detailed in Table 5.4.2. Applying the benefit ranking criteria produces a score out of 35.
2 Implied Implied Good practice Moderate 25 – 50 people
Minor Minor
3 Specifically mentioned
Specifically mentioned
Australian standard
High 50 – 100 people
Moderate Moderate
4 Specifically mentioned x 2
Specifically mentioned x 2
Contractual obligation
Extreme 100 – 250 people
Significant Significant
5 Specifically mentioned > 2
Specifically mentioned > 2
Legal requirement
Almost certain
> 250 people Major Major
Note Benefit Scale 5 has the greatest impact
Asset Condition and Performance The Council must ensure the appropriate condition and performance standards are maintained throughout our network of assets. Priority is therefore given to projects delivering renewal works over building upgrades and new assets.
Capital projects are submitted for approval having considered both the above criteria and individual asset ranking criteria. This in turn assists the Asset Management Committee in its decision making process.
CITY OF CHARLES STURT – PATHS/ACCESS RAMPS ASSET MANAGEMENT PLAN 2016
- 55 -
6.3 Valuation Forecasts
Asset values are forecast to increase as additional assets are added to the asset stock from construction and acquisition by the organisation and from assets constructed by land developers and others and donated to the organisation. Figure 9 shows the projected replacement cost asset values over the planning period in real values.
Figure 9: Projected Asset Values
CITY OF CHARLES STURT – PATHS/ACCESS RAMPS ASSET MANAGEMENT PLAN 2016
- 56 -
Depreciation expense values are forecast in line with asset values as shown in Figure 10.
Figure 10: Projected Depreciation Expense
The depreciated replacement cost will vary over the forecast period depending on the rates of addition of new assets, disposal of old assets and consumption and renewal of existing assets. Forecast of the assets’ depreciated replacement cost is shown in Figure 11. The depreciated replacement cost of contributed and new assets is shown in the darker colour and in the lighter colour for existing assets.
CITY OF CHARLES STURT – PATHS/ACCESS RAMPS ASSET MANAGEMENT PLAN 2016
- 57 -
Figure 11: Projected Depreciated Replacement Cost
6.4 Key Assumptions made in Financial Forecasts
This section details the key assumptions made in presenting the information contained in this Asset Management Plan and in preparing forecasts of required operating and capital expenditure and asset values, depreciation expense and carrying amount estimates. It is presented to enable readers to gain an understanding of the levels of confidence in the data behind the financial forecasts.
Key assumptions made in this Asset Management Plan and risks that these may change are shown in Table 6.4.
Table 6.4: Key Assumptions made in Asset Management Plan and Risks of Change
Key Assumptions Risks of Change to Assumptions Forecasted on “today’s” dollars, Local Government Price Index (LGPI) is added in the financial budgeting cycle
If LGPI is not accurate, then over time, the forecast will be inaccurate
Staffing needs are resourced adequately Unable to resource planned asset management activities No significant changes in Legislation Changes may demand unplanned/unbudgeted asset
management activities Growth as forecast Forecasted growth may demand unplanned/unbudgeted
asset management activities
CITY OF CHARLES STURT – PATHS/ACCESS RAMPS ASSET MANAGEMENT PLAN 2016
- 58 -
6.5 Forecast Reliability and Confidence
The expenditure and valuations projections in this Asset Management Plan are based on best available data. Currency and accuracy of data is critical to effective asset and financial management. Data confidence is classified on a 5 level scale13 in accordance with Table 6.5.
Table 6.5: Data Confidence Grading System
Confidence Grade Description A Highly reliable Data based on sound records, procedures, investigations and analysis, documented properly and recognised
as the best method of assessment. Dataset is complete and estimated to be accurate ± 2% B Reliable Data based on sound records, procedures, investigations and analysis, documented properly but has minor
shortcomings, for example some of the data is old, some documentation is missing and/or reliance is placed on unconfirmed reports or some extrapolation. Dataset is complete and estimated to be accurate ± 10%
C Uncertain Data based on sound records, procedures, investigations and analysis which is incomplete or unsupported, or extrapolated from a limited sample for which grade A or B data are available. Dataset is substantially complete but up to 50% is extrapolated data and accuracy estimated ± 25%
D Very Uncertain Data is based on unconfirmed verbal reports and/or cursory inspections and analysis. Dataset may not be fully complete and most data is estimated or extrapolated. Accuracy ± 40%
E Unknown None or very little data held. The estimated confidence level for and reliability of data used in this Asset Management Plan is shown in Table 6.5.1.
Table 6.5.1: Data Confidence Assessment for Data used in Asset Management Plan
Data Confidence Assessment Comment Demand drivers Reliable Existing demand drivers are reliably researched Growth projections Uncertain Based on State Government 30 year plan and known
increases in the short medium term Operations expenditures Reliable Based on known expenditure and type of issue Maintenance expenditures
Uncertain Dependent on industry wide cost structure. Recently decreased, but long term average is still increasing.
Projected Renewal exps. - Asset values
Reliable Many competing projects.
- Asset residual values Reliable Well researched and up-dated yearly - Asset useful lives Reliable Well researched - Condition modelling Uncertain Recently implemented works and assets system will allow
better modelling - Network renewals Uncertain Recently implemented works and assets system will allow
better modelling - Defect repairs Uncertain Recently implemented works and assets system will allow
better modelling Upgrade/New expenditures
Uncertain Many competing projects
Disposal expenditures Reliable Well researched and up-dated yearly Over all data sources, the data confidence is assessed as medium confidence level for data used in the preparation of this Asset Management Plan.
13 IPWEA, 2011, IIMM, Table 2.4.6, p 2|59.
CITY OF CHARLES STURT – PATHS/ACCESS RAMPS ASSET MANAGEMENT PLAN 2016
- 59 -
7. PLAN IMPROVEMENT AND MONITORING
7.1 Status of Asset Management Practices
7.1.1 Accounting and financial systems
The organisation implemented the TechnologyOne Finance One ERP module during 2002 and 2003. The system has been capturing all operating and capital expenses since that time. In the absence of a job costing application, the chart of accounts was developed to track all of the required information of a project as identified at the time by the project managers.
The capital works chart structure identifies the project, subproject, object and activity codes, and contained within the project and subproject numbers are codes to identify the manager, asset category, new/renew/upgrade and the project objective. The project and subproject define the location and objective of the project, the object code identifies the inputs into it, and the activity code identifies the nature of work being carried out.
The budgets for all our projects are also stored in Finance One at the project and subproject level. Reports are generated on a monthly basis from Finance One comparing actual to estimate. Once works have been completed, the subproject numbers are closed off, and the balance of the subproject is either capitalised into the Finance One Fixed Asset Register, or into a current Asset Management Services Fixed Asset Register, provided it meets the Threshold of Materiality.
Accountabilities for financial systems
The Finance One Fixed Asset Register stores all of the financial information relating to buildings, land, plant and equipment and furniture and fittings. It is used for the generation of depreciation, revaluations and disposal in these asset categories. Other asset categories including Roads, Drainage and Bridges were previously managed in stand-alone systems such as RoadPak, Excel, and GIS. A new consolidated Works and Assets system will be implemented during 2013 and 2014.
Finance One (TechnologyOne “Financials”) is also the organisation’s solution for Accounts Payable, General and Project Ledgers, Inventory Management and Purchasing. All Receipting, Accounts Receivable, Land Information and Bank Reconciliations are carried out in the Property and Rating solution. Human Resources is managed in the People One ERP module of the TechnologyOne application.
Plant and Equipment, Land and Buildings, Furniture and Fittings asset information in the Finance One application is managed by the Finance Department, and is done so based on information supplied by the asset managers and owners and in accordance with the Asset Accounting Policy. All other assets are managed by the asset owners in their stand-alone systems.
Accounting standards and regulations
There are many Regulations and Accounting Standards that we must comply with; however, those that are specifically related to Asset Management are:
South Australian Local Government Act 1999 AASB 116 Property Plant and Equipment AASB 1021 Depreciation AASB 1045 Land Under Roads Capital/maintenance threshold
The organisation has an Asset Accounting Policy that is reviewed annually by the Manager Financial Services. This policy details the expenditure that is to be capitalised, and the associated accounting treatment for non-current assets. It also sets the Threshold of Materiality for all asset categories; these values can be summarised as Land and Buildings at $5,000, Computer Equipment $1,000, Furniture and Fittings $500, Roads, Drains and Bridges $5,000, Mechanical Equipment $1,000 and Vehicles $5,000.
CITY OF CHARLES STURT – PATHS/ACCESS RAMPS ASSET MANAGEMENT PLAN 2016
- 60 -
Where an individual asset falls below the threshold, but the assets form part of a network, such as park furniture on a reserve, then consideration will be given to capitalising the aggregated value providing they exceed the threshold. Acquisition costs of less than these thresholds will be expensed.
Required changes to accounting financial systems arising from this Asset Management Plan
The preparation and ongoing review and maintenance of Asset Management Plans has highlighted the need for the organisation to implement an Asset Management System. A contract for the implementation of a system was released in August of 2012 The basic system has now been implemented and data up-loaded. The system is being optimised as new data becomes available.
The Asset system data base has been integrated with the Financial database under the recently introduced Works and Asset system. This system is now operational and being monitored for performance and need for additional personnel training. Output of data regarding maintenance work on assets will allow fine tuning of the Long Term Financial Plan as well as regular up-dating of the Long Term Financial Plan.
7.2.1 Asset management system
Assets were previously managed using a variety of systems and tools. In 2012 we commenced a project to consolidate asset data and works scheduling to reduce the risk of using disparate systems and processes. This has now resulted in an asset database which has been “cleansed” of duplicate and out of date data. This will be an on-going process.
Asset registers
The master asset data sits within the TechnologyOne works and assets system. The TechnologyOne core enterprise suite includes the existing Financials module resulting in a consolidated asset register.
Linkage from asset management to financial system
The consolidated asset register sits within the TechnologyOne core enterprise suite. The asset data is stored in the works and assets module with linked asset book data (financial data) in the financials module. Additional asset data, captured from activities such as condition audits, will be loaded and modelled against this core asset data in the Assetic predictive modelling tool. The results will then be loaded back to the consolidated register in the form of summary condition data, estimated useful lifes and valuations.
Accountabilities for asset management system and data maintenance
Asset Manager and Asset Officer (Data Owner) in liaison with the Asset Management Planning Business Unit. Works related data is the responsibility of the Field Service Manager and their respective business units.
Required changes to asset management system arising from this Asset Management Plan
Refinement of the Business Rules used in modelling may be required to help inform the management of a likely budget shortfall
CITY OF CHARLES STURT – PATHS/ACCESS RAMPS ASSET MANAGEMENT PLAN 2016
- 61 -
7.2 Improvement Program
The asset management improvement plan generated from this Asset Management Plan is shown in Table 8.2.
Table 7.2: Improvement Plan
Task No Task Responsibility Resources Required
Timeline
1 Adopt auditing processes that will ensure the integrity of the Asset Management Plan so Council can meet its legislative obligations.
AM AO Management Accountant Coordinator Asset Management
On-going
2 Improve processes to keep the Asset Register and financial General Ledger consistent with each other and up to date.
AM AO Management Accountant Coordinator Asset Management
Has been partially achieved To be finalised Nov 2016
3 Introduce a process to write off assets due to strategic decision, or impacting works, causing need to bring forward the renewal of a path.
AO Management Accountant Coordinator Roads
Completed
4 Improve processes that support the path renewal program to focus on condition 5 and 4 paths that could be a risk to public safety.
AO AO Coordinator Engineering Works
Partially achieved. Recent up-date indicates a reduction to 3% of Condition 4 and 5 Paths.
5 Establish an Environmental Framework applicable to paths that delivers objectives of ‘Toward One Planet Living”.
AM AO Coordinator Sustainability Programs Coordinator Roads Coordinator Engineering Works
TBA Ongoing
6 Review and implement improved design and construction standards applying to paths to reduce maintenance and extend useful life.
AM Coordinator Design Progress achieved with development of Standards
8 Review the process for recording, monitoring, and actioning reported hazards.
AM AO Coordinator Engineering Works
Ongoing
9 Review the process for recording, monitoring, and actioning requests for path maintenance/repairs to reduce its complexity.
AM AO Coordinator Engineering Works
Ongoing
10 Investigate the relationship between the time that a path is identified as not being safe and serviceable and potential hazards or risks.
AM AO Coordinator Engineering Works
Ongoing
11 Improve the integration of paths in our project and business planning in accordance with the Walk 12 Charter.
AM AO Coordinator Transport Projects & Assets
Ongoing
CITY OF CHARLES STURT – PATHS/ACCESS RAMPS ASSET MANAGEMENT PLAN 2016
- 62 -
The improvement plan timeframe established in the 2014 Path Asset Management Plan has been revised to reflect actual outcomes achieved and projected dates to complete parts of this improvement plan. 7.3 Monitoring and Review Procedures
This Asset Management Plan will be reviewed during annual budget planning processes and amended to recognise any material changes in service levels and/or resources available to provide those services as a result of budget decisions.
The Asset Management Plan will be updated annually if required to ensure it represents the current service level, asset values, projected operations, maintenance, capital renewal and replacement, capital upgrade/new and asset disposal expenditures and projected expenditure values incorporated into the organisation’s long term financial plan. The update, if required, will be triggered via an annual review meeting that encompasses all of the afore mentioned inputs.
The Local Government Act 1999 sets out the requirements for the organisation in relation to preparing and reviewing its Asset Management Plans.
Chapter 8 – Administrative and financial accountability Part 1 Strategic management plans
‘(1a) A Council must, in conjunction with the plans required under subsection (1), develop and adopt –
a) a long term financial plan for a period of at least 10-years and
b) an infrastructure and Asset Management Plan, relating to the management and development of infrastructure and major assets by the council for a period of at least 10-years.
(4) A council may review its strategic plans under this section at any time but must –
(a) undertake a review of
(i) its long term financial plan; and
(ii) any other elements of its strategic management plans prescribed by regulations for the purposes of this paragraph,
As soon as practicable after adopting the council’s annual business plans for a particular financial year and
(b) in an event, undertake a comprehensive review of its strategic management plans within 2 years after each general election cycle.’
Should the annual review cycle identify material changes that either have a significant financial or service delivery impact then the document will be resubmitted to the Asset Management Committee for review and update.
A comprehensive review of the Asset Management Plan will be conducted every four years within 2 years of each general election cycle as prescribed in the LG Act 1999 unless required before that time. Once again, a revision will be issued for approval and publishing should material changes be identified through the trigger review process.
7.4 Performance Measures
The effectiveness of the Asset Management Plan can be measured in the following ways:
The degree to which the required projected expenditures identified in this Asset Management Plan are incorporated into the organisation’s long term financial plan,
The degree to which 1-5-year detailed works programs, budgets, business plans and organisational structures take into account the ‘global’ works program trends provided by the Asset Management Plan,
The degree to which the existing and projected service levels and service consequences (what we cannot do), risks and residual risks are incorporated into the organisation’s Strategic Plan and associated plans,
The Asset Renewal Funding Ratio achieving the target of 1.0.
CITY OF CHARLES STURT – PATHS/ACCESS RAMPS ASSET MANAGEMENT PLAN 2016
- 63 -
8. REFERENCES IPWEA, 2006, ‘International Infrastructure Management Manual’, Institute of Public Works Engineering Australia, Sydney, www.ipwea.org.au/IIMM
IPWEA, 2008, ‘NAMS.PLUS Asset Management’, Institute of Public Works Engineering Australia, Sydney, www.ipwea.org.au/namsplus.
IPWEA, 2009, ‘Australian Infrastructure Financial Management Guidelines’, Institute of Public Works Engineering Australia, Sydney, www.ipwea.org.au/AIFMG.
IPWEA, 2011, ‘International Infrastructure Management Manual’, Institute of Public Works Engineering Australia, Sydney, www.ipwea.org.au/IIMM
TechnologyOne - FinanceOne, Corporate Financial System
City of Charles Sturt, Community Plan 2013-2027
City of Charles Sturt, Corporate Plan 2013-2017
City of Charles Sturt, Towards One Planet Living: Greening the Western Suburbs 2008-2013
City of Charles Sturt, Engineering & Open Space Guidelines
City of Charles Sturt, Environmental Sustainability Policy
City of Charles Sturt, Asset Accounting Policy
City of Charles Sturt, Asset Fund Policy
City of Charles Sturt, Walking and Cycling Strategy
World Commission on Environment and Development. (1987). Our Common Future. The Bruntland Commission, UNESCO. Ajuntament de Barcelona and United Cities and Local Governments. (2004). Agenda 21 for culture. United Cities and Local Government-Working Group on Culture. http://agenda21cultura.org/
CITY OF CHARLES STURT – PATHS/ACCESS RAMPS ASSET MANAGEMENT PLAN 2016
Appendix B Projected 2-year Capital Renewal and Replacement Works Program
Appendix C Projected 10-year Capital Upgrade/New Works Program
Appendix D Budgeted Expenditures Accommodated in Long Term Financial Plan
Appendix E Abbreviations
Appendix F Glossary
CITY OF CHARLES STURT – PATHS/ACCESS RAMPS ASSET MANAGEMENT PLAN 2016
- 65 -
Appendix A Maintenance Response Levels of Service
10005 Footpath Maintenance
Outcomes (at a corporate level)
Customer Satisfaction
Improved asset and financial management
Maintain footpaths to an appropriate standard
Report Frequency: Calendar Month
Sub Activity Financial Performance Specification Performance
Budget Job No. Unit Rate Qty Intervention Criteria Scope of Work Response Times Outcomes (Unit Level)
024 Path Repairs Concrete
Information to be Reported:
Quantity of Work (m2);
Value of Work.
100050024 Monthly KPI reporting. Request or referral through CRM, RRT or internal audit
Vertical Displacement > 20mm; or
Failed Slabs > 30 % by area; or
Failed reinstatements.
Reconstruct affected slabs including, Footpaths, Laneways, Walkways and Reserve Paths;
Infill concrete to median islands, roundabouts etc.
Where RRT respond –RRT make safe within 3 days or RRT repair within 10 business days.
Where RRT have made the area safe and not repaired – place in program for repair within 21 days.
Reduction in risk from hazards to pedestrians/path users;
Improving integrity and condition of asset;
Improved works programming.
020 Path Repairs Brick Paving
Information to be Reported:
Quantity of Work (m2);
Value of Work.
100050020 Monthly KPI reporting. Request or referral through CRM, RRT or internal audit
Vertical Displacement > 20mm; or
Failed pavers > 30% by area; or
Failed reinstatements.
Re-lay affected area including Vehicular Pavements, Footpaths and Reserve Paths;
(Includes brick, segmental and concrete pavers)
Where RRT respond –RRT make safe within 3 days or RRT repair within 10 business days.
Where RRT have barricaded area and not repaired – place in program
for repair 12 to 18 months’ time.
Reduction in risk from hazards to pedestrians/path users;
Improving integrity and condition of asset ;
Improved works programming.
CITY OF CHARLES STURT – PATHS/ACCESS RAMPS ASSET MANAGEMENT PLAN 2016
- 66 -
006 Unmade Paths- Area Patching
(Note Includes Footpaths & reserve paths)
Information to be Reported:
Quantity of Work (m2);
Value of Work;
Number of days to respond.
100050006
Not recorded separately. Request or referral through CRM, RRT; or
Any Holes; or
Undulating surface > 30mm under 3m straight edge.
Re-sheeting with imported granular material;
Repair potholes;
Undulations, water ponding & rutting - regrade surface;
Spay or remove weeds;
Remove groundcover vegetation.
Where RRT respond –RRT make safe within 3 days. or RRT repair within 10 business days.
Reduction in risk from hazards to pedestrians/path users;
Improving integrity an condition of asset;
Pavements uniform in shape with surface free from damage holes undulation, disruptions or displacements;
Improved Works programming.
CITY OF CHARLES STURT – PATHS/ACCESS RAMPS ASSET MANAGEMENT PLAN 2016
- 67 - Appendix B Draft Projected 2-year Capital Renewal and Replacement Works Program (Subject to change)
Path Renewal Suburb From To Estimated Area m²
Renewal Year
Morrell Street Allenby Gardens Allenby Gardens East Foster St 27 2015/2016 Tenth Street Bowden Bowden Drayton Gibson 166 2015/2016 Ninth Street Bowden Bowden Gibson Trembath St 227.2 2015/2016 Second Street Brompton Brompton Wood Ave Coglin St 315 2015/2016 Collins Reserve - Outer Fulham Gardens Fulham Gardens 377 2015/2016 Charles Sturt Avenue Grange Grange Lane 14 Lane 16 210 2015/2016 Frederick Road Grange Grange Sunset Cr Railway 40 2015/2016 Grange Road Grange Grange Kirkcaldy Av Michael St 166 2015/2016 Avro Avenue Hendon Hendon Sopwith Av Andrew St 166 2015/2016 De Haviland Avenue Hendon Hendon Sopwith Av Andrew St 73 2015/2016 De Haviland Avenue Hendon Hendon End Farman 148 2015/2016 De Haviland Avenue Hendon Hendon Andrew St Vickers Av 218 2015/2016 Avro Avenue Hendon Hendon 22M From Dead End Farman Av 304 2015/2016 Tapleys Hill Road Hendon Hendon 22M Sth. Of Denton St Denton St 101 2015/2016 Stewart Street Henley Beach Henley Beach Lane 37 Grange Rd 53 2015/2016 Military Road Henley Beach Henley Beach Lane 39 Reedie St 77 2015/2016 Bitumen - South Street Henley Beach Henley Beach No. 4 Military Rd 151 2015/2016 Military Road Henley Beach Henley Beach Marlborough S Foord Av 109 2015/2016 Victoria Street Henley Beach Henley Beach East Tc Wright St 164 2015/2016 East Terrace Henley Beach Henley Beach Lane 44 Chester St 48 2015/2016 Grange Road Henley Beach Henley Beach Seaview Rd Military Rd 131 2015/2016 Bitumen - River Street Hindmarsh Hindmarsh Adam West Adam East 297 2015/2016 Orsmond Street Hindmarsh Hindmarsh George St 43M East Of George St 58 2015/2016 Hindmarsh Avenue West Hindmarsh Hindmarsh Dead End Young Av 54 2015/2016 Bertie Street West Hindmarsh Hindmarsh 39M Sth Of Port Rd Port Rd 126 2015/2016 Albemarle Street West Hindmarsh Hindmarsh 37M Sth Of Port Rd Port Rd 99 2015/2016 Adam Street Hindmarsh Hindmarsh 168 2015/2016 Adam Street Hindmarsh Hindmarsh 145 2015/2016 Adam Street Hindmarsh Hindmarsh 78 2015/2016
CITY OF CHARLES STURT – PATHS/ACCESS RAMPS ASSET MANAGEMENT PLAN 2016
- 68 - Findon Road Kidman Park Kidman Park Keele Pl Adele Av 473 2015/2016 Grange Road Kidman Park Kidman Park No. 374A Milford St 214 2015/2016 Kelsey Street Kidman Park Kidman Park Morris St Hoskin Av 106 2015/2016 Collins Reserve - Outer Kidman Park Kidman Park 496 2015/2016 Collins Reserve - Outer Kidman Park 11 2015/2016 Torrens Road Kilkenny Kilkenny 68M East Of Regency Rd 99M East Of Regency Rd 34 2015/2016 Goodall Avenue Kilkenny Kilkenny Bollen St Regency 341 2015/2016 Share Street Kilkenny Kilkenny David Tc 7M West Of End 68 2015/2016 David Terrace Kilkenny Kilkenny Railway Line Kilkenny Road 40 2015/2016 David Terrace Kilkenny Kilkenny Share Street 20m Nth of Share Street 44 2015/2016 Pennington Gardens Reserve Pennington Pennington 42 2015/2016 Risely Avenue Royal Park Royal Park Opp. No. 1/16 No. 7-21 183.75 2015/2016 Tapleys Hill Road Royal Park Royal Park Dixon St Verge Narrows 137.7 2015/2016 Tapleys Hill Road Royal Park Royal Park Verge Widens Old Port 109.35 2015/2016 Wilson Street Royal Park Royal Park Bend Brandwood St 114 2015/2016 Tapleys Hill Road Royal Park Royal Park Poplar St No. 22 67.2 2015/2016 Allan Street Royal Park Royal Park Crighton Av No. 45 82.8 2015/2016 Tapleys Hill Road Royal Park Royal Park Kauper St Old Port 52.44 2015/2016 Tapleys Hill Road Royal Park Royal Park North Pde Old Port 55.35 2015/2016 Selkirk Avenue Seaton Seaton No. 20 No. 18 212.4 2015/2016 Clark Terrace Seaton Seaton Tapleys Hill Rd Clark Tce Est(Service Rd) 102.6 2015/2016 Green Avenue Seaton Seaton Raymond Alfred Av 150 2015/2016 Green Avenue Seaton Seaton Alfred Av End 123 2015/2016 Buchan Street Seaton Seaton Squires Janet St 216 2015/2016 Minns Street East Seaton Seaton Hallville St Lot. 83 86.4 2015/2016 Pioneer Street Seaton Seaton Findon Av Flavel St 137.7 2015/2016 Tapleys Hill Road Seaton Seaton Shandon Av Wilford Av 113.4 2015/2016 Commane Avenue Seaton Seaton Gregory Cr Trimmer 117.5 2015/2016 Corio Avenue Seaton Seaton Grange Willcocks 162 2015/2016 Tapleys Hill Road Seaton Seaton Russ Av Raymond Av 43.2 2015/2016 Findon Avenue Seaton Seaton Owen St Beatrice Av 143.1 2015/2016 Trimmer Parade Seaton Seaton Foot St Pioneer 160.65 2015/2016
CITY OF CHARLES STURT – PATHS/ACCESS RAMPS ASSET MANAGEMENT PLAN 2016
- 69 - Tapleys Hill Road Seaton Seaton Ballater Av Reedbeds Ct 137.7 2015/2016 Carley Reserve Seaton Seaton 65.76 2015/2016 Gordon Street Semaphore Park Semaphore Park No. 4 Granville St 117.45 2015/2016 Trust Reserve - Outer Semaphore Park Semaphore Park 261.9 2015/2016 Sir Alex Ramsey Reserve Semaphore Park Semaphore Park 214.65 2015/2016 Sir Alex Ramsey Reserve Semaphore Park Semaphore Park 304.5 2015/2016 Sir Alex Ramsey Reserve Semaphore Park Semaphore Park 93.15 2015/2016 Sir Alex Ramsey Reserve Semaphore Park Semaphore Park 93.15 2015/2016 Brocas Avenue St Clair St Clair Actil Av 11M East Of Actil 13.75 2015/2016 Audrey Street Tennyson Tennyson Seaview Military 58.8 2015/2016 Moredun Street Tennyson Tennyson Seaview Military 121.2 2015/2016 Military Road Tennyson Tennyson Moredun St Hillview Av 247.05 2015/2016 Military Road Tennyson Tennyson No. 81 Moredun St 70.8 2015/2016 Frederick Street Welland Welland Hindmarsh Av Gawler Av 319.2 2015/2016 Grange Road Welland Welland Frederick St Welland Av 172.8 2015/2016 Hindmarsh Avenue Welland Welland Frederick Welland Av 147.6 2015/2016 Rockingham Street West Beach West Beach No. 1 No. 11 99.6 2015/2016 Military Road West Beach West Beach Burbridge Rd 21M Nth Of Burbridge Rd 62.7 2015/2016 Newlands Drive West Beach West Beach Winston Cr Burbridge Rd 118.8 2015/2016 Bitumen - RTLP - Opie Reserve West Beach West Beach 363 2015/2016 Robert Street West Croydon West Croydon Brown Croydon 268.65 2015/2016 Robert Street West Croydon West Croydon Brown Croydon 267.3 2015/2016 Brown Street West Croydon West Croydon Herbert Rd Westbourne St 122.4 2015/2016 Brown Street West Croydon West Croydon Robert St Henry St 116.4 2015/2016 Alfred Road West Croydon West Croydon Carlyle Av Clarence St 108 2015/2016 Alfred Road West Croydon West Croydon Lincoln St Boston St 112.05 2015/2016 Turner Drive West Lakes West Lakes Car Park Entrance 4 W/L Boulevard 24 2015/2016 Footpath - Misc - Design Woodville 500 2015/2016 Owen Street Woodville North Woodville North York Thirteenth Av 120 2015/2016 York Place Woodville North Woodville North Woodmore St Hanson 82 2015/2016 Davis Street Woodville South Woodville South Haynes Cr Ledger 178.8 2015/2016
CITY OF CHARLES STURT – PATHS/ACCESS RAMPS ASSET MANAGEMENT PLAN 2016
- 70 - May Street Albert Park Albert Park Grace St Port 27 2016/2017 Coombe Road Allenby Gardens Allenby Gardens Maclagan Av Leane Av 110 2016/2017 Coombe Road Allenby Gardens Allenby Gardens Leane Av Price Weir Av 113 2016/2017 Coombe Road Allenby Gardens Allenby Gardens Maclagan Av Leane Av 112 2016/2017 Morrell Street Allenby Gardens Allenby Gardens Foster St Barham 117 2016/2017 East Avenue Allenby Gardens Allenby Gardens Brand Av Maclagan Av 269 2016/2017 East Avenue Allenby Gardens Allenby Gardens Leane Av Price Weir Av 131 2016/2017 Knight Street Allenby Gardens Allenby Gardens East Lewanick St 123 2016/2017 MacLagan Avenue Allenby Gardens Allenby Gardens East Coombe Rd 27 2016/2017 Reserve Allenby Gardens Reserve Allenby Gardens 12 2016/2017 Alison Street Athol Park Athol Park Alfreda St Adele St 125 2016/2017 Cooke Street Athol Park Athol Park Lavinia Athol 223 2016/2017 Woodlands Crescent Beverley Beverley Ledger Olveston Av 134 2016/2017 Main Street Beverley Beverley 109M Nth Of Grange Rd 92M Sth Of George St 27 2016/2017 Howards Road Beverley Beverley No. 8 Port 24 2016/2017 East Avenue Beverley Beverley Hubbard St Spring St 40 2016/2017 East Avenue Beverley Beverley Jeanes St Port 61 2016/2017 Gibson Street Bowden Bowden Thirteenth St Fourteeth 143 2016/2017 Drayton Street Bowden Bowden Fifth St Church St 85 2016/2017 Second Street Brompton Brompton Brown St Opp. Pickering St 211 2016/2017 Brown Street Brompton Brompton Second St Thornes Lane West 155 2016/2017 Chief Street Brompton Brompton Hawker Fifth St 27 2016/2017 Chief Street Brompton Brompton Ethelbert Sq Hawker 26 2016/2017 Coglin Street Brompton Brompton Hawker Fifth St 46 2016/2017 Seventh Avenue Cheltenham Cheltenham Colston Stroud St Sou 410 2016/2017 Buccleuch Avenue Findon Findon Centenary Av Lucerne 108 2016/2017 Field Court Findon Findon Reserve Pde Trimmer 169 2016/2017 Almond Avenue Findon Findon Amanda Av Lillian 104 2016/2017 McAllan Avenue Findon Findon Mill Buccleuch 109 2016/2017 Angley Avenue Findon Findon Mill Buccleuch 126 2016/2017 Winona Street Findon Findon Rondo Ave Findon Rd 24 2016/2017 Buccleuch Avenue Findon Findon Angley Mcallan 27 2016/2017
CITY OF CHARLES STURT – PATHS/ACCESS RAMPS ASSET MANAGEMENT PLAN 2016
- 71 - Drummond Avenue Findon Findon Angley Matheson Av 24 2016/2017 Beatty Street Flinders Park Flinders Park Holbrooks Laperouse 132 2016/2017 Jellicoe Street Flinders Park Flinders Park Torres Av Craddock St 129 2016/2017 Holbrooks Road Flinders Park Flinders Park 74M Nth Of Baudin Av 40M Sth Of Banks Av 112 2016/2017 Teak Street Flinders Park Flinders Park Hartley Collingwood 24 2016/2017 Tracey Avenue Flinders Park Flinders Park Belgrave Lilac 24 2016/2017 Blake Street Flinders Park Flinders Park Hartley Collingwood 30 2016/2017 Tapleys Hill Road Fulham Gardens Fulham Gardens Marlborough S Kent Av 127 2016/2017 Cheadle Street Fulham Gardens Fulham Gardens No. 27 Camillo Wy 24 2016/2017 Moore Drive Fulham Gardens Fulham Gardens Murphy St Gail 24 2016/2017 Shannon Street Fulham Gardens Fulham Gardens No. 24 Westminster 24 2016/2017 Porter Crescent Fulham Gardens Fulham Gardens Bolingbroke Murray St 108 2016/2017 Westminster Avenue Fulham Gardens Fulham Gardens Murray Shannon St 114 2016/2017 Everest Street Fulham Gardens Fulham Gardens Gault Av Hughes Av 127 2016/2017 Jamaica Avenue Fulham Gardens Fulham Gardens Joseph Av Debney St 379 2016/2017 Charles Sturt Avenue Grange Grange Lane 3 Terminus St 24 2016/2017 Sonia Street Grange Grange Rapson St Medallion Dr 47 2016/2017 Swan Street Grange Grange Lane 16 Jetty St 24 2016/2017 Derby Street Grange Grange Lane 23 Westmoreland 27 2016/2017 Surrey Street Grange Grange Lane 25 No. 2/47-49 24 2016/2017 Grange Road Grange Grange No. 659 Wilson Ct 50 2016/2017 Jetty Street Grange Grange No.10 Charles Sturt 24 2016/2017 Military Road Grange Grange No. 320 Terminus St 32 2016/2017 Gurner Terrace Grange Grange Lane 2 Fort St 24 2016/2017 Charles Sturt Avenue Grange Grange Lane 2 Fort St 27 2016/2017 Trimmer Parade Grange Grange Fort St No. 243 24 2016/2017 Yacht Place Grange Grange Galleon St Frederick Rd 27 2016/2017 Clayton Drive Grange Grange C/Sac End W Frederick St 24 2016/2017 Sopwith Avenue Hendon Hendon Tapleys Hill Dehavilland Av 24 2016/2017 Andrew Street Hendon Hendon Tapleys Hill Dehavilland Av 269 2016/2017 Avro Avenue Hendon Hendon Farman Sopwith Av 121 2016/2017 De Haviland Avenue Hendon Hendon Farman Sopwith Av 126 2016/2017
CITY OF CHARLES STURT – PATHS/ACCESS RAMPS ASSET MANAGEMENT PLAN 2016
- 72 - Vickers Avenue Hendon Hendon 59M East Of Dehavilland Avro 108 2016/2017 Marlborough Street Henley Beach Henley Beach Mitton Av No. 58 24 2016/2017 Anthony Street Henley Beach Henley Beach Reedie St Lane 31 24 2016/2017 Stewart Street Henley Beach Henley Beach Lane 38 Lane 37 24 2016/2017 Cudmore Terrace Henley Beach Henley Beach Marlborough S Grange Rd 27 2016/2017 Mitton Avenue Henley Beach Henley Beach Marlborough Margaret St 479 2016/2017 East Terrace Henley Beach Henley Beach Beck St Victoria St 128 2016/2017 Mitton Avenue Henley Beach Henley Beach Bolingbroke Murray St 109 2016/2017 Reedie Street Henley Beach Henley Beach Stewart St East Tc 109 2016/2017 Mitton Avenue Henley Beach Henley Beach Margaret St Belfast St 109 2016/2017 Grange Road Henley Beach Henley Beach Military Rd Anthony St 337 2016/2017 Hoy Crescent Henley Beach Henley Beach Cudmore Tc Bend 112 2016/2017 Cudmore Terrace Henley Beach Henley Beach Varcoe St Hoy Cr 102 2016/2017 Harrison Street Henley Beach Henley Beach Chambers St Cudmore Tc 130 2016/2017 Franklin Street Henley Beach Henley Beach East Tc No. 8 118 2016/2017 Henley Beach Road Henley Beach South Henley Beach South 65M East Of Military Rd No. 6/35 24 2016/2017 Burford Road Henley Beach South Henley Beach South No. 13 Gilmore Rd 24 2016/2017 Lexington Road Henley Beach South Henley Beach South No. 28 Burnley St 24 2016/2017 Burford Road Henley Beach South Henley Beach South Gilmore Rd 32M Sth Of Hmas Aust. Rd 24 2016/2017 Henley Beach Road Henley Beach South Henley Beach South Rodgers Av Yeomans Av 106 2016/2017 Susan Street Hindmarsh Hindmarsh Bacon St Holden 27 2016/2017 Mary Street Hindmarsh Hindmarsh Manton Orsmond St 252 2016/2017 Drayton Street Hindmarsh Hindmarsh Port Rd D/End 113 2016/2017 Margaret Street Kidman Park Kidman Park Frogmore Opal St 24 2016/2017 Grange Road Kidman Park Kidman Park Frogmore Rd 53M West Of Findon Rd 24 2016/2017 Miller Street Kidman Park Kidman Park Walter Sydney 24 2016/2017 Morris Street Kidman Park Kidman Park Sydney Kelsey 24 2016/2017 Sydney Avenue Kidman Park Kidman Park Miller St Kidman 27 2016/2017 Hoskin Avenue Kidman Park Kidman Park Bend Kidman Av 107 2016/2017 Valetta Road Kidman Park Kidman Park Stokes Cr Park Dr 113 2016/2017 Bollen Street Kilkenny Kilkenny End Goodall 24 2016/2017 Downer Street Kilkenny Kilkenny Coles St Copley St 121 2016/2017
CITY OF CHARLES STURT – PATHS/ACCESS RAMPS ASSET MANAGEMENT PLAN 2016
- 73 - Hassell Street Kilkenny Kilkenny Poplar St Ash St 126 2016/2017 Hanson Road Kilkenny Kilkenny Torrens Rd Blackburn Ct 359 2016/2017 Noble Street Ovingham Ovingham Gilbert Telford St( West) 103 2016/2017 Park Avenue Pennington Pennington Torrens Cr Windsor Av 27 2016/2017 Grand Junction Road Pennington Pennington Price Av Ariel St 27 2016/2017 Boyd Street Pennington Pennington Clay Ct Grand Junction Rd 27 2016/2017 Grand Junction Road Pennington Pennington 67M East Of Addison No. 180 62 2016/2017 Princess Street Pennington Pennington Torrens Wynette 27 2016/2017 Tulloch Avenue Pennington Pennington Butler Arthur 24 2016/2017 Alfred Street Pennington Pennington Helen Hodgeman 124 2016/2017 Addison Road Pennington Pennington No. 46 Butler 120 2016/2017 Price Avenue Pennington Pennington No. 24 Grand Junction Rd 117 2016/2017 Bell Street Pennington Pennington Butler Arthur 247 2016/2017 Price Avenue Pennington Pennington Arthur Stonehaven 117 2016/2017 Butler Avenue Pennington Pennington Addison Gilligan St 119 2016/2017 McQuillan Avenue Renown Park Renown Park Swan Ct Cavan Av 27 2016/2017 St Johns Avenue Renown Park Renown Park Gosport Mcquillan Av 27 2016/2017 Exeter Terrace Renown Park Renown Park Gosport St Mcquillan Av 123 2016/2017 Palmer Court Renown Park Renown Park No.36 No.30 120 2016/2017 Stacey Place Renown Park Renown Park Ashman Av D/End North 107 2016/2017 Bishop Street Renown Park Renown Park Wright St Harrison Rd 267 2016/2017 Baker Street Renown Park Renown Park Torrens Mcquillan 126 2016/2017 Risely Avenue Royal Park Royal Park Opp. No. 7-21 Oak 24 2016/2017 Cedar Avenue Royal Park Royal Park Bend Tapleys Hill 138 2016/2017 Maple Avenue Royal Park Royal Park Myrtle St Pine 222 2016/2017 Frederick Road Royal Park Royal Park Cooke Cr 54M Sth Of Wilson St 123 2016/2017 Tapleys Hill Road Royal Park Royal Park Pine No. 58 103 2016/2017 Royal Terrace Royal Park Royal Park Frederick Cook 121 2016/2017 Grange Road Seaton Seaton Leven Av Montrose Av 27 2016/2017 Airdrie Avenue Seaton Seaton Kingborn Falkirk 24 2016/2017 Parkhouse Avenue Seaton Seaton Leven Fortrose 24 2016/2017 Matthews Avenue Seaton Seaton Small St Tapleys Hill 24 2016/2017
CITY OF CHARLES STURT – PATHS/ACCESS RAMPS ASSET MANAGEMENT PLAN 2016
- 74 - Prior Avenue Seaton Seaton Wilford Av No. 5 24 2016/2017 Meakin Terrace Seaton Seaton Reserve Path Meakin Tce (E) 24 2016/2017 Gleneagles Court Seaton Seaton Opp. No 18 End 24 2016/2017 Frederick Road Seaton Seaton No. 4/2 Middleton Dr 24 2016/2017 Willcocks Avenue Seaton Seaton Corio Av No. 33 27 2016/2017 Carley Crescent Seaton Seaton Fairway No. 15 24 2016/2017 Parker Avenue Seaton Seaton Childs Av Slade Pl 24 2016/2017 Trimmer Parade Seaton Seaton No. 1/86-96 Todville 27 2016/2017 Rositano Avenue Seaton Seaton Kingborn Falkirk 24 2016/2017 Todville Street Seaton Seaton Honeyton St Levistone 27 2016/2017 Winser Avenue Seaton Seaton Selkirk Fortrose 24 2016/2017 Elaine Avenue Seaton Seaton Bend Shandon Av 24 2016/2017 Findon Avenue Seaton Seaton Tapleys Hill Commane 27 2016/2017 Fourth Avenue Seaton Seaton Morley Stevens 115 2016/2017 Commane Avenue Seaton Seaton Findon Av Gregory Cr 123 2016/2017 Findon Avenue Seaton Seaton Commane Foot St 143 2016/2017 Gregory Crescent Seaton Seaton Jennifer St Gurrs Rd 115 2016/2017 Frederick Road Seaton Seaton Glenburnie St Matthews Av 107 2016/2017 Tapleys Hill Road Seaton Seaton Matthews Pedlar 117 2016/2017 Seaton Terrace Seaton Seaton Frederick Lily Av 116 2016/2017 Squires Avenue Seaton Seaton Tapleys Hill Selkirk Av 138 2016/2017 Squires Avenue Seaton Seaton Fortrose Av Kinross Av 143 2016/2017 Squires Avenue Seaton Seaton Kinross Av Kingborn 104 2016/2017 Tomkinson Road Semaphore Park Semaphore Park Granville St Fairford 24 2016/2017 Trust Reserve Link Bartley Terrace Semaphore Park Semaphore Park 152M Nth Of Eagle Ct 70M Sth Of Lower 270 2016/2017
Bartley Terrace Semaphore Park Semaphore Park 70M Sth Of Lower Lower 86.4 2016/2017 Bartley Terrace Semaphore Park Semaphore Park Eagle Ct 152M Nth Of Eagle Ct 184.8 2016/2017 Bartley Terrace Semaphore Park Semaphore Park Lower Bower 235.2 2016/2017 Bartley Terrace Semaphore Park Semaphore Park Dotterel Dr Pelican 127.2 2016/2017 Bartley Terrace Semaphore Park Semaphore Park Kingfisher Dr Bower 102 2016/2017 Bartley Terrace Semaphore Park Semaphore Park Pelican Kingfisher Dr 552 2016/2017
CITY OF CHARLES STURT – PATHS/ACCESS RAMPS ASSET MANAGEMENT PLAN 2016
- 75 - Arlington Terrace Welland Welland Grange Bond St 27 2016/2017 Arlington Terrace Welland Welland Fischer St Port 27 2016/2017 Seaview Road West Beach West Beach Mellor St Bridge(Sth) 24 2016/2017 Robert Street West Croydon West Croydon Brown Croydon 267 2016/2017 Brown Street West Croydon West Croydon Robert St Henry St 116 2016/2017 Carlyle Avenue West Croydon West Croydon Bend Clarence St 108 2016/2017 Kingsley Avenue West Croydon West Croydon Clarence St 17M East Of Clarence St 19 2016/2017 Port Road West Croydon West Croydon 224M West Of Jane St 201M West Of Jane St 78 2016/2017 Rosetta Street West Croydon West Croydon Port Rd 23M Nth Of Port Rd 55 2016/2017 Rosetta Street West Croydon West Croydon 40M Sth Of Euston Tce Euston Tce 50 2016/2017 Port Road West Croydon West Croydon 90M East Of Garnet St 94M West Of Minnie St 82 2016/2017 Musgrave Avenue West Hindmarsh West Hindmarsh 123M West Of Mcdonnell Av Mcdonnell Av 163 2016/2017 RTLP - John Keeley Reserve West Hindmarsh West Hindmarsh 39 2016/2017 Eildon Court West Lakes West Lakes Lakeview No. 1 36 2016/2017 Sir John Marks Drive West Lakes West Lakes Opp. No. 59 Opp. No. 53-55 110 2016/2017 Walkway - West Lakes West Lakes Mariners Cr Frederick St 31 2016/2017 Walkway - West Lakes West Lakes Sims Cr Sportsmans Dr 73 2016/2017 Walkway - West Lakes West Lakes Frome Cr Lakeview Av 425 2016/2017 Frederick Street West Lakes West Lakes Windemere Av Crampton 165 2016/2017 Lakeview Avenue West Lakes West Lakes Eildon Ct Yampi Pl 112 2016/2017 Lochside Drive West Lakes West Lakes Woodlake Av Frederick St 271 2016/2017 Lochside Drive West Lakes West Lakes Tiranna Way Kamo Wy 29 2016/2017 Mary Ann Street West Lakes West Lakes Lord Hobart Hero 41 2016/2017 Reserve Woodlake Reserve West Lakes West Lakes 18 2016/2017 Reserve Maramba East Reserve West Lakes West Lakes 14 2016/2017 Reserve Martinique Court Walkway West Lakes West Lakes 7 2016/2017 Reserve West Lakes West Lakes 21 2016/2017 Reserve Eights Reserve West Lakes West Lakes 18 2016/2017 Reserve Scullers Reserve West Lakes West Lakes 90 2016/2017 Reserve Fisher Reserve West Lakes West Lakes 23 2016/2017 Reserve West Lakes West Lakes 18 2016/2017 Corcoran Drive West Lakes West Lakes Keppel Gr Harbour Ct 24 2016/2017
CITY OF CHARLES STURT – PATHS/ACCESS RAMPS ASSET MANAGEMENT PLAN 2016
- 76 - Reserve Annie Watt Reserve West Lakes Shore West Lakes Shore 201 2016/2017 Military Road West Lakes Shore West Lakes Shore The Annie Watt Cct West Lakes Bvd 29 2016/2017 Dawe Court West Lakes Shore West Lakes Shore Newcombe End 35 2016/2017 Newcombe Avenue West Lakes Shore West Lakes Shore Bartley Tce Laver Cr 105 2016/2017 Varram Way West Lakes Shore West Lakes Shore Kiama Edwin St 16 2016/2017 Reserve Midcourse Reserve West Lakes Shore West Lakes Shore 38 2016/2017 Neighbourhood Reserve South West Lakes Shore West Lakes Shore 16 2016/2017 Reserve West Lakes Shore West Lakes Shore 85 2016/2017 Fairford Terrace Walkway West Lakes Shore West Lakes Shore 28 2016/2017 Military Road West Lakes Shore West Lakes Shore Opp Lakeside Elanora 24 2016/2017 Military Road West Lakes Shore West Lakes Shore Dune Ct Shore Ct 24 2016/2017 Newcombe Avenue West Lakes Shore West Lakes Shore Boyd Cr Dawe Ct 24 2016/2017 Lambert Avenue West Lakes Shore West Lakes Shore Nw Bend No. 23 24 2016/2017 Bartley Terrace West Lakes Shore West Lakes Shore Varram Wy Hawkesbury 24 2016/2017 Bartley Terrace West Lakes Shore West Lakes Shore Greenfield Cr Eagle Ct 405 2016/2017 Hughes Street North Woodville Woodville Florence St Leslie St Eas 119 2016/2017 Hughes Street North Woodville Woodville Stanley St Beaufort St 116 2016/2017 Rowley Terrace Woodville Woodville Port Rd 34M East Of Port Rd 58 2016/2017 Woodville Road Garden Beds Woodville Woodville 5 2016/2017 Woodville Road Garden Beds Woodville Woodville 94 2016/2017 McColl Street Woodville Woodville Dead End Hughes North 30 2016/2017 Park Street North Woodville Woodville Belmore Stanley St 268 2016/2017 Footpath - Misc - Design Woodville 100 2016/2017 Maramba Avenue West Lakes Woodville Lakes Marlee Ct Frederick St 13 2016/2017 Woodville Road Woodville North Woodville North Vee Dr(Sth) Vee Dr(Nth) 20 2016/2017 Hanson Road Woodville North Woodville North 26M Sth Of Lincoln St Lincoln St 35 2016/2017 Hanson Road Woodville North Woodville North No. 107 Thirteenth Av 55 2016/2017 Burwood Avenue Woodville North Woodville North Torrens 80M Nth Of Torrens 94 2016/2017 Burleigh Avenue Woodville North Woodville North 184M West Of Audley St 58M West Of Audley St 150 2016/2017 Hanson Road Woodville North Woodville North Ninth No. 171-171A 65 2016/2017 Burwood Avenue Woodville North Woodville North 80M Nth Of Torrens Sheridan 366 2016/2017 Hanson Road Woodville North Woodville North No. 11 Leo St 105 2016/2017
CITY OF CHARLES STURT – PATHS/ACCESS RAMPS ASSET MANAGEMENT PLAN 2016
- 77 - Burwood Avenue Woodville North Woodville North Torrens Adit St 370 2016/2017 Reserve Sparrow Reserve Woodville North Woodville North 4 2016/2017 Audley Street Woodville North Woodville North 124M Sth Of Burleigh Av Burleigh Av 121 2016/2017 Tenth Avenue Woodville North Woodville North Thirteenth Ninth 28 2016/2017 Twelfth Avenue Woodville North Woodville North Fourteenth Av Ninth 24 2016/2017 Park Street North Woodville Park Woodville Park Beaufort St Ranelagh St 128 2016/2017 Curtis Street Woodville South Woodville South Cedar Church 95 2016/2017 Findon Road Woodville South Woodville South Woodville Rd Evans St 737 2016/2017 Reserve Woodville Oval Woodville South Woodville South 24 2016/2017 Lucas Street Woodville South Woodville South Esk Cheviot St 27 2016/2017 Cedar Avenue Woodville South Woodville South Curtis St Oval 28 2016/2017 Claire Street Woodville West Woodville West Levi St James St 143 2016/2017 May Street Woodville West Woodville West Lewis Calendar Pl 102 2016/2017 Lawton Crescent Woodville West Woodville West Alma South Alma North 178 2016/2017 Todville Street Woodville West Woodville West Bend(West) Elizabeth St 103 2016/2017 May Street Woodville West Woodville West Elizabeth St Pitman Av 27 2016/2017 Jean Street Woodville West Woodville West No. 10 Patricia 24 2016/2017 Findon Road Woodville West Woodville West No. 3/ 86-94 Patricia St 27 2016/2017 Ryan Avenue Woodville West Woodville West Jean St Findon 27 2016/2017 Sage Crescent Woodville West Woodville West Ryan Findon 24 2016/2017 Truro Place Woodville West Woodville West Trimmer End 24 2016/2017 Went Street Woodville West Woodville West End Lachlan Av 34 2016/2017 Beryl Street Woodville West Woodville West Lewis Calendar Pl 24 2016/2017 Claire Street Woodville West Woodville West James St Green Rd 143 2016/2017 May Street Woodville West Woodville West Shirley Av Holden Av 103 2016/2017 Nicholls Terrace Woodville West Woodville West Ryan Elizabeth 105 2016/2017
Sportsmans Drive West Lakes West Lakes Trimmer Beeston Wy 1115 2016/2017 Tapleys Hill Road Seaton Seaton Reedbeds Ct Squires Av 275.4 2016/2017
Torrens Road St Clair St Clair Cheltenham Pd 371M Est Of Cheltenham Pd 499.5 2016/2017
Tapleys Hill Road Fulham Gardens Fulham Gardens Sharpes Av Cheadle St 376.65 2016/2017 Findon Road Kidman Park Kidman Park 273M Sth Of Valetta Rd Valetta Rd 325.2 2016/2017
CITY OF CHARLES STURT – PATHS/ACCESS RAMPS ASSET MANAGEMENT PLAN 2016
- 78 -
Jamaica Avenue Fulham Gardens Fulham Gardens Keith Av Craig 372.6 2016/2017 Actil Avenue St Clair St Clair Leslie St Wes Torrens 135 2016/2017
Port Road Median 3 Albert Park ALBERT PARK 255 2017/2018 Port Road Median 3 Albert Park ALBERT PARK 255 2017/2018 Farman Avenue Albert Park ALBERT PARK Avro Av Spad St 112.05 2017/2018 Port Road Median 2 Allenby Gardens ALLENBY GARDENS 344 2017/2018 Coombe Road Allenby Gardens ALLENBY GARDENS Knight St Brand Av 416.4 2017/2018 Birdwood Avenue Allenby Gardens ALLENBY GARDENS Coombe Rd Way 264 2017/2018 Leane Avenue Allenby Gardens ALLENBY GARDENS East Coombe 224.1 2017/2018 Coombe Road Allenby Gardens ALLENBY GARDENS Price Weir Av Port 291.6 2017/2018 Grange Road Allenby Gardens ALLENBY GARDENS Torres Av Hallett St 209.25 2017/2018 Lewanick Street Allenby Gardens ALLENBY GARDENS Knight Brand Av 291.6 2017/2018 Charles Street Allenby Gardens ALLENBY GARDENS Torres Maude 117.6 2017/2018 Glenroy Street Athol Park ATHOL PARK Park Millicent 508.8 2017/2018 Lavinia Street Athol Park ATHOL PARK William St Hanson 313.2 2017/2018 Howards Road Beverley BEVERLEY No. 52-54 No. 20 400.8 2017/2018 Main Street Beverley BEVERLEY Jeanes West St 200.4 2017/2018 Wodonga Street Beverley BEVERLEY Woolgina St End 123.6 2017/2018 Toogood Avenue Beverley BEVERLEY Ledger Rd Charles Rd 592.8 2017/2018 Lancelot Street Beverley BEVERLEY Pope Charles 122.4 2017/2018 East Avenue Beverley BEVERLEY Mclean St George St 338.85 2017/2018 East Avenue Beverley BEVERLEY Watson St Willsmore St 90.45 2017/2018 Gibson Street Bowden BOWDEN Eleventh St Hawker St 161.2 2017/2018 Drayton Street Bowden BOWDEN Tenth St Eleventh St 112.2 2017/2018 Eighth Street Bowden BOWDEN Gibson Trembath St 223.5 2017/2018 Wattle Street Brompton BROMPTON Fifth Torrens 232.2 2017/2018 Drayton Street Brompton BROMPTON East Bike Path 152 2017/2018 First Avenue Cheltenham CHELTENHAM Woodstock St Tewkesbury 167.4 2017/2018 Haddy Street Cheltenham CHELTENHAM Cricksdale Wotten 163.35 2017/2018 Buller Terrace Cheltenham CHELTENHAM 73M East Of High St Cheltenham 103.75 2017/2018 Woodstock Street Cheltenham CHELTENHAM First Av Second 94.5 2017/2018
CITY OF CHARLES STURT – PATHS/ACCESS RAMPS ASSET MANAGEMENT PLAN 2016
- 79 -
Woodstock Street Cheltenham CHELTENHAM Stroud St Sou First Av 94.5 2017/2018 Stroud Street North Cheltenham CHELTENHAM 45M Nth Of Buller Tce Torrens 522.45 2017/2018 Port Road Cheltenham CHELTENHAM 81M West Of Stroud Sth Stroud St Sou 109.35 2017/2018 South Road Croydon CROYDON Port Princes St 99.9 2017/2018 Queen Street Croydon Croydon Princes St Euston 139.05 2017/2018 Thomas Street Croydon Croydon Day Tce Robert St 106.65 2017/2018 Scotia Street Croydon Croydon Ellen South Rd 162 2017/2018 Elizabeth Street Croydon Croydon Cedar Av Harriet 126.9 2017/2018 Thomas Street Croydon Croydon William St Cedar Av 129.6 2017/2018 Thomas Street Croydon Croydon Harriet St Hurtle St 128.25 2017/2018 Queen Street Croydon CROYDON Princes St Euston 145.8 2017/2018 Port Road Croydon CROYDON Minnie St King St 93.15 2017/2018 King Street Croydon CROYDON Port Rd Princes St 89.1 2017/2018 Henry Street Croydon CROYDON Elizabeth St South Rd 209.25 2017/2018 Findon Road Findon FINDON Angley Av Chapman St 176.85 2017/2018 Findon Road Findon FINDON Chapman St Matheson Av 332.1 2017/2018 Crittenden Road Findon FINDON Bernard St Birch St 113.4 2017/2018 David Avenue Findon FINDON Adamson Av Dunn 105.6 2017/2018 Balcombe Avenue Findon FINDON Tyrie Av Findon 260.4 2017/2018 Chapman Street Findon FINDON David Findon 111.6 2017/2018 Reserve Parade Findon FINDON Judith Av Tweed Av 186 2017/2018 Trimmer Parade Findon FINDON Pioneer Arooma St 108 2017/2018 Trimmer Parade Findon FINDON Cameron Av Cul-D-Sac 95.85 2017/2018 Trimmer Parade Findon FINDON Cul-D-Sac Judith Av 97.2 2017/2018 Trimmer Parade Findon FINDON Judith Av Cul-D-Sac 94.5 2017/2018 Bardia Avenue Findon FINDON No. 6 Findon 92.4 2017/2018 Dominion Avenue Findon FINDON Buccleuch Av Bend 87.6 2017/2018 St Albyns Street Findon FINDON Telford Av Rondo 193.2 2017/2018 Angley Avenue Findon FINDON Mill Ruth St 86.4 2017/2018 Washington Crescent Findon FINDON Bend Findon 102.6 2017/2018 Holbrooks Road Flinders Park FLINDERS PARK Beatty St Jellicoe St 240.3 2017/2018 Flinders Parade Flinders Park FLINDERS PARK Thistle Av Greville Av 242.4 2017/2018
CITY OF CHARLES STURT – PATHS/ACCESS RAMPS ASSET MANAGEMENT PLAN 2016
- 80 -
Flinders Parade Flinders Park FLINDERS PARK Douglas St Van Dieman St 84 2017/2018 Kanbara Street Flinders Park FLINDERS PARK Parukala St Hartley 216 2017/2018 Nelson Avenue Flinders Park FLINDERS PARK Frobisher Av Franklin Av 120 2017/2018 Catherine Avenue Flinders Park FLINDERS PARK Belgrave Lilac 236.4 2017/2018 Parana Street Flinders Park FLINDERS PARK Kanbara Culdesac 226.8 2017/2018 Hartley Road Flinders Park FLINDERS PARK Howard St Greville Av 132.3 2017/2018 Jellicoe Street Flinders Park FLINDERS PARK Holbrooks Laperouse Av 118.8 2017/2018 Malcolm Street Flinders Park FLINDERS PARK Dillon Grange 382.8 2017/2018 Belgrave Avenue Flinders Park FLINDERS PARK Jarman Tce Brentwood 133.65 2017/2018 Ingrid Avenue Flinders Park FLINDERS PARK Lilac Abelia 76.8 2017/2018 Torres Avenue Flinders Park FLINDERS PARK Mountbatten Beatty St 118.5 2017/2018 Holbrooks Road Flinders Park FLINDERS PARK Baudin Av 74M Nth Of Baudin Av 98.55 2017/2018 Marlborough Street Fulham Gardens FULHAM GARDENS Lancaster Av Marlborough P 217.2 2017/2018 Marlborough Street Fulham Gardens FULHAM GARDENS Marlborough P Tapleys Hill 200.4 2017/2018 Madeline Crescent Fulham Gardens FULHAM GARDENS Little Av Pandil Ct 270 2017/2018 Coppins Terrace Fulham Gardens FULHAM GARDENS Somerset Av Jasmine Gr 300 2017/2018 Grange Road Fulham Gardens FULHAM GARDENS Messenger Rd Kidman Av 272.7 2017/2018 Dorset Avenue Fulham Gardens FULHAM GARDENS Devonshire York Av 186 2017/2018 Murray Street Fulham Gardens FULHAM GARDENS Mitton Av Westminster A 307.2 2017/2018 Marlborough Street Fulham Gardens FULHAM GARDENS No. 58 Marlborough C 195.6 2017/2018 Coppins Terrace Fulham Gardens FULHAM GARDENS Tapleys Hill Somerset Av 120 2017/2018 Motley Avenue Fulham Gardens FULHAM GARDENS Debney St 67M East Of Debney St 89.1 2017/2018 Fort Street Grange GRANGE Cannes Av Trimmer 144 2017/2018 Frederick Street Grange GRANGE Hogben St Jetty St 297.6 2017/2018 Brogan Court Grange GRANGE End (West) Sunset Cr 286.4 2017/2018 Cannes Avenue Grange GRANGE Monaco Fort 82.8 2017/2018 Pierce Street Grange GRANGE Matthew St Beach St 182.25 2017/2018 Military Road Grange GRANGE Connaught St Albany St 66 2017/2018 Monaco Crescent Grange GRANGE No. 2 No. 8 105.6 2017/2018 Pine Lodge Reserve Grange GRANGE 98.75 2017/2018 Military Road Grange GRANGE Albany St Lane 1 82.8 2017/2018 Old Port Reach Reserve Grange GRANGE 182.4 2017/2018
CITY OF CHARLES STURT – PATHS/ACCESS RAMPS ASSET MANAGEMENT PLAN 2016
- 81 -
Avro Avenue Hendon HENDON Andrew St Vickers Av 111.25 2017/2018 Avro Avenue Hendon HENDON Vickers Av Davidson 107.5 2017/2018 De Haviland Avenue Hendon HENDON Sopwith Av Andrew St 117.6 2017/2018 North Street Henley Beach HENLEY BEACH East Tc Wright St 170.4 2017/2018 Thompson Street Henley Beach HENLEY BEACH Jeanes St Gale St 142.8 2017/2018 Whibley Street Henley Beach HENLEY BEACH Mitchell St Griffiths St 80.4 2017/2018 White Street Henley Beach HENLEY BEACH Henley Beach Charles St 204 2017/2018 White Street Henley Beach HENLEY BEACH South St Atkin St 175.2 2017/2018 Varcoe Street Henley Beach HENLEY BEACH Cudmore Tc North St 186 2017/2018 Mitton Avenue Henley Beach HENLEY BEACH Murray St Shannon St 86.4 2017/2018 Stewart Street Henley Beach HENLEY BEACH Lane 36 Lane 34 289.2 2017/2018 Henley Beach Road Henley Beach HENLEY BEACH No. 12-14 White St 74.4 2017/2018 Hoy Crescent Henley Beach HENLEY BEACH Cudmore Tc Bend 100.8 2017/2018 White Street Henley Beach HENLEY BEACH Atkin St Reserve 80.4 2017/2018 South Street Henley Beach HENLEY BEACH No. 286 Military Rd 203 2017/2018
Gilmore Road Henley Beach South HENLEY BEACH SOUTH Hazel Tce Burford Rd 127.2 2017/2018
Halsey Road Henley Beach South HENLEY BEACH SOUTH Aylwin St Sims St 108 2017/2018
Seaview Road Henley Beach South HENLEY BEACH SOUTH Esplanade Lexington Rd 392.85 2017/2018
Halsey Road Henley Beach South HENLEY BEACH SOUTH Bode St Burnley St 101.25 2017/2018
Halsey Road Henley Beach South HENLEY BEACH SOUTH Canberra St Aylwin St 106.65 2017/2018
Fletcher Road Henley Beach South HENLEY BEACH SOUTH Yorktown Cr Burnley St 110.7 2017/2018
Richard Street Hindmarsh HINDMARSH Holden St Chapel St 248.4 2017/2018 Nile Street Hindmarsh HINDMARSH Adam Richard 100.1 2017/2018 Orsmond Street Hindmarsh HINDMARSH South Rd George St 321.3 2017/2018 Richard Street Hindmarsh HINDMARSH Nile St Manton St 315.9 2017/2018 First Street Hindmarsh HINDMARSH Station Gibson St 118.4 2017/2018 Alfrina Street Kidman Park KIDMAN PARK Dean Frogmore 235.2 2017/2018 Kidman Avenue Kidman Park KIDMAN PARK Hart Av Kidman Av C/S 105.3 2017/2018
CITY OF CHARLES STURT – PATHS/ACCESS RAMPS ASSET MANAGEMENT PLAN 2016
- 82 -
Keele Place Kidman Park KIDMAN PARK End Findon 156 2017/2018 Lock Street Kidman Park KIDMAN PARK Hoskin Kidman 109.35 2017/2018 Olympia Street Kidman Park KIDMAN PARK Frogmore End 439.2 2017/2018 Walkway - Concrete - Kidman Park KIDMAN PARK Olympia St Fergusson Av 230.75 2017/2018 Bryan Avenue Kilkenny KILKENNY Tarcowie Myponga 187.2 2017/2018 Mundulla Street Kilkenny KILKENNY Arkaba Rd Aroona North 218.4 2017/2018 Yallum Terrace Kilkenny KILKENNY Grayson Copley St 177.6 2017/2018 Port Road Kilkenny KILKENNY David Tc Aroona Rd 121.5 2017/2018 Wilpena Terrace Kilkenny KILKENNY Pinda St Mundulla St 83.7 2017/2018 Copley Street Kilkenny KILKENNY Downer St Torrens 87.6 2017/2018 Reynell Street Kilkenny KILKENNY Shearer St Aroona 98.4 2017/2018 Noble Street Ovingham OVINGHAM Telford St( East) Park 88.8 2017/2018 Stonehaven Street Pennington PENNINGTON Price Av No. 41 225.45 2017/2018 Gilligan Street Pennington PENNINGTON Butler Sinclair Sq(Sth) 98.55 2017/2018 Boyd Street Pennington PENNINGTON Stonehaven St Clay Ct 94.5 2017/2018 Arthur Street Pennington PENNINGTON Bell St Alderman Av 105.3 2017/2018 Butler Avenue Pennington PENNINGTON No. 20-20A Butler Ct 91.2 2017/2018 Cavan Avenue Renown Park RENOWN PARK Mcquillan End 148.5 2017/2018 Lamont Street Renown Park Renown Park Tait St South Rd 324 2017/2018 Ferris Street Renown Park RENOWN PARK Tait Bishop 203.85 2017/2018 Ashman Avenue Renown Park RENOWN PARK Stacey Exeter 177.6 2017/2018 Monmouth Street Ridleyton RIDLEYTON Henry Moss Ct Wood Av 109.35 2017/2018 Wilson Street Royal Park ROYAL PARK Frederick Symonds St 319.2 2017/2018 Maple Avenue Royal Park ROYAL PARK Poplar St Clovelly 325.2 2017/2018 Wilson Street Royal Park ROYAL PARK Brandwood St Port 427.2 2017/2018 Maple Avenue Royal Park ROYAL PARK Gum St Myrtle 148.8 2017/2018 Crighton Avenue Royal Park ROYAL PARK Frederick Arnold St 159.6 2017/2018 Amos Way Royal Park ROYAL PARK No. 7 Risley 97.2 2017/2018 Frederick Road Royal Park ROYAL PARK North Pde Crighton Av 87.6 2017/2018 Poplar Street Royal Park ROYAL PARK Crown Palm Av 87.75 2017/2018 Pine Street Royal Park ROYAL PARK Palm Av Maple Av 78 2017/2018 Wattle Avenue Royal Park ROYAL PARK Kauper St Dixon 110.7 2017/2018
CITY OF CHARLES STURT – PATHS/ACCESS RAMPS ASSET MANAGEMENT PLAN 2016
- 83 -
Raymond Avenue Seaton SEATON Green Av Raymond Lane 222 2017/2018 Squires Avenue Seaton SEATON Buchan St Owen St 247.05 2017/2018 Findon Avenue Seaton SEATON Tapleys Hill Commane 136.35 2017/2018 Grange Road Seaton SEATON Milvera Tce Tapleys Hill Rd 292.95 2017/2018 Kingborn Avenue Seaton SEATON Singleton Av Lanark 114.75 2017/2018 Milvera Terrace Seaton SEATON Willcocks Elaine Av 84 2017/2018
CITY OF CHARLES STURT – PATHS/ACCESS RAMPS ASSET MANAGEMENT PLAN 2016
- 84 -
Appendix C Projected Upgrade/Exp/New 10-year Capital Works Program
Charles Sturt CC Projected Capital Renewal Works Program - Path_Ramps_Aug2015_S2_V1
($000) Year Item Description Estimate 2015 Network Renewals
1 Paths - kerb ramp renewal DDA $450 2 Paths - large area renewal slabs $897 3 Paths - large area renewal pavers $418 4 Paths - renewal as identified in Asset Register $3,000
2015 Defect Repairs 2015 Total $4,765 2016 Network Renewals
1 Paths - kerb ramp renewal DDA $450 2 Paths - large area renewal slabs $897 3 Paths - large area renewal pavers $418 4 Paths - renewal as identified in Asset Register $4,000
2016 Defect Repairs 2016 Total $5,765 Year Item Description Estimate 2017 Network Renewals
1 Paths - kerb ramp renewal DDA $450 2 Paths - large area renewal slabs $897 3 Paths - large area renewal pavers $418 4 Paths - renewal as identified in Asset Register $5,000
2017 Defect Repairs 2017 Total $6,765 2018 Network Renewals Estimate
1 Paths - kerb ramp renewal DDA $450 2 Paths - large area renewal slabs $897 3 Paths - large area renewal pavers $418 4 Paths - renewal as identified in Asset Register $6,000
2018 Defect Repairs 2018 Total $7,765 Year Item Description Estimate 2019 Network Renewals
1 Paths - kerb ramp renewal DDA $450 2 Paths - large area renewal slabs $897 3 Paths - large area renewal pavers $418 4 Paths - renewal as identified in Asset Register $6,000
2019 Defect Repairs 2019 Total $7,765
CITY OF CHARLES STURT – PATHS/ACCESS RAMPS ASSET MANAGEMENT PLAN 2016
- 85 -
Appendix D Budgeted Expenditures Accommodated in LONG TERM FINANCIAL PLAN
CITY OF CHARLES STURT – PATHS/ACCESS RAMPS ASSET MANAGEMENT PLAN 2016
- 86 -
Appendix E Abbreviations
AAAC Average annual asset consumption
AM Asset management
Asset Management Plan
Asset Management Plan
ARI Average recurrence interval
ASC Annual service cost
BOD Biochemical (biological) oxygen demand
CRC Current replacement cost
CWMS Community wastewater management systems
DA Depreciable amount
DRC Depreciated replacement cost
EF Earthworks/formation
IRMP Infrastructure risk management plan
LCC Life Cycle cost
LCE Life cycle expenditure
LONG TERM FINANCIAL PLAN
Long term financial plan
MMS Maintenance management system
PCI Pavement condition index
RV Residual value
SoA State of the Assets
SS Suspended solids
vph Vehicles per hour
WDCRD Written down current replacement cost
CITY OF CHARLES STURT – PATHS/ACCESS RAMPS ASSET MANAGEMENT PLAN 2016
- 87 -
Appendix F Glossary
Annual service cost (ASC) 1) Reporting actual cost The annual (accrual) cost of providing a service
including operations, maintenance, depreciation, finance/opportunity and disposal costs less revenue.
2) For investment analysis and budgeting An estimate of the cost that would be tendered,
per annum, if tenders were called for the supply of a service to a performance specification for a fixed term. The Annual Service Cost includes operations, maintenance, depreciation, and finance / opportunity and disposal costs, less revenue.
Asset A resource controlled by an entity as a result of past events and from which future economic benefits are expected to flow to the entity. Infrastructure assets are a sub-class of property, plant and equipment which are non-current assets with a life greater than 12 months and enable services to be provided.
Asset category Sub-group of assets within a class hierarchy for financial reporting and management purposes.
Asset class A group of assets having a similar nature or function in the operations of an entity, and which, for purposes of disclosure, is shown as a single item without supplementary disclosure.
Asset condition assessment The process of continuous or periodic inspection, assessment, measurement and interpretation of the resultant data to indicate the condition of a specific asset so as to determine the need for some preventative or remedial action.
Asset hierarchy A framework for segmenting an asset base into appropriate classifications. The asset hierarchy can be based on asset function or asset type or a combination of the two.
Asset management (AM) The combination of management, financial, economic, engineering and other practices applied to physical assets with the objective of providing the required level of service in the most cost effective manner.
Asset renewal funding ratio The ratio of the net present value of asset renewal funding accommodated over a 10-year period in a long term financial plan relative to the net present value of projected capital renewal expenditures identified in an Asset Management Plan for the same period [AIFMG Financial Sustainability Indicator No 8].
Average annual asset consumption (AAAC)* The amount of an organisation’s asset base consumed during a reporting period (generally a year). This may be calculated by dividing the depreciable amount by the useful life (or total future economic benefits/service potential) and totalled for each and every asset OR by dividing the carrying amount (depreciated replacement cost) by the remaining useful life (or remaining future economic benefits/service potential) and totalled for each and every asset in an asset category or class.
Borrowings A borrowing or loan is a contractual obligation of the borrowing entity to deliver cash or another financial asset to the lending entity over a specified period of time or at a specified point in time, to cover both the initial capital provided and the cost of the interest incurred for providing this capital. A borrowing or loan provides the means for the borrowing entity to finance outlays (typically physical assets) when it has insufficient funds of its own to do so, and for the lending entity to make a financial return, normally in the form of interest revenue, on the funding provided.
Capital expenditure Relatively large (material) expenditure, which has benefits, expected to last for more than 12 months. Capital expenditure includes renewal, expansion and upgrade. Where capital projects involve a combination of renewal, expansion and/or upgrade expenditures, the total project cost needs to be allocated accordingly.
Capital expenditure - expansion Expenditure that extends the capacity of an existing asset to provide benefits, at the same standard as is currently enjoyed by existing beneficiaries, to a new group of users. It is discretionary expenditure, which increases future operations and maintenance costs, because it increases the organisation’s asset base, but may be associated with additional revenue from the new user group, e.g. extending a drainage or road network, the provision of an oval or park in a new suburb for new residents.
CITY OF CHARLES STURT – PATHS/ACCESS RAMPS ASSET MANAGEMENT PLAN 2016
- 88 -
Capital expenditure - new Expenditure which creates a new asset providing a new service/output that did not exist beforehand. As it increases service potential it may impact revenue and will increase future operations and maintenance expenditure.
Capital expenditure - renewal Expenditure on an existing asset or on replacing an existing asset, which returns the service capability of the asset up to that which it had originally. It is periodically required expenditure, relatively large (material) in value compared with the value of the components or sub-components of the asset being renewed. As it reinstates existing service potential, it generally has no impact on revenue, but may reduce future operations and maintenance expenditure if completed at the optimum time, e.g. resurfacing or resheeting a material part of a road network, replacing a material section of a drainage network with pipes of the same capacity, resurfacing an oval.
Capital expenditure - upgrade Expenditure, which enhances an existing asset to provide a higher level of service or expenditure that will increase the life of the asset beyond that which it had originally. Upgrade expenditure is discretionary and often does not result in additional revenue unless direct user charges apply. It will increase operations and maintenance expenditure in the future because of the increase in the organisation’s asset base, e.g. widening the sealed area of an existing road, replacing drainage pipes with pipes of a greater capacity, enlarging a grandstand at a sporting facility.
Capital funding Funding to pay for capital expenditure.
Capital grants Monies received generally tied to the specific projects for which they are granted, which are often upgrade and/or expansion or new investment proposals.
Capital investment expenditure See capital expenditure definition.
Capitalisation threshold The value of expenditure on non-current assets above which the expenditure is recognised as capital expenditure and below which the expenditure is charged as an expense in the year of acquisition.
Carrying amount The amount at which an asset is recognised after deducting any accumulated depreciation / amortisation and accumulated impairment losses thereon.
Class of assets See asset class definition
Component Specific parts of an asset having independent physical or functional identity and having specific attributes such as different life expectancy, maintenance regimes, risk or criticality.
Core asset management Asset management which relies primarily on the use of an asset register, maintenance management systems, job resource management, inventory control, condition assessment, simple risk assessment and defined levels of service, in order to establish alternative treatment options and long-term cashflow predictions. Priorities are usually established on the basis of financial return gained by carrying out the work (rather than detailed risk analysis and optimised decision- making).
Cost of an asset The amount of cash or cash equivalents paid or the fair value of the consideration given to acquire an asset at the time of its acquisition or construction, including any costs necessary to place the asset into service. This includes one-off design and project management costs.
Critical assets Assets for which the financial, business or service level consequences of failure are sufficiently severe to justify proactive inspection and rehabilitation. Critical assets have a lower threshold for action than non-critical assets.
Current replacement cost (CRC) The cost the entity would incur to acquire the asset on the reporting date. The cost is measured by reference to the lowest cost at which the gross future economic benefits could be obtained in the normal course of business or the minimum it would cost, to replace the existing asset with a technologically modern equivalent new asset (not a second hand one) with the same economic benefits (gross service potential) allowing for any differences in the quantity and quality of output and in operating costs.
Deferred maintenance The shortfall in rehabilitation work undertaken relative to that required to maintain the service potential of an asset.
Depreciable amount The cost of an asset, or other amount substituted for its cost, less its residual value.
CITY OF CHARLES STURT – PATHS/ACCESS RAMPS ASSET MANAGEMENT PLAN 2016
- 89 -
Depreciated replacement cost (DRC) The current replacement cost (CRC) of an asset less, where applicable, accumulated depreciation calculated on the basis of such cost to reflect the already consumed or expired future economic benefits of the asset.
Depreciation / amortisation The systematic allocation of the depreciable amount (service potential) of an asset over its useful life.
Economic life See useful life definition.
Expenditure The spending of money on goods and services. Expenditure includes recurrent and capital outlays.
Expenses Decreases in economic benefits during the accounting period in the form of outflows or depletions of assets or increases in liabilities that result in decreases in equity, other than those relating to distributions to equity participants.
Fair value The amount for which an asset could be exchanged, or a liability settled, between knowledgeable, willing parties, in an arm’s length transaction.
Financing gap A financing gap exists whenever an entity has insufficient capacity to finance asset renewal and other expenditure necessary to be able to appropriately maintain the range and level of services its existing asset stock was originally designed and intended to deliver. The service capability of the existing asset stock should be determined assuming no additional operating revenue, productivity improvements, or net financial liabilities above levels currently planned or projected. A current financing gap means service levels have already or are currently falling. A projected financing gap if not addressed will result in a future diminution of existing service levels.
Heritage asset An asset with historic, artistic, scientific, technological, geographical or environmental qualities that is held and maintained principally for its contribution to knowledge and culture and this purpose is central to the objectives of the entity holding it.
Impairment Loss The amount by which the carrying amount of an asset exceeds its recoverable amount.
Infrastructure assets Physical assets that contribute to meeting the needs of organisations or the need for access to major economic and social facilities and services, e.g. roads, drainage, footpaths and cycleways. These are typically large, interconnected networks or portfolios of composite assets. The components of these assets may be separately maintained, renewed or replaced individually so that the required level and standard of service from the network of assets is continuously sustained. Generally the components and hence the assets have long lives. They are fixed in place and are often have no separate market value.
Investment property Property held to earn rentals or for capital appreciation or both, rather than for: (a) use in the production or supply of goods or services
or for administrative purposes; or (b) sale in the ordinary course of business.
Key performance indicator A qualitative or quantitative measure of a service or activity used to compare actual performance against a standard or other target. Performance indicators commonly relate to statutory limits, safety, responsiveness, cost, comfort, asset performance, reliability, efficiency, environmental protection and customer satisfaction.
Level of service The defined service quality for a particular service/activity against which service performance may be measured. Service levels usually relate to quality, quantity, reliability, responsiveness, environmental impact, acceptability and cost.
Life Cycle Cost * 1. Total LCC The total cost of an asset throughout its
life including planning, design, construction, acquisition, operation, maintenance, rehabilitation and disposal costs.
2. Average LCC The life cycle cost (LCC) is average cost to provide the service over the longest asset life cycle. It comprises average operations, maintenance expenditure plus asset consumption expense, represented by depreciation expense projected over 10-years. The Life Cycle Cost does not indicate the funds required to provide the service in a particular year.
CITY OF CHARLES STURT – PATHS/ACCESS RAMPS ASSET MANAGEMENT PLAN 2016
- 90 -
Life Cycle Expenditure The Life Cycle Expenditure (LCE) is the average operations, maintenance and capital renewal expenditure accommodated in the long term financial plan over 10-years. Life Cycle Expenditure may be compared to average Life Cycle Cost to give an initial indicator of affordability of projected service levels when considered with asset age profiles.
Loans / borrowings See borrowings.
Maintenance All actions necessary for retaining an asset as near as practicable to an appropriate service condition, including regular ongoing day-to-day work necessary to keep assets operating, e.g road patching but excluding rehabilitation or renewal. It is operating expenditure required to ensure that the asset reaches its expected useful life. • Planned maintenance
Repair work that is identified and managed through a maintenance management system (MMS). MMS activities include inspection, assessing the condition against failure/breakdown criteria/experience, prioritising scheduling, actioning the work and reporting what was done to develop a maintenance history and improve maintenance and service delivery performance.
• Reactive maintenance Unplanned repair work that is carried out in response to service requests and management/ supervisory directions.
• Specific maintenance Maintenance work to repair components or replace sub-components that needs to be identified as a specific maintenance item in the maintenance budget.
• Unplanned maintenance Corrective work required in the short-term to restore an asset to working condition so it can continue to deliver the required service or to maintain its level of security and integrity.
Maintenance expenditure * Recurrent expenditure, which is periodically or regularly required as part of the anticipated schedule of works required to ensure that the asset achieves its useful life and provides the required level of service. It is expenditure, which was anticipated in determining the asset’s useful life.
Materiality The notion of materiality guides the margin of error acceptable, the degree of precision required and the extent of the disclosure required when preparing general purpose financial reports. Information is material if its omission, misstatement or non-disclosure has the potential, individually or collectively, to influence the economic decisions of users taken on the basis of the financial report or affect the discharge of accountability by the management or governing body of the entity.
Modern equivalent asset Assets that replicate what is in existence with the most cost-effective asset performing the same level of service. It is the most cost efficient, currently available asset which will provide the same stream of services as the existing asset is capable of producing. It allows for technology changes and, improvements and efficiencies in production and installation techniques
Net present value (NPV) The value to the organisation of the cash flows associated with an asset, liability, activity or event calculated using a discount rate to reflect the time value of money. It is the net amount of discounted total cash inflows after deducting the value of the discounted total cash outflows arising from e.g the continued use and subsequent disposal of the asset after deducting the value of the discounted total cash outflows.
Non-revenue generating investments Investments for the provision of goods and services to sustain or improve services to the community that are not expected to generate any savings or revenue to the organisation, e.g. parks and playgrounds, footpaths, roads and bridges, libraries, etc.
Operations Regular activities to provide services such as public health, safety and amenity, e.g street sweeping, grass mowing and street lighting.
Operating expenditure Recurrent expenditure, which is continuously required to provide a service. In common use the term typically includes, e.g power, fuel, staff, plant equipment, on-costs and overheads but excludes maintenance and depreciation. Maintenance and depreciation is on the other hand included in operating expenses.
CITY OF CHARLES STURT – PATHS/ACCESS RAMPS ASSET MANAGEMENT PLAN 2016
- 91 -
Operating expense The gross outflow of economic benefits, being cash and non cash items, during the period arising in the course of ordinary activities of an entity when those outflows result in decreases in equity, other than decreases relating to distributions to equity participants.
Operating expenses Recurrent expenses continuously required to provide a service, including power, fuel, staff, plant equipment, maintenance, depreciation, on-costs and overheads.
Operations, maintenance and renewal financing ratio Ratio of estimated budget to projected expenditure for operations, maintenance and renewal of assets over a defined time (e.g 5, 10 and 15-years).
Operations, maintenance and renewal gap Difference between budgeted expenditures in a long term financial plan (or estimated future budgets in absence of a long term financial plan) and projected expenditures for operations, maintenance and renewal of assets to achieve/maintain specified service levels, totalled over a defined time (e.g. 5, 10 and 15-years).
Pavement management system (PMS) A systematic process for measuring and predicting the condition of road pavements and wearing surfaces over time and recommending corrective actions.
PMS Score A measure of condition of a road segment determined from a Pavement Management System.
Rate of annual asset consumption * The ratio of annual asset consumption relative to the depreciable amount of the assets. It measures the amount of the consumable parts of assets that are consumed in a period (depreciation) expressed as a percentage of the depreciable amount.
Rate of annual asset renewal * The ratio of asset renewal and replacement expenditure relative to depreciable amount for a period. It measures whether assets are being replaced at the rate they are wearing out with capital renewal expenditure expressed as a percentage of depreciable amount (capital renewal expenditure/DA).
Rate of annual asset upgrade/new * A measure of the rate at which assets are being upgraded and expanded per annum with capital upgrade/new expenditure expressed as a percentage of depreciable amount (capital upgrade/expansion expenditure/DA).
Recoverable amount The higher of an asset's fair value, less costs to sell and its value in use.
Recurrent expenditure Relatively small (immaterial) expenditure or that which has benefits expected to last less than 12 months. Recurrent expenditure includes operations and maintenance expenditure.
Recurrent funding Funding to pay for recurrent expenditure.
Rehabilitation See capital renewal expenditure definition above.
Remaining useful life The time remaining until an asset ceases to provide the required service level or economic usefulness. Age plus remaining useful life is useful life.
Renewal See capital renewal expenditure definition above.
Residual value The estimated amount that an entity would currently obtain from disposal of the asset, after deducting the estimated costs of disposal, if the asset were already of the age and in the condition expected at the end of its useful life.
Revenue generating investments Investments for the provision of goods and services to sustain or improve services to the community that are expected to generate some savings or revenue to offset operating costs, e.g public halls and theatres, childcare centres, sporting and recreation facilities, tourist information centres, etc.
Risk management The application of a formal process to the range of possible values relating to key factors associated with a risk in order to determine the resultant ranges of outcomes and their probability of occurrence.
Section or segment A self-contained part or piece of an infrastructure asset.
Service potential The total future service capacity of an asset. It is normally determined by reference to the operating capacity and economic life of an asset. A measure of service potential is used in the not-for-profit sector/public sector to value assets, particularly those not producing a cash flow.
CITY OF CHARLES STURT – PATHS/ACCESS RAMPS ASSET MANAGEMENT PLAN 2016
- 92 -
Service potential remaining A measure of the future economic benefits remaining in assets. It may be expressed in dollar values (Fair Value) or as a percentage of total anticipated future economic benefits. It is also a measure of the percentage of the asset’s potential to provide services that is still available for use in providing services (Depreciated Replacement Cost/Depreciable Amount).
Specific Maintenance Replacement of higher value components/sub-components of assets that is undertaken on a regular cycle including repainting, replacement of air conditioning equipment, etc. This work generally falls below the capital/ maintenance threshold and needs to be identified in a specific maintenance budget allocation.
Strategic Longer-Term Plan A plan covering the term of office of councillors (4 years minimum) reflecting the needs of the community for the foreseeable future. It brings together the detailed requirements in the Council’s longer-term plans such as the Asset Management Plan and the long-term financial plan. The plan is prepared in consultation with the community and details where the Council is at that point in time, where it wants to go, how it is going to get there, mechanisms for monitoring the achievement of the outcomes and how the plan will be resourced.
Sub-component Smaller individual parts that make up a component part.
Useful life Either: (a) the period over which an asset is expected to be
available for use by an entity, or (b) the number of production or similar units expected
to be obtained from the asset by the entity. It is estimated or expected time between placing the asset into service and removing it from service, or the estimated period of time over which the future economic benefits embodied in a depreciable asset, are expected to be consumed by the organisation.
Value in Use The present value of future cash flows expected to be derived from an asset or cash generating unit. It is deemed to be depreciated replacement cost (DRC) for those assets whose future economic benefits are not primarily dependent on the asset's ability to generate net cash inflows, where the entity would, if deprived of the asset, replace its remaining future economic benefits.
Additional and modified glossary items shown *
CITY OF CHARLES STURT – PATHS/ACCESS RAMPS ASSET MANAGEMENT PLAN 2016