140


AT Asset Management Plan 2015 - 2018
Asset Management Plan
2015-2018
AT Asset Management Plan 2015 - 2018

AT Asset Management Plan 2015 - 2018
Foreword 2015 – 2018 Asset Management Plan
Auckland Transport (AT) manages the largest and most strategically important urban transport network in New Zealand, serving a city of 1.5 million people representing one third of New Zealand’s population and 35 per cent of the national economy.
AT manages $16.5 billion of mainly road and public transport assets and this Asset Management Plan demonstrates that these assets are being managed in a prudent, efficient and forward-looking manner.
The efficient management and growth of this network and its services is essential to the social and economic wellbeing of New Zealand’s largest city and consequently is vitally important to the economic well-being of New Zealand as a whole.
For AT, it is not just a matter of optimising the value and efficiency of the networks and systems already in place, but also effectively managing the overall condition of the network and planning future services to meet the needs of Auckland’s rapidly increasing population.
This document details the strategies and management systems deployed by AT and sets out the future renewals and maintenance investment required to continue building the assets, infrastructure and delivery systems of a transformational, sustainable and affordable urban transport service. It also addresses the shortfalls that will begin to accrue if budgets are not sustainable over the medium to long term.
This plan notes that the renewals funding required to maintain current levels of service from Auckland’s transport assets over the coming 10 years has been assessed at $3.44 billion, which is $930 million more than the $2.51 billion approved in Auckland Council’s 2015-2025 Long Term Plan.
While this will be sufficient over the next three years, beyond that the situation will deteriorate and by 2025 more than nine per cent of assets will be in very poor condition, comparing unfavourably with the current situation where less than one per cent of assets that are in a very poor condition, made possible with renewals funding of $3.44 billion.
The network maintenance and asset operations funding provided for the next 10 years is $1.86 billion, which is aligned to historic levels of expenditure, but does not reflect the increasing demands of a growing city. It also does not reflect the increased requirement for maintenance that will arise from the reduced level of renewal investment from 2019 onwards.
Network maintenance and operational budgets should increase by about 1.5 per cent a year to keep pace with growth-led demand. Simultaneously, AT must ensure that this does not compromise the prudent management of on-going asset deterioration, considering that depreciation of the network is currently running at a rate of $261 million a year (or $715,000 a day).
Renewals and maintenance funding constraints will result in a lower quality transport network in the medium to long term. This will challenge the expectation of AT, and its intent, to proactively manage the network to an appropriate standard aligned to the outcome it is required to deliver and which is expected in one of the world’s most liveable cities. It will also increasingly focus on what will become the growing maintenance needs of a deteriorating network.
To avoid AT precipitating an unsustainable deterioration in asset condition that will have to be addressed in the future (and possibly by future generations), AT will need to confront these issues in the 2018 - 2021 AMP and prudently manage any adverse effects that result.
AT Asset Management Plan 2015 - 2018
AT Asset Management Plan 2015 - 2018
Three years is not a long time when managing assets with a lifespan of decades. Accordingly, AT has until 2018 to work with its funding partners Auckland Council and NZ Transport Agency to develop a sustainable Asset Management Plan, in which renewals and maintenance funding needs are clear, investment is optimised and the trade-offs between cost, risk and levels of service are transparent.
This plan sets out the issues and choices and provides the starting point from which to tackle the challenges and costs of maintaining AT’s network assets for the benefit of current and future generations.
Dr Lester Levy, CNZM Dr David Warburton
Chairman Chief Executive Auckland Transport Auckland Transport
AT Asset Management Plan 2015 - 2018

AT Asset Management Plan 2015 - 2018
Quality record
ORIGINATOR Auckland Transport Strategic Asset Management and Systems Infrastructure Division CONTRIBUTORS
Dilip Datta Brett Elston Andy Finch Thisula Kithulagoda Robert McSpadden Michael Mason Vikram Nalla May Oo Anna Percy Siri Rangamuwa Deepa Seares Glen Syred Gerri WaterKamp
Asset management plan document set Strategic summary Asset management plan – overview (This document) Asset class management plans (14) Asset risk management plan
AT Asset Management Plan 2015 - 2018

Table of contents Executive summary………………………………………………………………………….. 9 Key elements of this plan……………………………………………………………………. 22 1. Infrastructure asset management………………………………………………….. 27 2. The transport asset portfolio……………………………………………….……….. 35 3. Outcomes and levels of service…………………………………….………………. 45 4. Growth and demand…………………………………………………………………. 69 5. Risk management……………………………………………………………………. 77 6. Sustainability………………………………………………………………………….. 91 7. Asset investment requirements……………………………………………………. 99 8. Funding and impacts………………………………………………………………… 113 Appendices 1. Legislative requirements…………………………………………………………….. 123 2. Notes, assumptions and limitations of financial information…………………….. 124 3. Detailed financial tables……………………………………………………………... 125 4. Asset class management plan summaries………………………………………... 137 Road network 4.1 Pavement………………………………………………………………………. 139 4.2 Stormwater……………………………………………………………………... 145 4.3 Footpaths and cycleways……………………………………………………. 151 4.4 Bridges and major culverts…………………………………………………… 159 4.5 Walls (seawalls, noise walls and retaining walls) …………………………. 165 4.6 Parking………………………………………………………………………….. 171 4.7 Traffic systems (signals, signs and markings)……………………………… 177 4.8 Street lighting………………………………………………………………….. 185 4.9 Corridor structures and fixtures……………………………………………… 191 Public transport network 4.10 Rail stations and depots/ stabling…………………………………………… 197 4.11 Rolling stock (trains) …………………………………………………………. 203 4.12 Wharves……………………………………………………………………….. 209 4.13 AT HOP………………………………………………………………………... 215 4.14 Bus network…………………………………………………………………… 221 Bibliography…………………………………………………………………………………… 227
AT Asset Management Plan 2015 - 2018

AT Asset Management Plan 2015 - 2018

AT Asset Management Plan 2015 – 2018 Page 9 of 139
Executive summary Context Auckland Transport (AT) was established in 2010 as a council-controlled organisation of Auckland Council. Its purpose is to provide an effective, efficient and safe land transport system for the Auckland region, in the public interest (1).
AT is responsible for $16.5 billion of assets, including road and public transport assets with a replacement value of $13.4 billion. These assets are summarised in Table 11, and make up the essential transport infrastructure network that enables people and goods to move around Auckland.
Over the next 30 years (the timeframe covered by this plan), Auckland’s population is expected to grow from 1.5 million to over 2.2 million people. This includes 237,000 new residents in the next 10 years, and a corresponding growth in jobs and businesses (2).
This growth will mean that the costs of renewing, maintaining and operating Auckland’s transport network will increase, as new infrastructure is added to the network to accommodate increasing demand.
Scope and purpose of this plan This Asset Management Plan 2015–2018 (AMP) sets out how AT will manage the assets that it is responsible for within Auckland's transport network over the next 3 years, looking forward 10 years in detail and 30 years in outline. A new AMP will be prepared in 2018.
AT uses asset management planning as a mechanism for managing and maintaining the transport assets it is responsible for.
Asset management planning:
• ensures that network assets continue to provide the essential transport services they were built for
• identifies the optimal maintenance, operations and renewals requirements for Auckland’s transport assets to provide the agreed levels of service
• sets out a recommended approach for managing asset risks and resilience
• forecasts the consequential renewals and operations impact of urban growth and new transport investments
• recommends specifications for new assets so that they provide the best whole-of-life value.
1 Some transport assets are the responsibility of other agencies, and hence are not covered by this plan.. State highways are managed by the New Zealand Transport Agency, and rail tracks and signals by KiwiRail.
AT Asset Management Plan 2015 - 2018
AT Asset Management Plan 2015 – 2018 Page 10 of 139
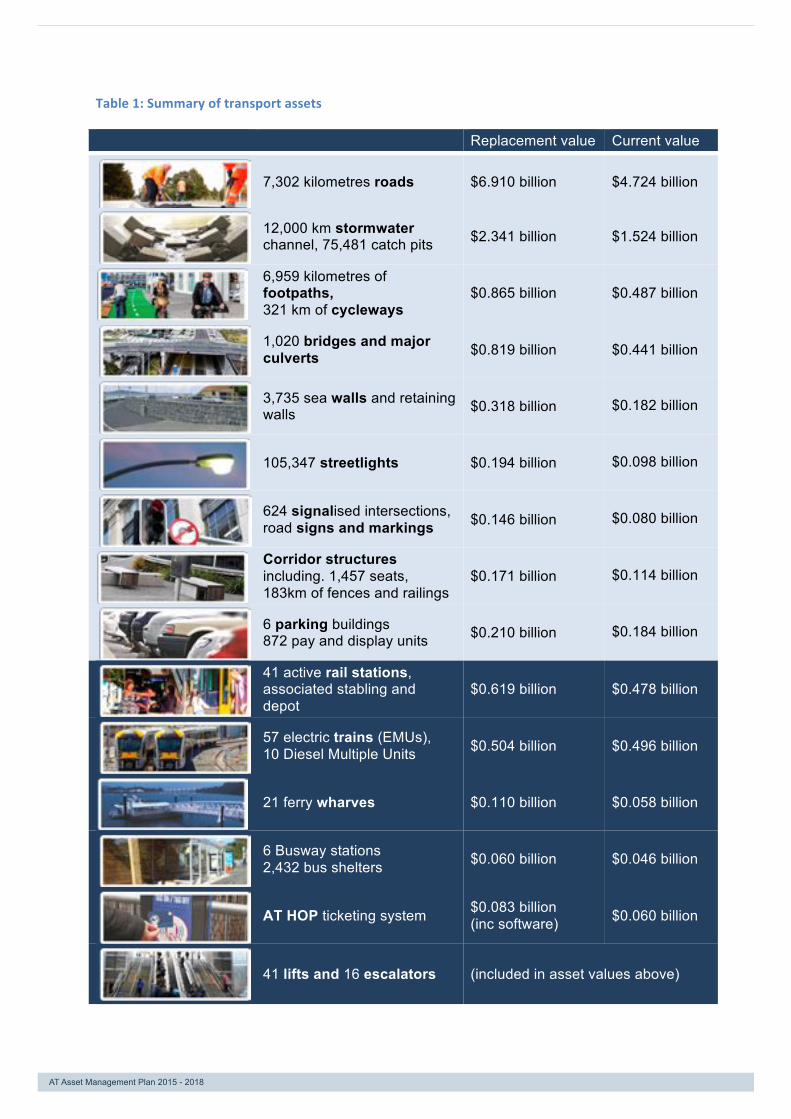
Table 1: Summary of transport assets
Replacement value Current value
7,302 kilometres roads $6.910 billion $4.724 billion
12,000 km stormwater channel, 75,481 catch pits $2.341 billion $1.524 billion
6,959 kilometres of footpaths, 321 km of cycleways
$0.865 billion $0.487 billion
1,020 bridges and major culverts $0.819 billion $0.441 billion
3,735 sea walls and retaining walls $0.318 billion $0.182 billion
105,347 streetlights $0.194 billion $0.098 billion
624 signalised intersections, road signs and markings $0.146 billion $0.080 billion
Corridor structures including. 1,457 seats, 183km of fences and railings
$0.171 billion $0.114 billion
6 parking buildings 872 pay and display units $0.210 billion $0.184 billion
41 active rail stations, associated stabling and depot
$0.619 billion $0.478 billion
57 electric trains (EMUs), 10 Diesel Multiple Units $0.504 billion $0.496 billion
21 ferry wharves $0.110 billion $0.058 billion
6 Busway stations 2,432 bus shelters $0.060 billion $0.046 billion
AT HOP ticketing system $0.083 billion (inc software) $0.060 billion
41 lifts and 16 escalators (included in asset values above)
AT Asset Management Plan 2015 - 2018
AT Asset Management Plan 2015 – 2018 Page 11 of 139
AT’s asset management approach and recommended transport programme, as set out in this AMP, is a key input into the long term planning of AT and Auckland Council, and in particular to AT’s Auckland Regional Land Transport Plan 2015–2025, which in turn informs:
• the transport content of Auckland Council’s Long-Term Plan 2015–2025 (the long-term plan), including the 30-year Infrastructure Strategy
• the Auckland content of the New Zealand Transport Agency’s National Land Transport Programme 2015–2018.
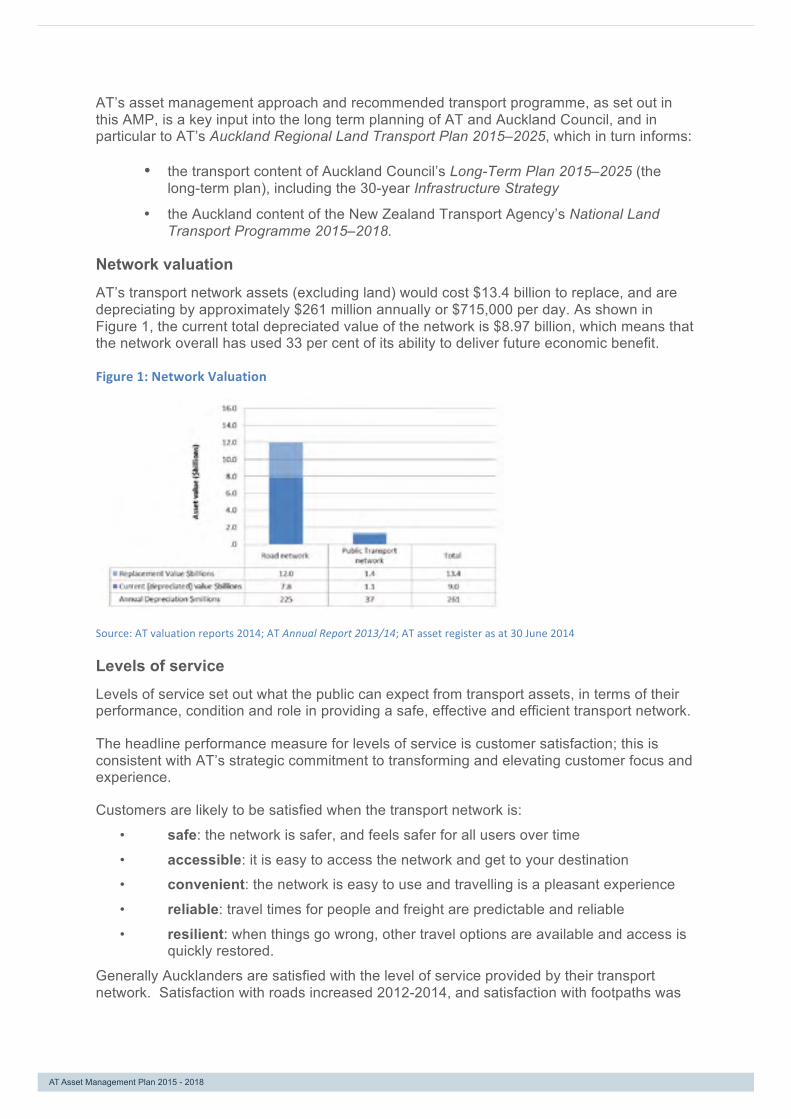
Network valuation AT’s transport network assets (excluding land) would cost $13.4 billion to replace, and are depreciating by approximately $261 million annually or $715,000 per day. As shown in Figure 1, the current total depreciated value of the network is $8.97 billion, which means that the network overall has used 33 per cent of its ability to deliver future economic benefit.
Figure 1: Network Valuation
Source: AT valuation reports 2014; AT Annual Report 2013/14; AT asset register as at 30 June 2014
Levels of service Levels of service set out what the public can expect from transport assets, in terms of their performance, condition and role in providing a safe, effective and efficient transport network.
The headline performance measure for levels of service is customer satisfaction; this is consistent with AT’s strategic commitment to transforming and elevating customer focus and experience.
Customers are likely to be satisfied when the transport network is:
• safe: the network is safer, and feels safer for all users over time
• accessible: it is easy to access the network and get to your destination
• convenient: the network is easy to use and travelling is a pleasant experience
• reliable: travel times for people and freight are predictable and reliable
• resilient: when things go wrong, other travel options are available and access is quickly restored.
Generally Aucklanders are satisfied with the level of service provided by their transport network. Satisfaction with roads increased 2012-2014, and satisfaction with footpaths was
AT Asset Management Plan 2015 - 2018

AT Asset Management Plan 2015 – 2018 Page 12 of 139
stable, as shown in Figure 2. Satisfaction with PT services is high, but declined in 2014 due to a range of factors including rapid patronage growth.
Future targets aim to maintain current satisfaction levels for roads and footpaths through to 2018 by ensuring that assets are maintained, operated and renewed as needed to deliver a fit for purpose level of service. AT has set a target to improve customer satisfaction with public transport from 81.4 per cent (its current level) to 85 per cent through a combination of asset and service improvements.
Figure 2: Customer satisfaction trends and targets
Satisfaction with the quality of roads
Satisfaction with the quality of footpaths
Satisfaction with public transport services
The customer satisfaction targets agreed between AT and Auckland Council through the 2015 AT Statement of Intent are set out in Table 2
Table 2: Customer satisfaction targets
Performance measure Actual 2012/13
Actual 2013/14
Statement of intent/annual plan targets
2014/15
Long-term plan targets
2015/16 2016/17 2017/18 2018/19– 2024/25
Customer satisfaction – roads 68% 71% 70% 70% 70% 70% 70%
Customer satisfaction – footpaths 61% 63% 65% 65% 65% 65% 65%
Customer satisfaction – public transport
New measure 81.4% 83% 83% 84% 85% 85%
Customer satisfaction – road safety 63% New measure 60% 60–
65% 60-65% 60–65%
Source: Auckland Council Long-‐Term Plan 2015–2025 (2), AT Statement of Intent 2015 (3)
Key technical performance measures that AT uses to monitor and support achievement of its customer satisfaction targets are shown in Table 3.
Table 3: Technical level of service performance measures
Performance measure Actual 2012/13
Actual 2013/14
Statement of intent/
annual plan targets 2014/15
Auckland Council long-term plan targets
2015/16 2016/17 2017/18 2018/19– 2024/25
Change from the previous financial year in the number of fatalities and serious injury crashes on the local road network, expressed as a number
429 (year to 31 Dec 2013)
2.66% reduction
from previous
year
Reduce by at
least 9
Reduce by at
least 9
Reduce by at
least 9
Reduce by at least 9
AT Asset Management Plan 2015 - 2018

AT Asset Management Plan 2015 – 2018 Page 13 of 139
Performance measure Actual 2012/13
Actual 2013/14
Statement of intent/
annual plan targets 2014/15
Auckland Council long-term plan targets
Percentage of customer service requests relating to roads and footpaths that receive a response within specified time frames2
85% 85% 85% 85% 85% 85%
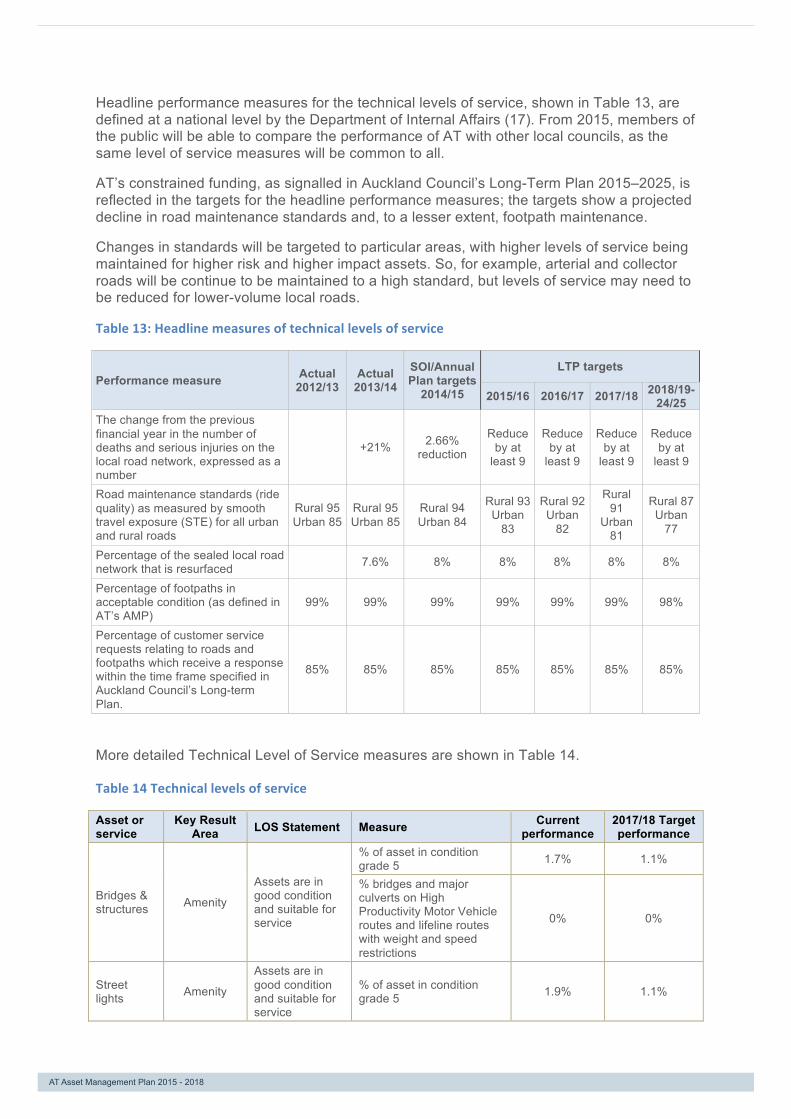
Road maintenance standards (ride quality), as measured by smooth travel exposure, for all urban and rural roads
Rural 95 Urban 85
Rural 95 Urban 85 Rural 93
Urban 83 Rural 92 Urban 82
Rural 91 Urban 81
Decreasing to Rural 87 Urban 77
Percentage of the sealed local road network that is resurfaced 7.6% 8% 8% 8% 8% 8%
Percentage of footpaths in acceptable condition (as defined in AT’s AMP)
99% 99% 99% 99% 99% 98%
Source: Auckland Council Long-‐Term Plan 2015–2025 (2), AT Statement of Intent 2015/16 (3)
Current condition of the network and recent trends The condition of any asset will deteriorate with use and over time. Over the past three years, AT has invested close to $200 million each year in asset renewals. At this level of investment, asset condition has been maintained overall, and the proportion of assets in very good, good or moderate condition is 97% as shown in Figure 3.
Figure 3: Road and public transport networks – current condition and trends
Source: AT renewals optimisation model (4)
Assets in very poor condition often present higher levels of risk and require more maintenance in order to provide suitable levels of safety and service.
The two asset classes with the highest proportion of assets in very poor condition are wharves (4.4 per cent of assets) and road pavement (3.2 per cent). These are also the two groups for which asset condition has improved the most over the past three years.
2 As defined in Auckland Transport’s customer service standards: two days for an incident investigation as a high priority; three days for an incident investigation as a normal priority; and one hour emergency response time.
AT Asset Management Plan 2015 - 2018

AT Asset Management Plan 2015 – 2018 Page 14 of 139
Identifying investment needs The levels of investment required for transport assets, as identified in this AMP, derive from the lifecycle, level of service and risk outcomes that the assets are required to provide.
AT uses best practice asset management tools to set appropriate levels of maintenance and renewals activities for its assets, in order to deliver a safe network that meets customer expectations at the lowest whole-of-life cost.
Key drivers for the recommended investment in renewals and maintenance are:
• the need to protect the current investment in the network
• the need to manage and protect the service potential of the network
• new assets added to the road and PT networks each year to keep up with population and business growth
• changing travel modes, and the council’s strategic aim of achieving a transformational shift in people’s preferred travel modes to public transport
• the need to deliver the required levels of service at the lowest whole-of-life cost
• the need to manage risk for critical infrastructure.
Decisions about the actual level of investment that will be made in renewals, maintenance and operations are made by AT’s two funders: Auckland Council and New Zealand Transport Agency.
Auckland Council is the major funder, and its long term plan drives AT’s overall funding levels. The New Zealand Transport Agency also contributes funding to AT, with its decisions guided by the Government Policy Statement on Land Transport 2015/2016–2024/2025.
Renewals investment needs Renewals are essential, ongoing investments to replace assets before they fail. Timely renewal of the many assets that comprise the road and public transport networks is necessary, in order to protect the current investment in the network, and manage safety, service, financial and reputational risk.
AT’s recommended renewals programme is based on:
• optimising the benefits provided by assets, and minimising their whole-of-life costs, including maintenance and replacement costs
• delivering the required level of service, now and in the context of future growth
• reducing and managing the risk of asset failure.
The renewals programme recommended in this AMP describes the long-term investment needed to provide sustainable asset condition and levels of service across the network. Total renewals funding recommended over 10 years, excluding the specific projects listed above, is 2.88 billion in 2014/2015 dollars. Allowing for forecast inflation, the 10 year funding required is 3.44 billion.
The impact of implementing the recommended renewals programme would be to reduce the proportion of transport assets in very poor condition to less than 1 per cent, and to achieve a
AT Asset Management Plan 2015 - 2018
AT Asset Management Plan 2015 – 2018 Page 15 of 139
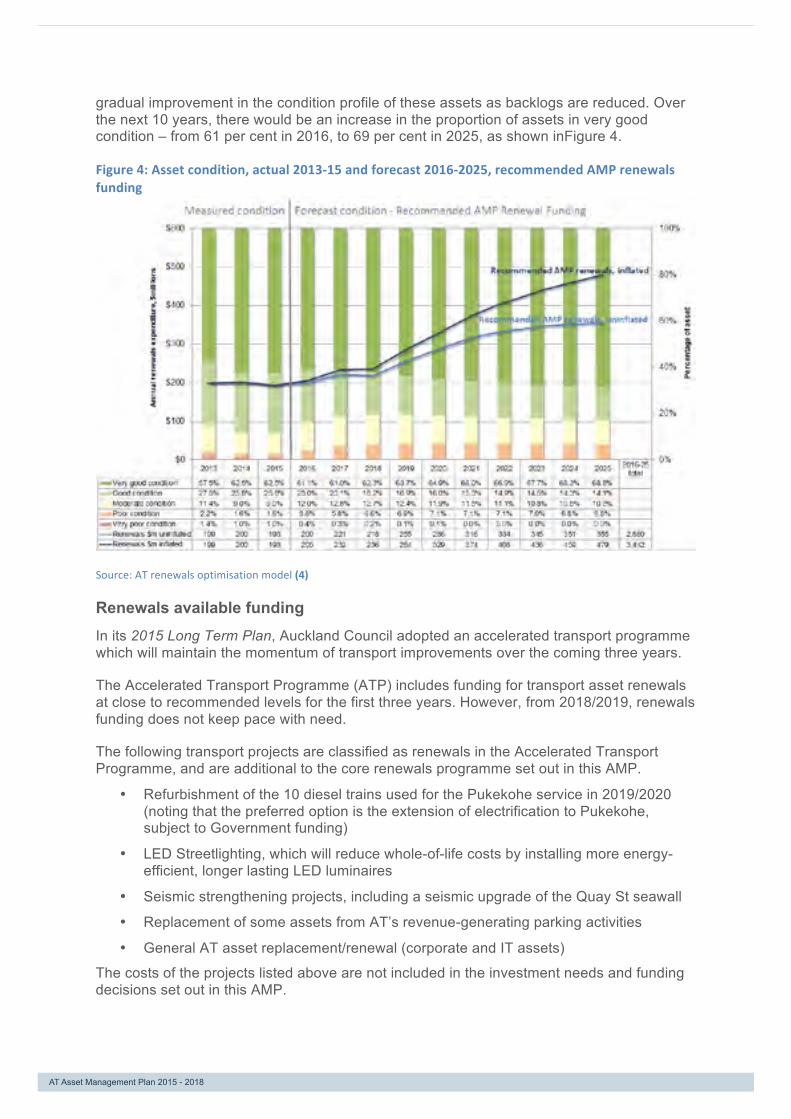
gradual improvement in the condition profile of these assets as backlogs are reduced. Over the next 10 years, there would be an increase in the proportion of assets in very good condition – from 61 per cent in 2016, to 69 per cent in 2025, as shown inFigure 4.
Figure 4: Asset condition, actual 2013-‐15 and forecast 2016-‐2025, recommended AMP renewals funding
Source: AT renewals optimisation model (4)
Renewals available funding In its 2015 Long Term Plan, Auckland Council adopted an accelerated transport programme which will maintain the momentum of transport improvements over the coming three years.
The Accelerated Transport Programme (ATP) includes funding for transport asset renewals at close to recommended levels for the first three years. However, from 2018/2019, renewals funding does not keep pace with need.
The following transport projects are classified as renewals in the Accelerated Transport Programme, and are additional to the core renewals programme set out in this AMP.
• Refurbishment of the 10 diesel trains used for the Pukekohe service in 2019/2020 (noting that the preferred option is the extension of electrification to Pukekohe, subject to Government funding)
• LED Streetlighting, which will reduce whole-of-life costs by installing more energy-efficient, longer lasting LED luminaires
• Seismic strengthening projects, including a seismic upgrade of the Quay St seawall
• Replacement of some assets from AT’s revenue-generating parking activities
• General AT asset replacement/renewal (corporate and IT assets)
The costs of the projects listed above are not included in the investment needs and funding decisions set out in this AMP.
AT Asset Management Plan 2015 - 2018

AT Asset Management Plan 2015 – 2018 Page 16 of 139
Figure 5 shows recommended renewals investment for the coming 10 years in the context of past investment, the funding levels proposed in Auckland Council’s long term plan and annual deprecation.
Figure 5: Recommended AMP and approved ATP renewals programme
Source: Auckland Regional Land Transport Plan 2015–2025 (5), Auckland Council Long-‐Term Plan 2015–2025 (2)
The level of funding for renewals approved in Auckland Council’s 2015 Long-Term Plan aligns with the level recommended in this AMP for the first three years. After that, it falls short of the recommended level of funding based on asset needs.
Less spending on renewals means that assets will degrade over time, leading to long-term loss of asset condition and value. The consequences, in terms of both costs and condition, of the long-term plan renewals funding is shown in Figure 6.
AT Asset Management Plan 2015 - 2018

AT Asset Management Plan 2015 – 2018 Page 17 of 139
Figure 6: Cost and condition impacts of the approved (ATP) 10-‐year renewals programme
Source: AT renewals optimisation model (4)
After 2018, the investment approved for renewals in the long-term plan is not sufficient to cover identified renewals needs, and this will lead to deterioration in the assets’ condition. By the end of the 10 years covered by the plan, the proportion of assets in very poor condition will have increased from less than 1 per cent in 2016 to 9.4 per cent in 2025.
Having high levels of assets in very poor and poor condition for a sustained period will lead to reduced levels of service, and an increased risk of failure and safety issues. This, in turn, will require higher levels of network monitoring and reactive maintenance.
The 30-year outlook, as proposed in Auckland Council’s Auckland 30-year Infrastructure Strategy (6), is for further restrictions on renewals funding in future decades, with a $4 billion gap between the recommended and the approved renewals programme over the next 30 years.
Maintenance investment needs Maintenance and asset-based operations cover the routine activities that keep Auckland’s road network, rail stations, bus stops and stations, and ferry wharves open for business. Maintenance and asset-based operations are the second largest item of AT operational expenditure each year, after public transport service contracts.
New transport assets, from whichever source, bring consequential operations, maintenance and renewals requirements. Based on past trends, around 1.5% more assets are added to the network each year, through a combination of vested assets in new developments and AT capital projects.
The financial impact of this is a corresponding increase in maintenance and operations funding requirements each year, just to keep up with growth in the asset base. Over the 10 years, consequential opex totals $98.1 million as shown in Table 4.
AT Asset Management Plan 2015 - 2018

AT Asset Management Plan 2015 – 2018 Page 18 of 139
Table 4: Estimated consequential maintenance and operations costs from asset growth
($million) 2015/ 2016
2016/ 2017
2017/ 2018
2018/ 2019
2019/ 2020
2020/ 2021
2021/ 2022
2022/ 2023
2023/ 2024
2024/ 2025
2016-2025 total
Consequential opex from asset growth 1.7 3.4 5.2 6.9 8.8 10.6 12.5 14.4 16.3 18.3 98.1
Approved funding, maintenance and operations Road maintenance budgets do not increase at all over the coming 10 years as shown in Figure 7 and Table 5. Public transport maintenance and asset-based operations budgets increase by around 1.9% each year, which is below the forecast rate of inflation.
Figure 7 : Maintenance and operations 2015/2016 to 2024/2025, approved ATP funding
Table 5 : Approved ATP funding for maintenance and operations
($million, inflated) 2015/ 2016
2016/ 2017
2017/ 2018
2018/ 2019
2019/ 2020
2020/ 2021
2021/ 2022
2022/ 2023
2023/ 2024
2024/ 2025
2016-2025 total
Roads maintenance and asset-based operations 114 114 114 114 114 115 115 115 115 115 1,145
PT maintenance and asset-based operations 65 64 68 69 71 72 73 74 75 77 708
A widening gap will arise between maintenance budgets and asset needs, for the following reasons.
• inflation
• consequential opex from asset growth, estimated at 1.5% (compounding) each year
• additional costs associated with patronage growth (for public transport) and growth in vehicle, freight, cycle and pedestrian trips (for roads)
• The shortfall in renewals funding creating increased demand for maintenance. For example, if roads are resealed less often, then more pothole maintenance will be required as the pavement deteriorates.
AT Asset Management Plan 2015 - 2018

AT Asset Management Plan 2015 – 2018 Page 19 of 139
Funding gap and consequences Figure 8 compares the impacts that the recommended (AMP) and approved (Accelerated Transport Programme, ATP) renewals funding levels will have on the proportion of poor and very poor assets in the network.
Figure 8: Recommended and approved budgets – impacts on levels of poor and very poor assets
Source: AT renewals optimisation model (4)
Funding at the approved levels will increase the overall level of backlog in the network; that is, the proportion of assets that are in worse condition than their nominated renewal intervention point. The backlog liability that will arise from the two different levels of funding (recommended and approved) is shown in Figure 9.
At approved funding levels, backlog liability will increase from 2018/2019 as renewals budgets fail to keep pace with the rate of asset deterioration. More backlog liability will be created than the funding that is being saved by the constrained budgets, because provision is not being made so that renewals can occur at the optimal time. Whole of life asset costs increase because assets in poor condition have higher maintenance costs and deteriorate more quickly
Figure 9: Overview of backlog liability
Source: AT renewals optimisation model (4)
AT Asset Management Plan 2015 - 2018

AT Asset Management Plan 2015 – 2018 Page 20 of 139
Addressing the funding gap from 2018 The next long term planning cycle, leading to publication of the 2018-2021 Asset Management Plan, provides an opportunity to address the significant issues raised by the proposed future shortfall in renewals funding from Year 4 of the ten-year Long Term Plan.
With limited funding, priority setting has an increasing role in asset management. This issue is not unique to Auckland. In response to concern about the long term affordability of road maintenance and renewals, the New Zealand Transport Agency and Local Government New Zealand have established the One Network Road Classification to better align asset management and funding decisions with network priorities. This classification will be used to inform asset management planning, investment choices, and maintenance and operational decisions throughout New Zealand and is especially relevant to the challenges faced in Auckland.
The New Zealand Transport Agency anticipates that it will use the One Network Road Classification as the basis for its funding allocations for road maintenance and renewal projects from 2018 onwards.
AT will apply the One Network Road Classification in order to better understand the links between cost, risk and levels of service and to ensure that maintenance, operational and investment decisions align with national and international best practice in asset management.
The asset management and risk mitigation tasks set out in Table 6 will ensure continuous improvement in Asset Management during the 2015-2018 period, and build the evidence base for a reassessment of renewals funding levels in the 2018 AMP.
Table 6: Asset management issues and risks 2015-‐2018
Issue/risk Management/mitigation tasks
• Increased requirement for asset management planning
Fully integrate the One Network Road Classification into AT planning, management, financial and delivery processes
Additional monitoring, risk management and reporting activities to manage higher levels of risk
Annual updates of the AMP including key indicators such as customer satisfaction, health and safety issues, network condition and performance.
• Approved maintenance and asset-based operations funding does not provide for the impacts of asset growth
• Approved renewals funding from 2018/2019 forward does not meet recommended renewals needs
Reprioritise work from lower to higher risk impact assets eg. defer renewals of lower volume local roads in order to prioritise regional and arterial roads
Reduce maintenance standards for some assets
Advise on of the consequences resulting from the level of funding proposed in the LTP, and the impact of the shortfall relative to the needs identified in the AMP
Work closely with Auckland Council and the Transport Agency to ensure that AT’s funding needs are clear, and that tradeoffs between cost, risk and level of service are transparent.
AT Asset Management Plan 2015 - 2018

AT Asset Management Plan 2015 – 2018 Page 21 of 139
Issue/risk Management/mitigation tasks
• Levels of service for some assets cannot be sustained at current levels of funding
Re-assess investment needs and levels of service. Consult on any proposed significant changes.
Revisit the agreed levels of service and funding envelope consequences in the 2018-21 funding round.
Close monitoring of asset condition, network risk and customer satisfaction trends.
Forecasting of the links between funding and trends in customer complaints and asset integrity.
Summary of key points
• AT’s is responsible for transport assets with a replacement value of $13.4 billion
• Current asset condition is good and customer satisfaction is high
• Growth adds approximately 1.5% more assets (and costs) to the network each year
• The recommended (AMP) budget provides for an optimal maintenance and renewals programme, balancing cost, risk and levels of service
• Approved LTP renewals funding has been approved at close to recommended levels for the first three years. However in the seven years from 2018/2019, renewals funding is set at a level significantly lower than the AMP recommendation. By the end of the decade, 9.4 per cent % of transport assets will be in very poor condition. As a result, AT will be managing a much higher level of risk.
• Maintenance budgets do not increase over time, which will lead to a widening gap between funding and asset needs, due to:
o Inflation
o New assets and increased demand
o Increased maintenance costs, as a consequence of deferred renewals.
• From 2018/19, AT does not have a sustainable funding model for maintaining and renewing its assets.
The coming three years provide the opportunity to ensure that AT has taken all possible steps to achieve value for money, is delivering a fit for purpose level of service, and is managing risk appropriately. AT will engage with Council and will revisit the agreed levels of service and funding envelope consequences in the 2018-2021 funding round.
AT Asset Management Plan 2015 - 2018

AT Asset Management Plan 2015 – 2018 Page 22 of 139
Key elements of this plan Figure 10 shows the chapters in this AMP and the key elements of AT’s asset management planning practice that they cover.
Figure 10: AMP chapters and the key elements of asset management planning they cover
• Purpose and key elements of asset management • Strategic context • Auckland Transport's approach to asset management
1 Infrastructure asset management
• DescripLon of current assets and service acLviLes • The scope, size and value of our network assets • Overview of the regional transport network
2 The transport asset porXolio
• Understanding the needs of users and stakeholders • One Network Road ClassificaLon and levels of service • Links between assets and acLviLes, and service outcomes
3 Outcomes and levels of service
• Growth implicaLons for asset management • Strategic road and public transport networks • One Network Road ClassificaLon purpose and objecLves
4 Growth and demand
• Risks and criLcal assets • Risk management opLons and monitoring • Network asset resilience and safety
5 Risk management
• AcLve long-‐term environmental stewardship • Long-‐term social and economic management • ImplementaLon of sustainable pracLces
6 Sustainability
• CondiLon, age and operaLonal needs of assets • Recommended renewals, maintenance and operaLons investment 7 Asset investment requirements
• Funding sources • Proposed funding levels • Investment prioriLsiaLon within financial constraints
8 Funding and impacts
• LegislaLve requirements • Notes, assumpLons and limitaLons • Detailed financial tables
Appendices
• Overview of each asset class Asset class management plans
Bibliography
AT Asset Management Plan 2015 - 2018
AT Asset Management Plan 2015 – 2018 Page 23 of 139
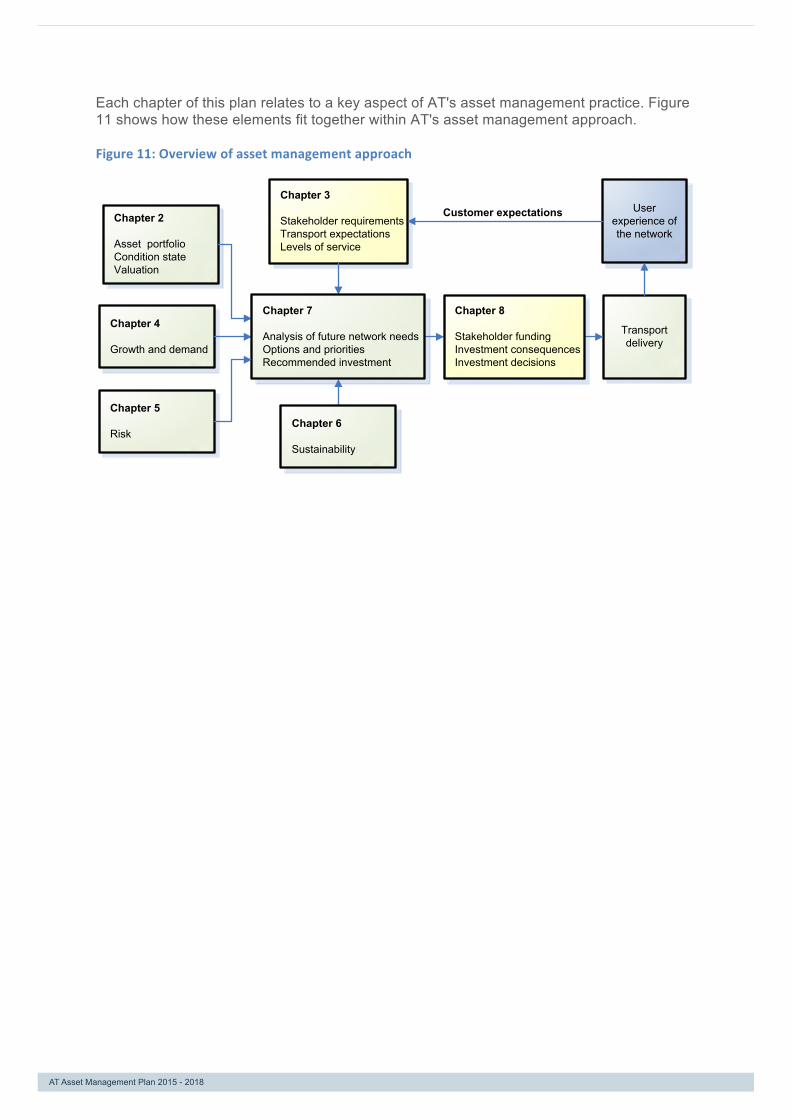
Each chapter of this plan relates to a key aspect of AT's asset management practice. Figure 11 shows how these elements fit together within AT's asset management approach. Figure 11: Overview of asset management approach
Transport delivery
Chapter 3
Stakeholder requirementsTransport expectationsLevels of service
Chapter 2
Asset portfolioCondition stateValuation
Userexperience of the network
Customer expectations
Chapter 4
Growth and demand
Chapter 5
RiskChapter 6
Sustainability
Chapter 7
Analysis of future network needsOptions and prioritiesRecommended investment
Chapter 8
Stakeholder fundingInvestment consequencesInvestment decisions
AT Asset Management Plan 2015 - 2018

AT Asset Management Plan 2015 – 2018 Page 24 of 139

AT Asset Management Plan 2015 – 2018 Page 26 of 139
AT Asset Management Plan 2015 – 2018 Page 27 of 139
1. Infrastructure asset management
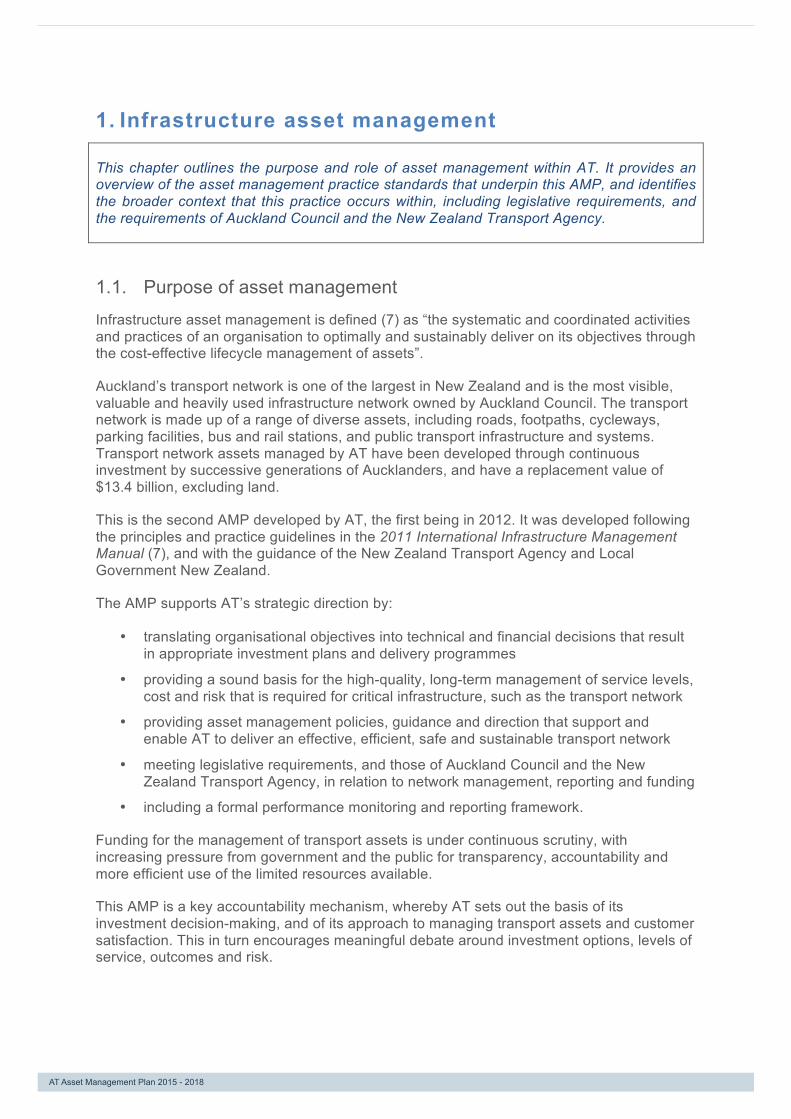
This chapter outlines the purpose and role of asset management within AT. It provides an overview of the asset management practice standards that underpin this AMP, and identifies the broader context that this practice occurs within, including legislative requirements, and the requirements of Auckland Council and the New Zealand Transport Agency.
Purpose of asset management 1.1.
Infrastructure asset management is defined (7) as “the systematic and coordinated activities and practices of an organisation to optimally and sustainably deliver on its objectives through the cost-effective lifecycle management of assets”.
Auckland’s transport network is one of the largest in New Zealand and is the most visible, valuable and heavily used infrastructure network owned by Auckland Council. The transport network is made up of a range of diverse assets, including roads, footpaths, cycleways, parking facilities, bus and rail stations, and public transport infrastructure and systems. Transport network assets managed by AT have been developed through continuous investment by successive generations of Aucklanders, and have a replacement value of $13.4 billion, excluding land.
This is the second AMP developed by AT, the first being in 2012. It was developed following the principles and practice guidelines in the 2011 International Infrastructure Management Manual (7), and with the guidance of the New Zealand Transport Agency and Local Government New Zealand.
The AMP supports AT’s strategic direction by:
• translating organisational objectives into technical and financial decisions that result in appropriate investment plans and delivery programmes
• providing a sound basis for the high-quality, long-term management of service levels, cost and risk that is required for critical infrastructure, such as the transport network
• providing asset management policies, guidance and direction that support and enable AT to deliver an effective, efficient, safe and sustainable transport network
• meeting legislative requirements, and those of Auckland Council and the New Zealand Transport Agency, in relation to network management, reporting and funding
• including a formal performance monitoring and reporting framework.
Funding for the management of transport assets is under continuous scrutiny, with increasing pressure from government and the public for transparency, accountability and more efficient use of the limited resources available.
This AMP is a key accountability mechanism, whereby AT sets out the basis of its investment decision-making, and of its approach to managing transport assets and customer satisfaction. This in turn encourages meaningful debate around investment options, levels of service, outcomes and risk.
AT Asset Management Plan 2015 - 2018
AT Asset Management Plan 2015 – 2018 Page 28 of 139
Strategic context 1.2.
AT is a Council Controlled Organisation of Auckland Council and is responsible for roads (excluding state highways), footpaths, cycling, parking and public transport in the Auckland region.
AT’s long-term planning is guided by the Auckland Plan (8), which sets out a vision for Auckland to become the world’s most liveable city.
The Auckland Plan anticipates that Auckland’s population will grow from 1.4 million to over 2.1 million people, with 237,000 new residents in the next 10 years, and a corresponding growth in jobs and businesses (2).
AT’s plans must also be consistent with the Government Policy Statement on Land Transport 2015/16–2024/25 (9), which has a strong and continuing focus on economic growth and productivity, alongside safety and value for money.
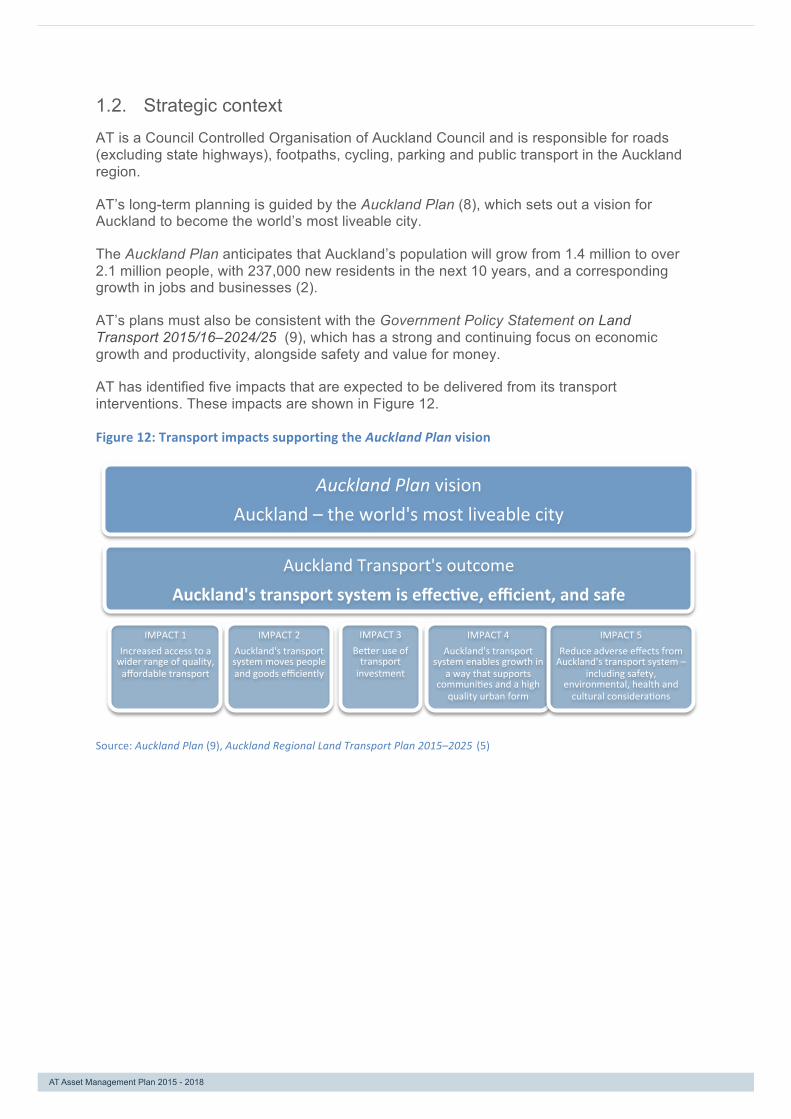
AT has identified five impacts that are expected to be delivered from its transport interventions. These impacts are shown in Figure 12.
Figure 12: Transport impacts supporting the Auckland Plan vision
Source: Auckland Plan (9), Auckland Regional Land Transport Plan 2015–2025 (5)
Auckland Plan vision Auckland – the world's most liveable city
Auckland Transport's outcome
Auckland's transport system is effec\ve, efficient, and safe
IMPACT 1 Increased access to a wider range of quality, affordable transport
IMPACT 2 Auckland's transport system moves people and goods efficiently
IMPACT 3 Beaer use of transport investment
IMPACT 4 Auckland's transport
system enables growth in a way that supports
communiLes and a high quality urban form
IMPACT 5 Reduce adverse effects from Auckland's transport system –
including safety, environmental, health and cultural consideraLons
AT Asset Management Plan 2015 - 2018
AT Asset Management Plan 2015 – 2018 Page 29 of 139
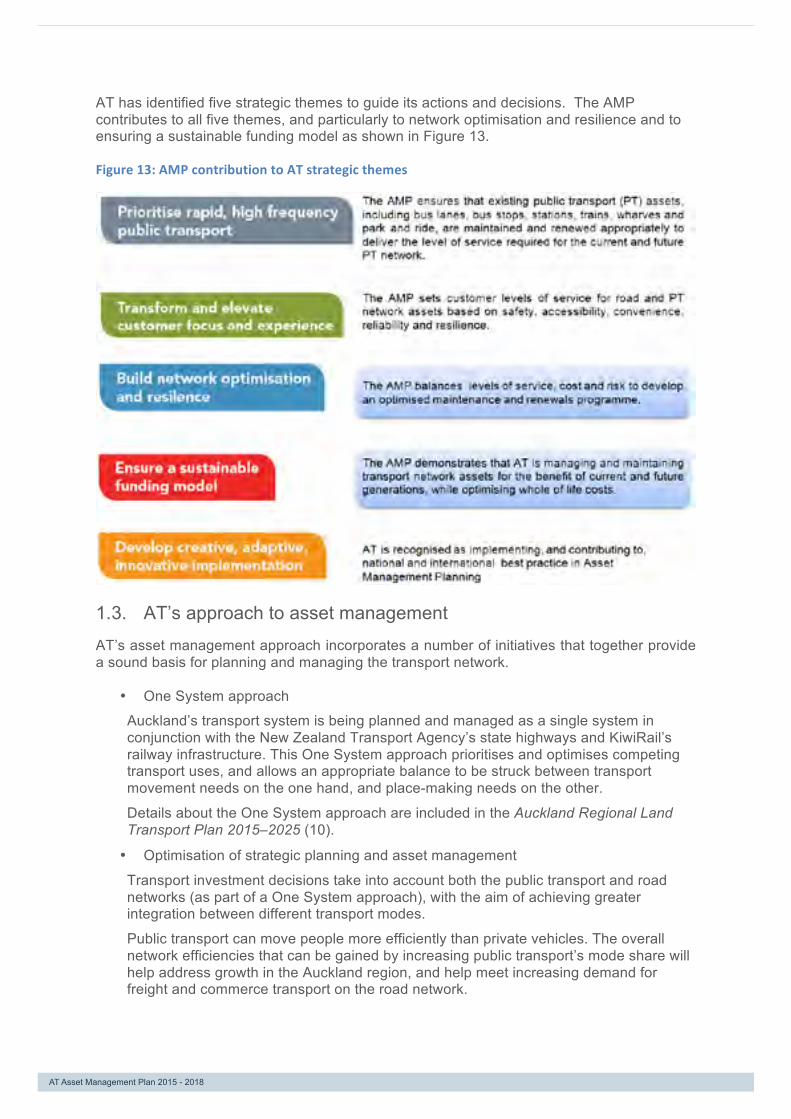
AT has identified five strategic themes to guide its actions and decisions. The AMP contributes to all five themes, and particularly to network optimisation and resilience and to ensuring a sustainable funding model as shown in Figure 13.
Figure 13: AMP contribution to AT strategic themes
AT’s approach to asset management 1.3.
AT’s asset management approach incorporates a number of initiatives that together provide a sound basis for planning and managing the transport network.
• One System approach
Auckland’s transport system is being planned and managed as a single system in conjunction with the New Zealand Transport Agency’s state highways and KiwiRail’s railway infrastructure. This One System approach prioritises and optimises competing transport uses, and allows an appropriate balance to be struck between transport movement needs on the one hand, and place-making needs on the other.
Details about the One System approach are included in the Auckland Regional Land Transport Plan 2015–2025 (10).
• Optimisation of strategic planning and asset management
Transport investment decisions take into account both the public transport and road networks (as part of a One System approach), with the aim of achieving greater integration between different transport modes.
Public transport can move people more efficiently than private vehicles. The overall network efficiencies that can be gained by increasing public transport’s mode share will help address growth in the Auckland region, and help meet increasing demand for freight and commerce transport on the road network.
AT Asset Management Plan 2015 - 2018

AT Asset Management Plan 2015 – 2018 Page 30 of 139
• Travel demand management
Travel demand management maximises the use of the existing road network’s capacity by managing demand. These measures aim to address traffic congestion in ways other than by increasing the road network’s capacity, ranging from walking school buses to traffic signal optimisation. .
• Funding prioritisation
Key AT priorities are to operate, maintain and renew infrastructure optimally; to manage demand efficiently and safely; and to make better use of networks. Protecting existing investment in the transport network is considered a higher priority than building additional capacity through investing in new infrastructure, services and technology, as shown in Figure 14.
Figure 14: Four-‐stage intervention process
Source: Auckland Regional Land Transport Plan 2015–2025 (5)
• Whole-of-life cost optimisation
This approach involves minimising the total cost of ownership over the life of an asset for the levels of service provided. Typical areas of expenditure that are included in calculating the whole-of-life cost of owning an asset include maintenance, renewal and rehabilitation, depreciation and cost of finance, and replacement or disposal costs. AT uses optimised decision-making to minimise the total cost of asset ownership by providing an optimal balance between renewals and maintenance investment levels, levels of service and risk.
• Industry best-practice
AT uses the 2011 International Infrastructure Management Manual (7) guidelines for asset management practice. During 2015, AT will also review the recently published ISO55000 series standards for asset management, and consider adopting them as part of its AMP improvement plan.
Associated documents 1.4.
This AMP is a 30-year plan, with a focus on the first 10 financial years from 2015/2016 to 2024/2015. It helps inform AT’s strategic plans and new capital investment decisions, and sets out its proposed expenditure for operating, maintaining and renewing its existing assets.
The AMP is a key input into AT’s 10-year Auckland Regional Land Transport Plan 2015–2025, which in turn informs:
AT Asset Management Plan 2015 - 2018
AT Asset Management Plan 2015 – 2018 Page 31 of 139
• the transport content of Auckland Council’s Long-Term Plan 2015–2025 (the long-term plan)
• the Auckland content of the New Zealand Transport Agency’s National Land Transport Programme 2012–2015 (NLTP).
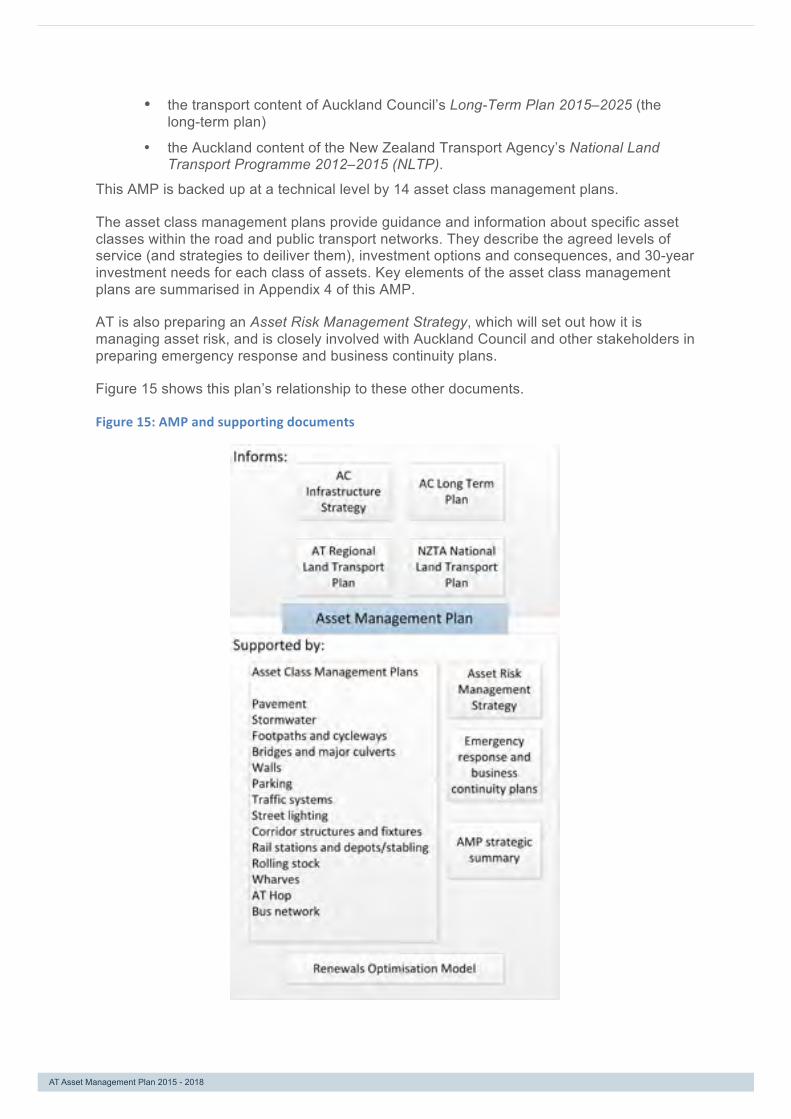
This AMP is backed up at a technical level by 14 asset class management plans.
The asset class management plans provide guidance and information about specific asset classes within the road and public transport networks. They describe the agreed levels of service (and strategies to deiliver them), investment options and consequences, and 30-year investment needs for each class of assets. Key elements of the asset class management plans are summarised in Appendix 4 of this AMP.
AT is also preparing an Asset Risk Management Strategy, which will set out how it is managing asset risk, and is closely involved with Auckland Council and other stakeholders in preparing emergency response and business continuity plans.
Figure 15 shows this plan’s relationship to these other documents.
Figure 15: AMP and supporting documents
AT Asset Management Plan 2015 - 2018

AT Asset Management Plan 2015 – 2018 Page 32 of 139


AT Asset Management Plan 2015 – 2018 Page 34 of 139
AT Asset Management Plan 2015 – 2018 Page 35 of 139
2. The transport asset portfolio
The transport network comprises a broad range of assets that underpin the delivery of transport services. This chapter identifies the range, extent, valuation and condition state of those assets, and their current suitability to deliver levels of service.
Key messages
• Auckland’s road network supports 8 billion vehicle kilometres travelled each year, of which between 2% and 6% are trucks and other heavy commercial vehicles.
• Public transport network supported 79 million PT trips in 2014/2015
• The replacement value of transport infrastructure assets is $13.4 billion.
• The transport network is depreciating by $261 million annually, which is the equivalent of $715,000 a day.
• The transport network has used approximately 33 per cent of its ability to deliver future economic benefit,
• Asset condition within the network is currently good, with only 1 per cent of assets in very poor condition.
• The road and public transport networks are growing and changing (see Chapter 4).
Asset overview 2.1.
AT is one of the largest transport providers in New Zealand and manages the most complex and diverse network, including road and public transport networks.
AT’s transport asset portfolio grows each year, as new assets are constructed through AT projects and by developers. Asset growth is considered in Section 4.4.
Road network The road network enables the daily flow of people and commerce across the region through a portfolio of diverse assets including roads, footpaths, streetlights, signs, traffic signals, parking, cycleways, road drainage, kerbs and channels, bridges and retaining structures.
Each Aucklander uses the road network to make, on average, four trips (two return trips) each day. Of these trips, around half are as car driver, a quarter are as car passenger, and the remaining quarter are walking, public transport or cycling trips (in that order) (10).
The road asset network supports:
• 8 billion vehicle kilometres travelled each year (11)
• over 54 million tonnes of freight moved to, from and around Auckland each year (8)
• 3,650 customer requests for service each month
• 5,300 walking trips into the city centre during the morning peak
• 958,000 cycling trips in designated areas each year (3)
AT Asset Management Plan 2015 - 2018

AT Asset Management Plan 2015 – 2018 Page 36 of 139
• Over 4,000 children walking to school each morning on over 400 walking school buses
• over 10,000 corridor access requests processed annually. (13)
Public transport network
The public transport network supports the provision of public transport services by third party suppliers including bus, ferry and rail services.
The public transport network supports:
• 79 million public transport trips in 2014/2015, made up of:
o 60 million passenger trips on bus services
o 14 million passenger trips on rail
o 5 million passenger trips on ferries
• 100,000 AT HOP cards issued
• 205 contracted services in place, including 28 school bus contracts.
2.2. Asset value and depreciation
AT assets in total have a value of $16.5 billion, including land, corporate assets and intangible assets such as software. This AMP is concerned with AT’s road and public transport network assets, which have a replacement value of $13.351 billion, as shown in Table 7.3
The current (depreciated) value of AT assets is $8.973 billion, indicating that the network has used approximately 33 per cent of its service potential.
Transport network assets are depreciating by approximately $261 million annually, or $715,000 a day.
Table 7: Network valuation ($ million)
Network Replacement value Current (depreciated) value Annual depreciation Road network 11,974 7,835 225 Public transport network 1,376 1,138 37 Total 13,351 8,973 261
Source: AT valuation reports as set out in Appendix 2
3 Further detail of valuation dates and assumptions is provided in Appendix 2.
AT Asset Management Plan 2015 - 2018

AT Asset Management Plan 2015 – 2018 Page 37 of 139
Road network The road network has a total replacement value of $11.97 billion. The network:
• has a depreciated value of $7.83 billion, indicating that it has used approximately 35 per cent of its service potential
• uses 1.8 per cent of its service potential each year
• assets have an average of 55 years of overall service life
• assets have, on average, 36 years of remaining service life.
Road pavement represents 58 per cent of the total investment in the road network, followed by stormwater assets (including kerbs and channels, cesspits and culverts), which represent 20 per cent of the total, as shown in Figure 16.
Further details about AT’s road assets are provided in the asset class management plans: see Appendix 4 for summaries.
Figure 16: Road network value
Source: AT valuation reports as set out in Appendix 2
AT Asset Management Plan 2015 - 2018

AT Asset Management Plan 2015 – 2018 Page 38 of 139
Public transport network Over the period covered by this AMP, AT will be operating:
• 6 busway stations, including the new Silverdale station • bus stops and bus shelters • 41 existing rail stations with scheduled services, and a new station at Parnell • 57 electric multiple units and 10 diesel multiple units, with the diesel trains dedicated
to the Pukekohe to Papakura shuttle service • an electric multiple units depot and maintenance facility at Wiri, and distributed
stabling facilities • 21 ferry wharves • the AT HOP ticketing system, including ticketing and fare payment devices and
software.
The total replacement value of AT’s public transport assets is $1,376 million, as summarised in Table 8.
Table 8: Public transport network value ($ million)
Asset class Optimised replacement cost
Optimised depreciated replacement cost
Rail stations and depots 620 478 Trains 504 496 Wharves 110 58 AT HOP 83 60 Bus network 60 46 Rail stations and depots 620 478 Total public transport network assets 1,376 1,138
Source: AT valuation reports as set out in Appendix 2
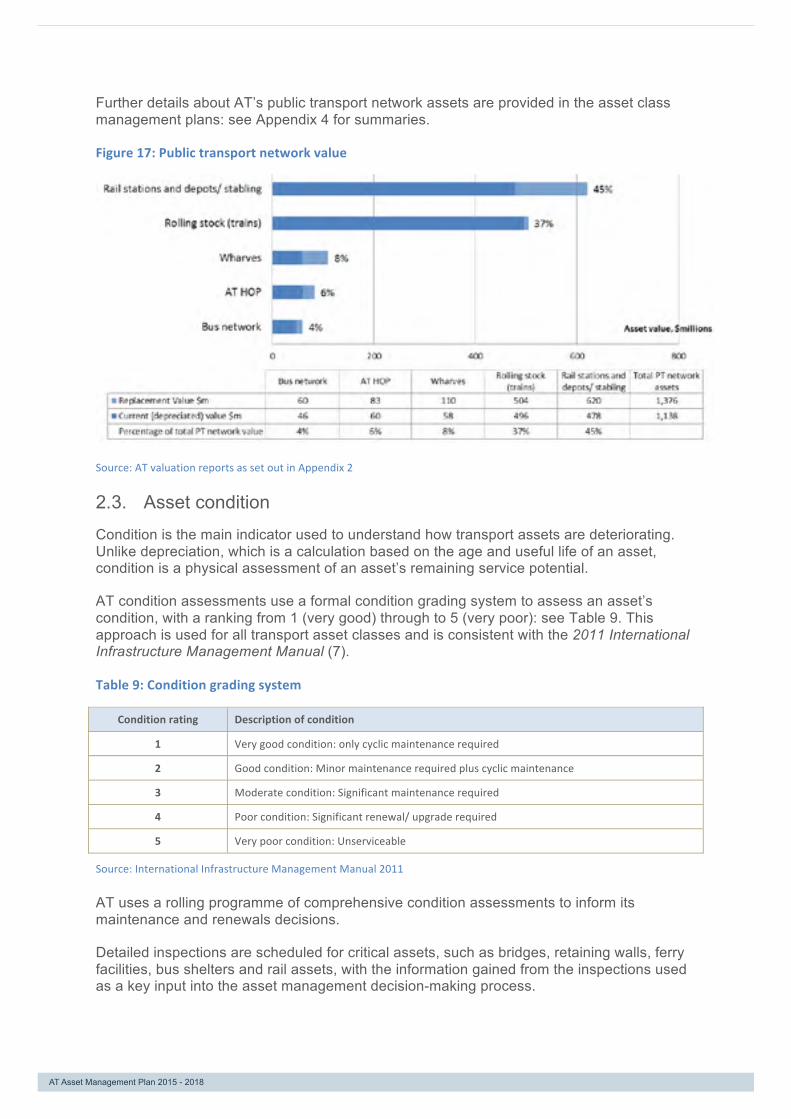
Figure 17 shows that rail stations and depots represent 45 per cent of the total investment in the public transport network, followed by trains at 37 per cent.
This valuation indicates that, as a group, public transport assets have used approximately 17 per cent of their service potential. However, the electric trains, the AT HOP system and the rail stations are relatively new investments, which are expected to have many years of useful life remaining.
AT Asset Management Plan 2015 - 2018
AT Asset Management Plan 2015 – 2018 Page 39 of 139
Further details about AT’s public transport network assets are provided in the asset class management plans: see Appendix 4 for summaries.
Figure 17: Public transport network value
Source: AT valuation reports as set out in Appendix 2
Asset condition 2.3.
Condition is the main indicator used to understand how transport assets are deteriorating. Unlike depreciation, which is a calculation based on the age and useful life of an asset, condition is a physical assessment of an asset’s remaining service potential.
AT condition assessments use a formal condition grading system to assess an asset’s condition, with a ranking from 1 (very good) through to 5 (very poor): see Table 9. This approach is used for all transport asset classes and is consistent with the 2011 International Infrastructure Management Manual (7).
Table 9: Condition grading system
Condition rating Description of condition
1 Very good condition: only cyclic maintenance required
2 Good condition: Minor maintenance required plus cyclic maintenance
3 Moderate condition: Significant maintenance required
4 Poor condition: Significant renewal/ upgrade required
5 Very poor condition: Unserviceable
Source: International Infrastructure Management Manual 2011
AT uses a rolling programme of comprehensive condition assessments to inform its maintenance and renewals decisions.
Detailed inspections are scheduled for critical assets, such as bridges, retaining walls, ferry facilities, bus shelters and rail assets, with the information gained from the inspections used as a key input into the asset management decision-making process.
AT Asset Management Plan 2015 - 2018
AT Asset Management Plan 2015 – 2018 Page 40 of 139
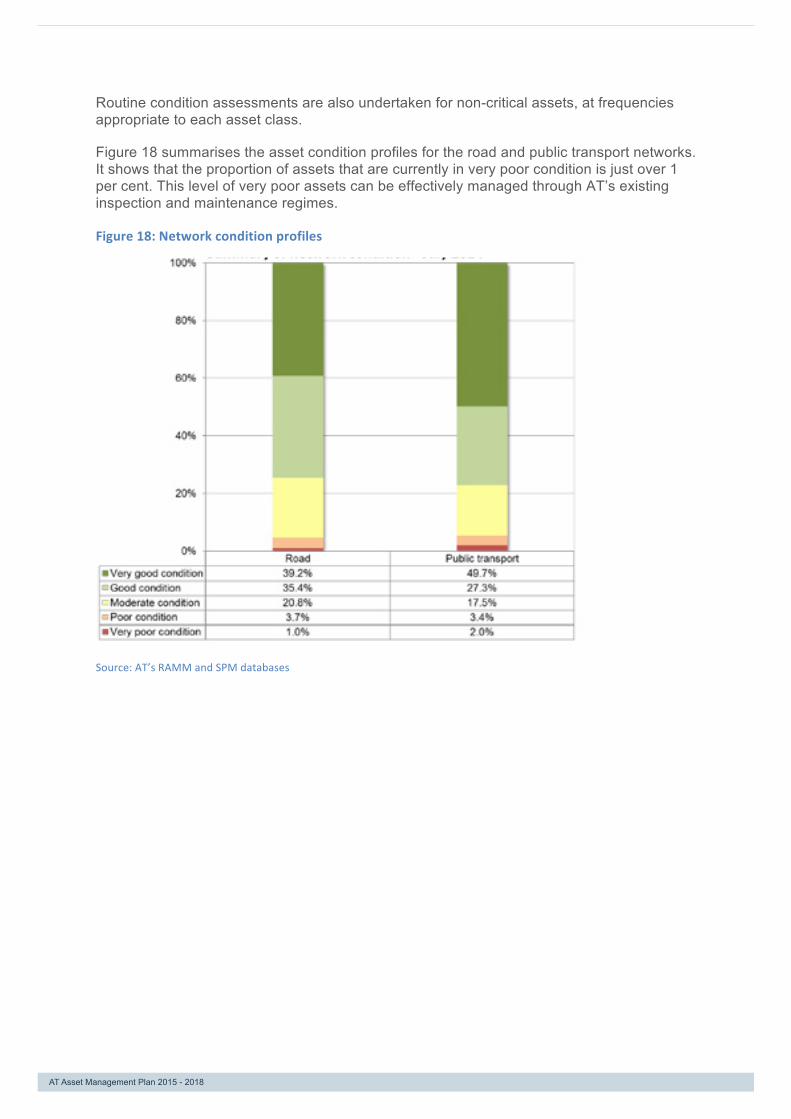
Routine condition assessments are also undertaken for non-critical assets, at frequencies appropriate to each asset class.
Figure 18 summarises the asset condition profiles for the road and public transport networks. It shows that the proportion of assets that are currently in very poor condition is just over 1 per cent. This level of very poor assets can be effectively managed through AT’s existing inspection and maintenance regimes.
Figure 18: Network condition profiles
Source: AT’s RAMM and SPM databases
AT Asset Management Plan 2015 - 2018

AT Asset Management Plan 2015 – 2018 Page 41 of 139
Figure 19 summarises the condition profile of the individual asset classes that make up the transport network. Detailed condition profiles for each asset class are contained in the asset class management plans, summaries of which can be found in Appendix 4.
Most AT assets are in good or very good condition and this holds true across all the asset classes. The proportion of assets in very poor condition is generally in the range of 0–2 per cent, although it is higher for wharves (4.4 per cent) and pavement (3.2 per cent).
Figure 19: Summary condition profiles of asset classes
Source: AT’s RAMM and SPM databases
Asset condition trends 2.4.
The 10-year condition trend of AT’s road pavement assets is shown in Figure 20. It shows that current levels of investment are maintaining the pavement to a consistently good standard. Consistent data for pavement is available from 2004, the longest time series of all the asset classes. Figure 20 shows that AT is managing its most valuable asset to a high standard.
Figure 20: Pavement condition index (higher number represents better pavement condition)
Source: New Zealand Transport Agency, October 2014
AT Asset Management Plan 2015 - 2018

AT Asset Management Plan 2015 – 2018 Page 42 of 139
Figure 21 shows recent condition trends for selected key assets. Over the past three years, most assets have been maintained in a stable condition.
Wharves and pavement, which have the highest proportion of assets in very poor condition, also showed the greatest improvement over the 2012–2015 period. This is because AT’s renewals programme targets all very poor condition assets, restoring these to good or very good condition.
Figure 21: Condition trends for selected key assets
Source: AT’s RAMM and SPM databases
AT Asset Management Plan 2015 - 2018


AT Asset Management Plan 2015 – 2018 Page 44 of 139
AT Asset Management Plan 2015 – 2018 Page 45 of 139
3. Outcomes and levels of service
The transport network is built and managed to provide value to its stakeholders, including its users and the broarder community. This chapter identifies the transport stakeholders, their expectations of the network, the levels of service required to deliver to those expectations, and AT’s current performance in meeting these expectations.
Key messages
Customer satisfaction and technical levels of service have improved in the areas of the network that AT has invested in, especially the rail network.
There has been little change over time in levels of service for the more business-as-usual areas of the network, such as footpaths and ferry services. There has been some increase in satisfaction with the quality of roads.
Customer perceptions of the network’s safety have not changed materially. Actual trends in deaths and serious injuries show that the previous long-term trend of improved (reduced) road trauma has stalled and partly reversed in recent years.
AT’s future targets are for:
• continued improvements in customer satisfaction with public transport services
• static satisfaction and declining technical levels of service for roads, in line with the impacts of constrained renewals budgets
• a return to the previous trend of steadily reducing road deaths and serious injuries.
Measuring network outcomes 3.1.
This section sets out how AT defines and measures the suitability, performance, safety and condition of its transport assets.
Customers and other stakeholders expect that the transport network will continue to provide reliable and safe services, every day, year after year. To ensure that these expectations are met, AT manages its transport assets to:
• deliver the transport outcomes defined in Auckland Council’s and its own strategies
• achieve customer levels of service, and their supporting technical levels of service
• manage risk (see Chapter 5)
• achieve value for money (see Chapter 7).
Levels of service describe the standards which AT delivers in its management and maintenance of the network. The result is transparency for the public and other stakeholders that the network can support lifestyle and business needs, and confidence in AT’s management of the network.
AT Asset Management Plan 2015 - 2018

AT Asset Management Plan 2015 – 2018 Page 46 of 139
Stakeholders and transport outcomes 3.2.
Asset management aims, among other things, to meet stakeholders’ expectations. This requires asset managers to have a good understanding of stakeholder values and drivers. Table 10 sets out an overview of stakeholder expectations of and requirements for the Auckland transport network.
Table 10: Stakeholders and their transport expectations
Stakeholders Areas of interest and expectations Consultation or feedback method used
Transport customers (residential)
The main improvements suggested by: • residential road users:
o smooth roads Auckland-wide o quality roads in local area o safety
• footpath users: o smooth footpaths o more and continuous footpaths o well-maintained footpaths
• cyclists: o more provision for cyclists o wider cycle lanes o safety
• public transport users: o more frequent services o reduced fares o improved punctuality and reliability
(especially of trains).
Auckland Road User Satisfaction Survey - Residential (12) AT research panel findings (13).
Transport customers (commercial)
The main improvements suggested by commercial road users: • improve traffic flow • improve public transport.
Auckland Road User Satisfaction Survey - commercial (12)
Auckland residents and ratepayers
Aucklanders: • want public transport, but it has to be convenient,
reliable and quicker. • want to walk and cycle but it has to be safe. • want better transport but have mixed views on how
to raise the additional investment required. • want current funding to be reallocated more
favourably towards public transport, walking and cycling.
Feedback on the draft Long-Term Plan 2015–2025 as summarised in Auckland Regional Land Transport Plan 2015–2025 (5)
Auckland Council Deliver the outcomes in the Auckland Plan and Unitary Plan. Provide value for money.
AT’s annual statement of intent (3). Elected member liaison team.
Local boards Generally support AT projects. Central local boards favour more walking and cycling projects. Outer (rural and semi-rural) local boards favour more sealing of unsealed roads (14).
Elected member liaison team.
AT Asset Management Plan 2015 - 2018

AT Asset Management Plan 2015 – 2018 Page 47 of 139
Stakeholders Areas of interest and expectations Consultation or feedback method used
Other council-controlled organisations
Integrated planning, including: • for the CBD, with Waterfront Auckland and
Auckland Council Property Ltd • for events, with Auckland Tourism, Events and
Economic Development.
Direct liaison. Joint working groups.
New Zealand Transport Agency
Deliver government policy statement outcomes. Provide value for money. Partnership projects, including the AT Operations Centre, and the One Network Road Classification.
Direct liaison. Non-voting member on AT’s board. Memorandum of understanding (February 2012).
KiwiRail AT rolling stock and station assets are well maintained and meet appropriate safety standards.
Direct liaison.
Ports of Auckland and Auckland International Airport Ltd
Arterial road efficiency and reliability for carrying freight. Integrated planning.
Liaison with industry groups.
Mana Whenua Mana Whenua want to achieve: • A good relationship with AT • AT to recognise Te Ao Māori (the Māori world
view) • A set of overarching principles for Te Ao Māori • The Mauri Model method (Māori values) reflected
in prioritisation
Independent Māori Statutory Board; Tamaki Regional Mana Whenua Forum; Tamaki (Treaty Negotiations) Collective; AT Māori relationships team engagement with runanga, iwi and hapu authorities..
Industry and customer groups (including the Road Users Forum, Business Forum, and walking and cycling advocates)
Integrated planning. Network efficiency and reliability. Specific network improvements. Access to properties.
Direct liaison and through industry groups.
Utilities (e.g. Watercare, Telecom, Vector)
Corridor access. Programming.
Direct liaison and through industry groups.
Adjoining road corridor authorities
Network services alignment. Standards and protocols.
Direct liaison.
Transport operators Customer service experiences. Travel time reliability, and bus priority. Public transport demand. Network performance. Scheduling, ticketing and information systems. Service subsidies.
Through commercial franchising model.
AT Asset Management Plan 2015 - 2018

AT Asset Management Plan 2015 – 2018 Page 48 of 139
3.3. Level of service framework
AT performance indicators for asset management are aligned to the Auckland Plan goal of making Auckland the world’s most liveable city. The level of service framework (Figure 22) shows how KPIs measure the effectiveness of AT’s transport services and contribute to the outcomes in the Auckland Plan. The framework enables AT to focus its transport programmes to prioritise activities that contribute to strategic goals.
Figure 22: Level of service framework
Vision
Outcomes linked to transport
Strategic directions
Transformational shifts
AT Strategic Themes Prioritise rapid, high frequency public transportTransform and elevate customer experience
AT Impacts
Strategic service values Accessibility Amenity Convenience Affordability Resilience
Peoples access to jobs
Asset quality AIFS usage Transport affordability
Increase resilience of the network
Public transport access
Road customer satisfaction with
network
PT mode transfer usage
Optimise ‘whole of life cycle’ asset management
Public transport patronage Road VKT Freight tonnage
Mode sharePT customer
satisfaction with network
Arterial road network
productivity
Public transport efficiency TDM
Public transport am peak mode
shareValue for money
Access to property Economic sustainability Public transport General traffic Freight
Parking PT commute travel times Transport delay Strategic freight
route mobility
Unitary Plan requirements implemented
Bus congestion Road congestion
Tactical service values Accessibility Quality Convenience Affordability Reliability Resilience
Increase availability of travel
options
Assets and services are fit for
purpose
Improve signage and real-time information
Provide assets and services at least whole of life cost
Reduce road peak congestion
Improve or maintain road
travel time reliability
Resolution rate for Requests for
Service
Manage parking opportunities
Assets are in good condition
Improve inter-modal links across
public transport
Capital projects are managed within budget
Public transport capacity to match
demand
Improve public transport travel time reliability
Response to incidents and
failures
Improve the freight network
Reduce or maintain journey time for public
transportImprove integration of
utilities and access requests
Reduce or maintain road journey times
Improve availability of footpaths in the
urban area
Improve capacity and efficiency of
freight routes
Improve cycle networks
Operational inputs
Programmes to deliver
Accessibilityprogrammes
Qualityprogrammes
Ease of useprogrammes
Economic efficiency
programmes
Capacityprogrammes
Reliability programmes
Responsivenessprogrammes
Build network optimisation and resilience
Auckland, the world’s most liveable city
Move to outstanding public transport within one network / Radically improve the quality of urban living
Improve transport journey time reliability
Assets & servicesTactical outputs
(AMP focus)
Efficiency
TacticalLevels of Service
NetworkStrategic outputs
Movement
StrategicLevels of Service
Capacity of the transport system to meet demand
AT Strategic Themes Increased access to a wider range of quality,
affordable transport choicesAuckland's transport network moves people
and goods efficientlyBetter use of transport
investment
Auckland Plan
A well-connected and accessible Auckland An Auckland of prosperity and opportunity
Create better connections and accessibility within Auckland, across New Zealand and to the world
Develop an economy that delivers opportunity and prosperity for all Aucklanders and New Zealand
AT Asset Management Plan 2015 - 2018

AT Asset Management Plan 2015 – 2018 Page 49 of 139
Vision
Outcomes linked to transport
Strategic directions
Transformational shifts
Ensure a sustainable funding modelDevelop creative, adaptive, innovative implementation AT Strategic Themes
AT Impacts
Strategic service values
Safe vehicleenvironment
Safe pedestrian
environment
Safe cycleenvironment
Safe public transport
Support for community
safety
Sustainability - resource use and climate
Sustainability - emissions and
community
Tactical service values
Minimise fatal and serious injuries per
100 million VKT
Minimise pedestrian fatal
and serious injuries
Minimise cycle fatal and serious
injuries
Minimise PT fatal/serious
injuries
Increase coverage of school travel programmes
Minimise carbon footprint Minimise air pollution
Provide road safety
programmes targeted to risk
Availability of pedestrian crossings
Increase cycle safety education
programmes
Minimise PT safety and security
incidents
Provide community safety
programmes
Maximise the economic value of recycled materials
Minimise water pollution
Increase road safety education
programmes
Eliminate very poor condition
footpaths
Provide targeted cycle safety
projects
Provide PT safety and security programmes
Support emergency
services
Minimise pollution of soil
Increase police road safety liaison
programmes
Eliminate very poor condition
cycleways
Provide transport component for Civil Defence
Minimise noise and light pollution
Minimise number of motorcycle fatal
and serious injuries
Eliminate prosecutions for RMA
non-complianceManage temporary hazards and safety
of road workers
Vehicle safetyprogrammes
Pedestrian safetyprogrammes
Cycle safety programmes
Public transport safety
programmes
Community safetyprogrammes
Recyclingprogrammes
Pollution controlprogrammes
Programmes to deliver
Operational inputs
StrategicLevels of Service
TacticalLevels of Service
Auckland Plan
AT Strategic Themes
NetworkStrategic outputs
Assets & servicesTactical outputs
(AMP focus)
Auckland, the world’s most liveable city
Water quality
Fossil fuel energy consumption
Safety Environmental
Road fatalities and serious injuries Greenhouse gas emissions
Public transport safety and secuity Air quality
Reduce adverse effects from Auckland's transport system – including safety, environmental, health and cultural
considerations
Move to outstanding public transport within one network / Radically improve the quality of urban living
Auckland's transport system enables growth in a way that supports communities and a high quality urban form
A fair, safe and healthy Auckland A green Auckland
Create a strong, inclusive and equitable society that ensures opportunity for all Aucklanders
Contribute to tackling climate change and increasing energy
resilience
AT Asset Management Plan 2015 - 2018
AT Asset Management Plan 2015 – 2018 Page 50 of 139
Customer levels of service 3.4.
Stakeholders’ expectations of the transport network are expressed by customer levels of service (which focus on the services customers experience) and technical levels of service (which provide information about the supporting technical requirements).
Customers are likely to be satisfied when the transport network is:
• Safe: the network is safer, and feels safer for all users over time
• Accessible: it is easy to access the network and get to your destination
• Convenient: the network is easy to use and travelling is a pleasant experience
• Reliable: travel times for people and freight are predictable and reliable
• Resilient: when things go wrong, other travel options are available and access is quickly restored
AT’s activities aimed at achieving these things include:
• maintenance programmes, including smoothing pavements, marking roads, cleaning cesspits and managing vegetation
• renewals programmes, for example road reseals, streetlight replacements, bus station refurbishments and bridge bearing replacements
• design guidelines, so that roads, footpaths and public transport assets, whether built by AT or by developers, are fit for purpose and cost effective for the whole of their lives
• operational programmes, including managing bus, rail and ferry services, optimising traffic signals, delivering safety campaigns, and promoting walking and cycling.
• capital improvement projects
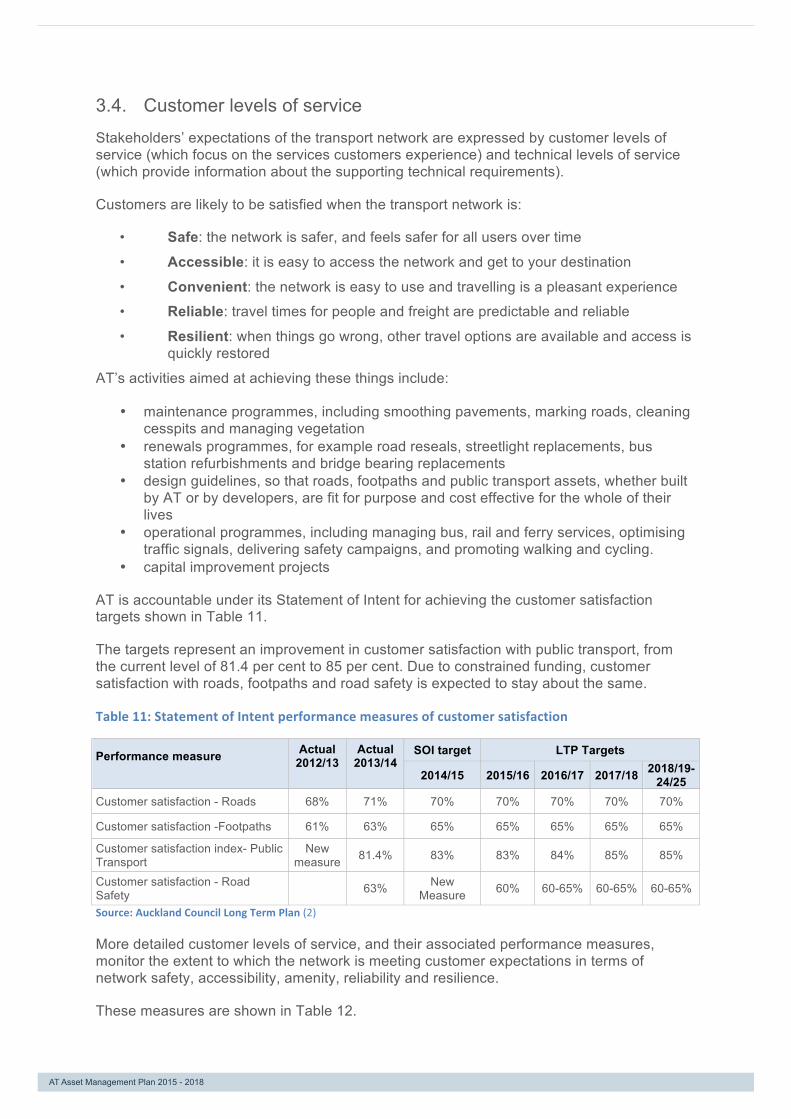
AT is accountable under its Statement of Intent for achieving the customer satisfaction targets shown in Table 11.
The targets represent an improvement in customer satisfaction with public transport, from the current level of 81.4 per cent to 85 per cent. Due to constrained funding, customer satisfaction with roads, footpaths and road safety is expected to stay about the same.
Table 11: Statement of Intent performance measures of customer satisfaction
Performance measure Actual 2012/13
Actual 2013/14
SOI target LTP Targets
2014/15 2015/16 2016/17 2017/18 2018/19- 24/25
Customer satisfaction - Roads 68% 71% 70% 70% 70% 70% 70%
Customer satisfaction -Footpaths 61% 63% 65% 65% 65% 65% 65%
Customer satisfaction index- Public Transport
New measure 81.4% 83% 83% 84% 85% 85%
Customer satisfaction - Road Safety 63% New
Measure 60% 60-65% 60-65% 60-65%
Source: Auckland Council Long Term Plan (2)
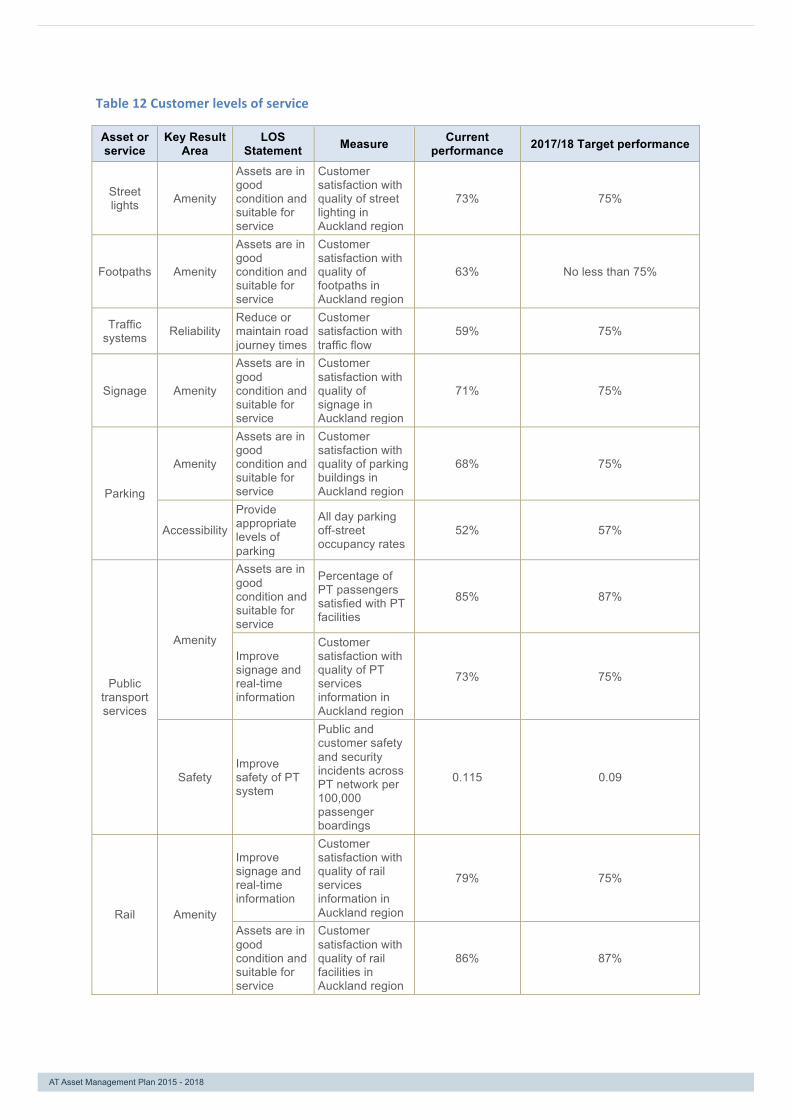
More detailed customer levels of service, and their associated performance measures, monitor the extent to which the network is meeting customer expectations in terms of network safety, accessibility, amenity, reliability and resilience.
These measures are shown in Table 12.
AT Asset Management Plan 2015 - 2018
AT Asset Management Plan 2015 – 2018 Page 51 of 139
Table 12 Customer levels of service
Asset or service
Key Result Area
LOS Statement Measure Current
performance 2017/18 Target performance
Street lights Amenity
Assets are in good condition and suitable for service
Customer satisfaction with quality of street lighting in Auckland region
73% 75%
Footpaths Amenity
Assets are in good condition and suitable for service
Customer satisfaction with quality of footpaths in Auckland region
63% No less than 75%
Traffic systems Reliability
Reduce or maintain road journey times
Customer satisfaction with traffic flow
59% 75%
Signage Amenity
Assets are in good condition and suitable for service
Customer satisfaction with quality of signage in Auckland region
71% 75%
Parking
Amenity
Assets are in good condition and suitable for service
Customer satisfaction with quality of parking buildings in Auckland region
68% 75%
Accessibility
Provide appropriate levels of parking
All day parking off-street occupancy rates
52% 57%
Public transport services
Amenity
Assets are in good condition and suitable for service
Percentage of PT passengers satisfied with PT facilities
85% 87%
Improve signage and real-time information
Customer satisfaction with quality of PT services information in Auckland region
73% 75%
Safety Improve safety of PT system
Public and customer safety and security incidents across PT network per 100,000 passenger boardings
0.115 0.09
Rail Amenity
Improve signage and real-time information
Customer satisfaction with quality of rail services information in Auckland region
79% 75%
Assets are in good condition and suitable for service
Customer satisfaction with quality of rail facilities in Auckland region
86% 87%
AT Asset Management Plan 2015 - 2018

AT Asset Management Plan 2015 – 2018 Page 52 of 139
Asset or service
Key Result Area
LOS Statement Measure Current
performance 2017/18 Target performance
Customer satisfaction with quality of rail vehicles in Auckland region
92.9% 87%
Bus Amenity
Improve signage and real-time information
Customer satisfaction with quality of bus services information in Auckland region
72% 75%
Assets are in good condition and suitable for service
Customer satisfaction with quality of bus facilities in Auckland region
85% 87%
Ferry Amenity
Improve signage and real-time information
Customer satisfaction with quality of ferry services information in Auckland region
76% 75%
Assets are in good condition and suitable for service
Customer satisfaction with quality of ferry facilities in Auckland region
89% 87%
Technical levels of service 3.5.
Technical levels of services are aligned to the core services AT delivers and the assets that support this delivery.
For the road transport network, AT’s core services are:
• providing a suitable road corridor that allows people and goods to move efficiently and safely
• providing access to the road network for adjacent land-users, properties and businesses
• playing a central role in the management of parking in Auckland
• managing access to the road corridor for utilities to install and maintain their assets.
For the public transport network, AT’s core services include:
• moving people efficiently and safely
• providing transport mode choices for people to travel around the region
• responding to current and future demand to reduce congestion
Technical levels of services use quantitative measures such as asset condition and performance, to measure how effective assets are in relation to delivering these services.
AT Asset Management Plan 2015 - 2018
AT Asset Management Plan 2015 – 2018 Page 53 of 139
Headline performance measures for the technical levels of service, shown in Table 13, are defined at a national level by the Department of Internal Affairs (17). From 2015, members of the public will be able to compare the performance of AT with other local councils, as the same level of service measures will be common to all.
AT’s constrained funding, as signalled in Auckland Council’s Long-Term Plan 2015–2025, is reflected in the targets for the headline performance measures; the targets show a projected decline in road maintenance standards and, to a lesser extent, footpath maintenance.
Changes in standards will be targeted to particular areas, with higher levels of service being maintained for higher risk and higher impact assets. So, for example, arterial and collector roads will be continue to be maintained to a high standard, but levels of service may need to be reduced for lower-volume local roads.
Table 13: Headline measures of technical levels of service
Performance measure Actual 2012/13
Actual 2013/14
SOI/Annual Plan targets
2014/15
LTP targets
2015/16 2016/17 2017/18 2018/19- 24/25
The change from the previous financial year in the number of deaths and serious injuries on the local road network, expressed as a number
+21% 2.66% reduction
Reduce by at
least 9
Reduce by at
least 9
Reduce by at
least 9
Reduce by at
least 9
Road maintenance standards (ride quality) as measured by smooth travel exposure (STE) for all urban and rural roads
Rural 95 Urban 85
Rural 95 Urban 85
Rural 94 Urban 84
Rural 93 Urban
83
Rural 92 Urban
82
Rural 91
Urban 81
Rural 87 Urban
77
Percentage of the sealed local road network that is resurfaced 7.6% 8% 8% 8% 8% 8%
Percentage of footpaths in acceptable condition (as defined in AT’s AMP)
99% 99% 99% 99% 99% 99% 98%
Percentage of customer service requests relating to roads and footpaths which receive a response within the time frame specified in Auckland Council’s Long-term Plan.
85% 85% 85% 85% 85% 85% 85%
More detailed Technical Level of Service measures are shown in Table 14.
Table 14 Technical levels of service
Asset or service
Key Result Area LOS Statement Measure Current
performance 2017/18 Target performance
Bridges & structures Amenity
Assets are in good condition and suitable for service
% of asset in condition grade 5 1.7% 1.1%
% bridges and major culverts on High Productivity Motor Vehicle routes and lifeline routes with weight and speed restrictions
0% 0%
Street lights Amenity
Assets are in good condition and suitable for service
% of asset in condition grade 5 1.9% 1.1%
AT Asset Management Plan 2015 - 2018

AT Asset Management Plan 2015 – 2018 Page 54 of 139
Asset or service
Key Result Area LOS Statement Measure Current
performance 2017/18 Target performance
Footpaths Amenity
Assets are in good condition and suitable for service
% of northern area footpaths in condition grade 5
0.2% 0%
% of central area footpaths in condition grade 5 0.7% 0%
% of western area footpaths in condition grade 5
0.6% 0%
% of southern area footpaths in condition grade 5
0.6% 0%
Drainage Amenity
Assets are in good condition and suitable for service
% of catchpits in condition grade 5 0.5% 0%
% of kerb & channel in condition grade 5 0.9% 0%
Traffic systems Efficiency
Assets are in good condition and suitable for service
% of asset in condition grade 5 0.1% 0.1%
Reduce or maintain road journey times
% signal uptime 98% 99% Percentage of arterial routes with signal optimisation in place
10% (2012) >50%
Signage Amenity
Assets are in good condition and suitable for service
% of asset in condition grade 5 0.4% 0.1%
Parking
Amenity
Assets are in good condition and suitable for service
% of parking building assets in condition grade 5 0.1% 0.3%
Uptime of parking building ticket machines 96% 95%
Accessibility Provide appropriate levels of parking
All day parking off-street occupancy rates 52% 57%
Rail Amenity
Assets are in good condition and suitable for service
% of rail station assets in condition grade 5 0.3% 0%
% of rolling stock in condition grade 5 1% 0%
Bus Amenity
Assets are in good condition and suitable for service
% of busway stations in condition grade 5 0% 0%
% of bus shelters and bus stops in condition grade 5 0.6% 0%
Ferry Amenity
Assets are in good condition and suitable for service
% of wharf assets in condition grade 5 5.9% 0%
Assets are in good condition and suitable for service
% of ferry terminal assets in condition grade 5 2.1% 1.9%
AT Asset Management Plan 2015 - 2018

AT Asset Management Plan 2015 – 2018 Page 55 of 139
Levels of service trends 3.6.
Figures 23 to 37 show selected level of service areas that highlight key trends in network performance, asset condition and user satisfaction over the past few years.
The figures indicate increasing satisfaction with road quality, but decreasing satisfaction with the time it takes to travel. Satisfaction with footpaths, cycleways and parking was stable. These trends align with AMP and regional land transport plan investment, which was generally maintained at historical rates during this period, and with technical measures such as pavement integrity and surface condition, which are high and stable.
For public transport, patronage has grown, driven particularly by a significant increase in the investment in rail. Customer satisfaction has fallen as customer numbers have grown, which indicates that level of service is perhaps more important to new than to existing customers.
Customer perceptions of safety have also not changed materially, although actual deaths and serious injuries on Auckland local roads increased in 2012/13 and again in 2013/2014, going against the long-term trend of safety improvements. This highlights the difficulties and risks in establishing causal relationships between technical performance measures and customer perceptions.
Figure 23: Road user satisfaction Source: IPSOS and AT road user satisfaction survey
Figure 24: Footpath user satisfaction Source: IPSOS and AT road user satisfaction survey
Figure 25: Cycle user satisfaction
Source: IPSOS and AT road user satisfaction survey
Figure 26: Parking user satisfaction
Source: IPSOS and AT road user satisfaction survey
AT Asset Management Plan 2015 - 2018
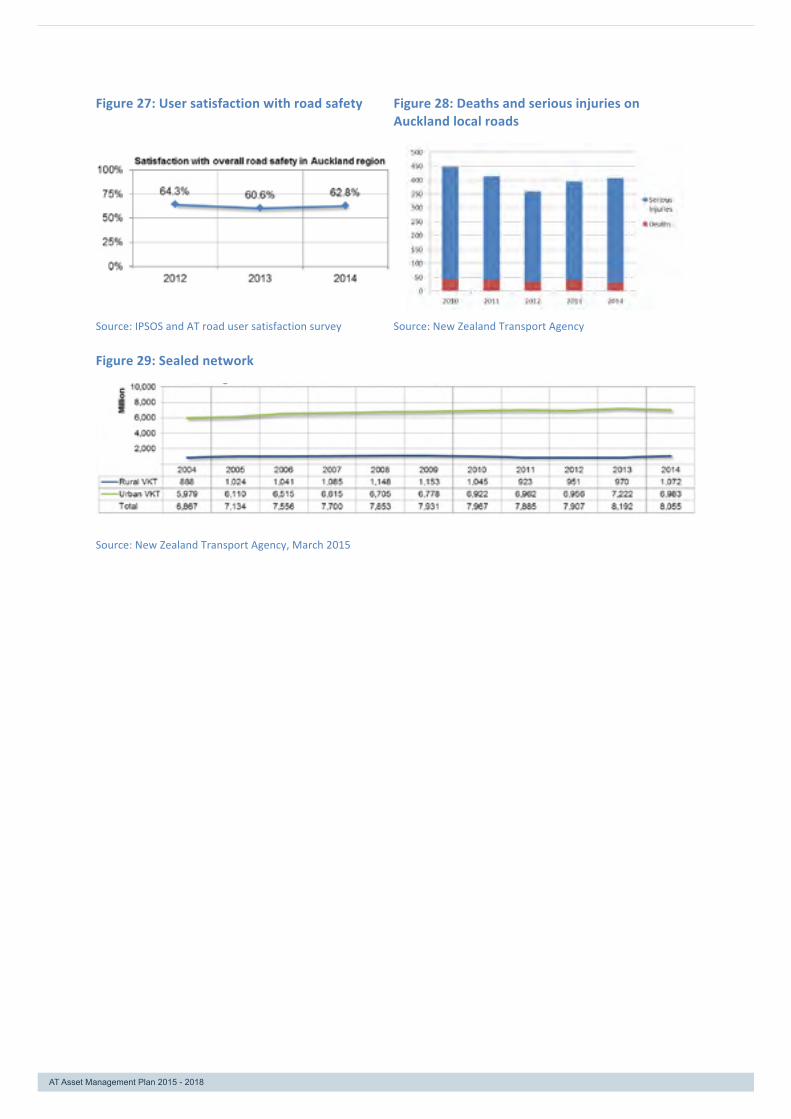
AT Asset Management Plan 2015 – 2018 Page 56 of 139
Figure 27: User satisfaction with road safety Figure 28: Deaths and serious injuries on Auckland local roads
Source: IPSOS and AT road user satisfaction survey Source: New Zealand Transport Agency
Figure 29: Sealed network
Source: New Zealand Transport Agency, March 2015
AT Asset Management Plan 2015 - 2018

AT Asset Management Plan 2015 – 2018 Page 57 of 139
Figure 30: Smooth travel exposure
Source: New Zealand Transport Agency, March 2015
Figure 31: Pavement integrity index
Source: New Zealand Transport Agency, March 2015
Figure 32: Pavement condition index
Source: New Zealand Transport Agency, March 2015
Figure 33: Satisfaction with traffic flow Figure 34: Satisfaction with travel time
Source: IPSOS and AT road user satisfaction survey, May 2013
Source: IPSOS and AT road user satisfaction survey, May 2013
AT Asset Management Plan 2015 - 2018

AT Asset Management Plan 2015 – 2018 Page 58 of 139
Figure 35: Travel time variability
Source: AT and New Zealand Transport Agency annual congestion survey
Figure 36: Public transport use
Source: AT patronage data
Figure 37 Satisfaction with public transport
Source: AT public transport customer satisfaction surveys
AT Asset Management Plan 2015 - 2018
AT Asset Management Plan 2015 – 2018 Page 59 of 139
Network priorities 3.7.
With constrained funding and growing transport demand, AT must set priorities to develop those transport assets that are most crucial to the function of the whole transport network. These priorities inform new capital works, but also the standards set for customer levels of service and for maintenance, operations and renewals programmes.
AT’s network planning takes into account:
• areas of housing and employment growth, including special housing areas
• key connecting routes for the city centre, metropolitan centres and town centres
• key freight generating and attracting areas, and Auckland’s international gateways
• routes that maximise access to education and employment, which in turn informs both road and public transport network development
• geographic projects identified in the Auckland Plan (city centre and southern initiative)
• transport infrastructure that will be the most important in the event of an earthquake, volcano, tsunami or cyclone, as identified by the Auckland Lifelines Group.
The following maps show the various priority transport networks that AT has identified.
• heavy commercial vehicle routes on the regional freight network (Figure 38)
• the regional arterial road network (Figure 39)
• rapid and frequent transit infrastructure identified in the regional public transport network (Figure 40)
• category 1, 2 and 3 transport infrastructure as identified by the Auckland Lifelines group (Figure 41). Category 1 infrastructure includes the motorways, Britomart and Newmarket train stations, and the Auckland Traffic Operations Centre.
In this AMP, the networks listed above are used as part of the identification of asset risk, and to identify those assets which have an earlier renewals intervention point. In future AMPs, priority routes and assets will be given greater prominence in the development of maintenance and renewals work programmes.
AT Asset Management Plan 2015 - 2018
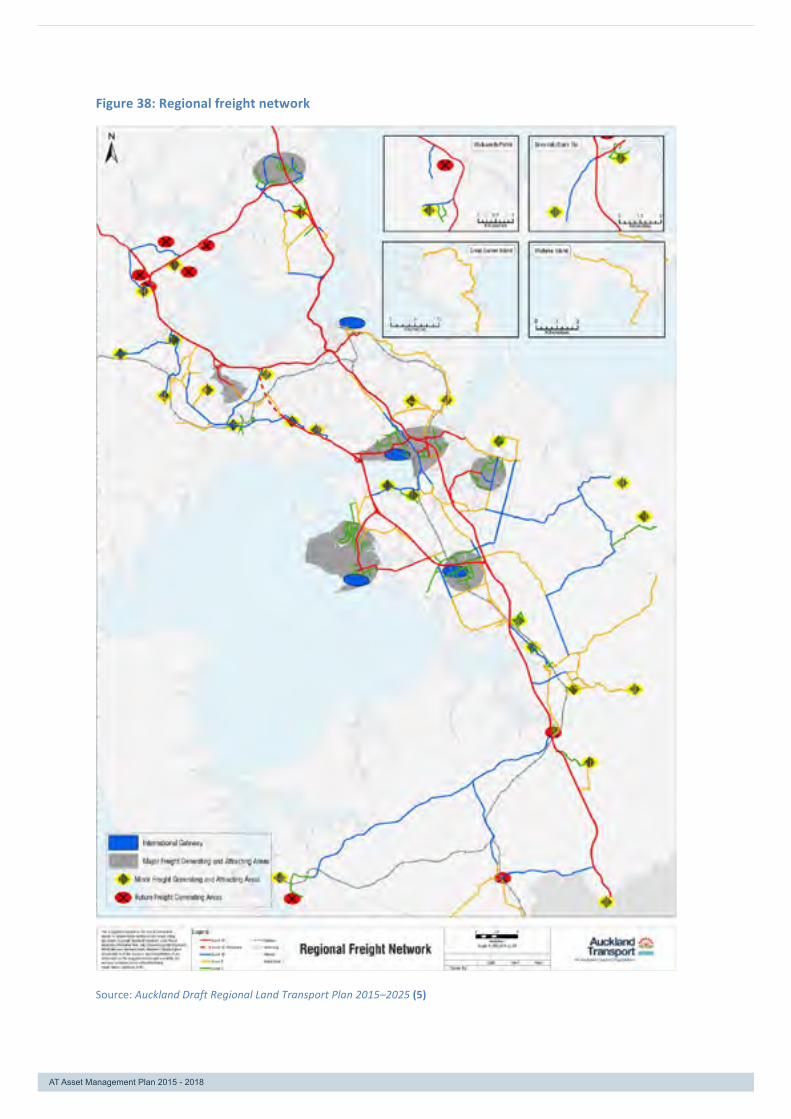
AT Asset Management Plan 2015 – 2018 Page 60 of 139
Figure 38: Regional freight network
Source: Auckland Draft Regional Land Transport Plan 2015–2025 (5)
AT Asset Management Plan 2015 - 2018
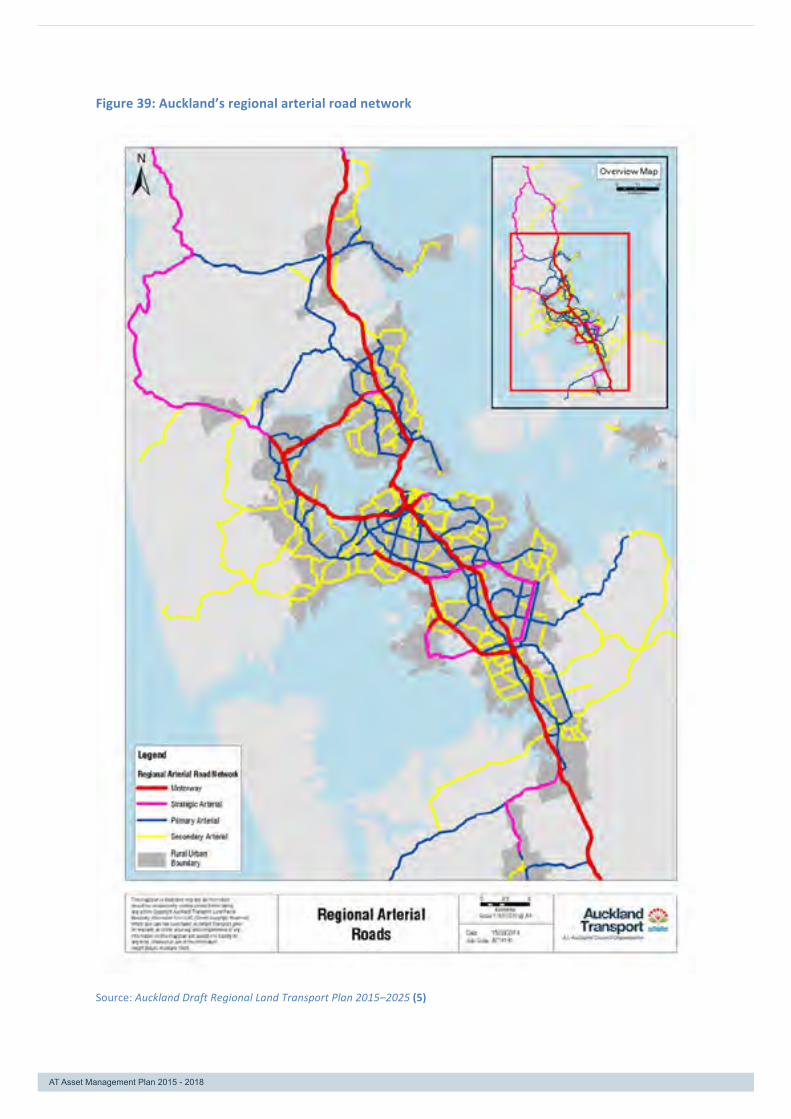
AT Asset Management Plan 2015 – 2018 Page 61 of 139
Figure 39: Auckland’s regional arterial road network
Source: Auckland Draft Regional Land Transport Plan 2015–2025 (5)
AT Asset Management Plan 2015 - 2018

AT Asset Management Plan 2015 – 2018 Page 62 of 139
Figure 40: Auckland’s public transport network 2026 (following implementation of the Regional Public Transport Plan)
Source: Regional Public Transport Plan (15), as updated in 2014
!!H
!!H
!!H
!!H!!H!!H
!!H
!!H
!!H
!!H
!!H
!!H
!!H
!!H
!!H
!!H
To Whangaparaoa
To Pukekohe
_Airbus express
to city centre
LRT interchange
CityCentre
Drury
Otara
Albany
Penrose
Wynyard
Swanson
Manukau
Otahuhu
Botany
PanmureOwairaka
Rosedale
Westgate
New Lynn
Avondale
St LukesBalmoral
Onehunga
Mangere
Papakura
Manurewa
Highbury
Akoranga
Takapuna
Northcote
Glen Eden
Te Atatu
HendersonMt Albert
Newmarket
Devonport
Birkenhead
Middlemore
Mt Roskill
Papatoetoe
Glen Innes
Hobsonville
Sylvia Park
Smales Farm
Pt Chevalier
Constellation
Blockhouse Bay
Mt Eden Station
Karangahape Station
Rapid Network
Frequent Network
Connector Network
Local Network
!!H Major Interchange
Intermediate interchange
Minor interchange
l
Note: Proposed minimum all-day services, excluding proposed peak-only and targeted services
AT Asset Management Plan 2015 – 2018 Page 62 of 139
Figure 40: Auckland’s public transport network 2026 (following implementation of the Regional Public Transport Plan)
Source: Regional Public Transport Plan (15), as updated in 2014
AT Asset Management Plan 2015 - 2018

AT Asset Management Plan 2015 – 2018 Page 63 of 139
Figure 41: Critical transport infrastructure as defined by the Auckland Lifelines Group
Source: Auckland Lifelines Group (16)
AT Asset Management Plan 2015 - 2018

AT Asset Management Plan 2015 – 2018 Page 64 of 139
One Network Road Classification 3.8.
As a result of the 2012 government policy statement on land transport and of ministerial taskforce recommendations, a streamlined road classification system for New Zealand, known as the One Network Road Classification (ONRC), has been developed to inform how New Zealand’s road networks are operated, maintained and managed.
The ONRC helps transport authorities to set priorities by supporting a nationally consistent approach to classifying road networks and to identifying levels of service for them. The classification is a joint initiative of the New Zealand Transport Agency and Local Government New Zealand, and its development and implementation is being governed by the Road Efficiency Group.
The New Zealand Transport Agency expects that the ONRC will be used as the basis for funding allocations for road maintenance and renewals programmes from 2018 onwards, and that this will enable funding to be allocated more effectively and efficiently, based on the function of each road in the national road network (17).
The ONRC project has three elements. The first is classifying roads into categories based on their function in the national network. This task is complete, and a map of the AT roads classified as Regional and Arterial is shown in Figure 42. The pace of growth and change in Auckland means that the road classification will need to be regularly reviewed.
The ONRC shows the wide range of functions that roads serve in the Auckland and national networks. For example, arterial and regional roads make up 18 per cent of Auckland’s transport network by length, but carry 72 per cent of its traffic. At the other end of the scale, 40 per cent of the network by length is access roads, which carry only 4 per cent of the total traffic, as shown in Figure 43.
Figure 42: One Network Road Classification categories by length and use (vehicle kilometres travelled (vkt))
Source: AT One Network Road Classification, RAMM vkt data
AT Asset Management Plan 2015 - 2018

AT Asset Management Plan 2015 – 2018 Page 65 of 139
Figure 43: One Network Road Classification: Regional and Arterial roads
CBD
Pi ha
Orewa
Om aha
Kum eu
Howic k
Awhit u
Al bany
Waiuku
Kai aua
Muri wai
Manukau Cl evedon
Onehunga
Takapuna
Maraet a i
Pukek ohe
Papakur a
Hender son
Tit irang i
Wells f ord
Mangawhai
Warkworth
Mount Eden
Sout h Head
Hel ensv il l e
Sai n t Johns
Kawakawa Bay
Kawau Is land
Whangaparaoa
Hunua Ranges
Waiheke Is l and
Waitakere Ranges
L itt l e Barr ie r Is l and
K a i p a r a H a r b o u r
M a n u k a u H a r b o u r
K a i p a r a H a r b o u r
W a i t e m a t a H a r b o u r
±
This map/plan is illustrative only and all informationshould be independently verified on site before takingany action. Copyright Auckland Transport. Land Parcel Boundary information from LINZ (Crown Copyright Reserved).Whilst due care has been taken, Auckland Transpor t gives no warranty as to the accuracy and completeness of any information on this map/plan and accepts no liability for any error, omission or use of the information.Height datum: Auckland 1946.
Job Code:
0 5 102.5
KilometresONRC Classifications
Regional and Arterial
@ A4Scale 1:500,000
Date:
Legend
14th July 2015AT15144
Great Barrier Island
ONRC Classification
Regional
Ar terial
Railway
Road Network
AT Asset Management Plan 2015 - 2018

AT Asset Management Plan 2015 – 2018 Page 66 of 139
The second element of the ONRC is the development of performance measures and targets, which determine how the categories and customer levels of service translate into specific maintenance, operational and investment decisions. The new performance measures will significantly increase the level of detail that AT reports to the New Zealand Transport Agency about the impacts and outcomes of its road maintenance and renewals activities.
The third and final element of the ONRC is to provide nationally consistent customer levels of service. Customer levels of service define the fit-for-purpose outcomes expected for each category of road, in terms of mobility, safety, accessibility and amenity.
AT’s current levels of service, as set out in Chapter 0, will be expanded to cover all of the outcomes identified by the ONRC, enabling the performance of Auckland’s transport network to be benchmarked nationally and internationally.
The costs and risks of any changes to levels of service also need to be understood, and a programme to harmonise levels of service developed and adopted. This represents a significant improvement task that AT will address when developing its 2018 AMP.
AT Asset Management Plan 2015 - 2018


AT Asset Management Plan 2015 – 2018 Page 68 of 139

AT Asset Management Plan 2015 – 2018 Page 69 of 139
4. Growth and demand
The transport network is growing in response to increased demand from population growth and land development. This chapter identifies the impacts of this network growth and the asset management investment implications for the transport asset portfolio.
Key messages
• Auckland will be home to 716,000 more people over the coming 30 years, with predicted population growth of 237,000 people in the first decade.
• The road and public transport asset networks need to be expanded to accommodate this growth. The public transport network needs to expand fastest, as demand for public transport travel is growing most rapidly.
• New transport assets, whether built by AT or by developers, will need to be maintained and, eventually, renewed. This is reflected in network growth factors for renewals, and is expected to add around 1.5% to road maintenance and operations costs annually.
Growth 4.1.
Auckland is expected to grow by 716,000 people to a total of 2.24 million by 2045, as shown in Figure 44 (18). In the first decade of this AMP (to 2025), Auckland will grow by 237,000 people – almost the current population of Hamilton and Tauranga combined. Jobs are forecast to grow proportionately, with 89,000 additional jobs in the region by 2025 and 247,000 by 2045.
Figure 44: Auckland population and employment trends
Source: Actual = Statistics New Zealand (19); projected = Auckland Council (18)
This level of growth will place significant pressure on the capacity of existing infrastructure and create demand for new infrastructure. As well as growing in number, Auckland’s population demographics is changing. For example, the fastest growing age group is the over-65 years group, and over one-third of Aucklanders will identify as Asian (19) by 2021.
AT Asset Management Plan 2015 - 2018
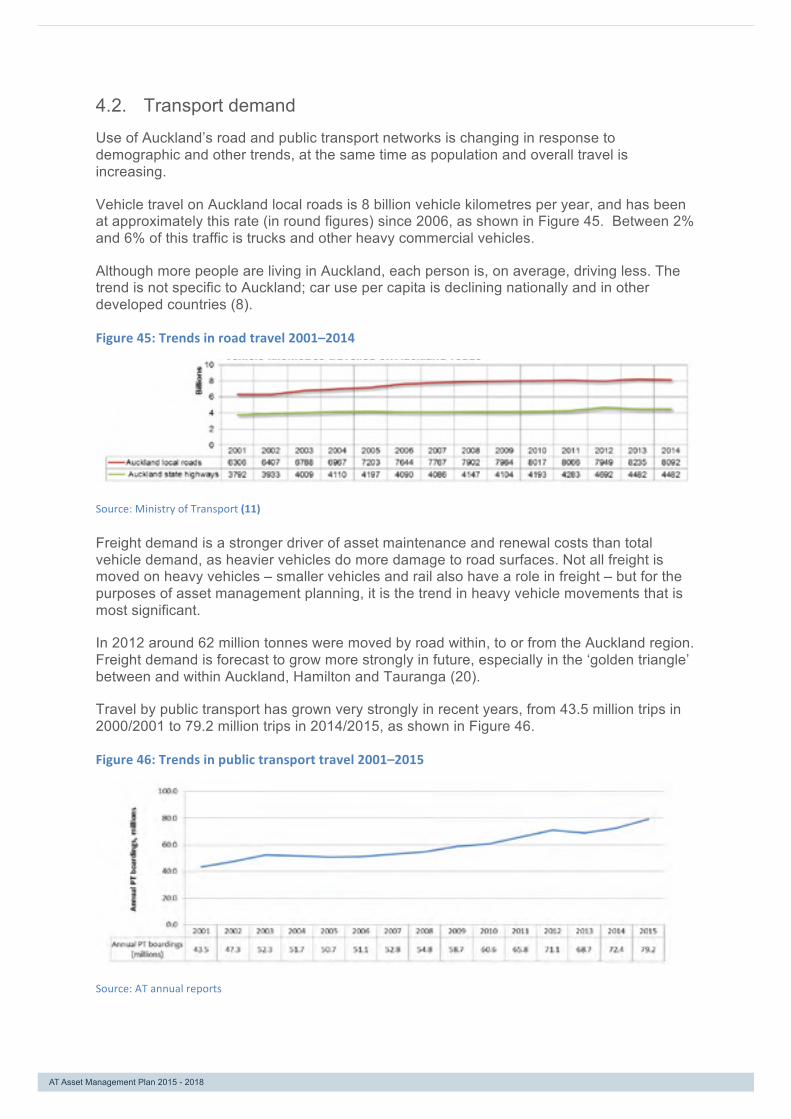
AT Asset Management Plan 2015 – 2018 Page 70 of 139
Transport demand 4.2.
Use of Auckland’s road and public transport networks is changing in response to demographic and other trends, at the same time as population and overall travel is increasing.
Vehicle travel on Auckland local roads is 8 billion vehicle kilometres per year, and has been at approximately this rate (in round figures) since 2006, as shown in Figure 45. Between 2% and 6% of this traffic is trucks and other heavy commercial vehicles.
Although more people are living in Auckland, each person is, on average, driving less. The trend is not specific to Auckland; car use per capita is declining nationally and in other developed countries (8).
Figure 45: Trends in road travel 2001–2014
Source: Ministry of Transport (11)
Freight demand is a stronger driver of asset maintenance and renewal costs than total vehicle demand, as heavier vehicles do more damage to road surfaces. Not all freight is moved on heavy vehicles – smaller vehicles and rail also have a role in freight – but for the purposes of asset management planning, it is the trend in heavy vehicle movements that is most significant.
In 2012 around 62 million tonnes were moved by road within, to or from the Auckland region. Freight demand is forecast to grow more strongly in future, especially in the ‘golden triangle’ between and within Auckland, Hamilton and Tauranga (20).
Travel by public transport has grown very strongly in recent years, from 43.5 million trips in 2000/2001 to 79.2 million trips in 2014/2015, as shown in Figure 46.
Figure 46: Trends in public transport travel 2001–2015
Source: AT annual reports
AT Asset Management Plan 2015 - 2018

AT Asset Management Plan 2015 – 2018 Page 71 of 139
Development 4.3.
Auckland Council estimates that over 10,000 new dwellings are needed each year for the coming 30 years to cope with the predicted growth in population and with the long-term trend towards smaller households (18). The Auckland Housing Accord sets short-term targets to accommodate more dwellings by speeding up the development process, with a focus on new greenfield areas and brownfield sites (that is, significant residential developments on land formerly used for another purpose, for example, industrial sites). Longer-term development needs are identified in the Unitary Plan, and will be met through a combination of greenfield areas, brownfields developments, infill and intensification.
All new developments require investment in transport infrastructure and services to support that growth. Providing this infrastructure is a responsibility shared between Auckland Council, AT and developers.
Outside these identified growth areas, Auckland’s population is still growing through intensification. Intensification occurs as more people choose to live in medium-density housing and apartments. This not only places increased capacity demands for movement along the transport corridors, but also means that the corridors themselves become important public space with more people shopping, socialising and relaxing within the road corridor.
Improving the quality, accessibility and safety of the street environment supports the economic success of businesses and the strength of local communities. This encourages further development of local centres, and ultimately has a strong effect on growth and the success of the Auckland Plan development strategy. The ‘shared space’ redesigns in Auckland city centre are an example of how transport investment can accommodate and support intensification.
The challenges of growth extend well beyond projects in growth areas designed to give access to new homes and businesses. New residents will want to travel all over Auckland, and new businesses will want to link to all Auckland’s customers, suppliers and workforce. Auckland’s rapid growth means there will be increased demand across the whole of the transport network, and not only for those parts of the network where specific growth projects are underway.
Growth in assets 2012–2015 4.4.
Transport asset growth occurs through:
• AT capital projects
• Vested assets – generally roads and associated assets such as streetlights in new growth areas. These are generally built by developers but the responsibility for operating, maintaining and renewing these assets is transferred to AT
• State Highway projects which can result in roads being transferred to AT to manage and maintain as local roads. Cycleways and shared paths constructed by the Transport Agency are also transferred to AT to manage and maintain.
Table 15 shows key assets added to the network in the past three years, and forecast for the coming three years.
AT Asset Management Plan 2015 - 2018
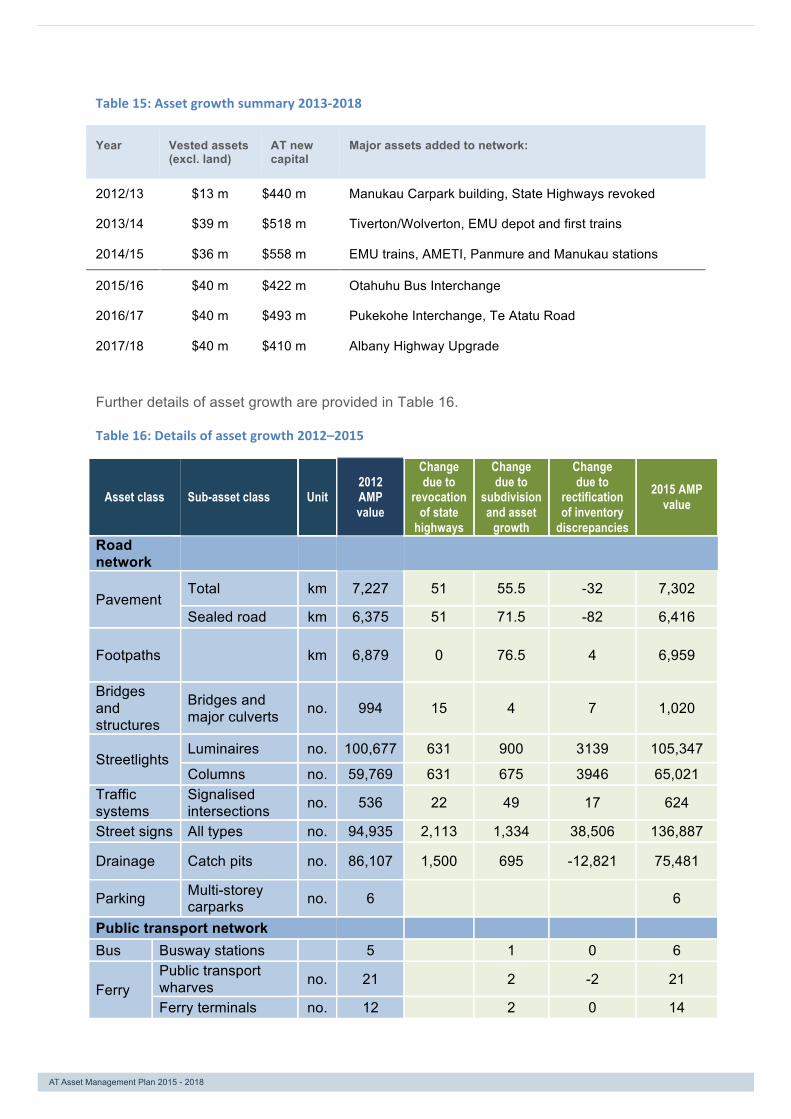
AT Asset Management Plan 2015 – 2018 Page 72 of 139
Table 15: Asset growth summary 2013-‐2018
Year Vested assets (excl. land)
AT new capital
Major assets added to network:
2012/13 $13 m $440 m Manukau Carpark building, State Highways revoked
2013/14 $39 m $518 m Tiverton/Wolverton, EMU depot and first trains
2014/15 $36 m $558 m EMU trains, AMETI, Panmure and Manukau stations
2015/16 $40 m $422 m Otahuhu Bus Interchange
2016/17 $40 m $493 m Pukekohe Interchange, Te Atatu Road
2017/18 $40 m $410 m Albany Highway Upgrade
Further details of asset growth are provided in Table 16.
Table 16: Details of asset growth 2012–2015
Asset class Sub-asset class
Unit 2012 AMP value
Change due to
revocation of state
highways
Change due to
subdivision and asset
growth
Change due to
rectification of inventory
discrepancies
2015 AMP value
Road network
Pavement Total km 7,227 51 55.5 -32 7,302
Sealed road km 6,375 51 71.5 -82 6,416
Footpaths
km 6,879 0 76.5 4 6,959
Bridges and structures
Bridges and major culverts no. 994 15 4 7 1,020
Streetlights Luminaires no. 100,677 631 900 3139 105,347
Columns no. 59,769 631 675 3946 65,021 Traffic systems
Signalised intersections no. 536 22 49 17 624
Street signs All types no. 94,935 2,113 1,334 38,506 136,887
Drainage Catch pits no. 86,107 1,500 695 -12,821 75,481
Parking Multi-storey carparks no. 6 6
Public transport network Bus Busway stations 5 1 0 6
Ferry Public transport wharves no. 21 2 -2 21
Ferry terminals no. 12 2 0 14
AT Asset Management Plan 2015 - 2018
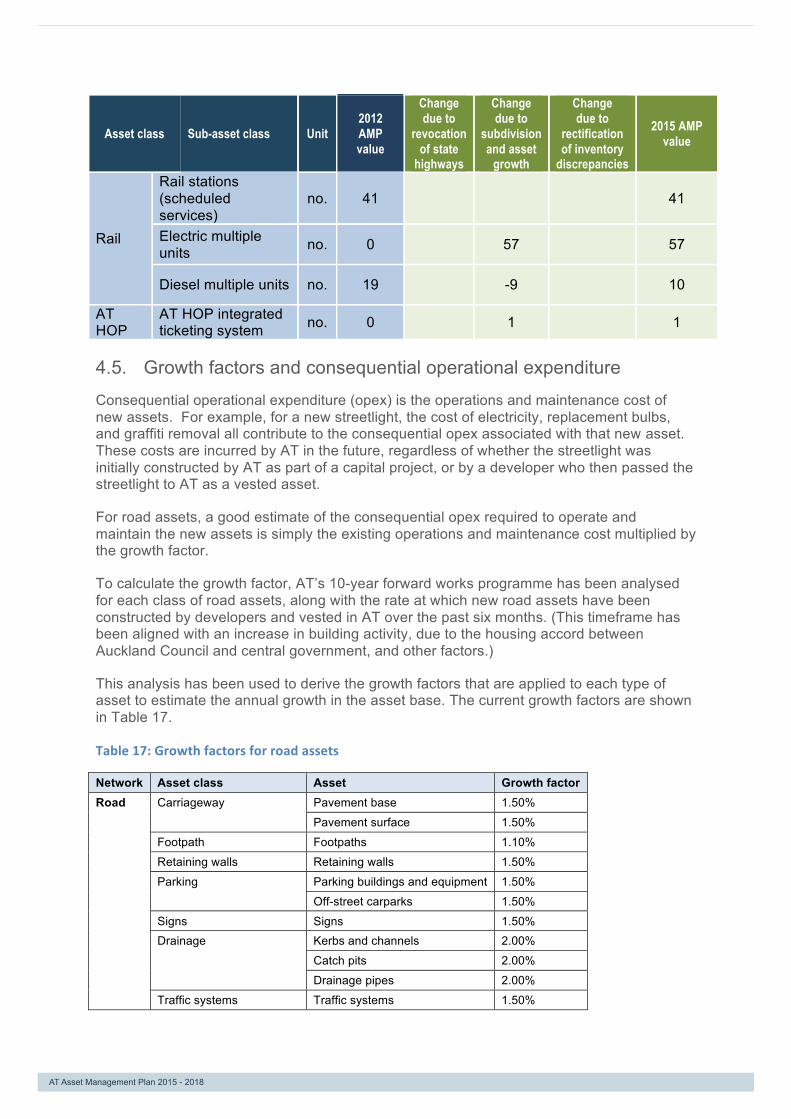
AT Asset Management Plan 2015 – 2018 Page 73 of 139
Asset class Sub-asset class
Unit 2012 AMP value
Change due to
revocation of state
highways
Change due to
subdivision and asset
growth
Change due to
rectification of inventory
discrepancies
2015 AMP value
Rail
Rail stations (scheduled services)
no. 41 41
Electric multiple units no. 0 57 57
Diesel multiple units no. 19 -9 10
AT HOP
AT HOP integrated ticketing system no. 0 1 1
Growth factors and consequential operational expenditure 4.5.
Consequential operational expenditure (opex) is the operations and maintenance cost of new assets. For example, for a new streetlight, the cost of electricity, replacement bulbs, and graffiti removal all contribute to the consequential opex associated with that new asset. These costs are incurred by AT in the future, regardless of whether the streetlight was initially constructed by AT as part of a capital project, or by a developer who then passed the streetlight to AT as a vested asset.
For road assets, a good estimate of the consequential opex required to operate and maintain the new assets is simply the existing operations and maintenance cost multiplied by the growth factor.
To calculate the growth factor, AT’s 10-year forward works programme has been analysed for each class of road assets, along with the rate at which new road assets have been constructed by developers and vested in AT over the past six months. (This timeframe has been aligned with an increase in building activity, due to the housing accord between Auckland Council and central government, and other factors.)
This analysis has been used to derive the growth factors that are applied to each type of asset to estimate the annual growth in the asset base. The current growth factors are shown in Table 17.
Table 17: Growth factors for road assets
Network Asset class Asset Growth factor Road Carriageway Pavement base 1.50%
Pavement surface 1.50%
Footpath Footpaths 1.10%
Retaining walls Retaining walls 1.50%
Parking Parking buildings and equipment 1.50%
Off-street carparks 1.50%
Signs Signs 1.50% Drainage Kerbs and channels 2.00%
Catch pits 2.00%
Drainage pipes 2.00%
Traffic systems Traffic systems 1.50%
AT Asset Management Plan 2015 - 2018

AT Asset Management Plan 2015 – 2018 Page 74 of 139
Network Asset class Asset Growth factor Sea walls Sea walls 1.50%
Cycle Cycleways 1.10%
Corridor structures Corridor structures 1.50%
Streetlights Streetlights 2.40% Bridges and major culverts Bridges 0.75%
Culverts 0.75%
Corridor fixtures Corridor fixtures 1.50%
New transport assets, from whichever source, bring consequential operations, maintenance and renewals requirements. Around 1.5% more assets are added to the network each year, and consequently maintenance and operations funding requirements increase by 1.5% each year, just to keep up with growth in the asset base. Over the 10 years, consequential opex totals $98.1 million as shown in Table 18.
Table 18: Estimated consequential opex from asset growth
($million) 2015/ 2016
2016/ 2017
2017/ 2018
2018/ 2019
2019/ 2020
2020/ 2021
2021/ 2022
2022/ 2023
2023/ 2024
2024/ 2025
2016-2025 total
Consequential opex from asset growth 1.7 3.4 5.2 6.9 8.8 10.6 12.5 14.4 16.3 18.3 98.1
The rate of growth in transport assets will accelerate as Auckland’s population continues to grow and as initiatives including Strategic Housing Areas increase the supply of new housing. Preliminary calculations suggest that this will increase consequential opex requirements by $600 per dwelling per year. This suggests that the above consequential opex estimates, calculated based on past trends, could significantly underestimate the costs associated with connecting more than 10,000 new homes to the transport network each year, as envisaged by the Auckland Housing Accord.
Public transport assets also create a consequential opex cost, but calculating this cost using a growth factor does not work well for bus, rail and ferry infrastructure, for a number of reasons.
• Vested assets are not significant, as it is rare for developers to construct public transport assets.
• The maintenance and operations costs of a new public transport asset, such as a new rail and bus interchange, are best calculated separately. A growth factor based on the costs of existing assets would not be accurate.
• Service changes, for example increased hours of operation, can be as significant in terms of future costs as newly constructed assets.
As a result, in this AMP, the consequential opex component of future maintenance and operations budgets is itemised for road assets only, and not public transport assets.
Consequential opex from PT assets, not included in the estimates above, will include significant costs for maintenance and operations of the City Rail Link from 2023, and potentially a future Light Rail Transit system.
AT Asset Management Plan 2015 - 2018


AT Asset Management Plan 2015 – 2018 Page 76 of 139
AT Asset Management Plan 2015 – 2018 Page 77 of 139
5. Risk management
One of AT’s key roles is to manage and balance network risks against levels of service and whole-of-life costs. There are significant risks associated with operating and managing the transport network, which can lead to network failure, death and serious injuries, and other significant consequences. This chapter identifies those risks and how they are managed.
Key messages
• Transport asset risks include death and serious injury risks
• AT has identified its most critical assets, including lifeline routes and facilities.
• AT has identified the risks associated with key hazards, including unplanned events such as earthquakes and tsunamis, and has controls to mitigate the impact of these hazards.
• AT’s road safety programmes aim to reduce deaths and serious injuries through engineering, education and enforcement.
Transport asset risks 5.1.
The risks associated with AT’s transport assets may lead to:
• injury or death to transport users, operators or members of the public
• reduced access for network users to travel options, including unavailable or reduced routes, services and facilities
• damage to other infrastructure or property
• reduced amenity of the transport network for users (including appearance, cleanliness, noise, comfort etc)
• reduced public transport patronage
• impacts on vehicle travel speeds (e.g. delays, congestion, roughness)
• increased operating costs (e.g. due to increased asset deterioration)
• increased costs to repair assets or restore services, potentially affecting AT’s ability to fund services
• environmental impacts (e.g. pollution of waterways, air or soil).
AT has prepared an Asset Risk Management Plan, which identifies the key transport asset risks, and sets out how AT manages and controls them.
This chapter provides a brief overview of the Asset Risk Management Plan, including:
• the transport asset risk management context
• the transport asset risks, and how AT manages and controls them
• how AT defines its tolerance for asset risk in terms of asset criticality
• how AT monitors and reports on its asset risk profile
AT Asset Management Plan 2015 - 2018

AT Asset Management Plan 2015 – 2018 Page 78 of 139
• the key improvements to the Asset Risk Management Plan that AT has planned for the next 12 to 18 months.
Transport asset risk management context 5.2.
The following factors define the transport asset risk management context that AT operates within.
• The Auckland road and public transport networks, and the assets that constitute them, as summarised in this AMP
• The strategies and plans that AT has in place for developing and managing the transport networks, and the systems, processes, procedures and practices that implement those strategies and plans (including activities by both AT and contracted organisations)
• The AT risk management framework, which defines the overarching policies and procedures that AT uses to identify, assess, treat and monitor risk at an appropriate level of detail. The risk management process that AT has adopted follows the joint Australian–New Zealand international standard, AS/NZS ISO 31000:2009 Risk Management – Principles and Guidelines, tailored to suit AT’s specific requirements.
Transport asset risk is just one of a number of types of risk that AT manages on a day-to-day and long-term basis, in order to provide a safe, effective, and efficient transport system. Figure 47 illustrates these broader risks, and how transport asset risk fits amongst them.
Figure 47: AT risk framework
AT Asset Management Plan 2015 - 2018
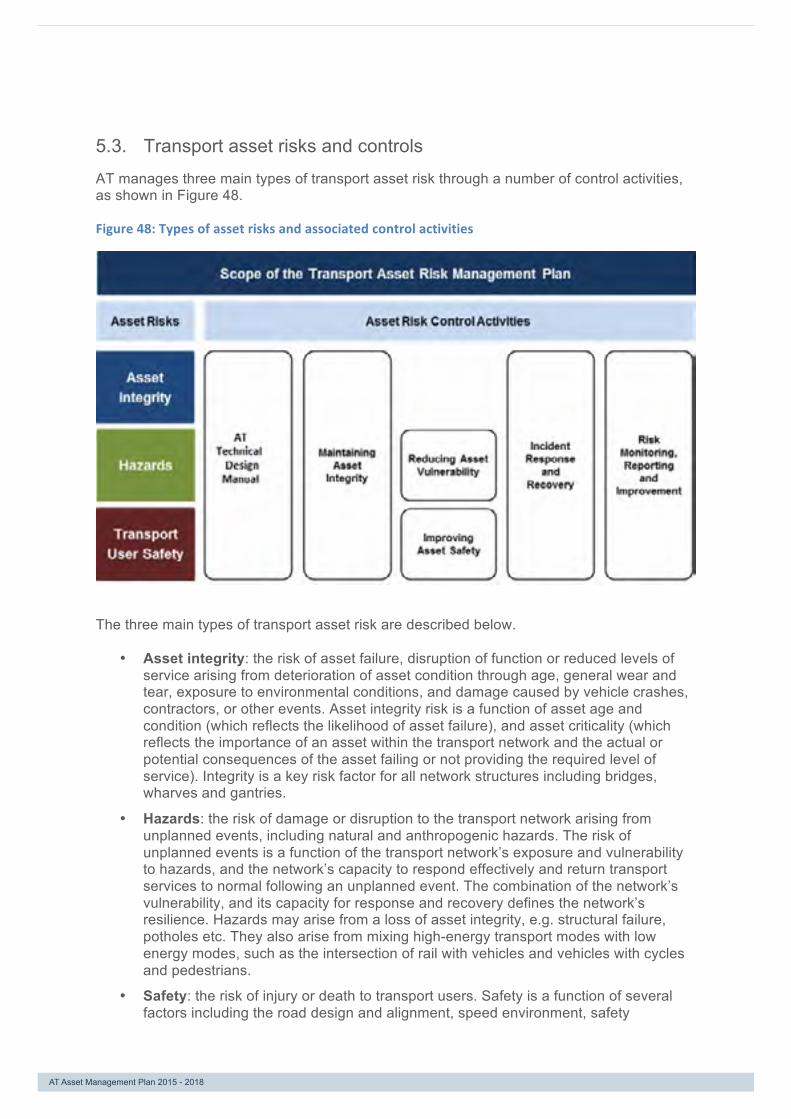
AT Asset Management Plan 2015 – 2018 Page 79 of 139
Transport asset risks and controls 5.3.
AT manages three main types of transport asset risk through a number of control activities, as shown in Figure 48.
Figure 48: Types of asset risks and associated control activities
The three main types of transport asset risk are described below.
• Asset integrity: the risk of asset failure, disruption of function or reduced levels of service arising from deterioration of asset condition through age, general wear and tear, exposure to environmental conditions, and damage caused by vehicle crashes, contractors, or other events. Asset integrity risk is a function of asset age and condition (which reflects the likelihood of asset failure), and asset criticality (which reflects the importance of an asset within the transport network and the actual or potential consequences of the asset failing or not providing the required level of service). Integrity is a key risk factor for all network structures including bridges, wharves and gantries.
• Hazards: the risk of damage or disruption to the transport network arising from unplanned events, including natural and anthropogenic hazards. The risk of unplanned events is a function of the transport network’s exposure and vulnerability to hazards, and the network’s capacity to respond effectively and return transport services to normal following an unplanned event. The combination of the network’s vulnerability, and its capacity for response and recovery defines the network’s resilience. Hazards may arise from a loss of asset integrity, e.g. structural failure, potholes etc. They also arise from mixing high-energy transport modes with low energy modes, such as the intersection of rail with vehicles and vehicles with cycles and pedestrians.
• Safety: the risk of injury or death to transport users. Safety is a function of several factors including the road design and alignment, speed environment, safety
AT Asset Management Plan 2015 - 2018

AT Asset Management Plan 2015 – 2018 Page 80 of 139
standards, the condition of transport assets, driving conditions, vehicle condition, and user behaviour (including drivers, pedestrians, and cyclists). The national Safer Journeys Strategy to 2020 (21) sets out a plan to achieve a safe road system that is increasingly free of deaths and serious injuries, through safer roads and roadsides, safer speeds, safer vehicles and safer road use. The safer roads and roadsides component of this strategy relates closely to transport asset risk, including how transport assets may contribute to, or control, the risk of incidents and crashes occurring (e.g. surface skid resistance, guard rails, barriers, mode separation etc).
Risk controls include activities designed to avoid or prevent risks, or reduce the likelihood of risks occurring; activities that identify when risks have occurred or are likely to occur; and activities that respond to risks when they do occur. AT employs all these types of risk controls throughout its transport assets’ lifecycles.
The key asset risk control activities that AT uses are as follows.
• Applying the AT Code of Practice: provides quality standards to ensure that the function, condition, operational cost and useful service life of transport assets is consistently achieved across the region. The Code of Practice is a key control that AT uses during asset design and construction.
• Maintaining asset integrity: this includes operational activities, maintenance, renewal, and asset condition monitoring and reviews. All these activities protect assets, slow down asset deterioration, rectify asset defects, identify actual and potential asset failures, and restore asset level of service.
• Reducing asset vulnerability: this includes identifying assets that may be vulnerable to certain hazards, and renewing or improving those assets to mitigate the risk.
• Improving asset safety: this includes identifying locations on the transport network where there is a high risk of vehicle crashes or other incidents that may impact on transport user safety, and renewing or improving the transport assets at these locations to mitigate the risk.
• Planning for incident response and recovery: this includes the plans and arrangements AT has in place to ensure there is an effective response to incidents and emergencies on the network, and that transport users are safeguarded and normal services restored following an incident. These plans and arrangements include the Auckland Incident Management Plan and the AT operations centres at Smales Farm and the downtown Ferry Building.
• Monitoring, reporting on and improving asset risk management: this includes the processes that AT’s uses to monitor its asset risk profile at a strategic level, and to identify specific issues or risks in each risk area, as well as the management actions required to address these issues and risks.
In addition to the above risk control activities, AT carries insurance for loss of or damage to transport assets arising from certain insurable events.
Table 19, Table 20 and Table 21 provide more detailed summaries of the key controls that AT uses with respect to the key transport asset risks (i.e. asset integrity, hazards and safety).
AT Asset Management Plan 2015 - 2018

AT Asset Management Plan 2015 – 2018 Page 81 of 139
Table 19: Summary of asset failure modes, causes and controls
Potential modes of asset failure (loss of integrity)
Causes of asset deterioration and failure
Key controls
• Deterioration or failure of building fabric
• Loss of structural integrity
• Failure of supporting structures
• Degradation of appearance or amenity
• Component, equipment or core services failure
• Loss of shape, skid resistance or surface integrity (pavement)
• Blockage or missing lids or grates (stormwater systems)
• Incorrect, non-‐compliant or non-‐visible signs or markings
• Third-‐party contractor damage
• Age-‐related deterioration
• Changes to requirements or standards
• Collision or impact
• Components or fixtures failure
• Cumulative surfacing treatments
• Cumulative traffic loading
• Excess stormwater flows
• Dirt, grime, rubbish build up
• Fire (equipment failure, smoking, vehicle fire)
• Incorrect bitumen content
• Overpressure (retaining walls)
• Over-‐weight vehicle loading
• Scour (stormwater runoff)
• Obstruction or blockage
• Tanking failure
• Seismic loading
• Services outage (power, water, gas, telecoms)
• Traffic systems software failure
• Vandalism or theft
• Vegetation growth or root penetration
• Water penetration
• Wave damage
• Wind loading or damage
• AT Code of Practice
• AT communications (call centre and website)
• AT operations centres
• Corridor access request procedure
• Over-‐weight and over-‐dimension requests
• Routine inspections
• Programmed condition assessments
• Maintenance (preventative and reactive)
• Renewal (reactive, preventative, predictive and proactive)
• Incident response and recovery (managed by the AT operations centres)
• AT asset risk registers
AT Asset Management Plan 2015 - 2018
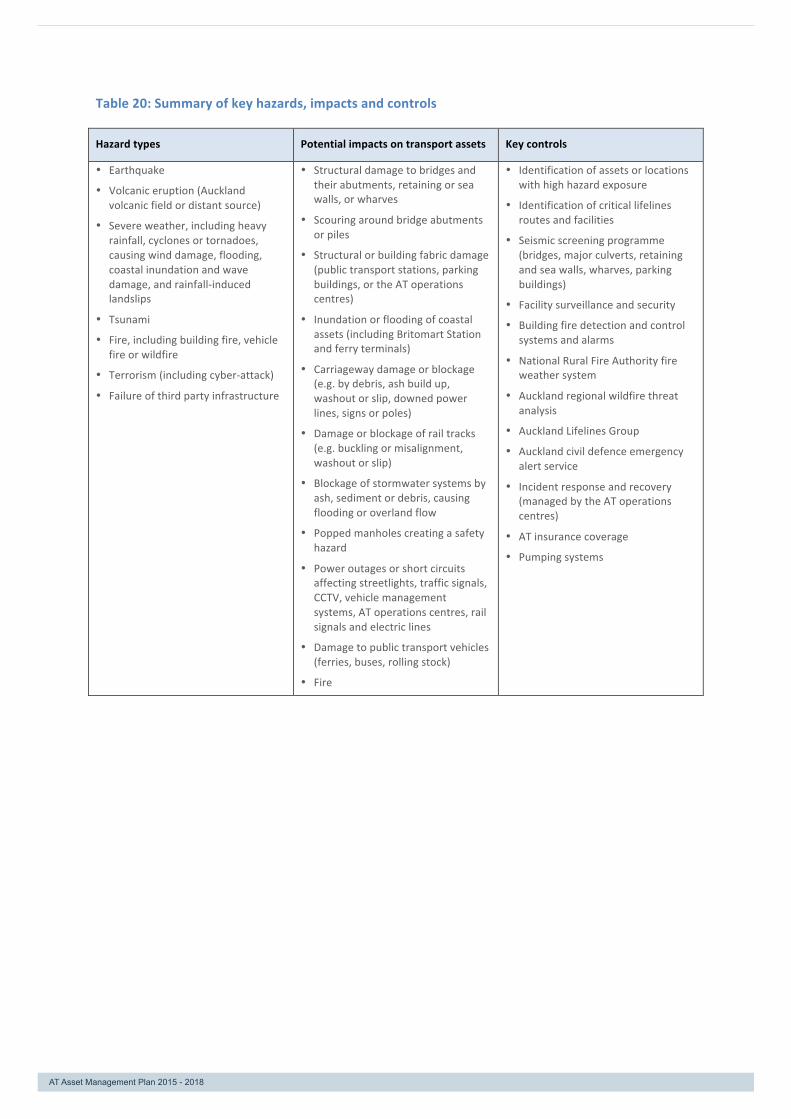
AT Asset Management Plan 2015 – 2018 Page 82 of 139
Table 20: Summary of key hazards, impacts and controls
Hazard types Potential impacts on transport assets Key controls
• Earthquake
• Volcanic eruption (Auckland volcanic field or distant source)
• Severe weather, including heavy rainfall, cyclones or tornadoes, causing wind damage, flooding, coastal inundation and wave damage, and rainfall-‐induced landslips
• Tsunami
• Fire, including building fire, vehicle fire or wildfire
• Terrorism (including cyber-‐attack)
• Failure of third party infrastructure
• Structural damage to bridges and their abutments, retaining or sea walls, or wharves
• Scouring around bridge abutments or piles
• Structural or building fabric damage (public transport stations, parking buildings, or the AT operations centres)
• Inundation or flooding of coastal assets (including Britomart Station and ferry terminals)
• Carriageway damage or blockage (e.g. by debris, ash build up, washout or slip, downed power lines, signs or poles)
• Damage or blockage of rail tracks (e.g. buckling or misalignment, washout or slip)
• Blockage of stormwater systems by ash, sediment or debris, causing flooding or overland flow
• Popped manholes creating a safety hazard
• Power outages or short circuits affecting streetlights, traffic signals, CCTV, vehicle management systems, AT operations centres, rail signals and electric lines
• Damage to public transport vehicles (ferries, buses, rolling stock)
• Fire
• Identification of assets or locations with high hazard exposure
• Identification of critical lifelines routes and facilities
• Seismic screening programme (bridges, major culverts, retaining and sea walls, wharves, parking buildings)
• Facility surveillance and security
• Building fire detection and control systems and alarms
• National Rural Fire Authority fire weather system
• Auckland regional wildfire threat analysis
• Auckland Lifelines Group
• Auckland civil defence emergency alert service
• Incident response and recovery (managed by the AT operations centres)
• AT insurance coverage
• Pumping systems
AT Asset Management Plan 2015 - 2018

AT Asset Management Plan 2015 – 2018 Page 83 of 139
Table 21: Summary of high safety-‐risk locations, safety critical assets and controls
Types of high-‐safety-‐risk locations Types of safety critical assets Key controls(1)
• Intersections (including pedestrian crossings)
• Schools
• Speed advisory curves
• Level crossings (vehicle or pedestrian)
• Bridges
• High-‐speed environments
• Wharves
• High cycle-‐volume areas
• High pedestrian-‐volume public spaces
• Compulsory and warning signs
• Markings and traffic signals
• Pavement surfacing
• Pavement alignment and camber
• Lighting
• Barriers, guard rails and fences
• Fire detection and control systems
• Emergency egress
• AT Code of Practice
• Maintaining asset integrity through operational, maintenance and renewal activities
• Crash reduction studies
• Safety Around Schools programme
• Planned safety improvements
• Urgent safety improvements
• AT asset risk registers
• Building Warrant of Fitness compliance
Note:
1. Only includes engineering controls (planning, designing, constructing, operating, maintaining and renewing transport assets). Does not include policy, education or enforcement controls.
Asset criticality and risk tolerance 5.4.
AT’s key asset management principle is to meet service levels and to manage risk while minimising whole-of-life costs. This is achieved by optimising the timing of maintenance and renewal interventions. To provide guidance for asset maintenance and renewal decision-making, AT’s tolerance for risk arising from the deterioration and failure of transport assets has been defined based on asset criticality.
Asset criticality reflects the importance of an asset within the transport network, and the actual or potential consequences of the asset failing (or failing to provide the required level of service). Asset criticality is determined based on a number of factors, including:
• the degree to which the failure of the asset would impact on the safe and efficient operation of the transport network (especially assets that are necessary for safety, regulatory or efficiency reasons)
• the asset’s location or functional significance, taking into account road classification and traffic volumes (including vehicle, cycle and pedestrian traffic), critical lifelines routes, key public transport or freight routes, and public profile
• other factors, such as the potential, should the asset fail, for it to damage or disrupt other infrastructure or property, or damage the environment, and the cost of repairing the asset.
The higher the criticality of the asset, the lower AT’s tolerance for risk in relation to it. Conversely, AT will tolerate greater risk in relation to less critical assets.
AT has defined three criticality grades that reflect its tolerance for asset risk. Corresponding maintenance and renewal intervention levels have been defined for each criticality grade and these are summarised in Table 22.
AT Asset Management Plan 2015 - 2018

AT Asset Management Plan 2015 – 2018 Page 84 of 139
Table 22: Transport asset criticality grades and corresponding intervention levels
Asset criticality Levels of service Asset classes Risk profile description
High criticality assets Risk tolerance very low: minimum risk of failure is tolerated Maintenance service levels(1) 1, 2 and 3
No assets in poor or very poor condition
Exterior and interior fitout at: • Rail stations • Ferry terminals • Busway stations
Wharves Bridges Traffic Signals AT HOP ticketing system
Front-‐of-‐house assets with significant public perception implications. Assets with significant safety risks or traffic movement implications.
Moderate criticality assets Risk tolerance low: some risk of failure is tolerated Maintenance service levels(1) 4, 5 and 6
No assets in very poor condition
Pavement base Pavement surface Footpaths Kerbs and channels Drainage pipes Catch pits Cycleways Structural and service assets at: • rail stations • ferry terminals • busway stations Corridor structures Streetlight poles, luminaires and brackets Signs Retaining walls Parking buildings and equipment Off-‐street carparks Sea walls Bus shelters
Assets with medium to low public perception and safety implications.
Low criticality assets Risk tolerance moderate: Greater risk of failure is tolerated
Assets allowed to fall into very poor condition with risk of failure
None assigned No assets are in this category
Source: AT renewals optimisation model (4)
Notes:
1. Maintenance service levels include specified response times to address identified asset defects and issues. These are defined in AT’s maintenance contract specifications.
2. Renewal intervention levels are the target thresholds for determining when an asset should be renewed based on its condition or age. The condition grade of an asset is a proxy measure of the likelihood that the asset has failed or will fail to provide the required level of service in the future.
The above criticality profiles ensure that risk is incorporated into renewals assessments in two ways:
• by setting a condition-based level of service (the renewals intervention point) – this is a first response to risk and reflects the tolerance for risk for each asset
• by setting the time to address current and annually accruing backlog (backlog is the highest risk condition state for an asset). This reflects the tolerance for backlog risk over time for each asset and has an impact on cost and condition.
These factors in turn influence the recommended asset investment, as set out in Chapter 7.
AT Asset Management Plan 2015 - 2018

AT Asset Management Plan 2015 – 2018 Page 85 of 139
Monitoring and reporting on transport asset risks 5.5.
Regular monitoring, reviewing and reporting is an important part of the risk management process, as it ensures that new risks and changes to existing risks are identified and managed.
AT’s management of transport asset risk will be monitored through the processes described in Table 23. These processes will be developed as part of the Asset Risk Management Plan improvement programme over the next 12 to 18 months.
Table 23: Risk monitoring and management
Monitoring processes Description
Monitoring and analysing trends in key risk indicators
Key risk indicators are metrics used to provide an early signal of increasing risk exposures across the enterprise. Unlike key performance indicators, which provide information about past performance, key risk indicators are leading indicators that provide information about changing risk factors or exposures, which may impact on future performance. Key risk indicators measure or provide information about events or trigger points that might signal issues that are developing internally or potential risks that are emerging from changes in the external context.
Liaison with Auckland Lifelines Group
AT’s involvement with the Auckland Lifelines Group provides opportunities to review infrastructure-‐related risks at a cross-‐sector level.
Audits or reviews of existing controls
Audits or reviews of existing controls provide an opportunity to evaluate the effectiveness of those controls and to identify opportunities for improvement.
PESTELOM assessment undertaken during the preparation of the asset class management plans
(PESTELOM stands for:
• Political • Environmental • Social • Technological • Economic • Legal/legislative • Organisational • Media)
The preparation of the asset class management plans, which this AMP is based on, involves assessing the organisation’s strategic context, and the potential impact of asset maintenance and renewal needs in relation to that context. This provides AT with opportunities to:
• consider the implications of changes in the strategic context (e.g. objectives, levels of service, funding levels, priorities) with respect to asset risk profiles and controls
• consider the asset-‐related risks with respect to implementation, including challenging key assumptions
• identify whether changes to asset risk controls or additional controls are required.
Formal reviews of the Asset Risk Management Plan
AT’s Asset Risk Management Plan may be formally reviewed on a periodic or ad-‐hoc basis, as required, to assess:
• any changes to the strategic or operational context, which need to be taken into account, or which have resulted in changes to the risk landscape or tactical controls
• trends in key risk indicators that need to be addressed
• the results of audits or reviews of tactical controls that need to be addressed, or changes to tactical controls that have been planned or implemented as a result
• progress with implementing risk management improvements and any additional improvement actions required.
AT Asset Management Plan 2015 - 2018

AT Asset Management Plan 2015 – 2018 Page 86 of 139
AT uses risk registers to record risk-related information. Asset risks, and their controls and treatments, are recorded in the risk registers and are assigned appropriate owners. Risks are reported to AT management, the executive leadership team, the chief executive, the Finance and Risk Committee, and the AT Board, in accordance with the risk escalation hierarchy defined in the AT risk management framework.
Road safety 5.6.
One of AT’s main objectives is to provide a safe transport system that is increasingly free of deaths and serious injuries. This supports the vision and plan of the National Road Safety Committee, as set out in the Safer Journeys Strategy to 2020 (21).
To reduce the number of deaths and serious injuries on Auckland roads, footpaths, cycle paths and public transport services, AT collaborates with key stakeholders including the:
• New Zealand Police
• New Zealand Transport Agency
• Ministry of Transport
• Accident Compensation Corporation.
AT takes an evidence-based approach to safety, taking into account the risks to road users, public transport users, cyclists and pedestrians. Safety interventions use the ‘three Es’ of engineering, education and enforcement.
AT’s asset safety framework is currently under development.
Table 24 summarises AT’s current Road Safety Action Plan.
Table 24: Road Safety Action Plan safety interventions
Type of intervention Key actions Detailed activities
Engineering Increase safety engineering
Develop a crash risk assessment rating and priority for all arterial roads and on local roads that have a high crash-‐risk
Implement a prioritised programme of safety engineering projects
Implement safety engineering measures at high-‐crash-‐risk locations
Use Road Safety Action Plan meetings to coordinate activities between AT and key stakeholders
Improve speed management
Develop a regional speed management policy around safer and survivable speed
Use fixed safety cameras at intersections and other high-‐risk areas
Specify safe urban design and engineering measures for pedestrians, vehicle drives, cyclists and public transport users in and around town centres, schools and residential areas
Improve intersection safety
Initiate safety audits and crash reduction studies at high-‐risk intersections
Implement engineering improvements at and around the intersections
Improve pedestrian safety
Implement upgrades of pedestrian facilities
Improve safety measures around highly pedestrianised areas and shared zones
AT Asset Management Plan 2015 - 2018
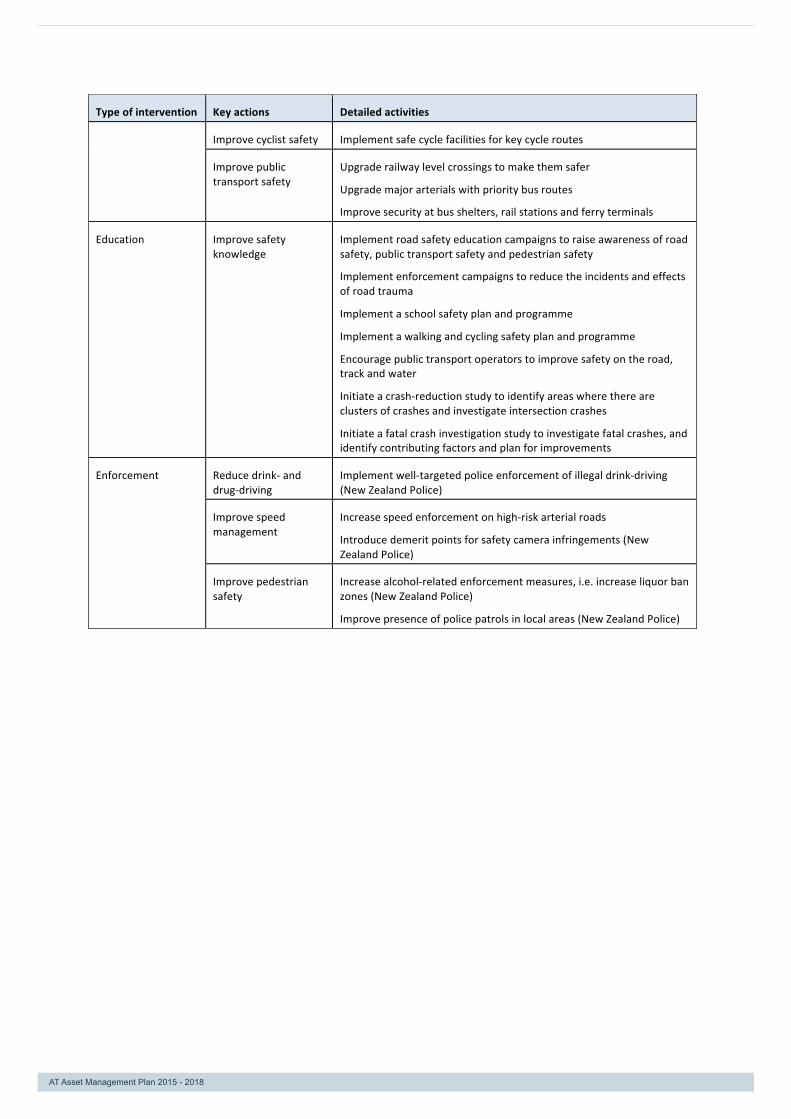
AT Asset Management Plan 2015 – 2018 Page 87 of 139
Type of intervention Key actions Detailed activities
Improve cyclist safety Implement safe cycle facilities for key cycle routes
Improve public transport safety
Upgrade railway level crossings to make them safer
Upgrade major arterials with priority bus routes
Improve security at bus shelters, rail stations and ferry terminals
Education Improve safety knowledge
Implement road safety education campaigns to raise awareness of road safety, public transport safety and pedestrian safety
Implement enforcement campaigns to reduce the incidents and effects of road trauma
Implement a school safety plan and programme
Implement a walking and cycling safety plan and programme
Encourage public transport operators to improve safety on the road, track and water
Initiate a crash-‐reduction study to identify areas where there are clusters of crashes and investigate intersection crashes
Initiate a fatal crash investigation study to investigate fatal crashes, and identify contributing factors and plan for improvements
Enforcement Reduce drink-‐ and drug-‐driving
Implement well-‐targeted police enforcement of illegal drink-‐driving (New Zealand Police)
Improve speed management
Increase speed enforcement on high-‐risk arterial roads
Introduce demerit points for safety camera infringements (New Zealand Police)
Improve pedestrian safety
Increase alcohol-‐related enforcement measures, i.e. increase liquor ban zones (New Zealand Police)
Improve presence of police patrols in local areas (New Zealand Police)
AT Asset Management Plan 2015 - 2018

AT Asset Management Plan 2015 – 2018 Page 88 of 139

AT Asset Management Plan 2015 – 2018 Page 90 of 139

AT Asset Management Plan 2015 – 2018 Page 91 of 139
6. Sustainability
Sustainable infrastructure management meets the needs of the present without compromising the ability of future generations to meet their own needs. It requires that investment decisions consider the long-term impacts of any action or inaction in the broadest possible terms.
This chapter identifies transport sustainability issues and how these are addressed within this AMP.
Key messages
• The Auckland 30-year Infrastructure Strategy requires AT to plan, design and operate its networks and assets in ways that support quality compact growth, reduce resource use and help generate positive behaviour change in Aucklanders.
• Sustainability initiatives are underway and AT is using its draft Sustainability Framework to identify further opportunities
Context 6.1.
The Auckland Plan commits Auckland Council and its CCOs, including AT, to environmental action and green growth.
Infrastructure, including transport infrastructure has a lead role in delivering on this commitment. The Auckland 30-year Infrastructure Strategy states that networks and assets will need to be planned, designed, and operated in a way which:
• supports quality compact growth
• reduces resource use
• assists in generating positive behaviour change in Aucklanders (6).
This includes recognising the role of mana whenua as kaitiaki and providing opportunities for this responsibility to be expressed as part of infrastructure planning and ongoing monitoring.
AT‘s Statement of Intent 2015 (3) commits it to use sustainable business practices in all its operations.
Auckland Transport’s draft Sustainability Framework 6.2.
AT is developing a Sustainability Framework to embed sustainability across the business, from policy to procurement. The draft Framework has informed the preparation of this Asset Management Plan, as shown in Figure 49.
AT Asset Management Plan 2015 - 2018
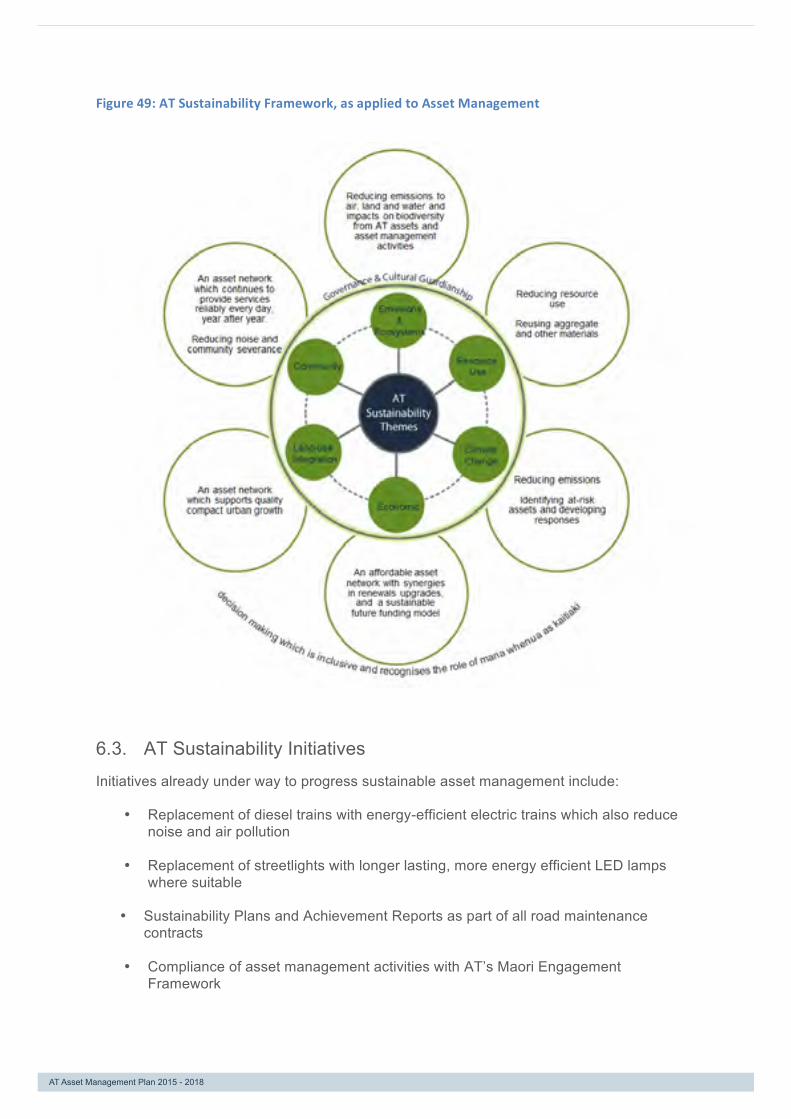
AT Asset Management Plan 2015 – 2018 Page 92 of 139
AT Sustainability Initiatives 6.3.
Initiatives already under way to progress sustainable asset management include:
• Replacement of diesel trains with energy-efficient electric trains which also reduce noise and air pollution
• Replacement of streetlights with longer lasting, more energy efficient LED lamps where suitable
• Sustainability Plans and Achievement Reports as part of all road maintenance contracts
• Compliance of asset management activities with AT’s Maori Engagement Framework
Figure 49: AT Sustainability Framework, as applied to Asset Management
AT Asset Management Plan 2015 - 2018

AT Asset Management Plan 2015 – 2018 Page 93 of 139
Future challenges, to be built into 2018-2021 Asset Management Plan, include:
• Increasing the proportion of renewals projects which enhance the public transport, walking and cycling networks in line with future strategies, rather than simply replacing like with like
• Undertake a systematic review of the potential impacts of climate change and sea level rise on AT assets
• Develop a Vegetation Asset Class Management Plan which considers the maintenance and enhancement of ecosystems in the road corridor
Table 25 shows further detail of sustainability issues and mitigation actions, by asset class.
AT Asset Management Plan 2015 - 2018

AT
Ass
et M
anag
emen
t Pla
n 20
15 –
201
8 P
age
94 o
f 139
Table 25
: Sustainab
ility im
pacts an
d mitigatio
n actio
ns
Ass
et C
lass
Im
pact
s on
sus
tain
abili
ty
Miti
gatio
n m
easu
res
(to
be
dele
gate
d to
con
trac
tors
as
appr
opria
te)
Con
trib
utes
to:
Pav
emen
ts
Roa
d no
ise
Sm
ooth
ro
ad
surfa
ces
that
us
e in
nova
tive
mat
eria
ls. S
moo
th b
ridge
join
ts. B
ylaw
con
trols
. C
omm
unity
D
ust f
rom
uns
eale
d ro
ads
Roa
d se
alin
g (s
ee
AT’
s S
eal
Ext
ensi
on
Gui
delin
es).
Sur
face
tre
atm
ent
durin
g pe
riods
of
dry
wea
ther
. Inn
ovat
ive
unse
aled
road
des
igns
.
Em
issi
ons,
Com
mun
ity
S
carc
ity
of
cons
ente
d qu
arrie
s pr
ovid
ing
qual
ity
natu
ral a
ggre
gate
s ne
ar A
uckl
and
Rec
yclin
g co
ncre
te a
nd o
ther
mat
eria
ls
Res
ourc
e U
se
B
itum
en ru
n-of
f R
obus
t con
trols
whe
n ap
plyi
ng b
itum
en p
rodu
cts
in
road
con
stru
ctio
n, m
aint
enan
ce a
nd re
new
als.
E
mis
sion
s (to
air
and
wat
er)
P
avem
ent s
urfa
ce re
new
als
R
ecyc
le
and
reus
e pa
vem
ent
surfa
ces
by
refre
shin
g th
e bi
nder
an
d re
-layi
ng
(req
uire
s sp
ecia
list p
lant
.)
Res
ourc
e U
se
Sto
rmw
ater
S
torm
wat
er ru
noff
from
road
sur
face
s
Man
age
stor
mw
ater
to
avoi
d flo
odin
g an
d re
duce
se
dim
ent l
oad
Pro
mot
e lo
w-im
pact
des
ign
to m
anag
e st
orm
wat
er
qual
ity a
t the
out
set o
f dev
elop
men
t In
stal
l Tet
ra T
raps
, w
hich
are
gro
ss-p
ollu
tant
filt
er
devi
ces,
whe
re th
e fil
ter i
s in
serte
d in
to s
treet
cat
ch
pits
ove
r the
out
let p
ipe.
Em
issi
ons
(to w
ater
)
Foot
path
s an
d cy
clew
ays
Air
pollu
tion
Pro
vide
saf
e, a
ttrac
tive
and
acce
ssib
le f
ootp
ath
faci
litie
s to
enc
oura
ge w
alki
ng i
nste
ad o
f pr
ivat
e ve
hicl
e us
e.
Em
issi
on/
Eco
-sys
tem
s,
Res
ourc
e us
e,
Land
-use
in
tegr
atio
n, C
omm
unity
Per
sona
l sec
urity
Im
prov
e th
e ur
ban
envi
ronm
ent t
o cr
eate
attr
activ
e pe
dest
rian
stre
ets
and
shar
ed s
pace
s th
at a
re s
afe
to e
njoy
24/
7. P
rovi
de w
ell-d
esig
ned
light
ing.
Com
mun
ity
Brid
ges
and
maj
or c
ulve
rts
Hig
h en
ergy
co
nsum
ptio
n an
d C
O2
emis
sion
s as
soci
ated
with
pro
duct
ion
of c
emen
t ne
eded
for
br
idge
con
stru
ctio
n
Rec
yclin
g br
idge
com
pone
nts.
In
nova
tive
brid
ge
desi
gn
and
cons
truct
ion
solu
tions
.
Res
ourc
e us
e,
Eco
nom
ic,
Com
mun
ity
AT Asset Management Plan 2015 - 2018

AT
Ass
et M
anag
emen
t Pla
n 20
15 –
201
8 P
age
95 o
f 139
Ass
et C
lass
Im
pact
s on
sus
tain
abili
ty
Miti
gatio
n m
easu
res
(to
be
dele
gate
d to
con
trac
tors
as
appr
opria
te)
Con
trib
utes
to:
Wal
ls
Una
ttrac
tive
appe
aran
ce o
f re
tain
ing
wal
ls,
nois
e w
alls
and
sea
wal
ls.
Use
nat
ural
mat
eria
ls.
Use
mur
als,
pat
tern
s in
the
faça
de,
tilin
g an
d/or
pl
antin
g to
im
prov
e th
e ap
pear
ance
.
Em
issi
on/
Eco
-sys
tem
s,
Res
ourc
e us
e, C
omm
unity
E
ffect
of
stre
am c
onta
min
atio
n on
fis
h in
stre
ams
and
river
s.
Whe
n co
nstru
ctin
g or
rep
airin
g w
alls
nea
r st
ream
s an
d riv
ers,
use
pre
-cas
t blo
cks,
off-
site
fabr
icat
ion,
ca
tch
fenc
es a
nd s
heet
pili
ng.
Sto
re m
ater
ials
out
of
reac
h of
wat
er.
Em
issi
on/
Eco
-sys
tem
s,
Res
ourc
e us
e, C
omm
unity
M
ater
ial
used
to
fil
l ga
bion
ba
sket
s co
uld
be
diss
olve
d by
the
sea
wat
er a
nd c
ould
be
harm
ful t
o aq
uatic
life
form
s.
Ens
ure
that
mat
eria
l use
d in
gab
ion
bask
ets
is n
on-
solu
ble
and
iner
t. E
mis
sion
/ E
co-s
yste
ms,
R
esou
rce
use,
Com
mun
ity
Th
e co
nstru
ctio
n of
new
sea
wal
ls c
an h
ave
a ne
gativ
e im
pact
on
sand
dun
es
Dun
es
shou
ld
not
be
rem
oved
or
da
mag
ed
to
enab
le th
e co
nstru
ctio
n of
new
sea
wal
ls.
Em
issi
on/
Eco
-sys
tem
s,
Res
ourc
e us
e
Par
king
C
onve
nien
t pa
rkin
g m
ay n
ot a
ttrac
t ro
ad u
sers
to
othe
r tra
nspo
rt m
odes
suc
h as
wal
king
, cy
clin
g or
pu
blic
tran
spor
t
Land
use
d fo
r ca
r pa
rkin
g is
not
ava
ilabl
e fo
r ot
her,
mor
e pr
oduc
tive,
use
s
Prio
ritis
e an
d m
anag
e pa
rkin
g as
set
out
in
the
Par
king
Stra
tegy
G
over
nanc
e, R
esou
rce
use,
C
limat
e ch
ange
, Eco
nom
ic,
Land
-use
inte
grat
ion,
C
omm
unity
O
pera
tion
of
park
ing
build
ings
ha
s ne
gativ
e en
viro
nmen
tal i
mpa
cts
Wor
k to
war
ds IS
O 1
4001
cer
tific
atio
n of
car
par
ks
Gov
erna
nce,
Em
issi
on/ E
co-
syst
ems,
Eco
nom
ic
Ill
egal
ly p
arke
d ve
hicl
es c
ause
del
ay a
nd ri
sk
Use
enf
orce
men
t to
ens
ure
bus,
hig
h-oc
cupa
ncy
vehi
cle
(HO
V)
lane
s an
d tra
ffic
lane
s ar
e fre
e fro
m
obst
ruct
ion
Em
issi
on/ E
co-s
yste
ms,
E
cono
mic
, Lan
d-us
e in
tegr
atio
n, C
omm
unity
S
treet
ligh
ts
Ene
rgy
use
Pro
gres
sive
ly i
nsta
ll LE
D s
treet
lig
ht l
amps
and
co
ntro
l gea
r th
at c
an v
ary
light
ing
leve
ls a
ccor
ding
to
ne
ed
(Thi
s al
so
appl
ies
to
park
ing
and
PT
faci
litie
s an
d tra
ffic
sign
als)
.
Em
issi
on/ E
co-s
yste
ms,
E
cono
mic
, Com
mun
ity
Li
ght p
ollu
tion
Impr
ove
light
ing
stan
dard
s th
roug
h be
tter
light
di
strib
utio
n an
d lo
wer
lig
ht
pollu
tion
from
ne
w
light
ing
tech
nolo
gies
, re
duci
ng s
pill
light
and
sky
gl
ow.
Em
issi
on/ E
co-s
yste
ms,
C
omm
unity
AT Asset Management Plan 2015 - 2018

AT
Ass
et M
anag
emen
t Pla
n 20
15 –
201
8 P
age
96 o
f 139
Ass
et C
lass
Im
pact
s on
sus
tain
abili
ty
Miti
gatio
n m
easu
res
(to
be
dele
gate
d to
con
trac
tors
as
appr
opria
te)
Con
trib
utes
to:
Traf
fic
syst
ems
Air
pollu
tion
from
veh
icle
exh
aust
s U
se t
raffi
c sy
stem
s to
man
age
cong
estio
n an
d re
duce
inef
ficie
nt, s
top-
star
t tra
vel
Em
issi
on/ E
co-s
yste
ms,
C
omm
unity
O
ptim
isin
g ve
hicl
e flo
w c
an d
isco
urag
e ot
her
road
us
ers
incl
udin
g pe
dest
rians
and
cyc
lists
U
se R
oute
Opt
imis
atio
n to
favo
ur c
erta
in ro
ad u
ser
grou
ps d
epen
ding
on
curr
ent
stra
tegi
es s
uch
as
bus
prio
rity,
key
ped
estri
an r
oute
s, c
ycle
lane
s or
fre
ight
. Fo
r ex
ampl
e, Q
ueen
St i
nter
sect
ions
hav
e in
crea
sed
pede
stria
n ph
ase
leng
ths.
Em
issi
on/ E
co-s
yste
ms,
La
nd-u
se in
tegr
atio
n,
Com
mun
ity
Cor
ridor
st
ruct
ures
and
fix
ture
s
Def
ores
tatio
n of
sl
ow-g
row
ing
nativ
e ha
rdw
ood
trees
incl
udin
g ka
uri,
rimu
and
tota
ra
Use
of
sust
aina
ble
sour
ces
of w
ood
for
fenc
es,
bolla
rds
and
sigh
t rai
ls
Em
issi
on/ E
co-s
yste
ms,
C
limat
e ch
ange
Zi
nc f
rom
gal
vani
zed
stee
l, an
d to
xins
fro
m w
ood
treat
men
t, ol
d pa
int a
nd c
reos
ote
can
ente
r stre
ams
and
river
s or
be
toxi
c
Avo
id t
he u
se o
f th
ese
mat
eria
ls,
use
appr
opria
te
safe
guar
ds, a
nd d
ispo
se o
f use
d pr
oduc
ts c
aref
ully
E
mis
sion
/ Eco
-sys
tem
s
Rai
l sta
tions
La
ck o
f su
itabl
e al
tern
ativ
es le
ad t
o hi
gh le
vels
of
priv
ate
vehi
cle
use
Incr
ease
d us
e of
trai
ns d
ue to
hig
h qu
ality
sta
tions
w
ill
decr
ease
th
e nu
mbe
r of
ro
ad
vehi
cles
an
d he
nce
decr
ease
po
llutio
n an
d ca
rbon
em
issi
ons
from
road
veh
icle
s
Em
issi
on/ E
co-s
yste
ms,
C
limat
e ch
ange
, Com
mun
ity
Rol
ling
stoc
k A
tmos
pher
ic p
ollu
tion
and
carb
on e
mis
sion
s E
lect
ric t
rain
s ge
nera
te l
ess
pollu
tion
and
carb
on
emis
sion
s co
mpa
red
to th
e ol
der d
iese
l tra
ins
The
new
ele
ctric
tra
in s
ervi
ce i
s al
so q
uiet
er t
han
the
dies
el tr
ains
.
Em
issi
on/ E
co-s
yste
ms,
C
omm
unity
Wha
rves
M
ater
ial
used
in
wha
rf co
nstru
ctio
n ca
n en
ter
the
sea
wat
er a
nd c
ould
be
harm
ful
to a
quat
ic l
ife
form
s.
Ens
ure
that
mat
eria
l use
d in
wha
rves
is a
ppro
pria
te
for u
se in
the
mar
ine
envi
ronm
ent.
Dis
pose
of u
sed
mat
eria
ls s
afel
y.
Em
issi
on/ E
co-s
yste
ms
Bus
net
wor
k Im
plem
enta
tion
of th
e P
T N
ew N
etw
ork
will
cha
nge
usag
e of
bus
ass
ets
Use
th
e bu
s st
op
rene
wal
s pr
ogra
mm
e as
an
op
portu
nity
to
ensu
re f
acili
ties
are
fit f
or p
urpo
se,
cons
ider
ing
thei
r ro
le a
nd fo
reca
st u
sage
in th
e P
T N
ew N
etw
ork
Res
ourc
e us
e, L
and-
use
inte
grat
ion,
Com
mun
ity
Veg
etat
ion
Opp
ortu
nitie
s to
en
hanc
e ec
osys
tem
s an
d to
m
itiga
te o
ther
im
pact
s of
tra
nspo
rt in
frast
ruct
ure,
in
clud
ing
visu
al a
men
ity a
nd d
isch
arge
s to
air
and
wat
er
Pre
pare
a
Veg
etat
ion
Ass
et
Cla
ss
Man
agem
ent
Pla
n w
hich
co
nsid
ers
the
mai
nten
ance
an
d en
hanc
emen
t of e
cosy
stem
s in
the
road
cor
ridor
Em
issi
ons
and
ecos
yste
ms,
C
omm
unity
,
AT Asset Management Plan 2015 - 2018


AT Asset Management Plan 2015 – 2018 Page 99 of 139
7. Asset investment requirements
Ongoing investment in the transport network is required to ensure that assets are maintained in sound condition, are suitable for use and are able to deliver the levels of service identified in Chapter 3.
This chapter identifies the asset investment needs, based on AT’s asset management strategies, core principles and processes.
Key messages
uninflated inflated
• 2015/16–2024/25 renewals investment needs $2.88 billion $3.44 billion
• 2015/16–2024/25 maintenance investment needs –public transport assets $0.71 billion
• 2015/16–2024/25 maintenance investment needs – existing roads $1.15 billion
• Consequential opex from new roads and capital projects $0.98 billion
• Current asset condition is good, with 97% of assets in very good, good or moderate condition. Backlog (assets that are due or overdue for renewal) is $157 million.
• AT’s recommendation is to reduce the backlog over periods ranging from 3 to 30 years, addressing the backlog for critical assets first.
Identifying asset requirements 7.1.
This chapter sets out AT’s future investment requirements for asset renewals, maintenance and operations.
AT’s recommended renewals, maintenance and operations programmes have been developed on an ‘asset needs’ basis, applying AT’s asset management process as described in the previous sections of this AMP. Figure 50 summarises this process.
AT Asset Management Plan 2015 - 2018
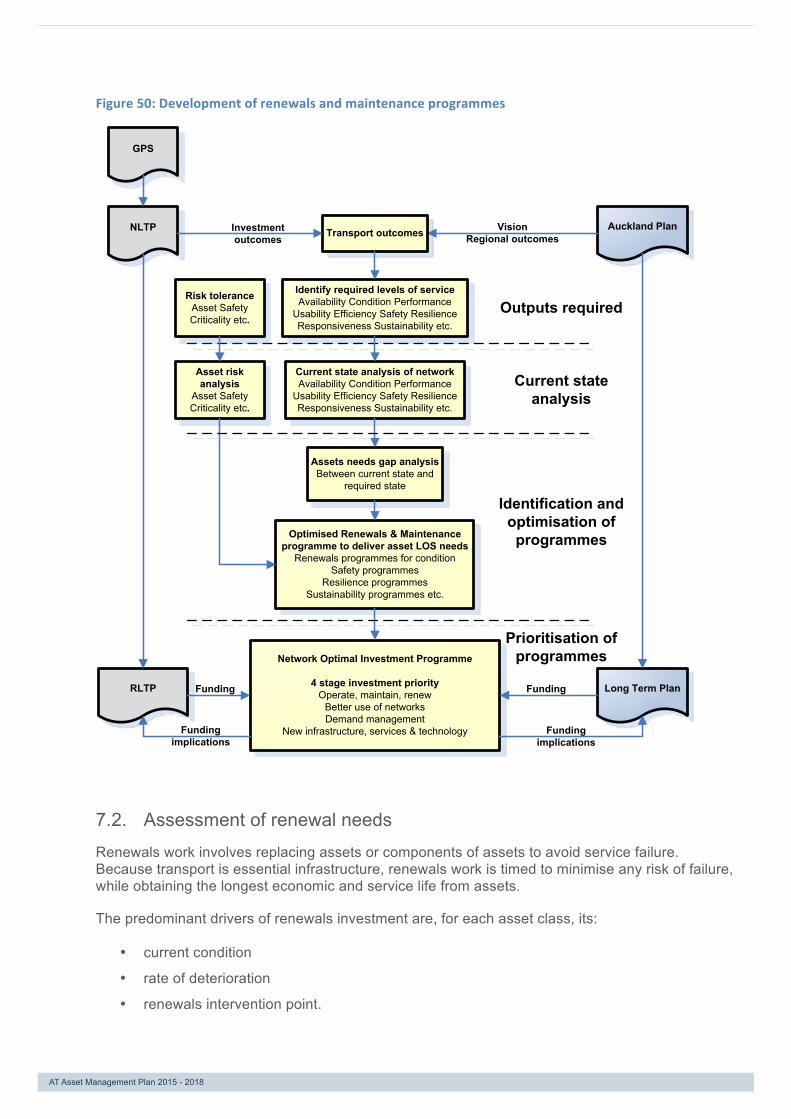
AT Asset Management Plan 2015 – 2018 Page 100 of 139
Figure 50: Development of renewals and maintenance programmes
Assessment of renewal needs 7.2.
Renewals work involves replacing assets or components of assets to avoid service failure. Because transport is essential infrastructure, renewals work is timed to minimise any risk of failure, while obtaining the longest economic and service life from assets.
The predominant drivers of renewals investment are, for each asset class, its:
• current condition
• rate of deterioration
• renewals intervention point.
Auckland PlanNLTP VisionRegional outcomes
Current state analysis of network Availability Condition Performance
Usability Efficiency Safety ResilienceResponsiveness Sustainability etc.
GPS
Transport outcomesInvestmentoutcomes
Identify required levels of serviceAvailability Condition Performance
Usability Efficiency Safety ResilienceResponsiveness Sustainability etc.
Network Optimal Investment Programme
4 stage investment priorityOperate, maintain, renew
Better use of networksDemand management
New infrastructure, services & technology
Long Term PlanRLTP
Fundingimplications
FundingFunding
Fundingimplications
Outputs required
Identification and optimisation of programmes
Current state analysis
Assets needs gap analysisBetween current state and
required state
Asset risk analysis
Asset Safety Criticality etc.
Optimised Renewals & Maintenance programme to deliver asset LOS needs
Renewals programmes for conditionSafety programmes
Resilience programmesSustainability programmes etc.
Risk toleranceAsset Safety Criticality etc.
Prioritisation of programmes
AT Asset Management Plan 2015 - 2018

AT Asset Management Plan 2015 – 2018 Page 101 of 139
One factor that has not been taken into account in this chapter is funding constraints and timing. Minimising the whole-of-life costs of assets often involves spending now to avoid greater costs later on. Funding constraints, and the amended work programme to fit these constraints, is considered in Chapter 8 – Funding and Impacts.
Condition
AT regularly inspects its assets to monitor their condition, using a condition grading system based on the 2011 International Infrastructure Management Manual. Assets are assessed against a 5 point condition scale, ranging from 1 = very good (meets or exceeds customer levels of service as set in Chapter 3) through to 5 = very poor (delivers a very poor level of service, at risk of failing completely).
Rate of deterioration
Figure 51 shows the rate of deterioration curves for the various transport asset classes. These rates are estimations for planning purposes and are based on work previously done within the New Zealand infrastructure asset management sector. AT reviews the accuracy of the curves and the actual expected life for each asset type each year based on actual age, condition and useful life trends.
Renewals intervention point
A renewals intervention point is set for each asset class, based on the level of service required from that class and its risk categorisation.
Figure 51 shows the general approach AT takes to identifying renewals intervention points, using three levels of service options for managing asset condition. Each asset type has been assigned an intervention point based as set out in Table 22.
A present, there no asset classes that are set to be managed at intervention point 3 (allowed to fall below very poor condition, that is, to fail completely). This is because of the potential for higher levels of risk, increased maintenance costs and negative public perception that allowing assets to fall to this condition may have.
Intervention point 2, in which assets are replaced or renewed when they fall into very poor condition, is currently the default setting for the majority of AT’s assets.
Important front-of-house and critical assets are managed at renewals intervention point 1, and are replaced when they fall into poor condition.
Risk is also taken into account in setting the time within which the current and annually accruing backlog must be addressed (backlog is the highest risk condition state for an asset). This reflects the tolerance for backlog risk over time for each asset, and has an impact on the timing of recommended renewals investments.
AT Asset Management Plan 2015 - 2018

AT Asset Management Plan 2015 – 2018 Page 102 of 139
Figure 51: Condition, deterioration and renewals intervention points
Very poor condition assets 7.3.
Currently 1 per cent of AT’s road and public transport assets are in very poor condition. This represents $114.8 million of renewals.
Figure 52 shows the distribution of poor and very poor condition across the asset classes. Assets in very poor condition have a higher risk of unplanned failure and attract higher maintenance costs to keep them viable.
Figure 52: Assets in poor and very poor condition
Source: AT renewals optimisation model (4)
Intervention point 2 No assets worse than condition grade 4
Intervention point 3 No assets worse than condition grade 5
Intervention point 1 No assets worse than condition grade 3
AT Asset Management Plan 2015 - 2018

AT Asset Management Plan 2015 – 2018 Page 103 of 139
Backlog levels across the assets 7.4.
Backlog liability is the total value of assets that are in worse condition than their nominated intervention point. The current value of backlog liability in the transport network is $157 million. This is made up of $114.8 million of assets in very poor condition, and a further $42.2 million of level of service 1 assets that are in poor condition.
Figure 53 shows the distribution of backlog liability for both road and public transport assets. It shows that the majority of backlog exists within the pavement and bridges asset class. Some backlog needs have also been identified within the streetlights, drainage, footpaths and ferry (wharves) classes. Renewals work focusses on reducing this backlog.
Figure 53: Current backlog liability
Source: AT renewals optimisation model (4)
Identifying renewals investment 7.5.
AT determines its recommended renewals programme by using the renewals optimisation model (4) to estimate the cost of renewing assets in future years. The model calculates renewals costs based on:
• renewing intervention point 1 assets in the year in which they fall into poor condition
• renewing intervention point 2 assets in the year in which they fall into very poor condition
• applying the growth factors described in Section 4.4 to take into account new assets created either through AT capital works or by developers as part of the subdivision process.
The renewals optimisation model calculates an optimal long-term renewals investment profile by optimising the relationship between condition, risk and cost across the various asset classes. It can also be used to calculate the future asset condition and risk consequences of available budgets, as set out in the following chapter.
AT Asset Management Plan 2015 - 2018

AT Asset Management Plan 2015 – 2018 Page 104 of 139
The renewals optimisation model approach allows for direct testing of trade-offs between funding availability, levels of service and the levels of backlog that can be accepted, based on risk criteria such as criticality, movement and public perception considerations. It provides decision-makers with a good understanding of the trade-off consequences for each asset class and across the portfolio as whole. The area of potential trade-offs between cost, service and risk is illustrated in Figure 54. The 14 asset class management plans provide further details, for specific assets, of renewals needs, levels of service and risk policy settings.
Figure 54: Renewals optimisation model trade-‐offs
Details of the first decade (2016–2025) renewals investment for each asset class are shown in Table 26. Further details of renewals needs are included in the asset class management plans, summarised in Appendix 4.
Table 26: Renewals investment needs, recommended AMP renewals programme 2016–2025
($ million; inflated) 2015/ 2016
2016/ 2017
2017/ 2018
2018/ 2019
2019/ 2020
2020/ 2021
2021/ 2022
2022/ 2023
2023/ 2024
2024/ 2025
2016-2025 total
Pavement 125.2 133.7 116.3 152.7 189.5 222.2 247.0 266.5 282.0 294.8 2030.0 Stormwater 8.7 15.6 22.8 29.4 35.1 39.8 43.8 47.2 50.2 52.7 345.3 Footpaths & Cycleways 21.0 7.8 10.5 13.2 16.0 18.9 21.7 24.7 27.6 30.5 192.0 Bridges and Major Culverts 9.7 16.7 18.4 20.0 21.3 22.5 23.5 24.5 25.3 26.0 208.1 Walls 13.1 4.2 5.4 6.5 7.5 8.3 9.0 9.7 10.2 10.7 84.6 Traffic Systems 8.2 14.8 12.5 18.5 16.9 16.6 17.4 18.1 18.4 19.0 160.4 Street Lighting 6.7 26.6 25.6 17.1 15.7 17.5 16.9 16.4 15.8 15.5 173.7 Corridor Structures and Fixtures 3.1 1.9 6.1 8.7 9.5 9.2 8.4 7.6 6.9 6.6 68.1 Vegetation - - - - - - - - - - 0.0 Parking 2.5 2.0 3.2 3.7 4.2 5.1 5.1 5.5 5.8 6.0 43.1 Road total 198.2 223.3 220.9 269.9 315.7 360.0 393.0 420.2 442.2 461.8 3,305.3 Rail Stations and Depots/ Stabling 2.1 1.9 7.4 6.8 7.2 8.1 9.3 10.4 11.3 12.1 76.6 Rolling Stock 0.0 0.0 0.0 0.0 0.0 0.0 0.0 0.0 0.0 0.0 0.0 Wharves 4.1 4.5 4.3 4.4 3.2 3.1 3.0 2.9 2.8 2.7 35.0 AT HOP - - - - - - - - - - 0.0 Bus Network 0.9 2.8 3.2 3.0 2.6 2.4 2.3 2.3 2.5 2.6 24.6
PT total 7.0 9.2 15.0 14.2 13.1 13.6 14.6 15.7 16.6 17.4 136.2 Total renewals needs, inflated 205.2 232.4 235.9 284.1 328.8 373.7 407.6 435.9 458.8 479.2 3,441.5
Renewals needs, uninflated 200.0 220.6 217.8 254.9 286.4 315.7 333.7 345.1 351.3 354.8 2,880.2
Source: AT renewals optimisation model (4) Further detail is set out in Appendix 3. Figures are to the nearest $100,000, so items shown as $0 can be between $0 and $50,000.
AT Asset Management Plan 2015 - 2018

AT Asset Management Plan 2015 – 2018 Page 105 of 139
Long term asset renewals needs are forecast to grow as the asset base increases. Indicative long term renewals needs (uninflated) are shown in Table 27.
Table 27 Indicative renewals investment needs 30 year summary ($m) uninflated
Annual average renewals needs ($m, uninfated)
1st decade average
2nd decade average
3rd decade average
2016-45 total
Road 276.5 335.1 319.6 9,312.4
Public transport 11.5 12.9 43.1 674.4
Total 288.0 347.9 362.7 9,986.9
Source: Renewals Optimisation Model (4)
Procurement strategy for renewals 7.6.
Maintenance and renewals works are procured through a single competitive bidding process, and are provided by external contractors and suppliers across three contract areas; north, central and west, south. Contracts combine maintenance, renewals and some minor capital works. They have terms of four years, plus two subsequent rights of renewal of two years each, and are structured to give contractors incentives to get to know the network and deliver to the agreed level of service statements and performance measures.
Over the 2015–2018 period, AT will work with contractors to align levels of service and performance measures for road assets with the One Network Road Classification described in Chapter three.
Impact of the recommended AMP renewals programme 7.7.
Over the 30 years it covers, the recommended AMP renewals programme will ensure that the proportion of assets in very poor condition remains below 1 per cent, and will achieve a gradual improvement in the asset condition profile as backlog variations are reduced. This includes an increase in the proportion of assets in very good condition, from 61.1 per cent in 2016 to 68.8 per cent in 2025, as shown in Figure 55.
AT Asset Management Plan 2015 - 2018
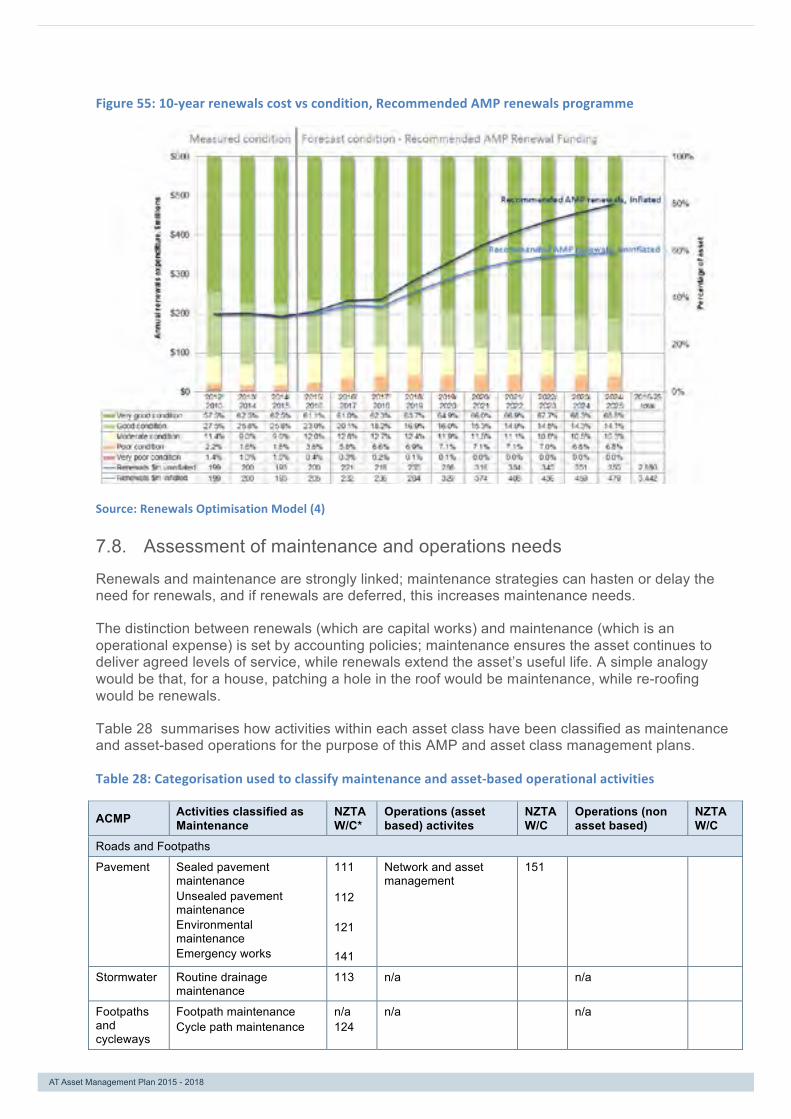
AT Asset Management Plan 2015 – 2018 Page 106 of 139
Figure 55: 10-‐year renewals cost vs condition, Recommended AMP renewals programme
Source: Renewals Optimisation Model (4)
Assessment of maintenance and operations needs 7.8.
Renewals and maintenance are strongly linked; maintenance strategies can hasten or delay the need for renewals, and if renewals are deferred, this increases maintenance needs.
The distinction between renewals (which are capital works) and maintenance (which is an operational expense) is set by accounting policies; maintenance ensures the asset continues to deliver agreed levels of service, while renewals extend the asset’s useful life. A simple analogy would be that, for a house, patching a hole in the roof would be maintenance, while re-roofing would be renewals.
Table 28 summarises how activities within each asset class have been classified as maintenance and asset-based operations for the purpose of this AMP and asset class management plans.
Table 28: Categorisation used to classify maintenance and asset-‐based operational activities
ACMP Activities classified as Maintenance
NZTA W/C*
Operations (asset based) activites
NZTA W/C
Operations (non asset based)
NZTA W/C
Roads and Footpaths
Pavement Sealed pavement maintenance Unsealed pavement maintenance Environmental maintenance Emergency works
111 112 121 141
Network and asset management
151
Stormwater Routine drainage maintenance
113 n/a n/a
Footpaths and cycleways
Footpath maintenance Cycle path maintenance
n/a 124
n/a n/a
AT Asset Management Plan 2015 - 2018

AT Asset Management Plan 2015 – 2018 Page 107 of 139
ACMP Activities classified as Maintenance
NZTA W/C*
Operations (asset based) activites
NZTA W/C
Operations (non asset based)
NZTA W/C
Bridges and major culverts
Structures maintenance 114 n/a n/a
Walls n/a n/a n/a
Traffic systems
Traffic services maintenance Operational traffic management Level crossing warning devices
122 123 131
Operational traffic management
123 n/a
Street lighting
Traffic services maintenance
122 Traffic services maintenance
122 n/a
Corridor structures and fixtures
Traffic services maintenance Amenities maintenance
122 n/a
n/a n/a
Vegetation Environmental maintenance Amenity planting
121 n/a
n/a n/a
Roads and Footpaths (not otherwise classified)
Operational traffic management Permits to access/ work in road corridor Safety and demand management Other road related operational costs
123 n/a 151
Parking (not subsidised by NZTA)
Parking Maintenance of parking buildings and offstreet parking areas
n/a Pay & Display systems n/a Enforcement n/a
Public Transport
Rail stations and depots/ stabling
Rail station and depot facilities maintenance
514 Rail station operating costs (514)
514 Rail service contracts, concessionary fares, track access payments to KiwiRail
515 522
Rolling stock
Maintenance fees for diesel and electric trains
515 Fuel and other costs for diesel and electric trains
515 n/a
Wharves Wharf facilities maintenance
514 Passenger facilities operating costs
514 Ferry service contracts and concessionary fares
512 522
AT HOP n/a AT HOP operating costs
524 n/a
Bus network Bus shelter cleaning and maintenance
514 Bus station operating costs
514 Bus service contracts and concessionary fares
511 517 521 522
Public transport (not otherwise classified)
Public transport information supply, operations and maintenance
524
*NZTA Work Category as defined in the NZTA Planning and Investment Knowledge Base
AT Asset Management Plan 2015 - 2018
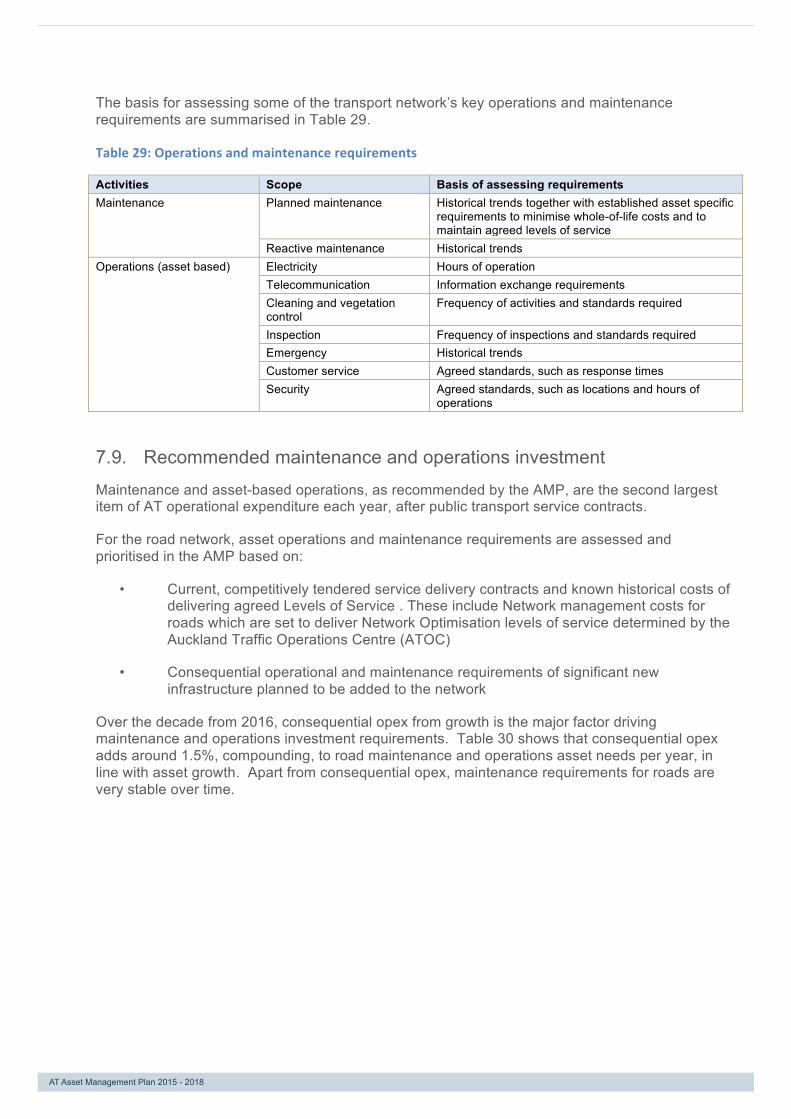
AT Asset Management Plan 2015 – 2018 Page 108 of 139
The basis for assessing some of the transport network’s key operations and maintenance requirements are summarised in Table 29.
Table 29: Operations and maintenance requirements
Activities Scope Basis of assessing requirements Maintenance Planned maintenance Historical trends together with established asset specific
requirements to minimise whole-of-life costs and to maintain agreed levels of service
Reactive maintenance Historical trends Operations (asset based) Electricity Hours of operation
Telecommunication Information exchange requirements Cleaning and vegetation control
Frequency of activities and standards required
Inspection Frequency of inspections and standards required Emergency Historical trends Customer service Agreed standards, such as response times Security Agreed standards, such as locations and hours of
operations
Recommended maintenance and operations investment 7.9.
Maintenance and asset-based operations, as recommended by the AMP, are the second largest item of AT operational expenditure each year, after public transport service contracts.
For the road network, asset operations and maintenance requirements are assessed and prioritised in the AMP based on:
• Current, competitively tendered service delivery contracts and known historical costs of delivering agreed Levels of Service . These include Network management costs for roads which are set to deliver Network Optimisation levels of service determined by the Auckland Traffic Operations Centre (ATOC)
• Consequential operational and maintenance requirements of significant new infrastructure planned to be added to the network
Over the decade from 2016, consequential opex from growth is the major factor driving maintenance and operations investment requirements. Table 30 shows that consequential opex adds around 1.5%, compounding, to road maintenance and operations asset needs per year, in line with asset growth. Apart from consequential opex, maintenance requirements for roads are very stable over time.
AT Asset Management Plan 2015 - 2018
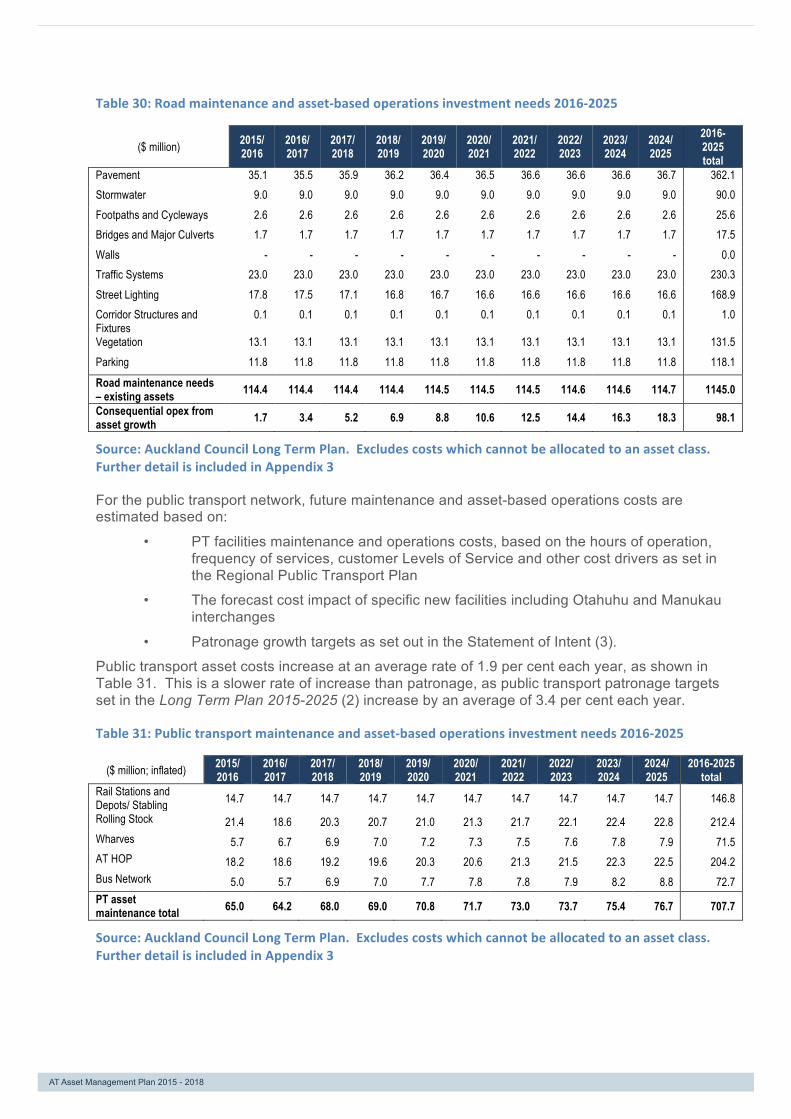
AT Asset Management Plan 2015 – 2018 Page 109 of 139
Table 30: Road maintenance and asset-‐based operations investment needs 2016-‐2025
($ million) 2015/ 2016
2016/ 2017
2017/ 2018
2018/ 2019
2019/ 2020
2020/ 2021
2021/ 2022
2022/ 2023
2023/ 2024
2024/ 2025
2016-2025 total
Pavement 35.1 35.5 35.9 36.2 36.4 36.5 36.6 36.6 36.6 36.7 362.1 Stormwater 9.0 9.0 9.0 9.0 9.0 9.0 9.0 9.0 9.0 9.0 90.0 Footpaths and Cycleways 2.6 2.6 2.6 2.6 2.6 2.6 2.6 2.6 2.6 2.6 25.6 Bridges and Major Culverts 1.7 1.7 1.7 1.7 1.7 1.7 1.7 1.7 1.7 1.7 17.5 Walls - - - - - - - - - - 0.0 Traffic Systems 23.0 23.0 23.0 23.0 23.0 23.0 23.0 23.0 23.0 23.0 230.3 Street Lighting 17.8 17.5 17.1 16.8 16.7 16.6 16.6 16.6 16.6 16.6 168.9 Corridor Structures and Fixtures
0.1 0.1 0.1 0.1 0.1 0.1 0.1 0.1 0.1 0.1 1.0
Vegetation 13.1 13.1 13.1 13.1 13.1 13.1 13.1 13.1 13.1 13.1 131.5 Parking 11.8 11.8 11.8 11.8 11.8 11.8 11.8 11.8 11.8 11.8 118.1
Road maintenance needs – existing assets 114.4 114.4 114.4 114.4 114.5 114.5 114.5 114.6 114.6 114.7 1145.0
Consequential opex from asset growth 1.7 3.4 5.2 6.9 8.8 10.6 12.5 14.4 16.3 18.3 98.1
Source: Auckland Council Long Term Plan. Excludes costs which cannot be allocated to an asset class. Further detail is included in Appendix 3
For the public transport network, future maintenance and asset-based operations costs are estimated based on:
• PT facilities maintenance and operations costs, based on the hours of operation, frequency of services, customer Levels of Service and other cost drivers as set in the Regional Public Transport Plan
• The forecast cost impact of specific new facilities including Otahuhu and Manukau interchanges
• Patronage growth targets as set out in the Statement of Intent (3).
Public transport asset costs increase at an average rate of 1.9 per cent each year, as shown in Table 31. This is a slower rate of increase than patronage, as public transport patronage targets set in the Long Term Plan 2015-2025 (2) increase by an average of 3.4 per cent each year.
Table 31: Public transport maintenance and asset-‐based operations investment needs 2016-‐2025
($ million; inflated) 2015/ 2016
2016/ 2017
2017/ 2018
2018/ 2019
2019/ 2020
2020/ 2021
2021/ 2022
2022/ 2023
2023/ 2024
2024/ 2025
2016-2025 total
Rail Stations and Depots/ Stabling 14.7 14.7 14.7 14.7 14.7 14.7 14.7 14.7 14.7 14.7 146.8 Rolling Stock 21.4 18.6 20.3 20.7 21.0 21.3 21.7 22.1 22.4 22.8 212.4 Wharves 5.7 6.7 6.9 7.0 7.2 7.3 7.5 7.6 7.8 7.9 71.5 AT HOP 18.2 18.6 19.2 19.6 20.3 20.6 21.3 21.5 22.3 22.5 204.2 Bus Network 5.0 5.7 6.9 7.0 7.7 7.8 7.8 7.9 8.2 8.8 72.7 PT asset maintenance total 65.0 64.2 68.0 69.0 70.8 71.7 73.0 73.7 75.4 76.7 707.7
Source: Auckland Council Long Term Plan. Excludes costs which cannot be allocated to an asset class. Further detail is included in Appendix 3
AT Asset Management Plan 2015 - 2018


AT Asset Management Plan 2015 – 2018 Page 113 of 139
8. Funding and impacts
AT’s funding comes from Auckland Council, the New Zealand Transport Agency and from revenue, including parking charges and public transport fares. Auckland Council has adopted an Accelerated Transport Programme in its Long-Term Plan 2015–2025, which provides for renewals funding for the transport network at close to the levels recommended in this AMP in the first three years. From year four of the long-term plan, funding for renewals is below the recommended level, which is forecast to result in lower levels of service, increased risk and increased whole-of-life costs.
Key messages
inflated uninflated
• Renewals investment need 2015/2016 to 2024/2025 • 3,440 • $2,880
• Renewals funding approved in Long-Term Plan 2015–2025
• 2,511 • $2,129
• Renewals funding is close to recommended levels for the first three years of the long-term plan (2015/16 to 2017/18), but falls thereafter.
• This level of renewals funding will increase the proportion of assets in very poor condition, from 1 per cent in 2016 to 9.4 per cent in 2025.
• Maintenance and operations budgets approved in the Long Term Plan do not include provision for consequential opex from asset growth.
Funding sources 8.1.
AT’s funding comes from three sources: Auckland Council, the New Zealand Transport Agency and AT revenue, as shown in Figure 56.
Figure 56: Funding and delivery flows for the AT network
AT is a Council Controlled Organisation of Auckland Council. Auckland Council contributes over half of AT’s total funding, and sets the level of funding for AT in its long-term plan (2). Auckland Council’s policy settings for funding roads, footpaths, public transport and parking are contained in its Revenue and Financing Policy (22).
Auckland Transport programmes
Infrastructure maintenanceOperations and transport servicesInfrastructure renewalsNew capital development
At revenue
Public transport faresRental revenueParking fees and fines
FundingLong Term Plan
Auckland Council revenue
General ratesOther revenue
NZTA revenue
Fuel exciseRoad user chargesMotor vehicle registrations
National Land Transport Programme
Funding
Funding
AT Asset Management Plan 2015 - 2018

AT Asset Management Plan 2015 – 2018 Page 114 of 139
The New Zealand Transport Agency is directly responsible for State Highways and also co-invests in AT activities that contribute to achieving the priorities in the Government Policy Statement on Land Transport 2015/16–2024/25 (8). Roughly a quarter of AT’s funding comes from the New Zealand Transport Agency. The policies that guide the agency’s investment are set out in its Investment Assessment Framework (23).
The remainder of AT’s funding comes from operating revenue (parking and enforcement revenue and public transport fares).
The Accelerated Transport Programme – Capital Improvements 8.2.
Auckland Council consulted in its draft long-term plan on two alternative capital improvement programmes:
• an optimised capital programme, called the Auckland Plan scenario • a reduced basic programme to fit within capital funding constraints.
Following public consultation, Auckland Council adopted an accelerated transport capital programme (ATP), which includes all of the projects in the basic programme, along with some additional programmes. The accelerated programme will include:
• bringing forward investment for the Auckland–Manukau Eastern Transport Initiative between 2015 and 2018
• increasing walking and cycling funding to $124 million, leveraging additional central government funding
• developing transport interchanges at Otahuhu, Manukau and Te Atatu • improving the Te Atatu road corridor • developing a Pukekohe interchange and park-and-ride • building new park-and-rides at Papakura, Westgate and Silverdale • improving Tamaki Drive and Ngapipi Road intersection • increasing the budget for rural road seal extensions by $7 million • undertaking public transport safety improvements • building 45 kilometres of additional bus lanes.
Table 32 summarises the ten year capital programme (2016–2025) by asset class. Note that some projects, including the Growth Infrastructure Fund and corporate projects, cannot be allocated to an asset class and are not included in the summary table. Full detail of capital projects is set out in Appendix 3.
As part of the Accelerated Transport Programme, Auckland Council makes provision within its overall transport renewals allocation for the following specific projects:
• Refurbishment of the 10 diesel trains used for the Pukekohe service in 2019/2020 (noting that the preferred option is the extension of electrification to Pukekohe, subject to Government funding)
• LED Streetlighting, which will reduce whole-of-life costs by installing more energy-efficient, longer lasting LED luminaires
• Seismic strengthening projects, including a seismic upgrade of the Quay St seawall • Replacement of some assets from AT’s revenue-generating parking activities • General AT asset replacement/renewal (corporate and IT assets)
These projects are included as capital projects in Table 32 and Appendix 3.
AT Asset Management Plan 2015 - 2018

AT Asset Management Plan 2015 – 2018 Page 115 of 139
Table 32: Approved ATP capital improvement programmes by asset class
($m, inflated) 2015/ 2016
2016/ 2017
2017/ 2018
2018/ 2019
2019/ 2020
2020/ 2021
2021/ 2022
2022/ 2023
2023/ 2024
2024/ 2025
2016-2025 total
Pavements 94.4 99.2 54.4 26.0 23.4 58.2 159.4 131.5 171.7 126.9 945.1 Footpaths and Cycleways 38.5 48.2 68.5 13.4 20.7 23.7 24.4 25.3 26.1 27.0 315.7 Bridges and Major Culverts 0.0 4.4 4.5 0.0 0.0 0.0 0.0 0.0 0.0 0.0 9.0 Walls 1.0 1.1 1.1 1.1 1.1 11.0 55.9 12.6 13.1 13.5 111.5 Traffic Systems 0.1 0.1 0.1 0.1 0.1 0.1 0.1 0.2 0.2 0.2 1.4 Street Lighting 4.8 5.0 5.1 5.2 5.4 7.5 7.7 8.0 8.2 8.5 65.3 Parking (includes park and ride) 7.3 9.2 5.8 2.5 4.2 3.8 3.9 4.1 4.2 4.3 49.3
Road capital projects total 146.1 167.2 139.6 48.3 54.9 104.2 251.5 181.6 223.5 180.5 1497.3 Rail Stations and Depots/ Stabling (inc City Rail Link) 114.4 158.0 125.1 217.0 314.4 470.1 508.3 380.6 77.8 7.2 2372.9
Rolling Stock 26.8 1.0 0.0 0.0 8.1 0.0 0.0 0.0 0.0 0.0 35.9 Wharves 0.6 0.6 0.6 0.7 0.7 0.7 0.7 0.8 0.8 0.8 7.1 AT HOP 8.0 1.9 4.2 2.0 2.1 3.4 2.2 7.8 8.1 2.4 42.2 Bus Network 57.4 85.1 66.9 6.9 12.9 121.7 210.1 91.0 75.6 120.3 848.0 PT capital projects total 207.3 246.7 196.9 226.6 338.1 595.9 721.3 480.1 162.3 130.7 3306.1
Source: Auckland Council Long Term Plan. Excludes costs which cannot be allocated to an asset class. Further detail is included in Appendix 3
The Accelerated Transport Programme – maintenance and operations 8.3.
Approved road maintenance budgets show no significant increase over the coming 10 years as shown in Figure 57 and Table 33. Public transport maintenance and asset-based operations budgets increase by an average of 1.9% each year, while over the same period patronage targets increase by an average of 3.4% per year.
Figure 57 : Approved ATP maintenance and asset-‐based operations funding 2015/2016 to 2024/2025
AT Asset Management Plan 2015 - 2018
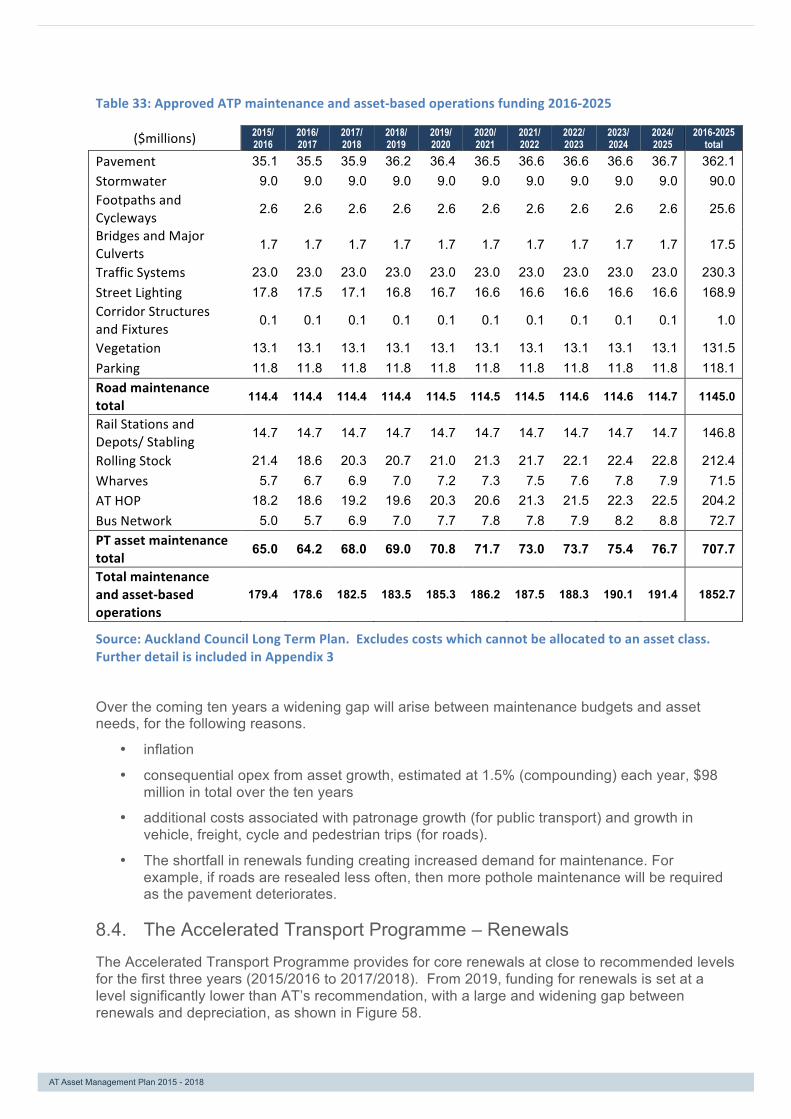
AT Asset Management Plan 2015 – 2018 Page 116 of 139
Table 33: Approved ATP maintenance and asset-‐based operations funding 2016-‐2025
($millions) 2015/ 2016
2016/ 2017
2017/ 2018
2018/ 2019
2019/ 2020
2020/ 2021
2021/ 2022
2022/ 2023
2023/ 2024
2024/ 2025
2016-2025 total
Pavement 35.1 35.5 35.9 36.2 36.4 36.5 36.6 36.6 36.6 36.7 362.1 Stormwater 9.0 9.0 9.0 9.0 9.0 9.0 9.0 9.0 9.0 9.0 90.0 Footpaths and Cycleways
2.6 2.6 2.6 2.6 2.6 2.6 2.6 2.6 2.6 2.6 25.6
Bridges and Major Culverts
1.7 1.7 1.7 1.7 1.7 1.7 1.7 1.7 1.7 1.7 17.5
Traffic Systems 23.0 23.0 23.0 23.0 23.0 23.0 23.0 23.0 23.0 23.0 230.3 Street Lighting 17.8 17.5 17.1 16.8 16.7 16.6 16.6 16.6 16.6 16.6 168.9 Corridor Structures and Fixtures
0.1 0.1 0.1 0.1 0.1 0.1 0.1 0.1 0.1 0.1 1.0
Vegetation 13.1 13.1 13.1 13.1 13.1 13.1 13.1 13.1 13.1 13.1 131.5 Parking 11.8 11.8 11.8 11.8 11.8 11.8 11.8 11.8 11.8 11.8 118.1 Road maintenance total
114.4 114.4 114.4 114.4 114.5 114.5 114.5 114.6 114.6 114.7 1145.0
Rail Stations and Depots/ Stabling
14.7 14.7 14.7 14.7 14.7 14.7 14.7 14.7 14.7 14.7 146.8
Rolling Stock 21.4 18.6 20.3 20.7 21.0 21.3 21.7 22.1 22.4 22.8 212.4 Wharves 5.7 6.7 6.9 7.0 7.2 7.3 7.5 7.6 7.8 7.9 71.5 AT HOP 18.2 18.6 19.2 19.6 20.3 20.6 21.3 21.5 22.3 22.5 204.2 Bus Network 5.0 5.7 6.9 7.0 7.7 7.8 7.8 7.9 8.2 8.8 72.7 PT asset maintenance total
65.0 64.2 68.0 69.0 70.8 71.7 73.0 73.7 75.4 76.7 707.7
Total maintenance and asset-‐based operations
179.4 178.6 182.5 183.5 185.3 186.2 187.5 188.3 190.1 191.4 1852.7
Source: Auckland Council Long Term Plan. Excludes costs which cannot be allocated to an asset class. Further detail is included in Appendix 3
Over the coming ten years a widening gap will arise between maintenance budgets and asset needs, for the following reasons.
• inflation
• consequential opex from asset growth, estimated at 1.5% (compounding) each year, $98 million in total over the ten years
• additional costs associated with patronage growth (for public transport) and growth in vehicle, freight, cycle and pedestrian trips (for roads).
• The shortfall in renewals funding creating increased demand for maintenance. For example, if roads are resealed less often, then more pothole maintenance will be required as the pavement deteriorates.
The Accelerated Transport Programme – Renewals 8.4.
The Accelerated Transport Programme provides for core renewals at close to recommended levels for the first three years (2015/2016 to 2017/2018). From 2019, funding for renewals is set at a level significantly lower than AT’s recommendation, with a large and widening gap between renewals and depreciation, as shown in Figure 58.
AT Asset Management Plan 2015 - 2018
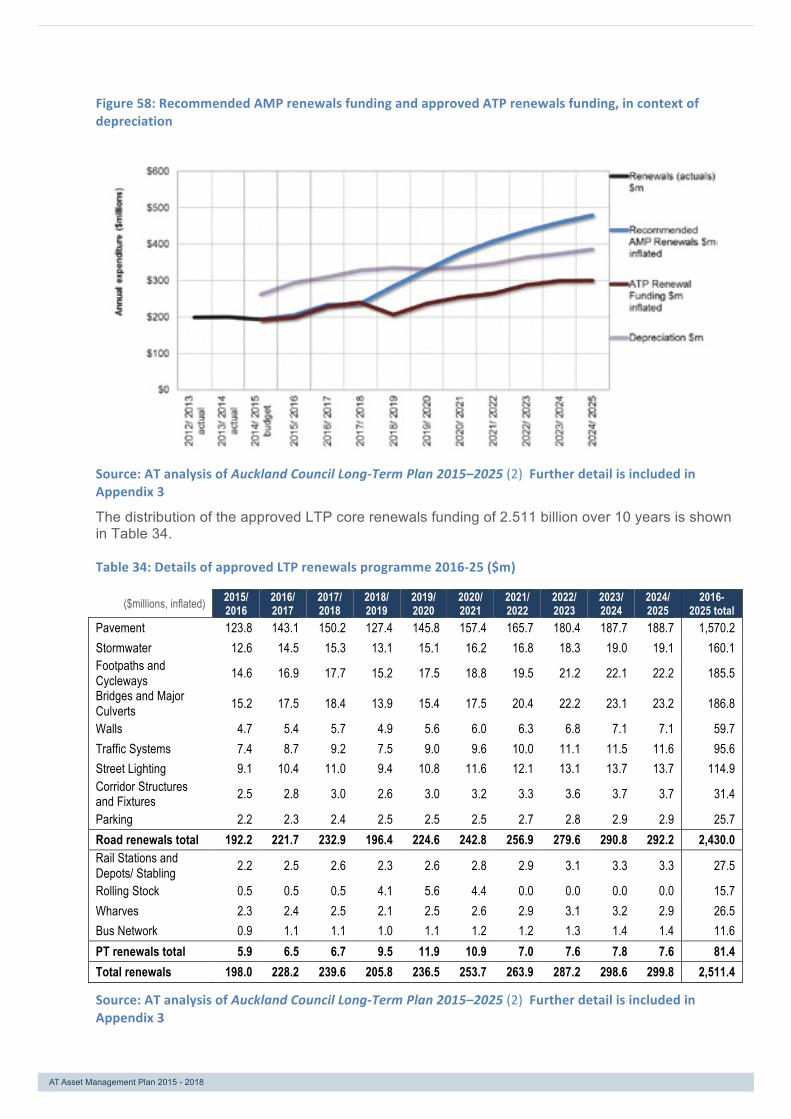
AT Asset Management Plan 2015 – 2018 Page 117 of 139
Figure 58: Recommended AMP renewals funding and approved ATP renewals funding, in context of depreciation
Source: AT analysis of Auckland Council Long-‐Term Plan 2015–2025 (2) Further detail is included in Appendix 3
The distribution of the approved LTP core renewals funding of 2.511 billion over 10 years is shown in Table 34.
Table 34: Details of approved LTP renewals programme 2016-‐25 ($m)
($millions, inflated) 2015/ 2016
2016/ 2017
2017/ 2018
2018/ 2019
2019/ 2020
2020/ 2021
2021/ 2022
2022/ 2023
2023/ 2024
2024/ 2025
2016-2025 total
Pavement 123.8 143.1 150.2 127.4 145.8 157.4 165.7 180.4 187.7 188.7 1,570.2 Stormwater 12.6 14.5 15.3 13.1 15.1 16.2 16.8 18.3 19.0 19.1 160.1 Footpaths and Cycleways 14.6 16.9 17.7 15.2 17.5 18.8 19.5 21.2 22.1 22.2 185.5 Bridges and Major Culverts 15.2 17.5 18.4 13.9 15.4 17.5 20.4 22.2 23.1 23.2 186.8
Walls 4.7 5.4 5.7 4.9 5.6 6.0 6.3 6.8 7.1 7.1 59.7 Traffic Systems 7.4 8.7 9.2 7.5 9.0 9.6 10.0 11.1 11.5 11.6 95.6 Street Lighting 9.1 10.4 11.0 9.4 10.8 11.6 12.1 13.1 13.7 13.7 114.9 Corridor Structures and Fixtures 2.5 2.8 3.0 2.6 3.0 3.2 3.3 3.6 3.7 3.7 31.4
Parking 2.2 2.3 2.4 2.5 2.5 2.5 2.7 2.8 2.9 2.9 25.7 Road renewals total 192.2 221.7 232.9 196.4 224.6 242.8 256.9 279.6 290.8 292.2 2,430.0 Rail Stations and Depots/ Stabling 2.2 2.5 2.6 2.3 2.6 2.8 2.9 3.1 3.3 3.3 27.5
Rolling Stock 0.5 0.5 0.5 4.1 5.6 4.4 0.0 0.0 0.0 0.0 15.7 Wharves 2.3 2.4 2.5 2.1 2.5 2.6 2.9 3.1 3.2 2.9 26.5 Bus Network 0.9 1.1 1.1 1.0 1.1 1.2 1.2 1.3 1.4 1.4 11.6 PT renewals total 5.9 6.5 6.7 9.5 11.9 10.9 7.0 7.6 7.8 7.6 81.4 Total renewals 198.0 228.2 239.6 205.8 236.5 253.7 263.9 287.2 298.6 299.8 2,511.4
Source: AT analysis of Auckland Council Long-‐Term Plan 2015–2025 (2) Further detail is included in Appendix 3
AT Asset Management Plan 2015 - 2018
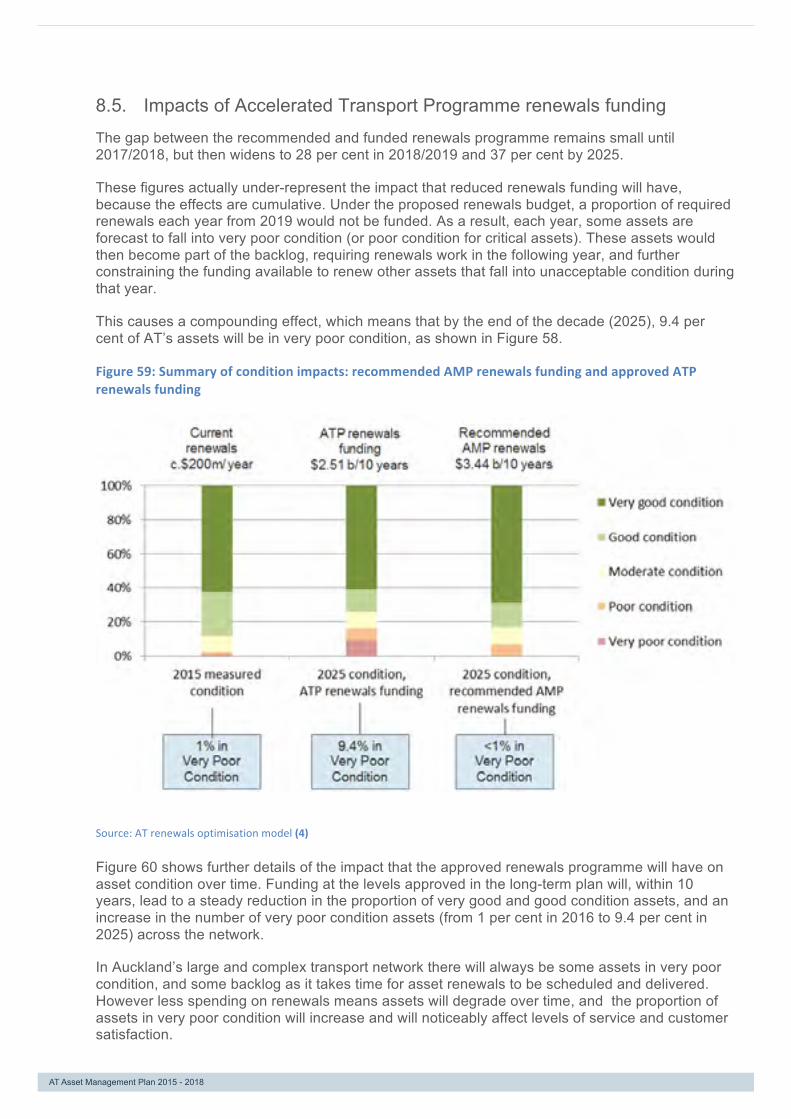
AT Asset Management Plan 2015 – 2018 Page 118 of 139
Impacts of Accelerated Transport Programme renewals funding 8.5.
The gap between the recommended and funded renewals programme remains small until 2017/2018, but then widens to 28 per cent in 2018/2019 and 37 per cent by 2025.
These figures actually under-represent the impact that reduced renewals funding will have, because the effects are cumulative. Under the proposed renewals budget, a proportion of required renewals each year from 2019 would not be funded. As a result, each year, some assets are forecast to fall into very poor condition (or poor condition for critical assets). These assets would then become part of the backlog, requiring renewals work in the following year, and further constraining the funding available to renew other assets that fall into unacceptable condition during that year.
This causes a compounding effect, which means that by the end of the decade (2025), 9.4 per cent of AT’s assets will be in very poor condition, as shown in Figure 58.
Figure 59: Summary of condition impacts: recommended AMP renewals funding and approved ATP renewals funding
Source: AT renewals optimisation model (4)
Figure 60 shows further details of the impact that the approved renewals programme will have on asset condition over time. Funding at the levels approved in the long-term plan will, within 10 years, lead to a steady reduction in the proportion of very good and good condition assets, and an increase in the number of very poor condition assets (from 1 per cent in 2016 to 9.4 per cent in 2025) across the network.
In Auckland’s large and complex transport network there will always be some assets in very poor condition, and some backlog as it takes time for asset renewals to be scheduled and delivered. However less spending on renewals means assets will degrade over time, and the proportion of assets in very poor condition will increase and will noticeably affect levels of service and customer satisfaction.
AT Asset Management Plan 2015 - 2018

AT Asset Management Plan 2015 – 2018 Page 119 of 139
Figure 60: 10-‐year renewals cost vs condition, approved ATP renewals programme
Source: AT renewals optimisation model (4)
The short-term savings from the proposed constrained renewals programme will lead to long-term increases in the overall level of backlog in the network, i.e. the proportion of assets that are in worse condition than their agreed renewal intervention point.
The backlog liability arising from the constrained funding is shown in Figure 61. Backlog liability will increase by over $800 million over the coming 10 years as renewals budgets fail to keep pace with asset deterioration. More backlog liability is created than the money saved by the constrained budgets, because provision is not made for renewals to occur at the optimal time. Figure 61: Overview of backlog liability
Source: AT renewals optimisation model (4)
$800
mill
ion
00 m
illio
n
AT Asset Management Plan 2015 - 2018
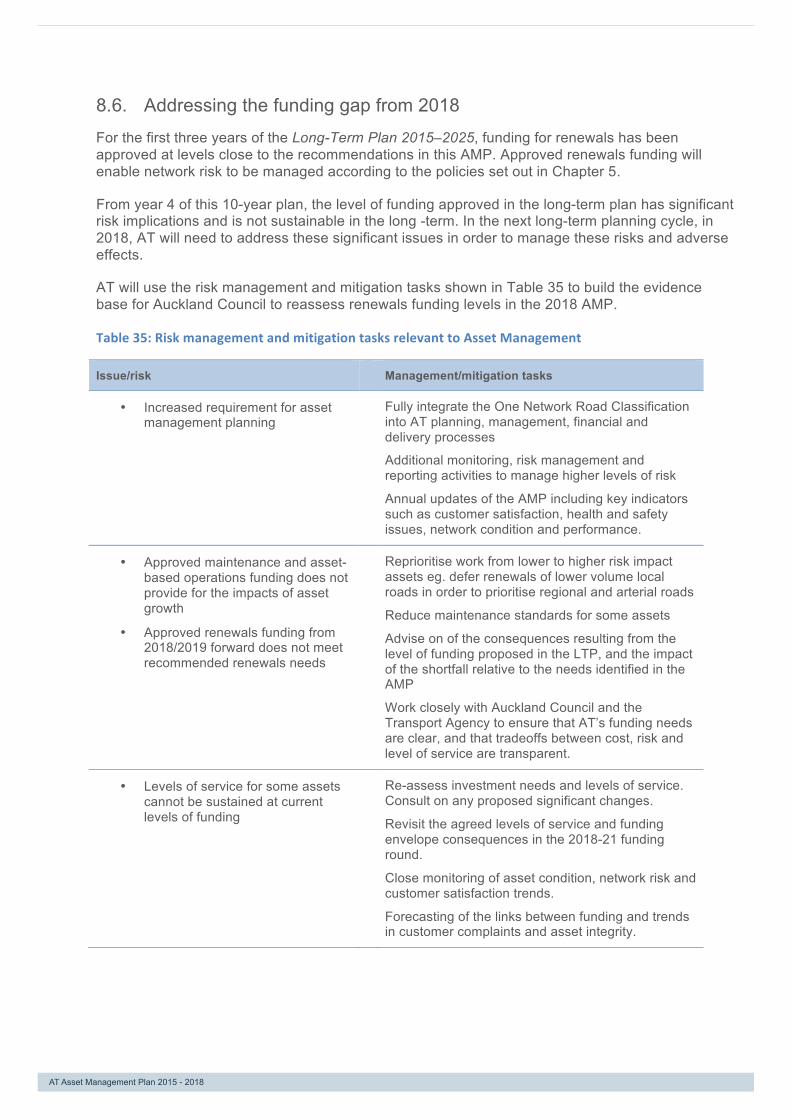
AT Asset Management Plan 2015 – 2018 Page 120 of 139
Addressing the funding gap from 2018 8.6.
For the first three years of the Long-Term Plan 2015–2025, funding for renewals has been approved at levels close to the recommendations in this AMP. Approved renewals funding will enable network risk to be managed according to the policies set out in Chapter 5.
From year 4 of this 10-year plan, the level of funding approved in the long-term plan has significant risk implications and is not sustainable in the long -term. In the next long-term planning cycle, in 2018, AT will need to address these significant issues in order to manage these risks and adverse effects.
AT will use the risk management and mitigation tasks shown in Table 35 to build the evidence base for Auckland Council to reassess renewals funding levels in the 2018 AMP.
Table 35: Risk management and mitigation tasks relevant to Asset Management
Issue/risk Management/mitigation tasks
• Increased requirement for asset management planning
Fully integrate the One Network Road Classification into AT planning, management, financial and delivery processes
Additional monitoring, risk management and reporting activities to manage higher levels of risk
Annual updates of the AMP including key indicators such as customer satisfaction, health and safety issues, network condition and performance.
• Approved maintenance and asset-based operations funding does not provide for the impacts of asset growth
• Approved renewals funding from 2018/2019 forward does not meet recommended renewals needs
Reprioritise work from lower to higher risk impact assets eg. defer renewals of lower volume local roads in order to prioritise regional and arterial roads
Reduce maintenance standards for some assets
Advise on of the consequences resulting from the level of funding proposed in the LTP, and the impact of the shortfall relative to the needs identified in the AMP
Work closely with Auckland Council and the Transport Agency to ensure that AT’s funding needs are clear, and that tradeoffs between cost, risk and level of service are transparent.
• Levels of service for some assets cannot be sustained at current levels of funding
Re-assess investment needs and levels of service. Consult on any proposed significant changes.
Revisit the agreed levels of service and funding envelope consequences in the 2018-21 funding round.
Close monitoring of asset condition, network risk and customer satisfaction trends.
Forecasting of the links between funding and trends in customer complaints and asset integrity.
AT Asset Management Plan 2015 - 2018


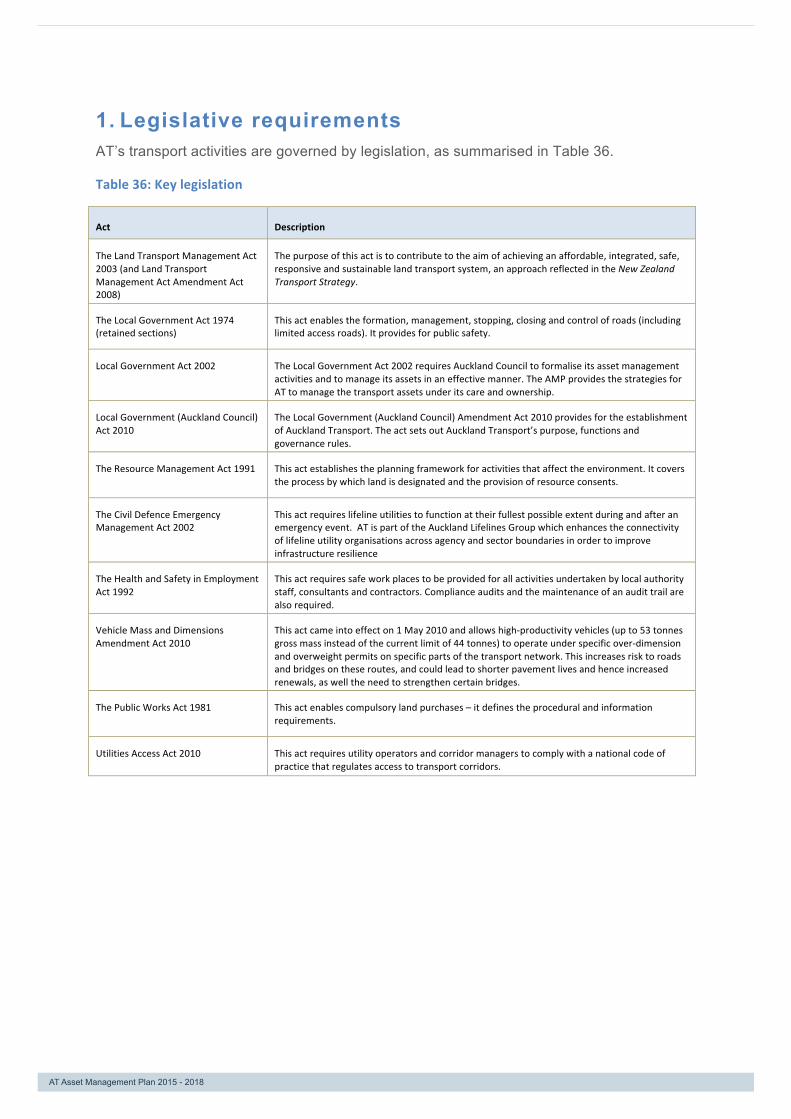
AT Asset Management Plan 2015 – 2018 Page 123 of 139
1. Legislative requirements AT’s transport activities are governed by legislation, as summarised in Table 36.
Table 36: Key legislation
Act Description
The Land Transport Management Act 2003 (and Land Transport Management Act Amendment Act 2008)
The purpose of this act is to contribute to the aim of achieving an affordable, integrated, safe, responsive and sustainable land transport system, an approach reflected in the New Zealand Transport Strategy.
The Local Government Act 1974 (retained sections)
This act enables the formation, management, stopping, closing and control of roads (including limited access roads). It provides for public safety.
Local Government Act 2002 The Local Government Act 2002 requires Auckland Council to formalise its asset management activities and to manage its assets in an effective manner. The AMP provides the strategies for AT to manage the transport assets under its care and ownership.
Local Government (Auckland Council) Act 2010
The Local Government (Auckland Council) Amendment Act 2010 provides for the establishment of Auckland Transport. The act sets out Auckland Transport’s purpose, functions and governance rules.
The Resource Management Act 1991 This act establishes the planning framework for activities that affect the environment. It covers the process by which land is designated and the provision of resource consents.
The Civil Defence Emergency Management Act 2002
This act requires lifeline utilities to function at their fullest possible extent during and after an emergency event. AT is part of the Auckland Lifelines Group which enhances the connectivity of lifeline utility organisations across agency and sector boundaries in order to improve infrastructure resilience
The Health and Safety in Employment Act 1992
This act requires safe work places to be provided for all activities undertaken by local authority staff, consultants and contractors. Compliance audits and the maintenance of an audit trail are also required.
Vehicle Mass and Dimensions Amendment Act 2010
This act came into effect on 1 May 2010 and allows high-‐productivity vehicles (up to 53 tonnes gross mass instead of the current limit of 44 tonnes) to operate under specific over-‐dimension and overweight permits on specific parts of the transport network. This increases risk to roads and bridges on these routes, and could lead to shorter pavement lives and hence increased renewals, as well the need to strengthen certain bridges.
The Public Works Act 1981 This act enables compulsory land purchases – it defines the procedural and information requirements.
Utilities Access Act 2010 This act requires utility operators and corridor managers to comply with a national code of practice that regulates access to transport corridors.
AT Asset Management Plan 2015 - 2018
AT Asset Management Plan 2015 – 2018 Page 124 of 139
2. Notes, assumptions and limitations of financial information
The following notes provide context for the financial information in this AMP. • All financial information in Chapter 7: Asset Investment Requirements is on an ‘asset needs’
basis and aligns with the Auckland Plan budget published in the Auckland Draft Regional Land Transport Plan 2015–2025 (24). This is a recommended budget, which takes into account value for money, including minimising whole-of-life costs and achieving efficiency targets. Consideration of affordability and timing of expenditure is a separate step.
• Financial information in Chapter 8:Funding and Impacts aligns with the decisions in Auckland Council’s Long-Term Plan 2015–2025 (2).
• All financial information in this AMP is sourced from AT’s SAP financial management system, which is also used for the transport financial information in the Regional Land Transport Plan (5) and in Auckland Council’s Long Term Plan (2).
• Both inflated and uninflated budgets are reported, as specified in the text. • All financial information in the AMP excludes corporate and IT support overheads, and
corporate and IT renewals. Staff time is included as a cost where it is allocated in SAP to specific outputs, but ‘cost centre’ budgets are not included.
• Harbour Master was a late transfer to AT and given the value has not been included in the AMP
• The classification of expenditure as ‘new capital’, ‘renewals’ and ‘maintenance/operations’ is as per AT’s accounting policies, as set out in its Annual Report 2013/14 (25) and aligns with the SAP financial management system.
• The classification of maintenance/operations expenditure into maintenance, operations (asset based) and operations (non asset based) is specific to AT Asset Management and details of this classification are set out in Table 28.
• Valuation information is as at 30 June 2014 and aligns with the asset management inputs to the Annual Report 2013/14 (25). Valuations exclude land, corporate assets and intangible assets, and may not align to the values published in the Annual Report 2013/14. o Road asset values are from AT infrastructure valuation as at 30 June 2014, with the
exception of parking buildings, the value of which is taken from the AT asset register, as at 30 June 2014.
o PT asset values are from the June 2014 Fair Value Assessment of AT Specialised Buildings & Infrastructure, except as listed below:
§ Valuations for trains were taken from the AT asset register. This value excludes any residual value of rolling stock that is currently surplus to AT’s requirements, and any depreciation to date on electric trains.
§ AT’s bus assets, including bus shelters and busway stations, were valued as part of the 2014 road network valuation, and are included as public transport assets in this AMP.
§ Values for AT’s integrated ticketing system (AT HOP) assets were taken from the AT asset register, as at 30 June 2014.
• Renewal unit rates have been assessed from the current maintenance contracts. • It is assumed that the capacity exists in the contracting industry, and in AT’s management of
consents, land purchase, legalisation, design, procurement and contract administration, to implement the capital new works and renewals projects and programmes that are forecasted.
• The degree of accuracy and completeness of the asset data information is as assessed in the 14 asset class management plans (26).
AT Asset Management Plan 2015 - 2018

AT Asset Management Plan 2015 – 2018 Page 125 of 139
3. Detailed financial tables
Recommended AMP renewals programme 3.1.
Recommended AMP renewals programme by ACMP, inflated
($millions, inflated) 2015/ 2016
2016/ 2017
2017/ 2018
2018/ 2019
2019/ 2020
2020/ 2021
2021/ 2022
2022/ 2023
2023/ 2024
2024/ 2025
2016-2025 total
Pavement 125.2 133.7 116.3 152.7 189.5 222.2 247.0 266.5 282.0 294.8 2030.0 Stormwater 8.7 15.6 22.8 29.4 35.1 39.8 43.8 47.2 50.2 52.7 345.3 Footpaths and Cycleways 21.0 7.8 10.5 13.2 16.0 18.9 21.7 24.7 27.6 30.5 192.0 Bridges and Major Culverts 9.7 16.7 18.4 20.0 21.3 22.5 23.5 24.5 25.3 26.0 208.1
Walls 13.1 4.2 5.4 6.5 7.5 8.3 9.0 9.7 10.2 10.7 84.6 Traffic Systems 8.2 14.8 12.5 18.5 16.9 16.6 17.4 18.1 18.4 19.0 160.4 Street Lighting 6.7 26.6 25.6 17.1 15.7 17.5 16.9 16.4 15.8 15.5 173.7 Corridor Structures and Fixtures 3.1 1.9 6.1 8.7 9.5 9.2 8.4 7.6 6.9 6.6 68.1
Parking 2.5 2.0 3.2 3.7 4.2 5.1 5.1 5.5 5.8 6.0 43.1 Road renewals needs total 198.2 223.3 220.9 269.9 315.7 360.0 393.0 420.2 442.2 461.8 3305.3
Rail Stations and Depots/ Stabling 2.1 1.9 7.4 6.8 7.2 8.1 9.3 10.4 11.3 12.1 76.6
Wharves 4.1 4.5 4.3 4.4 3.2 3.1 3.0 2.9 2.8 2.7 35.0 Bus Network 0.9 2.8 3.2 3.0 2.6 2.4 2.3 2.3 2.5 2.6 24.6 PT asset renewals needs total 7.0 9.2 15.0 14.2 13.1 13.6 14.6 15.7 16.6 17.4 136.2
Total renewals 205.2 232.4 235.9 284.1 328.8 373.7 407.6 435.9 458.8 479.2 3441.5
Recommended AMP renewals programme by ACMP, uninflated
($millions, uninflated) 2015/ 2016
2016/ 2017
2017/ 2018
2018/ 2019
2019/ 2020
2020/ 2021
2021/ 2022
2022/ 2023
2023/ 2024
2024/ 2025
2016-2025 total
Pavement 122.0 126.9 107.4 137.0 165.1 187.8 202.2 211.0 215.9 218.3 1693.6 Stormwater 8.5 14.8 21.1 26.4 30.5 33.6 35.8 37.4 38.4 39.1 285.6 Footpaths and Cycleways 20.5 7.4 9.7 11.9 14.0 15.9 17.8 19.5 21.1 22.6 160.4
Bridges and Major Culverts 9.5 15.9 17.0 17.9 18.6 19.0 19.3 19.4 19.4 19.3 175.2
Walls 12.7 3.9 5.0 5.8 6.5 7.0 7.4 7.7 7.8 7.9 71.9 Traffic Systems 8.0 14.0 11.6 16.6 14.7 14.0 14.3 14.4 14.1 14.1 135.7 Street Lighting 6.5 25.3 23.6 15.3 13.7 14.8 13.8 13.0 12.1 11.5 149.6 Corridor Structures and Fixtures 3.0 1.8 5.6 7.8 8.3 7.8 6.9 6.0 5.3 4.9 57.4
Parking 2.5 1.9 3.0 3.3 3.7 4.3 4.2 4.4 4.4 4.4 36.0 Road renewals needs total 193.2 211.9 204.0 242.1 275.0 304.2 321.7 332.7 338.6 342.0 2765.4
Rail Stations and Depots/ Stabling 2.0 1.8 6.9 6.1 6.2 6.9 7.6 8.3 8.7 8.9 63.4
Wharves 4.0 4.2 4.0 4.0 2.8 2.7 2.5 2.3 2.1 2.0 30.5 Bus Network 0.8 2.7 3.0 2.7 2.3 2.0 1.9 1.8 1.9 1.9 21.0 PT asset renewals needs total 6.8 8.7 13.8 12.8 11.4 11.5 12.0 12.4 12.7 12.9 114.9
Total renewals 200.0 220.6 217.8 254.9 286.4 315.7 333.7 345.1 351.3 354.8 2880.2
AT Asset Management Plan 2015 - 2018
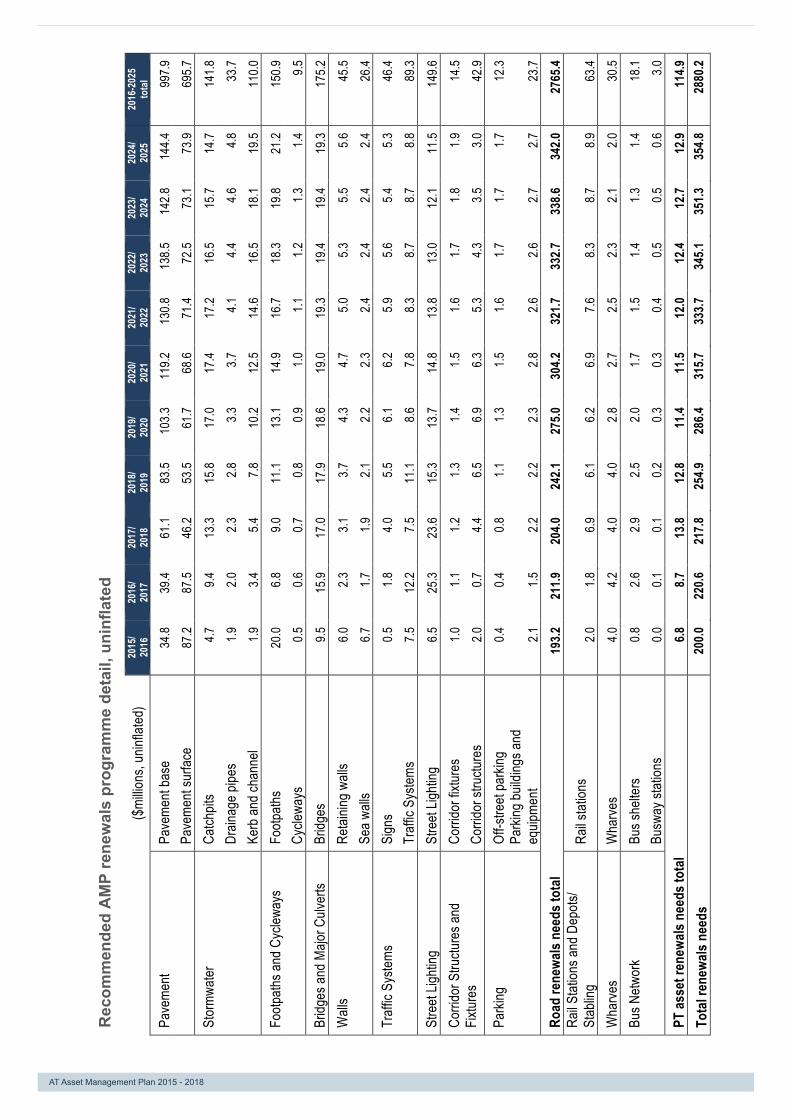
AT
Ass
et M
anag
emen
t Pla
n 20
15 –
201
8 P
age
126
of 1
39
Rec
omm
ende
d A
MP
rene
wal
s pr
ogra
mm
e de
tail,
uni
nfla
ted
($
millio
ns, u
ninfla
ted)
20
15/
2016
20
16/
2017
20
17/
2018
20
18/
2019
20
19/
2020
20
20/
2021
20
21/
2022
20
22/
2023
20
23/
2024
20
24/
2025
20
16-2
025
tota
l
Pave
ment
Pa
veme
nt ba
se
34.8
39.4
61.1
83.5
103.3
11
9.2
130.8
13
8.5
142.8
14
4.4
997.9
Pave
ment
surfa
ce
87.2
87.5
46.2
53.5
61.7
68.6
71.4
72.5
73.1
73.9
695.7
St
ormw
ater
Catch
pits
4.7
9.4
13.3
15.8
17.0
17.4
17.2
16.5
15.7
14.7
141.8
Drain
age
pipes
1.9
2.0
2.3
2.8
3.3
3.7
4.1
4.4
4.6
4.8
33
.7
Kerb
and c
hann
el 1.9
3.4
5.4
7.8
10
.2 12
.5 14
.6 16
.5 18
.1 19
.5 11
0.0
Footp
aths a
nd C
yclew
ays
Footp
aths
20.0
6.8
9.0
11.1
13.1
14.9
16.7
18.3
19.8
21.2
150.9
Cycle
ways
0.5
0.6
0.7
0.8
0.9
1.0
1.1
1.2
1.3
1.4
9.5
Br
idges
and M
ajor C
ulver
ts Br
idges
9.5
15
.9 17
.0 17
.9 18
.6 19
.0 19
.3 19
.4 19
.4 19
.3 17
5.2
Wall
s Re
taini
ng w
alls
6.0
2.3
3.1
3.7
4.3
4.7
5.0
5.3
5.5
5.6
45.5
Se
a wall
s 6.7
1.7
1.9
2.1
2.2
2.3
2.4
2.4
2.4
2.4
26
.4 Tr
affic
Syste
ms
Sign
s 0.5
1.8
4.0
5.5
6.1
6.2
5.9
5.6
5.4
5.3
46
.4
Traff
ic Sy
stems
7.5
12
.2 7.5
11
.1 8.6
7.8
8.3
8.7
8.7
8.8
89
.3 St
reet
Lighti
ng
Stre
et Lig
hting
6.5
25
.3 23
.6 15
.3 13
.7 14
.8 13
.8 13
.0 12
.1 11
.5 14
9.6
Corri
dor S
tructu
res a
nd
Fixtur
es
Corri
dor f
ixtur
es
1.0
1.1
1.2
1.3
1.4
1.5
1.6
1.7
1.8
1.9
14.5
Corri
dor s
tructu
res
2.0
0.7
4.4
6.5
6.9
6.3
5.3
4.3
3.5
3.0
42.9
Parki
ng
Off-s
treet
par
king
0.4
0.4
0.8
1.1
1.3
1.5
1.6
1.7
1.7
1.7
12.3
Pa
rking
build
ings a
nd
equip
ment
2.1
1.5
2.2
2.2
2.3
2.8
2.6
2.6
2.7
2.7
23
.7 Ro
ad re
newa
ls ne
eds t
otal
19
3.2
211.9
20
4.0
242.1
27
5.0
304.2
32
1.7
332.7
33
8.6
342.0
27
65.4
Rail S
tatio
ns a
nd D
epot
s/ St
ablin
g Ra
il sta
tions
2.0
1.8
6.9
6.1
6.2
6.9
7.6
8.3
8.7
8.9
63
.4 W
harve
s W
harve
s 4.0
4.2
4.0
4.0
2.8
2.7
2.5
2.3
2.1
2.0
30
.5 Bu
s Netw
ork
Bus s
helte
rs
0.8
2.6
2.9
2.5
2.0
1.7
1.5
1.4
1.3
1.4
18.1
Bu
sway
stati
ons
0.0
0.1
0.1
0.2
0.3
0.3
0.4
0.5
0.5
0.6
3.0
PT as
set r
enew
als n
eeds
tota
l 6.8
8.7
13
.8 12
.8 11
.4 11
.5 12
.0 12
.4 12
.7 12
.9 11
4.9
Tota
l ren
ewals
nee
ds
200.0
22
0.6
217.8
25
4.9
286.4
31
5.7
333.7
34
5.1
351.3
35
4.8
2880
.2
AT Asset Management Plan 2015 - 2018
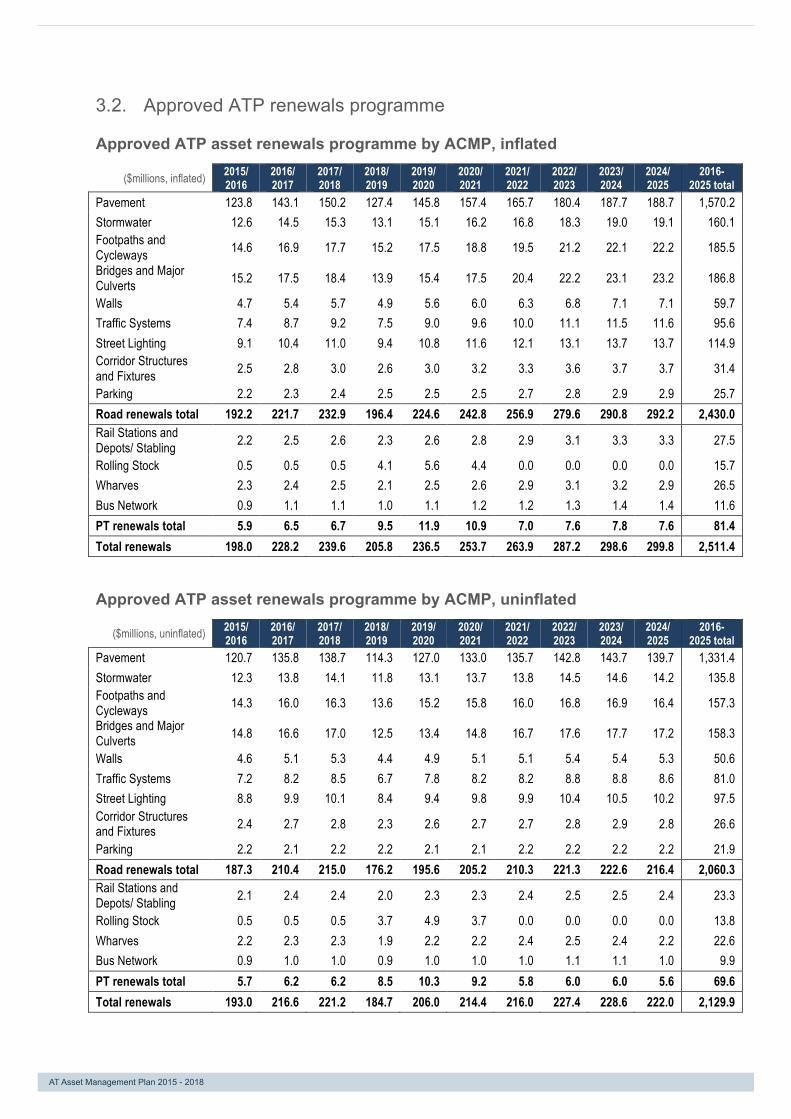
AT Asset Management Plan 2015 – 2018 Page 127 of 139
Approved ATP renewals programme 3.2.
Approved ATP asset renewals programme by ACMP, inflated
($millions, inflated) 2015/ 2016
2016/ 2017
2017/ 2018
2018/ 2019
2019/ 2020
2020/ 2021
2021/ 2022
2022/ 2023
2023/ 2024
2024/ 2025
2016-2025 total
Pavement 123.8 143.1 150.2 127.4 145.8 157.4 165.7 180.4 187.7 188.7 1,570.2 Stormwater 12.6 14.5 15.3 13.1 15.1 16.2 16.8 18.3 19.0 19.1 160.1 Footpaths and Cycleways 14.6 16.9 17.7 15.2 17.5 18.8 19.5 21.2 22.1 22.2 185.5
Bridges and Major Culverts 15.2 17.5 18.4 13.9 15.4 17.5 20.4 22.2 23.1 23.2 186.8
Walls 4.7 5.4 5.7 4.9 5.6 6.0 6.3 6.8 7.1 7.1 59.7 Traffic Systems 7.4 8.7 9.2 7.5 9.0 9.6 10.0 11.1 11.5 11.6 95.6 Street Lighting 9.1 10.4 11.0 9.4 10.8 11.6 12.1 13.1 13.7 13.7 114.9 Corridor Structures and Fixtures 2.5 2.8 3.0 2.6 3.0 3.2 3.3 3.6 3.7 3.7 31.4
Parking 2.2 2.3 2.4 2.5 2.5 2.5 2.7 2.8 2.9 2.9 25.7 Road renewals total 192.2 221.7 232.9 196.4 224.6 242.8 256.9 279.6 290.8 292.2 2,430.0 Rail Stations and Depots/ Stabling 2.2 2.5 2.6 2.3 2.6 2.8 2.9 3.1 3.3 3.3 27.5
Rolling Stock 0.5 0.5 0.5 4.1 5.6 4.4 0.0 0.0 0.0 0.0 15.7 Wharves 2.3 2.4 2.5 2.1 2.5 2.6 2.9 3.1 3.2 2.9 26.5 Bus Network 0.9 1.1 1.1 1.0 1.1 1.2 1.2 1.3 1.4 1.4 11.6 PT renewals total 5.9 6.5 6.7 9.5 11.9 10.9 7.0 7.6 7.8 7.6 81.4 Total renewals 198.0 228.2 239.6 205.8 236.5 253.7 263.9 287.2 298.6 299.8 2,511.4
Approved ATP asset renewals programme by ACMP, uninflated
($millions, uninflated) 2015/ 2016
2016/ 2017
2017/ 2018
2018/ 2019
2019/ 2020
2020/ 2021
2021/ 2022
2022/ 2023
2023/ 2024
2024/ 2025
2016-2025 total
Pavement 120.7 135.8 138.7 114.3 127.0 133.0 135.7 142.8 143.7 139.7 1,331.4 Stormwater 12.3 13.8 14.1 11.8 13.1 13.7 13.8 14.5 14.6 14.2 135.8 Footpaths and Cycleways 14.3 16.0 16.3 13.6 15.2 15.8 16.0 16.8 16.9 16.4 157.3 Bridges and Major Culverts 14.8 16.6 17.0 12.5 13.4 14.8 16.7 17.6 17.7 17.2 158.3
Walls 4.6 5.1 5.3 4.4 4.9 5.1 5.1 5.4 5.4 5.3 50.6 Traffic Systems 7.2 8.2 8.5 6.7 7.8 8.2 8.2 8.8 8.8 8.6 81.0 Street Lighting 8.8 9.9 10.1 8.4 9.4 9.8 9.9 10.4 10.5 10.2 97.5 Corridor Structures and Fixtures 2.4 2.7 2.8 2.3 2.6 2.7 2.7 2.8 2.9 2.8 26.6
Parking 2.2 2.1 2.2 2.2 2.1 2.1 2.2 2.2 2.2 2.2 21.9 Road renewals total 187.3 210.4 215.0 176.2 195.6 205.2 210.3 221.3 222.6 216.4 2,060.3 Rail Stations and Depots/ Stabling 2.1 2.4 2.4 2.0 2.3 2.3 2.4 2.5 2.5 2.4 23.3
Rolling Stock 0.5 0.5 0.5 3.7 4.9 3.7 0.0 0.0 0.0 0.0 13.8 Wharves 2.2 2.3 2.3 1.9 2.2 2.2 2.4 2.5 2.4 2.2 22.6 Bus Network 0.9 1.0 1.0 0.9 1.0 1.0 1.0 1.1 1.1 1.0 9.9 PT renewals total 5.7 6.2 6.2 8.5 10.3 9.2 5.8 6.0 6.0 5.6 69.6 Total renewals 193.0 216.6 221.2 184.7 206.0 214.4 216.0 227.4 228.6 222.0 2,129.9
AT Asset Management Plan 2015 - 2018
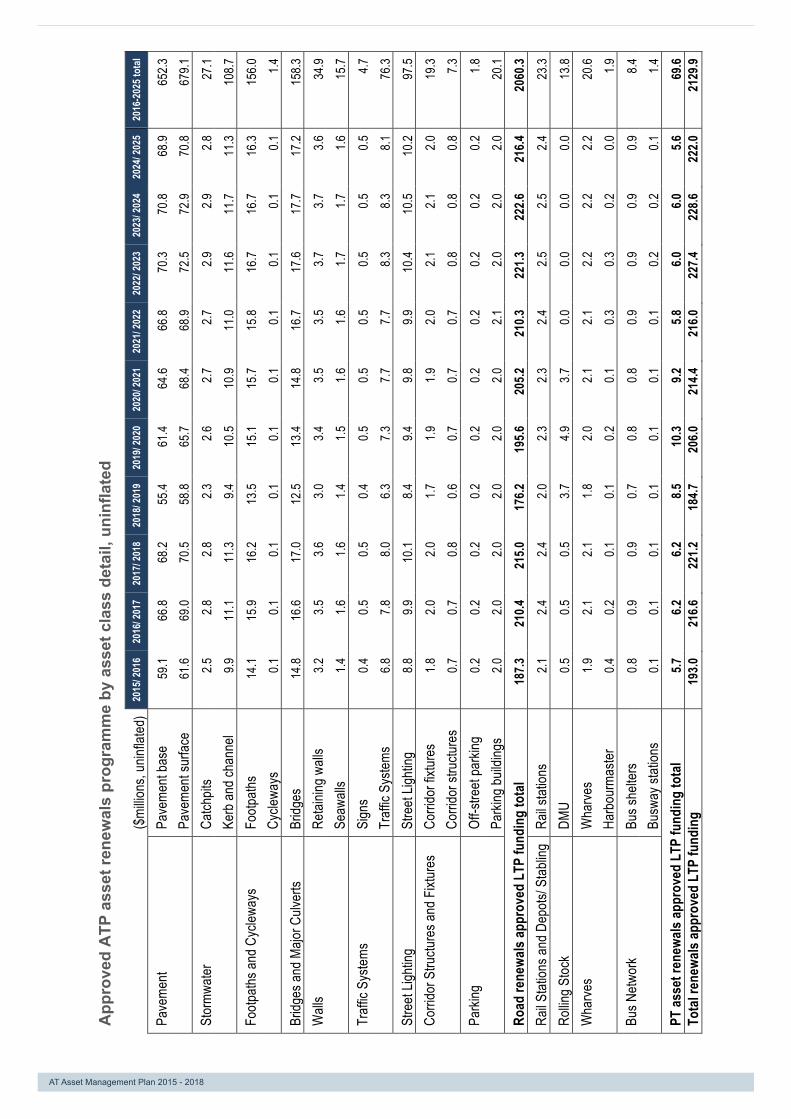
AT
Ass
et M
anag
emen
t Pla
n 20
15 –
201
8 P
age
128
of 1
39
App
rove
d A
TP a
sset
rene
wal
s pr
ogra
mm
e by
ass
et c
lass
det
ail,
unin
flate
d
($
millio
ns, u
ninfla
ted)
20
15/ 2
016
2016
/ 201
7 20
17/ 2
018
2018
/ 201
9 20
19/ 2
020
2020
/ 202
1 20
21/ 2
022
2022
/ 202
3 20
23/ 2
024
2024
/ 202
5 20
16-2
025 t
otal
Pave
ment
Pa
veme
nt ba
se
59.1
66.8
68.2
55.4
61.4
64.6
66.8
70.3
70.8
68.9
652.3
Pave
ment
surfa
ce
61.6
69.0
70.5
58.8
65.7
68.4
68.9
72.5
72.9
70.8
679.1
St
ormw
ater
Catch
pits
2.5
2.8
2.8
2.3
2.6
2.7
2.7
2.9
2.9
2.8
27.1
Ke
rb an
d cha
nnel
9.9
11.1
11.3
9.4
10.5
10.9
11.0
11.6
11.7
11.3
108.7
Fo
otpath
s and
Cyc
leway
s Fo
otpath
s 14
.1 15
.9 16
.2 13
.5 15
.1 15
.7 15
.8 16
.7 16
.7 16
.3 15
6.0
Cy
clewa
ys
0.1
0.1
0.1
0.1
0.1
0.1
0.1
0.1
0.1
0.1
1.4
Bridg
es an
d Majo
r Culv
erts
Bridg
es
14.8
16.6
17.0
12.5
13.4
14.8
16.7
17.6
17.7
17.2
158.3
W
alls
Reta
ining
wall
s 3.2
3.5
3.6
3.0
3.4
3.5
3.5
3.7
3.7
3.6
34
.9
Seaw
alls
1.4
1.6
1.6
1.4
1.5
1.6
1.6
1.7
1.7
1.6
15.7
Traff
ic Sy
stems
Si
gns
0.4
0.5
0.5
0.4
0.5
0.5
0.5
0.5
0.5
0.5
4.7
Tr
affic
Syste
ms
6.8
7.8
8.0
6.3
7.3
7.7
7.7
8.3
8.3
8.1
76.3
Stre
et Lig
hting
St
reet
Lighti
ng
8.8
9.9
10.1
8.4
9.4
9.8
9.9
10.4
10.5
10.2
97.5
Corri
dor S
tructu
res a
nd F
ixtur
es
Corri
dor f
ixtur
es
1.8
2.0
2.0
1.7
1.9
1.9
2.0
2.1
2.1
2.0
19.3
Co
rrido
r stru
cture
s 0.7
0.7
0.8
0.6
0.7
0.7
0.7
0.8
0.8
0.8
7.3
Pa
rking
Of
f-stre
et p
arkin
g 0.2
0.2
0.2
0.2
0.2
0.2
0.2
0.2
0.2
0.2
1.8
Parki
ng bu
ilding
s 2.0
2.0
2.0
2.0
2.0
2.0
2.1
2.0
2.0
2.0
20
.1 Ro
ad re
newa
ls ap
prov
ed L
TP fu
ndin
g to
tal
187.3
21
0.4
215.0
17
6.2
195.6
20
5.2
210.3
22
1.3
222.6
21
6.4
2060
.3 Ra
il Sta
tions
and
Dep
ots/
Stab
ling
Rail s
tatio
ns
2.1
2.4
2.4
2.0
2.3
2.3
2.4
2.5
2.5
2.4
23.3
Rollin
g St
ock
DMU
0.5
0.5
0.5
3.7
4.9
3.7
0.0
0.0
0.0
0.0
13.8
Wha
rves
Wha
rves
1.9
2.1
2.1
1.8
2.0
2.1
2.1
2.2
2.2
2.2
20.6
Ha
rbou
rmas
ter
0.4
0.2
0.1
0.1
0.2
0.1
0.3
0.3
0.2
0.0
1.9
Bus N
etwor
k Bu
s she
lters
0.8
0.9
0.9
0.7
0.8
0.8
0.9
0.9
0.9
0.9
8.4
Busw
ay st
ation
s 0.1
0.1
0.1
0.1
0.1
0.1
0.1
0.2
0.2
0.1
1.4
PT
asse
t ren
ewals
appr
oved
LTP
fund
ing
tota
l 5.7
6.2
6.2
8.5
10
.3 9.2
5.8
6.0
6.0
5.6
69
.6 To
tal r
enew
als ap
prov
ed L
TP fu
ndin
g 19
3.0
216.6
22
1.2
184.7
20
6.0
214.4
21
6.0
227.4
22
8.6
222.0
21
29.9
AT Asset Management Plan 2015 - 2018

AT
Ass
et M
anag
emen
t Pla
n 20
15 –
201
8 P
age
129
of 1
39
App
rove
d A
TP a
sset
rene
wal
s pr
ogra
mm
e by
NZT
A w
ork
cate
gory
, inf
late
d
NZTA
Wor
k Cat
egor
y As
set C
lass
2015
/ 201
6 20
16/
2017
20
17/
2018
20
18/
2019
20
19/
2020
20
20/
2021
20
21/
2022
20
22/
2023
20
23/
2024
20
24/
2025
20
16-2
025
tota
l
211
Unse
aled
road
met
alling
(in
clude
d be
low w
ith se
aled
pave
ment
reha
b)
21
2 Se
aled r
oad r
esur
facing
Pa
veme
nt
63.2
72.8
76.4
65.6
75.4
80
.9
84.1
91
.6
95.2
95
.6
800.
7 21
3 Dr
ainag
e re
newa
ls St
ormw
ater
12.6
14.5
15.3
13.1
15.1
16
.2
16.8
18
.3
19.0
19
.1
160.
1 21
4 Se
aled r
oad p
avem
ent r
ehab
Pa
veme
nt
60.7
70.3
73.9
61.8
70.5
76
.5
81.6
88
.8
92.4
93
.1
769.
4
215
St
ructu
res c
ompo
nent
repla
ceme
nts
Bridg
es an
d Majo
r Culv
erts
15.2
17.5
18.4
13.9
15.4
17
.5
20.4
22
.2
23.1
23
.2
186.
8 Co
rrido
r Stru
cture
s and
Fix
tures
0.
5 0.
6 0.
6 0.
5 0.
6 0.
7 0.
7 0.
7 0.
8 0.
8 6.
4 22
2 Tr
affic
servi
ces r
enew
als
Stre
et Lig
hting
9.
1 10
.4 11
.0 9.
4 10
.8
11.6
12
.1
13.1
13
.7
13.7
11
4.9
Traff
ic Sy
stems
7.
3 8.
7 9.
2 7.
5 8.
9 9.
6 10
.0
11.1
11
.5
11.5
95
.4
124
Cycle
ways
Fo
otpath
s and
Cyc
leway
s 0.
1 0.
1 0.
2 0.
1 0.
2 0.
2 0.
2 0.
2 0.
2 0.
2 1.
6
Subs
idisa
ble R
oad
Rene
wals
Tota
l 16
8.7
195.0
20
4.9
171.9
19
6.8
213.2
22
5.9
246.0
25
5.9
257.2
21
35.5
n/a
Footp
aths
Footp
aths a
nd C
yclew
ays
14.5
16.7
17.5
15.1
17.3
18
.6
19.3
21
.0
21.9
22
.0
183.
9 n/
a Pa
rking
Pa
rking
2.
2 2.
3 2.
4 2.
5 2.
5 2.
5 2.
7 2.
8 2.
9 2.
9 25
.7
n/a
Corri
dor f
ixtur
es
Corri
dor S
tructu
res a
nd F
ixtur
es
2.0
2.3
2.4
2.0
2.3
2.5
2.6
2.9
3.0
3.0
24.9
n/
a W
alls
Wall
s 4.
7 5.
4 5.
7 4.
9 5.
6 6.
0 6.
3 6.
8 7.
1 7.
1 59
.7
n/a
Traf
fic sy
stems
Tr
affic
Syste
ms
0.02
0.02
0.02
0.02
0.02
0.
02
0.02
0.
02
0.02
0.
02
0.2
No
n su
bsid
isabl
e Roa
d Re
newa
ls To
tal
23.4
26.7
28.0
24.5
27.8
29.7
31.0
33.5
34.9
35.0
294.4
Road
Ren
ewals
Tot
al
192.2
22
1.7
232.9
19
6.4
224.6
24
2.8
256.9
27
9.6
290.8
29
2.2
2430
.0
514
PT fa
cilitie
s main
tenan
ce an
d ope
ratio
ns
Rail S
tatio
ns an
d De
pots/
Sta
bling
2.
2 2.
5 2.
6 2.
3 2.
6 2.
8 2.
9 3.
1 3.
3 3.
3 27
.5
514
PT fa
cilitie
s main
tenan
ce an
d ope
ratio
ns
Wha
rves
1.9
2.2
2.3
2.0
2.3
2.5
2.6
2.8
2.9
2.9
24.3
51
4 PT
facil
ities m
ainten
ance
and o
pera
tions
Bu
s Netw
ork
0.9
1.1
1.1
1.0
1.1
1.2
1.2
1.3
1.4
1.4
11.6
51
5 Ra
il pas
seng
er se
rvice
s Ro
lling
Stoc
k 0.
5 0.
5 0.
5 4.
1 5.
6 4.
4 0.
0 0.
0 0.
0 0.
0 15
.7
Su
bsid
isabl
e Pub
lic T
rans
port
Rene
wals
Tota
l 5.5
6.3
6.6
9.3
11
.6 10
.8 6.7
7.3
7.5
7.6
79
.2 n/
a Ha
rbou
rmas
ter
Wha
rves
0.4
0.2
0.1
0.1
0.3
0.1
0.4
0.4
0.3
0.0
2.2
Re
newa
ls To
tal
19
8.0
228.2
23
9.6
205.8
23
6.5
253.7
26
3.9
287.2
29
8.6
299.8
25
11.4
AT Asset Management Plan 2015 - 2018
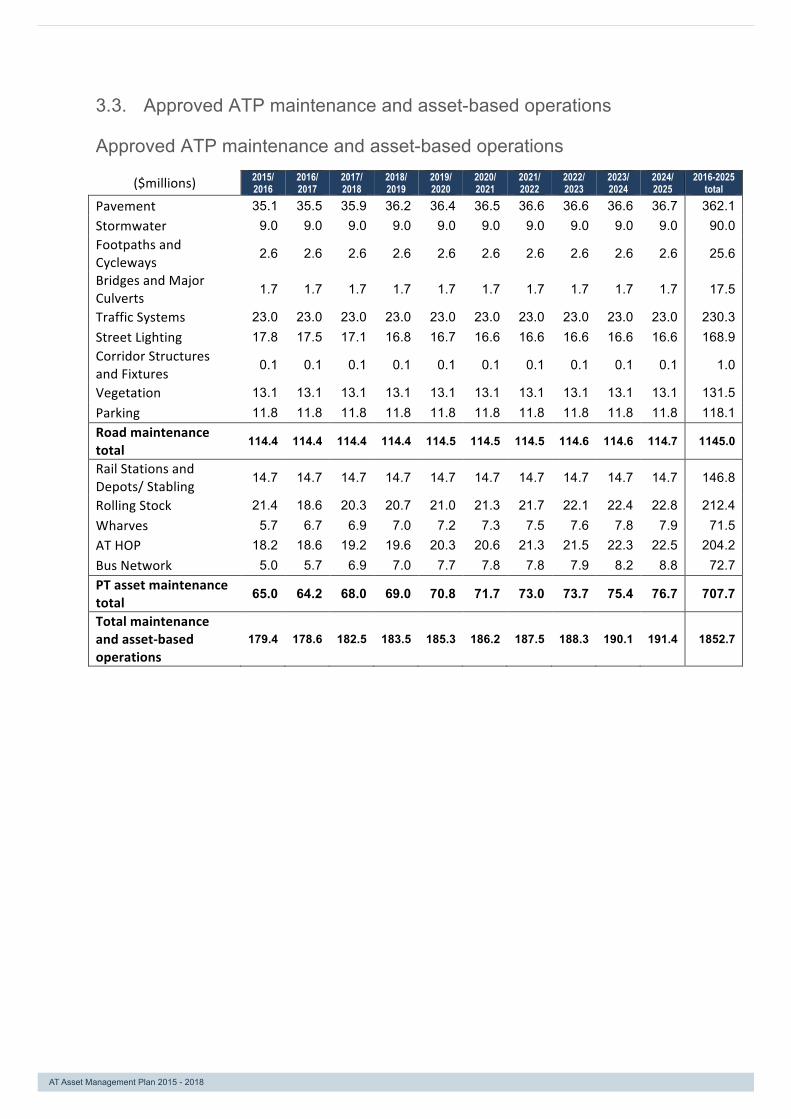
AT Asset Management Plan 2015 – 2018 Page 130 of 139
Approved ATP maintenance and asset-based operations 3.3.
Approved ATP maintenance and asset-based operations
($millions) 2015/ 2016
2016/ 2017
2017/ 2018
2018/ 2019
2019/ 2020
2020/ 2021
2021/ 2022
2022/ 2023
2023/ 2024
2024/ 2025
2016-2025 total
Pavement 35.1 35.5 35.9 36.2 36.4 36.5 36.6 36.6 36.6 36.7 362.1 Stormwater 9.0 9.0 9.0 9.0 9.0 9.0 9.0 9.0 9.0 9.0 90.0 Footpaths and Cycleways
2.6 2.6 2.6 2.6 2.6 2.6 2.6 2.6 2.6 2.6 25.6
Bridges and Major Culverts
1.7 1.7 1.7 1.7 1.7 1.7 1.7 1.7 1.7 1.7 17.5
Traffic Systems 23.0 23.0 23.0 23.0 23.0 23.0 23.0 23.0 23.0 23.0 230.3 Street Lighting 17.8 17.5 17.1 16.8 16.7 16.6 16.6 16.6 16.6 16.6 168.9 Corridor Structures and Fixtures
0.1 0.1 0.1 0.1 0.1 0.1 0.1 0.1 0.1 0.1 1.0
Vegetation 13.1 13.1 13.1 13.1 13.1 13.1 13.1 13.1 13.1 13.1 131.5 Parking 11.8 11.8 11.8 11.8 11.8 11.8 11.8 11.8 11.8 11.8 118.1 Road maintenance total
114.4 114.4 114.4 114.4 114.5 114.5 114.5 114.6 114.6 114.7 1145.0
Rail Stations and Depots/ Stabling
14.7 14.7 14.7 14.7 14.7 14.7 14.7 14.7 14.7 14.7 146.8
Rolling Stock 21.4 18.6 20.3 20.7 21.0 21.3 21.7 22.1 22.4 22.8 212.4 Wharves 5.7 6.7 6.9 7.0 7.2 7.3 7.5 7.6 7.8 7.9 71.5 AT HOP 18.2 18.6 19.2 19.6 20.3 20.6 21.3 21.5 22.3 22.5 204.2 Bus Network 5.0 5.7 6.9 7.0 7.7 7.8 7.8 7.9 8.2 8.8 72.7 PT asset maintenance total
65.0 64.2 68.0 69.0 70.8 71.7 73.0 73.7 75.4 76.7 707.7
Total maintenance and asset-‐based operations
179.4 178.6 182.5 183.5 185.3 186.2 187.5 188.3 190.1 191.4 1852.7
AT Asset Management Plan 2015 - 2018

AT
Ass
et M
anag
emen
t Pla
n 20
15 –
201
8 P
age
131
of 1
39
App
rove
d A
TP m
aint
enan
ce a
nd a
sset
-bas
ed o
pera
tions
det
ail
ACMP
Ex
pend
iture
ca
tego
ry
Main
activ
ity
2015
/ 20
16
2016
/ 20
17
2017
/ 20
18
2018
/ 20
19
2019
/ 20
20
2020
/ 20
21
2021
/ 20
22
2022
/ 20
23
2023
/ 20
24
2024
/ 20
25
2016
-202
5 to
tal
Pave
ment
Maint
enan
ce
Pave
ment
maint
enan
ce
31.3
31.6
32.1
32.3
32.5
32.7
32.7
32.7
32.8
32.8
323.4
Op
erati
ons (
Asse
t ba
sed)
Ne
twor
k and
asse
t ma
nage
ment
3.9
3.9
3.9
3.9
3.9
3.9
3.9
3.9
3.9
3.9
38
.7
Stor
mwate
r Ma
inten
ance
Ro
utine
drain
age
maint
enan
ce
9.0
9.0
9.0
9.0
9.0
9.0
9.0
9.0
9.0
9.0
90.0
Footp
aths a
nd
Cycle
ways
Ma
inten
ance
Fo
otpath
s and
cycle
way
maint
enan
ce
2.6
2.6
2.6
2.6
2.6
2.6
2.6
2.6
2.6
2.6
25.6
Bridg
es an
d Majo
r Cu
lverts
Ma
inten
ance
Br
idge m
ainten
ance
1.7
1.7
1.7
1.7
1.7
1.7
1.7
1.7
1.7
1.7
17
.5 Tr
affic
Syste
ms
Maint
enan
ce
Traff
ic sy
stems
main
tenan
ce
16.8
16.8
16.8
16.8
16.8
16.8
16.8
16.8
16.8
16.8
168.4
Op
erati
ons (
Asse
t ba
sed)
Op
erati
onal
traffic
ma
nage
ment
6.2
6.2
6.2
6.2
6.2
6.2
6.2
6.2
6.2
6.2
61
.9 St
reet
Lighti
ng
Maint
enan
ce
Maint
enan
ce of
stre
etligh
ts 4.2
4.2
4.2
4.2
4.2
4.2
4.2
4.2
4.2
4.2
41
.5
Op
erati
ons (
Asse
t ba
sed)
El
ectric
ity co
sts fo
r stre
etligh
ts 13
.7 13
.4 13
.0 12
.7 12
.6 12
.4 12
.4 12
.4 12
.4 12
.4 12
7.4
Corri
dor S
tructu
res
and F
ixtur
es
Maint
enan
ce
Corri
dor s
tructu
res a
nd
fixtur
es m
ainten
ance
0.1
0.1
0.1
0.1
0.1
0.1
0.1
0.1
0.1
0.1
1.0
Ve
getat
ion
Maint
enan
ce
13
.1 13
.1 13
.1 13
.1 13
.1 13
.1 13
.1 13
.1 13
.1 13
.1 13
1.5
Parki
ng
Maint
enan
ce
Parki
ng bu
ilding
s, off
stree
t pa
rking
9.3
9.3
9.3
9.3
9.3
9.3
9.3
9.3
9.3
9.3
92
.7
Op
erati
ons (
Asse
t ba
sed)
Pa
y & D
isplay
2.5
2.5
2.5
2.5
2.5
2.5
2.5
2.5
2.5
2.5
25
.4
Op
erati
ons (
Non
asse
t bas
ed)
Enfor
ceme
nt 5.6
5.6
5.6
5.6
5.6
5.6
5.6
5.6
5.6
5.6
56
.1 Ro
ads a
nd fo
otpath
s ge
nera
lly
Oper
ation
s (No
n as
set b
ased
) Al
l non
-ass
et ro
ad ac
tivitie
s 19
.4 19
.4 19
.4 19
.4 19
.4 19
.4 19
.4 19
.4 19
.4 19
.4 19
3.9
Road
main
tena
nce a
nd as
set-b
ased
ope
ratio
ns to
tal.
114.4
11
4.4
114.4
11
4.4
114.5
11
4.5
114.5
11
4.6
114.6
11
4.7
1145
.0 Sh
aded
(non
-ass
et) i
tem
s exc
lude
d fro
m to
tal
AT Asset Management Plan 2015 - 2018

AT
Ass
et M
anag
emen
t Pla
n 20
15 –
201
8 P
age
132
of 1
39
ACMP
Ex
pend
iture
cate
gory
Ma
in ac
tivity
20
15/
2016
20
16/
2017
20
17/
2018
20
18/
2019
20
19/
2020
20
20/
2021
20
21/
2022
20
22/
2023
20
23/
2024
20
24/
2025
2016
-20
25
tota
l Ra
il Stat
ions a
nd D
epots
/ St
ablin
g Ma
inten
ance
Ra
il stat
ion an
d dep
ot ma
inten
ance
4.4
4.4
4.4
4.4
4.4
4.4
4.4
4.4
4.4
4.4
43
.8
Oper
ation
s (As
set b
ased
) Ra
il stat
ion op
erati
ons
10.3
10.3
10.3
10.3
10.3
10.3
10.3
10.3
10.3
10.3
103.0
Op
erati
ons (
Non a
sset
base
d)
Rail s
ervic
es, c
once
ssion
ary f
ares
, trac
k ac
cess
10
0. 2 10
4. 2 10
6. 3 10
9. 9 11
2. 6 12
2. 4 13
4. 2 13
3. 0 14
3. 8 17
0. 7 12
37. 2
Rollin
g Stoc
k Ma
inten
ance
Ma
inten
ance
of di
esel
and e
lectric
train
s 14
.6 11
.3 12
.2 12
.4 12
.5 12
.7 12
.9 13
.1 13
.3 13
.5 12
8.6
Op
erati
ons (
Asse
t bas
ed)
Fuel
and o
ther c
osts
for di
esel
and e
lectric
tra
ins
6.8
7.3
8.1
8.3
8.5
8.6
8.8
8.9
9.1
9.3
83.8
Wha
rves
Maint
enan
ce
Wha
rf fac
ilities
main
tenan
ce
1.3
1.3
1.3
1.3
1.3
1.3
1.3
1.3
1.3
1.3
13.0
Op
erati
ons (
Asse
t bas
ed)
Ferry
pass
enge
r fac
ilities
oper
ation
s 4.4
5.4
5.6
5.7
5.9
6.0
6.2
6.3
6.5
6.6
58
.5
Op
erati
ons (
Non a
sset
base
d)
Ferry
servi
ces a
nd co
nces
siona
ry far
es
13.7
22.1
28.9
30.2
31.6
33.1
34.7
36.4
38.4
28.2
297.3
AT
HOP
Op
erati
ons (
Asse
t bas
ed)
AT H
OP op
erati
ons
18.2
18.6
19.2
19.6
20.3
20.6
21.3
21.5
22.3
22.5
204.2
Bu
s Netw
ork
Maint
enan
ce
Bus s
top m
ainten
ance
1.6
1.6
1.6
1.6
1.6
1.6
1.6
1.6
1.6
1.6
16
.1
Oper
ation
s (As
set b
ased
) Bu
sway
stati
on op
erati
ons
3.4
4.1
5.3
5.4
6.1
6.1
6.2
6.3
6.6
7.2
56.6
Op
erati
ons (
Non a
sset
base
d)
Bus s
ervic
es an
d con
cess
ionar
y far
es
167. 5
275. 8
316. 0
329. 3
337. 9
346. 6
356. 1
371. 8
386. 0
400. 8
3287
. 7
PT no
t othe
rwise
spec
ified
Oper
ation
s (No
n ass
et ba
sed)
PT
mar
ketin
g and
infor
matio
n, mu
ltimod
al 18
.2 18
.7 18
.6 17
.4 17
.4 17
.5 17
.6 17
.6 17
.7 17
.8 17
8.5
Publ
ic tra
nspo
rt m
ainte
nanc
e and
asse
t-bas
ed o
pera
tions
tota
l.
65.0
64.2
68.0
69.0
70.8
71.7
73.0
73.7
75.4
76.7
707.7
Sh
aded
(non
-ass
et) i
tem
s, co
rpor
ate c
osts
and
futu
re C
RL o
pera
ting
cost
s exc
lude
d
AT Asset Management Plan 2015 - 2018

AT Asset Management Plan 2015 – 2018 Page 133 of 139
Accelerated Transport Programme capital projects 3.4.
Accelerated Transport Programme capital projects by ACMP, inflated
($m, inflated) 2015/ 2016
2016/ 2017
2017/ 2018
2018/ 2019
2019/ 2020
2020/ 2021
2021/ 2022
2022/ 2023
2023/ 2024
2024/ 2025
2016-2025 total
Pavements 94.4 99.2 54.4 26.0 23.4 58.2 159.4 131.5 171.7 126.9 945.1 Footpaths and Cycleways 38.5 48.2 68.5 13.4 20.7 23.7 24.4 25.3 26.1 27.0 315.7 Bridges and Major Culverts 0.0 4.4 4.5 0.0 0.0 0.0 0.0 0.0 0.0 0.0 9.0 Walls 1.0 1.1 1.1 1.1 1.1 11.0 55.9 12.6 13.1 13.5 111.5 Traffic Systems 0.1 0.1 0.1 0.1 0.1 0.1 0.1 0.2 0.2 0.2 1.4 Street Lighting 4.8 5.0 5.1 5.2 5.4 7.5 7.7 8.0 8.2 8.5 65.3 Parking (includes park and ride) 7.3 9.2 5.8 2.5 4.2 3.8 3.9 4.1 4.2 4.3 49.3
Road capital projects total 146.1 167.2 139.6 48.3 54.9 104.2 251.5 181.6 223.5 180.5 1497.3 Rail Stations and Depots/ Stabling (inc City Rail Link) 114.4 158.0 125.1 217.0 314.4 470.1 508.3 380.6 77.8 7.2 2372.9
Rolling Stock 26.8 1.0 0.0 0.0 8.1 0.0 0.0 0.0 0.0 0.0 35.9 Wharves 0.6 0.6 0.6 0.7 0.7 0.7 0.7 0.8 0.8 0.8 7.1 AT HOP 8.0 1.9 4.2 2.0 2.1 3.4 2.2 7.8 8.1 2.4 42.2 Bus Network 57.4 85.1 66.9 6.9 12.9 121.7 210.1 91.0 75.6 120.3 848.0 PT capital projects total 207.3 246.7 196.9 226.6 338.1 595.9 721.3 480.1 162.3 130.7 3306.1 Excludes corporate projects and Growth Infrastructure Fund
Accelerated Transport Programme capital projects by ACMP, uninflated
($m, uninflated) 2015/ 2016
2016/ 2017
2017/ 2018
2018/ 2019
2019/ 2020
2020/ 2021
2021/ 2022
2022/ 2023
2023/ 2024
2024/ 2025
2016-2025 total
Pavements 92.0 94.2 50.2 23.3 20.4 49.1 130.5 104.1 131.5 94.0 789.3 Footpaths and Cycleways 37.5 45.7 63.2 12.0 18.0 20.0 20.0 20.0 20.0 20.0 276.5 Bridges and Major Culverts 0.0 4.2 4.2 0.0 0.0 0.0 0.0 0.0 0.0 0.0 8.4 Walls 1.0 1.0 1.0 1.0 1.0 9.3 45.7 10.0 10.0 10.0 90.0 Traffic Systems 0.1 0.1 0.1 0.1 0.1 0.1 0.1 0.1 0.1 0.1 1.2 Street Lighting 4.7 4.7 4.7 4.7 4.7 6.3 6.3 6.3 6.3 6.3 55.0 Parking (includes park and ride) 7.1 8.8 5.4 2.2 3.6 3.2 3.2 3.2 3.2 3.2 43.1
Road capital projects total 142.4 158.7 128.8 43.4 47.8 88.0 205.9 143.7 171.1 133.6 1263.5 Rail Stations and Depots/ Stabling (inc City Rail Link) 111.5 150.0 115.5 194.6 273.8 397.2 416.1 301.3 59.6 5.3 2025.0
Rolling Stock 26.1 0.9 0.0 0.0 7.1 0.0 0.0 0.0 0.0 0.0 34.1 Wharves 0.6 0.6 0.6 0.6 0.6 0.6 0.6 0.6 0.6 0.6 6.0 AT HOP 7.8 1.8 3.9 1.8 1.8 2.9 1.8 6.2 6.2 1.8 36.0 Bus Network 56.0 80.8 61.8 6.2 11.2 102.8 172.0 72.0 57.9 89.1 709.8 PT capital projects total 202.0 234.1 181.8 203.3 294.5 503.5 590.5 380.1 124.3 96.8 2811.0 Excludes corporate projects and Growth Infrastructure Fund
AT Asset Management Plan 2015 - 2018

AT
Ass
et M
anag
emen
t Pla
n 20
15 –
201
8 P
age
134
of 1
39
Acc
eler
ated
Tra
nspo
rt P
rogr
amm
e ca
pita
l pro
ject
s de
tail,
uni
nfla
ted
($
millio
ns, u
ninfla
ted)
2015
/ 20
16
2016
/ 20
17
2017
/ 20
18
2018
/ 20
19
2019
/ 20
20
2020
/ 20
21
2021
/ 20
22
2022
/ 20
23
2023
/ 20
24
2024
/ 20
25
2016
-202
5 to
tal
Pave
ments
Do
minio
n Roa
d Tra
nspo
rt Co
rrido
r
9.1
40.0
49
.1
Long
Bay
Glen
var R
idge R
d 3.0
2.6
2.4
7.9
Pe
nlink
Toll
Roa
d 1.2
1.2
W
arkw
orth
Wes
tern C
ollec
tor
3.2
3.2
DEFE
RRAL
FRO
M 20
14/15
- Te
Atat
u Rd :
Cor
ridor
Impr
ovem
ents
6.7
6.7
Te A
tatu R
d : C
orrid
or Im
prov
emen
ts 6.7
6.3
12
.9
Linco
ln Rd
- Co
rrido
r Imp
rove
ments
1.8
2.0
2.0
10.1
8.7
16.4
2.7
43.6
Al
bany
High
way U
pgra
de
22.9
12.4
1.0
36
.3
Mill R
oad I
mpro
veme
nts (N
orthe
rn)
3.0
3.0
3.0
3.0
12.6
21.5
29.3
29.3
104.7
NORS
GA P
C 13
Hob
sonv
illle P
oint
0.5
0.5
NORS
GA P
C14 H
obso
nville
Villa
ge
0.3
5.5
11.8
17
.7
NORS
GA P
C 15
Mas
sey N
orth
T/C
16.7
9.2
5.7
6.4
38.0
DE
FERR
AL F
ROM
2014
/15 -
NORS
GA P
C 15
Mas
sey N
orth
T/C
4.1
4.1
Flat B
ush M
ain S
treet
Colle
ctor L
ink
1.4
5.3
6.7
Ta
haro
to/W
airau
- St
age 3
0.5
3.0
3.5
Brigh
am C
reek
Roa
d Coo
ridor
Impr
ovem
ents
1.0
7.7
0.1
8.8
Newm
arke
t Cro
ssing
1.0
5.1
6.1
Wyn
yard
Qua
rter -
Integ
rated
Rd P
rog
5.4
5.4
East
Wes
t Link
1.5
1.5
1.5
1.5
29
.6 39
.4 33
.0
108.0
Tama
ki Dr
ive &
Nga
pipi In
terse
ction
4.0
4.0
Se
al Ex
tensio
ns an
d Loc
al Tr
ansp
ort Im
prov
emen
ts 3.2
3.2
3.1
1.0
1.0
1.0
1.0
1.0
1.0
1.0
16
.5
Impr
ovem
ents
Comp
lemen
ting D
evelo
pmen
t 0.8
0.8
0.8
0.8
0.8
0.8
0.8
0.8
0.8
0.8
8.0
Road
Defe
rral N
ew C
apex
(bala
ncing
item)
-1
7.3
-1
7.3
PC
32 P
eniha
na N
orth
Tpt M
itigati
on
0.1
0.1
0.1
0.1
0.4
PC
127 H
uapa
i Nor
th Tr
ansp
ort M
itigati
on
2.1
2.1
Route
Opti
misa
tion /
Netw
ork O
pera
ting P
lan C
apita
l Pro
gram
me
2.5
2.5
2.5
2.5
2.5
2.5
2.5
2.5
20.0
AM
ETI M
t Well
ington
Hwa
y
0.2
2.0
6.5
6.3
15
.0
AMET
I Mor
in to
Merto
n Link
1.0
8.2
28.9
38.1
Ge
nera
l AT
Asse
t rep
lacem
ent
6.0
3.7
6.0
5.1
5.5
4.0
6.0
5.1
5.5
4.0
50.9
Sa
fety p
rogr
amme
s 21
.9 21
.4 20
.8 10
.0 13
.0 13
.0 13
.0 13
.0 13
.0 15
.0 15
4.1
Int
ellige
nt Tr
ansp
ort S
ystem
s Infr
astru
cture
3.5
3.5
3.5
3.5
3.5
3.5
3.5
3.5
28
.0
Loca
l road
impr
ovem
ents
comp
lemen
ting H
NO in
itiativ
es
5.0
5.0
AT Asset Management Plan 2015 - 2018

AT
Ass
et M
anag
emen
t Pla
n 20
15 –
201
8 P
age
135
of 1
39
($
millio
ns, u
ninfla
ted)
2015
/ 20
16
2016
/ 20
17
2017
/ 20
18
2018
/ 20
19
2019
/ 20
20
2020
/ 20
21
2021
/ 20
22
2022
/ 20
23
2023
/ 20
24
2024
/ 20
25
2016
-202
5 to
tal
Footp
aths
and
Cycle
ways
W
alking
and
Cycli
ng P
rogr
amme
24
.0 34
.0 53
.2 2.0
8.0
10
.0 10
.0 10
.0 10
.0 10
.0 17
1.2
W
atervi
ew S
hare
d Path
3.5
1.7
5.2
Lo
cal B
oard
Initia
tives
10
.0 10
.0 10
.0 10
.0 10
.0 10
.0 10
.0 10
.0 10
.0 10
.0 10
0.0
Bridg
es an
d Ma
jor
Culve
rts
Murp
hys R
d Brid
ge Im
prov
emen
ts
4.2
4.2
8.4
Wall
s Qu
ay S
treet
Seaw
all S
eismi
c Upg
rade
4.3
35.7
40
.0
Seism
ic str
ength
ening
(Exc
rene
wals)
1.0
1.0
1.0
1.0
1.0
5.0
10
.0 10
.0 10
.0 10
.0 50
.0 Tr
affic
Syste
ms
Red L
ight C
amer
a New
0.1
0.1
0.1
0.1
0.1
0.1
0.1
0.1
0.1
0.1
1.2
Stre
et Lig
hting
St
reet
Lighti
ng im
prov
emen
ts- re
gionw
ide
0.3
0.3
0.3
0.3
0.3
0.3
0.3
0.3
0.3
0.3
3.0
LE
D St
reetl
ightin
g 4.4
4.4
4.4
4.4
4.4
6.0
6.0
6.0
6.0
6.0
52
.0 Pa
rking
Pa
rk n R
ide S
ilver
dale-
Stag
e 2
5.7
5.7
Park
n Ride
- Gl
en E
den
0.9
0.9
Encro
achm
ent R
esolu
tion
1.2
1.2
1.2
1.2
1.2
1.2
1.2
1.2
1.2
1.2
12.2
Pa
rk n R
ide -
Wes
tgate
3.1
3.1
Pa
rking
Pro
gram
me
2.0
1.0
1.0
1.0
2.4
2.0
2.0
2.0
2.0
2.0
17.4
DE
FERR
AL F
ROM
2014
/15 -
Parki
ng P
rogr
amme
3.0
3.0
Pa
rk n R
ide -
Papa
kura
0.8
0.8
Road
capi
tal p
rojec
ts to
tal
142.4
15
8.7
128.8
43
.4 47
.8 88
.0 20
5.9
143.7
17
1.1
133.6
12
63.5
Rail
Stati
ons
and D
epots
/ St
ablin
g
Rail C
ross
ing S
epar
ation
(exc
luding
New
marke
t Cro
ssing
)
5.0
5.0
5.0
5.0
20
.0 PT
Rail
Stat
ion M
inor C
apex
0.3
0.3
0.3
0.3
0.3
0.3
0.3
0.3
0.3
0.3
3.0
Ne
wmar
ket S
tation
(New
marke
t Squ
are i
mpro
veme
nts)
0.3
1.1
1.4
City
Rail L
ink
110.9
14
8.5
115.2
19
4.3
273.5
39
6.9
410.8
29
6.0
54.3
20
00.6
Ro
lling
Stoc
k EM
U Pr
ocur
emen
t 26
.1 0.9
27
.1 Di
esel
Refur
bishm
ent (
Puke
kohe
shutt
les)
7.1
7.1
W
harve
s PT
Wha
rves C
apex
- Mi
nor
0.6
0.6
0.6
0.6
0.6
0.6
0.6
0.6
0.6
0.6
6.0
AT H
OP
AIFS
Exp
ansio
n 1.8
1.8
3.9
1.8
1.8
2.9
1.8
6.2
6.2
1.8
30
.0
PT In
tegra
ted F
ares
6.0
6.0
Bus
Netw
ork
PT B
us S
top Im
prov
emen
ts 3.6
2.2
2.1
1.3
1.3
1.3
1.3
1.3
1.3
1.3
17
.2 PT
Infor
matio
n and
Sign
age I
mpro
veme
nts
1.5
1.5
1.5
1.5
1.5
1.5
1.5
1.5
12.0
PT T
e Atat
u Moto
rway
Bus
Inter
chan
ge
0.5
4.5
5.0
AT Asset Management Plan 2015 - 2018
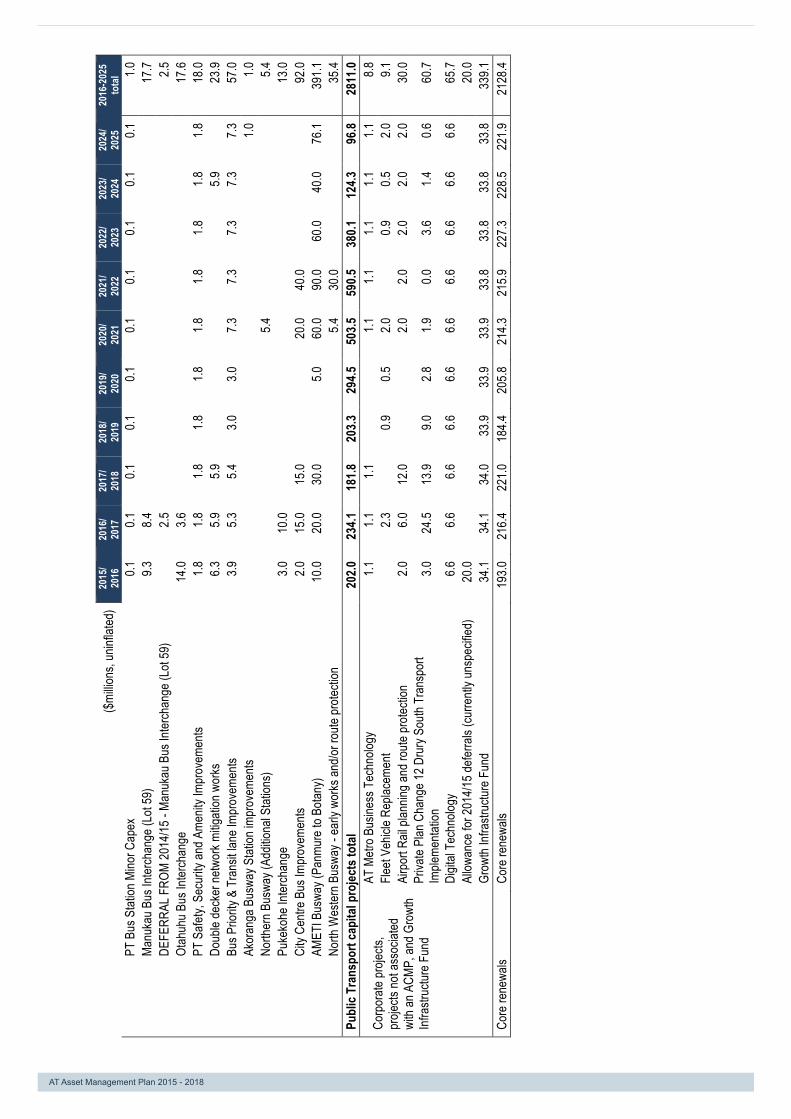
AT
Ass
et M
anag
emen
t Pla
n 20
15 –
201
8 P
age
136
of 1
39
($
millio
ns, u
ninfla
ted)
2015
/ 20
16
2016
/ 20
17
2017
/ 20
18
2018
/ 20
19
2019
/ 20
20
2020
/ 20
21
2021
/ 20
22
2022
/ 20
23
2023
/ 20
24
2024
/ 20
25
2016
-202
5 to
tal
PT
Bus
Stat
ion M
inor C
apex
0.1
0.1
0.1
0.1
0.1
0.1
0.1
0.1
0.1
0.1
1.0
Manu
kau B
us In
terch
ange
(Lot
59)
9.3
8.4
17.7
DE
FERR
AL F
ROM
2014
/15 -
Manu
kau B
us In
terch
ange
(Lot
59)
2.5
2.5
Otah
uhu B
us In
terch
ange
14
.0 3.6
17
.6
PT S
afety,
Sec
urity
and A
menit
y Imp
rove
ments
1.8
1.8
1.8
1.8
1.8
1.8
1.8
1.8
1.8
1.8
18
.0
Doub
le de
cker
netw
ork m
itigati
on w
orks
6.3
5.9
5.9
5.9
23
.9
Bus P
riority
& T
rans
it lan
e Imp
rove
ments
3.9
5.3
5.4
3.0
3.0
7.3
7.3
7.3
7.3
7.3
57
.0
Akor
anga
Bus
way S
tation
impr
ovem
ents
1.0
1.0
North
ern B
uswa
y (Ad
dition
al St
ation
s)
5.4
5.4
Puke
kohe
Inter
chan
ge
3.0
10.0
13.0
Ci
ty Ce
ntre B
us Im
prov
emen
ts 2.0
15
.0 15
.0
20
.0 40
.0
92.0
AM
ETI B
uswa
y (Pa
nmur
e to B
otany
) 10
.0 20
.0 30
.0
5.0
60.0
90.0
60.0
40.0
76.1
391.1
North
Wes
tern B
uswa
y - ea
rly w
orks
and/o
r rou
te pr
otecti
on
5.4
30
.0
35.4
Publ
ic Tr
ansp
ort c
apita
l pro
jects
tota
l 20
2.0
234.1
18
1.8
203.3
29
4.5
503.5
59
0.5
380.1
12
4.3
96.8
2811
.0
Corp
orate
proje
cts,
proje
cts no
t ass
ociat
ed
with
an A
CMP,
and G
rowt
h Inf
rastr
uctur
e Fun
d
AT M
etro B
usine
ss T
echn
ology
1.1
1.1
1.1
1.1
1.1
1.1
1.1
1.1
8.8
Fle
et Ve
hicle
Repla
ceme
nt
2.3
0.9
0.5
2.0
0.9
0.5
2.0
9.1
Ai
rpor
t Rail
plan
ning a
nd ro
ute pr
otecti
on
2.0
6.0
12.0
2.0
2.0
2.0
2.0
2.0
30.0
Priva
te Pl
an C
hang
e 12 D
rury
South
Tra
nspo
rt Im
pleme
ntatio
n 3.0
24
.5 13
.9 9.0
2.8
1.9
0.0
3.6
1.4
0.6
60
.7
Di
gital
Tech
nolog
y 6.6
6.6
6.6
6.6
6.6
6.6
6.6
6.6
6.6
6.6
65
.7
Allow
ance
for 2
014/1
5 defe
rrals
(curre
ntly u
nspe
cified
) 20
.0
20.0
Gr
owth
Infra
struc
ture F
und
34.1
34.1
34.0
33.9
33.9
33.9
33.8
33.8
33.8
33.8
339.1
Co
re re
newa
ls Co
re re
newa
ls 19
3.0
216.4
22
1.0
184.4
20
5.8
214.3
21
5.9
227.3
22
8.5
221.9
21
28.4
AT Asset Management Plan 2015 - 2018
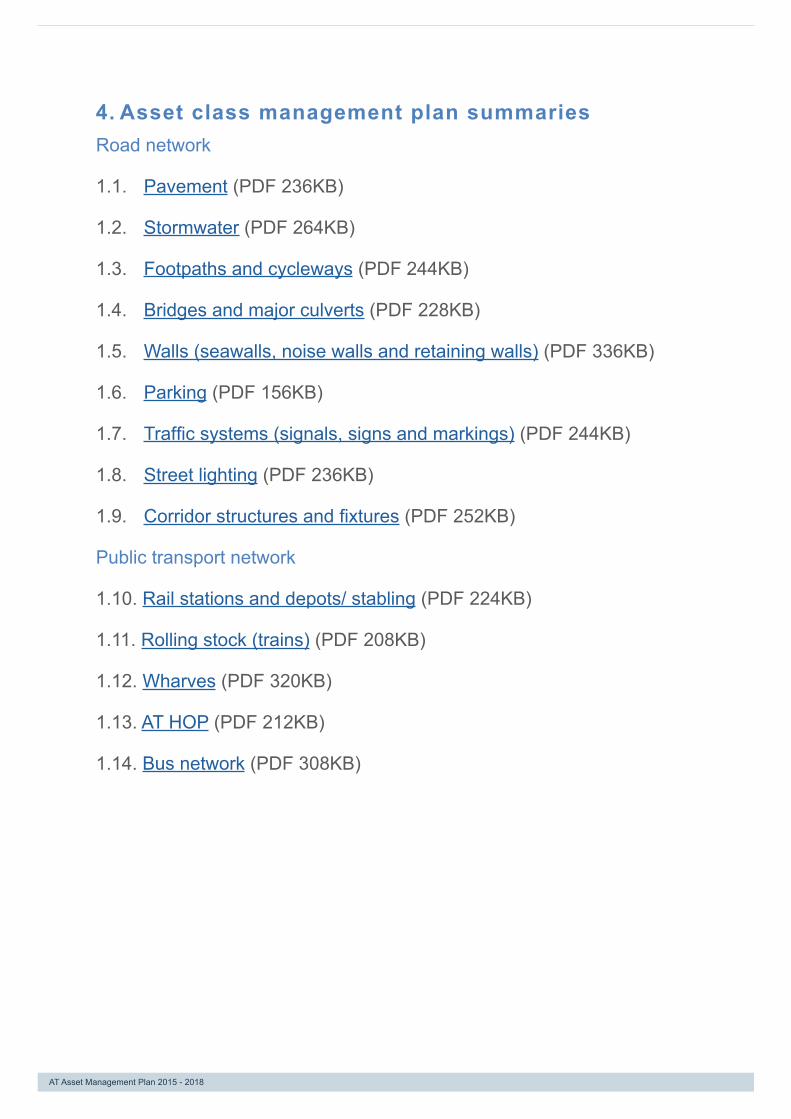
AT Asset Management Plan 2015 – 2018 Page 137 of 139
4. Asset class management plan summariesRoad network
Pavement 4.1.
Stormwater 4.2.
Footpaths and cycleways 4.3.
Bridges and major culverts 4.4.
Walls (seawalls, noise walls and retaining walls) 4.5.
Parking 4.6.
Traffic systems (signals, signs and markings) 4.7.
Street lighting 4.8.
Corridor structures and fixtures 4.9.
Public transport network
Rail stations and depots/ stabling 4.10.
Rolling stock (trains) 4.11.
Wharves 4.12.
AT HOP 4.13.
Bus network 4.14.
Road network
1.1. Pavement (PDF 236KB)
1.2. Stormwater (PDF 264KB)
1.3. Footpaths and cycleways (PDF 244KB)
1.4. Bridges and major culverts (PDF 228KB)
1.5. Walls (seawalls, noise walls and retaining walls) (PDF 336KB)
1.6. Parking (PDF 156KB)
1.7. Traffic systems (signals, signs and markings) (PDF 244KB)
1.8. Street lighting (PDF 236KB)
1.9. Corridor structures and fixtures (PDF 252KB)
Public transport network
1.10. Rail stations and depots/ stabling (PDF 224KB)
1.11. Rolling stock (trains) (PDF 208KB)
1.12. Wharves (PDF 320KB)
1.13. AT HOP (PDF 212KB)
1.14. Bus network (PDF 308KB)
AT Asset Management Plan 2015 - 2018

Bibliography 1. Local Government (Auckland Council) Act. section 38. 2009.
2. Auckland Council. Long Term Plan. 2015.
3. Auckland Transport. Draft Statement of Intent 2015/16.
4. —. Renewals Optimisation Model . s.l. : Road Efficiency Group Best Practice Case Study, 2015.
5. —. Regional Land Transport Plan. 2015.
6. Auckland Council. Infrastructure Strategy. 2015.
7. IPWEA. International Infrastructure Management Manual. 2011.
8. Minister of Transport. Government Policy Statement. 2015.
9. Auckland Council. Auckland Plan. 2012.
10. Ministry of Transport. Continuous household travel survey 2011-‐2013. 2014.
11. —. Transport Volume : Vehicle Travel. 2014.
12. IPSOS / Auckland Transport. Auckland Road User Satisfaction. 2014.
13. Auckland Transport. AT Research panel. [Online] https://at.govt.nz/about-‐us/consultations/at-‐research-‐panel/.
14. —. Report on Elected Member Workshops (unpublished). 2014.
15. —. Regional Public Transport Plan. 2014.
16. Auckland Lifelines Group. Critical Infrastructure Report 2 -‐ Auckland's Lifelines.
17. Road Efficiency Group (NZTA and Local Government NZ). One Network Road Classification. NZ Transport Agency. [Online] 2015. http://www.nzta.govt.nz/projects/road-‐efficiency-‐group/onrc.html.
18. Auckland Council. Auckland Regional Transport Model Scenario I 8b. Nov 2013.
19. Statistics NZ. Subnational population projections. 2015 (2013 base).
20. Ministry of Transport. National Freight Demand Study. 2014.
21. —. Safer Journeys Strategy to 2020. 2010.
22. Auckland Council. Revenue and Financing Policy. 2015.
23. NZ Transport Agency. Investment Assessment Framework. 2015.
24. Auckland Transport. Draft Regional Land Transport Plan. 2015.
25. —. Annual Report 2013/14. 2014.
26. —. Asset Class Management Plans (for 15 Asset Classes, excluding Vegetation). 2015.
27. —. Asset Valuations 2012 and 2014 (composite).
28. Department of Internal Affairs. Nonfinancial Performance Measures Rules. 2013.
29. Ministry of Transport. Freight and the transport industry : Freight Volume.
AT Asset Management Plan 2015 - 2018

www.AT.govt.nzAuckland Transport’s Call Centre operates24 hours / 7 days / weekPhone +64 9 355 3553Fax +64 9 355 3550
Visit our Head Office6 Henderson Valley Road, Henderson,Auckland 0612Private Bag 92 250, Auckland 1142


