BRIDGES ASSET MANAGEMENT PLAN Reference: 2011/004336 Adopted 22 February 2011 Ku Ku Ku Ku-ring ring ring ring-gai Council gai Council gai Council gai Council BRIDGES BRIDGES BRIDGES BRIDGES ASSET MANAGEMENT PLAN ASSET MANAGEMENT PLAN ASSET MANAGEMENT PLAN ASSET MANAGEMENT PLAN Adopted 22 February 2011 Adopted 22 February 2011 Adopted 22 February 2011 Adopted 22 February 2011
Transcript
BRIDGES ASSET MANAGEMENT PLAN Reference: 2011/004336 Adopted 22 February 2011
KuKuKuKu----ringringringring----gai Councilgai Councilgai Councilgai Council
BRIDGESBRIDGESBRIDGESBRIDGES
ASSET MANAGEMENT PLANASSET MANAGEMENT PLANASSET MANAGEMENT PLANASSET MANAGEMENT PLAN
Adopted 22 February 2011Adopted 22 February 2011Adopted 22 February 2011Adopted 22 February 2011
BRIDGES ASSET MANAGEMENT PLAN Reference: 2011/004336 Adopted 22 February 2011
Document ControlDocument ControlDocument ControlDocument Control
What Council Provides ............................................................................................1 What does it Cost? ..................................................................................................1 Plans for the Future................................................................................................1 Measuring our Performance...................................................................................1 The Next Steps .......................................................................................................2
2.2.2.2. INTRODUCTIONINTRODUCTIONINTRODUCTIONINTRODUCTION ........................................................................................................................................................................................................................................................................................................................................................................................................................2222 2.1 Background .....................................................................................................2 2.2 Goals and Objectives of Asset Management .....................................................3 2.3 Plan Framework ..............................................................................................4 2.4 Core and Advanced Asset Management ...........................................................6 3.1 Customer Research and Expectations..............................................................7 3.2 Legislative Requirements ................................................................................7 3.3 Current Levels of Service .................................................................................7 3.4 Desired Levels of Service .................................................................................9
4.4.4.4. FUTURE DEMANDFUTURE DEMANDFUTURE DEMANDFUTURE DEMAND ................................................................................................................................................................................................................................................................................................................................................................................................ 10101010 4.1 Demand Forecast...........................................................................................10 4.2 Changes in Technology ..................................................................................10 4.3 Demand Management Plan ............................................................................10 4.4 New Assets from Growth ...............................................................................11
5.5.5.5. LIFECYCLE MANAGEMENT PLANLIFECYCLE MANAGEMENT PLANLIFECYCLE MANAGEMENT PLANLIFECYCLE MANAGEMENT PLAN.................................................................................................................................................................................................................................................................................................... 12121212 5.1 Background Data ...........................................................................................12 5.1.1 Physical parameters ..............................................................................12 5.1.2 Asset capacity and performance.............................................................13 5.1.3 Asset condition.......................................................................................13 5.1.4 Asset valuations .....................................................................................15 5.2 Risk Management Plan ..................................................................................15 5.3 Routine Maintenance Plan .............................................................................16 5.3.1 Maintenance plan ...................................................................................16 5.3.2 Standards and specifications..................................................................17 5.3.3 Summary of future maintenance expenditures.......................................17 5.4 Renewal/Replacement Plan ...........................................................................18 5.4.1 Renewal plan .........................................................................................18 5.4.2 Renewal standards.................................................................................19 5.4.3 Summary of future renewal expenditure ................................................19 5.5 Creation/Acquisition/Upgrade Plan................................................................21 5.5.1 Selection criteria....................................................................................21 5.5.2 Standards and specifications..................................................................21 5.5.3 Summary of future upgrade/new assets expenditure .............................21 5.6 Disposal Plan .................................................................................................21
6.6.6.6. FINANCIAL SUMMARYFINANCIAL SUMMARYFINANCIAL SUMMARYFINANCIAL SUMMARY........................................................................................................................................................................................................................................................................................................................................................................ 22222222 6.1 Financial Statements and Projections ............................................................22 6.1.1 Sustainability of service delivery.............................................................22 6.2 Funding Strategy............................................................................................25 6.3 Valuation Forecasts .......................................................................................25 6.4 Key Assumptions made in Financial Forecasts ..............................................28
7.7.7.7. ASSET MANAGEMENT PRACTICESASSET MANAGEMENT PRACTICESASSET MANAGEMENT PRACTICESASSET MANAGEMENT PRACTICES............................................................................................................................................................................................................................................................................................ 30303030 7.1 Accounting/Financial Systems .......................................................................30 7.2 Asset Management Systems ..........................................................................30 7.3 Information Flow Requirements and Processes.............................................30
BRIDGES ASSET MANAGEMENT PLAN Reference: 2011/004336 Adopted 22 February 2011
7.4 Standards and Guidelines ..............................................................................30 8.8.8.8. PLAN IMPROVEMENT AND MONITORINGPLAN IMPROVEMENT AND MONITORINGPLAN IMPROVEMENT AND MONITORINGPLAN IMPROVEMENT AND MONITORING.................................................................................................................................................................................................................................................... 31313131
8.1 Performance Measures .................................................................................31 8.2 Improvement Plan .........................................................................................31 8.3 Monitoring and Review Procedures................................................................31 9 Conclusion .........................................................................................................32
REFERENCESREFERENCESREFERENCESREFERENCES................................................................................................................................................................................................................................................................................................................................................................................................................................................................ 34343434 RELATED DOCUMENTSRELATED DOCUMENTSRELATED DOCUMENTSRELATED DOCUMENTS.................................................................................................................................................................................................................................................................................................................................................................................................... 35353535
- i -
BRIDGES ASSET MANAGEMENT PLAN Reference: 2011/004336 Adopted 22 February 2011
CWMSCWMSCWMSCWMS Community wastewater management systems
DADADADA Depreciable amount
DoHDoHDoHDoH Department of Health
EFEFEFEF Earthworks/formation
IRMPIRMPIRMPIRMP Infrastructure risk management plan
LCCLCCLCCLCC Life Cycle cost
LCELCELCELCE Life cycle expenditure
MMSMMSMMSMMS Maintenance management system
PCIPCIPCIPCI Pavement condition index
RVRVRVRV Residual value
SSSSSSSS Suspended solids
vphvphvphvph Vehicles per hour
- ii -
BRIDGES ASSET MANAGEMENT PLAN Reference: 2011/004336 Adopted 22 February 2011
GLOSSARYGLOSSARYGLOSSARYGLOSSARY
Annual service cost (ASC)Annual service cost (ASC)Annual service cost (ASC)Annual service cost (ASC)
An estimate of the cost that would be tendered, per annum, if tenders were called for the supply of a service to a performance specification for a fixed term. The Annual Service Cost includes operating, maintenance, depreciation, finance / opportunity and disposal costs, less revenue.
Asset classAsset classAsset classAsset class
Grouping of assets of a similar nature and use in an entity's operations (AASB 166.37).
The process of continuous or periodic inspection, assessment, measurement and interpretation of the resultant data to indicate the condition of a specific asset so as to determine the need for some preventative or remedial action.
The combination of management, financial, economic, engineering and other practices applied to physical assets with the objective of providing the required level of service in the most cost effective manner.
AssetsAssetsAssetsAssets
Future economic benefits controlled by the entity as a result of past transactions or other past events (AAS27.12).
Property, plant and equipment including infrastructure and other assets (such as furniture and fittings) with benefits expected to last more than 12 month.
Average annual asset consumption Average annual asset consumption Average annual asset consumption Average annual asset consumption (AAAC)(AAAC)(AAAC)(AAAC)****
The amount of a local government’s asset base consumed during a year. This may be calculated by dividing the Depreciable Amount (DA) by the Useful Life and totalled for each and every asset OR by dividing the Fair Value (Depreciated Replacement Cost) by the Remaining Life and totalled for each and every asset in an asset category or class.
Asset (re)valuation values based on the cost to replace the asset including demolition and restoration costs.
Capital expansion expenditureCapital expansion expenditureCapital expansion expenditureCapital expansion expenditure
Expenditure that extends an existing asset, at the same standard as is currently enjoyed by residents, to a new group of users. It is discretional expenditure, which increases future operating, and maintenance costs, because it increases council’s asset base, but may be associated with additional revenue from the new user group, eg. extending a drainage or road network, the provision of an oval or park in a new suburb for new residents.
Capital expenditureCapital expenditureCapital expenditureCapital expenditure
Relatively large (material) expenditure, which has benefits, expected to last for more than 12 months. Capital expenditure includes renewal, expansion and upgrade. Where capital projects involve a combination of renewal, expansion and / or upgrade expenditures, the total project cost needs to be allocated accordingly.
- ii -
BRIDGES ASSET MANAGEMENT PLAN Reference: 2011/004336 Adopted 22 February 2011
Capital fundingCapital fundingCapital fundingCapital funding
Funding to pay for capital expenditure.
Capital grantsCapital grantsCapital grantsCapital grants
Monies received generally tied to the specific projects for which they are granted, which are often upgrade and / or expansion or new investment proposals.
Capital investment exCapital investment exCapital investment exCapital investment expenditurependiturependiturependiture
See capital expenditure definition
Capital new expenditureCapital new expenditureCapital new expenditureCapital new expenditure
Expenditure which creates a new asset providing a new service to the community that did not exist beforehand. As it increases service potential it may impact revenue and will increase future operating and maintenance expenditure.
Capital renewal expenditureCapital renewal expenditureCapital renewal expenditureCapital renewal expenditure
Expenditure on an existing asset, which returns the service potential or the life of the asset up to that which it had originally. It is periodically required expenditure, relatively large (material) in value compared with the value of the components or sub-components of the asset being renewed. As it reinstates existing service potential, it has no impact on revenue, but may reduce future operating and maintenance expenditure if completed at the optimum time, eg. resurfacing or resheeting a material part of a road network, replacing a material section of a drainage network with pipes of the same capacity, resurfacing an oval. Where capital projects involve a combination of renewal, expansion and / or upgrade expenditures, the total project cost needs to be allocated accordingly.
Capital upgrade expenditureCapital upgrade expenditureCapital upgrade expenditureCapital upgrade expenditure
Expenditure, which enhances an existing asset to provide a higher level of service or expenditure that, will increase the life of the asset beyond that which it had originally. Upgrade expenditure is discretional and often does not result in additional revenue unless direct user charges apply. It will increase operating and maintenance expenditure in the future because of the increase in the Council’s asset base, e.g. widening the sealed area of an existing road, replacing drainage pipes with pipes of a greater capacity, enlarging a grandstand at a sporting facility. Where capital projects involve a combination of renewal, expansion and / or upgrade expenditures, the total project cost needs to be allocated accordingly.
The amount at which an asset is recognised after deducting any accumulated depreciation / amortisation and accumulated impairment losses thereon.
Class of Class of Class of Class of assetsassetsassetsassets
See asset class definition.
ComponentComponentComponentComponent
An individual part of an asset which contributes to the composition of the whole and can be separated from or attached to an asset or a system.
Cost of an assetCost of an assetCost of an assetCost of an asset
The amount of cash or cash equivalents paid or the fair value of the consideration given to acquire an asset at the time of its acquisition or construction, plus any costs necessary to place the asset into service. This includes one-off design and project management costs.
- iii -
BRIDGES ASSET MANAGEMENT PLAN Reference: 2011/004336 Adopted 22 February 2011
The cost the entity would incur to acquire the asset on the reporting date. The cost is measured by reference to the lowest cost at which the gross future economic benefits could be obtained in the normal course of business or the minimum it would cost, to replace the existing asset with a technologically modern equivalent new asset (not a second hand one) with the same economic benefits (gross service potential) allowing for any differences in the quantity and quality of output and in operating costs.
CurrCurrCurrCurrent replacement cost “As New” ent replacement cost “As New” ent replacement cost “As New” ent replacement cost “As New” (CRC)(CRC)(CRC)(CRC)
The current cost of replacing the original service potential of an existing asset, with a similar modern equivalent asset, i.e. the total cost of replacing an existing asset with an as NEW or similar asset expressed in current dollar values.
Replacement of higher value components / sub-components of assets that is undertaken on a regular cycle including repainting, building roof replacement, cycle, replacement of air conditioning equipment, etc. This work generally falls below the capital / maintenance threshold and needs to be identified in a specific maintenance budget allocation.
An asset with historic, artistic, scientific, technological, geographical or environmental qualities that is held and maintained principally for its contribution to knowledge and culture and this purpose is central to the objectives of the entity holding it.
Impairment LossImpairment LossImpairment LossImpairment Loss
The amount by which the carrying amount of an asset exceeds its recoverable amount.
Physical assets of the entity or of another entity that contribute to meeting the public's need for access to major
- iv -
BRIDGES ASSET MANAGEMENT PLAN Reference: 2011/004336 Adopted 22 February 2011
economic and social facilities and services, eg. roads, drainage, footpaths and cycleways. These are typically large, interconnected networks or portfolios of composite assets. The components of these assets may be separately maintained, renewed or replaced individually so that the required level and standard of service from the network of assets is continuously sustained. Generally the components and hence the assets have long lives. They are fixed in place and are often have no market value.
Property held to earn rentals or for capital appreciation or both, rather than for:
(a) use in the production or supply of goods or services or for administrative purposes; or
(b) sale in the ordinary course of business (AASB 140.5)
Level of serviceLevel of serviceLevel of serviceLevel of service
The defined service quality for a particular service against which service performance may be measured. Service levels usually relate to quality, quantity, reliability, responsiveness, environmental, acceptability and cost.
The life cycle cost (LCC) is average cost to provide the service over the longest asset life cycle. It comprises annual maintenance and asset consumption expense, represented by depreciation expense. The Life Cycle Cost does not indicate the funds required to provide the service in a particular year.
The Life Cycle Expenditure (LCE) is the actual or planned annual maintenance
and capital renewal expenditure incurred in providing the service in a particular year. Life Cycle Expenditure may be compared to Life Cycle Expenditure to give an initial indicator of life cycle sustainability.
Loans result in funds being received which are then repaid over a period of time with interest (an additional cost). Their primary benefit is in ‘spreading the burden of capital expenditure over time. Although loans enable works to be completed sooner, they are only ultimately cost effective where the capital works funded (generally renewals) result in operating and maintenance cost savings, which are greater than the cost of the loan (interest and charges).
Maintenance and renewal gapMaintenance and renewal gapMaintenance and renewal gapMaintenance and renewal gap
Difference between estimated budgets and projected expenditures for maintenance and renewal of assets, totalled over a defined time (e.g 5, 10 and 15 years).
Maintenance and renewal sustainability Maintenance and renewal sustainability Maintenance and renewal sustainability Maintenance and renewal sustainability indexindexindexindex
Ratio of estimated budget to projected expenditure for maintenance and renewal of assets over a defined time (e.g 5, 10 and 15 years).
Recurrent expenditure, which is periodically or regularly required as part of the anticipated schedule of works required to ensure that the asset achieves its useful life and provides the required level of service. It is expenditure, which was anticipated in determining the asset’s useful life.
- v -
BRIDGES ASSET MANAGEMENT PLAN Reference: 2011/004336 Adopted 22 February 2011
MaterialityMaterialityMaterialityMateriality
An item is material is its omission or misstatement could influence the economic decisions of users taken on the basis of the financial report. Materiality depends on the size and nature of the omission or misstatement judged in the surrounding circumstances.
Modern equivalent asset.Modern equivalent asset.Modern equivalent asset.Modern equivalent asset.
A structure similar to an existing structure and having the equivalent productive capacity, which could be built using modern materials, techniques and design. Replacement cost is the basis used to estimate the cost of constructing a modern equivalent asset.
Investments for the provision of goods and services to sustain or improve services to the community that are not expected to generate any savings or revenue to the Council, e.g. parks and playgrounds, footpaths, roads and bridges, libraries, etc.
Recurrent expenditure, which is continuously required excluding maintenance and depreciation, e.g power, fuel, staff, plant equipment, on-costs and overheads.
PavePavePavePavement management systemment management systemment management systemment management system
A systematic process for measuring and predicting the condition of road pavements and wearing surfaces over time and recommending corrective actions.
Repair work that is identified and managed through a maintenance management system (MMS). MMS
activities include inspection, assessing the condition against failure / breakdown criteria / experience, prioritising scheduling, actioning the work and reporting what was done to develop a maintenance history and improve maintenance and service delivery performance.
PMS ScorePMS ScorePMS ScorePMS Score
A measure of condition of a road segment determined from a Pavement Management System.
Rate of annual asset consumptionRate of annual asset consumptionRate of annual asset consumptionRate of annual asset consumption****
A measure of average annual consumption of assets (AAAC) expressed as a percentage of the depreciable amount (AAAC/DA). Depreciation may be used for AAAC.
Rate of annual asset renewalRate of annual asset renewalRate of annual asset renewalRate of annual asset renewal****
A measure of the rate at which assets are being renewed per annum expressed as a percentage of depreciable amount (capital renewal expenditure/DA).
RRRRate of annual asset upgradeate of annual asset upgradeate of annual asset upgradeate of annual asset upgrade****
A measure of the rate at which assets are being upgraded and expanded per annum expressed as a percentage of depreciable amount (capital upgrade / expansion expenditure/DA).
Relatively small (immaterial) expenditure or that which has benefits expected to last less than 12 months. Recurrent expenditure includes operating and maintenance expenditure.
Investments for the provision of goods and services to sustain or improve services to the community that are expected to generate some savings or revenue to offset operating costs, e.g. public halls and theatres, childcare centres, sporting and recreation facilities, tourist information centres, etc.
The application of a formal process to the range of possible values relating to key factors associated with a risk in order to determine the resultant ranges of outcomes and their probability of occurrence.
Section or segmentSection or segmentSection or segmentSection or segment
A self-contained part or piece of an infrastructure asset.
Service potentialService potentialService potentialService potential
The capacity to provide goods and services in accordance with the entity's objectives, whether those objectives are the generation of net cash inflows or the provision of goods and services of a particular volume and quantity to the beneficiaries thereof.
A measure of the remaining life of assets expressed as a percentage of economic life. It is also a measure of the percentage of the asset’s potential to provide services that is still available for use in providing services (DRC/DA).
Documents Council objectives for a specified period (3-5 yrs), the principle activities to achieve the objectives, the means by which that will be carried out, estimated income and expenditure, measures to assess performance and how rating policy relates to the Council’s objectives and activities.
Smaller individual parts that make up a component part.
- vii -
BRIDGES ASSET MANAGEMENT PLAN Reference: 2011/004336 Adopted 22 February 2011
Useful lifeUseful lifeUseful lifeUseful life
Either:
(a) the period over which an asset is expected to be available for use by an entity, or
(b) the number of production or similar units expected to be obtained from the asset by the entity.
It is estimated or expected time between placing the asset into service and removing it from service, or the estimated period of time over which the future economic benefits embodied in a depreciable asset, are expected to be consumed by the Council. It is the same as the economic life.
Value in UseValue in UseValue in UseValue in Use
The present value of estimated future cash flows expected to arise from the continuing use of an asset and from its disposal at the end of its useful life. It is deemed to be depreciated replacement cost (DRC) for those assets whose future economic benefits are not primarily dependent on the asset's ability to generate new cash flows, where if deprived of the asset its future economic benefits would be replaced.
SourceSourceSourceSource: DVC 2006, Glossary NoteNoteNoteNote: Items shown: **** Modified to use DA instead of CRC ******** Additional glossary items shown.
- 1 -
BRIDGES ASSET MANAGEMENT PLAN Reference: 2011/004336 Adopted 22 February 2011
What Council ProvidesWhat Council ProvidesWhat Council ProvidesWhat Council Provides
Council provides a bridges network to allow safe vehicle and pedestrian access throughout Council whilst reducing the impact on the environment and facilitating movement over a wider area.
There are three (3) kinds of bridges in the Ku-ring-gai local government area.
Road bridges primary purpose is allowing motor vehicles access throughout the area, pedestrians and other forms of transport may also use these bridges.
Pedestrian bridges are not intended for use by motor vehicles. They allow pedestrians to avoid creeks and have easier access to some areas in Ku-ring-gai. They are usually found in parks and open space.
Culvert-pipe bridges are used for stormwater drainage flow and take run-off away from non-permeable surfaces.
What does it Cost?What does it Cost?What does it Cost?What does it Cost?
There are two (2) key indicators of cost to provide the bridges service.
� The life cycle cost being the average cost over the life cycle of the asset; and
� The total maintenance and capital renewal expenditure required to deliver existing service levels in the next 10 years covered by Council’s Long Term Financial Plan.
The life cycle cost to provide the bridges service is estimated at $162,912 per annum. Council’s planned life cycle expenditure for Year 1 of the Bridges Asset Management Plan is $68,000 which gives a life cycle sustainability index of
0.42. The amount allocated is the annual depreciation amount.
The total maintenance and capital renewal expenditure required to provide the bridge service in the next 10 years is estimated at $1.7 million. This is an average of $162,912 per annum.
Council’s maintenance and capital renewal expenditure for Year 1 of the Bridges Asset Management Plan of $68,600 giving a10 year sustainability index of 0.42.
Plans for the FuturePlans for the FuturePlans for the FuturePlans for the Future
Council plans to operate and maintain the bridges network to achieve the following strategic objectives.
1. Ensure the bridges network is maintained at a safe and functional standard as set out in this Bridges Asset Management Plan.
2. Ensure sufficient funding is provided to keep the bridges network at a satisfactory level and aim to achieve all bridges rated as satisfactory or better.
3. Keep the Bridges Asset Register updated to ensure equity in the distribution of funding.
Bridge assets will be maintained in a reasonably usable condition. Defects found or reported that are outside our service standard will be repaired. See our maintenance response service levels for details of defect prioritisation and response time.
- 2 -
BRIDGES ASSET MANAGEMENT PLAN Reference: 2011/004336 Adopted 22 February 2011
FunctionFunctionFunctionFunction
Our intent is that an appropriate bridges network is maintained in partnership with other levels of government and stakeholders to allow safe vehicle and pedestrian access throughout council whilst reducing the impact on the environment and facilitating movement over a wider area.
Bridges asset attributes will be maintained at a safe level and associated signage and equipment be provided as needed to ensure public safety. We need to ensure key functional objectives are met:
• Ensure sufficient funding is maintained to keep the bridges network at a satisfactory level and aim to achieve all bridges rated as satisfactory or better
• Keep the Bridges Asset Register updated to ensure equity in the distribution of funding
The main functional consequence of ensuring the maintenance of the bridges
network is to prevent any ongoing liabilities for Council.
SafetySafetySafetySafety
We inspect all bridges regularly and prioritise and repair defects in accordance with our inspection schedule to ensure they are safe.
The Next StepsThe Next StepsThe Next StepsThe Next Steps
This actions resulting from this Bridges Asset Management Plan are:
• Identifying the annual depreciation required to achieve sufficient funding for bridges.
• Identifying the levels of service required.
• Identifying the risks associated with not providing funding.
This Bridges Asset Management Plan is to demonstrate responsive management of assets (and services provided from assets), compliance with regulatory requirements, and to communicate funding required to provide the required levels of service.
The Bridges Asset Management Plan is to be read with the following associated planning documents:
Ku-ring-gai Asset Management Strategy
Ku-ring-gai Asset Management Policy
This Bridges Asset Management Plan covers the following infrastructure assets:
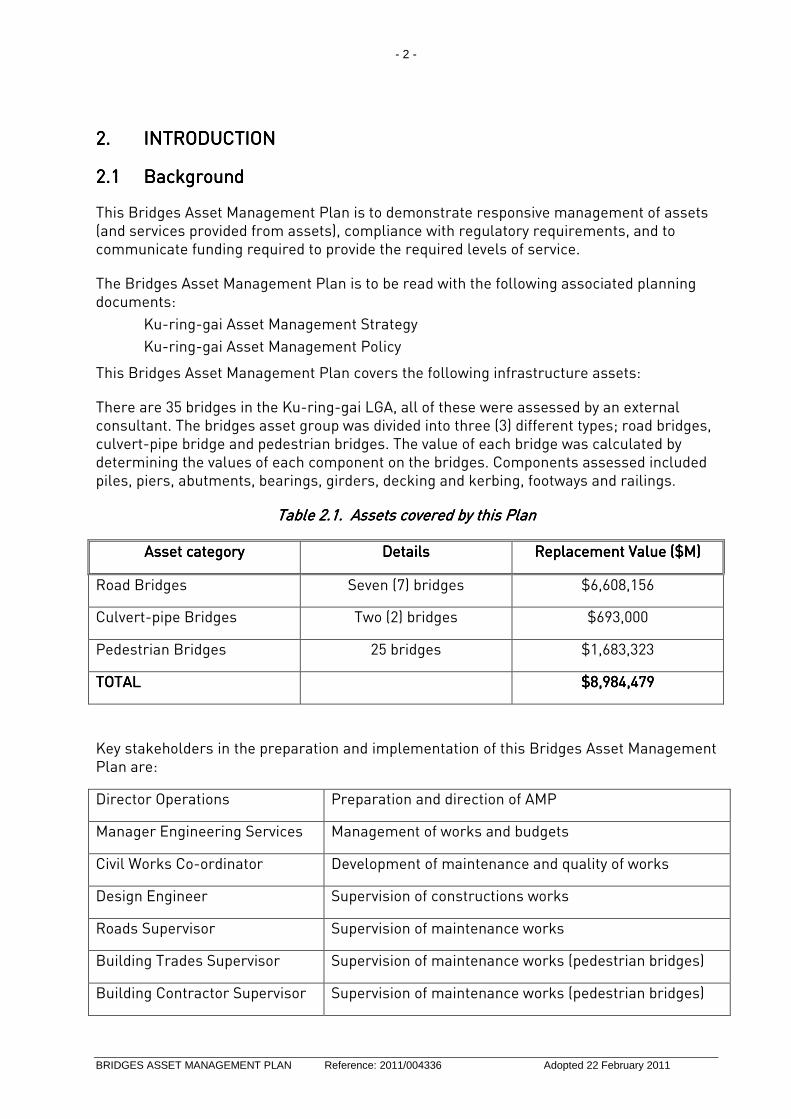
There are 35 bridges in the Ku-ring-gai LGA, all of these were assessed by an external consultant. The bridges asset group was divided into three (3) different types; road bridges, culvert-pipe bridge and pedestrian bridges. The value of each bridge was calculated by determining the values of each component on the bridges. Components assessed included piles, piers, abutments, bearings, girders, decking and kerbing, footways and railings.
Table 2.1. Assets covered by this PlanTable 2.1. Assets covered by this PlanTable 2.1. Assets covered by this PlanTable 2.1. Assets covered by this Plan
Asset categoryAsset categoryAsset categoryAsset category DetDetDetDetailsailsailsails Replacement Value ($M)Replacement Value ($M)Replacement Value ($M)Replacement Value ($M)
Key stakeholders in the preparation and implementation of this Bridges Asset Management Plan are:
Director Operations Preparation and direction of AMP
Manager Engineering Services Management of works and budgets
Civil Works Co-ordinator Development of maintenance and quality of works
Design Engineer Supervision of constructions works
Roads Supervisor Supervision of maintenance works
Building Trades Supervisor Supervision of maintenance works (pedestrian bridges)
Building Contractor Supervisor Supervision of maintenance works (pedestrian bridges)
- 3 -
BRIDGES ASSET MANAGEMENT PLAN Reference: 2011/004336 Adopted 22 February 2011
2222.2.2.2.2 Goals and Objectives ofGoals and Objectives ofGoals and Objectives ofGoals and Objectives of Asset Management Asset Management Asset Management Asset Management
The Council exists to provide services to its community. Some of these services are provided by infrastructure assets. Council has acquired infrastructure assets by ‘purchase’, by contract, construction by Council staff and by donation of assets constructed by developers and others to meet increased levels of service.
Council’s goal in managing infrastructure assets is to meet the required level of service in the most cost effective manner for present and future consumers. The key elements of infrastructure asset management is:
• taking a life cycle approach,
• developing cost-effective management strategies for the long term,
• providing a defined level of service and monitoring performance,
• understanding and meeting the demands of growth through demand management and infrastructure investment,
• managing risks associated with asset failures,
• sustainable use of physical resources, and
• continuous improvement in asset management practices.1
This Bridges Asset Management Plan is prepared under the direction of Council’s vision, mission, goals and objectives.
Council’s vision is:
Ku-ring-gai will be a creative, vibrant place where citizens respect each other and conserve the magnificent environment and society for our children and grandchildren.
Council’s mission is:
Ensure its assets are sustainable and sufficient funding is provided to maintain them at a satisfactory standard.
1 IIMM 2006 Sec 1.1.3, p 1.3
- 4 -
BRIDGES ASSET MANAGEMENT PLAN Reference: 2011/004336 Adopted 22 February 2011
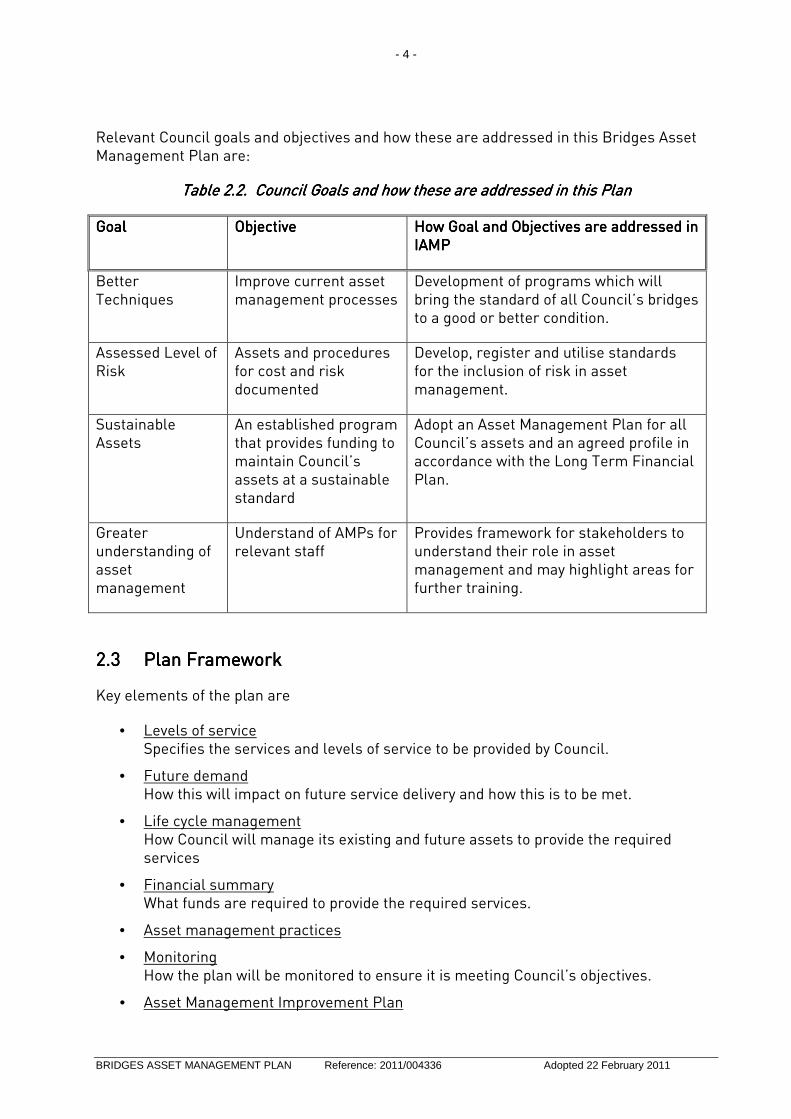
Relevant Council goals and objectives and how these are addressed in this Bridges Asset Management Plan are:
Table 2.2. CounTable 2.2. CounTable 2.2. CounTable 2.2. Council Goals and how these are addressed in this Plancil Goals and how these are addressed in this Plancil Goals and how these are addressed in this Plancil Goals and how these are addressed in this Plan
GoalGoalGoalGoal ObjectiveObjectiveObjectiveObjective How Goal and Objectives are addressed in How Goal and Objectives are addressed in How Goal and Objectives are addressed in How Goal and Objectives are addressed in IAMPIAMPIAMPIAMP
Better Techniques
Improve current asset management processes
Development of programs which will bring the standard of all Council’s bridges to a good or better condition.
Assessed Level of Risk
Assets and procedures for cost and risk documented
Develop, register and utilise standards for the inclusion of risk in asset management.
Sustainable Assets
An established program that provides funding to maintain Council’s assets at a sustainable standard
Adopt an Asset Management Plan for all Council’s assets and an agreed profile in accordance with the Long Term Financial Plan.
Greater understanding of asset management
Understand of AMPs for relevant staff
Provides framework for stakeholders to understand their role in asset management and may highlight areas for further training.
2222.3.3.3.3 Plan FrameworkPlan FrameworkPlan FrameworkPlan Framework
Key elements of the plan are
• Levels of service Specifies the services and levels of service to be provided by Council.
• Future demand How this will impact on future service delivery and how this is to be met.
• Life cycle management How Council will manage its existing and future assets to provide the required services
• Financial summary What funds are required to provide the required services.
• Asset management practices
• Monitoring How the plan will be monitored to ensure it is meeting Council’s objectives.
• Asset Management Improvement Plan
- 5 -
BRIDGES ASSET MANAGEMENT PLAN Reference: 2011/004336 Adopted 22 February 2011
A road map for preparing an Asset Management Plan is shown below.
Road Map for preparing an Asset Management Plan Source: IIMM Fig 1.5.1, p 1.11
IS THE PLAN
AFFORDABLE?
CORPORATE PLANNING
Confirm strategic objectives and establish AM
policies, strategies & goals.
Define responsibilities & ownership.
Decide core or advanced AM Pan.
Gain organisation commitment.
REVIEW/COLLATE ASSET INFORMATION
Existing information sources
Identify & describe assets.
Data collection
Condition assessments
Performance monitoring
Valuation Data
ESTABLISH LEVELS OF SERVICE
Establish strategic linkages
Define & adopt statements
Establish measures & targets
Consultation
LIFECYCLE MANAGEMENT STRATEGIES
Develop lifecycle strategies
Describe service delivery strategy
Risk management strategies
Demand forecasting and management
Optimised decision making (renewals, new works,
disposals)
Optimise maintenance strategies
FINANCIAL FORECASTS
Lifecycle analysis
Financial forecast summary
Valuation Depreciation
Funding
IMPROVEMENT PLAN
Assess current/desired practices
Develop improvement plan
ITERATION
Reconsider service statements
Options for funding
Consult with Council
Consult with Community
DEFINE SCOPE &
STRUCTURE OF PLAN
AM PLAN
REVIEW AND
AUDIT
IMPLEMENT
IMPROVEMENT
STRATEGY
ANNUAL PLAN /
BUSINESS PLAN
- 6 -
BRIDGES ASSET MANAGEMENT PLAN Reference: 2011/004336 Adopted 22 February 2011
2222.4.4.4.4 Core and Advanced Asset ManagementCore and Advanced Asset ManagementCore and Advanced Asset ManagementCore and Advanced Asset Management
This Bridges Asset Management Plan is prepared as a ‘core’ Asset Management Plan in accordance with the International Infrastructure Management Manual. It is prepared to meet minimum legislative and organisational requirements for sustainable service delivery and long term financial planning and reporting. Core asset management is a ‘top down’ approach where analysis is applied at the ‘system’ or ‘network’ level.
Future revisions of this Bridges Asset Management Plan will move towards ‘advanced’ asset management using a ‘bottom up’ approach for gathering asset information for individual assets to support the optimisation of activities and programs to meet agreed service levels.
- 7 -
BRIDGES ASSET MANAGEMENT PLAN Reference: 2011/004336 Adopted 22 February 2011
3333.... LEVELS OF SERVICELEVELS OF SERVICELEVELS OF SERVICELEVELS OF SERVICE
3333.1.1.1.1 CustomerCustomerCustomerCustomer Research and Expectations Research and Expectations Research and Expectations Research and Expectations
Council has not carried out any research on customer expectations. While surveys of footpaths and roads have been completed, no investigation explicitly into Council’s bridges network has been conducted. This will be investigated for future updates of the Bridges Asset Management Plan.
All resident feedback surveys and customer requests will be used in developing the Strategic Management Plan and in allocation of resources in the budget.
Local Government Act Sets out role, purpose, responsibilities and powers of local governments including the preparation of a Long Term Financial Plan supported by Asset Management Plans for sustainable service delivery.
Roads Act Sets out role, purpose, responsibilities and powers of local governments relating to the management and control of road assets.
Occupational Health, Safety & Welfare Act
Sets out roles and responsibilities to secure the health, safety and welfare of persons at work.
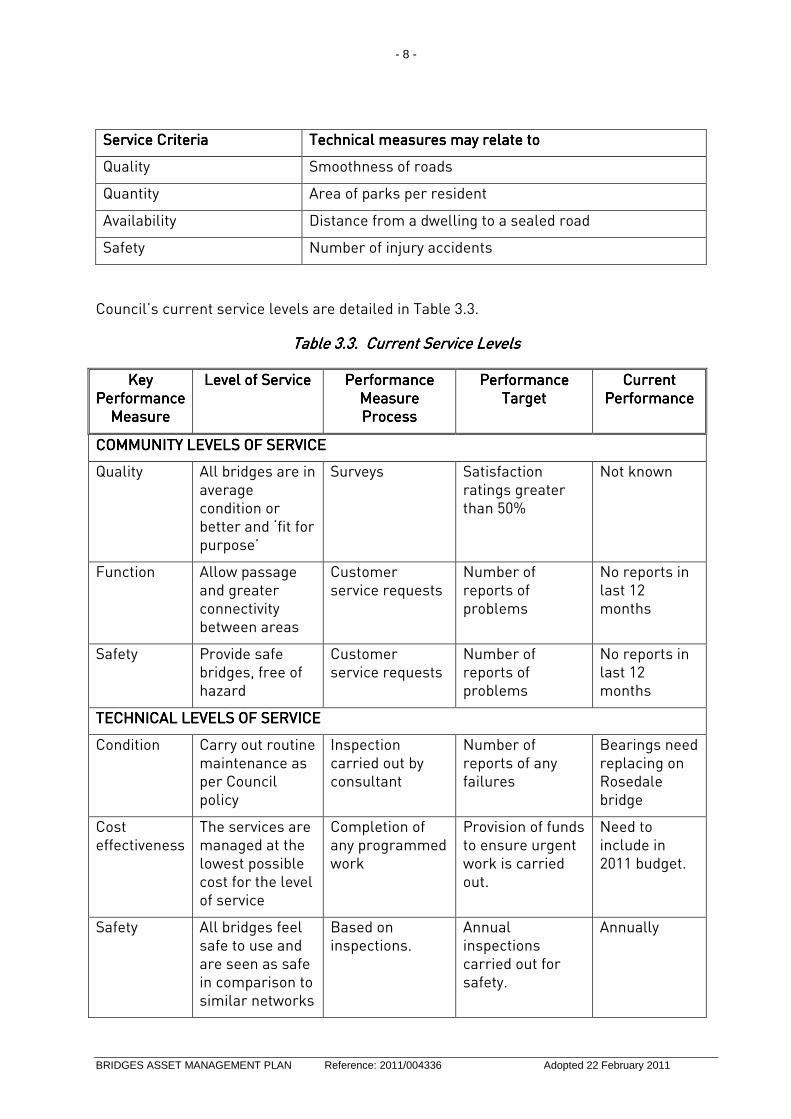
3333....3333 Current Levels of ServiceCurrent Levels of ServiceCurrent Levels of ServiceCurrent Levels of Service
Council has defined service levels in two (2) terms.
Community levels of service relate to how the community receives the service in terms of safety, quality, quantity, reliability, responsiveness, cost / efficiency and legislative compliance.
Supporting the community service levels are operational or technical measures of performance developed to ensure that the minimum Community levels of service are met.
These technical measures relate to service criteria such as:
- 8 -
BRIDGES ASSET MANAGEMENT PLAN Reference: 2011/004336 Adopted 22 February 2011
Service CriteriaService CriteriaService CriteriaService Criteria Technical measures may relate toTechnical measures may relate toTechnical measures may relate toTechnical measures may relate to
Quality Smoothness of roads
Quantity Area of parks per resident
Availability Distance from a dwelling to a sealed road
Safety Number of injury accidents
Council’s current service levels are detailed in Table 3.3.
Table Table Table Table 3333....3333. Current Service Levels. Current Service Levels. Current Service Levels. Current Service Levels
Level of ServiceLevel of ServiceLevel of ServiceLevel of Service Performance Performance Performance Performance Measure Measure Measure Measure ProcessProcessProcessProcess
Current Current Current Current PerformancePerformancePerformancePerformance
COMMUNITY LEVELS OF SERVICECOMMUNITY LEVELS OF SERVICECOMMUNITY LEVELS OF SERVICECOMMUNITY LEVELS OF SERVICE
Quality All bridges are in average condition or better and ‘fit for purpose’
Surveys Satisfaction ratings greater than 50%
Not known
Function Allow passage and greater connectivity between areas
Customer service requests
Number of reports of problems
No reports in last 12 months
Safety Provide safe bridges, free of hazard
Customer service requests
Number of reports of problems
No reports in last 12 months
TECHNICAL LEVELS OF SERVICETECHNICAL LEVELS OF SERVICETECHNICAL LEVELS OF SERVICETECHNICAL LEVELS OF SERVICE
Condition Carry out routine maintenance as per Council policy
Inspection carried out by consultant
Number of reports of any failures
Bearings need replacing on Rosedale bridge
Cost effectiveness
The services are managed at the lowest possible cost for the level of service
Completion of any programmed work
Provision of funds to ensure urgent work is carried out.
Need to include in 2011 budget.
Safety All bridges feel safe to use and are seen as safe in comparison to similar networks
Based on inspections.
Annual inspections carried out for safety.
Annually
- 9 -
BRIDGES ASSET MANAGEMENT PLAN Reference: 2011/004336 Adopted 22 February 2011
3333....4444 Desired Levels of ServiceDesired Levels of ServiceDesired Levels of ServiceDesired Levels of Service
At present, the desired levels of service is reactive and based on any requests for action. When Council considers all the issues associated with their assets, it can then determine what funding levels need to be provided annually for its bridges. A new cost centre has been created for bridge maintenance but further work is required to determine the annual level of funding. This will be done in future revisions of this Bridges Asset Management Plan.
As bridges are a critical asset, any urgent work will need immediate attention at the expense of other assets.
- 10 -
BRIDGES ASSET MANAGEMENT PLAN Reference: 2011/004336 Adopted 22 February 2011
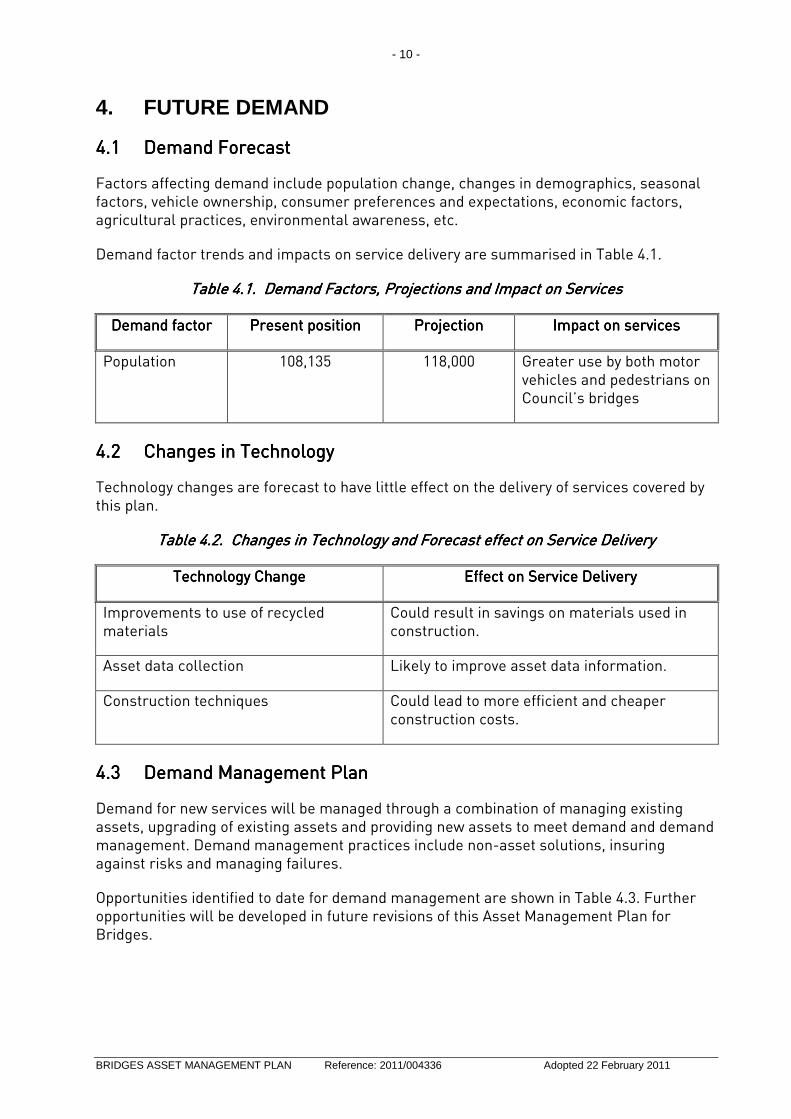
Factors affecting demand include population change, changes in demographics, seasonal factors, vehicle ownership, consumer preferences and expectations, economic factors, agricultural practices, environmental awareness, etc.
Demand factor trends and impacts on service delivery are summarised in Table 4.1.
Table Table Table Table 4444.1. Demand Factors, Projections and Impact on Services.1. Demand Factors, Projections and Impact on Services.1. Demand Factors, Projections and Impact on Services.1. Demand Factors, Projections and Impact on Services
Demand factorDemand factorDemand factorDemand factor Present positionPresent positionPresent positionPresent position ProjectionProjectionProjectionProjection Impact on servicesImpact on servicesImpact on servicesImpact on services
Population 108,135 118,000 Greater use by both motor vehicles and pedestrians on Council’s bridges
4444.2.2.2.2 Changes in TechnologyChanges in TechnologyChanges in TechnologyChanges in Technology
Technology changes are forecast to have little effect on the delivery of services covered by this plan.
Table Table Table Table 4444.2. Changes in Technology and Forecast effect on Service Deliv.2. Changes in Technology and Forecast effect on Service Deliv.2. Changes in Technology and Forecast effect on Service Deliv.2. Changes in Technology and Forecast effect on Service Deliveryeryeryery
Technology ChangeTechnology ChangeTechnology ChangeTechnology Change Effect on Service DeliveryEffect on Service DeliveryEffect on Service DeliveryEffect on Service Delivery
Improvements to use of recycled materials
Could result in savings on materials used in construction.
Asset data collection Likely to improve asset data information.
Construction techniques Could lead to more efficient and cheaper construction costs.
4444.3.3.3.3 Demand Management PlanDemand Management PlanDemand Management PlanDemand Management Plan
Demand for new services will be managed through a combination of managing existing assets, upgrading of existing assets and providing new assets to meet demand and demand management. Demand management practices include non-asset solutions, insuring against risks and managing failures.
Opportunities identified to date for demand management are shown in Table 4.3. Further opportunities will be developed in future revisions of this Asset Management Plan for Bridges.
- 11 -
BRIDGES ASSET MANAGEMENT PLAN Reference: 2011/004336 Adopted 22 February 2011
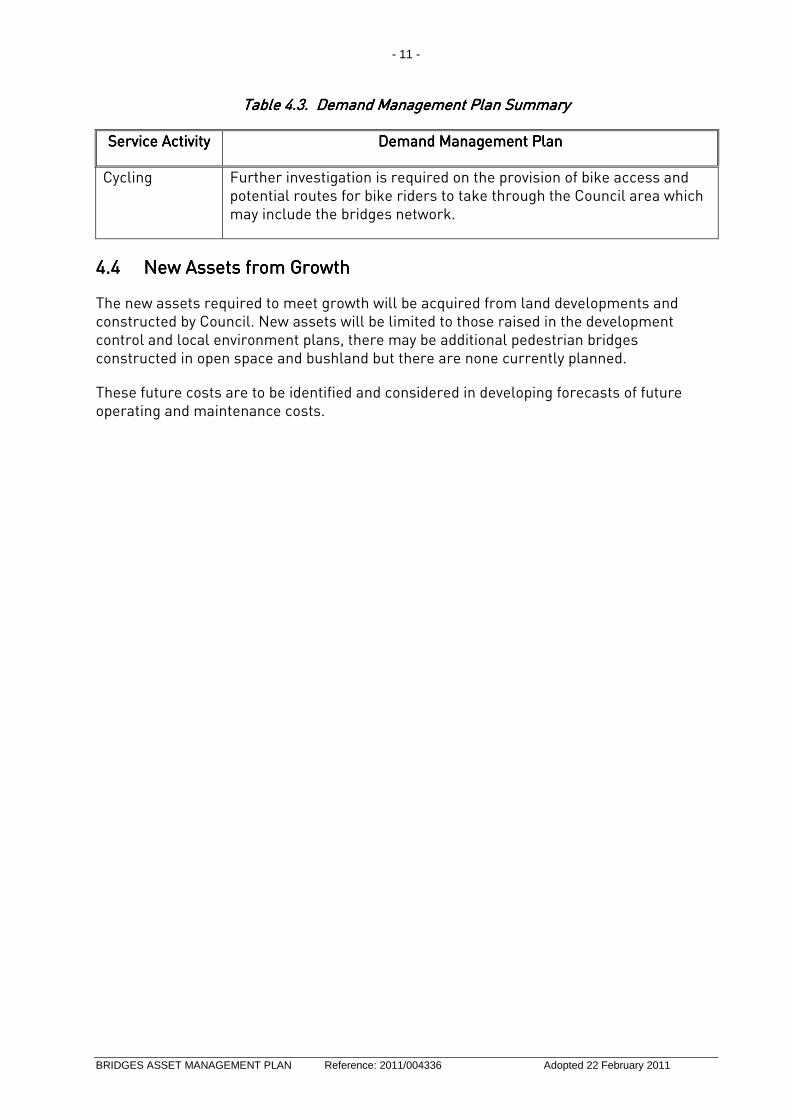
Table Table Table Table 4444.3. Demand Management Plan Summary.3. Demand Management Plan Summary.3. Demand Management Plan Summary.3. Demand Management Plan Summary
Service ActivityService ActivityService ActivityService Activity Demand Management PlanDemand Management PlanDemand Management PlanDemand Management Plan
Cycling Further investigation is required on the provision of bike access and potential routes for bike riders to take through the Council area which may include the bridges network.
4.44.44.44.4 New Assets from GrowthNew Assets from GrowthNew Assets from GrowthNew Assets from Growth
The new assets required to meet growth will be acquired from land developments and constructed by Council. New assets will be limited to those raised in the development control and local environment plans, there may be additional pedestrian bridges constructed in open space and bushland but there are none currently planned.
These future costs are to be identified and considered in developing forecasts of future operating and maintenance costs.
- 12 -
BRIDGES ASSET MANAGEMENT PLAN Reference: 2011/004336 Adopted 22 February 2011
5555.... LIFECYCLE MANAGEMELIFECYCLE MANAGEMELIFECYCLE MANAGEMELIFECYCLE MANAGEMENNNNT PLANT PLANT PLANT PLAN
The lifecycle management plan details how Council plans to manage and operate the assets at the agreed levels of service (defined in Section 3) while optimising life cycle costs.
5555.1.1.1.1 Background DataBackground DataBackground DataBackground Data
The assets covered by this Bridges Asset Management Plan are shown below:
Road Bridges Bridges which allow the movement of motor vehicles through the area.
Culvert-pipe Bridges Bridges which allows stormwater drainage to flow over or through an area, there is no access for people.
Pedestrian Bridges Bridges which allow pedestrians easier movement through an area. Not accessible by motor vehicles.
Bridges are further divided into components to attain a fair value for each part of each bridge. Bridges are widely distributed throughout the local government area and depending on their function are made from a wide variety of materials.
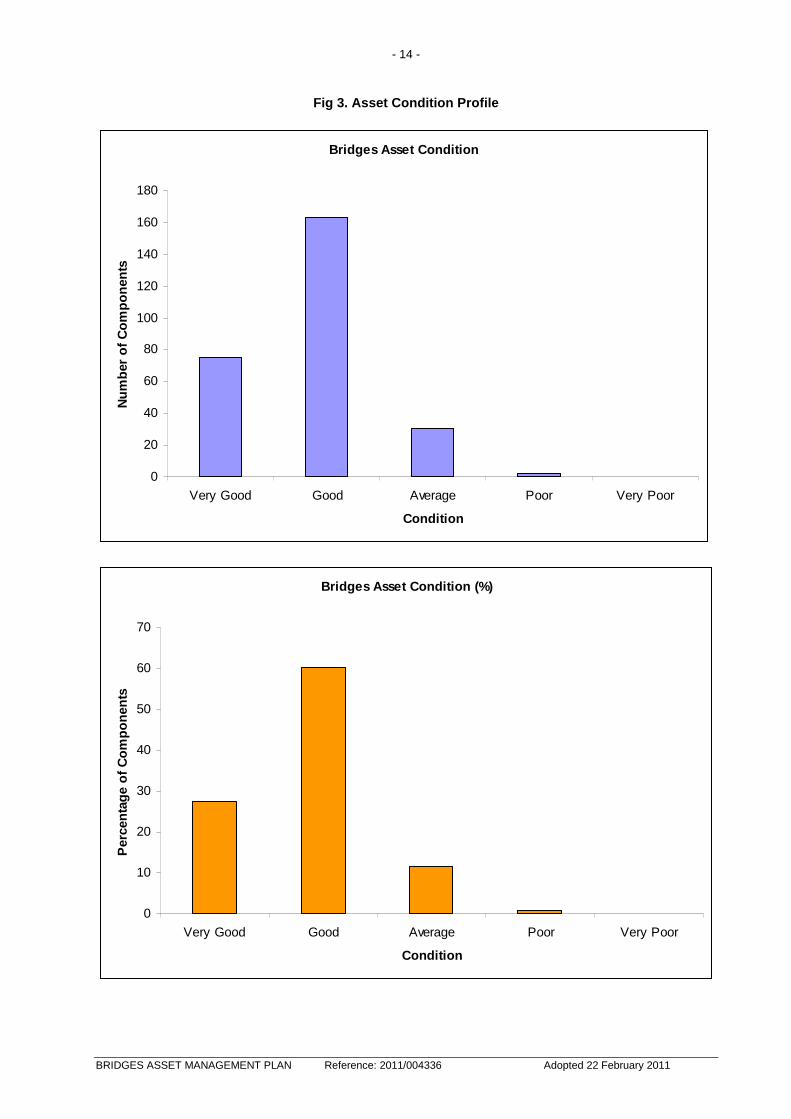
The bridges network is in better condition than many other asset groups with few components with conditions worse than average and no components with a rating of very poor.
A large amount of Councils’ bridges components were rated as good or very good.
- 13 -
BRIDGES ASSET MANAGEMENT PLAN Reference: 2011/004336 Adopted 22 February 2011
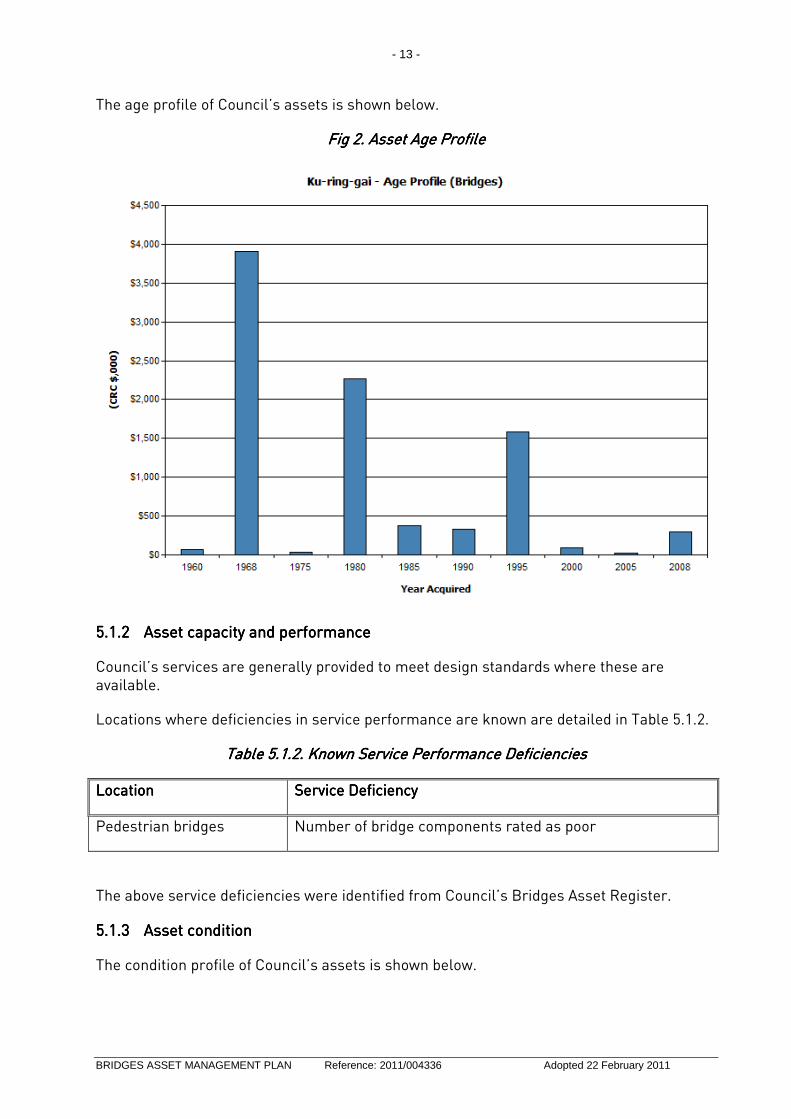
The age profile of Council’s assets is shown below.
Fig Fig Fig Fig 2222. . . . Asset Asset Asset Asset Age Age Age Age ProfileProfileProfileProfile
5555.1.2.1.2.1.2.1.2 Asset capacity and performanceAsset capacity and performanceAsset capacity and performanceAsset capacity and performance
Council’s services are generally provided to meet design standards where these are available.
Locations where deficiencies in service performance are known are detailed in Table 5.1.2.
Table Table Table Table 5555.1.2. Known Service Performance Deficiencies.1.2. Known Service Performance Deficiencies.1.2. Known Service Performance Deficiencies.1.2. Known Service Performance Deficiencies
LocationLocationLocationLocation Service DeService DeService DeService Deficiencyficiencyficiencyficiency
Pedestrian bridges Number of bridge components rated as poor
The above service deficiencies were identified from Council’s Bridges Asset Register.
The value of assets as at 7th May 2010 covered by this Bridges Asset Management Plan is summarised below. Assets were last revalued at 3oth June 2010. Assets are valued at brownfield rates.
Current Replacement Cost $8,981,923
Fair Value (Depreciable Amount) $6,727,603
Depreciated Replacement Cost $2,254,651.15
Annual Depreciation Expense $162,912
Council’s sustainability reporting reports the rate of annual asset consumption and compares this to asset renewal and asset upgrade and expansion.
Asset Consumption 1.81%
Asset renewal 0.0%
Annual Upgrade/expansion 0.0%
5555.2.2.2.2 RRRRisk Management Planisk Management Planisk Management Planisk Management Plan
An assessment of risks3 associated with service delivery from infrastructure assets has identified critical risks to Council. The risk assessment process identifies credible risks,
2 IIMM 2006, Appendix B, p B:1-3 (‘cyclic’ modified to ‘planned’) 3 Risk Management Plan 2009/162222
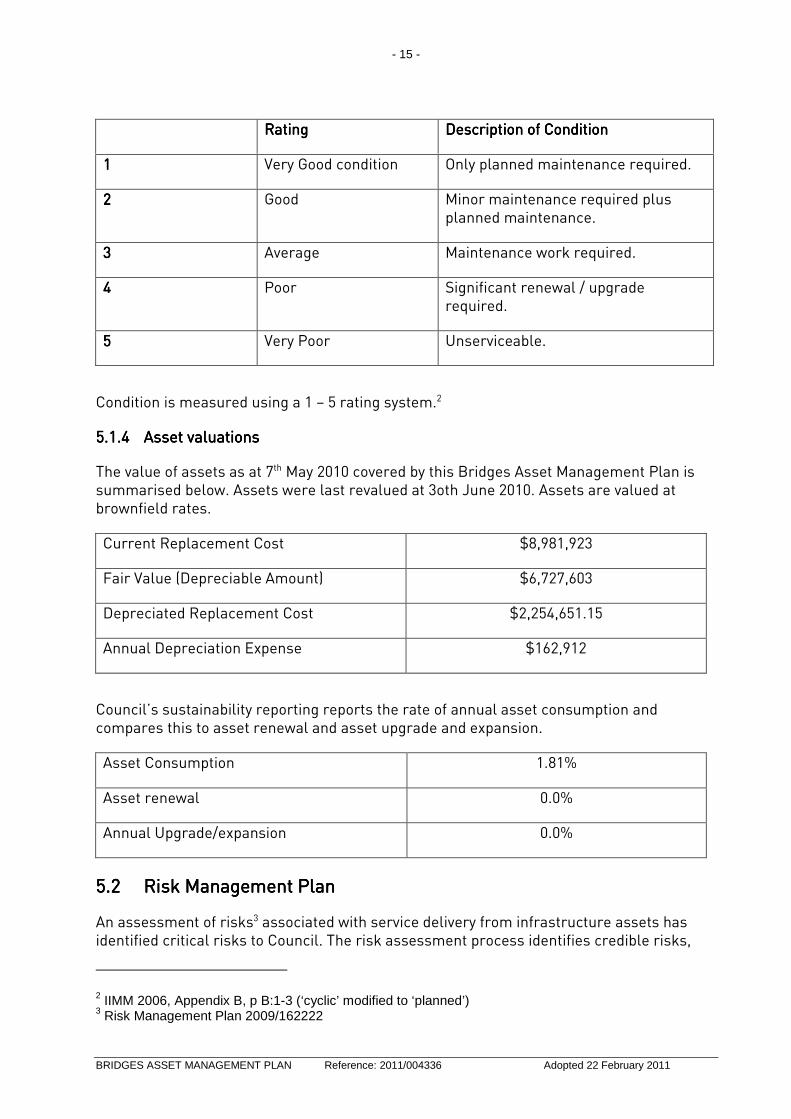
RatingRatingRatingRating Description of ConditionDescription of ConditionDescription of ConditionDescription of Condition
1111 Very Good condition Only planned maintenance required.
2222 Good Minor maintenance required plus planned maintenance.
3333 Average Maintenance work required.
4444 Poor Significant renewal / upgrade required.
5555 Very Poor Unserviceable.
- 16 -
BRIDGES ASSET MANAGEMENT PLAN Reference: 2011/004336 Adopted 22 February 2011
the likelihood of the risk event occurring, the consequences should the event occur, develops a risk rating, evaluates the risk and develops a risk treatment plan for non-acceptable risks.
Critical risks, being those assessed as
‘Very High’ - requiring immediate corrective action, and
‘High’ - requiring prioritised corrective action
are identified in the Infrastructure Risk Management Plan which are summarised following in Table 5.2.
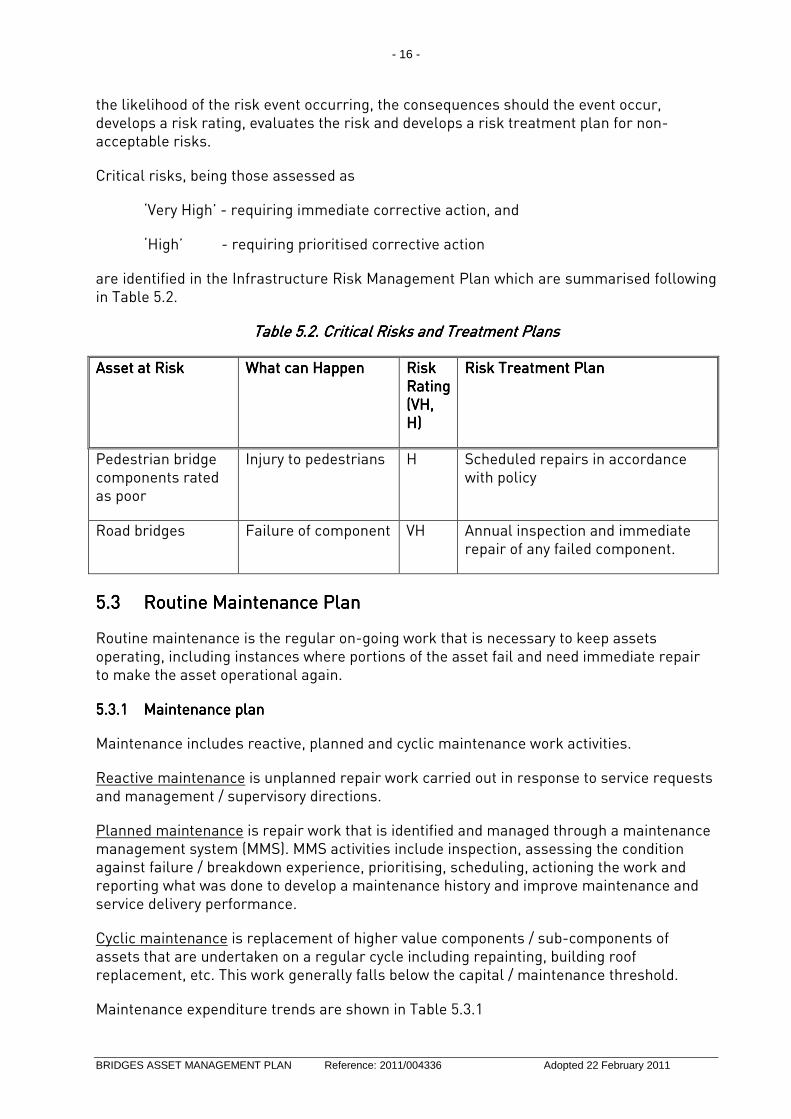
Table Table Table Table 5555.2. .2. .2. .2. Critical Risks and Treatment PlansCritical Risks and Treatment PlansCritical Risks and Treatment PlansCritical Risks and Treatment Plans
Asset at Asset at Asset at Asset at RiskRiskRiskRisk What can HappenWhat can HappenWhat can HappenWhat can Happen Risk Risk Risk Risk RatingRatingRatingRating (VH, (VH, (VH, (VH, H)H)H)H)
Risk Treatment PlanRisk Treatment PlanRisk Treatment PlanRisk Treatment Plan
Pedestrian bridge components rated as poor
Injury to pedestrians H Scheduled repairs in accordance with policy
Road bridges Failure of component VH Annual inspection and immediate repair of any failed component.
5555....3333 Routine Maintenance PlanRoutine Maintenance PlanRoutine Maintenance PlanRoutine Maintenance Plan
Routine maintenance is the regular on-going work that is necessary to keep assets operating, including instances where portions of the asset fail and need immediate repair to make the asset operational again.
5555.3.1.3.1.3.1.3.1 MMMMaintenance planaintenance planaintenance planaintenance plan
Maintenance includes reactive, planned and cyclic maintenance work activities.
Reactive maintenance is unplanned repair work carried out in response to service requests and management / supervisory directions.
Planned maintenance is repair work that is identified and managed through a maintenance management system (MMS). MMS activities include inspection, assessing the condition against failure / breakdown experience, prioritising, scheduling, actioning the work and reporting what was done to develop a maintenance history and improve maintenance and service delivery performance.
Cyclic maintenance is replacement of higher value components / sub-components of assets that are undertaken on a regular cycle including repainting, building roof replacement, etc. This work generally falls below the capital / maintenance threshold.
Maintenance expenditure trends are shown in Table 5.3.1
- 17 -
BRIDGES ASSET MANAGEMENT PLAN Reference: 2011/004336 Adopted 22 February 2011
Planned maintenance work is 100% of total maintenance expenditure. Much of the maintenance work on road bridges is accounted for in the roads maintenance budget.
Maintenance expenditure levels are considered to be adequate OR inadequate to meet required service levels. Future revision of this Bridges Asset Management Plan will include linking required maintenance expenditures with required service levels.
Assessment and prioritisation of reactive maintenance is undertaken by Council staff using experience and judgement.
5555.3.2.3.2.3.2.3.2 Standards and specificationsStandards and specificationsStandards and specificationsStandards and specifications
Maintenance work is carried out in accordance with the Australian Standards and Specifications.
5555.3.3.3.3.3.3.3.3 Summary of future Summary of future Summary of future Summary of future maintenance maintenance maintenance maintenance expendituresexpendituresexpendituresexpenditures
Future maintenance expenditure is forecast to trend in line with the value of the asset stock as shown in Fig 4.
Note that all costs are shown in current 2009/10 dollar values.
- 18 -
BRIDGES ASSET MANAGEMENT PLAN Reference: 2011/004336 Adopted 22 February 2011
Deferred maintenance is work that is identified for maintenance and unable to be funded. These are to be included in the risk assessment process in the Infrastructure Risk Management Plan.
Maintenance is funded from Council’s operating budget and grants where available. This is further discussed in Section 6.2.
5555....4444 Renewal/Replacement PlanRenewal/Replacement PlanRenewal/Replacement PlanRenewal/Replacement Plan
Renewal expenditure is major work which does not increase the asset’s design capacity but restores, rehabilitates, replaces or renews an existing asset to its original service potential. Work over and above restoring an asset to original service potential is upgrade / expansion or new works expenditure.
5555.4.1.4.1.4.1.4.1 Renewal planRenewal planRenewal planRenewal plan
Assets requiring renewal are identified from estimates of remaining life obtained from the asset register worksheets on the ‘Planned Expenditure template’. Candidate proposals are inspected to verify accuracy of remaining life estimate and to develop a preliminary renewal estimate. Verified proposals are ranked by priority and available funds and scheduled in future works programmes.
- 19 -
BRIDGES ASSET MANAGEMENT PLAN Reference: 2011/004336 Adopted 22 February 2011
The ranking of renewal projects is determined differently for each type of bridge. The renewal program will be based on the usage of the bridge and the risk rating. High priority will be given to road bridges where failure will result in no alternative access.
Renewal will be undertaken using replacement of components.
Renewal work is carried out in carried out in accordance with the Australian Standards and Spedifications.
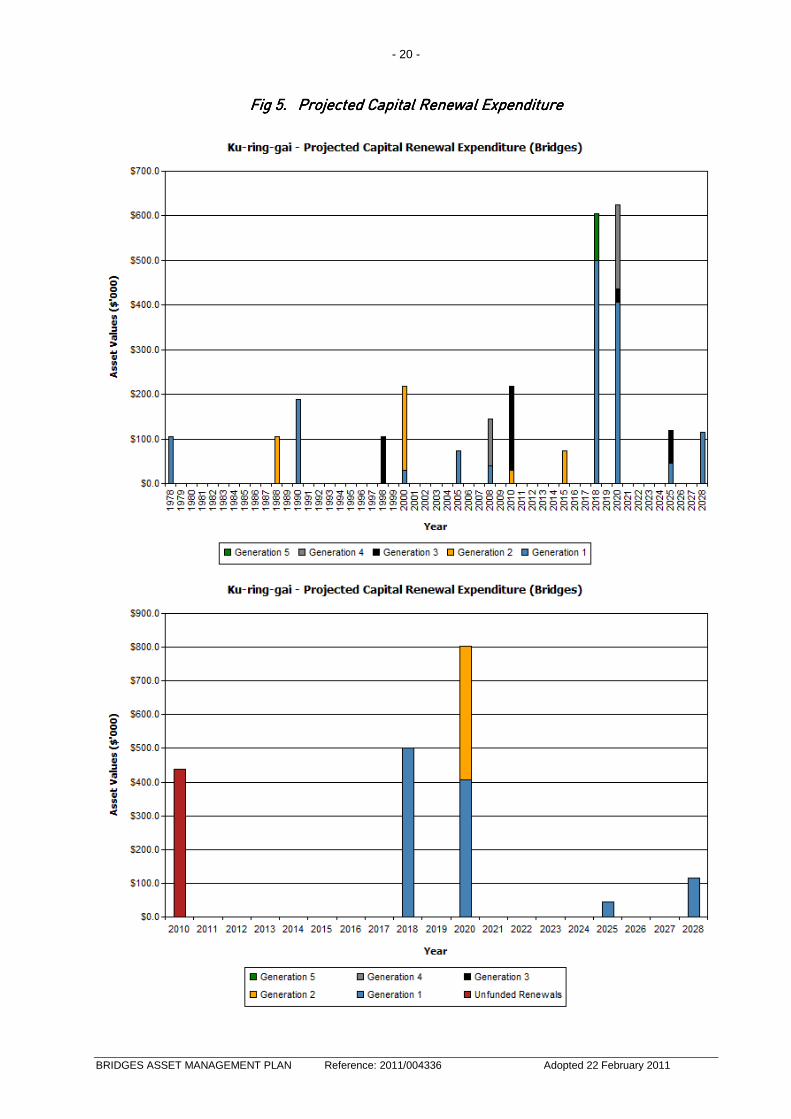
5555.4.3.4.3.4.3.4.3 Summary of future Summary of future Summary of future Summary of future renewal expenditurerenewal expenditurerenewal expenditurerenewal expenditure
Projected future renewal expenditures are forecast to increase over time as the asset stock ages. The costs are summarised in Fig 5.
Note that all costs are shown in current 2009/10 dollar values.
- 20 -
BRIDGES ASSET MANAGEMENT PLAN Reference: 2011/004336 Adopted 22 February 2011
Fig Fig Fig Fig 5555.... Projected Projected Projected Projected Capital Capital Capital Capital Renewal Renewal Renewal Renewal ExpenditureExpenditureExpenditureExpenditure
- 21 -
BRIDGES ASSET MANAGEMENT PLAN Reference: 2011/004336 Adopted 22 February 2011
Deferred renewal, are those assets identified for renewal and not scheduled for renewal in Capital Works Programs are to be included in the risk assessment process in the Risk Management Plan.
Renewals are to be funded from Council’s Capital Works Program and grants where available. This is further discussed in Section 6.2.
5555....5555 Creation/Acquisition/Upgrade PlanCreation/Acquisition/Upgrade PlanCreation/Acquisition/Upgrade PlanCreation/Acquisition/Upgrade Plan
New works are those works that create a new asset that did not previously exist, or works which upgrade or improve an existing asset beyond its existing capacity. They may result from growth, social or environmental needs. Assets may also be acquired at no cost to the Council from land development. These assets from growth are considered in Section 4.4.
New assets and upgrade / expansion of existing assets are identified from various sources such as Councillor or community requests, proposals identified by strategic plans or partnerships with other organisations. Candidate proposals are inspected to verify need and to develop a preliminary renewal estimate.
5555.5.2.5.2.5.2.5.2 Standards and specificationsStandards and specificationsStandards and specificationsStandards and specifications
Standards and specifications for new assets and for upgrade / expansion of existing assets are the same as those for renewal shown in Section 5.4.2.
5555.5.3.5.3.5.3.5.3 Summary of future Summary of future Summary of future Summary of future upgrade/new assets expenditureupgrade/new assets expenditureupgrade/new assets expenditureupgrade/new assets expenditure
Future upgrades and new assets will be considered alongside the development control plan and the local environment plan. Further expenditure into upgrades and new assets will be reconsidered in subsequent Bridges Asset Management Plans.
New assets and services are to be funded from Council’s Capital Works Program and grants where available. This is further discussed in Section 6.2.
5555....6666 DisposDisposDisposDisposal Planal Planal Planal Plan
Disposal includes any activity associated with disposal of a decommissioned asset including sale, demolition or relocation. These assets will be further reinvestigated to determine the required levels of service and see what options are available for alternate service delivery, if any. At the moment there are no bridges assets scheduled for disposal.
Where cashflow projections from asset disposals are not available, these will be developed in future revisions of this Bridges Asset Management Plan.
- 22 -
BRIDGES ASSET MANAGEMENT PLAN Reference: 2011/004336 Adopted 22 February 2011
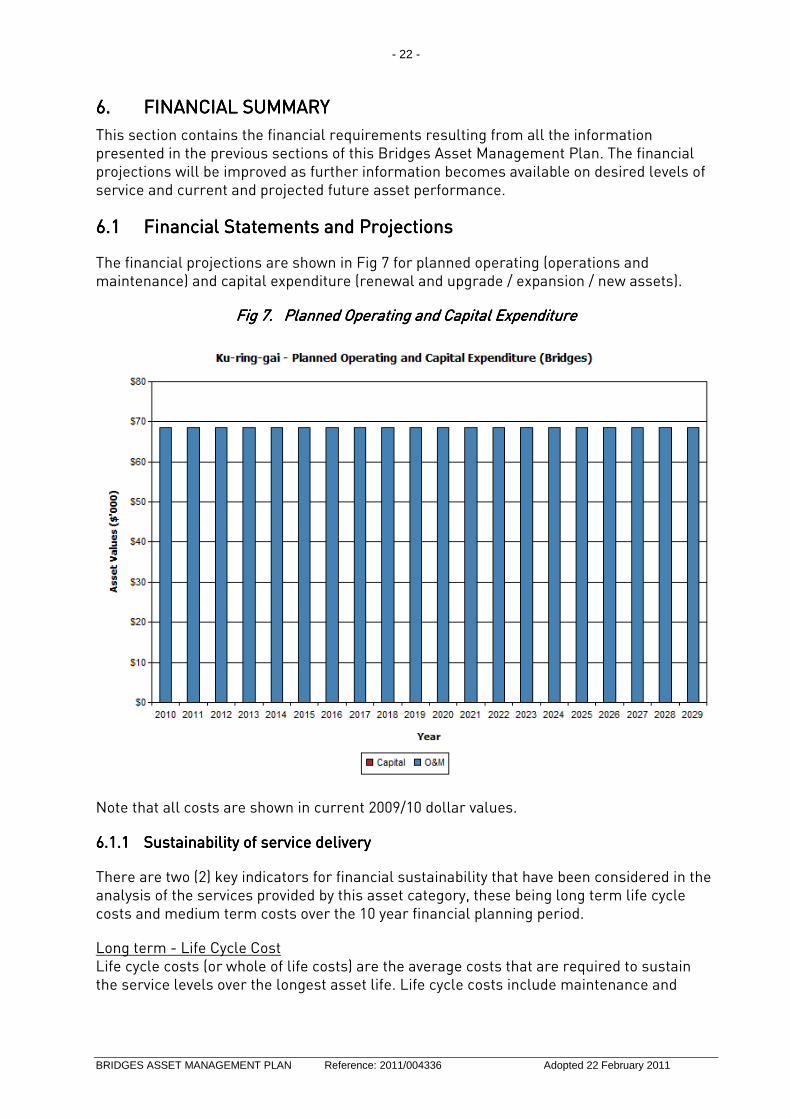
This section contains the financial requirements resulting from all the information presented in the previous sections of this Bridges Asset Management Plan. The financial projections will be improved as further information becomes available on desired levels of service and current and projected future asset performance.
6666.1.1.1.1 Financial Statements and ProjectionsFinancial Statements and ProjectionsFinancial Statements and ProjectionsFinancial Statements and Projections
The financial projections are shown in Fig 7 for planned operating (operations and maintenance) and capital expenditure (renewal and upgrade / expansion / new assets).
Fig Fig Fig Fig 7777.... Planned Planned Planned Planned Operating and Capital ExpenditureOperating and Capital ExpenditureOperating and Capital ExpenditureOperating and Capital Expenditure
Note that all costs are shown in current 2009/10 dollar values.
6666.1.1.1.1.1.1.1.1 Sustainability of service deliverySustainability of service deliverySustainability of service deliverySustainability of service delivery
There are two (2) key indicators for financial sustainability that have been considered in the analysis of the services provided by this asset category, these being long term life cycle costs and medium term costs over the 10 year financial planning period.
Long term - Life Cycle Cost Life cycle costs (or whole of life costs) are the average costs that are required to sustain the service levels over the longest asset life. Life cycle costs include maintenance and
- 23 -
BRIDGES ASSET MANAGEMENT PLAN Reference: 2011/004336 Adopted 22 February 2011
asset consumption (depreciation expense). The annual average life cycle cost for the services covered in this Bridges Asset Management Plan is $162,912.
Life cycle costs can be compared to life cycle expenditure to give an indicator of sustainability in service provision. Life cycle expenditure includes maintenance plus capital renewal expenditure. Life cycle expenditure will vary depending on the timing of asset renewals. The life cycle expenditure at the start of the plan is $68,600.
A gap between life cycle costs and life cycle expenditure gives an indication as to whether present consumers are paying their share of the assets they are consuming each year. The purpose of this Bridges Asset Management Plan is to identify levels of service that the community needs and can afford and develop the necessary Long Term Financial Plans to provide the service in a sustainable manner.
The life cycle gap for services covered by this Bridges Asset Management Plan is $162,912 per annum. The life cycle sustainability index is 0.42.
Medium term – 10 year financial planning period This Bridges Asset Management Plan identifies the estimated maintenance and capital expenditures required to provide an agreed level of service to the community over a 20 year period for input into a 10 year financial plan and funding plan to provide the service in a sustainable manner.
This may be compared to existing or planned expenditures in the 20 year period to identify any gap. In a core Asset Management Plan, a gap is generally due to increasing asset renewals.
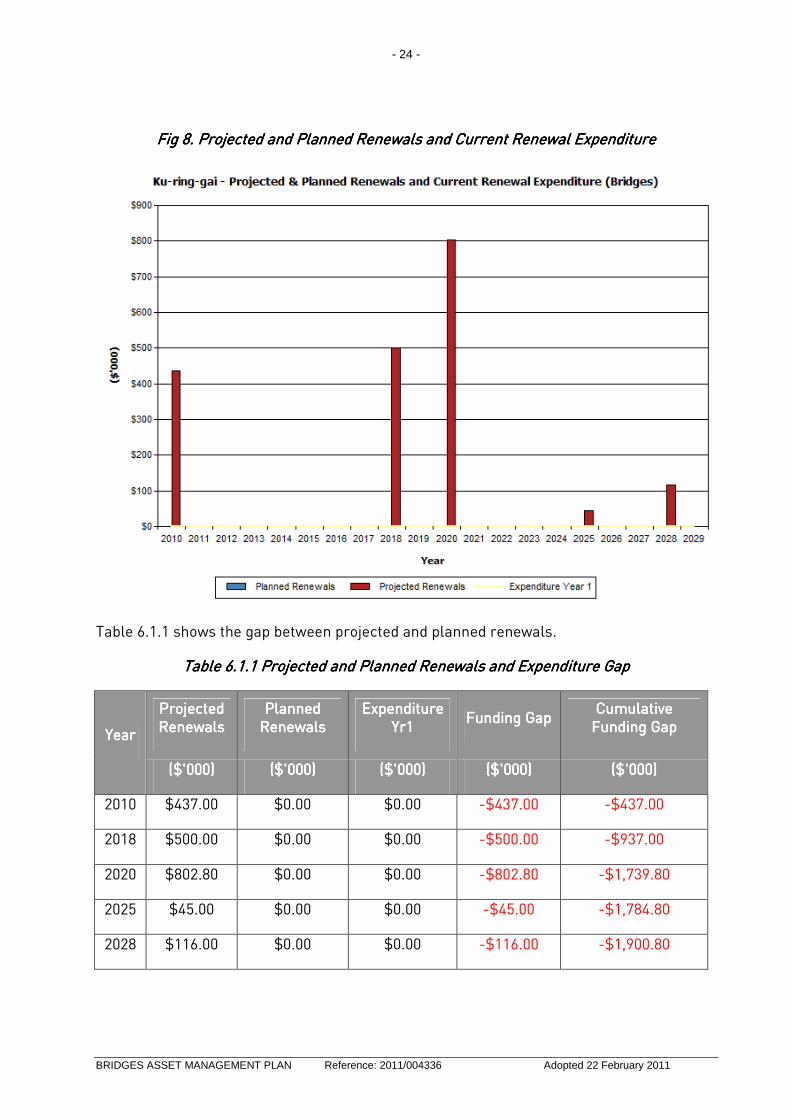
Fig 8 shows the projected asset renewals in the 20 year planning period from the asset register. The projected asset renewals are compared to planned renewal expenditure in the Capital Works Program and capital renewal expenditure in Year 1 of the planning period as shown in Fig 8.
Table 6.1.1 shows the annual and cumulative funding gap between projected and planned renewals.
- 24 -
BRIDGES ASSET MANAGEMENT PLAN Reference: 2011/004336 Adopted 22 February 2011
Fig 8. Projected and Planned Renewals and Current Renewal ExpenditureFig 8. Projected and Planned Renewals and Current Renewal ExpenditureFig 8. Projected and Planned Renewals and Current Renewal ExpenditureFig 8. Projected and Planned Renewals and Current Renewal Expenditure
Table 6.1.1 shows the gap between projected and planned renewals.
Table 6.1.1 Projected and Planned Renewals and ETable 6.1.1 Projected and Planned Renewals and ETable 6.1.1 Projected and Planned Renewals and ETable 6.1.1 Projected and Planned Renewals and Exxxxpenditurependiturependiturependiture GapGapGapGap
BRIDGES ASSET MANAGEMENT PLAN Reference: 2011/004336 Adopted 22 February 2011
Providing services in a sustainable manner will require matching of projected asset renewals to meet agreed service levels with planned Capital Works Programs and available revenue.
A gap between projected asset renewals, planned asset renewals and funding indicates that further work is required to manage required service levels and funding to eliminate any funding gap.
Council will manage the ‘gap’ by developing this Bridges Asset Management Plan to provide guidance on future service levels and resources required to provide these services, and provided Council maintains the funding level shown in the Long Term Financial Plan, then the gap of good bridges to poor bridges should reduce.
Council’s Long Term Financial Plan covers the first 10 years of the 20 year planning period. The total maintenance and capital renewal expenditure required over the 10 years is $16.3 million.
This is an average annual required expenditure of approximately $163,000. Estimated maintenance and capital renewal expenditure in Year 1 is $68,600. The 10 year sustainability index is 0.42.
Projected expenditure identified in Section 6.1 is to be funded from Council’s operating and capital budgets. The funding strategy is detailed in the Council’s 10 year Long Term Financial Plan.
Achieving the financial strategy will require Council to maintain its current level of funding, frequently revisiting the figures to assure they are still relevant.
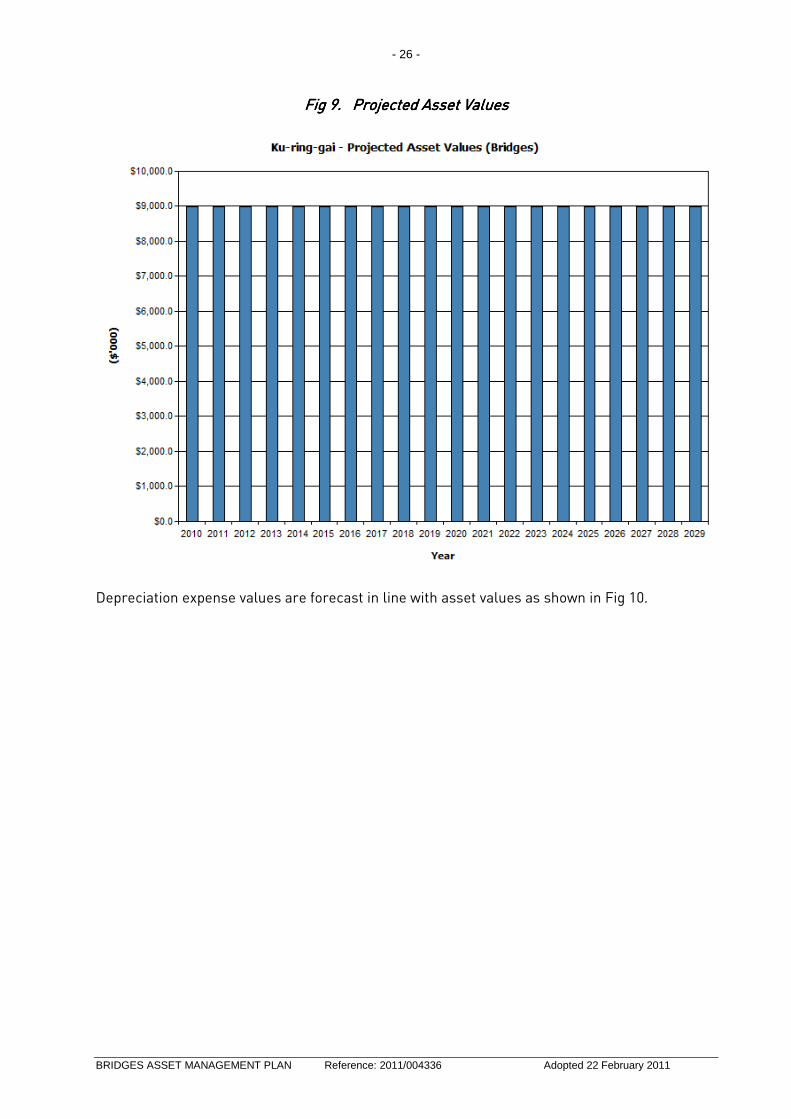
Asset values are forecast to increase as additional assets are added to the asset stock from construction and acquisition by Council and from assets constructed by land developers and others and donated to Council.
Fig 9 shows the projected replacement cost asset values over the planning period.
Note that all costs are shown in current 2009/10 dollar values.
- 26 -
BRIDGES ASSET MANAGEMENT PLAN Reference: 2011/004336 Adopted 22 February 2011
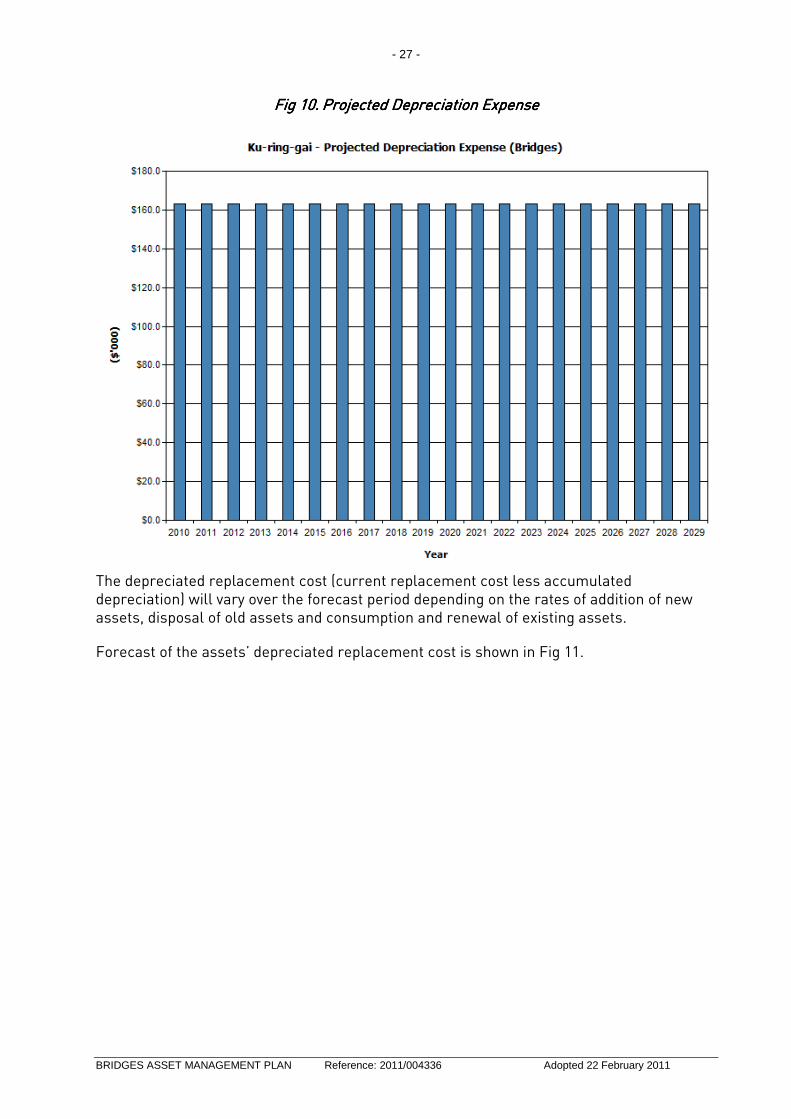
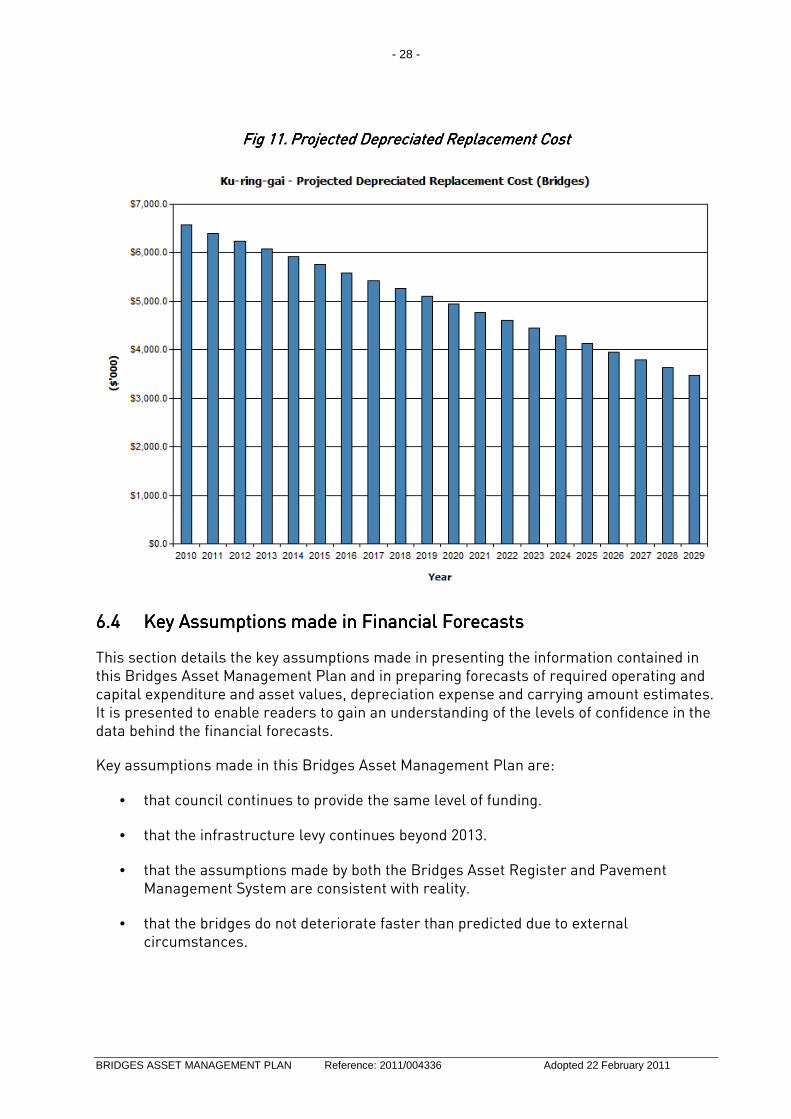
The depreciated replacement cost (current replacement cost less accumulated depreciation) will vary over the forecast period depending on the rates of addition of new assets, disposal of old assets and consumption and renewal of existing assets.
Forecast of the assets’ depreciated replacement cost is shown in Fig 11.
- 28 -
BRIDGES ASSET MANAGEMENT PLAN Reference: 2011/004336 Adopted 22 February 2011
6666.4.4.4.4 Key Assumptions made in Financial ForecastsKey Assumptions made in Financial ForecastsKey Assumptions made in Financial ForecastsKey Assumptions made in Financial Forecasts
This section details the key assumptions made in presenting the information contained in this Bridges Asset Management Plan and in preparing forecasts of required operating and capital expenditure and asset values, depreciation expense and carrying amount estimates. It is presented to enable readers to gain an understanding of the levels of confidence in the data behind the financial forecasts.
Key assumptions made in this Bridges Asset Management Plan are:
• that council continues to provide the same level of funding.
• that the infrastructure levy continues beyond 2013.
• that the assumptions made by both the Bridges Asset Register and Pavement Management System are consistent with reality.
• that the bridges do not deteriorate faster than predicted due to external circumstances.
- 29 -
BRIDGES ASSET MANAGEMENT PLAN Reference: 2011/004336 Adopted 22 February 2011
Accuracy of future financial forecasts may be improved in future revisions of this Bridges Asset Management Plan by the following actions:
• review of the assumptions in the asset management systems.
• review of component useful lives.
• more accurate unit rates become available.
• better construction techniques are employed.
- 30 -
BRIDGES ASSET MANAGEMENT PLAN Reference: 2011/004336 Adopted 22 February 2011
7777.1.1.1.1 Accounting/Financial SystemsAccounting/Financial SystemsAccounting/Financial SystemsAccounting/Financial Systems
Tech One financial systems for recording of actual costs against assets using Works and Assets.
Both Operations and Corporate staff are responsible for recording and allocating costs against assets.
Compliance with International Accounting Standards.
7777.2.2.2.2 Asset Management SystemsAsset Management SystemsAsset Management SystemsAsset Management Systems
Pavement Management System will be used to determine works on roads bridges. All bridge assets are recorded in the Bridges Asset Register (internal reference 2010/133930).
Council is currently investigating ways to integrate the asset register with the financial system
7777.3.3.3.3 Information Flow Information Flow Information Flow Information Flow RequirementsRequirementsRequirementsRequirements and Processes and Processes and Processes and Processes
The key information flows into this Bridges Asset Management Plan are:
• Asset register data on size, age, value, remaining life of the network;
• Unit rates for categories of work / material;
• Adopted service levels;
• Projections of various factors affecting future demand for services;
• Correlations between maintenance and renewal, including decay models;
• Data on new assets acquired by Council.
The key information flows from this Bridges Asset Management Plan are:
• Assumed Works Program and trends;
• Resulting budget, valuation and depreciation projections;
• Useful life analysis.
These will impact the Long Term Financial Plan, Strategic Business Plan, annual budget and departmental business plans and budgets.
7777.4.4.4.4 Standards and GuidelinesStandards and GuidelinesStandards and GuidelinesStandards and Guidelines
Australia Standards and Specifications will be used for any maintenance or upgrade works on bridges.
- 31 -
BRIDGES ASSET MANAGEMENT PLAN Reference: 2011/004336 Adopted 22 February 2011
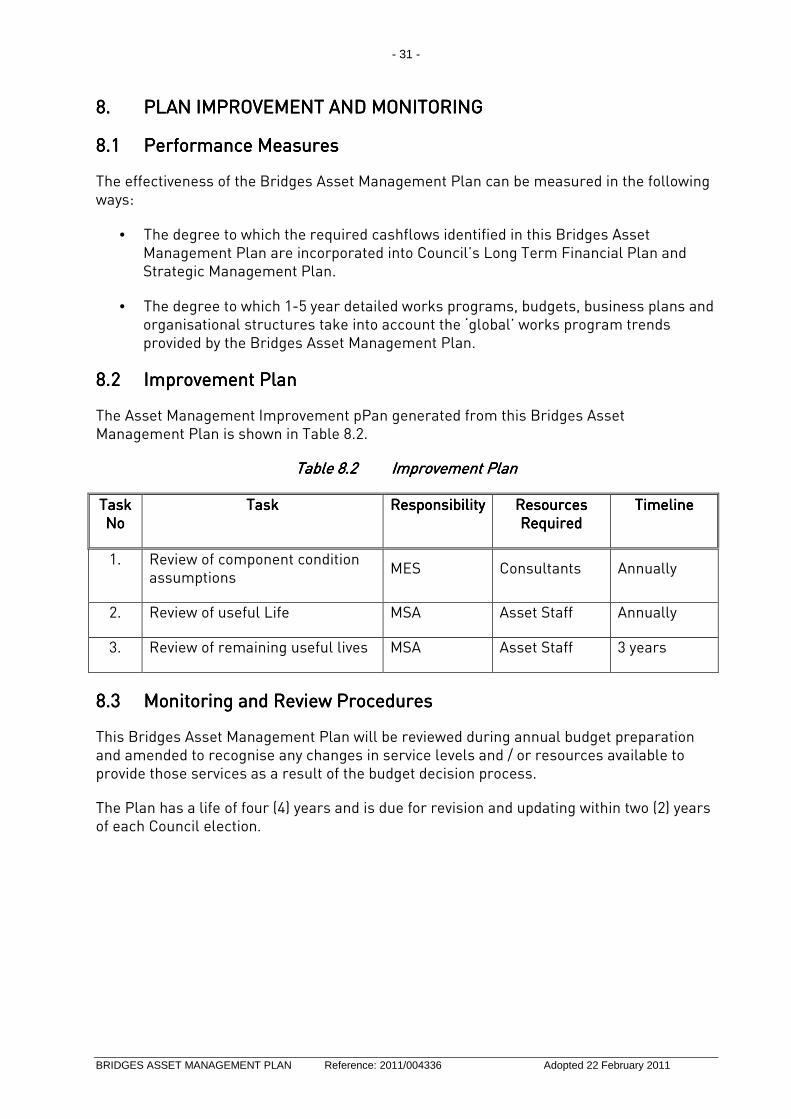
8888.... PLAN IMPROVEMEPLAN IMPROVEMEPLAN IMPROVEMEPLAN IMPROVEMENNNNT AND MONITORINGT AND MONITORINGT AND MONITORINGT AND MONITORING
The effectiveness of the Bridges Asset Management Plan can be measured in the following ways:
• The degree to which the required cashflows identified in this Bridges Asset Management Plan are incorporated into Council’s Long Term Financial Plan and Strategic Management Plan.
• The degree to which 1-5 year detailed works programs, budgets, business plans and organisational structures take into account the ‘global’ works program trends provided by the Bridges Asset Management Plan.
3. Review of remaining useful lives MSA Asset Staff 3 years
8888.3.3.3.3 Monitoring and Review ProceduresMonitoring and Review ProceduresMonitoring and Review ProceduresMonitoring and Review Procedures
This Bridges Asset Management Plan will be reviewed during annual budget preparation and amended to recognise any changes in service levels and / or resources available to provide those services as a result of the budget decision process.
The Plan has a life of four (4) years and is due for revision and updating within two (2) years of each Council election.
- 32 -
BRIDGES ASSET MANAGEMENT PLAN Reference: 2011/004336 Adopted 22 February 2011
9 Conclusion9 Conclusion9 Conclusion9 Conclusion
From the fair value calculations for bridges, the following table provides a summary of the condition of Council’s bridges at 30 June 2010:
Bridge ConditionBridge ConditionBridge ConditionBridge Condition ReReReReplacement Cost ($)placement Cost ($)placement Cost ($)placement Cost ($) Fair Value ($)Fair Value ($)Fair Value ($)Fair Value ($)
The cost to bring Council’s bridge to a satisfactory standard is based on the bridges at a condition less than fair and is the difference between the replacement cost and the fair value for these bridges.
Bridge ConditionBridge ConditionBridge ConditionBridge Condition Replacement Cost ($)Replacement Cost ($)Replacement Cost ($)Replacement Cost ($) Fair Value ($)Fair Value ($)Fair Value ($)Fair Value ($)
Therefore the cost to bring Council’s bridges to a satisfactory standard is $$$$68,000.68,000.68,000.68,000.
For the Long Term Financial Plan the annual depreciation amount for the rate of consumption of Council’s bridges is $$$$162,912162,912162,912162,912....
At this stage it is not proposed to allocate any additional funding for bridge maintenance until all the asset data has been collected and Council can consider the level of funding and the associated risks.
- 33 -
BRIDGES ASSET MANAGEMENT PLAN Reference: 2011/004336 Adopted 22 February 2011
BRIDGES ASSET MANAGEMENT PLAN Reference: 2011/004336 Adopted 22 February 2011
REFERENCESREFERENCESREFERENCESREFERENCES
Sample Council, ‘Strategic Management Plan 2010 – 2011,
Sample Council, ‘Annual Plan and Budget.
DVC, 2006, ‘Asset Investment Guidelines’, ‘Glossary’, Department for Victorian Communities, Local Government Victoria, Melbourne, http://www.dvc.vic.gov.au/web20/dvclgv.nsf/allDocs/RWP1C79EC4A7225CD2FCA257170003259F6?OpenDocument
IPWEA, 2006, ‘International Infrastructure Management Manual’, Institute of Public Works Engineering Australia, Sydney, www.ipwea.org.au
- 35 -
BRIDGES ASSET MANAGEMENT PLAN Reference: 2011/004336 Adopted 22 February 2011