Asset/Liability Management for Life Insurers Contractual Savings Conference – Supervisory and Regulatory Issues in Private Pensions and Life Insurance Presentation by David F. Babbel, Professor Department of Insurance and Risk Management Department of Finance Wharton School, University of Pennsylvania Philadelphia, Pennsylvania USA 19104-6218 [email protected]
Transcript
Asset/Liability Management for Life Insurers
Contractual Savings Conference – Supervisory and Regulatory Issues in Private Pensions and Life Insurance
• Insurers will act according to the economic incentives they face– To maximize share value– To maximize value of owners’ equity– To fulfill managements’ desires
• An insurance policy is a contingent claim to the policyowner– Life insurance cash flows are contingent upon an “event”– “Event” can be precipitated by:
• Policyholder choice• Chance
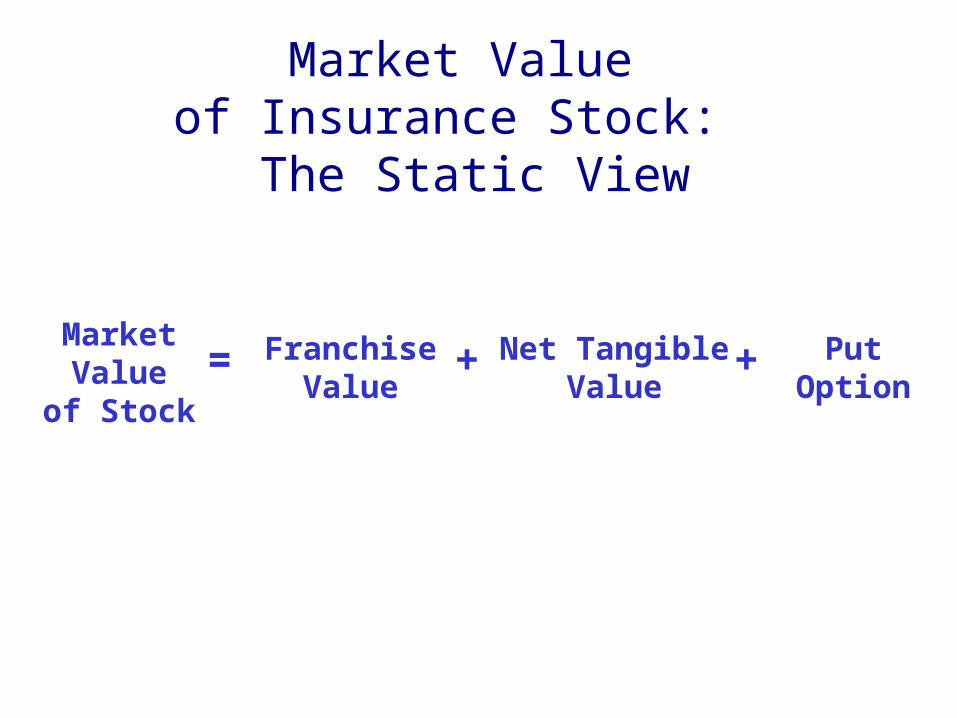
Market Value of Insurance Stock:
The Static View
MarketValue
of Stock
= FranchiseValue
Net TangibleValue
PutOption
+ +
Components of Insurance Stock Market Value– “Economic rents,” present value of future profits– Charter value– Reputation– Distribution network– Personnel
– Market value of tangible assetsless
– Present value of liabilities– Closely related to liquidation value
– The value of issuing debt (i.e., policies) at below-market rates due to the insurance insolvency guarantee programs– The value to equity holders of capturing the upside earnings while not incurring all of the costs of default
Franchise Value
Net Tangible Value
Put Option
{
{{
Risk and the Components of Value
Firm Risk
Firm Risk
Firm Risk
Franchise Value
Market value of tangible assets
Put Option Value
Present value of liabilities
Net Tangible Value
Components of Value Combined
1.0 -
Net Tangible Value
Firm Risk
Franchise Value
Put Option ValueMarket
Value
Net Tangible Value
Goal of Regulatory Policy
“To provide an incentive structure that is consistent with maximizing the value of owners’ equity by having the insurer adopt a low-risk profile.”
Otherwise, the insolvency guarantee programs become mechanisms for rewarding risky firms and subsidizing their behavior by low-risk firms.
Any regulatory action which reduces franchise value will entice some insurers to adopt risky behavior to increase value of owners’ equity.
If regulators can get the incentives right, 90% of their problems will be solved!
Betting the Bank
Insurers most likely to bet the bank have:
– Low franchise value
– Minimal liquidation value
With little to lose, the insurer will bet the bank
– If the bet is won, the owners benefit
– If the bet is lost, others (policyholders, contributors to the various state insolvency guarantee programs, and tax-payers) pick up the tab
The ability to bet the bank will be enhanced if the insurer can hide its true capital situation by inflating statutory surplus
Capital or Crapital?
Substitute future profits for surplus surplus relief reinsurance commission financing
Front load earnings commission financing asset yields higher than expected returns
Engage in actuarial subterfuge high discount rates, aggressive reserving methods low lapse, aggressive mortality & morbidity assumptions
Run up the sales offer high crediting rates, low surrender charges engage in lax underwriting, misprice policies
Insurance Policy as a Contingent Claim
• Triggered by loss or claim– If losses are uncorrelated, risk pooling is appropriate principle and
claims may be satisfied via a diversified investment portfolio
– If claims arise in clusters, based upon loss events and policyholder choices that are highly correlated, the risk pooling principle fails and a diversified investment portfolio is appropriate
• Examples of clustered claims– Policy churning
– SPDAs
– Life policy surrenders, policy loans
Simple Rules of ThumbMay do more harm than good
– MIL and MBS
– Prohibitions of certain investment classes
– Slow to incorporate new investment vehicles
– Duration matching• Basis risk
– Long vs. short-term interest rates– Domestic vs. foreign currencies– Liquid vs. illiquid investments– Taxable vs. tax-free status– Credit quality
• Taking options into account
– Ignoring one side of balance sheet
– Focus on earnings
Market Value of Insurance Stock: The Dynamic View
• Increments to Economic of Surplus depend on gaining positive Net Present Value
• Net present value may arise from asset or liability side of balance sheet
Where does NPV come from?(Developed Countries Version)
• Asset Side?– Very unlikely
– Perhaps after the fact• Unrealized credit risk
• Economic environment changed
• Liability Side?– Theoretically likely– Depends on pricing
Surplus Value of perpetual business = $1 million ÷ 10% = $10 million
Voila!
In summary...
Regulators should ensure that the economic incentives faced by insurers are consistent with preserving franchise value and liquidation value.
Best accomplished if insurers have something of value -- net tangible value -- to lose by pursuing risky investment strategies and other risky insurance operations.
Need to redefine “risky.”
Insurance regulators have considered applying various
asset/liability management tools to measure, monitor and
• Maximize asset portfolio yield• Minimize purchase price of asset portfolio• Minimize initial cash holdings• Minimize variance s.t. a target return• Maximize expected utility• Minimize a function of deviations from targets set for goals• Minimize cost of funding s.t. acceptable levels of insolvency risk• Maximize expected terminal wealth s.t. no shorts, limits on particular
asset holdings• Maximize E[V] of firm at horizon subject to penalties of shortfalls• Maximize E[U] of surplus at end of planning horizon• Minimize downside risk for a given average contribution rate• Maximize the expected log of asset wealth
109 papers cited…• Operations Research• European Journal of Operations
Research• Annals of Operations Research• Journal of Operations Research• Journal of the Operations Research
Society• Mathematics of Operations
Research• ORSA Journal of Computing • Journal of Applied Econometrics• Journal of Econometrics• Econometrics Review• Journal of Economic Dynamics
and Control
• Applied Mathematics and Optimization
• Mathematical Programming • Journal of Applied Mathematics• Informs Journal on Computing• Annals of Statistics• Journal of Information and
Optimization Sciences• Transactions of the Faculty of
Actuaries• International Journal of Forecasting• Management Science• Interfaces• Risk
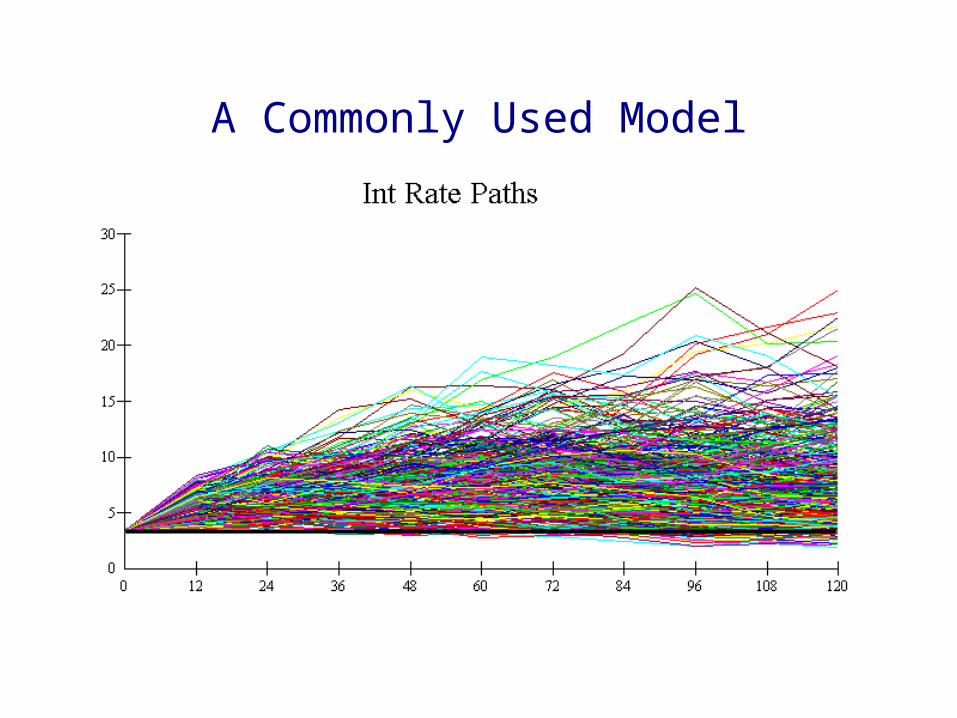
A Commonly Used Model
Asset TypesAsset Types
TYPE A TYPE B TYPE C
Foreign Exchange Interest Credit Risk
TYPE A TYPE B TYPE C
Key Driving
Factors
Key Driving
Factors
TYPE A TYPE B TYPE C
Model 1 Model 2 Model 3
Each different model is specialized to focus on key factor.
This specialization is aimed at speeding solutions.
Problem: how can you measure portfolio exposure to risk factors?
TYPE A TYPE B TYPE C
Model 1 Model 2 Model 3
Unified
Valuation
Model
Recommendations…
Developed Countries• Focus on economic
incentives• Focus on valuation• Focus on net tangible
value• A/L M measures are not
ready to be useful; indeed, they provide false comfort
Developing Countries• Focus on economic
incentives• Valuation tools are not
useful at this point• Focus on contributed
tangible capital• A/L M measures are not
ready to be useful at all for regulatory purposes
But what if our goal is to develop internal capital markets?
• Distinction between number of companies and amount of capital formation
• Confidence is a major concern
• Government guarantees cannot alone answer this concern
• Fostering small company entry into the market could destroy confidence and ultimately worsen capital formation