384 Biochemistry 2982, 21, 384-393 Assignment and Interpretation of Hydrogen Out-of-Plane Vibrations in the Resonance Raman Spectra of Rhodopsin and Bathorhodopsint Gregory Eyring,' Bostick Curry, Albert Broek, Johan Lugtenburg, and Richard Mathies* ABSTRACT: Resonance Raman studies of visual pigment analogues regenerated with 10-D, 10,l 1-D2, 11-D, 11,12-D2, 12-D, 15-D, and 20,14-D4isotopic derivatives of retinal have been used to assign the intense hydrogen outsf-plane (HOOP) vibrations in the spectra of rhodopsin, isorhodopsin, and ba- thorhodopsin. Low temperature 77 K photostationary steady-state experiments show that the unique 853-, 875-, and 921-cm-' lines of bathorhodopsin are due to isolated 14, 10, and 1 1 hydrogen out-of-plane wagging modes, respectively. The 12 HOOP wag could not be directly observed but must lie in the 830-860-cm-' region, an unusually low frequency for this vibration. Room temperature rapid-flow experiments similarly demonstrate that the 969-cm-' line in rhodopsin is due to the coupled Cl1H=CI2H A2 HOOP. The 959-cm-' line in isorhodopsin is attributed to a C7H=C8H A,, HOOP. For bathorhodopsin, the small shift of the 11 HOOP wag with 12-D substitution (921 - 916 cm-') clearly indicates that the 11 and 12 HOOPS are only weakly coupled. This contrasts It has long been known that light absorption in the visual pigment rhodopsin results in the cis - trans isomerization of the covalently bound 11-cis-retinal chromophore (I) (Wald, 19 I5Y R I 1968; Hubbard & Kropf, 1958). However, there has not been general agreement about the mechanism through which this isomerization is achieved. Several authors have advanced models in which the primary photoevent is not an isomerization (Fransen et al., 1976; van der Meer et al., 1976; Peters et al., 1977; Lewis, 1978; Warshel, 1978) while others have con- cluded that isomerization is essentially complete by the time bathorhodopsin,the primary photoproduct, is formed (Honig et al., 1979b; Birge & Hubbard, 1981). This problem is complicated by the fact that the chromophore in batho- rhodopsin displays a number of unusual properties which are 'From the Chemistry Department (G.E., B.C., and R.M.), University of California, Berkeley, California 94720, and the Chemistry Depart- ment (A.B. and J. L.), Leiden University, 2300 RA Leiden, The Neth- erlands. Received July 8,1981. This work was supported by grants from the National Institutes of Health (EY-02051) and from the Netherlands Research Organizations ZWO and SON. A.B. is supported by funds from SON. R.M. is an Alfred P. Sloan Research Fellow (1979-1981). Chemistry Department, Stanford University, Stanford, CA 94305. *Present address: 0006-2960/82/042 1-0384%O1.25/0 sharply with the strong coupling observed between these wags in rhodopsin, isorhodopsin, and all-trans-retinal. Models depicting an 11-trans-retinal chromophore in bathorhodopsin with twists about chain single bonds are insufficient to a m u n t for these new observations. Taken together with previous results, this indicates that the bathorhodopsin chromophore has a twisted 11-trans structure that is significantly perturbed near C12 by its (presumably electrostatic) interaction with an opsin residue. Interpretation of the rhodopsin and batho- rhodopsin HOOP intensities according to vibronic theory shows that the excited states of these pigments relax by an initial out-of-plane distortion of - 10' along the enhanced HOOP coordinates. Because intense HOOP modes are not seen in model compounds, these out-of-plane distortions are induced by opsin. Therefore, the HOOP intensities provide a direct indication of how the protein guides the excited-state relaxation of the rhodopsin and bathorhodopsin chromophores. not consistent with a relaxed all-trans geometry. One source of direct information on the structure of the bathorhodopsin chromophore has been resonance Raman (RR)' spectroscopy (Oseroff & Callender, 1974; Eyring & Mathies, 1979; Marcus & Lewis, 1979; Eyring et al., 1980a,b; Aton et al., 1980). Previous RR investigations of rhodopsin and isorhodopsin (Mathies et al., 1977) revealed a close correspondence between the 1100-1 400-cm-' fingerprint vi- brations of these pigments and those of the 11-cis- and 9- cis-retinal protonated Schiff bases (PSB's) in solution. Therefore, this region of the RR spectrum can be used to characterize the double bond geometry of the chromophore. While the bathorhodopsin fingerprint exhibits many similarities to that of the all-trans-retinal PSB (Eyring et al., 1980b; Aton et al., 1980), the most striking feature of the time-resolved room temperature (Hayward et al., 1981) and low temperature (Oseroff & Callender, 1974; Eyring et al., 1980b) batho- rhodopsin spectra is the appearance of three strong lines at 853,875, and 921 cm-' which are not observed in the all-trans model compound. Further evidence for bathorhodopsin's unusual properties is provided by the fast (<6 ps) risetime of this intermediate (Busch et al., 1972) and the 7-fold increase of this time when the protein is suspended in D20 (Peters et al., 1977). These observations have been used to argue for a primary event involving proton translocation in addition to the eventual cis - trans isomerization about the 11,12 double bond. Also, microcalorimetric measurements on bathorhodopsin have shown that about 35 kcal/mol, or roughly 60% of the absorbed photon's energy, is stored in this intermediate (Cooper, 1979). Electrostatic interactions between the chromophore and nearby opsin residues (Honig et al., 1979b; Warshel, 1978) as well I Abbreviations: RR, resonance Raman; HOOP, hydrogen out-of- plane; PSB, protonated Schiff base. 0 1982 American Chemical Society
Transcript
384 Biochemistry 2982, 21, 384-393
Assignment and Interpretation of Hydrogen Out-of-Plane Vibrations in the Resonance Raman Spectra of Rhodopsin and Bathorhodopsint
Gregory Eyring,' Bostick Curry, Albert Broek, Johan Lugtenburg, and Richard Mathies*
ABSTRACT: Resonance Raman studies of visual pigment analogues regenerated with 10-D, 10,l 1-D2, 11-D, 1 1,12-D2, 12-D, 15-D, and 20,14-D4 isotopic derivatives of retinal have been used to assign the intense hydrogen outsf-plane (HOOP) vibrations in the spectra of rhodopsin, isorhodopsin, and ba- thorhodopsin. Low temperature 77 K photostationary steady-state experiments show that the unique 853-, 875-, and 921-cm-' lines of bathorhodopsin are due to isolated 14, 10, and 1 1 hydrogen out-of-plane wagging modes, respectively. The 12 HOOP wag could not be directly observed but must lie in the 830-860-cm-' region, an unusually low frequency for this vibration. Room temperature rapid-flow experiments similarly demonstrate that the 969-cm-' line in rhodopsin is due to the coupled Cl1H=CI2H A2 HOOP. The 959-cm-' line in isorhodopsin is attributed to a C7H=C8H A,, HOOP. For bathorhodopsin, the small shift of the 11 HOOP wag with 12-D substitution (921 - 916 cm-') clearly indicates that the 11 and 12 HOOPS are only weakly coupled. This contrasts
I t has long been known that light absorption in the visual pigment rhodopsin results in the cis - trans isomerization of the covalently bound 1 1-cis-retinal chromophore (I) (Wald,
19
I5Y R
I 1968; Hubbard & Kropf, 1958). However, there has not been general agreement about the mechanism through which this isomerization is achieved. Several authors have advanced models in which the primary photoevent is not an isomerization (Fransen et al., 1976; van der Meer et al., 1976; Peters et al., 1977; Lewis, 1978; Warshel, 1978) while others have con- cluded that isomerization is essentially complete by the time bathorhodopsin, the primary photoproduct, is formed (Honig et al., 1979b; Birge & Hubbard, 1981). This problem is complicated by the fact that the chromophore in batho- rhodopsin displays a number of unusual properties which are
'From the Chemistry Department (G.E., B.C., and R.M.), University of California, Berkeley, California 94720, and the Chemistry Depart- ment (A.B. and J. L.), Leiden University, 2300 RA Leiden, The Neth- erlands. Received July 8,1981. This work was supported by grants from the National Institutes of Health (EY-02051) and from the Netherlands Research Organizations ZWO and SON. A.B. is supported by funds from SON. R.M. is an Alfred P. Sloan Research Fellow (1979-1981).
Chemistry Department, Stanford University, Stanford, CA 94305.
*Present address:
0006-2960/82/042 1-0384%O1.25/0
sharply with the strong coupling observed between these wags in rhodopsin, isorhodopsin, and all-trans-retinal. Models depicting an 1 1-trans-retinal chromophore in bathorhodopsin with twists about chain single bonds are insufficient to amun t for these new observations. Taken together with previous results, this indicates that the bathorhodopsin chromophore has a twisted 1 1-trans structure that is significantly perturbed near C12 by its (presumably electrostatic) interaction with an opsin residue. Interpretation of the rhodopsin and batho- rhodopsin HOOP intensities according to vibronic theory shows that the excited states of these pigments relax by an initial out-of-plane distortion of - 10' along the enhanced HOOP coordinates. Because intense HOOP modes are not seen in model compounds, these out-of-plane distortions are induced by opsin. Therefore, the HOOP intensities provide a direct indication of how the protein guides the excited-state relaxation of the rhodopsin and bathorhodopsin chromophores.
not consistent with a relaxed all-trans geometry. One source of direct information on the structure of the
bathorhodopsin chromophore has been resonance Raman (RR)' spectroscopy (Oseroff & Callender, 1974; Eyring & Mathies, 1979; Marcus & Lewis, 1979; Eyring et al., 1980a,b; Aton et al., 1980). Previous RR investigations of rhodopsin and isorhodopsin (Mathies et al., 1977) revealed a close correspondence between the 1 100-1 400-cm-' fingerprint vi- brations of these pigments and those of the 11-cis- and 9- cis-retinal protonated Schiff bases (PSB's) in solution. Therefore, this region of the RR spectrum can be used to characterize the double bond geometry of the chromophore. While the bathorhodopsin fingerprint exhibits many similarities to that of the all-trans-retinal PSB (Eyring et al., 1980b; Aton et al., 1980), the most striking feature of the time-resolved room temperature (Hayward et al., 1981) and low temperature (Oseroff & Callender, 1974; Eyring et al., 1980b) batho- rhodopsin spectra is the appearance of three strong lines at 853,875, and 921 cm-' which are not observed in the all-trans model compound.
Further evidence for bathorhodopsin's unusual properties is provided by the fast (<6 ps) risetime of this intermediate (Busch et al., 1972) and the 7-fold increase of this time when the protein is suspended in D20 (Peters et al., 1977). These observations have been used to argue for a primary event involving proton translocation in addition to the eventual cis - trans isomerization about the 1 1,12 double bond. Also, microcalorimetric measurements on bathorhodopsin have shown that about 35 kcal/mol, or roughly 60% of the absorbed photon's energy, is stored in this intermediate (Cooper, 1979). Electrostatic interactions between the chromophore and nearby opsin residues (Honig et al., 1979b; Warshel, 1978) as well
B A T H O R H O D O P S I N V I B R A T I O N A L A S S I G N M E N T V O L . 2 1 , N O . 2 , 1 9 8 2 385
bovine retinas were purchased from American Stores (Lincoln, NE), and rod outer segments were isolated by sucrose flotation. Analogue pigments were regenerated with the appropriate deuterium-substituted 1 1-cis- and 9-&-retinals after bleaching the rhodopsin in 100 mM phosphate buffer (pH 7) containing 10 mM 2-mercaptoethanol, The regenerated pigments were solubilized in Ammonyx-LO (Onyx Chemical Co., Jersey City, NJ) and purified by hydroxylapatite chromatography.
Room temperature rapid-flow RR spectra were obtained with 25 mL of sample (10 mM hydroxylamine and 1.5% Ammonyx-LO) having an absorbance of 0.8 at 500 nm. These spectra were excited with the 488-nm line of a Spectra-Physics 165 argon laser and detected with a dry ice cooled intensified vidicon (PAR 1205A and 1205D) coupled to a mismatched subtractive dispersion double monochromator (Mathies & Yu, 1978). The laser power (200 pW), flow rate (400 cm/s), and beam waist (10 pm) were chosen to make the effects of photolysis on the spectra negligible (photoalteration parameter F < 0.1; Mathies et al., 1976). Frequencies are accurate to f3 cm-', and the spectral slit width was 8 cm-'.
The 77 K photostationary steady-state experiments were performed following the methods of Oseroff & Callender (1974) and Eyring & Mathies (1979). The purified pigments were concentrated by vacuum dialysis (Schleicher & Schiill) and frozen onto a copper cold finger at 77 K. Spectra were obtained by using a dual-beam pump/probe technique with a standard photon counting Raman system. The monochro- mator was calibrated on the Rayleigh line, and slit widths were 5-6 cm-'. Wavenumber assignments are accurate to f 2 cm-'.
The synthesis and characterization of the 10-D, 11-D, 12-D, and 1 1,12-D2 retinal derivatives have been published (Eyring et al., 1980a; Broek C Lugtenburg, 1980). The synthesis of the 10,l 1-D2 and 20,14-D4 derivatives will be separately de- scribed (A. D. Broek and J. Lugtenburg, unpublished results). The 15-D retinal was prepared by LiAlD4 reduction of all- tram-retinoic acid to the alcohol, followed by Mn02 oxidation. The all-tram-retinal derivatives were isomerized by irradiation in CH3CN or CH30H and the resulting cis isomers separated and purified by high-performance liquid chromatography. Lower limits for deuterium incorporation were estimated from mass spectral analysis as follows: 10-D, 96%; 10,l 1-D2, 98%;
80%. NMR spectra showed that the incomplete deuteration of the 20,14-D4 derivative was randomly distributed. Therefore, the 14 position in 20,14-D4 should be >95% deu- terated.
Results Each spectrum in Figures 1 and 2 represents a 77 K
steady-state mixture of rhodopsin, isorhodopsin, and batho- rhodopsin whose chromophores have been deuterated at the indicated position@). Use of a yellow (568- or 580-nm) probe beam with a coaxial blue (488-nm) pump beam maximized the scattering from the analogue bathorhodopsins (Eyring & Mathies, 1979). Lines not due to bathorhodopsin have been crosshatched. They were identified by comparison of the low temperature steady-state spectra with spectra of the pure rhodopsin and isorhodopsin analogues (Figures 3-6) and by correlating pump beam induced changes in the line intensities with the expected changes in the bathorhodopsin concentration (Oseroff & Callender, 1974). For example, the line near 923 cm-' in the 11-D steady state (Figure 1B) is not assigned to batho because both 11-D rhodopsin and isorhodopsin (Figures 4A and 6A) have strong lines there and because in 488-nm probe experiments, the intensity of this line increases when the batho concentration is reduced with a coaxial yellow
as single and double bond twists (Warshel, 1978) may be necessary to account for this energy storage. Thus, evidence from a variety of sources indicates that the initial step in visual excitation, the transformation of rhodopsin to bathorhodopsin, is not a simple cis - trans isomerization.
Previous applications of RR spectroscopy to visual pigments and purple membrane have dealt primarily with qualitative comparisons of Raman fingerprints and the characterization of the Schiff-base linkage. However, a great deal more in- formation is contained in these spectra. The frequencies of the lines depend on the ground-state structure of the chro- mophore, while the intensities are a function of the displace- ment of the excited-state geometry relative to the ground state along the various normal coordinates (Tang & Albrecht, 1970; Warshel, 1977). In bathorhodopsin, the intense 853-, 875 , and 921-cm-' lines constitute such an unusual feature that their interpretation must provide key information about the ground- and excited-state chromophore structures. However, this in- formation cannot be extracted without a reliable assignment of these lines to specific normal modes.
Our previous work on bathorhodopsin containing IO-D and 1 1,12-D2 retinal derivatives (Eyring et al., 1980a) showed that the 875- and 921-cm-I lines were dramatically shifted in the 10-deuterio and 1 1,12-dideuterio derivatives, respectively. We therefore assigned the 875-cm-' line to an isolated 10 hydrogen out-of-plane (HOOP) wag and the 921-cm-' line to a coupled CI1H=Cl2H HOOP mode. Calculations using the QCFF-?r method indicated that these HOOP vibrations could be strongly enhanced by the introduction of ground-state single bond twists in the chromophore, without changing the calcu- lated fingerprint vibrational frequencies (Eyring et al., 1980b). These results suggested that the bathorhodopsin chromophore has a trans double bond configuration with a twisted single bond conformation.
Here wc have extended our analogue pigment RR studies to include the 11-D, 12-D, 10,ll-Dz, 20,14-D4, and 15-D derivatives. The RR spectra of these analogue bathorhodopsins permit us to assign the 853-, 875 , and 921-cm-' lines to the 14, 10, and 11 HOOP wags, respectively. We cannot defi- nitively assign any observed line in native bathorhodopsin to the 12 HOOP, but an analysis of the derivative spectra sug- gests that in unmodified batho it may lie near 830 cm-' with little intensity or near 860 cm-' under the more intense 14 HOOP. The 12-D bathorhodopsin spectra clearly demonstrate that the 11 HOOP wagging mode is only weakly coupled with the 12 HOOP. This surprising vibrational isolation cannot be explained by the -2OO chain twists that are necessary to induce the HOOP intensities. These new data suggest a more complex model for the bathorhodopsin ground state involving a charge perturbation of the CI2 chain carbon in addition to the previously proposed conformational distortions.
The large HOOP RR intensities in bathorhodopsin provide direct experimental evidence that its vertically excited state relaxes by distorting the 10,11, 12, and 14 hydrogens out of the local plane of the chain. Furthermore, the intensity of the 969-cm-' C,,H=CI2H A2 HOOP in rhodopsin indicates that the vertically excited state of rhodopsin must relax by an initial out-of-plane distortion of these hydrogens along A2 trajectories. The fact that these lines are not observed with comparable intensity in the free retinal PSB's shows that opsin facilitates this excited-state out-of-plane relaxation.
Materials and Methods Detailed procedures for the regeneration and purification
of visual pigment analogues have already been given (Eyring et al., 1980b; Eyring, 1981; Mathies, 1981). Briefly, frozen
386 B I O C H E M I S T R Y E Y R I N G E T A L .
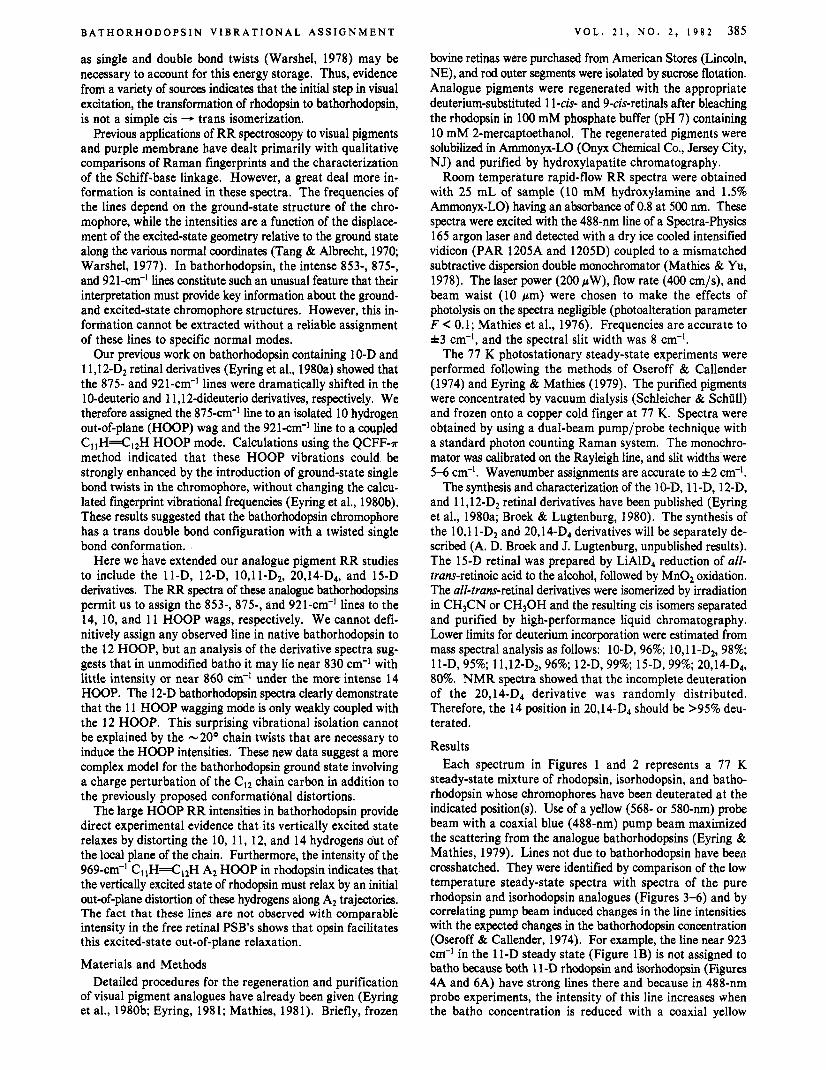
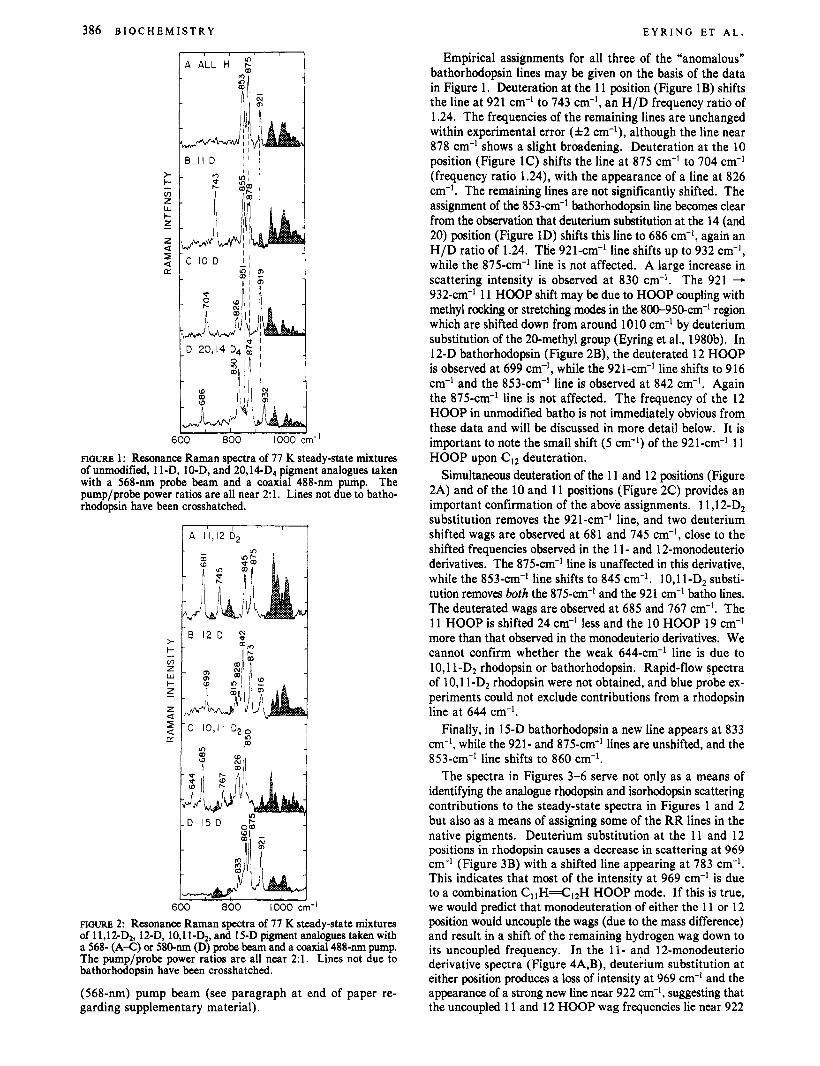
Empirical assignments for all three of the "anomalous" bathorhodopsin lines may be given on the basis of the data in Figure 1. Deuteration at the 11 position (Figure 1B) shifts the line at 921 cm-' to 743 cm-', an H/D frequency ratio of 1.24. The frequencies of the remaining lines are unchanged within experimental error ( f 2 cm-'), although the line near 878 cm-' shows a slight broadening. Deuteration at the 10 position (Figure 1C) shifts the line at 875 cm-' to 704 cm-' (frequency ratio 1.24), with the appearance of a line at 826 cm-'. The remaining lines are not significantly shifted. The assignment of the 853-cm-' bathorhodopsin line becomes clear from the observation that deuterium substitution at the 14 (and 20) position (Figure 1D) shifts this line to 686 cm-I, again an H/D ratio of 1.24. THe 921-cm-' line shifts up to 932 cm-', while the 875-cm-' line is not affected. A large increase in scattering intensity is observed at 830 cm-'. The 921 - 932-an-' 11 HOOP shift may be due to HOOP coupling with methyl rocking or stretching modes in the 80-95O-cm-' region which are shifted down from around 1010 cm-' by deuterium substitution of the 20-methyl group (Eyring et al., 1980b). In 12-D bathorhodopsin (Figure 2B), the deuterated 12 HOOP is observed at 699 cm-', while the 921-cm-I line shifts to 916 cm-' and the 853-cm-' line is observed at 842 cm-I. Again the 875-cm-' line is not affected. The frequency of the 12 HOOP in unmodified batho is not immediately obvious from these data and will be discussed in more detail below. It is important to note the small shift (5 cm-') of the 921-cm-' 11 HOOP upon CI2 deuteration.
Simultaneous deuteration of the 11 and 12 positions (Figure 2A) and of the 10 and 11 positions (Figure 2C) provides an important confirmation of the above assignments. 11,12-D2 substitution removes the 921 -cm-' line, and two deuterium shifted wags are observed at 681 and 745 cm-l, close to the shifted frequencies observed in the 11- and 12-monodeuterio derivatives. The 875-cm-' line is unaffected in this derivative, while the 853-cm-' line shifts to 845 cm-'. 10,l 1-Dz substi- tution removes both the 875-cm-' and the 921 cm-' batho lines. The deuterated wags are observed at 685 and 767 cm-'. The 11 HOOP is shifted 24 cm-' less and the 10 HOOP 19 cm-' more than that observed in the monodeuterio derivatives. We cannot confirm whether the weak 644-cm-' line is due to 10,l 1-D2 rhodopsin or bathorhodopsin. Rapid-flow spectra of 10,l 1-D2 rhodopsin were not obtained, and blue probe ex- periments could not exclude contributions from a rhodopsin line at 644 cm-I.
Finally, in 15-D bathorhodopsin a new line appears at 833 cm-I, while the 921- and 875-cm-' lines are unshifted, and the 853-cm-' line shifts to 860 cm-'.
The spectra in Figures 3-6 serve not only as a means of identifying the analogue rhodopsin and isorhodopsin scattering contributions to the steady-state spectra in Figures 1 and 2 but also as a means of assigning some of the RR lines in the native pigments. Deuterium substitution at the 11 and 12 positions in rhodopsin causes a decrease in scattering at 969 cm-I (Figure 3B) with a shifted line appearing at 783 cm-'. This indicates that most of the intensity at 969 cm-' is due to a combination Cl1H=Cl2H HOOP mode. If this is true, we would predict that monodeuteration of either the 11 or 12 position would uncouple the wags (due to the mass difference) and result in a shift of the remaining hydrogen wag down to its uncoupled frequency. In the 11- and 12-monodeuterio derivative spectra (Figure 4A,B), deuterium substitution at either position produces a loss of intensity at 969 cm-* and the appearance of a strong new line near 922 cm-', suggesting that the uncoupled 11 and 12 HOOP wag frequencies lie near 922
600 800 1000 crn-'
FIGURE 1: Resonance Raman spectra of 77 K steady-state mixtures of unmodified, 1 I-D, 10-D, and 20,14-D4 pigment analogues taken with a 568-nm probe beam and a coaxial 488-nm pump. The pump/probe power ratios are all near 2:l. Lines not due to batho- rhodopsin have been crosshatched.
I I A 11,12D2
FIGURE 2: Resonance Raman spectra of 77 K steady-state mixtures of 11,12-D2, 12-D, 10,11-D2, and 15-D pigment analogues taken with a 568- ( A X ) or 580-nm (D) probe beam and a cuaxial488-nm pump. The pump/probe power ratios are all near 2:l. Lines not due to bathorhodopsin have been crosshatched.
(568-nm) pump beam (see paragraph at end of paper re- garding supplementary material).
B A T H O R H O D O P S I N V I B R A T I O N A L A S S I G N M E N T V O L . 2 1 , N O . 2 , 1 9 8 2 387
FIGURE 3: Room temperature rapid-flow RR spectra of unmodified rhodopsin (A) and its 11,12-D2 and 10-D analogues (B and C).
I I ' I 6 1 ' 1 In' I 1
FIGURE 5: Room temperature rapid-flow RR spectra of unmodified isorhodopsin (A) and its l l ,12-D2 and 10-D analogues (B and C).
I
ISORHODOPSIN
A I I D h m I
FIGURE 4: Room temperature rapid-flow RR spectra of 11-D, 12-D, and 15-D rhodopsin analogues.
cm-', with a 47-cm-' coupling in the native pigment. The uncoupled deuterium shifted wags, which by analogy to the batho HOOP'S are expected in the 675-775-cm-' region, are not observed with intensity. The presence of a weak line near 843 cm-' in all the rhodopsin derivatives except the 10-D (Figure 3C) suggests that this line may be due to the 10 HOOP. This assignment is supported by the observation that in 10-D rhodopsin a deuterium-shifted line appears at 707 cm-I (H/D ratio 1.19). The derivative which has a spectrum most similar to that of native rhodopsin is 15-D rhodopsin (Figure 4C), for which no significant differences are observed in the HOOP region below 1000 cm-'.
The effects of these deuterium substitutions on the iso- rhodopsin spectrum appear to be generally smaller than those in rhodopsin. For example, none of the five derivatives shown in Figures 5 and 6 exhibits a dramatic loss of intensity in the line near 959 cm-', indicating that in isorhodopsin the majority of the intensity here is not due to a coupled Cl1H=CI2H HOOP mode. The weak line at 748 cm-' in 11-D isorhodopsin (Figure 6A) is probably the shifted 11 HOOP, with a fre- quency close to that observed in 11-D bathorhodopsin (Figure 1B).
In Table I we present all-trans-retinal HOOP frequencies and assignments determined through a comparison of Raman (676 nm in CCl,) and IR spectra. These spectra along with the details of the assignments will be published separately (B.
FIGURE 6: Room temperature rapid-flow RR spectra of 1 1-D, 12-D, and 15-D isorhodopsin analogues.
Curry and R. Mathies, unpublished results). These data provide a good indication of the HOOP frequencies and couplings expected for an unperturbed all-trans chromophore. It is valid to compare these data with the HOOP frequencies and couplings in bathorhodopsin because the central chain HOOP modes are relatively insensitive to protonated Schiff- base formation. For example, the all-trans-retinal PSB ex- hibits a strong A,, HOOP at 971 cm-', within 12 cm-' of the retinal Cl1H=CI2H A, HOOP.
Discussion The resonance Raman spectrum of bathorhodopsin, the
primary photochemical intermediate in vision, contains im- portant clues to the structure of its retinal chromophore. In particular, the spectrum of bathorhodopsin exhibits three in- tense lines at 853, 875, and 921 cm-' (Figure 1A) which are not observed in ,the spectrum of rhodopsin, isorhodopsin, or the metarhodopsins or in the Raman spectra of the free chromophores (Mathies et al., 1977; Doukas et al., 1978). Since these lines were first observed (Oseroff & Callender, 1974), the lack of an experimental assignment has impeded progress toward a consistent model for the primary photo- chemistry. The RR studies of deuterium-substituted pigment analogues presented here permit us to assign these unique bathorhodopsin lines to specific chain hydrogen out-of-plane wagging modes of the retinal chromophore. These HOOP
388 B I O C H E M I S T R Y E Y R I N G E T A L .
t
t
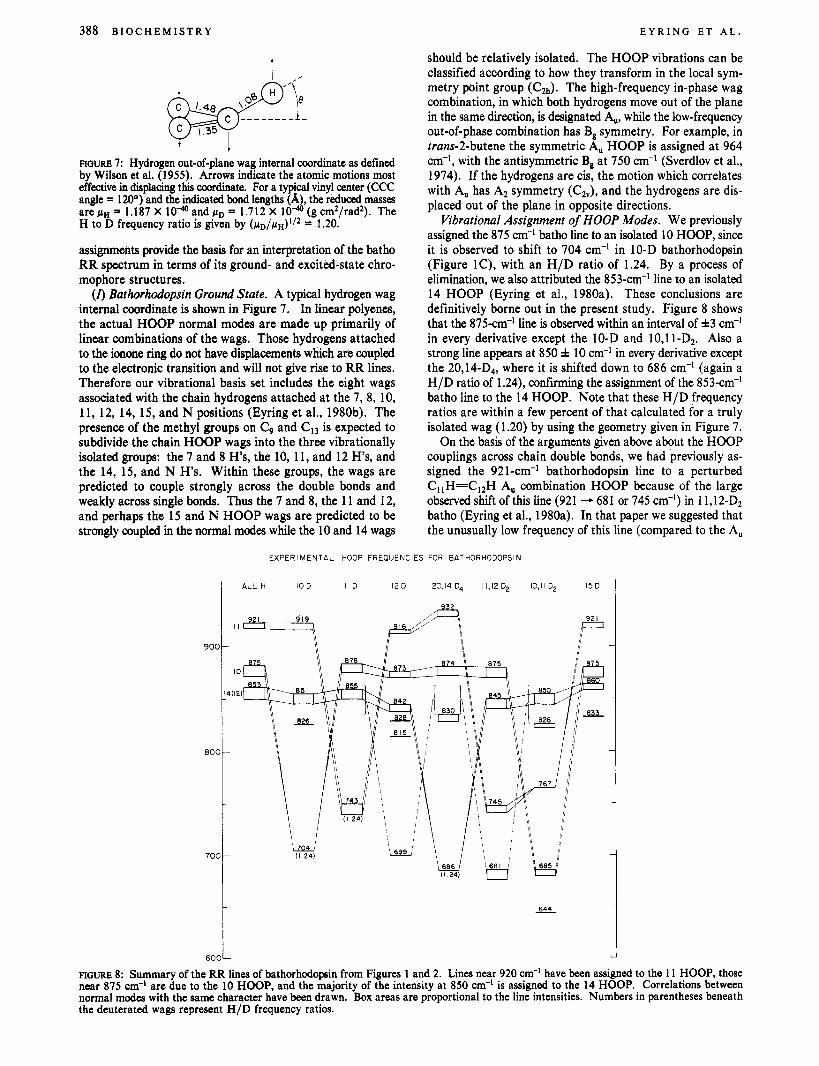
FIGURE 7: Hydrogen out-of-plane wag internal coordinate as defined by Wilson et al. (1955). Arrows indicate the atomic motions most effective in displacing this coordinate. For a typical vinyl center (CCC angle = 120°) and the indicated bond lengths (A), the reduced masses are pH = 1.187 X lo4 and p~ = 1.712 X lo4 (g cm2/rad2). The H to D frequency ratio is given by (pD/pH) ' I2 = 1.20.
assignments provide the basis for an interpretation of the batho RR spectrum in terms of its ground- and excited-state chro- mophore structures.
(Z) Bathorhodopsin Ground State. A typical hydrogen wag internal coordinate is shown in Figure 7. In linear polyenes, the actual HOOP normal modes are made up primarily of linear combinations of the wags. Those hydrogens attached to the ionone ring do not have displacements which are coupled to the electronic transition and will not give rise to RR lines. Therefore our vibrational basis set includes the eight wags associated with the chain hydrogens attached at the 7, 8, 10, 11, 12, 14, 15, and N positions (Eyring et al., 1980b). The presence of the methyl groups on C9 and C13 is expected to subdivide the chain HOOP wags into the three vibrationally isolated groups: the 7 and 8 H's, the 10, 11, and 12 Hs, and the 14, 15, and N H's. Within these groups, the wags are predicted to couple strongly across the double bonds and weakly across single bonds. Thus the 7 and 8, the 11 and 12, and perhaps the 15 and N HOOP wags are predicted to be strongly coupled in the normal modes while the 10 and 14 wags
should be relatively isolated. The HOOP vibrations can be classified according to how they transform in the local sym- metry point group (C2h). The high-frequency in-phase wag combination, in which both hydrogens move out of the plane in the same direction, is designated A,, while the low-frequency out-of-phase combination has B, symmetry. For example, in trans-2-butene the symmetric A, HOOP is assigned at 964 cm-I, with the antisymmetric B, at 750 cm-' (Sverdlov et al., 1974). If the hydrogens are cis, the motion which correlates with A, has A2 symmetry (C2J, and the hydrogens are dis- placed out of the plane in opposite directions.
Vibrational Assignment of HOOP Modes. We previously assigned the 875 cm-' batho line to an isolated 10 HOOP, since it is observed to shift to 704 cm-l in 10-D bathorhodopsin (Figure lC), with an H/D ratio of 1.24. By a process of elimination, we also attributed the 853-cm-' line to an isolated 14 HOOP (Eyring et al., 1980a). These conclusions are definitively borne out in the present study. Figure 8 shows that the 875-cm-' line is observed within an interval of f3 cm-' in every derivative except the 10-D and 10,ll-D2. Also a strong line appears at 850 f 10 cm-' in every derivative except the 20,14-D4, where it is shifted down to 686 cm-' (again a H/D ratio of 1.24), confirming the assignment of the 853-cm-' batho line to the 14 HOOP. Note that these H/D frequency ratios are within a few percent of that calculated for a truly isolated wag (1.20) by using the geometry given in Figure 7.
On the basis of the arguments given above about the HOOP couplings across chain double bonds, we had previously as- signed the 92 1-cm-' bathorhodopsin line to a perturbed C1 ,H=C12H A, combination HOOP because of the large observed shift of this line (921 - 681 or 745 cm-I) in 1 1,12-D2 batho (Eyring et al., 1980a). In that paper we suggested that the unusually low frequency of this line (compared to the A,
EXPERl M E N T A L HOOP FREQUENCIES FOR BPTHORHODOPSIN
12D 20,14D4 11.12D2 10,lIDp 15D 10 D I I D i ALL
600 1 FIGURE 8: Summary of the RR lines of bathorhodopsin from Figures 1 and 2. Lines near 920 cm-' have been assigned to the 1 1 HOOP, those near 875 em-' are due to the 10 HOOP, and the majority of the intensity at 850 cm-' is assigned to the 14 HOOP. Correlations between normal modw with the same character have been drawn. Box areas are proportional to the line intensities. Numbers in parentheses beneath the deuterated wags represent H/D frequency ratios.
B A T H O R H O D O P S I N V I B R A T I O N A L A S S I G N M E N T
HOOP observed near 970 cm-I in a wide variety of trans- substituted ethylenes; Potts & Nyquist, 1959) could be due to the presence of a charged opsin residue near CI1 which would reduce the 1 1,12 double bond order and thus the force constant for this mode. In view of the additional data on monosubstituted 1 1-D and 12-D bathorhodopsins presented here, a more detailed picture has emerged. The surprising result is that in bathorhodopsin the I I and I2 hydrogen wags are virtually uncoupled This can be seen by observing that in 11-D batho (Figure 8), all of the intensity at 921 cm-' is shifted to 743 cm-' (H/D frequency ratio 1.24), while in 12-D batho it shifts down only 5 cm-I to 916 cm-'. Thus, the 921-cm-' batho line must be assigned to an 'isolated" 11 HOOP wag, shifted by no more than 5 cm-' because of cou- pling with the 12 HOOP.
The intensities of the deuterated HOOP modes in the lO-D, 11-D, 12-D, and 20,14D4 derivatives clearly indicate that each of these wags has significant intrinsic Raman intensity. However, only the 10-H, 1 1-H, and 14-H wags are observed in the native bathorhodopsin spectrum. There are two possible explanations for why the 12 HOOP is not observed. First, if the 12 HOOP mode is vibrationally isolated from the other wags, then it must lie in the 850-860-cm-I region and be unobservable beneath the 14 HOOP. Alternatively, the 12 HOOP may be more strongly mixed with other HOOP modes (especially the 14 HOOP), and lie near 830 cm-' with little intensity.
If the 12 HOOP is not coupled with the other HOOP modes, then it would retain its intrinsic Raman intensity in bathorhodopsin and its derivatives. In this case, the 12 HOOP must lie underneath another strong HOOP line in the native spectrum. Because no residual bathorhodopsin intensity re- mains from 890 to 950 cm-' in the 11-D derivative or from 870 to 900 cm-' in 10-D, an unmixed 12 HOOP would have to lie below 870 em-' and be masked by the intense 14 HOOP at 853 cm-'. Assignment of the 12 HOOP near 860 cm-' would give an H/D frequency ratio of 1.23, close to that observed for the lO-H, 1 1-H, and 14-H wags.
The other alternative is that the 12 HOOP may be mixed with other HOOP modes. If two wags are nearly equally mixed to form symmetric and antisymmetric combinations, then all of the Raman intensity could be concentrated into the symmetric mode. For example, the intensity of the 11-H and 12-H wags appears in the 969-cm-' A2 combination mode in rhodopsin (see below). In bathorhodopsin the 12-H wag is not mixed with the 11-H or 10-H wag since the 11 and 10 HOOPs are only slightly shifted by C12 deuteration. The 12-H wag could, however, mix with the 14-H wag. While the 12-H and 14-H wags are not expected to be significantly coupled in the force constant matrix, they are expected to have small (5-10 cm-') splitting due to kinetic coupling through the motion of carbon 13. A small splitting between these nearly degenerate wags could explain the lack of intensity of the 12 HOOP in native batho, since the symmetric combination would exhibit most of the Raman intensity, while the antisymmetric combination would be weak. Because such coupling splits the mixed HOOPs apart in frequency, reduction of the mixing due to deuteration of either component would cause the re- maining observed HOOP to shift in frequency toward the previous position of the removed line. This is indeed observed in 12-D bathorhodopsin, in which the intense 14 HOOP drops from 853 to 842 cm-'. A similar drop of the 14 HOOP to 845 cm-' is observed in the 1 1, 12-D2 derivative. This implies that the unobserved 12,14 combination lies below 842 cm-' in the native spectrum. Further support for the assignment of the
V O L . 2 1 , N O . 2 , 1 9 8 2 389
Table I: Experimental C,,H, C,,H and C,,H HOOP Frequencies of all-trans-Retinal Analogues"
chromophore 10 HOOP 11 HOOP 12 HOOP
all H 959 A, 10-D 710 956 A, 11-D 741 919 12-D 907 122 11,12-D2 743 708 10,ll-D, 692 762 908
~
a All frequencies a e in cm-'.
12 HOOP near 830 cm-l, mixed with the 14 HOOP, is pro- vided by the 15-D derivative (Figure 8). Coupling between the 14-H and the 15-H wags causes the 14 HOOP to increase in frequency from 853 to 860 cm-' upon 15 deuteration. The new line which appears at 833 cm-' in 15-D batho cannot be due to the 15-D wag or to the N H wag, because this line is unchanged in 15,N-D2 batho. The most reasonable expla- nation is that the shift of the 14 HOOP to 860 cm-' reduces its mixing with the 12 HOOP (at -830 cm-'), allowing the previously unobserved 12-H wag to exhibit its intensity. Although the effects of deuterated methyl rocking vibrations have yet to be quantified (cf. 19-CD,-bathorhodopsin; Eyring et al., 1980b) the strong line at 830 cm-I in the 20,14-D4 derivative can similarly be assigned to the residual 12-H wag, no longer coupled with the 14 HOOP. These observations provide significant evidence that the 12 HOOP lies at a very low frequency (-830 cm-'). While we cannot exclude the alternative assignment of an "isolated" 12 HOOP near 850-860 cm-', it is clear that the 12 HOOP can be no higher than 860 cm-'.
The spectra in Figures 3-6 allow us to assign the more intense HOOP modes of rhodopsin and isorhodopsin. On the basis of the deuterium shift cited above in 1 1,12-D, rhodopsin (Figure 3B), we assign the strong 969-cm-' line of rhodopsin to a combination HOOP mode of the 11 and 12 hydrogen wags. Monodeuteration of either the 11 or 12 pi t ions (Figure 4A,B) decouples the wags and leaves a residual isolated HOOP near 920 cm-'. This is very similar to the Cl1H=CI2H HOOP coupling behavior observed for all-trans-retinal (cf. Table I), suggesting that this coupling is relatively independent of whether the hydrogens are cis or trans to the 11,12 double bond. Since the -960-cm-' A, HOOP mode in trans systems correlates with the A2 mode in cis, we assign the 969-cm-' rhodopsin line to the CllH=Cl2H A2 HOOP. Residual in- tensity at 975 cm-' in 11,12-D2 rhodopsin (Figure 3B) is probably due to an A, symmetry combination of the 7 and 8 HOOP wags, which our calculations predict should appear in this region (Eyring et al., 1980b).
In isorhodopsin, the 959-cm-I line (Figure 5A) cannot be primarily due to any of the 10, 11, 12, or 15 wags, since its intensity is not significantly altered when these positions are deuterated. By elimination, therefore, we attribute it to the C7H=C8H A, HOOP. However, an ClIH=C12H A, HOOP apparently does contribute some intensity here, since like the analogue rhodopsins, the 11-D and 12-D isorhodopsin deriv- atives (Figure 6A,B) exhibit decoupled 11-H and 12-H wags at 908 and 921 cm-', respectively.
Protein Effects on Bathorhodopsin HOOP Modes. Now that the 10-H, 11-H, and 12-H HOOP modes have been identified in the spectra of substituted bathorhodopsins, a comparison of the frequencies and deuterium shifts of these lines with those of all-trans-retinal (Table I) can be used to determine how opsin perturbs the chromophore force field in bathorhodopsin. Examination of the 10-H and 11-H wag behavior in bathorhodopsin indicates that the 10 and 11 centers
390 B I oc H E M I ST R Y
are unperturbed and that the interaction between the 10-H and 11-H wags is not substantially different from that observed for all-trans-retinal. The isolated 10-D and 11-D wags in bathorhodopsin (704 and 743 cm-l) are within a few cm-' of those observed in retinal (710 and 741 cm-I). Furthermore, the coupled 10 and 11 deuterated wags in 10,l 1-Dz batho have nearly the same frequencies (685 and 767 mil) as those seen in lO,Il-D, retinal (692 and 762 cm-I). The agreement be- tween these frequencies indicates that a "normal" single bond exists between unperturbed C,, and C,, centers in batho- rhodopsin. Furthermore, the small shifts obsmred for the 11 HOOP in 10-D batbo (2 cm-l) and for the 10 HOOP in 11-D batho (3 c n - I ) are precisely those expected for two wags joined by a single bond?
The unusual behavior of the 12 HOOP frequency and the CIIH==CI2H HOOP coupling in bathorhodopsin is illustrated by comparison with all-trans-retinal, rhodopsin, and iso- rhodopsin. In all-tramretinal the 11 and 12 wags are strongly coupled to produce a combination HOOP mode at 959 cm-' (Table I). Deuteration at either the 11 or 12 position demuples the wags to produce one isolated deuterium wag (741 cm-' in 11-D and 722 cn-l in 12-D) and one isolated residual proton wag (919 cm-I in 11-D and 907 cm-l in 12-D), while deu- teration at both centers gives rise to a pair of HOOP modes at 708 and 743 cm-l. These are very similar to the frequencies and shifting patterns observed for the 11 and 12 HOOPs in rhodopsin and isorhodopsin. In native bathorhodopsin, on the other hand, the 11 HOOP is observed at 921 cm-' rather than near 960 cm-l. Monodeuteration at the 12 position clearly demonstrates that this low 11 HOOP frequency is due to reduced coupling of the 11-H and 12-H wags rather than to an unusually low 11-H wag frequency. The "isolated" 11-H wag frequencies in 12-D batho (916 ad) and in 11-D batho (743 c d ) are nearly identical with the corresponding fre- quencies in 12-D and 11-D retinal (907 and 741 cm-I). The "isolated" 12-H wags in 11-D and 12-D batho (<880 and 699 c n - I ) , however, appear at substantially lower frequencies than their counterparts in retinal (919 and 722 cm-I). The small downshift of the 11-H frequency in native batho when C12 is deuterated (921 - 916 cn-I), compared with the 52-cm-l drop for retinal (959 - 907 cm-I), demonstrates that the splitting between these wags is unusually weak in bathorhodopsin.
The splitting between the 11-H and 12-H wags is expected to depend directly upon the strength of the potential energy coupling between the wags, but it also varies inversely with the difference between the unmixed wag frequencies. Thus the observed effects in bathorhodopsin can be modeled either by reduction of the CI,=CIZ bond order, which directly re- duces the 11-H-12-H coupling constant, or by dropping the 12-H isolated frequency so that the two unmixed wags are no
A significant increase in vibrational splitting is expected upon deu- teration of hydrogen wags joined by a single bond. The coupling term between two interacting wags i j is given by h,, =&gu +J&, where the f s are elements of the potential energy (F) matrix and the g's are e l e men& of the inverse kinetic energy (C) matrix (Wilson et al., 1955). For adjacent trans substituents, the&gll term is positive and theh,g,l term is negative. Deuteration of the substituent centers decreases the mag- nitude of the g, matrix element, which is equal to the inverse of the reduced mass o/internal coordinate j . This will make the net coupling h,, more negative. Since thef,, matrix element is approximately pro- portional to the *-bond order between the centers. the/ugu term will be smaller (and the h,, splitting more negative) for wags trans to a single bond than for wags trans to a double bond. The balance of these effects is that the pitivehfl,, term is dominant for trans doublebonded protons. the two terms nearly cancel for single-bonded protons and for double- bonded deuterons, and the negative/& term dominates for singlebonded dcuterons.
E Y R I N G ET A L .
_L__11
BATHORHOOOPSI N
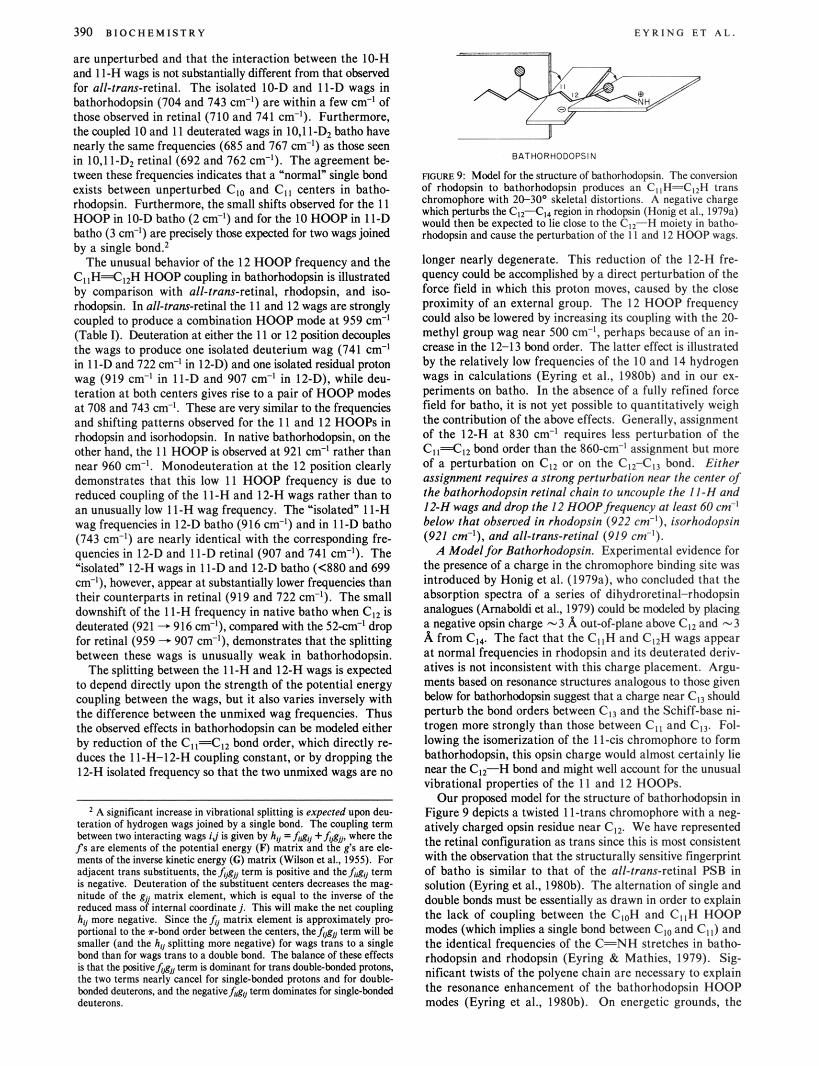
FIGURE 9 Model for the structure of bathorhodopsin. The conversion of rhodopsin to bathorhodopsin produces an C,,H=C,,H trans chromophore with 2(t3Oo skeletal distortions. A negative charge which perturbs the C,,-C,, region in rhodopsin (Honig et al., 1979a) would then be expected to lie close to the C12-H moiety in batho- rhodopsin and cause the perturbation of the I I and 12 HOOP wags.
longer nearly degenerate. This reduction of the 12-H fre- quency could be accomplished by a direct perturbation of the force field in which this proton moves, caused by the close proximity of an external group. The 12 HOOP frequency could also be lowered by increasing its coupling with the 20- methyl group wag near 500 cm-l, perhaps because of an in- crease in the 12-13 bond order. The latter effect is illustrated by the relatively low frequencies of the IO and 14 hydrogen wags in calculations (Eyring et al., 1980b) and in our ex- periments on batho. In the absence of a fully refined force field for batho, it is not yet possible to quantitatively weigh the contribution of the above effects. Generally, assignment of the 12-H at 830 cm-' requires less perturbation of the CII==CIz bond order than the 860-cmP assignment but more of a perturbation on CI, or on the C,,-C,, bond. Either assignment requires a strong perturbation near the center of the bathorhodopsin retinal chain to uncouple the 11-H and 12-H wags and drop the I 2 HOOP frequency at least 60 cm-' below that observed in rhodopsin (922 cm-I), isorhodopsin (921 cm-I), and all-trans-retinal (919 cm-I).
A Model for Bathorhodopsin. Experimental evidence for the presence of a charge in the chromophore binding site was introduced by Honig et al. (1979a). who concluded that the absorption spectra of a series of dihydroretinal-rhodopsin analogues (Amaboldi et al., 1979) could be modeled by placing a negative opsin charge -3 A out-of-plane above C,, and -3 A from C14. The fact that the Cl lH and CIzH wags appear at normal frequencies in rhodopsin and its deuterated deriv- atives is not inconsistent with this charge placement. Argu- ments based on resonance structures analogous to those given below for bathorhcdopsin suggest that a charge near C,, should perturb the bond orders between CI, and the Schiff-base ni- trogen more strongly than those between C , , and C,,. Fol- lowing the isomerization of the 11-cis chromophore to form batborbodopsin, this opsin charge would almost certainly lie near the CIz-H bond and might well account for the unusual vibrational properties of the 11 and 12 HOOPs.
Our proposed model for the structure of bathorhodopsin in Figure 9 depicts a twisted 11-trans chromophore with a neg- atively charged opsin residue near Clz. We have represented the retinal configuration as trans since this is most consistent with the observation that the structurally sensitive fingerprint of batho is similar to that of the all-trans-retinal PSB in solution (Eyring et al., 1980b). The alternation of single and double bonds must be essentially as drawn in order to explain the lack of coupling between the CIoH and C,,H HOOP modes (which implies a single bond between Clo and C I J and the identical frequencies of the C=NH stretches in batho- rhodopsin and rhodopsin (Eyring & Mathies, 1979). Sig- nificant twists of the polyene chain are necessary to explain the resonance enhancement of the bathorhodopsin HOOP modes (Eyring et al., 1980b). On energetic grounds, the
B A T H O R H O D O P S I N V I B R A T I O N A L A S S I G N M E N T
largest twists should appear about the bonds with the lowest torsional barriers. In light of the unusual 11 and 12 HOOP wag behavior, a reduction in the Cl1=Cl2 bond order that would allow moderate twists about the 11,12 bond is clearly possible. However, for simplicity Figure 9 depicts 30' twists about only the Clo-Cll and C1,--C13 single bonds. In rho- dopsin, the steric interaction of the 13-methyl group with the 10 hydrogen appears to require that isomerization about C11=C12 occurs by rotating the 13-methyl group away from the 10 hydrogen behind the plane of the drawing (Birge & Hubbard, 1981). We propose that the relaxation of the ba- thorhodopsin chromophore is hindered by nonbonding inter- action of the 9- and 13-methyl groups with protein residues that constrain the 13-methyl group to lie behind the plane in Figure 9. This is supported by the observation that 9-de- methyl- and 13-demethylbathorhodopsins do not have strongly enhanced HOOP vibrations (Eyring et al., 1980b).
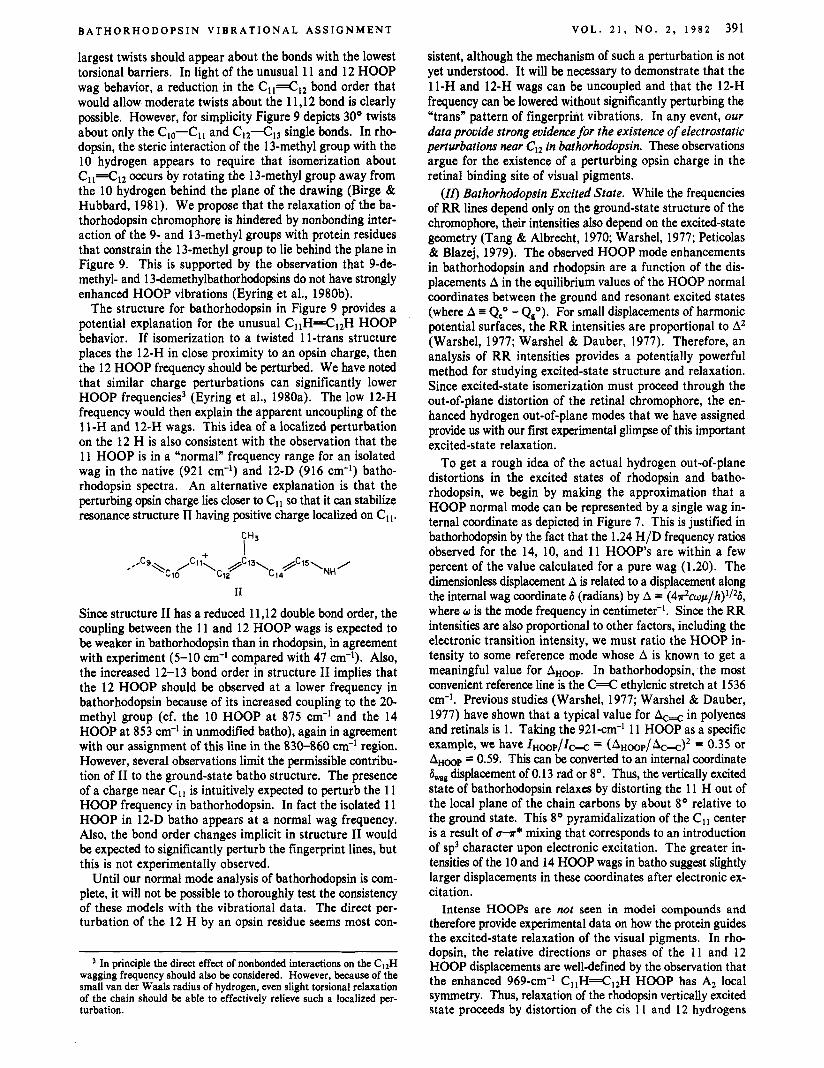
The structure for bathorhodopsin in Figure 9 provides a potential explanation for the unusual C1 'H=C12H HOOP behavior. If isomerization to a twisted 11-trans structure places the 12-H in close proximity to an opsin charge, then the 12 HOOP frequency should be perturbed. We have noted that similar charge perturbations can significantly lower HOOP frequencies3 (Eyring et al., 1980a). The low 12-H frequency would then explain the apparent uncoupling of the 11-H and 12-H wags. This idea of a localized perturbation on the 12 H is also consistent with the observation that the 11 HOOP is in a "normal" frequency range for an isolated wag in the native (921 cm-I) and 12-D (916 cm-l) batho- rhodopsin spectra. An alternative explanation is that the perturbing opsin charge lies closer to Cll so that it can stabilize resonance structure I1 having positive charge localized on C1 l .
CH3 I
V O L . 2 1 , N O . 2 , 1 9 8 2 391
sistent, although the mechanism of such a perturbation is not yet understood. It will be necessary to demonstrate that the 11-H and 12-H wags can be uncoupled and that the 12-H frequency can be lowered without significantly perturbing the "trans" pattern of fingerprint vibrations. In any event, our data provide strong evidence for the existence of electrostatic perturbations near Cl, in bathorhodopsin. These observations argue for the existence of a perturbing opsin charge in the retinal binding site of visual pigments.
(II) Bathorhodopsin Excited State. While the frequencies of RR lines depend only on the ground-state structure of the chromophore, their intensities also depend on the excited-state geometry (Tang & Albrecht, 1970; Warshel, 1977; Peticolas & Blazej, 1979). The observed HOOP mode enhancements in bathorhodopsin and rhodopsin are a function of the dis- placements A in the equilibrium values of the HOOP normal coordinates between the ground and resonant excited states (where A Q," - Qso). For small displacements of harmonic potential surfaces, the RR intensities are proportional to A2 (Warshel, 1977; Warshel & Dauber, 1977). Therefore, an analysis of RR intensities provides a potentially powerful method for studying excited-state structure and relaxation. Since excited-state isomerization must proceed through the out-of-plane distortion of the retinal chromophore, the en- hanced hydrogen out-of-plane modes that we have assigned provide us with our first experimental glimpse of this important excited-state relaxation.
To get a rough idea of the actual hydrogen out-of-plane distortions in the excited states of rhodopsin and batho- rhodopsin, we begin by making the approximation that a HOOP normal mode can be represented by a single wag in- ternal coordinate as depicted in Figure 7. This is justified in bathorhodopsin by the fact that the 1.24 H/D frequency ratios observed for the 14, 10, and 11 HOOP'S are within a few percent of the value calculated for a pure wag (1.20). The dimensionless displacement A is related to a displacement along the internal wag coordinate 6 (radians) by A = ( 4 7 # c ~ p / h ) ' / ~ S , where w is the mode frequency in centimeter-'. Since the RR intensities are also proportional to other factors, including the electronic transition intensity, we must ratio the HOOP in- tensity to some reference mode whose A is known to get a meaningful value for AHOOP. In bathorhodopsin, the most convenient reference line is the C = C ethylenic stretch at 1536 cm-'. Previous studies (Warshel, 1977; Warshel & Dauber, 1977) have shown that a typical value for Ac+ in polyenes and retinals is 1. Taking the 921-cm-' 1 1 HOOP as a specific example, we have I H ~ p / Z ~ = (AHoop/AC+)2 = 0.35 or AHmp = 0.59. This can be converted to an internal coordinate 6, displacement of 0.13 rad or 8O. Thus, the vertically excited state of bathorhodopsin relaxes by distorting the 11 H out of the local plane of the chain carbons by about 8' relative to the ground state. This 8' pyramidalization of the C l l center is a result of UT* mixing that corresponds to an introduction of sp3 character upon electronic excitation. The greater in- tensities of the 10 and 14 HOOP wags in batho suggest slightly larger displacements in these coordinates after electronic ex- citation.
Intense HOOPS are not seen in model compounds and therefore provide experimental data on how the protein guides the excited-state relaxation of the visual pigments. In rho- dopsin, the relative directions or phases of the 11 and 12 HOOP displacements are well-defined by the observation that the enhanced 969-cm-' CIIH=Cl2H HOOP has A2 local symmetry. Thus, relaxation of the rhodopsin vertically excited state proceeds by distortion of the cis 11 and 12 hydrogens
I1
Since structure I1 has a reduced 11,12 double bond order, the coupling between the 11 and 12 HOOP wags is expected to be weaker in bathorhodopsin than in rhodopsin, in agreement with experiment (5-10 cm-' compared with 47 cm-'). Also, the increased 12-13 bond order in structure I1 implies that the 12 HOOP should be observed at a lower frequency in bathorhodopsin because of its increased coupling to the 20- methyl group (cf. the 10 HOOP at 875 cm-l and the 14 HOOP at 853 cm-' in unmodified batho), again in agreement with our assignment of this line in the 830-860 cm-' region. However, several observations limit the permissible contribu- tion of I1 to the ground-state batho structure. The presence of a charge near C l l is intuitively expected to perturb the 11 HOOP frequency in bathorhodopsin. In fact the isolated 11 HOOP in 12-D batho appears at a normal wag frequency. Also, the bond order changes implicit in structure I1 would be expected to Significantly perturb the fingerprint lines, but this is not experimentally observed.
Until our normal mode analysis of bathorhodopsin is com- plete, it will not be possible to thoroughly test the consistency of these models with the vibrational data. The direct per- turbation of the 12 H by an opsin residue seems most con-
In principle the direct effect of nonbonded interactions on the ClzH wagging frequency should also be considered. However, because of the small van der Waals radius of hydrogen, even slight torsional relaxation of the chain should be able to effectively relieve such a localized per- turbation.
392 B I O C H E M I S T R Y E Y R I N G E T A L .
FIGURE 10: Model for the excited-state. relaxation of rhodopsin and bathorhodopsin based on Raman intensities. Excitation of 1 1-cis- rhodopsin (viewed edge on) is followed by relaxation of the 11 and 12 hydrogens along an A2 HOOP coordinate that displaces these hydrogens in opposite directions from the original molecular plane. Excitation of 1 I-trans-bathorhodopsin leads to an C I I H = C I Z H .A, HOOP relaxation that displaces these hydrogens in the smne direction from the original molecular plane. These rapid HOOP relaxations in the excited state are then followed by slower torsional deformations of the chromophore.
out-of-plane in opposite directions, consistent with the fact that the Az mode must have (-) symmetry with respect to a plane perpendicular to the C=C bond. This is precisely the direction of motion the hydrogens must follow when the double bond undergoes cis - trans isomerization. Because the 10, 1 1 , 12, and 14 HOOP wags of bathorhodopsin are all quite isolated, the relative directions of the HOOP displacements in the excited state are more difficult to determine.
These considerations suggest the model shown in Figure 10 for the relaxation of the excited states of rhodopsin and ba- thorhodopsin. The conformational energies of the ground and excited states of rhodopsin and bathorhodopsin are represented as a function of two internal vibrational coordinates associated with the 11,12 double bond: a relatively high-frequency HOOP (lo00 cm-') involving the 1 1 and 12 wags and a low frequency carbon double bond torsion (200 cm-I). The isom- erization in Figure 10 (left) begins with vertical excitation of the cis-rhodopsin chromophore. Relaxation in the excited state proceeds first via the hlgh-frequency HOOP distortion of 1 1 and 12 hydrogens 5-10' out of the local plane in opposite directions. This rapid HOOP relaxation, which involves little carbon motion, will then be followed by a slower relaxation along low frequency (1200 cm-') skeletal torsional coordinates. This torsional relaxation clearly provides the dominant con- tribution to the overall isomerization trajectory. The excit- ed-state displacement along the Cl1=Cl2 torsional coordinate could in principle also be determined from its resonance Ra- man intensity. However, since this line has not yet been identified, we assume that this torsion has an excited-state minimum near 90° (Rosenfeld et al., 1977; Birge & Hubbard, 1981). At this geometry, the carbon centers are likely to be pyramidal (Brooks & Schaefer, 1979) and highly polarizable (Salem, 1979) and/or dipolar (Mathies & Stryer, 1976). We may speculate that the same opsin charge which we have invoked to explain the perturbation of the bathorhodopsin ground state (Figure 9) stabilizes a dipolar excited-state conformation leading to bathorhodopsin. This could provide
an explanation for the order of magnitude increase in the cis - trans isomerization quantum yield in rhodopsin (0.67) relative to that of the 1 1-cis protonated Schiff base in solution (Rosenfeld et al., 1977). Figure 10 also depicts the excited state of bathorhodopsin, where the initial relaxation occurs via an in-phase (A,) displacement of tlie 1 1 and 12 hydrogens.
Conclusions In summary, our RR data on deuterium-substituted visual
pigment analogues have shown that the anomalous low wavenumber lines of bathorhodopsin at 853,875, and 921 cm-' are due to isolated 14, 10, and 1 1 hydrogen out-of-plane wagging modes of the retinal chromophore. The lack of coupling observed between the 1 1 HOOP wag and the 12 HOOP wag in bathorhodopsin contrasts sharply with the strong coupling observed between these wags in rhodopsin, isorhodopsin, and all-trans-retinal. This argues that the retinal chromophore of bathorhodopsin does not have a simple all- trans configuration with a twisted single bond conformation. Rather, more extensive electrostatic perturbations on the C,, region of the chromophore are required. Our results suggest that it will be important to explore whether an opsin charge near Cl1=CI2 can help to explain bathorhodopsin's efficient storage of photon energy (Cooper, 1979) and its unusual formation kinetics (Peters et al., 1977).
Acknowledgments We thank Professor W. L. Hubbell for the use of his
darkroom facilities. B. Barry provided valuable assistance in the purification of our visual pigment analogues. Insightful discussions with Professors R. R. Birge, B. Honig, M. EI- Sayed, L. Stryer, and A. Warshel during the course of this research are also gratefully acknowledged.
Supplementary Material Available Complete (600-1700 cm-') spectra of 77 K photostationary
steady-state mixtures of bovine visual pigments containing unmodified, 10-D, 11-D, 12-D, 20,14-D4, 10,ll-Dz, ll,12-D2, and 15-D retinal analogues obtained by using a blue (488 nm) probe beam, with and without a yellow pump beam, as well as a yellow (568 and 585 nm) probe beam, with and without a blue pump, for each derivative (Figures 11-18), spectra of the 15-D and 15,N-Dz derivatives (Figure 18), a comparison of blue (488 nm) probe spectra, with and without a yellow pump, for the 19-D3, IO-D, and 19,10-D4 derivatives (Figure 19), and room temperature rapid-flow resonance Raman spectra (488 nm) of 19,10-D4 rhodopsin and isorhodopsin (Figure 20) (10 pages). Ordering information is given on any current masthead page.
References Arnaboldi, M., Motto, M. G., Tsujimoto, K., Balogh-Nair,
V., & Nakanishi, K. (1979) J. Am. Chem. Soc. 101,7082. Aton, B., Doukas, A. G., Narva, D., Callender, R. H., Dinur,
U., & Honig, B. (1980) Biophys. J. 29, 79. Birge, R. R., & Hubbard, L. M. (1981) Biophys. J. 34,517. Broek, A. D., & Lugtenburg, J. (1980) Recl. Trau. Chim.
Pays-Bas 99, 363. Brooks, B. R., & Schaefer, H. F., I11 (1979) J . Am. Chem.
SOC. 101, 307. Busch, G. E., Applebury, M. L., Lamola, A. A,, & Rentzepis,
P. M. (1972) Proc. Natl. Acad. Sci. U.S.A. 69, 2802. Cooper, A. (1979) Nature (London) 282, 531. Doukas, A. G., Aton, B., Callender, R. H., & Ebrey, T. G.
(1978) Biochemistry 17, 2430.
B A T H O R H O D O P S I N V I B R A T I O N A L A S S I G N M E N T
Eyring, G. (1981) Ph.D. Thesis, University of California, Berkeley, CA.
Eyring, G., & Mathies, R. (1979) Proc. Natl. Acad. Sci. U.S.A. 76, 33.
Eyring, G., Curry, B., Mathies, R., Broek, A,, & Lugtenburg, J. (1980a) J. Am. Chem. SOC. 102, 5390.
Eyring, G., Curry, B., Mathies, R., Fransen, R., Palings, I., & Lugtenburg, J. (1980b) Biochemistry 19, 2410.
Fransen, M. R., Luyten, W. C. M. M., van Thuijl, J., Lug- tenburg, J., Jansen, P. A. A., van Breugel, P. J. G. M., & Daemen, F. J. M. (1976) Nature (London) 260, 726.
Hayward, G., Carlsen, W., Siegman, A., & Stryer, L. (1981) Science (Washington, D.C.) 21 I , 942.
Honig, B., Dinur, U., Nakanishi, K., Balogh-Nair, V., Gaw- inowicz, M. A,, Arnaboldi, M., & Motto, M. G. (1979a) J. Am. Chem. SOC. 101, 7084.
Honig, B., Ebrey, T., Callender, R. H., Dinur, U., & Otto- lenghi, M. (1979b) Proc. Natl. Acad. Sci. U.S.A. 76,2503.
Hubbard, R., & Kropf, A. (1958) Proc. Natl. Acad. Sci. U.S.A. 44, 130.
Lewis, A. (1978) Proc. Natl. Acad. Sci. U.S.A. 75, 549. Marcus, M. A,, & Lewis, A. (1979) Photochem. Photobiol.
Mathies, R. (1981) Methods Enzymol. (in press). Mathies, R., & Stryer, L. (1976) Proc. Natl. Acad. Sci. U.S.A.
Mathies, R., & Yu, N.-T. (1978) J. Raman Spectrosc. 7, 349.
29, 699.
73, 2169.
V O L . 2 1 , N O . 2 , 1 9 8 2 393
Mathies, R., Oseroff, A. R., & Stryer, L. (1976) Proc. Natl. Acad. Sci. U.S.A. 73, 1.
Mathies, R., Freedman, T. B., & Stryer, L. (1977) J. Mol. Biol. 109, 367.
Oseroff, A. R., & Callender, R. H. (1974) Biochemistry 13, 4243.
Peters, K., Applebury, M. L., & Rentzepis, P. M. (1977) Proc. Natl. Acad. Sci. U.S.A. 74, 3119.
Peticolas, W. L., & Blazej, D. C. (1979) Chem. Phys. Lett. 63, 604.
Potts, W. J., & Nyquist, R. A. (1959) Spectrochim. Acta 15, 679.
Rosenfeld, T., Honig, B., Ottolenghi, M., Hurley, J., & Ebrey, T. G. (1977) Pure Appl. Chem. 49, 341.
Salem, L. (1979) Acc. Chem. Res. 12, 87. Sverdlov, L. M., Kovner, M. A,, & Krainov, E. P. (1974) in
Vibrational Spectra of Polyatomic Molecules, Wiley, New York.
Tang, J., & Albrecht, A. C. (1970) Raman Spectrosc. 2, 33. van der Meer, K., Mulder, J. J. C., & Lugtenburg, J. (1976)
Wald, G. (1968) Nature (London) 219, 800. Warshel, A. (1977) Annu. Rev. Biophys. Bioeng. 6, 273. Warshel, A. (1978) Proc. Natl. Acad. Sci. U.S.A. 75, 2558. Warshel, A,, & Dauber, P. (1977) J. Chem. Phys. 66,5477. Wilson, E. B., Decius, J. C., & Cross, P. C. (1955) in Mo-
lecular Vibrations, pp 58-61, McGraw-Hill, New York.