Full Terms & Conditions of access and use can be found at http://www.tandfonline.com/action/journalInformation?journalCode=ganp20 Download by: [College of Business Education] Date: 10 December 2016, At: 14:01 Journal of Asian Natural Products Research ISSN: 1028-6020 (Print) 1477-2213 (Online) Journal homepage: http://www.tandfonline.com/loi/ganp20 Assignment of absolute stereostructures through quantum mechanics electronic and vibrational circular dichroism calculations Peng Dai, Nan Jiang & Ren-Xiang Tan To cite this article: Peng Dai, Nan Jiang & Ren-Xiang Tan (2016) Assignment of absolute stereostructures through quantum mechanics electronic and vibrational circular dichroism calculations, Journal of Asian Natural Products Research, 18:1, 72-91, DOI: 10.1080/10286020.2015.1134502 To link to this article: http://dx.doi.org/10.1080/10286020.2015.1134502 Published online: 16 Feb 2016. Submit your article to this journal Article views: 102 View related articles View Crossmark data
Transcript
Full Terms & Conditions of access and use can be found athttp://www.tandfonline.com/action/journalInformation?journalCode=ganp20
Download by: [College of Business Education] Date: 10 December 2016, At: 14:01
Assignment of absolute stereostructures throughquantum mechanics electronic and vibrationalcircular dichroism calculations
Peng Dai, Nan Jiang & Ren-Xiang Tan
To cite this article: Peng Dai, Nan Jiang & Ren-Xiang Tan (2016) Assignment of absolutestereostructures through quantum mechanics electronic and vibrational circulardichroism calculations, Journal of Asian Natural Products Research, 18:1, 72-91, DOI:10.1080/10286020.2015.1134502
To link to this article: http://dx.doi.org/10.1080/10286020.2015.1134502
Assignment of absolute stereostructures through quantum mechanics electronic and vibrational circular dichroism calculations
Peng Daia, Nan Jiangb and Ren-Xiang Tana
astate Key laboratory of Pharmaceutical Biotechnology, institute of functional Biomolecules, nanjing university, nanjing 210093, china; bschool of Pharmacy, nanjing university, nanjing 210029, china
1. Introduction
Natural products present in plants, micro-organisms and (in)vertebrates have been widely used in traditional medicines and are a valuable source for drug discovery. In natural product chemistry, one of the major bottlenecks lies in the elucidation of their chirality which is a determinant for their biological properties [1].
To unambiguously assign the absolute configuration (AC), a variety of spectral (e.g. NMR and X-ray crystallography [2]) and chemical approaches such as Mosher’s reaction have been developed. However, these experimental techniques have practical problems. For example, X-ray crystallography method requires the crystalline structure of suitable quality; synthetic approaches are usually tedious. In most cases, a single experimental method seems insufficient to address the AC of complex chiral molecules. To overcome the limitation, the electronic circular dichro-ism (ECD) spectroscopy, capable of displaying differentiated ECD spectra of enantiomers, has appeared as an ideal approach due to its inexpensiveness and easy performance [3]. The interpre-tation procedure requires usually the chiroptical data for the pre-clarified reference compounds and some empirical or semi-empirical ECD rules such as octant rule [4] or excitation chirality method [5]. But such references are not always appreciable for the configurational elucidation for
ABSTRACTElucidation of absolute configuration of chiral molecules including structurally complex natural products remains a challenging problem in organic chemistry. A reliable method for assigning the absolute stereostructure is to combine the experimental circular dichroism (CD) techniques such as electronic and vibrational CD (ECD and VCD), with quantum mechanics (QM) ECD and VCD calculations. The traditional QM methods as well as their continuing developments make them more applicable with accuracy. Taking some chiral natural products with diverse conformations as examples, this review describes the basic concepts and new developments of QM approaches for ECD and VCD calculations in solution and solid states.
structurally complicated novel compounds. With the relevant advances in theoretical chemistry, the obstacle has been overcome by comparing the experimentally acquired ECD spectrum of a particular chiral molecule with those simulated for all optional diastereomers through quantum mechanics (QM) calculation.
However, the ECD-based approach is not suitable for the molecules without any chiral-ity-dependent chromophores. This frustration can be alleviated using vibrational circular dichroism (VCD) which is also workable for the AC determination purpose [6]. The VCD spectrum is theoretically acquirable for all infrared (IR)-active molecules because it meas-ures the absorption variation between left- and right-circularly polarized infrared radiation via molecular vibrational transitions [7]. Although the VCD experiments require usually larger quantity of sample (at least 10 mg, whereas ECD experiments need only 0.1–1.0 mg), they have much wider and more reliable applications in stereochemical analysis. The key for AC assignments is to avoid the unambiguity so that the earlier determinations have to be accomplished using reference chiroptical data and empirical rules [8,9]. This is also the case for the experimental VCD spectroscopy which has to be helped by the computation technology that clarifies the ambiguity [10–15].
Theoretical spectrum calculations of chiral molecules are not restricted to any struc-tural preconditions and molecular size. In particular, the influence of surroundings (e.g. solvent effects and intermolecular interactions in solid-state) [16] on conformations and spectral properties have been dealt with through various solvation models or computa-tional approaches for large-sized systems. This review will be concentrated on theoretical approaches as well as their applications in the ECD and VCD calculations for the AC assignment of natural products.
The article is organized as follows. In Section 2, various computational procedures and methods are introduced with an emphasis on the accurate and fast ECD/VCD calculations for large-sized aggregating systems in solution and solid states. Sections 3 and 4 present the applications for AC elucidations, and concluding remarks are given in the fifth section.
2. Theoretical concept
The principle flowchart of assigning ACs of chiral compounds in combination of QM ECD/VCD calculations with experimental measurements is summarized in Figure 1. General steps include: (i) screening the conformational space through conformational analysis or molecular dynamic (MD) simulation, (ii) obtaining chiroptical spectroscopic information on each located minimum by QM method, (iii) getting the total chiroptical signals by assem-bling those of all the minima through Boltzmann population or conformational averaging, (iv) correcting the overall chiroptical spectrum, and (v) assigning AC by comparing the acquired and calculated chiroptical spectra.
2.1. Potential energy surface scan
The chiroptical spectroscopy depends on the conformational diversity. In many cases, simply considering the global minimum is not sufficient to reproduce the experimentally recorded chiroptical curve. All the ECD contributions from significantly populated conformations should be considered. Thus, a detailed conformational investigation is indispensable to form the first step in the simulation of chiroptical curve (Figure 1). For the screening of a
74 P. DAi ET Al.
potential energy surface, Boltzmann-populated conformation analysis and MD simulation can be employed.
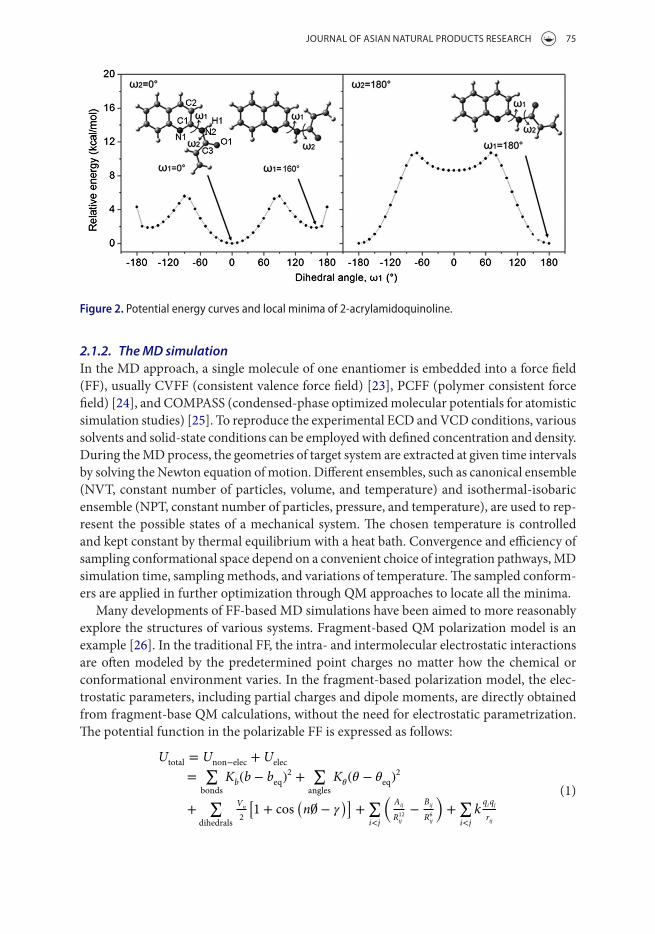
2.1.1. The Boltzmann approachAll the possible conformations or isomers of an arbitrary enantiomer can be generated through Boltzmann-populated conformation analysis method. This can be done by systematically analyzing the degrees of freedom, which are usually the dihedral angles of each flexible part of the molecule. As shown in Figure 2, the rotation energy profile can be calculated by rotating the flexible C1–N2 single bond with an interval of 10° for dihedral angle of ω1 (N1–C1–N2–C3) [17]. The possible conformations with relative energies lower than 3.0 kcal/mol will be employed to investigate the secondary degree of freedom (ω2, C1–N2–C3–O1). This procedure is tedious. Usually, the conformation analysis is carried out in two steps: (i) performing calculations at lower levels, such as semi-empirical methods (AM1 [18] and PM3 [19]) and Hartree–Fock (HF) method, to obtain the possible conformers; and (ii) optimizing the conformers within an ener-getic range of 3.0 kcal/mol at a higher level, e.g. density functional theory (DFT) with BLYP [20], B3LYP [20,21], B3PW91 [22] functionals, to locate all the minima that are significantly populated at a given temperature.
Figure 1. Principle flowchart for assigning ac of chiral compound by combining QM ecd and Vcd calculations with experimental measurements.
JouRNAl of AsiAN NATuRAl PRoDuCTs REsEARCh 75
2.1.2. The MD simulationIn the MD approach, a single molecule of one enantiomer is embedded into a force field (FF), usually CVFF (consistent valence force field) [23], PCFF (polymer consistent force field) [24], and COMPASS (condensed-phase optimized molecular potentials for atomistic simulation studies) [25]. To reproduce the experimental ECD and VCD conditions, various solvents and solid-state conditions can be employed with defined concentration and density. During the MD process, the geometries of target system are extracted at given time intervals by solving the Newton equation of motion. Different ensembles, such as canonical ensemble (NVT, constant number of particles, volume, and temperature) and isothermal-isobaric ensemble (NPT, constant number of particles, pressure, and temperature), are used to rep-resent the possible states of a mechanical system. The chosen temperature is controlled and kept constant by thermal equilibrium with a heat bath. Convergence and efficiency of sampling conformational space depend on a convenient choice of integration pathways, MD simulation time, sampling methods, and variations of temperature. The sampled conform-ers are applied in further optimization through QM approaches to locate all the minima.
Many developments of FF-based MD simulations have been aimed to more reasonably explore the structures of various systems. Fragment-based QM polarization model is an example [26]. In the traditional FF, the intra- and intermolecular electrostatic interactions are often modeled by the predetermined point charges no matter how the chemical or conformational environment varies. In the fragment-based polarization model, the elec-trostatic parameters, including partial charges and dipole moments, are directly obtained from fragment-base QM calculations, without the need for electrostatic parametrization. The potential function in the polarizable FF is expressed as follows:
(1)
Utotal = Unon−elec + Uelec
=∑
bonds
Kb(b − beq)2 +
∑angles
K𝜃(𝜃 − 𝜃eq)2
+∑
dihedrals
Vn
2
�1 + cos
�n� − 𝛾
��+∑i<j
�Aij
R12ij
−Bij
R6ij
�+∑i<j
kqiqj
rij
Figure 2. Potential energy curves and local minima of 2-acrylamidoquinoline.
76 P. DAi ET Al.
where all the bond stretching, angle bending, torsional rotating, and Lennard-Jones param-eters are taken from the traditional FF. The electrostatic parameters (atomic partial charges, qi and qj) are dynamical variables and can be updated according to the environment. These values can be obtained through conventional QM calculations for small- or medium-sized molecules. For the large-sized systems, such as cyclic peptides, fragmentation QM method can be adopted. It has been demonstrated that the polarization model is able to reasonably describe the diverse conformations of α-conotoxin, a group of cone snail-derived cyclic peptides that selectively act on a wide range of ion channels [26].
2.2. Simulation of ECD spectrum
Based on all the possible conformers, the second step of ECD computation comprises cal-culating electronic transition from ground state to excited states, fitting overall spectrum, and performing UV correction.
2.2.1. Calculation of electronic transitionThe main quantity in ECD spectroscopy is the rotatory strength (R, in unit of cgs), which determines the intensity of an absorption band in the wavelength range of λ1–λ2 [27]. For its calculation, there are two formalisms: the velocity formalism and the dipole length. They are origin-invariant [28] and origin-dependent [29], respectively, resulting in a subject of controversy about which kind of formalism should be preferred.
To calculate the rotatory strength R, a transition between |Ψ0⟩ and |Ψk⟩ is firstly theo-retically defined as
where �̂� and m̂ are the electric and magnetic dipole operators, respectively. An inspection of Equation (2) shows that the electric and magnetic transition dipole moments (𝜇0k and m⃗0k) and the angle between both moments have to be determined. Subsequently, the rotator strengths R0k are transformed and superimposed with Gaussian or Lorentz functions [30], centered at each wavelength λk of the electronic transitions, to give the Δε (i.e. the differ-ence between the absorption coefficients for the left- and right-circularly polarized light):
where β means the correction, considering the perturbation of external field by the local one of chromophore; NA is the Avogadro constant; Γk is the exponential half-width, which is an adjustable parameter for reproducing the experimentally acquired CD curve. Normally, the default values of 0.05–0.20 eV are used for Γk.
The simulation of ECD spectrum is accompanied by the calculation of UV property. In this case, the basic quantity is electric dipole strength D, which can be used to obtain oscillator strength f. The extinction coefficient, ε, obtained from the calculated oscillator strengths f0k, can be overlapped with Gaussian function equation:
(2)R0k = Im
�⟨Ψ0��̂��Ψk⟩⟨Ψ0�m̂�Ψk⟩
�
= ��𝜇0k�� ⋅ ��m⃗0k
�� ⋅ cos�𝜇0k, m⃗0k
�
(3)Δ�(�) =16�2�NA�
6909ℏc⋅
�
k
R0k
e−�
�−�k
Γk
�2
Γk
√�
JouRNAl of AsiAN NATuRAl PRoDuCTs REsEARCh 77
Some useful softwares can be applied to fit the ECD and UV spectra from the calculated rotatory strength R, electric dipole strength D, and oscillator strength f. One good example is SpecDis [31]. It is very convenient to compare the results between the velocity and the dipole length represents, as well as the band shapes fitted from Gaussian and Lorentzian function equations.
The major challenge in calculating electronic transition lies in the reasonable considera-tion of electron correlation. To obtain reliable ground state and excited state wave functions, several methods can be used: (i) configuration-interaction (CI) method [32], in which the semiempirical CNDO/S [33], ZINDO/S [34], and OM2 [35] with CI expansion can be applied to cover single excitations; (ii) time-dependent (TD) perturbation approach, which has been utilized in both HF and DFT methods [36]; (iii) DFT/MRCI approach, which combines the DFT method with multi-reference (MR) wavefunction in the CI expansion covering single and double excitations [37]. Among these methods, the most popular one is the time-dependent density functional theory (TDDFT), which has been successfully employed to calculate the ECD spectrum for many chiral natural products [38].
2.2.2. Fitting overall ECD spectrumAfter the single ECD and UV curves for all conformers are obtained, they are superposed to give the overall simulated ECD and UV spectra. At this time, the Boltzmann-weighted populations or conformational average can be used, according to whether Boltzmann-weighted-based conformational analysis method or MD simulation is used in the confor-mational searching.
2.2.3. UV correctionThere exist systematic errors in the calculations of excitation energies as well as the corre-sponding wavelengths. It is important to eliminate these systematic errors for the reproduc-tion of experimental ECD curve and a reliable AC assignment. The commonly used method is UV correction [39]. By comparing the overall UV spectrum with the experimentally recorded one, the deviation in the maximum-adsorption wavelength can be estimated and applied to correct the calculated overall ECD spectrum.
2.3. Simulation of VCD spectrum
2.3.1. Calculation of vibrational transitionThe VCD spectroscopy measures the differential absorption between left- and right-cir-cularly polarized infrared radiation by molecular vibrational transition. The VCD and IR intensities for the fundamental transition from (|0⟩ and |1⟩) of ith vibrational mode are given by the rotational strength (R) and dipole strength (D), respectively [40,41]:
(4)�(�) =4�2�NA�
6909ℏc⋅
�
k
D0k
e−�
�−�k
Γk
�2
Γk
√�
(5)R(i) = E⃗01(i) ⋅ Im[M⃗10(i)
]
78 P. DAi ET Al.
where E⃗01(i) and M⃗10(i) are the electric and magnetic transition dipole moments associated with the first vibrational transition (|0⟩ and |1⟩) of the ith normal mode.
The sign of the rotational strength is determined by the angle ξ(i) between the vectors E⃗01(i) and M⃗10(i).
where |E⃗01(i)| and |Im[M⃗10(i)]| are the lengths of vectors E⃗01(i) and M⃗10(i), respectively. Thus, R(i) > 0 if ξ(i) < 90°, whereas for ξ(i) > 90°, R(i) < 0.
Within the harmonic approximation, the transition dipole moments E⃗01(i) and M⃗10(i) can be written as a sum of contributions from each atom:
For a direct comparison to experiment, the calculated dipole and rotational strengths have to be transformed to molar absorptivity (ε) and differential molar absorptivity (Δε), respec-tively, using the following formulas [42]:
where NA is the Avogadro number, ℏ is the Planck constant, c is the light speed in vacuum, Di(ν) and Ri(ν) are the dipole and rotational strengths associated with the normal mode i, ν is the frequency of the normal mode i, and Δε is the difference between the molar absorp-tivities for the left- and right-circularly polarized light.
The VCD spectrum is usually simulated by representing the peaks as Lorentzian bands [42(b)]. Various half-widths, usually 10–30 cm−1 can be used for different vibration modes. For example, a half-width of 30 cm−1 was used for the associated NH-stretching modes, and that of 15 cm−1 for the free N–H and C–H stretches [43].
For the calculation of vibrational transition, DFT theory is the most popular method. Various DFT functionals, such as O3LYP [21(b),44,45], B3LYP [21,22], B3P86 [21(a),46], B3PW91 [23], X3LYP [21,47], B98 [48], MPW1LYP [49], MPW1PW91 [23,49], PBE1PBE
(6)D(i) =|||E⃗01(i)
|||2
(7)cos 𝜉(i) =E⃗01(i) ⋅ Im
[M⃗10(i)
]
|||E⃗01(i)|||||||Im
[M⃗10(i)
]||||
(8)E⃗01(i) =∑
𝜆
E⃗𝜆01(i)
(9)M⃗10(i) =∑
𝜆
M⃗𝜆10(i)
(10)�(�) =8�3NA
3 ⋅ 2.303ℏc�Di(�)
(11)Δ�(�) =32�3NA
3 ⋅ 2.303ℏc�Ri(�)
JouRNAl of AsiAN NATuRAl PRoDuCTs REsEARCh 79
[50], and BHandHLYP [21] can be used with basis sets of 6–31G(d), 6–31+G(d,p), TZVP, and LanL2DZ.
2.3.2. Fitting overall VCD spectrumAfter the single VCD and IR curves for all conformers are obtained, they are superposed to give the overall simulated VCD and IR spectra. At this time, the Boltzmann-weighted populations or conformation average can be used, according to the selected conformational searching method.
2.3.3. IR scale factorThere are also systematic errors in the calculations of vibrational excitation energies as well as the corresponding wavenumbers. In order to reproduce the experimental VCD curve, these systematic errors should be eliminated by IR scale factor. By comparing the overall IR spectrum with the experimental IR curve, especially for the wavenumber of maximum-adsorption peak, the scale factor can be determined and employed to correct all the wavenumbers for the overall VCD spectrum.
3. AC elucidation of chiral molecules through ECD spectrum
3.1. Chiral molecules with stereogenic centers
Lasiodipline B (1, Figure 3(a)) from the culture of Lasiodiplodia pseudotheobromae F2 is a sulfur-containing diketopiperazine. The constitution of 1 and its relative configuration were determined by extensive NMR measurements and single crystal X-ray diffraction. Accordingly, its AC could be either (2R,5R) or fully opposite (2S,5S) [38(d)]. To differen-tiate two enantiomeric possibilities, the QM calculations of ECD and UV spectra for both possible stereostructures were carried out within the framework of TDDFT with hybrid B3LYP functional and diffuse and polarized 6–31+G(d,p) basis sets. Subsequently, com-parison with the experimentally measured curve for 1 was made. After a UV correction of 13 nm (red shift), the accordingly adapted ECD spectrum predicted for (2R,5R) perfectly reproduced the experimentally measured one (Figure 3(a)). Based on these results, the AC of 1 was determined to be (2R,5R) [38(d)].
Molecular orbital (MO) analysis of the (2R,5R)-enantiomer indicated that the negative Cotton effects (CEs) in the calculated curve were located around 215 and 256 nm, arising from electronic transition from the filled lone pair orbitals of oxygen and sulfur (nO and nS) to anti-bonding C=O MOs (�∗
C=O) (MO 59 → 63, MO 61 → 63, and MO 62 → 64, Figure 3(b)). These bands could be correlated to the peaks centered at 215 and 246 nm, respectively, in the experimental CD curve.
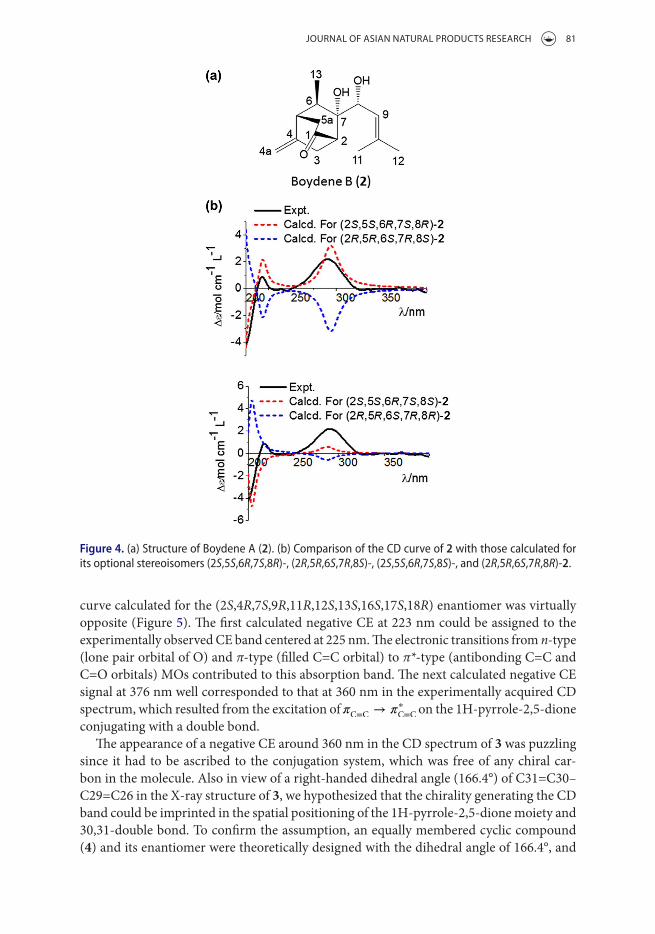
Another recent example in which TDDFT has been successfully applied to reproduce the experimentally measured ECD curve is boydene A (2), a skeletally unprecedented chiral natural product from the insect-derived P. Boydii [38(f)]. As can be seen in Figure 4, there were four possibilities of the relative configurations, (2S,5S,6R,7S,8R), (2R,5R,6S,7R,8S), (2S,5S,6R,7S,8S), and (2R,5R,6S,7R,8R), which were determined by the combination of 1H and 13C NMR spectra and 2D NMR results (1H–1H COSY, ROESY, HMQC and HMBC) [38(f)]. To elucidate its AC, TDDFT calculations at B3LYP/6–31G(d,p) level were per-formed, yielding a nearly perfect fit of the theoretical spectrum for (2S,5S,6R,7S,8R)-2 with the measured curve.
80 P. DAi ET Al.
3.2. Chiral molecules with stereogenic centers and chiral axis
Different conformational species with varying dihedral angles at the biaryl axis, can generate nearly opposite CD spectra. Taking as an example, the conformational analysis of streptoseo-mycin (3) within PCFF-based MD simulation in CH3OH solutions revealed that there was a facial transform between the left- and right-handed conformations for C31=C30–C29=C26 dihedrals, with the latter having a larger population (68.3%). From the 30 conformers drawn from the 3.0-ns MD simulation, the single ECD and UV spectra were calculated by use of the TDDFT method at B3LYP/6–31G(d) level. A comparison of the overall ECD spectra computed for the two enantiomers of 3 with the experimentally measured one showed a good agreement in the case of (2R,4S,7R,9S,11S,12R,13R,16R,17R,18S), whereas the ECD
Figure 3. (a) ac of lasiodipline B (1) attributed by comparison of experimentally measured cd curve (solid line) with the spectra calculated for (2R,5R) and (2S,5S) enantiomers (dotted lines). (b) contribution of electronic transitions to ces. the calculations were carried out within tddft framework at B3lYP/6–31+G(d,p) level.
JouRNAl of AsiAN NATuRAl PRoDuCTs REsEARCh 81
curve calculated for the (2S,4R,7S,9R,11R,12S,13S,16S,17S,18R) enantiomer was virtually opposite (Figure 5). The first calculated negative CE at 223 nm could be assigned to the experimentally observed CE band centered at 225 nm. The electronic transitions from n-type (lone pair orbital of O) and π-type (filled C=C orbital) to π*-type (antibonding C=C and C=O orbitals) MOs contributed to this absorption band. The next calculated negative CE signal at 376 nm well corresponded to that at 360 nm in the experimentally acquired CD spectrum, which resulted from the excitation of �C=C → �∗
C=C on the 1H-pyrrole-2,5-dione conjugating with a double bond.
The appearance of a negative CE around 360 nm in the CD spectrum of 3 was puzzling since it had to be ascribed to the conjugation system, which was free of any chiral car-bon in the molecule. Also in view of a right-handed dihedral angle (166.4°) of C31=C30–C29=C26 in the X-ray structure of 3, we hypothesized that the chirality generating the CD band could be imprinted in the spatial positioning of the 1H-pyrrole-2,5-dione moiety and 30,31-double bond. To confirm the assumption, an equally membered cyclic compound (4) and its enantiomer were theoretically designed with the dihedral angle of 166.4°, and
Figure 4. (a) structure of Boydene a (2). (b) comparison of the cd curve of 2 with those calculated for its optional stereoisomers (2S,5S,6R,7S,8R)-, (2R,5R,6S,7R,8S)-, (2S,5S,6R,7S,8S)-, and (2R,5R,6S,7R,8R)-2.
82 P. DAi ET Al.
Figure 5. comparison of the cd spectrum of 3 (solid line) with those (dotted lines) calculated for its enantiomers (2R-,4S-,7R-,9S-,11S-,12R-,13R-,16R-,17R-,18S)- and (2S-,4R-,7S-,9R-,11R-,12S-,13S-,16S-, 17S-,18R)-3.
Figure 6. theoretically designed cyclic compound (4) with left- and right-handed conformations in the conjugated double bonds and their computational cd spectra.
JouRNAl of AsiAN NATuRAl PRoDuCTs REsEARCh 83
the subsequent computation demonstrated that the left- and right-handed conformations exhibited respectively positive and negative CEs in the 350–400 nm, the latter of which matched well the experimentally acquired CD band of 3 around 360 nm (Figures 5 and 6).
The fluctuation of C31=C30–C29=C26 dihedrals of 3 in CH3OH solution, and its influ-ence on the CD spectra was investigated. The average C31=C30–C29=C26 dihedral angle of 173.5° possessed by the right-handed conformation along the MD simulation was well comparable to that (166.4°) displayed in its X-ray structure. This substantiated that negative CE around 360 nm in the CD spectrum of 3 was actually owing to an extra population of its right-handed conformations (Figure 7).
3.3. Solvent effects
(−)-Alternarlactam [(1S)-5], a new cytotoxin against two human cancer cell lines, was iso-lated from an endophyte culture and synthesized (along with (1R)-5) from readily available starting materials [16(b)]. Although there is only one stereogenic center at C-1, it could not be determined readily by the discerned CD bands since no model compound could be consulted. This frustration was overcome by the QM approach. TDDFT ECD calculations were performed on the pair of enantiomers at B3LYP/6–31+G(d,p) level within the polar-izable continuum model (PCM, CH3OH solvent: dielectric constant ε = 32.63) [16(b)]. The theoretical spectra and the experimentally measured ones were not a perfect match(Figure 8). Improved results were achieved by considering solvation effects (intermolecular hydro-gen bonding between solute and solvent molecules) through the use of explicit methanol molecule, as shown in Figure 8. This approach requires only slightly higher computational costs. In the spectrum calculated for (1S)-5 (Figure 8), there were two positive CEs at 220 and 336 nm, matching well with the observed bands at 218 and 333 nm, respectively. Concerning the assignment of these distinctive ECD bands, the excitations from n-type (lone pair orbital on O and N) and π-type (filled C=C orbital) MOs to π*-type (antibonding C=C and C=O orbitals) MO, contributed significantly to these absorbed bands. The first negative CE in the calculated ECD curve was located at 252 nm, corresponding to the broad band at 251 nm in the experimental spectrum. The �C=C → �∗
C=O played an important role.
Figure 7. the calculated ecd spectra for different conformations of (2R,4S,7R-,9S,11S,12R,13R,16R,17R,18S)-3 with left- and right-handed c31=c30–c29=c26 configurations. the conformations are drawn from the Md simulations.
84 P. DAi ET Al.
The next calculated negative CE at 364 nm could be assigned to the experimental CE at 365 nm. Contributed to this band was the excitation of �C=C to �∗
C=C and �∗C=O. Thus, the
stereochemical structure of the fungal metabolite was established as (1S)-configuration.The solvent effect in the simulation of ECD spectrum is an important factor to repro-
duce the experimentally measured curve, especially for the complex molecules with polar groups, and the explicit solute–solvent interactions have to be considered upon the ECD spectrum simulation.
4. VCD examples
The early QM VCD calculations were straightforwardly performed on monomers. But in some cases, the calculated VCD spectra from monomers do not match the experimentally recorded curve. Taking (1S)-5 as an example again, both MD simulations and QM confor-mational analysis revealed a facial transformation between the trans and cis configurations (Figure 9(a)) [16(a)]. Although this conformational flexibility was accounted by the MD simulation and Boltzmann-weighted population, the calculations relying on the monomers were difficult to globally reproduce the experimental VCD curve (Figure 9(b)) [16(a)]. This indicated that the intermolecular interactions in molecular aggregates were crucial to achieve a reasonable description of the VCD spectra in solid state.
The influence of the chemical environment on VCD spectra was also explored. Xu’s group investigated the concentration dependence of VCD spectra of glycidol in CDCl3 solution
Figure 8. attribution of the ac of (1S)-5 and (1R)-5 by comparing the experimental (solid line) with calculated (dotted lines) ecd spectra. the computation were carried out at B3lYP/6–31+G(d,p) level within two solvation models: PcM (red dotted line) and PcM combining explicit methanol molecule (PcM + explicit ch3oh, blue dotted line).
JouRNAl of AsiAN NATuRAl PRoDuCTs REsEARCh 85
and the self-aggregation effects through intermolecular O−H⋯O hydrogen bonding inter-actions [6(j, l),51]. The explicit solvent model based on a solute–solvent molecular cluster has also been employed to investigate the influence of intermolecular hydrogen bonding
Figure 9. conformation, ir, and Vcd spectra of (1S)-5 monomers. (a) the fluctuation of dihedral angle of χc15–o14–c8–c7 with the time in the Md simulations. (b) the ir (red lines) and Vcd (blue lines) spectra of (1S)-5 monomers, as well as the comparison of Boltzmann-weighted Vcd spectrum with experiment.
86 P. DAi ET Al.
interactions on the VCD spectra [6(j, l),51]. In fact, VCD in solid (e.g. KCl and KBr pellet, thin film, and crystal) phase [52–55] shows some advantages (such as the desire to get solvent-free spectra and the insolubility of the sample) with respect to the solution phase VCD. However, it is rather difficult to employ the traditional QM models to treat the com-plicated packing systems, due to the high computational scaling O(Nα) (N is the number of basis sets and α ≥ 3) of conventional methods. To address the issue, the fragmentation QM methods, whose basic idea can be referred in the references [56–58], were employed to investigate the packing effects on the IR and VCD spectroscopies of (1S)-5 in solid state.
The main procedures of the fragment-based VCD calculation include: (i) dividing the whole packing system into n fragments, each consisting of several monomers (Figure 10); (ii) putting every fragment in the presence of background point charges to model the
Figure 10. flowchart for the fragmentation-based Vcd calculation of the packing systems.
JouRNAl of AsiAN NATuRAl PRoDuCTs REsEARCh 87
influence of the other distant parts; (iii) performing conventional QM VCD calculation individually on the ith fragment, yielding the rotational strength, Ri, which determines the VCD of the vibrational transition 0 → i; and (iv) obtaining the total VCD intensity, RTotal, of the whole packing system from an universal set of the VCD signals of all the fragments. For the specific vibration transition, the vibrational frequencies are directly obtained from the frequency calculations on individual fragment [16(a)].
In order to simulate the solid-state VCD spectra, the fragment-based VCD calculations were implemented on the packing systems with different packing densities. The configura-tions of the packing systems were sampled through 3-ns MD simulations with the density set to 0.5 and 0.8 g/cm3, respectively [16(a)]. The VCD spectra of the (1S)-5 packing systems are displayed in Figure 11.
The VCD spectra with the density of 0.5 g/cm3 showed acceptable agreement with the experimental curve. Under this density, the dominant configurations were those clustered with intermolecular hydrogen bonding interactions. There were three characteristic (±) counterparts in the spectrum. The first one was located at about 1700 cm−1, which arose from the C=O stretching vibrations in the cyclopentanone. Secondly, the C=O in δ-lactam and C=C stretching vibrations contributed to the peaks in the regions of 1650−1600 cm−1.
Figure 11. Vcd spectra of the (1S)-5 packing systems. comparison was made between the calculations (blue lines) and experiment (gray lines).
88 P. DAi ET Al.
Finally, the out-plane bending vibrations of the methyl group led to the (±) peaks near 1350 cm−1 [16(a)].
In the case of the VCD spectra simulated under higher density of 0.8 g/cm3, the absorp-tion band originating from the C=O stretching vibration in the cyclopentanone unit shifted to a higher frequency, while that in the δ-lactam moved to a lower wavenumber around 1600 cm−1. On the other hand, the VCD intensities of the C=O stretching vibrations were very weak. In fact, under such a high packing density, the (1S)-5 molecules tended to take the ordered π–π stacking configurations [16(a)].
5. Concluding remarks
The experimental chiroptical spectroscopic techniques in combination with modern, high-level QM ECD and VCD calculations have become more dominant for the stereochemical assignment of chiral compounds. Prior to chiroptical spectroscopic calculations, a scan of the potential energy surface by DFT methods or MD simulations is recommended. The TDDFT for ECD calculations are preferable in most cases, because they provide acceptable accuracies at moderate computational costs. Inclusion of solvent effects through solvation models, such as PCM, as well as its combination of explicit solvent molecules, is important for the polar and charged chiral molecules. With continuing advancements in theoretical chemistry and computation technology, it will be more accurate to address the AC of natural and synthetic chiral compounds through a routine combination of ECD/VCD calculations and measurements.
Acknowledgments
We apologize to those whose relevant investigations failed to be highlighted owing to page space limitations.
Funding
Authors’ related research work was co-financed by the Ministry of Science and Technology [2013AA092901]; National Natural Science Foundation of China [21303086], [81121062], [21132004], [21072092]; the Natural Science Foundation of Jiangsu Province [BK20130884]; the Research Fund for Doctoral Program of Higher Education [20123234120012].
References
[1] (a) M. Kobayashi, T. Koyama, K. Ogura, S. Seto, F.J. Ritter, and I.E.M. Brueggemann-Rotgans, J. Am. Chem. Soc. 102, 6602 (1980); (b) K. Mori and H. Ueda, Tetrahedron Lett. 22, 461 (1981); (c) J.P. Vité, D. Klimetzek, G. Loskant, R. Hedden, and K. Mori, Naturwissenschaften. 63, 582 (1976); (d) J.R. Miller, K. Mori, and W.L. Roelofs, J. Insect Physiol. 23, 1447 (1977); (e) J.H. Tumlinson, M.G. Klein, R.E. Doolittle, T.L. Ladd, and A.T. Proveaux, Science. 197, 789 (1977); (f) M. Mori, K. Mochizuki, M. Kohno, T. Chuman, A. Ohnishi, H. Watanabe, and K. Mori, J. Chem. Ecol. 12, 83 (1986); (g) D.G. James and K. Mori, J. Chem. Ecol. 21, 403 (1995); (h) J.G. Millar, H.D. Pierce, A.M. Pierce, A.C. Oehlschlager, and J.H. Borden, J. Chem. Ecol. 11, 1071 (1985); (i) M.C. Cammaerts and K. Mori, Physiol. Entomol. 12, 381 (1987); (j) T. Suzuki, J. Kozaki, R. Sugawara, and K. Mori, Appl. Entomol. Zool. 19, 15 (1984); (k) P.G. McDowell, A. Hassanali, and R. Dransfield, Physiol. Entomol. 10, 183 (1985).
JouRNAl of AsiAN NATuRAl PRoDuCTs REsEARCh 89
[2] (a) C. Fattorusso, E. Stendardo, G. Appendino, E. Fattorusso, P. Luciano, A. Romano, and O. Taglialatela-Scafati, Org. Lett. 9, 2377 (2007); (b) D.R. Price and J.F. Stanton, Org. Lett. 4, 2809 (2002).
[3] (a) F. Furche, R. Ahlrichs, C. Wachsmann, E. Weber, A. Sobanski, F. Vögtle, and S. Grimme, J. Am. Chem. Soc. 122, 1717 (2000); (b) A. Jiemchooroj and P. Normana, J. Chem. Phys. 126, 134102 (2007); (c) D.M. McCann and P.J. Stephens, J. Org. Chem. 71, 6074 (2006); (d) Y.Q. Ding, X.C. Li, and D. Ferreira, J. Nat. Prod. 73, 435 (2010); (e) Y.Q. Ding, X.C. Li, and D. Ferreira, J. Org. Chem. 72, 9010 (2007).
[4] (a) W. Moffitt, R.B. Woodward, A. Moscowitz, W. Klyne, and C. Djerassi, J. Am. Chem. Soc. 83, 4013 (1961); (b) G. Snatzke and G. Eckhardt, Tetrahedron. 24, 4543 (1968); (c) T.D. Bouman and D.A. Lightner, J. Am. Chem. Soc. 98, 3145 (1976).
[5] N. Harada and K. Nakanishi, Acc. Chem. Res. 5, 257 (1972). [6] (a) F.J. Devlin and P.J. Stephens, J. Org. Chem. 70, 2980 (2005); (b) F.J. Devlin, P.J. Stephens,
P. Scafato, S. Superchi, and C. Rosini, Chirality. 14, 400 (2002); (c) F.J. Devlin, P.J. Stephens, K.B. Wiberg, J.R. Cheeseman, and M.J. Frisch, J. Org. Chem. 67, 8090 (2002); (d) F.J. Devlin, P.J. Stephens, P. Scafato, S. Superchi, and C. Rosinib, Tetrahedron: Asymmetry. 12, 1551 (2001); (e) P.J. Stephens and F.J. Devlin, Chirality. 12, 172 (2000); (f) P.J. Stephens, A. Aamouche, F.J. Devlin, S. Superchi, M.I. Donnoli, and C. Rosini, J. Org. Chem. 66, 3671 (2001); (g) F.J. Devlin and P.J. Stephens, J. Am. Chem. Soc. 121, 7413 (1999); (h) A. Aamouche, F.J. Devlin, and P.J. Stephens, J. Am. Chem. Soc. 122, 2346 (2000); (i) E. Debie, P. Bultinck, W. Herreboutb, and B. Veken, Phys. Chem. Chem. Phys. 10, 3498 (2008); (j) M. Losada and Y.J. Xu, Phys. Chem. Chem. Phys. 9, 3127 (2007); (k) F. Gangemi, R. Gangemi, G. Longhi, and S. Abbate, Phys. Chem. Chem. Phys. 11, 2683 (2009); (l) G.C. Yang and Y.J. Xu, Phys. Chem. Chem. Phys. 10, 6787 (2008); (m) T. Mugishima, M. Tsuda, Y. Kasai, H. Ishiyama, E. Fukushi, J. Kawabata, M. Watanabe, K. Akao, and J. Kobayashi, J. Org. Chem. 70, 9430 (2005); (n) V.P. Nicu, J. Neugebauer, and E.J. Baerends, J. Phys. Chem. A. 112, 6978 (2008); (o) F. Wang and P.L. Polavarapu, J. Phys. Chem. A. 105, 6991 (2001); (p) F. Gangemi, R. Gangemi, G. Longhi, and S. Abbate, Vib. Spectrosc. 50, 257 (2009); (q) T. Kuppens, K. Vandyck, J. Eycken, W. Herrebout, B. Veken, and P. Bultinck, Spectrochim. Acta. A. 67, 402 (2007); (r) H. Izumi, S. Yamagami, S. Futamura, L.A. Nafie, and R.K. Dukor, J. Am. Chem. Soc. 126, 194 (2004).
[7] L.A. Nafie, Appl. Spectrosc. 50, A14 (1996). [8] (a) W.T. King and A.J. Zelano, J. Chem. Phys. 47, 3197 (1967); (b) R.A.G.D. Silva, J. Kubelka,
and T.A. Bour, Biopolymers. 53, 380 (2000); (c) J. Hilario, J. Kubelka, F.A. Syud, S.H. Gellman, and T.A. Keiderling, Biopolymers. 67, 233 (2002); (d) P. Bour and T.A. Keiderling, J. Phys. Chem. B. 109, 23687 (2005).
[9] M. Gulotta, D.J. Goss, and M. Diem, Biopolymers. 28, 2047 (1989). [10] (a) G. Longhi, R. Gangemi, F. Lebon, E. Castiglioni, S. Abbate, V.M. Pultz, and D.A. Lightner,
J. Phys. Chem. A. 108, 5338 (2004); (b) S. Abbate, E. Castiglioni, F. Gangemi, R. Gangemi, G. Longhi, R. Ruzziconi, and S. Spizzichino, J. Phys. Chem. A. 111, 7031 (2007); (c) S. Abbate, E. Castiglioni, F. Gangemi, R. Gangemi, and G. Longhi, Chirality. 21, E242 (2009).
[11] (a) V.P. Nicu, J. Neugebauer, S.K. Wolff, and E.J. Baerends, Theor. Chem. Acc. 119, 245 (2008); (b) V.P. Nicu, E. Debie, W. Herrebout, B. Veken, P. Bultinck, and E.J. Baerends, Chirality. 21, E287 (2010).
[12] (a) H. Izumi, S. Futamura, L.A. Nafie, and R.K. Dukor, Chem. Rec. 3, 112 (2003); (b) H. Izumi, A. Ogata, L.A. Nafie, and R.K. Dukor, Chirality. 21, E172 (2009).
[13] (a) A.G. Petrovic, P.L. Polavarapu, R. Mahalakshmi, and P. Balaram, Chirality. 21, E76 (2009); (b) P. Polavarapu, N. Jeirath, T. Kurtán, G. Pescitelli, and K. Krohn, Chirality. 21, E202 (2009).
[14] F.J. Devlin, P.J. Stephens, and B. Figadère, Chirality. 21, E48 (2009). [15] M. Urbanová, Chirality. 21, E215 (2009). [16] (a) N. Jiang, R.X. Tan, and J. Ma, J. Phys. Chem. B. 115, 2801 (2011); (b) A.H. Zhang, N. Jiang,
W. Gu, J. Ma, Y.R. Wang, Y.C. Song, and R.X. Tan, Chem. Eur. J. 16, 14479 (2010); (c) R. Kuroda and Y. Saito, Bull. Chem. Soc. Jpn. 49, 433 (1976); (d) P. Biscarini and R. Kuroda, Inorg. Chim. Acta. 154, 209 (1988); (e) P. Biscarini, R. Franca, and R. Kuroda, Inorg. Chem. 34, 4618 (1995).
90 P. DAi ET Al.
[17] J.W. Zhao, L. Nie, L.Y. Zhang, Y. Jin, Y. Peng, S.H. Du, and N. Jiang, Anal. Methods. 5, 3009 (2013).
[18] M.J.S. Dewar, E.G. Zoebisch, E.F. Healy, and J.J.P. Stewart, J. Am. Chem. Soc. 107, 3902 (1985). [19] (a) J.J.P. Stewart, J. Comput. Chem. 10, 209 (1989); (b) J.J.P. Stewart, J. Comput. Chem. 10, 221
(1989). [20] (a) A.D. Becke, Phys. Rev. A. 38, 3098 (1988); (b) C. Lee, W. Yang, and R.G. Parr, Phys. Rev.
B. 37, 785 (1988). [21] P.J. Stephen, F.J. Devlin, C.F. Chabalowski, and M.J. Frisch, J. Phys. Chem. 98, 11623 (1994). [22] J.P. Perdew, J.A. Chevary, S.H. Vosko, K.A. Jackson, M.R. Pederson, D.J. Singh, and C. Fiolhais,
Phys. Rev. B. 48, 4978 (1993). [23] P.D. Osguthorpe, V.A. Roberts, D.J. Osguthorpe, J. Wolff, M. Genest, and A.T. Hagler, Proteins.
4, 31 (1988). [24] (a) S.R. Marder, J.W. Perry, B.G. Tiemann, C.B. Gorman, S. Gilmour, S. Biddle, and G. Bourhill,
J. Am. Chem. Soc. 115, 2524 (1993); (b) H. Sun, Macromolecules. 28, 701 (1995); (c) H. Sun, S.J. Mumby, J.R. Maple, and A.T. Hagler, J. Phys. Chem. 99, 5873 (1995); (d) M.J. Hwang, T.P. Stochfisch, and A.T. Hagler, J. Am. Chem. Soc. 116, 2515 (1994).
[25] (a) H. Sun and D. Rigby, Spectrochim. Acta Part A. 153, 1301 (1997); (b) D. Rigby, H. Sun, and B.E. Eichinger, Polym. Int. 44, 311 (1997); (c) H. Sun, J. Phys. Chem. B. 102, 7338 (1998); (d) S.W. Bunte and H. Sun, J. Phys. Chem. B. 104, 2477 (2000); (e) M.J. McQuaid, H. Sun, and D. Rigby, J. Comput. Chem. 25, 61 (2004).
[26] (a) N. Jiang and J. Ma, J. Phys. Chem. A. 112, 9854 (2008); (b) N. Jiang and J. Ma, J. Phys. Chem. B. 114, 11241 (2010).
[27] E.U. Condon, W. Altar, and H. Eyring, J. Chem. Phys. 5, 753 (1937). [28] R.A. Harris, J. Chem. Phys. 50, 3947 (1969). [29] W. Moffit, J. Chem. Phys. 25, 467 (1956). [30] J.A. Schellman, Chem. Rev. 75, 323 (1975). [31] T. Bruhn, Y. Hemberger, A. Schaumlöffel, and G. Bringmann, SpecDis Version 1.51 (University
of Wuerzburg, Wuerzburg, Germany, 2011). [32] (a) C.D. Sherrill and H.F. Schaefer III, Adv. Quant. Chem. 34, 143 (1999); (b) C.J. Cramer,
Essentials of Computational Chemistry (Wiley, Chichester, 2002), pp. 191–232. [33] (a) J.D. Bene and H.H. Jaffé, J. Phys. Chem. 48, 1807 (1968); (b) J.D. Bene and H.H. Jaffé, J.
Phys. Chem. 48, 4050 (1968); (c) R.L. Ellis, G. Kuehnlenz, and H.H. Jaffé, Theor. Chim. Acta. 26, 131 (1972).
[34] J. Ridley and M. Zerner, Theor. Chim. Acta. 32, 111 (1973). [35] W. Weber and W. Thiel, Theor. Chem. Acc. 103, 495 (2000). [36] E.K.U. Gross, J.F. Dobson, and M. Petersilka, Top. Curr. Chem. 181, 81 (1996). [37] S. Grimme and M. Waletzke, J. Chem. Phys. 111, 5645 (1999). [38] (a) H.M. Ge, W.H. Yang, Y. Shen, N. Jiang, Z.K. Guo, Q. Luo, Q. Xu, J. Ma, and R.X. Tan,
Chem. Eur. J. 16, 6338 (2010); (b) W.H. Yuan, M. Liu, N. Jiang, Z.K. Guo, J. Ma, J. Zhang, Y.C. Song, and R.X. Tan, Eur. J. Org. Chem. 2010, 6348 (2010); (c) Y.L. Zhang, J. Zhang, N. Jiang, Y.H. Lu, L. Wang, S.H. Xu, W. Wang, G.F. Zhang, Q. Xu, H.M. Ge, J. Ma, Y.C. Song, and R.X. Tan, J. Am. Chem. Soc. 133, 5931 (2011); (d) W. Wei, N. Jiang, Y.N. Mei, Y.L. Chu, H.M. Ge, Y.C. Song, S.W. Ng, and R.X. Tan, Phytochemistry. 100, 103 (2014); (e) W.H. Yuan, Z.W. Wei, P. Dai, H. Wu, Y.X. Zhao, M.M. Zhang, N. Jiang, and W.F. Zheng, Chem. Biodivers. 11, 1078 (2014); (f) Q. Wu, N. Jiang, W.B. Han, Y.N. Mei, H.M. Ge, Z.K. Guo, S.W. Ng, and R.X. Tan, Org. Biomol. Chem. 12, 9405 (2014).
[39] G. Bringmann and S. Busemann, Natural Product Analysis: Chromatography, Spectroscopy, Biological Testing, (Vieweg, Wiesbaden, 1998), pp. 195–211.
[40] P.J. Stephens, J. Phys. Chem. 89, 748 (1985). [41] V.P. Nicu, J. Autschbach, and E.J. Baerends, Phys. Chem. Chem. Phys. 11, 1526 (2009). [42] (a) P.L. Polavarapu, Vibrational Spectra: Principles and Applications with Emphasis on Optical
Activity (Elsevier, Amsterdam, 1998); (b) F.J. Devlin, P.J. Stephens, J.R. Cheeseman, and M.J. Frisch, J. Phys. Chem. A. 101, 9912 (1997).
[43] T.B. Freedman, X. Cao, D.A. Young, and L.A. Nafie, J. Phys. Chem. A. 106, 3560 (2002).
JouRNAl of AsiAN NATuRAl PRoDuCTs REsEARCh 91
44 N.C. Handy and A. Cohen, J. Mol. Phys. 99, 403 (2001). [45] W.M. Hoe, A.J. Cohen, and N.C. Handy, Chem. Phys. Lett. 341, 319 (2001). [46] J.P. Perdew, Phys. Rev. B. 33, 8822 (1986). [47] X. Xu and W.A. Goddard III, PNAS. 101, 2673 (2004). [48] H.L. Schmider and A.D. Becke, J. Chem. Phys. 108, 9624 (1998). [49] C. Adamo and V. Barone, J. Chem. Phys. 108, 664 (1998). [50] J.P. Perdew, K. Burke, and M. Ernzerhof, Phys. Rev. Lett. 77, 3865 (1996). [51] (a) M. Losada, H. Tran, and Y.J. Xu, J. Chem. Phys. 128, 014508 (2008); (b) G. Yang and Y.J.
Xu, J. Chem. Phys. 130, 164506 (2009). [52] R. Kuroda and T. Honma, Chirality. 12, 269 (2000). [53] C. Johannessena and P.W. Thulstrup, Dalton Trans. 10, 1028 (2007). [54] E. Castiglioni, P. Biscarini, and S. Abbate, Chirality. 21, E28 (2009). [55] G. Pescitelli, T. Kurtán, U. Flörke, and K. Krohn, Chirality. 21, E181 (2009). [56] (a) S. Li, W. Li, and T. Fang, J. Am. Chem. Soc. 127, 7215 (2005); (b) W. Li, T. Fang, and S. Li,
J. Chem. Phys. 124, 154102 (2006); (c) W. Li, S. Li, and Y. Jiang, J. Phys. Chem. A. 111, 2193 (2007); (d) H. Cao, T. Fang, S. Li, and J. Ma, Macromolecules. 40, 4363 (2007); (e) S. Li, W. Li, T. Fang, J. Ma, and Y. Jiang, Low Scaling Quantum Chemical (LSQC) program Version 1.1 (Nanjing University, Nanjing, 2006); (f) S. Li and W. Li, Annu. Rep. Prog. Chem. Sect. C: Phys. Chem. 104, 256 (2008); (g) W. Hua, T. Fang, W. Li, J.G. Yu, and S. Li, J. Phys. Chem. A. 112, 10864 (2008).
[57] (a) V. Deev and M.A. Collins, J. Chem. Phys. 122, 154102 (2005); (b) M.A. Collins and V.A. Deev, J. Chem. Phys. 125, 104104 (2006); (c) H.M. Netzloff and M.A. Collins, J. Chem. Phys. 127, 134113 (2007).
[58] (a) S.R. Gadre, R.N. Shirsat, and A.C. Limaye, J. Phys. Chem. 98, 9165 (1994); (b) K. Babu and S.R. Gadre, J. Comput. Chem. 24, 484 (2003); (c) V. Ganesh, R.K. Dongare, P. Balanarayan, and S.R. Gadre, J. Chem. Phys. 125, 104109 (2006).