Associate Professor of Medicine Division of Gastroenterology & Hepatology Indiana University School of Medicine Indianapolis, IN Post Conference Update: Highlights from the American Association for the Study of Liver Diseases PAUL KWO, MD PAUL KWO, MD
Transcript
Associate Professor of MedicineDivision of Gastroenterology & Hepatology
Indiana University School of MedicineIndianapolis, IN
Post Conference Update: Highlights from the American Association for the Study of Liver Diseases
PAUL KWO, MDPAUL KWO, MD
Faculty:Content Development and Training
Douglas T. Dieterich, MDProfessor of MedicineDivision of Liver DiseasesMount Sinai School of Medicine New York, New York
Paul Y. Kwo, MDAssociate Professor of Medicine Division of Gastroenterology Indiana University School of MedicineIndianapolis, Indiana
Mark S. Sulkowski, MDAssociate Professor of MedicineJohns Hopkins University School of MedicineMedical Director, Viral Hepatitis CenterJohns Hopkins Medical InstitutionBaltimore, Maryland
Tram Tran, MDMedical DirectorLiver TransplantationCedars Sinai Medical CenterAssociate Professor University of California Los Angeles School of Medicine Los Angeles, California
Learning Objectives (CME, CE, CPE)
● At the completion of this educational activity, participants should be able to:- Discuss significant developments in the diagnosis and
management of hepatitis B- Summarize new drugs and treatment strategies for
hepatitis B- Describe recent hepatitis therapy toxicity, drug interaction
and side effect data and strategies for management- Identify new therapeutic strategies to avoid or overcome
antiviral resistance- Highlight diagnosis and management approaches for
hepatitis B in individuals co-infected with HIV
Wait-list Mortality Among Liver Transplant Candidates with CHB
● Comparison of outcomes for CHB and other liver disease etiologies on LTx wait-list (1995-2006)- CHB pts (N=2,236): 36% Asian
Pacific; 15% HCC
● Wait-list Outcomes Comparison: - CHB deaths significantly higher- CHB LTx rates significantly lower- Post- MELD: CHB higher death and
lower LTx rates persisted
● Conclusions: - CHB pts on wait-list have worse
outcomes than other liver disease etiologies
- Early Diagnosis and intervention for CHB are essential to improve outcomes
Kim W, et al. 60th AASLD; Boston, MA; October 30-November 3, 2009; Abst. 3.
Hepatic Steatosis Associated with Severe Fibrosis in CHB
● Comparison of steatosis and insulin resistance (IR) in CHB and chronic hepatitis C (CHC) and effect on fibrosis (N=340)- Steatosis prevalence similar- IR rate higher in CHC
● For CHB, severe fibrosis (F3-F4) independently associated with: Older age (OR 1.054, p=0.02) Low platelet levels (OR 0.984,
Time of Follow-up (Years)Time of Follow-up (Years)
Cu
mu
lati
ve
Ha
zard
of
De
ve
lop
me
nt
to H
CC
Cu
mu
lati
ve
Ha
zard
of
De
ve
lop
me
nt
to H
CC
CHB + NAFLDCHBNAFLD
CHB + NAFLDCHBNAFLD
Cumulative Risk of HCC
Quality of Care of CHB in a Managed Care Setting
● Retrospective study using database of pts in managed care from 2001-2007 (N=250,401)
● Epidemiology and quality of care for CHB pts evaluated (N=1,163)
● Finding: Significant numbers of CHB pts did not have appropriate follow-up, screening or testing - For 2006 and 2007:
• No primary care follow-up in 31% and 26%
• No gastroenterology visit in 74% and 71%
● Conclusion: Significant deficiencies exist in quality of care for CHB in managed care setting
Sy T, et al. 60th AASLD; Boston, MA; October 30-November 3, 2009; Abst. 1341.
Per
cent
of P
atie
nts
Lack of Screening and Testing in CHB Patients
27 23
63
80
46
0102030405060708090
100
Without Screening for HCVWithout Screening for HCCWithout Documented HIV TestingWithout Testing for HAV ImmunityWithout imaging Surveillance
Diagnosis and Management of CHB by Primary Care Physicians
● Online surveys of PCPs regarding CHB in Asian-American pts (N=393)
● Most PCPs consider CHB serious and prevalent, but many don’t screen all Asian-American pts for CHB
● PCPs diagnosed over half of CHB in their practice
• 50% monitored without Tx; ~33% received CHB Tx
• ALT and HBV DNA commonly used to determine whether to Tx
• ~62% not familiar with current CHB Tx guidelines
● PCPs likely to refer CHB pts with advanced disease, worsening rapidly, or with resistance to Tx
● Conclusion: PCPs would benefit from more education regarding CHB and Tx guidelines
Upadhyaya N, et al. 60th AASLD; Boston, MA; October 30-November 3, 2009; Abst. 394.
PCP Beliefs and Screening
Per
cent
of p
rovi
ders
9788
32
0
20
40
60
80
100
CHB Serious in Asian-Americans
CHB Prevalent in Asian-Americans
CHB Screening of all Asian-Americans
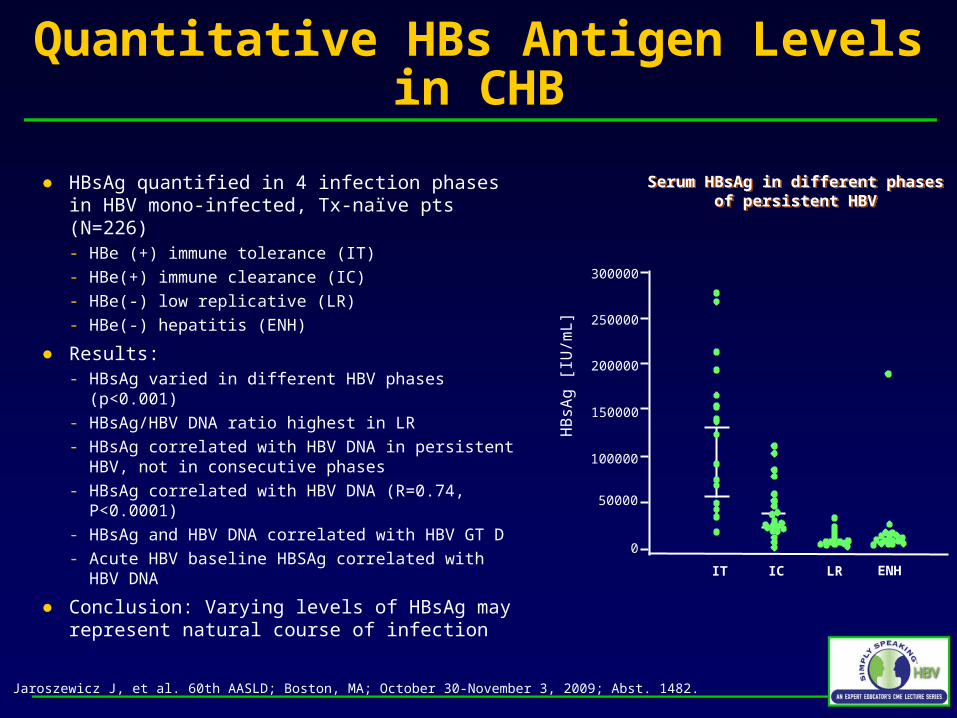
Quantitative HBs Antigen Levels in CHB
● HBsAg quantified in 4 infection phases in HBV mono-infected, Tx-naïve pts (N=226) - HBe (+) immune tolerance (IT)
- HBe(+) immune clearance (IC)
- HBe(-) low replicative (LR)
- HBe(-) hepatitis (ENH)
● Results: - HBsAg varied in different HBV phases (p<0.001)
- HBsAg/HBV DNA ratio highest in LR
- HBsAg correlated with HBV DNA in persistent HBV, not in consecutive phases
- HBsAg correlated with HBV DNA (R=0.74, P<0.0001)
- HBsAg and HBV DNA correlated with HBV GT D
- Acute HBV baseline HBSAg correlated with HBV DNA
● Conclusion: Varying levels of HBsAg may represent natural course of infection
Jaroszewicz J, et al. 60th AASLD; Boston, MA; October 30-November 3, 2009; Abst. 1482.
Serum HBsAg in different phasesof persistent HBV
Serum HBsAg in different phasesof persistent HBV
0
300000
250000
200000
IT IC LR ENHH
BsA
g [
IU/m
L]
150000
100000
50000
Long-term Serial HBV-DNA Levels after Spontaneous HBeAg Seroconversion
● Assessment of serial HBV DNA levels in CHB pts by ALT levels after spontaneous HBeAg seroconversion - Persistently normal ALT (PNALT, N=58)
- Minimally elevated ALT: ≥1 ALT 1-2 x ULN (MALT, N=52)
● MALT had significantly higher overall HBV DNA levels than PNALT (p=0.008)
● These data suggest that HBV DNA level <5 log10 copies/ml and PNALT are appropriate criteria for inactive HBV
Chen Y, et al. 60th AASLD; Boston, MA; October 30-November 3, 2009; Abst. 1499.
HBV DNA Levels (log10 c/mL)
Mean
level
<4 log10 in all
assays
<5 log10 in all
assays
≥5 log10
Only 1 assay ≥ 2 assays
PNALT 3.00±1.48 20.7% 72.4% 20.7% 6.9%
MALT 3.50±1.47 15.4% 51.9% 19.2% 28.9%
p value <0.0001 0.636 0.043 1.000 0.005
HBeAg Seroconversion During Treatment Does Not Lead to Durable Remission of CHB● Evaluation of pts with HBeAg
seroconversion on nucleos(t)ide analog (NA) Tx (N=48)- Median follow-up: 58 months (N=44)- NA Tx Used: 27 LAM, 13 ADV, 5 ETV, 2 TDF, 1
ADV + LAM
● 74% with HBeAg seroreversion by 3 years after HBeAg seroconversion
- High HBV DNA independent predictor of seroreversion (HR 1.36 per, P=0.006)
● Virologic recurrence occurred in 66%- Associated with drug resistance in 53%
● Conclusions:- HBeAg seroconversion not durable in a
majority of cases- NA should be continued indefinitely or until
HBsAg seroconversion
Reasons for Recurrence
Durable Remission after HBeAg Seroconversion
Perquin M, et al. 60th AASLD; Boston, MA; October 30-November 3, 2009; Abst. 219.
Pro
po
rtio
n o
f P
atie
nts
(%
)
0
20
40
60
80
100
0 12 24 36 48
N=42N=4235%35%
Treatment MonthTreatment Month
HBeAg negative and HBV DNA < 10,000 copies/mL
Per
cen
t o
f P
atie
nts
50%
67%
33%
20%17%
7% 7%
0%
0%
10%
20%
30%
40%
50%
60%
70%
Virologic Recurrence Serologic and VirologicRecurrence
Resistance
Treatment Discontinuation
Non-compliance
Suboptimal Suppression
Risk of HCC in CHB
● Retrospective-prospective study of CHB patients +/- cirrhosis (CI) on HBV therapy > 12 months (n=956)
● Cumulative HCC rate: 4.8% (46/956) within 3.9 yrs
● Cumulative HCC rate increases with CHB disease severity, older age and male gender
Papatheodoridis G, et al. 60th AASLD; Boston, MA; October 30-November 3, 2009; Abst. 137.
HR (95% CI) P
Severity of liver disease
CHB only Referent ---
Compensated CI 2.3 (1.2-4.6) 0.016
Decompensated CI 3.7 (1.3-10.0) 0.012
Age group at treatment onset (yrs)
< 50 Referent ---
50-60 7.7 (1.7-34.5) 0.007
> 60 16.7 (3.9-72.1) <0.001
Gender
Male Referent ---
Female 0.3 (0.1-0.8) 0.003
Causes of Death with CHB in US
● Cohort study of HMO members with CHB (n=6,689)- 48% women; 68.3% Asian-Pacific, 11.8% White- Minimal Exposure to HBV antivirals
● HBV related deaths- 10 year death rates: women < men (1.2% vs 4.8%), except within ages 20-29- Predictors of death in both sexes: age, pre-existing decompensated cirrhosis, HCC, cancer and diabetes. - White and unknown race were additional predictors in men.
Mean Number of Portal Tracts per Bx 16.05 +/- 0.77 7.49 +/- 0.65 <0.001
# of Specimens ≥10mm 93/100 43/100 <0.001
# of Specimens ≥15mm 52/100 17/100 <0.001
# of Specimens with ≥6 Portal Tracts 99/100 52/100 <0.001
Economic Advantages of Transient Elastography In CHB
● Study evaluating number of HBsAg+ patients (n=98) requiring liver biopsy (LBx) using international guidelines or Chan algorithm- Chan algorithm: LBx only if intermediate liver Transient elastography
● Results:- Fewer LBx if Chan algorithm used rather than APASL guidelines (20 vs. 84)- Annual cost savings from reduced liver biopsy = $83,328
Guirgis M, et al. 60th AASLD; Boston, MA; October 30-November 3, 2009; Abst. 498.
No LBx (n=14)
No LBx (n=14)
LBx (n=84)LBx
(n=84)
AGE ≥40(64)
ALT ≥ HNALTDNA ≥2000
Age <40(20)
LBx According To APASL GuidelinesLBx According To APASL Guidelines
LBx according to Chan algorithmLBx according to Chan algorithm
Normal ALT
≤5.0kPaReassurance
n=42
>5.0-6.0kPaObserve
n=9
>6.0-9.0kPaLBxn=12
>9.0-12.0kPaConsider Tx
n=5
>12.0kPaConsider Tx
n=4
Elevated ALT
<5.0kPaReassurance
n=6
>5.0-7.5kPaObserve
n=8
>7.5-12.0kPaLBxn=8
>12.0-13.4kPaConsider Tx
n=0
>13.4kPaConsider Tx
n=3
Prognostic Value of Non-invasive Diagnostics for Liver Fibrosis in CHB and CHC
● Liver fibrosis evaluated in pts with CHB and CHC (n=200)- 3 study groups: Doppler
Ultrasonography (DUS), transient elastography (TE) and FibroTest (FT)
- Liver biopsies in all pts on day of noninvasive test
● All found to be accurate in diagnosing severe fibrosis (F2-F4) in pts with CHB and CHC
● Conclusion: DUS, TE and FT all appear to be reliable in diagnosing severe fibrosis and to have clinical utility
SAPI: Splenic Artery Pulsatility Index.
MVPV: Mean Velocity of Portal Vein blood flow. Pavlov C, et al. 60th AASLD; Boston, MA; October 30-November 3, 2009; Abst. 1660.
ROC-curves of Severe (F2-F4)Liver Fibrosis Diagnostics
0
0.2
0.4
0.6
0.8
1
0 0.2 0.4 0.6 0.8 1
Transient ElastographyAUROC=0.888 (p<0.001)
FibroTestAUROC=0.884 (p<0.001)
DUS SAPIAUROC=0.843 (p<0.001)
DUS MVPVAUROC=0.695 (p=0.001)
Se
ns
itiv
ity
Specificity
CHB and Risk for Pancreatic Cancer?
● Retrospective study of pts who had HBV testing between 1995-2008 (n=95,920)
● Risks for pancreatic cancer assessed according to HBV status
● Univariate analysis found previous HBV exposure associated with pancreatic CA (HR 2.493, p<0.001), but multivariate model (which included race, sex and age) did not:
● When cohort analysis is adjusted for covariates, only age and diabetes are predictors of pancreatic cancer
Tang J, et al. 60th AASLD; Boston, MA; October 30-November 3, 2009; Abst. 1486.
Variable Hazard Ratio 95% CI P – Value
Previous HBV Exposure 1.411 0.877-2.271 0.156
Active HBV Infection 1.075 0.149-7.764 0.943
Race (African American) 1.134 0.755-1.704 0.943
Age 1.077 1.062-1.093 <0.001
Sex (male) 1.023 0.691-1.516 0.908
HIV 1.274 0.398-4.080 0.683
Diabetes 1.884 1.268-2.800 0.002
Studies GS-102 and GS-103: Safety and Tolerability of TDF in Patients with CHB
TDF 300 mg
TDF 300 mg
Week 240Liver Biopsy
Week 48Liver Biopsy
Pre-treatment Liver Biopsy
RA
ND
OM
IZA
TIO
N 2
:1
Tenofovir 300 mg
Adefovir 10 mg
Open-label8 Years
Double Blind
Week 144 End of Study
5 Years2 Years
Week 72 HBV DNA ≥400 copies/mL: Option to add FTC) to TDF in a fixed dose tablet
1 Year
Randomized, Double-Blind, Comparison of TDF vs. ADV for CHB
Marcellin P, et al. 44th EASL; Copenhagen, Denmark; April 22-26, 2009; Abst. 925.
22
Study 102 (HBeAg Negative):HBV DNA <400 Copies/mL (ITT)
0
10
20
30
40
50
60
70
80
90
100
Pat
ien
ts (
%)
Pat
ien
ts (
%)
88%
WeeksWeeks
Double-BlindDouble-Blind Open-LabelOpen-Label
TDF to TDFADV to TDF
93%
87%P<0.001
63%
Marcellin P, et al. Hepatology. 2009;50(suppl):532A-533A. Abstract 481.
18% of patients were lamivudine experienced and of these 93% and 96% of TDF to TDF and ADV to TDF patients had HBV DNA <400 copies/mL at week 96.
0 24 48 72 96 120 144
23
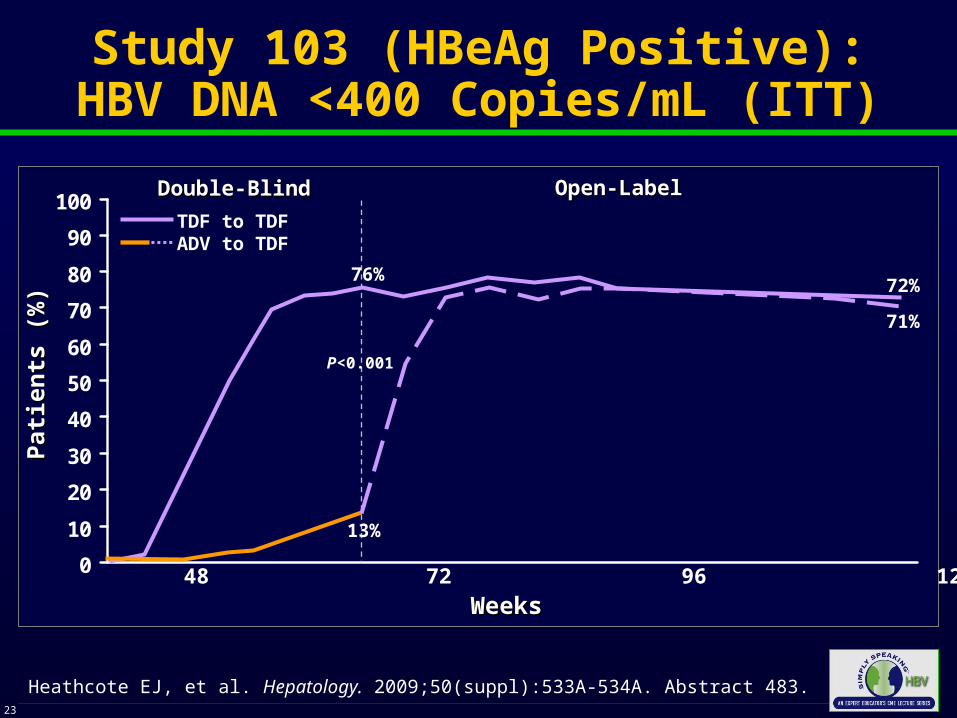
Study 103 (HBeAg Positive):HBV DNA <400 Copies/mL (ITT)
0
10
20
30
40
50
60
70
80
90
100
Pat
ien
ts (
%)
Pat
ien
ts (
%)
0 24 48 72 96 120 144
72%
WeeksWeeks
Double-BlindDouble-Blind
Heathcote EJ, et al. Hepatology. 2009;50(suppl):533A-534A. Abstract 483.
Open-LabelOpen-Label
TDF to TDFADV to TDF
76%
71%
P<0.001
13%
Study 103: Comparison of Long-term Outcomes of TDF and ADV Arms
● At Year 3 of Study 103, 80% of patients remained on treatment- 93% had HBV DNA <400 copies/mL (OT)- 8% cumulative probability of HBsAg loss- No resistance to TDF- Favorable tolerability profile with no change in creatinine levels
Heathcote E, et al. 60th AASLD; Boston, MA; October 30-November 3, 2009; Abst. 483.
Cu
mu
lati
ve P
rob
abil
ity
Fu
nct
ion
Est
imat
e
0.10
0.05
0.000 12 24 36 48 60 72 84 96 108 120 132 144
Weeks on Study
8%
At Week 48 all patientsinitiate Open-Label TDF
TDF-TDFADV-TDF
Cumulative Probability of HBsAg Loss
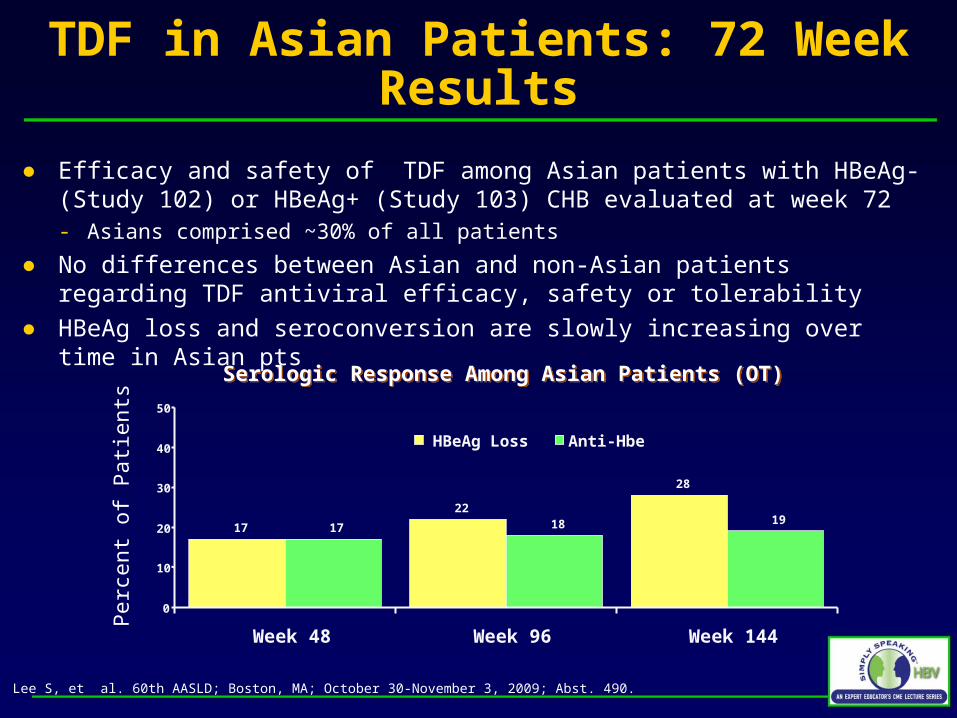
TDF in Asian Patients: 72 Week Results
● Efficacy and safety of TDF among Asian patients with HBeAg- (Study 102) or HBeAg+ (Study 103) CHB evaluated at week 72- Asians comprised ~30% of all patients
● No differences between Asian and non-Asian patients regarding TDF antiviral efficacy, safety or tolerability
● HBeAg loss and seroconversion are slowly increasing over time in Asian pts
Lee S, et al. 60th AASLD; Boston, MA; October 30-November 3, 2009; Abst. 490.
Serologic Response Among Asian Patients (OT)Serologic Response Among Asian Patients (OT)
Per
cent
of P
atie
nts
17
22
28
17 18 19
0
10
20
30
40
50
Week 48 Week 96 Week 144
HBeAg Loss Anti-Hbe
Long-term follow-up of CHB Patients Treated with TDF
● Mono-infected CHB Patients treated with TDF (300 mg/day) at 19 centers from 2002-2009 (n=194)- Majority with previous NA Tx, mainly
LAM (57%)
● 75% achieved HBV DNA <400 copies/mL by 1 year- 92% achieved HBV DNA <400
copies/mL by 2 years- Pts with slow decrease in HBV DNA
often had ADV resistance
● Small, significant decrease in HBsAg levels
● No resistance to TDF
De Man A, et al. 60th AASLD; Boston, MA; October 30-November 2009; Abst. 221.
Probability of Achieving HBV DNALevel <400 copies/mL
0
100
80
60
40
20
0 3 6 9 12
Pa
tie
nts
wit
h H
BV
DN
A <
40
0 c
op
ies
/mL
(%
)
Months of TDF Treatment
ETV-022: Loss of HBsAg after Treatment with ETV or LAM
● Evaluation of HBsAg loss by HBV genotype in study ETV-022- HBeAg(+) nucleoside-naïve adults with CHB, elevated
serum ALT, and compensated liver disease- Randomized to double-blind treatment for up to 96 weeks
with ETV (0.5 mg/day) or LAM (100 mg/day), with up to 24 weeks of off-treatment follow-up
● HBsAg was measured at regular intervals during on- and off-treatment follow-up
Gish R, et al. 60th AASLD; Boston, MA; October 30-November 3, 2009; Abst. 388.
ETVLVD
ETVLVD
ETV-022: Loss of HBsAg and HBV Genotypes
● 18 pts treated with entecavir had HBsAg loss- 8.4% and 13.5% for genotype A and D, respectively
Gish R, et al. 60th AASLD; Boston, MA; October 30-November 3, 2009; Abst. 388.
Characteristics of Patients with and without HBsAg loss
Proportion of Patients with HBsAg Loss by Genotype (Week 120)
Genotype
% w
ith H
BsA
g Lo
ss
Patients with HBsAg Loss
N=28
Patients without HBsAg Loss
N=681
Male 82% 75%
Asian 14% 59%
Caucasian 79% 38%
Mean Viral Load(log10 copies/mL)
9.8 9.6
Mean Knodell macroinflammatory score 9.1 7.7
Median serum ALT (U/L) 163 101
5.1%
0%
10%
13.5%
0.9%
2.9%
8.4%
2.8%
0%0%
7.1%
1.3%
0%
4.1%
0
2
4
6
8
10
12
14
16
A B C D F Other Total
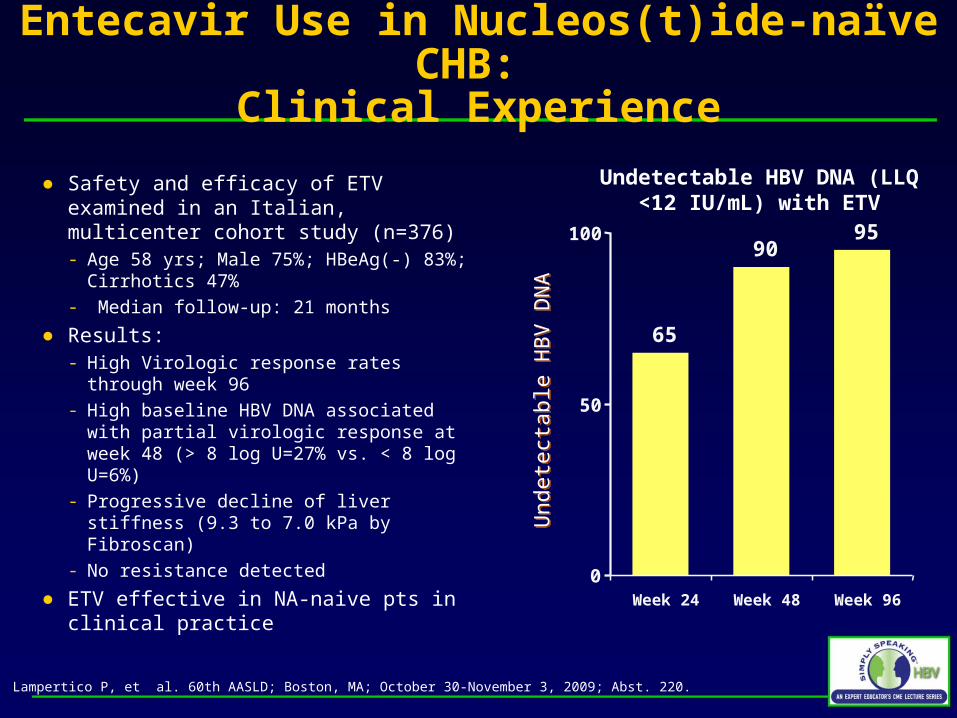
Entecavir Use in Nucleos(t)ide-naïve CHB: Clinical Experience
● Safety and efficacy of ETV examined in an Italian, multicenter cohort study (n=376)- Age 58 yrs; Male 75%; HBeAg(-) 83%;
Cirrhotics 47%- Median follow-up: 21 months
● Results:- High Virologic response rates through
week 96- High baseline HBV DNA associated with
partial virologic response at week 48 (> 8 log U=27% vs. < 8 log U=6%)
- Progressive decline of liver stiffness (9.3 to 7.0 kPa by Fibroscan)
- No resistance detected
● ETV effective in NA-naive pts in clinical practice
Lampertico P, et al. 60th AASLD; Boston, MA; October 30-November 3, 2009; Abst. 220.
Und
etec
tabl
e H
BV
DN
AU
ndet
ecta
ble
HB
V D
NA
Undetectable HBV DNA (LLQ <12 IU/mL) with ETV
65
9095
0
50
100
Week 24 Week 48 Week 96
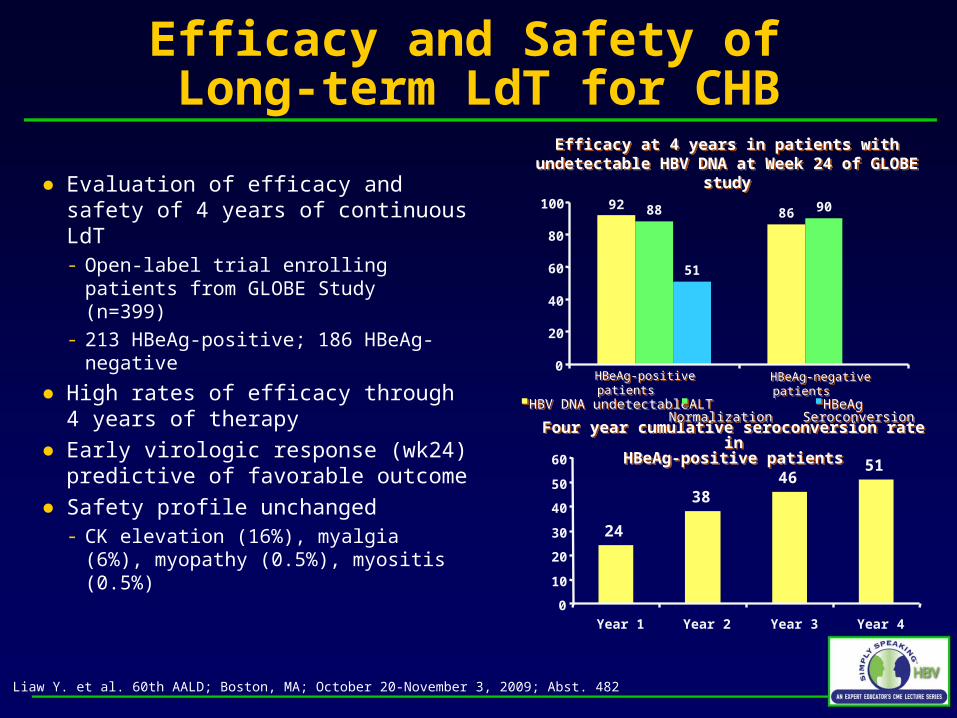
Efficacy and Safety of Long-term LdT for CHB
● Evaluation of efficacy and safety of 4 years of continuous LdT- Open-label trial enrolling patients
from GLOBE Study (n=399)
- 213 HBeAg-positive; 186 HBeAg-negative
● High rates of efficacy through 4 years of therapy
● Early virologic response (wk24) predictive of favorable outcome
● Safety profile unchanged- CK elevation (16%), myalgia (6%),
myopathy (0.5%), myositis (0.5%)
Liaw Y. et al. 60th AALD; Boston, MA; October 20-November 3, 2009; Abst. 482
Four year cumulative seroconversion rate inHBeAg-positive patients
Four year cumulative seroconversion rate inHBeAg-positive patients
Efficacy at 4 years in patients with undetectable HBV DNA at Week 24 of GLOBE study
Efficacy at 4 years in patients with undetectable HBV DNA at Week 24 of GLOBE study
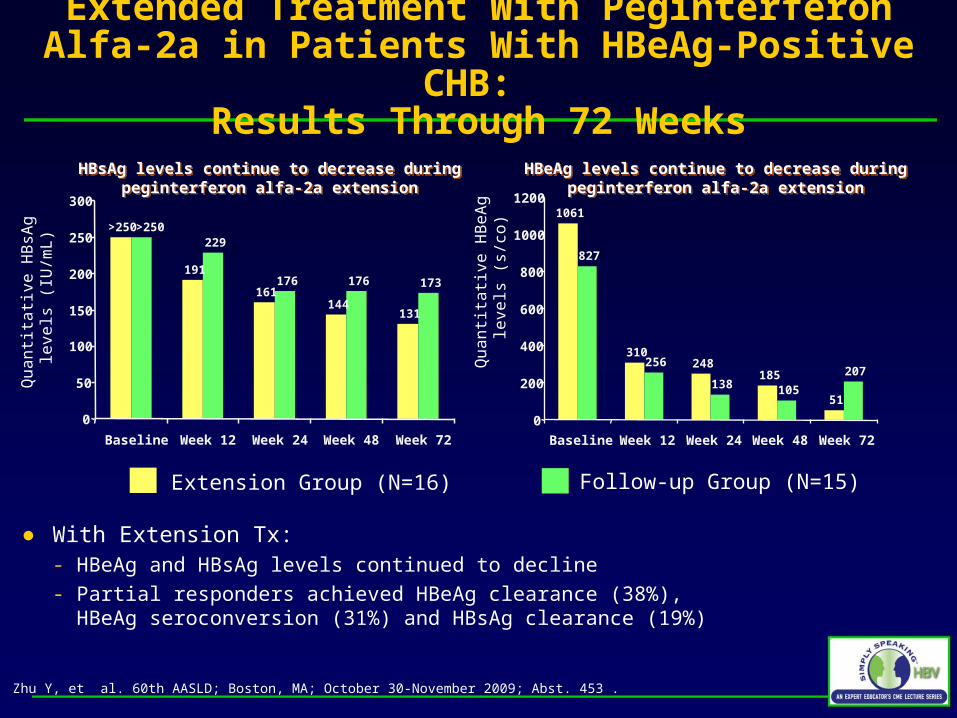
Extended Treatment With PegIFN in Patients With HBeAg-Positive CHB
● Study evaluating whether extending peginterferon alfa-2a to 72 weeks improves HBeAg seroconversion rate in partial responders (N=31)- Partial responders: no HBeAg seroconversion at week 48, but HBV DNA
<10,000 copies/mL
Zhu Y, et al. 60th AASLD; Boston, MA; October 30-November 2009; Abst. 453.
Study DesignStudy Design
Peginterferon alfa-2a(180 µg/week; n=65)
Peginterferon alfa-2a(180 µg/week; n=16)
0 48 72
Follow-up off Tx (n=15)
Extended Treatment With Peginterferon Alfa-2a in Patients With HBeAg-Positive CHB:
Results Through 72 Weeks
● With Extension Tx:- HBeAg and HBsAg levels continued to decline- Partial responders achieved HBeAg clearance (38%),
HBeAg seroconversion (31%) and HBsAg clearance (19%)
Zhu Y, et al. 60th AASLD; Boston, MA; October 30-November 2009; Abst. 453 .
HBsAg levels continue to decrease during peginterferon alfa-2a extension
HBsAg levels continue to decrease during peginterferon alfa-2a extension
HBeAg levels continue to decrease during peginterferon alfa-2a extension
HBeAg levels continue to decrease during peginterferon alfa-2a extension
Qu
an
tita
tive
HB
sAg
le
vels
(IU
/mL
)
Qu
an
tita
tive
HB
eA
g
leve
ls (
s/co
)Extension Group (N=16) Follow-up Group (N=15)
191
161144
131
229
176 176 173
>250>250
0
50
100
150
200
250
300
Baseline Week 12 Week 24 Week 48 Week 72
1061
310248
185
51
827
256
138 105
207
0
200
400
600
800
1000
1200
Baseline Week 12 Week 24 Week 48 Week 72
Capsid Assembly Inhibitors Active Against HBV Variants Resistant to Nucleos(t)ides
● HBV capsid is an icosahedral complex of 120 capsid protein dimers- Phenylpropenamides (AT-61 & AT-130) and heteroaryl-dehydropyrimidines
(BAY-41 4109) interfere with HBV capsid assembly
● In vitro study using HepG2 stable cell lines expressing HBV mutants resistant to Nucleos(t)ide analogs- Treated twice a week with increasing concentrations of AT-61, AT-130 and
BAY-41 4109
- Encapsidated DNA was quantified to determine concentration of drug that inhibits 50% of viral genome replication (IC50)
● Replication of WT and resistant variants was suppressed by all 3 drugs without cytotoxicity
● Targeting HBV nucleocapsid assembly or stability may represent a novel approach for HBV treatment
Billioud G, et al. 60th AASLD; Boston, MA; October 30-November 3, 2009; Abst 393.
ADV + LAM Associated with Fewer Long-term Symptoms than ADV Alone in CHB patients
Carey I, et al. 60th AASLD; Boston, MA; October 30-November 3, 2009; Abst 417.
Baseline clinical characteristics
ETV (n=59) LAM+ADV (n=197)
Males 79% 78%
Median age (years) 39 40
HBeAg+ 29% 35%
Cirrhosis 37% 34%
Duration (months) 12.3 ± 0.5 17.9 ± 1.1
HBV DNA log10
(IU/ml)5.3 ± 0.3 4.9 ± 0.1
HBV DNA >104 IU/ml 36% 38%
ALT (IU/L) 90.0 ± 13.3 88.3 ± 15.2
Platelets (x109/ml) 208 ± 5 193 ± 8
LAM + ADV vs. ETV in Treatment-naïve, CHB Patients: Efficacy and Safety Outcomes
● LAM + ADV and ETV had similar proportions achieve complete response (HBV DNA < 12 IU/mL)
● NR rates similar in each group - 1 pt in each group developed VB
- No viral mutations with drug resistance; including those with VB or NR
● Safety was similar with no difference in serum creatinine or eGFR over time- Serum phosphate levels fell
significantly in the LAM+ADV group but not in the ETV group
Carey I, et al. 60th AASLD; Boston, MA; October 30-November 3, 2009; Abst. 417.
MonthsMonths
% o
f P
atie
nts
% o
f P
atie
nts
Proportion of Complete Responders(HBV DNA <12 IU/mL)
Proportion of Complete Responders(HBV DNA <12 IU/mL)
48
60 61
72 74
43
56 55
69 71
0
25
50
75
100
3 6 9 12 18
LAM + ADV
ETV
ETV + TDF for patients with CHB, Advanced Fibrosis and Multiple Previous Treatment Failures
● Open-label cohort from 8 European sites evaluating ETV + TDF combination therapy in CHB pts (N=39) with:- Chronic HBV and advanced
fibrosis
- HBV drug resistance (LAM and/or ADV) or partial response
- 3 lines of prior antiviral Tx (median)
● Median TDF + ETV Tx of 10.5 months (range 1-42)
Petersen J, et al. 60th AASLD; Boston, MA; October 30-November 3, 2009; Abst. 405.
Patient characteristics
Median Age (years) 48
Male 90%
Median ALT (x ULN) 1.2
HBeAg positive 59%
Median HBV DNA (log10 IU/mL) 4.2
HBV genotype (A:B:C:D:E) 2:3:3:20:2
Previous therapy ADV + LAM ADV + ETV TDF + LAM LAM ADV ETV TDF
13521675
ETV + TDF for patients with CHB, Advanced Fibrosis and Multiple Previous Treatment Failures: Outcomes
● Results:- Median HBV DNA decline of
3.5 log10 copies/mL (P=0.0001)
- 79% HBV-DNA undetectable (< 80 IU/ml)
- 13% HBeAg and 2% HBsAg loss
- No safety concerns• No report of increase creatinine
• No clinical decompensation
• No Deaths
● Conclusion: ETV + TDF an effective rescue therapy in Tx-experienced, CHB pts
Petersen J, et al. 60th AASLD; Boston, MA; October 30-November 3, 2009; Abst. 405.
HBeAg and HBsAg Loss
HBV DNA Viremia
Baseline 3 6 9 12 15 18
1011
1010
1009
1008
1007
1006
1005
1004
1003
1002
LLoD
1915 17 17 16 10
1
1
4567
Time (month)
1
15 8 3
8 5 1
6
6
1
1
4
Log 1
0 c
opie
s/m
L
2%
13%
HBeAg loss HBsAg loss
Treatment-induced and Vaccine Escape HBV Mutants in Patients with HIV/HBV
● HIV-HBV patients followed prospectively for 3 years (N=308)- 3 – 6 month assessments of HBV
DNA and clinical outcomes
- Positive HBV DNA samples sequenced every 12 months
● 221 patients had genotypic analysis- 84% had prior LAM exposure
- HBV DNA suppression increased as TDF use (63%) increased in the cohort (18.1% 66.6% undetectable)
Lacombe K, et al. 60th AASLD; Boston, MA; October 30-November 3, 2009; Abst. 218.
HBV DNA Detection and Treatment Used During Follow-up
HBV DNA Detection and Treatment Used During Follow-up
* p<0.001* p<0.001**
**
**
**
Per
cent
of P
atie
nts
Month
0
10
20
30
40
50
60
70
80
90
100
Inclusion 12 24 36
HBV DNA > 194 UI/mL (%) 3TC or FTC TDF ADV
Treatment-induced and Vaccine Escape HBV Mutants in Patients with HIV/HBV: Findings
● Analysis of S gene sequence for vaccine escape mutations at positions 120 and 145- 6% at the start of the cohort- 12% at end-of-follow up (2.1% per patient year)
● Escape variants on S gene selected by LAM (E164D and I195M) were found in 18.8% at inclusion (Incidence 1.8 100/PY)
● Polymerase mutations conferring LAM resistance (M204I, M180L, V173L) were >50% and remained in viremic patients
● 4 patients on TDF had virologic failure; no clear evidence of genotypic resistance
Lacombe K, et al. 60th AASLD; Boston, MA; October 30-November 3, 2009; Abst. 218.
High Rates of HBeAg Seroconversion and HBsAg Loss in HIV/HBV Patients Treated with TDF + FTC
● Observational cohort
● 107 patients with HIV/HBV- 78% Males- 65% HBeAg(+)- HBV DNA 4.35 log10 IU/L- ART included TDF (62%), FTC (30%)
and/or LAM (46%)
● Median follow-up of 61 months:- ~90% with HBV DNA <350 IU/mL- 56% HBeAg seroconversion- 6.6 – 7.9% HBsAg loss
● Rates of seroconversion and HBsAg loss higher with TDF/FTC or LAM compared to TDF alone (P>0.05)
Kosi L, et al. 60th AASLD; Boston, MA; October 30-November 3, 2009; Abst. 391.
Cumulative Annual ProbabilityCumulative Annual Probability
Pat
ien
t P
erce
nt
9.75
6.2
7.4
0
2
4
6
8
10
12
HBeAg SC HbsAg loss(HBeAg+)
HbsAg loss(HBeAg-)
Entecavir in Patients with HBV/HDV Co-infection
● 15 patients in Turkey with detectable HDV RNA and elevated ALT treated with ETV (1mg) daily x 1 year- Follow-up on 12 patients
(2 D/C for non-safety reasons)
● All patients achieved undetectable HBV DNA
● HDV RNA level unchanged except in 2 pts with low HDV RNA/high HBV DNA prior to treatment who achieved undetectable HDV RNA- No change observed in HBsAg level
● ETV may be effective in a subset of patients with HBV/HDV but many do not have an HDV response
Onder F, et al. 60th AASLD; Boston, MA; October 30-November 3, 2009; Abst 913.
4.5
4
3.5
3
2.5
2
1.5
1
0.5
0Basal 6 Months 12 Months
HDV RNA
HBV DNA
HDV RNA
HBV DNA
Vira
l Loa
d (lo
g 10 co
pies
/mL)
Management of HBV Disease in Asian Patients on Disease Modifying Anti-Rheumatic Drug
● Disease Modifying Anti-Rheumatic Drug (DMARD) therapy in patients with rheumatoid arthritis (RA) and HBV infection may lead to liver flare- No guidelines for HBV screening
in this population
● RA cohort of Asian patients (N=505)- Mean age 46.3 years
- 79.5% Female
● ~75% not screened for HBV
● Among those screened, 2 pts HBsAg(+)
Bebb O, et al. 60th AASLD; Boston, MA; October 30-November 3, 2009; Abst 1353.
505 Asian Patients
424 on DMARD
103 tested for HBVDuring ALT Flare
N=2HBsAg(+)
(2%)
N=101HBsAg(-)
(98%)
Patient Testing For HBV in Asian DMARD Patients
13%
1%
24%38%
4%10%
48%
Management of HBV Disease in Asian Patients on Disease Modifying Anti-Rheumatic Drug
● ALT flares common in pts on DMARD and most unrelated to HBV:
● Of 2 pts found to be HBsAg+ on testing during flare:- Both HBeAg negative with detectable HBV DNA- Treated with LAM with successful outcome
● Conclusion: HBV screening should be routine prior to initiating DMARD in patient with RA, particularly high risk patient groups
Bebb O, et al. 60th AASLD; Boston, MA; October 30-November 3, 2009; Abst. 1353.
ALT rise not on DMARD
ALT rise on DMARD, no HBV test
ALT rise on DMARD, HBV -ve
ALT rise not on DMARD
ALT rise on DMARD, no HBV test
ALT rise on DMARD, HBV -ve
No ALT rise
No data
ALT rise on DMARD, HBV +ve
No ALT rise
No data
ALT rise on DMARD, HBV +ve
ALT riseon DMARD
HBV Disease Reactivation in Cancer Patients Receiving Chemotherapy
● Retrospective review of all cancer patients at Memorial Sloan-Kettering (2003- 2009) who had HBV DNA > 1000 c/mL and acute ALT or AST flare
● 217 patients had HBV DNA > 1000 copies/mL
● 21 had concomitant abrupt increase in serum ALT and/or AST- Median HBV DNA 7.2 log10 c/mL- Most patients had lymphoma or
leukemia - Immunosuppressive therapy was
initiated a median of 21 days (range 5-141) prior to reactivation
Mendelsohn R, et al. 60th AASLD; Boston, MA; October 30-November 3, 2009; Abst. 1328.
Malignancy in Enrolled PatientsMalignancy in Enrolled Patients
Lymphoma
Leukemia
Solid Tumors
Lymphoma
Leukemia
Solid Tumors
58%
32%
10%
HBV Disease Reactivation in Cancer Patients Receiving Chemotherapy
● Among patients with HBV flare, serious clinical outcomes were observed - 4 pts died due to liver disease
● Based on these data, all patients at MSKCC are screened for HBV since 2006- HBV prophylaxis is give to
prevent flare
- Only 2 cases since the protocol was started; both did not follow the protocol
Mendelsohn R, et al. 60th AASLD; Boston, MA; October 30-November 3, 2009; Abst. 1328.
Pat
ient
Num
ber
17
4 4
1
3
0
5
10
15
20
Hospitalization Mortality
Delay in CA txt Liver Transplant
Fulminant Liver Failure
HBV Transmission Among Infants of Chinese-American Mothers with CHB
● Newborns at risk for HBV were retrospectively identified at 2 New York hospitals (N=641)
● Contact was attempted to test infants for HBV - Loss to FU ~50% in this population
despite standard HBIG and vaccine - Risk factors include HBeAg(+)
● Perinatal transmission occurs in the US- Infants of HBsAg(+) mothers
should be followed closely
Mi L, et al. 60th AASLD; Boston, MA; October 30-November 3, 2009; Abst 1438.
69 mother with babies HBsAg-
7 mothers with babies HBsAg +
Mean Age +/- SD (range) 29.0 +/-4.7 (20.6-40.9)
29.4 +/-5.9 (22.5 -38.0)
HBeAg Status
Positive 16 (30.8%) 5 (83.3%)
Negative 36 (69.2%) 1 (16.7%)
HBV DNA (copies/ml)
< 160 8 (30.8%) 0
160-108 13 (50%) 0
> 108 5 (19.2%) 3 (100%)
Mean Prenatal ALT (U/L) +/- SD (range)
26.8 +/-12.9(8 -73)
26.6 +/-11.4 (15 - 45)
Assessment of TDF-Containing Regimens in Pregnancy Using the ART Pregnancy Registry
● APR is a international, prospective exposure registration cohort to monitor teratogenic effects of ART- Established 1989
- TDF data collected since 2001
● 1301 cases (1045 live births) receiving TDF regimens- Majority HIV infected women
exposed to combination ART
- 9 women HBV mono-infected
Brown RS, et al. 60th AASLD; Boston, MA; October 30-November 3, 2009; Abst 407.
TDF Regimens Maternal Demographics at Registration (Pregnancies Enrolled=1,186)
Median Age (years) 30
Race
Black 63.2%
Hispanic 16.3%
White 11.8%
Asian 2.2%
Other 2.6%
CD4+ T-Cell Count at Start of Pregnancy
≥ 500 cells/µL 23.3%
200-499 cells/µL 48.9%
<200 cells/µL 21.4%
HIV Infected
A. Asymptomatic, acute (primary) HIV or PGL 56.7%
B. Symptomatic, not (A) or (C) 5.7%
C. AIDS – indicator conditions 31.4%
HIV UninfectedHIV post-exposure prophylaxis 0
Hepatitis B mono-infected 0.7%
TDF-Containing Regimens in Pregnancy: Findings from the Antiretroviral Pregnancy Registry
● Congenital anomaly rate with TDF containing ART:- 2.4% (95% CI: 1.4-3.8) for
1st trimester - 1.6% (95% CI: 0.6-3.4) for
2nd/3rd trimester
● Similar to CDC’s population-based birth defects surveillance system and other ART regimens
● Data on other HBV agents (except LAM) are limited
Brown RS, et al. 60th AASLD; Boston, MA; October 30-November 3, 2009; Abst 407.
Birth Defect Rates By Trimester of Earliest Exposure to TDF Regimens and All ARV Regimens in APR
Earliest Exposure to ARVs
TDF Regimens
All ARV Regimens
1st Trimester
Number of Defects / Live Births 16/678 130/4530
Prevalence (95% CI) 2.4% (1.4 – 3.8)
2.9% (2.4 – 3.4)
2nd or 3rd Trimester
Number of Defects / Live Births 6/385 147/5874
Prevalence (95% CI) 1.6%(0.6 – 3.4)
2.5%(2.1 – 2.9)
Birth Defect Prevalence for First Trimester Exposure to Anti-HBV Drugs
Regimen Defects / Live Births Prevalence, % (95%CI)
Lamivudine 93/3226 2.9 (2.3, 3.5)
Tenofovir DF 16/678 2.4 (1.4, 3.8)
Adefovir dipovoxil 0/37 0
Entecavir 0/8 0
Telbivudine 0/3 0
Studies 102 and 103: TDF Resistance Surveillance in CHB Patients
● TDF resistance surveillance performed in patients with HBeAg- (Study 102) or HBeAg+ (Study 103) CHB
Snow-Lampart A, et al. 60th AASLD; Boston, MA; October 30-November 3, 2009; Abst. 480.
All patients:– At baseline– Yearly if HBV DNA ≥ 400 copies/mL
(≥ 69 IU/mL)– At discontinuation of TDF mono-therapy
if HBV DNA ≥ 400 copies/mL
Any patient post-baseline with:– Conserved site changes in pol/RT– Virologic breakthrough (VB)*
– Polymorphic site changes (> 1 patient)
Genotyping(HBV pol / RT)
Phenotyping(HBV pol / RT)
*Defined as a confirmed 1 log10 increase in HBV DNA from nadir and/or confirmed HBV DNA >400 copies/mL after having <400 copies/mL*Defined as a confirmed 1 log10 increase in HBV DNA from nadir and/or confirmed HBV DNA >400 copies/mL after having <400 copies/mL
Studies 102 and 103: No Relationship Between Virologic Breakthrough and Emergence of Genotypic
Changes
Snow-Lampart A, et al. 60th AASLD; Boston, MA; October 30-November 3, 2009; Abst. 480.
TDF Monotherapy (n=6)
TDF Monotherapy (n=6)
No Change
Polymorphic Site Change
No Change
Polymorphic Site Change
Genotypic Changes in HBeAg- and HBeAg+ TDF-TDF Treated Patients During Year 3
Genotypic Changes in HBeAg- and HBeAg+ TDF-TDF Treated Patients During Year 3
• Conserved site changes observed in 3/13 subjects (rtR51k, rtL180M±rtM204V±rtA181T; rtR192H)
• None of the changes were associated with Virologic Breakthrough
• Conserved site changes observed in 2/9 subjects (rtG152E; rtN236T±rtR274Q)
• rtG152E observed during a transient Virologic Breakthrough
N=3
N=1
N=1N=1
N=1
N=2N=2
N=3
FTC+TDF Therapy (n=7)
FTC+TDF Therapy (n=7)
TDF Monotherapy (n=5)
TDF Monotherapy (n=5)
N=3N=2
N=1
N=3
FTC+TDF Therapy (n=4)
FTC+TDF Therapy (n=4)
Genotypic Changes in HBeAg- and HBeAg+ ADV-TDF Treated Patients During Year 3
Genotypic Changes in HBeAg- and HBeAg+ ADV-TDF Treated Patients During Year 3
Conserved Size Change
Unable to Genotype
Conserved Size Change
Unable to Genotype
Resistance Surveillance in CHB Patients Treated with TDF: No Reduction in HBV Susceptibility to TDF
● 5 conserved site changes
● No persistent virologic breakthrough and no in vitro reduced susceptibility to TDF
Snow-Lampart A, et al. 60th AASLD; Boston, MA; October 30-November 3, 2009; Abst 480.
Treatment Group Viral Isolate Change from BL in HBV pol/RT
Fold Change from BL
TDF Patient AWeek 144 pool rtR51K 1.4
TDF-FTC/TDF Patient BWeek144 pool 4tA181T 0.7
TDF-FTC/TDF Patient C Week144pool/clones rtR192H Replication Defective
ADV-TDF Patient EWeek144 pool
Week 144 clone 1Week 144 clone 2
rtN236N/T±rtR274R/QrtN236TrtR274Q
1.98.21.9
Treatment Group Laboratory Isolate Change from control in HBV pol/RT
● 175 naïve patients tested by InnoLipa HBVDRv2/3● 17 (10%) tested positive for drug resistant mutants
● True LAM resistance in 1 patient: M204V/I● Other LAM-R mutations: 3.6%
Ng KA, et al. 60th AASLD; Boston, MA; October 30-November 3, 2009; Abst 429.
Number of MutationsRelated to Each Antiviral:
Number of MutationsRelated to Each Antiviral:
0 2 4
Number of Samples with Mutation0 2 4
Number of Samples with Mutation
L80VL80V
L180M L180ML180M L180M
A181T* A181T* A181T* A181T* A181T* A181T*
A194TA194T
S202CS202C
M204I M204IM204I M204I
M204VM204V
I233V*I233V*
LAM LdT ETV ADV TDFLAM LdT ETV ADV TDFn=13 n=10 n=5 n=9 n=3n=13 n=10 n=5 n=9 n=3
D E
CB
AG
F
HB
V R
ev
ers
e T
ran
sc
rip
tas
e
Switching Therapy to Lamivudine in Entecavir-treated Patients
● 2 year prospective, randomized study of ETV LAM sequential therapy (N=50)- All pts on ETV 0.5mg with normal ALT
and undetectable HBV DNA (<12 IU/ml)
- If HBV DNA rebound >20 IU/mL x 3, switched back to ETV
● All pts in ETV arm remained undetectable with normal ALT
● 3 pts in LAM arm with viral rebound- Pts switched back to ETV and
undetectable at week 48 with normal ALT and no resistance
Fung J, et al. 60th AASLD; Boston, MA; October 30-November 3, 2009; Abst 433.
Results at 48 weeks
Parameters ETV/ETV(n=25)
ETV/LAM(n=25) P
Follow-up period
(weeks)48 48 NS
ALT elevation 0% 0% NS
HBV DNA rebound 0 (0%) 3 (12%) NS
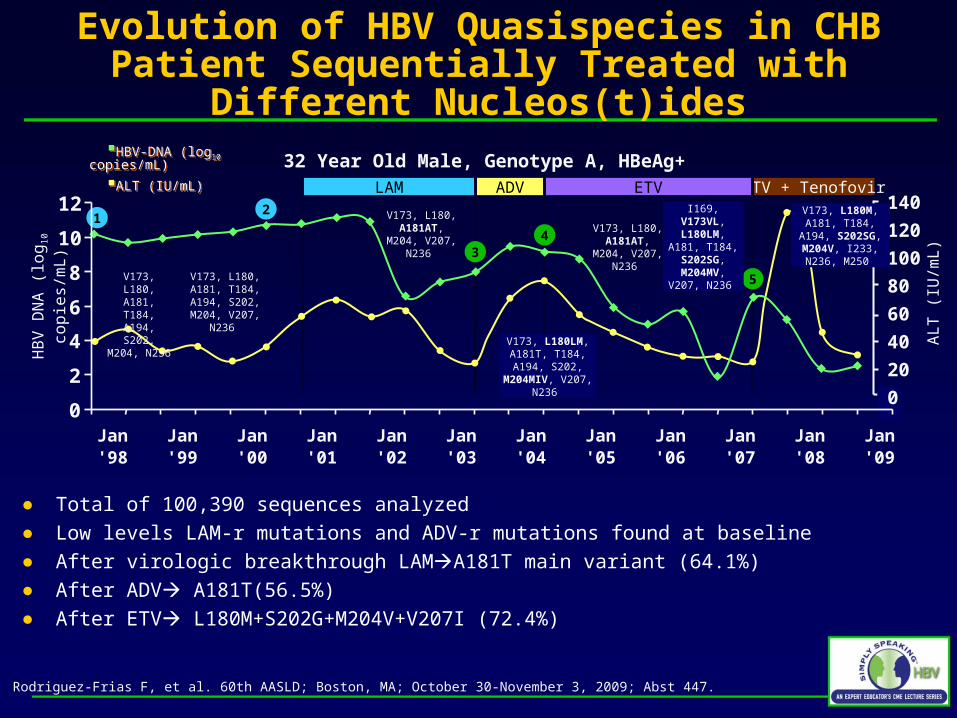
Evolution of HBV Quasispecies in CHB Patient Sequentially Treated with Different Nucleos(t)ides
● Ultra-deep pyrosequencing detects minor variants (~1%) in complex viral quasispecies
● Analysis by ultra-deep pyrosequencing of HBV quasispecies in consecutive serum samples from heavily-treated CHB patient- Sequential viral therapy: LAMADVETV- Multidrug resistance by standard direct sequencing
Rodriguez-Frias F, et al. 60th AASLD; Boston, MA; October 30-November 3, 2009; Abst 447.
Evolution of HBV Quasispecies in CHB Patient Sequentially Treated with Different Nucleos(t)ides
● Total of 100,390 sequences analyzed● Low levels LAM-r mutations and ADV-r mutations found at baseline ● After virologic breakthrough LAMA181T main variant (64.1%)● After ADV A181T(56.5%)● After ETV L180M+S202G+M204V+V207I (72.4%)
Rodriguez-Frias F, et al. 60th AASLD; Boston, MA; October 30-November 3, 2009; Abst 447.
TDF in CHB Patients with Previous LAM and ADV Failure
● Open-label, prospective study
● CHB patients with pre-existing LAM-failure and HBV viremia after ≥24 weeks of ADV switched to TDF or TDF + LAM for ≥48 weeks (N=61)- Median duration of LAM 37.5 mos
and ADV 22 mos
- Baseline DNA 6.12 log10 c/ml
- Significant baseline resistance present
● Primary analysis: HBV DNA decline from baseline
Patterson S, et al. 60th AASLD; Boston, MA; October 30-November 3, 2009; Abst 484.
Baseline Mutations N
LAM-R
rtM204I/V 20
Other 8
ADV-R
rtA181T/V 14
4
rtN236T 7
Pre-core (rtG1896A) 3
BCP (rtA1762A & G1764A 2
Envelope (rtG145R / P120T) 4
TDF in CHB Patients with Previous LAM and ADV Failure
● Median HBV DNA decline on TDF at week 48: 4.24 log10 c/ml● 20% at 48 weeks had HBV DNA >3 log10 c/ml
- 2 new mutations: N236T and A181T
- Associated with baseline N236T (p=0.024)
- Higher baseline VL (p=0.04)
Patterson S, et al. 60th AASLD; Boston, MA; October 30-November 3, 2009; Abst 484.
Months Months
% P
atie
nts
<2
00
0 c
/mL
% P
atie
nts
<2
00
0 c
/mL
0
20
40
60
80
100
0 6 12 18
rtM204I/V
rtA181T/V
rtN236T
0
20
40
60
80
100
0 6 12 18
Low VL
All
High VL
TDF for CHB Patients with Suboptimal Response to ADV or ADV + LAM Treatment
● CHB pts with HBV viremia switched from ADVTDF (15%) or ADV + LAMTDF + LAM (85%) (N=85)- Median duration of ADV 29.2 mos.
- 46% with ADV-R mutations
● No virologic breakthrough on TDF between weeks 24 and 48
● Slightly reduced probability of achieving HBV DNA <12 IU/ml with ADV-R
Levrero M, et al. 60th AASLD; Boston, MA; October 30-November 3, 2009; Abst 489.