Association between tax on sugar sweetened beverages and soft drink consumption in adults in Mexico: open cohort longitudinal analysis of Health Workers Cohort Study OPEN ACCESS Luz María Sánchez-Romero associate researcher 1 6 , Francisco Canto-Osorio associate researcher 1 , Romina González-Morales associate researcher 1 , M Arantxa Colchero associate professor 2 , Shu-Wen Ng associate professor 3 , Paula Ramírez-Palacios epidemiologist 4 , Jorge Salmerón associate professor 5 , Tonatiuh Barrientos-Gutiérrez director 1 1 Population Health Research Centre, National Institute of Public Health, Cuernavaca, Mexico; 2 Centre for Health Systems Research, National Institute of Public Health, Cuernavaca, Mexico; 3 Department of Nutrition and Carolina Population Center, University of North Carolina, Chapel Hill, NC, USA; 4 Epidemiological Research and Health Services Unit, Mexican Institute of Social Security, Cuernavaca, Mexico; 5 Research Centre in Policy, Population and Health, School of Medicine, National Autonomous University of Mexico, Mexico City, Mexico; 6 Cancer Prevention and Control, Lombardi Comprehensive Cancer Center, Georgetown University, Washington, DC, USA Abstract Abstract Objective — To examine changes in categories of soft drink consumption in a cohort of Mexican adults, three years after the implementation of the sugar sweetened beverage tax. Design — Open cohort longitudinal analysis. Setting — Three waves of the Health Workers Cohort Study, Mexico, spanning 2004 to 2018. Participants — 1770 people aged 19 years or older with information on drinks consumption available in at least one of the three cohort waves. Main outcome measure — Change in probability of belonging to one of four categories of soft drinks consumption (non, low, medium, high) after the tax was implemented. Heterogeneity of associations by income and education was also assessed. Results — Before the implementation of the tax, more than 50% of the participants were medium and high consumers of soft drinks and less than 10% were in the non-consumer category. After the tax was implemented, 43% of the population was categorised as medium or high consumers and the prevalence of non-consumers increased to 14%. Three years after implementation of the tax on 1 January 2014, the probability of being a non-consumer of soft drinks increased by 4.7 (95% confidence interval 0.3 to 9.1) percentage points and that of being a low consumer increased by 8.3 (0.6 to 16.0) percentage points compared with the pre-tax period. Conversely, the probability of being in the medium and high levels of soft drinks consumption decreased by 6.8 (0.5 to 13.2) percentage points and 6.1 (0.4 to 11.9) percentage points, respectively. No significant heterogeneity of the tax across income levels was observed, but stronger effects of the tax were seen in participants with secondary school education or higher, compared with those with elementary school or less. Conclusions — The Mexican sugar sweetened beverage tax was associated with a reduction in the probability of consuming soft drinks in this cohort of employees from a healthcare provider. The results cannot be extrapolated to the Mexican population, but they suggest that three years after implementation, the tax had helped to increase the proportion of people who do not consume soft drinks while decreasing the proportion of high and medium consumers. Introduction Consumption of added sugars is a primary risk factor for non-communicable diseases. 1 2 Sugar sweetened beverages are a main source of added sugars in the diet. 3 High consumption of such drinks has been linked to obesity, diabetes, cardiovascular disease, hypertension, metabolic syndrome, and dental caries, as well as to some types of cancer. 4-7 In 2017 the World Health Organization recommended limiting intake of Correspondence to: T Barrientos-Gutierrez [email protected]Data supplements on bmj.com (see http://www.bmj.com/content/369/bmj.m1311?tab=related#datasupp) Web appendix: Appendices No commercial reuse: See rights and reprints http://www.bmj.com/permissions Subscribe: http://www.bmj.com/subscribe BMJ 2020;369:m1311 doi: 10.1136/bmj.m1311 Page 1 of 11 Research RESEARCH
Transcript
Association between tax on sugar sweetenedbeverages and soft drink consumption in adults inMexico: open cohort longitudinal analysis of HealthWorkers Cohort Study
OPEN ACCESS
Luz María Sánchez-Romero associate researcher 1 6, Francisco Canto-Osorio associate researcher 1,Romina González-Morales associate researcher 1, M Arantxa Colchero associate professor 2,Shu-Wen Ng associate professor 3, Paula Ramírez-Palacios epidemiologist 4, Jorge Salmerónassociate professor 5, Tonatiuh Barrientos-Gutiérrez director 1
1Population Health Research Centre, National Institute of Public Health, Cuernavaca, Mexico; 2Centre for Health Systems Research, NationalInstitute of Public Health, Cuernavaca, Mexico; 3Department of Nutrition and Carolina Population Center, University of North Carolina, Chapel Hill,NC, USA; 4Epidemiological Research and Health Services Unit, Mexican Institute of Social Security, Cuernavaca, Mexico; 5Research Centre inPolicy, Population and Health, School of Medicine, National Autonomous University of Mexico, Mexico City, Mexico; 6Cancer Prevention and Control,Lombardi Comprehensive Cancer Center, Georgetown University, Washington, DC, USA
AbstractAbstractObjective — To examine changes in categories of soft drink consumptionin a cohort of Mexican adults, three years after the implementation ofthe sugar sweetened beverage tax.Design — Open cohort longitudinal analysis.Setting — Three waves of the Health Workers Cohort Study, Mexico,spanning 2004 to 2018.Participants — 1770 people aged 19 years or older with informationon drinks consumption available in at least one of the three cohort waves.Main outcome measure — Change in probability of belonging to oneof four categories of soft drinks consumption (non, low, medium, high)after the tax was implemented. Heterogeneity of associations by incomeand education was also assessed.Results — Before the implementation of the tax, more than 50% of theparticipants were medium and high consumers of soft drinks and lessthan 10% were in the non-consumer category. After the tax wasimplemented, 43% of the population was categorised as medium or highconsumers and the prevalence of non-consumers increased to 14%.Three years after implementation of the tax on 1 January 2014, theprobability of being a non-consumer of soft drinks increased by 4.7 (95%confidence interval 0.3 to 9.1) percentage points and that of being a low
consumer increased by 8.3 (0.6 to 16.0) percentage points comparedwith the pre-tax period. Conversely, the probability of being in the mediumand high levels of soft drinks consumption decreased by 6.8 (0.5 to 13.2)percentage points and 6.1 (0.4 to 11.9) percentage points, respectively.No significant heterogeneity of the tax across income levels wasobserved, but stronger effects of the tax were seen in participants withsecondary school education or higher, compared with those withelementary school or less.Conclusions — The Mexican sugar sweetened beverage tax wasassociated with a reduction in the probability of consuming soft drinksin this cohort of employees from a healthcare provider. The results cannotbe extrapolated to the Mexican population, but they suggest that threeyears after implementation, the tax had helped to increase the proportionof people who do not consume soft drinks while decreasing the proportionof high and medium consumers.IntroductionConsumption of added sugars is a primary risk factor fornon-communicable diseases.1 2 Sugar sweetened beverages area main source of added sugars in the diet.3 High consumptionof such drinks has been linked to obesity, diabetes,cardiovascular disease, hypertension, metabolic syndrome, anddental caries, as well as to some types of cancer.4-7 In 2017 theWorld Health Organization recommended limiting intake of
free sugar to 10% of total energy.1 To reduce sugar consumption,WHO now recommends the implementation of fiscal policiesto increase the price of sugar sweetened beverages.8 9 Taxes onsugar sweetened beverages have been implemented in manycountries, including Mexico, France, Hungary, Norway, SouthAfrica, and the UK, as well as in some US cities such asBerkeley and Philadelphia.10-12 Robust evaluations after theimplementation of taxes on sugar sweetened beverages haveshown important decreases in purchases or sales of suchdrinks.1 13-16
In Mexico, the consumption of added sugars represented 12.5%of the total energy intake in 2012, of which 70% came fromsugar sweetened beverages.3 17 Owing to the high levels ofconsumption of these drinks, Mexico has been ranked first inmortality and morbidity attributable to sugar sweetenedbeverages.18 19 To begin countering this, the Mexican governmentimplemented a tax of 1 peso (£0.03; €0.04; $0.04) per litre(approximately 10% increase in price) on all non-alcoholicdrinks with added sugar starting on 1 January 2014. Two yearsafter implementation of the tax, household purchases of taxedbeverages decreased by an average of 7.6%.20 Larger reductionsin purchases of these beverages were documented in urban areas,in households with children and adolescents, in lowsocioeconomic households, and among high sugar sweetenedbeverage purchasing households.20-22 However, these studieshave relied on purchase data, aggregated at the household level.More evidence about the effect of the tax on individual levelconsumption and health outcomes is needed.23 Emerging studieswith longer term results on the effect of the tax on consumptionof sugar sweetened beverages and health related outcomes willallow us to understand the utility of these interventions at anindividual level.Using two pre-tax waves and one post-tax wave of data onconsumption of soft drinks from a Mexican adult cohort, weaimed to estimate the change in categories of soft drinkconsumption three years after the implementation of the tax onsugar sweetened beverages and to assess the potential effectmodification of the tax by income levels.
MethodsSetting and study designWe conducted longitudinal analysis using data from the HealthWorkers Cohort Study (HWCS). The HWCS is a prospectiveopen cohort study composed of employees from the MexicanInstitute of Social Security (IMSS for its Spanish acronym) andtheir families in Cuernavaca. IMSS is one of the three mainpublic healthcare institutions in Mexico, providing healthcareto nearly 43 million people (30.1% of the national population).24
The cohort is occupationally diverse, including medical doctors,nurses and nurse assistants, social workers, management, andadministration and cleaning personnel, among others. Comparedwith the Mexican population, participants in the HWCS were,on average, in the seventh tenth of monthly average householdincome ($14 100 MXN); by thirds, the average of the lowincome group in the cohort corresponded to the second tenth ofnational income, medium income to the sixth, and high incometo the top tenth.The HWCS has had three data collection waves: 2004-06,2010-13, and 2017-18. The total number of employees at IMSSin the State of Morelos in 2004 was around 6000; of those, 75%(n=4500) were IMSS Cuernavaca employees. Of the total 4500IMSS employees, the HWCS recruited 2500 people at baseline;the response rate was 77% for wave 2 and 50% for wave 3.Participants completed a self-administered questionnaire, which
collected data on demographic characteristics, medical familyhistory, past medical history, lifestyle (diet and physicalactivity), psychosocial evaluation, quality of life, social support,and cognitive assessment. Detailed information can be foundelsewhere.25
SampleFor our analysis, we used data from all three waves of the cohort.We included participants aged 19 years and older with at leastone food frequency questionnaire measurement and completebeverage consumption information.25 From the original 4928observations, we excluded pregnant women, participants withextreme values of energy intake (<600 Kcal (1 kcal=4.18 kJ)and >6550 Kcal), and those who reported soft drink consumptionof 1500 mL or more per day.26 Our total analytical sampleincluded 1770 people with 3786 observations. Details about thedevelopment of the analytical sample can be found in appendix1 table A1-1.
Soft drink consumption and taximplementationOur outcome of interest was the change in the probability ofbelonging to one of four categories of consumption after the taxwas implemented. The HWCS self-reported questionnaireassessed diet with a validated semi-quantitative food frequencyquestionnaire of 116 food items, asking about the frequency offood consumption over the previous 12 months.27 Thequestionnaire was previously validated in a sample of Mexicanwomen, showing moderately good validity for energy and mostnutrients. We used information from the food frequencyquestions related to consumption of sugar sweetened beverages:“a bottle of cola” and “a bottle of flavored soft drink.” Frequencyof consumption was recorded with 10 different options rangingfrom “never” to “six or more times per day.” The questionnaireassumed that one serving of soft drink equalled 355 mL. Wecompiled this information and classified the frequency ofconsumption into four categories, to make our resultscomparable to previous literature.28 29 A non-consumer had nosoft drink consumption, a low consumer consumed less thanone serving a week, a medium consumer consumed at least oneserving a week but less than one serving a day, and a highconsumer consumed at least one serving a day. The sugarsweetened beverages tax was implemented on 1 January 2014;thus, we created a dichotomous variable for the tax, being 0 forthe pre-tax period (2004-13) and 1 for the post-tax period(2017-18).
Time invariant and time varying covariatesWe included age at baseline centred to the mean as a timeinvariant variable to control for the age at the beginning offollow-up. Time varying covariates were updated at each waveof data collection. We included a continuous variable for time,which represents the number of years that a person spent in thecohort. We used annual gross domestic product in current USDand yearly inflation (base index on July 2018) reported by theNational Institute of Statistics and Geography to adjust formacroeconomic variables.30 We included dummy variables foreducation, classified into three groups: elementary school orless, secondary school or high school, and college or higher.Income represents monthly family income as reported in theHWCS questionnaire, divided into three groups by tertiles (low,middle, high). We used thirds of income to identify differentialeffects by group, to allow for non-linearities, and to becomparable to previous analyses done at the household level.31
No commercial reuse: See rights and reprints http://www.bmj.com/permissions Subscribe: http://www.bmj.com/subscribe
BMJ 2020;369:m1311 doi: 10.1136/bmj.m1311 Page 2 of 11
We allowed income to vary by wave as we wanted to see howchanges in income categories were associated with changes inthe probability of moving to a different consumption category,independently of the tax. We also adjusted for seasonality andchanges in demand for beverages due to the weather, by usingthe monthly temperature in the Celsius scale as reported inCuernavaca, Morelos, and linking it to the date at whichparticipants completed each questionnaire. Finally, we includedan interaction term between age at baseline and time spent inthe cohort, to allow for different time trends according to theage at baseline of each participant.
Statistical analysisWe estimated the mean and standard deviation or the frequencyand percentage of each covariate for each wave of datacollection. We estimated the prevalence and 95% confidenceinterval of the sample in the four categories of soft drinkconsumption, for the three waves of data collection.For our main analysis, we fitted an ordered logistic correlatedrandom effect regression (OLCRE) model for unbalanced paneldata, to evaluate the association of the tax with the probabilityof remaining in the same category of soft drink consumption.We selected this model because it can simultaneously estimatewithin individual and between individual effects. Briefly, theOLCRE model estimates coefficients for level 1 variables thatvary between and within individuals, as well as level 2 variablesthat vary only between individuals.32 See appendix 1 for adetailed description of the model.To fit the OLCRE model, we used the -ologit- command inStata, following methods described by Schunck.33 For thisanalysis, we focused on the within individual effect ) of thesugar sweetened beverages tax. Complete OLCRE modelstranslated to proportional odds ratios are available in appendix1. To explore the potential effect modification of the tax onconsumption by income and education, we introduced aninteraction term between the tax period indicator variable andincome category (low, middle, or high) and between tax andeducation (elementary school or less, secondary school or highschool, and college or higher). To facilitate the presentation andinterpretation of the models, we used the post-estimation Statacommand -margins- to calculate the marginal effects of the taxon the probability of being in one of the categories of soft drinksconsumption. We used Stata/SE 14.2 for all analyses.
Sensitivity analysisWe relied on an unbalanced panel to estimate the difference insoft drinks consumption before and after implementation of thetax. This could introduce bias in the estimates due to missingdata at different waves. To explore the robustness of ourfindings, we did a complete case analysis as a sensitivityanalysis, restricting our analysis to participants with informationin all three waves (n=650 for each wave, 50% of full analyticalsample). A detailed description of the sample and regressionanalysis is available in appendix 2.
Patient and public involvementThe research design, questions, and outcomes were developedwithout participant involvement. Participants were not askedto contribute to interpretation or writing of the results. However,participants with abnormal findings were informed and referredfor treatment.
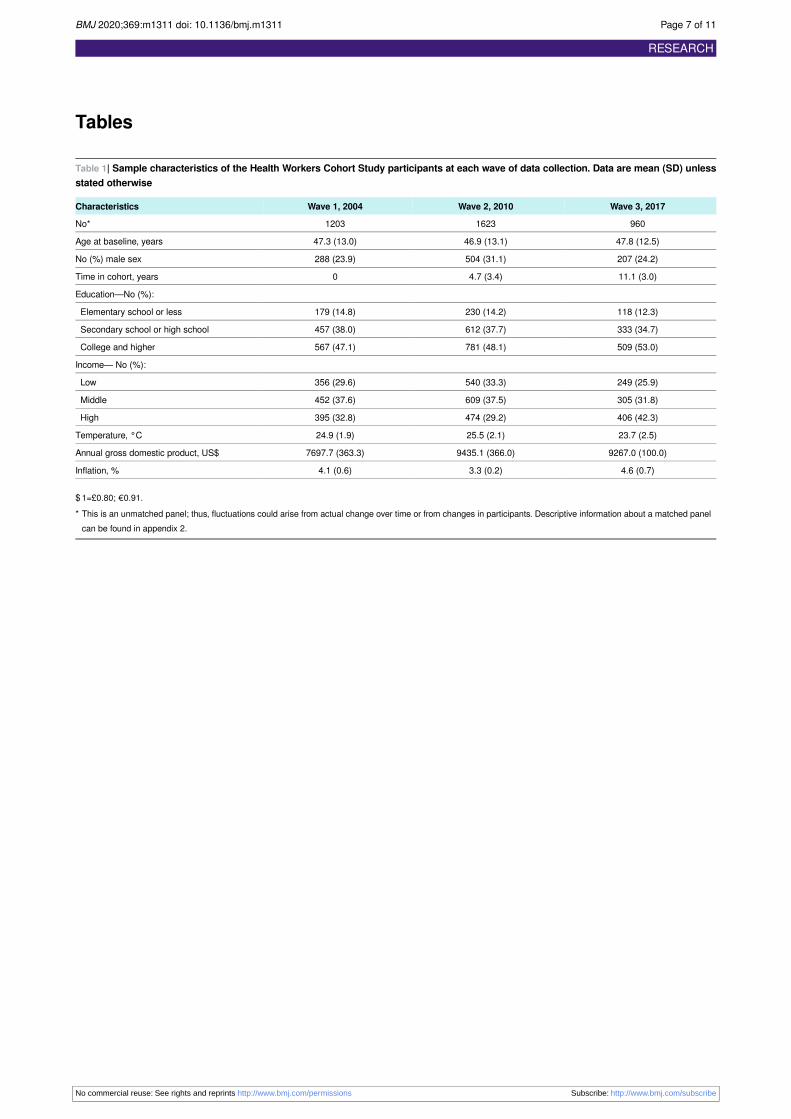
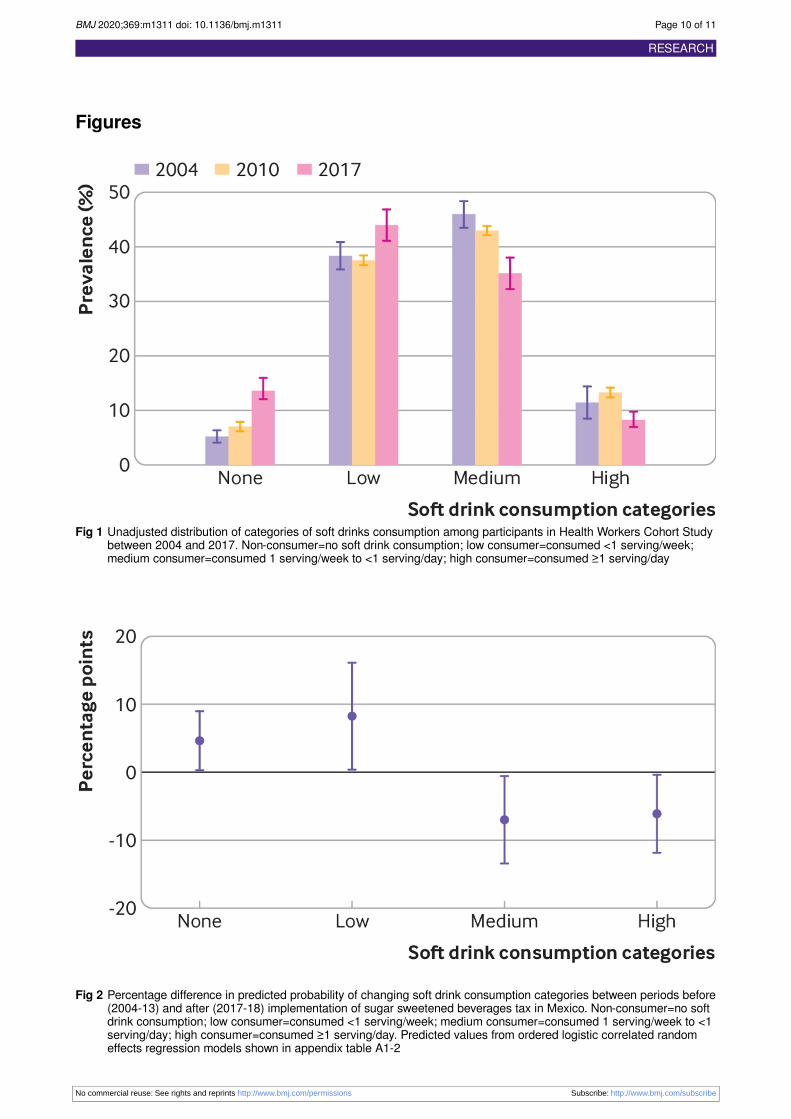
ResultsTable 1 shows the characteristics of the sample of HWCSparticipants at each wave of data collection. The average ageduring the study period was 47 years, with a slightly oldersample at wave 3. In 2010 the male population was 7% higherthan in 2004 and 2017 (male prevalence ∼23%). Nearly 50%of our analytical sample was composed of people with a collegedegree or higher. In 2017 42% of the population was in the highincome category; this represents an increase of 9% comparedwith 2004 and 13% compared with 2010.Figure 1 shows the unadjusted distribution of soft drinksconsumption before and after implementation of the tax. Beforethe implementation of the tax, more than 50% of the participantswere medium and high consumers (56.9% in 2004 and 55.8%in 2010), and less than 10% were in the non-consumer category(5.1% in 2004 and 6.9% in 2010) of soft drink consumption.After the tax was implemented, 42.9% of the population wascategorised as medium or high consumers and the prevalenceof non-consumers increased to 13.6%. Before the tax, theprevalence of high consumers was increasing (11.3% in 2004to 13.1% in 2010); after 2014 the prevalence of high consumersdecreased to 8.1%.Table A1-2 in the appendix shows the proportional odds ratiosof the OLCRE model for the association between the tax andcategories of soft drinks intake. After the tax was implemented,the proportional odds of being in a high consumption category,compared with being in any lower category became 61% lower(odds ratio 0.39; 95% confidence interval 0.16 to 0.94), afteradjustment for time varying and time invariant covariates.Translated into changes in probabilities, this reduction impliesthat after the implementation of the tax, the probability ofbecoming a non-consumer increased by 4.7 (95% confidenceinterval 0.3 to 9.1) percentage points, and the probability ofbeing a low consumer increased by 8.3 (0.6 to 16.0) percentagepoints. Conversely, the probability of being in the medium andhigh levels of soft drink consumption decreased by 6.8 (0.5 to13.2) percentage points for medium consumers and 6.1 (0.4 to12.0) percentage points for high consumers (fig 2).
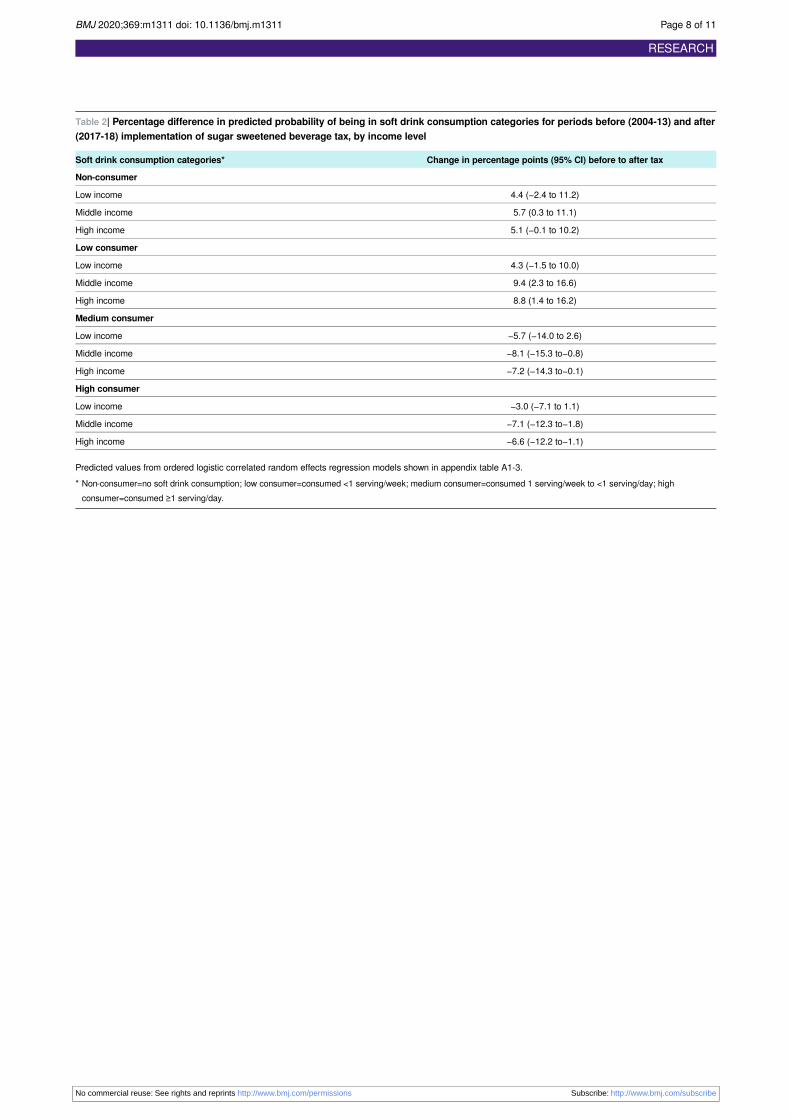
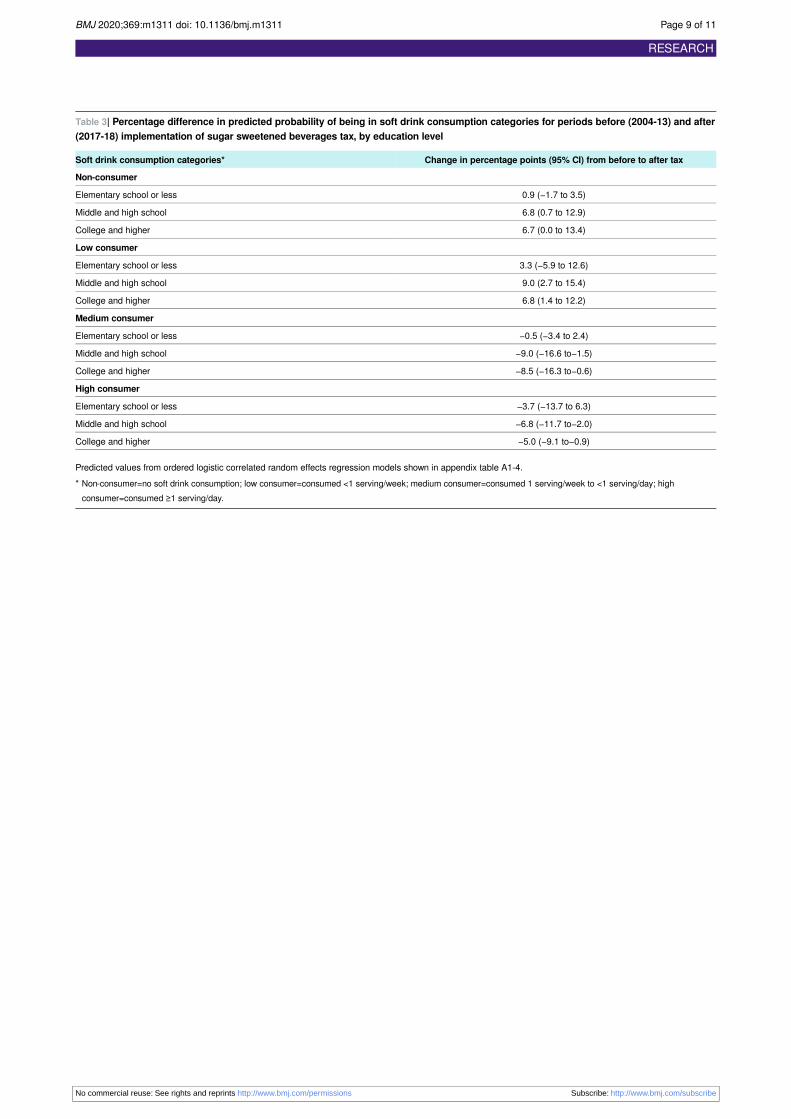
Effect modification of sugar sweetened drinktax by income and education categoryAs a secondary analysis, we assessed the potential effectmodification of the tax at different levels of individual income(low, middle, or high); the interaction between income and taxwas marginally significant only for the middle income group(appendix table A1-3). However, consistent with results in figure2, table 2 shows an increase in the probability of being in anon-consumer or low soft drink consumer category and areduction in the probability of being in a medium or highcategory for all income categories.We also assessed the effect modification of the tax by level ofeducation; in this case, the interaction was statisticallysignificant, indicating stronger effects of the tax for bothparticipants with secondary school and high school educationand those with college and higher levels of education, comparedwith those with elementary school or less (appendix 1 tableA1-4). Table 3 shows the change in the probability of soft drinksconsumption after the tax; the probability of being anon-consumer increased for participants with secondary andhigh school education (6.8 (0.7 to 12.9) percentage points) andcollege and higher education (6.7 (0.0 to 13.4) percentage points)but not for those with elementary school education (0.9 (−1.7to 3.5) percentage points). We observed a similar pattern forthe probability of being a low consumer. The probability of
No commercial reuse: See rights and reprints http://www.bmj.com/permissions Subscribe: http://www.bmj.com/subscribe
BMJ 2020;369:m1311 doi: 10.1136/bmj.m1311 Page 3 of 11
being in a high level of consumption decreased afterimplementation of the tax, particularly in participants withsecondary and high school education (−6.8 (−11.7 to −2.0)percentage points) and with college and higher education (−5.0(−9.1 to −0.9) percentage points), compared with participantswith elementary school or less (−3.7 (−13.7 to 6.3) percentagepoints). We observed a similar pattern for medium levels ofconsumption.
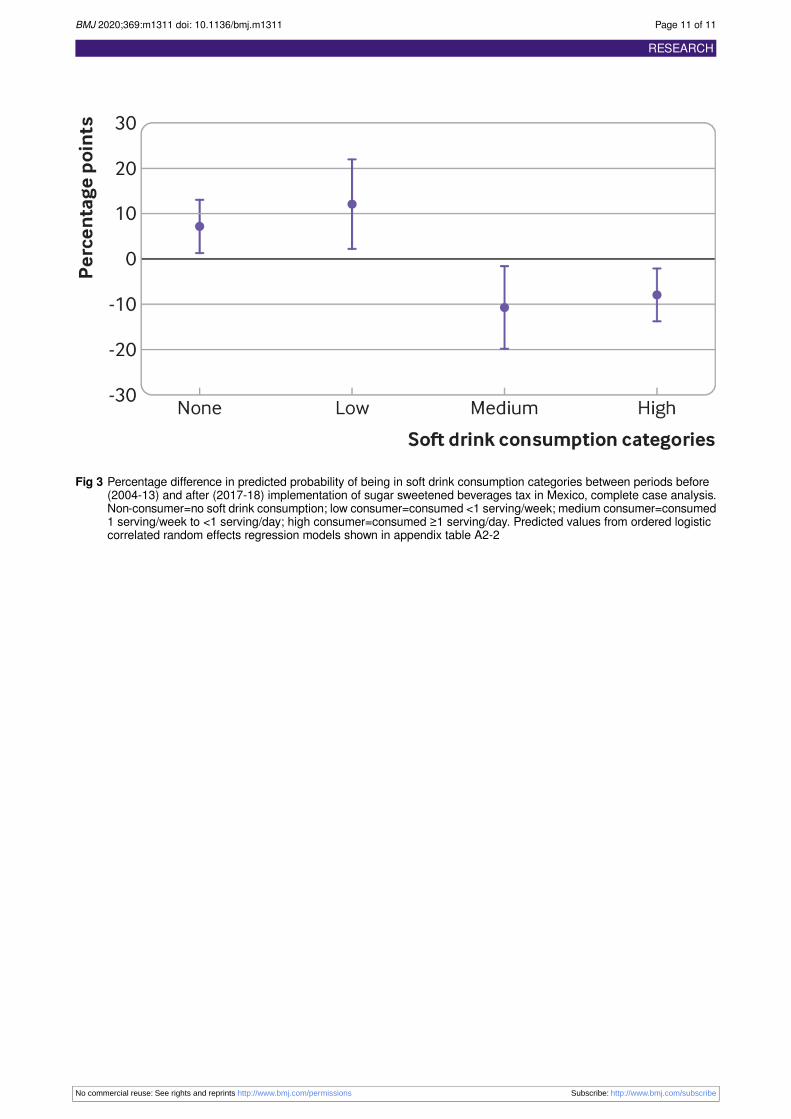
Sensitivity analysisWe replicated our main model analysis in the subsample ofparticipants with information in all three waves to do a completecase analysis (fig 3). Overall, the same patterns were observedand the strength of the associations increased. The probabilityof remaining in the medium level of consumption decreased by10.8 (1.7 to 19.8) percentage points after implementation of thetax, compared with 6.8 percentage points in the unbalancedsample. Similarly, the probability of remaining in the highcategory of consumption decreased by 8.0 (1.3 to 14.8),compared with 6.1 percentage points in the unbalanced sample.Detailed information of the coefficients from this statisticalmodel can be found in appendix 2.
DiscussionWe aimed to estimate the change in the probability of consumingsoft drinks after the sugar sweetened beverages tax wasimplemented, using 14 years of cohort data from the HealthWorkers Cohort Study in Cuernavaca, Mexico. We found thatthe tax was associated with a 6.8 percentage points and 6.1percentage points decrease in the probability of being in themedium and high categories of soft drink consumption,respectively, with a corresponding increase in the lowconsumption (8.3 percentage points) and non-consumption (4.7percentage points) categories. These findings suggest that the1 peso per litre tax in Mexico helped to reduce soft drinksconsumption in this population even three years afterimplementation.
Comparison with other studiesAlthough several studies have estimated the effect of sugarsweetened beverages taxes on household purchases, very fewexamples using individual level self-reported consumption dataare available. To our knowledge, only Philadelphia and Berkeleyhave used a similar approach. In Philadelphia, a telephonesurvey was used to estimate changes in consumption of sugarsweetened drinks; the results showed that the odds of daily sodaconsumption decreased by 40% after implementation of thetax.34 In Berkeley, three studies included measures ofself-reported sugar sweetened drinks consumption. One used24 hour beverage recall surveys before and after the tax(collected in the same months one year apart) and found thatconsumption had fallen 21% eight months after the tax wasimplemented, but the study was insufficiently powered to detectan effect.11 Another study interviewed shoppers in low incomeneighbourhoods in Berkeley using a short beverage frequencymeasure. This study found that consumption of soda and othersugary drinks fell significantly by 21% four months afterimplementation.15 The most recent study, by Lee et al, observedthat consumption of sugar sweetened drinks in Berkeley threeyears after the tax decreased by 0.55 times per day.35
Self-reported individual level consumption information providesa closer approximation to individual level behaviours; however,it is subject to self-report measurement biases that otherapproaches, such as sales figures, are less prone to, making the
analyses of all potential data sources valuable for policy analysisand evaluation. Although studies quantifying changes inconsumption after sugar sweetened beverages taxes are lacking,countries such as Finland, Hungary, and France have producedevaluations using purchase data. Finland and Hungary decreasedtheir demand for soft drinks by 4.7% and 10.2%, respectively,between 2011 and 2013. France also achieved a reduction of6.7% in the demand for sugar sweetened drinks between 2012and 2013.36 Although the percentage of taxation is differentacross countries, all evaluations showed significant decreasesin purchases.37 Comparing these reductions with our results isdifficult, as we used consumption data and focused on estimatingthe probability of change across consumption categories, withno quantification of the change in soft drink intake. However,our results suggest a change in soft drink consumptionbehaviours in the expected direction: an increase in theprobability of becoming a low consumer or non-consumer afterthe tax.The effect of the sugar sweetened beverages tax in Mexico hasbeen extensively evaluated using household purchases.14 20 22
Our findings, although not comparable given the differentmeasures used, are consistent with those of studies that showedreductions in household purchases of taxed beverages in urbanareas or reductions in country level sales of sugary drinksassociated with the sugar sweetened beverages tax.14 21
Household purchases per capita are a proxy for individualconsumption and have been shown to adequately approximatedietary quality.38 39 However, household purchase data tend toomit drinks acquired in other venues (for example, food service)or consumed outside of home, a behaviour that is better capturedby the food frequency questionnaire.Previous Mexican studies reported a price elasticity for softdrinks of −1.06 and−1.16 for sugar sweetened beverages; theseelasticities were higher for households in rural areas, in highmarginalised zones, or with lower income.40 Studies conductedusing nationally representative samples in Mexico found thathouseholds with low socioeconomic status experienced thelargest reduction in purchases of sugar sweetened drinks afterthe tax, compared with higher socioeconomic status strata.20 21
Our study found no statistically significant difference in theeffect of the tax by income level, although there was anindication that participants in the middle level of income couldhave experienced a larger reduction in consumption than otherincome groups. This discrepancy could be explained by thedifferences in the income distribution of our cohort, comparedwith the Mexican population; for instance, our low income thirdcaptures people between the second and third deciles of thenational income, whereas our high income third includesparticipants above the ninth decile of national income. Thus,the range of income captured by our cohort is smaller and biasedtowards higher income, compared with national estimates (norepresentation of the poorest tenth and overrepresentation ofthe top 20% of income).We observed heterogeneity of the effect of the tax by educationlevel, with larger decreases in the probability of being a mediumand high consumer of soft drinks and greater increases in theprobability of being a low consumer or non-consumer inparticipants with secondary and higher education, comparedwith those with elementary education or less. A previousanalysis using purchase data in a nationally representativesample found that households in which the family head had aneducation level of less than high school experienced the largestreduction in taxed beverage purchases after the tax.22 In ourcase, we relied on self-reported educational attainment level,which provides a closer link to individual level sugar sweetened
No commercial reuse: See rights and reprints http://www.bmj.com/permissions Subscribe: http://www.bmj.com/subscribe
BMJ 2020;369:m1311 doi: 10.1136/bmj.m1311 Page 4 of 11
drinks consumption. However, more than 40% of ourparticipants had college education or higher, compared with the18% reported nationally; only 15% of our sample had primaryschool or less compared with 25% nationally.41 Along with thecomposition of our sample, our results need to be interpretedtaking into consideration that our sample is composed of healthprofessionals and their families, who are likely to be moreinformed about the health effects of sugar sweetened drinksthan the overall population and might respond more positivelythan the rest of the population to the sugar sweetened beveragestax. Considering these limitations, our study still adds individuallevel, self-reported evidence suggesting that the tax has animportant ability to positively influence consumptionbehaviours, in line with previous findings from householdpurchase and sales data.20 21 We believe these findings shouldencourage deeper investigation of the intersection betweeneducation, information, and the tax to generate reductions inthe consumption of sugar sweetened beverages.
Strengths and limitations of studyOur analysis of Mexico’s sugar sweetened beverages tax didnot have a comparison group, as the tax is a national policy.Instead, we had information available from two time pointsbefore the implementation of the tax, which allowed us toestimate the trend between 2004 and 2010 and compare it withthe observed consumption in 2017. Our results could beinfluenced by social and economic confounders that we wereunable to account for. However, we included a large set ofconfounders at the individual and family level, as well aseconomic and weather data to adjust for seasonal differences,given that temperature and economic changes have a stronginfluence on beverage consumption. The food frequencyquestionnaire used was previously validated, but it was notassessed specifically for sugar content. Furthermore, it wasvalidated in a sample of women of low socioeconomic statusfrom Mexico City. This difference in validated population fromthe one used for our analysis could potentially influence ourresults.27 Also, our sample consists of health workers and theirfamilies, who, besides being more affluent and better educated,are likely to be more informed about the health implications ofsugar sweetened drinks than is the average Mexican; theirsocioeconomic status and professional involvement could makethem more prone to health oriented lifestyle changes than thegeneral population.42 This population might also underreportsoft drink consumption if they understand and perceive thenegative health implications of consumption of sugar sweeteneddrinks, particularly if the social desirability bias increased overtime. We note, however, that the post-tax wave used here wasat least three years after the media attention around the tax, sowhether such a bias would have necessarily become strongerfor the post-tax wave is unclear. Previous studies also found anincrease in purchases of water at least within the first year ofthe tax.14 Unfortunately, we were unable to investigate changesin water consumption in our study as the questions for waterintake in the HWCS survey changed across the three waves.
Implication of resultsThe nature of the public health policy and the possible studydesigns available make isolating the effects of this interventiondifficult. It is unclear whether changes in reported intakes ofsugar sweetened beverages are due to actual behavioural changesin response to higher prices or to the growing perception andunderstanding that such drinks are unhealthy and thatconsumption should be lowered (norm changes). Nevertheless,our findings, together with published evidence, indicate that a
fiscal measure such as taxation can be effective in helping toreduce intake of sugar sweetened drinks in the population.37
These results have an important public health implication, asthey add to the much needed evidence for the short term andlonger term effects of sugar sweetened beverages taxation onsales and consumption that has been requested by policy makersand industry stakeholders. Continued close monitoring ofchanges in intake by the population is still needed to betterunderstand the effects of this policy and assess potential futuremodifications.
ConclusionMexico’s sugar sweetened beverages tax (1 peso per litre) wasimplemented with the aim of reducing consumption of unhealthydrinks. Our findings show the continuous role that taxationmight play in reducing intake of soft drinks three years afterimplementation. Further research to understand the longer termimplications that these changes could have for body weight ormetabolic diseases is needed. A growing evidence base suggeststhat sizable reductions in consumption of sugar sweetened drinksmight be obtained with the current tax.37 Recent calls to increasethe tax to 20% have been made, to further reduce consumptionof unhealthy drinks.
What is already known on this topicTaxes on sugar sweetened drinks have been recommended as anintervention to reduce sugar consumptionEvidence of the effectiveness of tax in reducing consumption of sugarsweetened drinks in Mexico has been established through purchases andsales studies at the household levelNo study has analysed individual changes in consumption related to thetax in Mexico
What this study addsThree years after implementation of the tax, the probability of being amedium or high consumer of soft drinks had decreased, and the probabilityof being a low consumer or non-consumer had increasedStronger associations were observed in participants with secondary schooland higher education than in those with elementary school or lessTaxes on sugar sweetened drinks are an effective means of deterringconsumption; further increases to the tax could encourage furtherreductions in the very high consumption levels in Mexico
Contributors: LMSR processed and analysed the data and wrote and finalised themanuscript. FCO and RGM participated in the literature search, processed data,and modified the manuscript. AMC and SN provided advice on the analysis andhelped with the development of the manuscript. PRP collected data. JS contributedto the design of the study and participated in data collection. TBG designed thestudy, provided advice on the analysis, and helped to write the manuscript. Allauthors read and approved the final manuscript. The corresponding author atteststhat all listed authors meet authorship criteria and that no others meeting the criteriahave been omitted. LMSR is the guarantor.
Funding: This research received unrestricted funding from BloombergPhilanthropies. The funders had no role in the design, analysis, interpretation, orwriting of this paper.
Competing interests: All authors have completed the ICMJE uniform disclosureform at www.icmje.org/coi_disclosure.pdf and declare: support from BloombergPhilanthropies for the submitted work; no financial relationships with anyorganisations that might have an interest in the submitted work in the previousthree years; no other relationships or activities that could appear to have influencedthe submitted work.
Ethical approval: The study protocol, questionnaires, procedures, and informedconsent forms were approved by the corresponding institutional review boards ofall participating institutions: the Mexican Social Security Institute (12CEI 09 00614), the National Institute of Public Health (13CEI 17 007 36), and the Autonomous
No commercial reuse: See rights and reprints http://www.bmj.com/permissions Subscribe: http://www.bmj.com/subscribe
BMJ 2020;369:m1311 doi: 10.1136/bmj.m1311 Page 5 of 11
University of the Mexico State (1233008X0236). All participants gave writteninformed consent to enrol in the study.
Data sharing: Code for all the analyses as well as the anonymised database willbe made available on reasonable request.
Transparency: The lead author (the manuscript’s guarantor) affirms that thismanuscript is an honest, accurate, and transparent account of the study beingreported; that no important aspects of the study have been omitted; and that anydiscrepancies from the study as planned (and, if relevant, registered) have beenexplained.
Dissemination to participants and related patient and public communities: Resultswere disseminated as a research poster at the Obesity Society Meeting 2019.Future plans for dissemination include but are not limited to: press release by theNational Institute of Public Health in Mexico, in coordination with the University ofNorth Carolina; release of infographics through social media; and presentationsin national and international scientific seminars.
1 World Health Organization. Guideline: sugars intake for adults and children. 2015. https://apps.who.int/iris/bitstream/handle/10665/149782/9789241549028_eng.pdf?sequence=1.
2 World Health Organization. Global status report on noncommunicable diseases 2010.WHO Press, 2011.
3 Sánchez-Pimienta TG, Batis C, Lutter CK, Rivera JA. Sugar-sweetened beverages arethe main sources of added sugar intake in the Mexican population. J Nutr2016;146:1888S-96S. 10.3945/jn.115.220301 27511931
4 Malik VS, Pan A, Willett WC, Hu FB. Sugar-sweetened beverages and weight gain inchildren and adults: a systematic review and meta-analysis. Am J Clin Nutr2013;98:1084-102. 10.3945/ajcn.113.058362 23966427
5 Malik VS, Popkin BM, Bray GA, Després JP, Willett WC, Hu FB. Sugar-sweetenedbeverages and risk of metabolic syndrome and type 2 diabetes: a meta-analysis. DiabetesCare 2010;33:2477-83. 10.2337/dc10-1079 20693348
6 Niebylski ML, Redburn KA, Duhaney T, Campbell NR. Healthy food subsidies andunhealthy food taxation: A systematic review of the evidence. Nutrition 2015;31:787-95.10.1016/j.nut.2014.12.010 25933484
7 Vartanian LR, Schwartz MB, Brownell KD. Effects of soft drink consumption on nutritionand health: a systematic review and meta-analysis. Am J Public Health 2007;97:667-75.10.2105/AJPH.2005.083782 17329656
8 World Health Organization. Fiscal policies for diet and prevention of noncommunicablediseases: technical meeting report, 5-6 May 2015 . WHO; 2016.
9 Mytton OT, Clarke D, Rayner M. Taxing unhealthy food and drinks to improve health.BMJ 2012;344:e2931. 10.1136/bmj.e2931 22589522
10 Zhong Y, Auchincloss AH, Lee BK, Kanter GP. The short-term impacts of the Philadelphiabeverage tax on beverage consumption. Am J Prev Med 2018;55:26-34.10.1016/j.amepre.2018.02.017 29656917
11 Silver LD, Ng SW, Ryan-Ibarra S, etal . Changes in prices, sales, consumer spending,and beverage consumption one year after a tax on sugar-sweetened beverages inBerkeley, California, US: A before-and-after study. PLoS Med 2017;14:e1002283.10.1371/journal.pmed.1002283 28419108
12 Cornelsen L, Carriedo A. Health-related taxes on foods and beverages. Food ResearchCollaboration Policy Brief, 2015.
13 Afshin A, Peñalvo JL, Del Gobbo L, etal . The prospective impact of food pricing onimproving dietary consumption: A systematic review and meta-analysis. PLoS One2017;12:e0172277. 10.1371/journal.pone.0172277 28249003
14 Colchero MA, Popkin BM, Rivera JA, Ng SW. Beverage purchases from stores in Mexicounder the excise tax on sugar sweetened beverages: observational study. BMJ2016;352:h6704. 10.1136/bmj.h6704 26738745
15 Falbe J, Thompson HR, Becker CM, Rojas N, McCulloch CE, Madsen KA. Impact of theBerkeley excise tax on sugar-sweetened beverage consumption. Am J Public Health2016;106:1865-71. 10.2105/AJPH.2016.303362 27552267
16 Guerrero-López CM, Unar-Munguía M, Colchero MA. Price elasticity of the demand forsoft drinks, other sugar-sweetened beverages and energy dense food in Chile. BMCPublic Health 2017;17:180. 10.1186/s12889-017-4098-x 28183287
17 World Health Organization. Reducing consumption of sugar-sweetened beverages toreduce the risk of unhealthy weight gain in adults. 2016. https://www.who.int/elena/titles/ssbs_adult_weight/en/.
18 Pan American Health Organization. Taxes on sugar-sweetened beverages as a publichealth strategy: the experience of Mexico. PAHO, 2015, https://iris.paho.org/xmlui/handle/123456789/18391.
19 Singh GM, Micha R, Khatibzadeh S, Lim S, Ezzati M, Mozaffarian DGlobal Burden ofDiseases Nutrition and Chronic Diseases Expert Group (NutriCoDE). Estimated global,regional, and national disease burdens related to sugar-sweetened beverage consumptionin 2010. Circulation 2015;132:639-66. 10.1161/CIRCULATIONAHA.114.010636 26124185
20 Colchero MA, Rivera-Dommarco J, Popkin BM, Ng SW. In Mexico, evidence of sustainedconsumer response two years after implementing a sugar-sweetened beverage tax. HealthAff (Millwood) 2017;36:564-71. 10.1377/hlthaff.2016.1231 28228484
21 Colchero MA, Molina M, Guerrero-López CM. After Mexico implemented a tax, purchasesof sugar-sweetened beverages decreased and water increased: difference by place ofresidence, household composition, and income level. J Nutr 2017;147:1552-7.10.3945/jn.117.251892 28615377
22 Ng SW, Rivera JA, Popkin BM, Colchero MA. Did high sugar-sweetened beveragepurchasers respond differently to the excise tax on sugar-sweetened beverages inMexico?Public Health Nutr 2018;22:1-7.30560754
23 Wright A, Smith KE, Hellowell M. Policy lessons from health taxes: a systematic reviewof empirical studies. BMC Public Health 2017;17:583.10.1186/s12889-017-4497-z 28629470
24 Gutiérrez J, Rivera-Dommarco J, Shamah-Levy T, etal . Resultados Nacionales EncuestaNacional de Salud y Nutrición (ENSANUT). Instituto Nacional de Salud Pública, 2012.
25 Denova-Gutiérrez E, Flores YN, Gallegos-Carrillo K, etal . Health workers cohort study:methods and study design. Salud Publica Mex 2016;58:708-16.10.21149/spm.v58i6.8299 28225947
26 Valente H, Teixeira V, Padrão P, etal . Sugar-sweetened beverage intake and overweightin children from a Mediterranean country. Public Health Nutr 2011;14:127-32.10.1017/S1368980010002533 20920387
27 Hernández-Avila M, Romieu I, Parra S, Hernández-Avila J, Madrigal H, Willett W. Validityand reproducibility of a food frequency questionnaire to assess dietary intake of womenliving in Mexico City. Salud Publica Mex 1998;40:133-40.10.1590/S0036-36341998000200005 9617194
28 Schulze MB, Manson JE, Ludwig DS, etal . Sugar-sweetened beverages, weight gain,and incidence of type 2 diabetes in young and middle-aged women. JAMA2004;292:927-34. 10.1001/jama.292.8.927 15328324
29 Narain A, Kwok CS, Mamas MA. Soft drinks and sweetened beverages and the risk ofcardiovascular disease and mortality: a systematic review and meta-analysis. Int J ClinPract 2016;70:791-805. 10.1111/ijcp.12841 27456347
30 INEGI. PIB y Cuentas Nacionales México: Instituto Nacional de Estadística y Geografía;2018. https://www.inegi.org.mx/temas/pib/default.html#Informacion_general.
31 Batis C, Rivera JA, Popkin BM, Taillie LS. First-year evaluation of Mexico’s tax onnonessential energy-dense foods: an observational study. PLoS Med 2016;13:e1002057.10.1371/journal.pmed.1002057 27379797
32 Wooldridge JM. Econometric analysis of cross section and panel data. 2nd ed. MIT Press,2010.
33 Schunck R. Within and between estimates in random-effects models: Advantages anddrawbacks of correlated random effects and hybrid models. Stata J2013;13:65-7610.1177/1536867X1301300105.
34 Zhong Y, Auchincloss AH, Lee BK, Kanter GP. The short-term impacts of the Philadelphiabeverage tax on beverage consumption. Am J Prev Med 2018;55:26-34.10.1016/j.amepre.2018.02.017 29656917
35 Lee MM, Falbe J, Schillinger D, Basu S, McCulloch CE, Madsen KA. Sugar-sweetenedbeverage consumption 3 years after the Berkeley, California, sugar-sweetened beveragetax. Am J Public Health 2019;109:637-9. 10.2105/AJPH.2019.304971 30789776
36 European Competitiveness and Sustainable Industrial Policy Consortium. Food taxesand their impact on competitiveness in the agri-food sector. 2014. https://ec.europa.eu/growth/content/food-taxes-and-their-impact-competitiveness-agri-food-sector-study-0_en.
37 Teng AM, Jones AC, Mizdrak A, Signal L, Genç M, Wilson N. Impact of sugar-sweetenedbeverage taxes on purchases and dietary intake: Systematic review and meta-analysis.Obes Rev 2019;20:1187-204. 10.1111/obr.12868 31218808
38 Appelhans BM, French SA, Tangney CC, Powell LM, Wang Y. To what extent do foodpurchases reflect shoppers’ diet quality and nutrient intake?Int J Behav Nutr Phys Act2017;14:46. 10.1186/s12966-017-0502-2 28399887
39 Kong A, Schiffer L, Antonic M, Braunschweig C, Odoms-Young A, Fitzgibbon M. Therelationship between home- and individual-level diet quality among African American andHispanic/Latino households with young children. Int J Behav Nutr Phys Act 2018;15:5.10.1186/s12966-018-0645-9 29334994
40 Zheng Y, Zhen C, Dench D, Nonnemaker JM. US demand for tobacco products in asystem framework. Health Econ 2017;26:1067-86. 10.1002/hec.3384 27402419
41 INEGI. Censo y Conteo de Poblacion y Vivienda. Encuesta Intercensal 2015. https://www.inegi.org.mx/temas/educacion/.
42 Park S, Onufrak S, Sherry B, Blanck HM. The relationship between health-relatedknowledge and sugar-sweetened beverage intake among US adults. J Acad Nutr Diet2014;114:1059-66. 10.1016/j.jand.2013.11.003 24360502
43 Bell A, Fairbrother M, Jones K. Fixed and random effects models: making an informedchoice. Qual Quant 2019;53:1051-7410.1007/s11135-018-0802-x.
Table 1| Sample characteristics of the Health Workers Cohort Study participants at each wave of data collection. Data are mean (SD) unlessstated otherwise
$ 1=£0.80; €0.91.* This is an unmatched panel; thus, fluctuations could arise from actual change over time or from changes in participants. Descriptive information about a matched panel
can be found in appendix 2.
No commercial reuse: See rights and reprints http://www.bmj.com/permissions Subscribe: http://www.bmj.com/subscribe
BMJ 2020;369:m1311 doi: 10.1136/bmj.m1311 Page 7 of 11
Table 2| Percentage difference in predicted probability of being in soft drink consumption categories for periods before (2004-13) and after(2017-18) implementation of sugar sweetened beverage tax, by income level
Change in percentage points (95% CI) before to after taxSoft drink consumption categories*
Non-consumer
4.4 (−2.4 to 11.2)Low income
5.7 (0.3 to 11.1)Middle income
5.1 (−0.1 to 10.2)High income
Low consumer
4.3 (−1.5 to 10.0)Low income
9.4 (2.3 to 16.6)Middle income
8.8 (1.4 to 16.2)High income
Medium consumer
−5.7 (−14.0 to 2.6)Low income
−8.1 (−15.3 to−0.8)Middle income
−7.2 (−14.3 to−0.1)High income
High consumer
−3.0 (−7.1 to 1.1)Low income
−7.1 (−12.3 to−1.8)Middle income
−6.6 (−12.2 to−1.1)High income
Predicted values from ordered logistic correlated random effects regression models shown in appendix table A1-3.* Non-consumer=no soft drink consumption; low consumer=consumed <1 serving/week; medium consumer=consumed 1 serving/week to <1 serving/day; high
consumer=consumed ≥1 serving/day.
No commercial reuse: See rights and reprints http://www.bmj.com/permissions Subscribe: http://www.bmj.com/subscribe
BMJ 2020;369:m1311 doi: 10.1136/bmj.m1311 Page 8 of 11
Table 3| Percentage difference in predicted probability of being in soft drink consumption categories for periods before (2004-13) and after(2017-18) implementation of sugar sweetened beverages tax, by education level
Change in percentage points (95% CI) from before to after taxSoft drink consumption categories*
Non-consumer
0.9 (−1.7 to 3.5)Elementary school or less
6.8 (0.7 to 12.9)Middle and high school
6.7 (0.0 to 13.4)College and higher
Low consumer
3.3 (−5.9 to 12.6)Elementary school or less
9.0 (2.7 to 15.4)Middle and high school
6.8 (1.4 to 12.2)College and higher
Medium consumer
−0.5 (−3.4 to 2.4)Elementary school or less
−9.0 (−16.6 to−1.5)Middle and high school
−8.5 (−16.3 to−0.6)College and higher
High consumer
−3.7 (−13.7 to 6.3)Elementary school or less
−6.8 (−11.7 to−2.0)Middle and high school
−5.0 (−9.1 to−0.9)College and higher
Predicted values from ordered logistic correlated random effects regression models shown in appendix table A1-4.* Non-consumer=no soft drink consumption; low consumer=consumed <1 serving/week; medium consumer=consumed 1 serving/week to <1 serving/day; high
consumer=consumed ≥1 serving/day.
No commercial reuse: See rights and reprints http://www.bmj.com/permissions Subscribe: http://www.bmj.com/subscribe
BMJ 2020;369:m1311 doi: 10.1136/bmj.m1311 Page 9 of 11
Fig 1 Unadjusted distribution of categories of soft drinks consumption among participants in Health Workers Cohort Studybetween 2004 and 2017. Non-consumer=no soft drink consumption; low consumer=consumed <1 serving/week;medium consumer=consumed 1 serving/week to <1 serving/day; high consumer=consumed ≥1 serving/day
Fig 2 Percentage difference in predicted probability of changing soft drink consumption categories between periods before(2004-13) and after (2017-18) implementation of sugar sweetened beverages tax in Mexico. Non-consumer=no softdrink consumption; low consumer=consumed <1 serving/week; medium consumer=consumed 1 serving/week to <1serving/day; high consumer=consumed ≥1 serving/day. Predicted values from ordered logistic correlated randomeffects regression models shown in appendix table A1-2
No commercial reuse: See rights and reprints http://www.bmj.com/permissions Subscribe: http://www.bmj.com/subscribe
BMJ 2020;369:m1311 doi: 10.1136/bmj.m1311 Page 10 of 11
Fig 3 Percentage difference in predicted probability of being in soft drink consumption categories between periods before(2004-13) and after (2017-18) implementation of sugar sweetened beverages tax in Mexico, complete case analysis.Non-consumer=no soft drink consumption; low consumer=consumed <1 serving/week; medium consumer=consumed1 serving/week to <1 serving/day; high consumer=consumed ≥1 serving/day. Predicted values from ordered logisticcorrelated random effects regression models shown in appendix table A2-2
No commercial reuse: See rights and reprints http://www.bmj.com/permissions Subscribe: http://www.bmj.com/subscribe
BMJ 2020;369:m1311 doi: 10.1136/bmj.m1311 Page 11 of 11