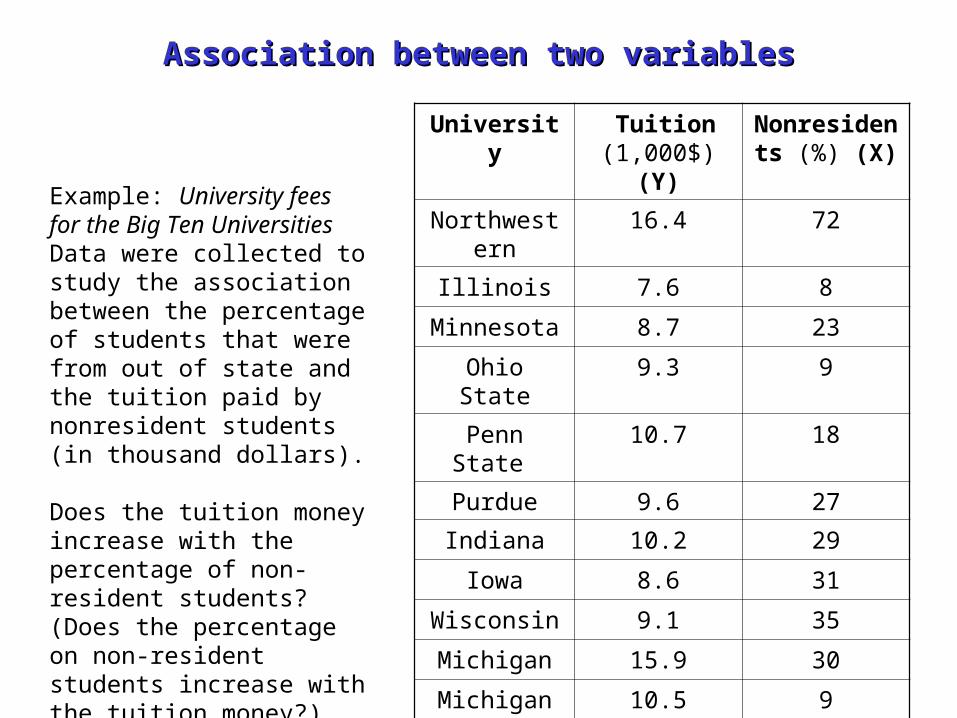
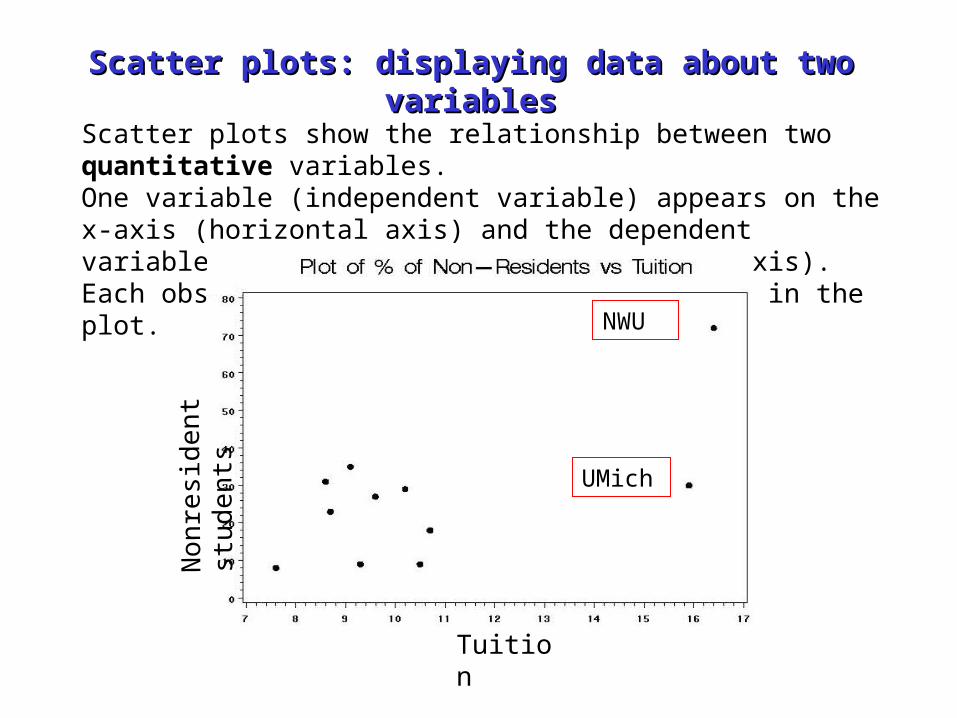
Association between two variables Association between two variables Example: University fees for the Big Ten Universities Data were collected to study the association between the percentage of students that were from out of state and the tuition paid by nonresident students (in thousand dollars). Does the tuition money increase with the percentage of non- resident students? (Does the percentage on non-resident students increase with the tuition money?) Universit y Tuition (1,000$) (Y) Nonresiden ts (%) (X) Northwest ern 16.4 72 Illinois 7.6 8 Minnesota 8.7 23 Ohio State 9.3 9 Penn State 10.7 18 Purdue 9.6 27 Indiana 10.2 29 Iowa 8.6 31 Wisconsin 9.1 35 Michigan 15.9 30 Michigan State 10.5 9
Transcript
Association between two variablesAssociation between two variables
Example: University fees for the Big Ten UniversitiesData were collected to study the association between the percentage of students that were from out of state and the tuition paid by nonresident students (in thousand dollars).
Does the tuition money increase with the percentage of non- resident students? (Does the percentage on non-resident students increase with the tuition money?)
University Tuition (1,000$) (Y)
Nonresidents (%) (X)
Northwestern 16.4 72
Illinois 7.6 8
Minnesota 8.7 23
Ohio State 9.3 9
Penn State 10.7 18
Purdue 9.6 27
Indiana 10.2 29
Iowa 8.6 31
Wisconsin 9.1 35
Michigan 15.9 30
Michigan State
10.5 9
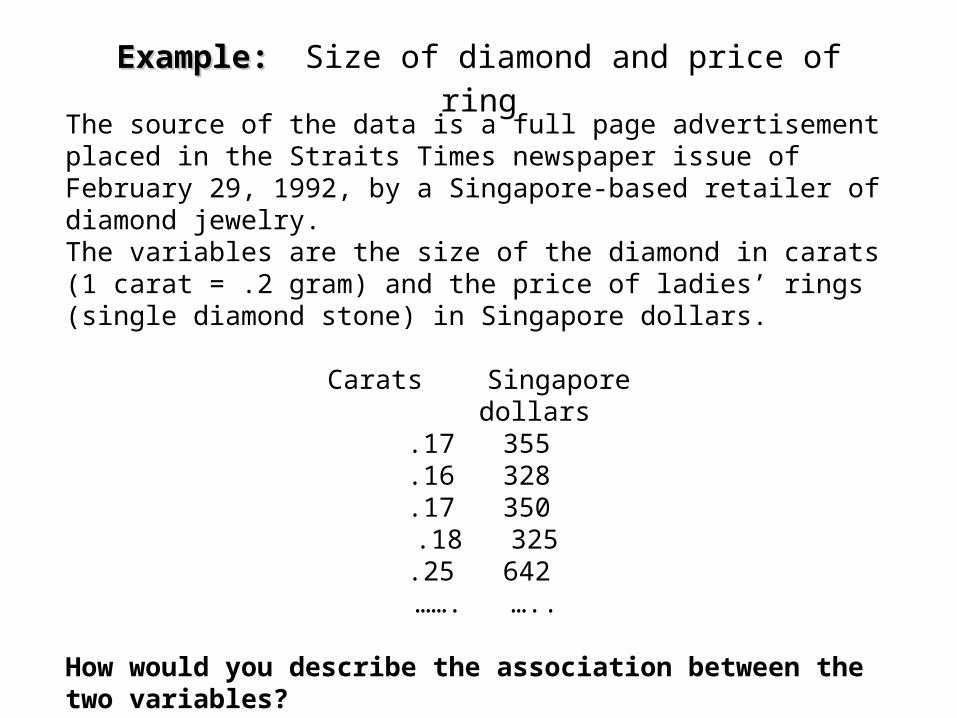
Example:Example: Size of diamond and price of ring
The source of the data is a full page advertisement placed in the Straits Times newspaper issue of February 29, 1992, by a Singapore-based retailer of diamond jewelry.The variables are the size of the diamond in carats (1 carat = .2 gram) and the price of ladies’ rings (single diamond stone) in Singapore dollars.
Carats Singapore dollars
.17 355
.16 328
.17 350 .18 325.25 642 ……. …..
How would you describe the association between the two variables?
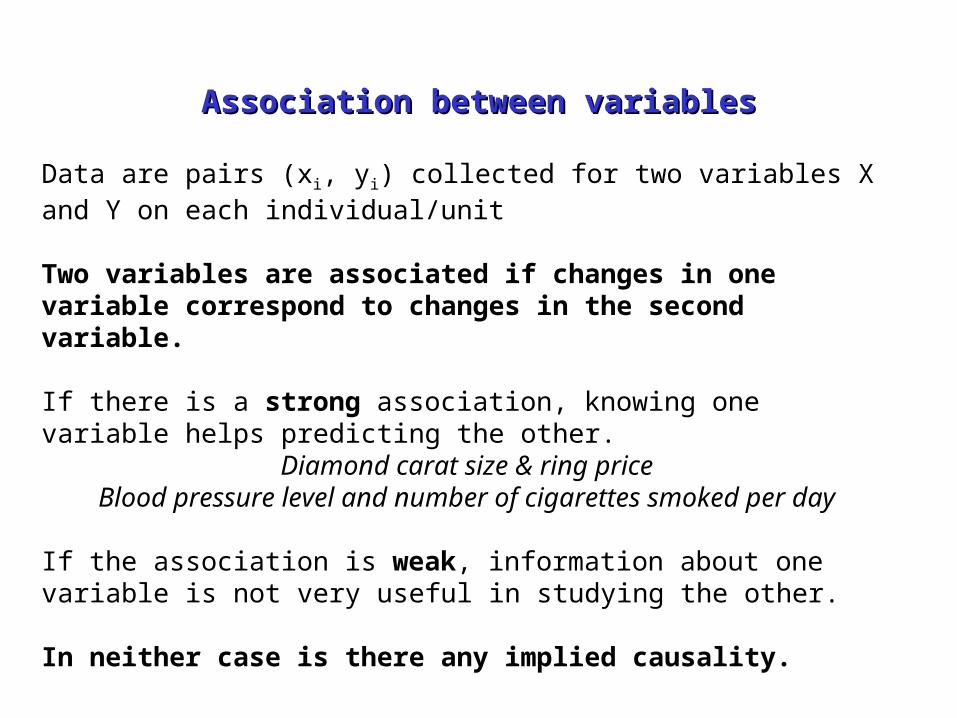
Association between variablesAssociation between variables
Data are pairs (xi, yi) collected for two variables X and Y on each individual/unit
Two variables are associated if changes in one variable correspond to changes in the second variable.
If there is a strong association, knowing one variable helps predicting the other.
Diamond carat size & ring priceBlood pressure level and number of cigarettes smoked per day
If the association is weak, information about one variable is not very useful in studying the other.
In neither case is there any implied causality.
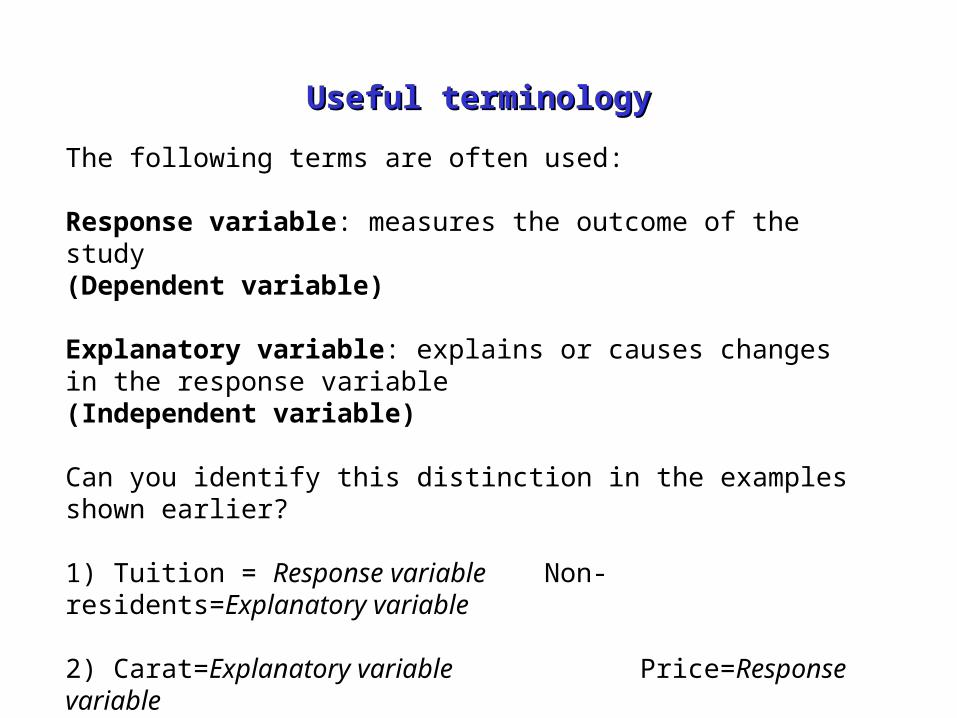
Useful terminologyUseful terminology
The following terms are often used:
Response variable: measures the outcome of the study(Dependent variable)
Explanatory variable: explains or causes changes in the response variable(Independent variable)
Can you identify this distinction in the examples shown earlier?
In this case, knowledge of the data may lead us to believe causality.
Scatter plots: displaying data about two variablesScatter plots: displaying data about two variables
Scatter plots show the relationship between two quantitative variables.One variable (independent variable) appears on the x-axis (horizontal axis) and the dependent variable appears on the y-axis (vertical axis). Each observation is represented by a point in the plot.
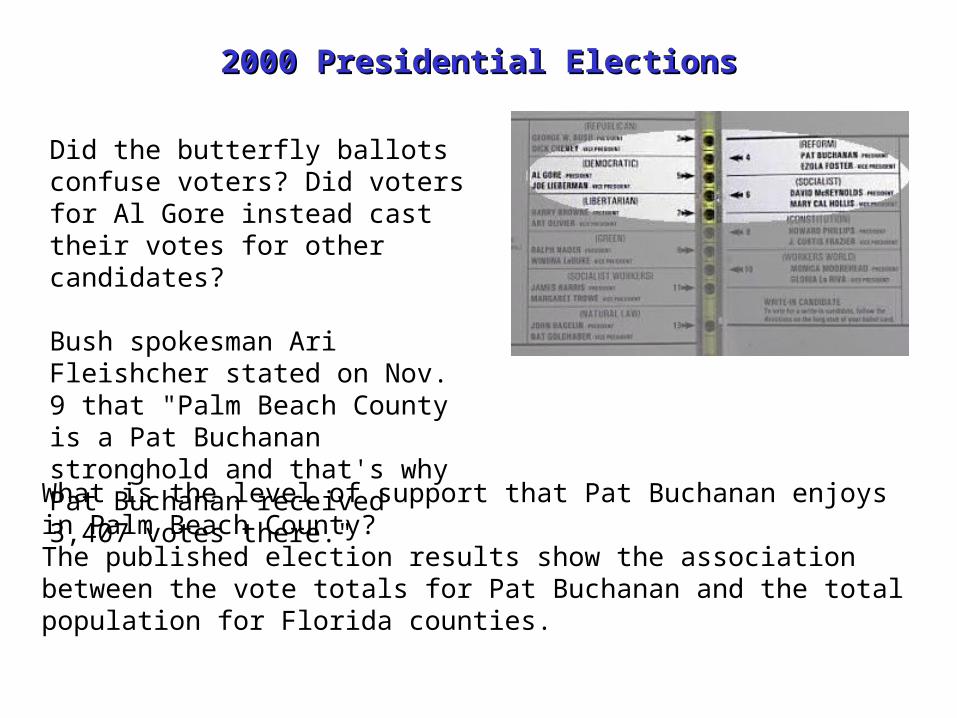
Did the butterfly ballots confuse voters? Did voters for Al Gore instead cast their votes for other candidates?
Bush spokesman Ari Fleishcher stated on Nov. 9 that "Palm Beach County is a Pat Buchanan stronghold and that's why Pat Buchanan received 3,407 votes there."
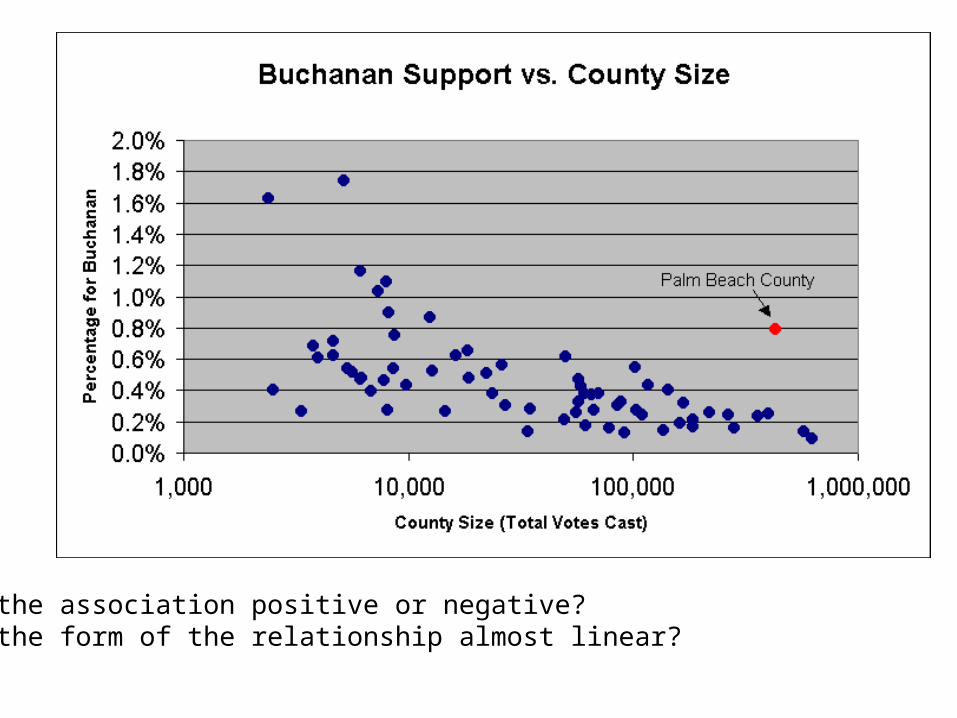
What is the level of support that Pat Buchanan enjoys in Palm Beach County?The published election results show the association between the vote totals for Pat Buchanan and the total population for Florida counties.
Is the association positive or negative? Is the form of the relationship almost linear?
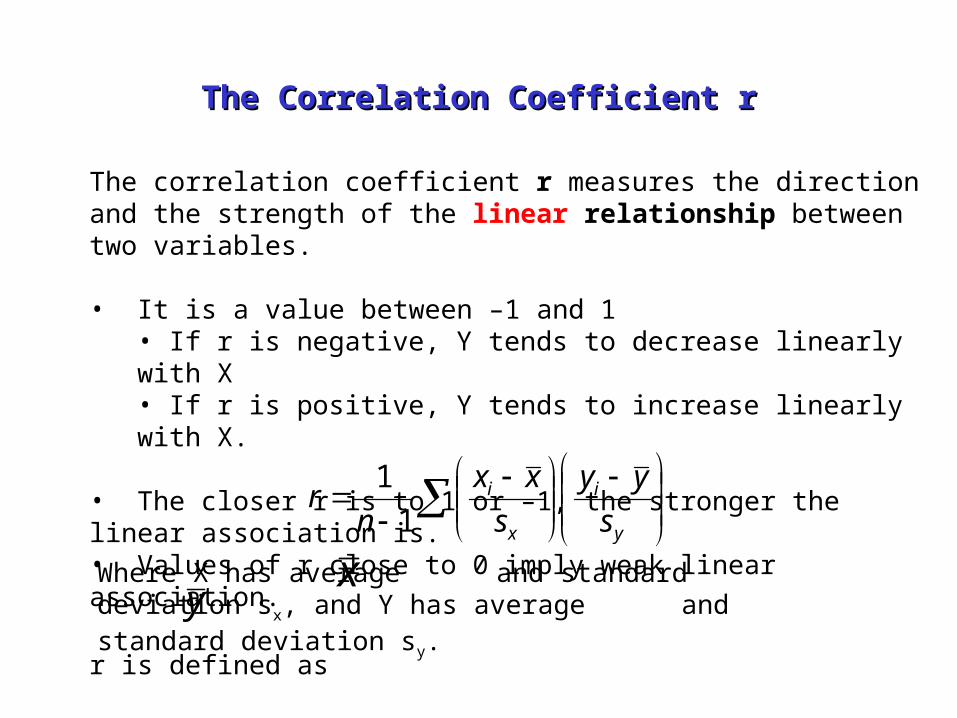
The Correlation Coefficient rThe Correlation Coefficient r
The correlation coefficient r measures the direction and the strength of the linear relationship between two variables.
• It is a value between –1 and 1• If r is negative, Y tends to decrease linearly with X• If r is positive, Y tends to increase linearly with X.
• The closer r is to 1 or –1, the stronger the linear association is. • Values of r close to 0 imply weak linear association.
r is defined as
y
i
x
i
s
yy
s
xx
nr
1
1
Where X has average and standard deviation sx, and Y has average and standard deviation sy.
xy
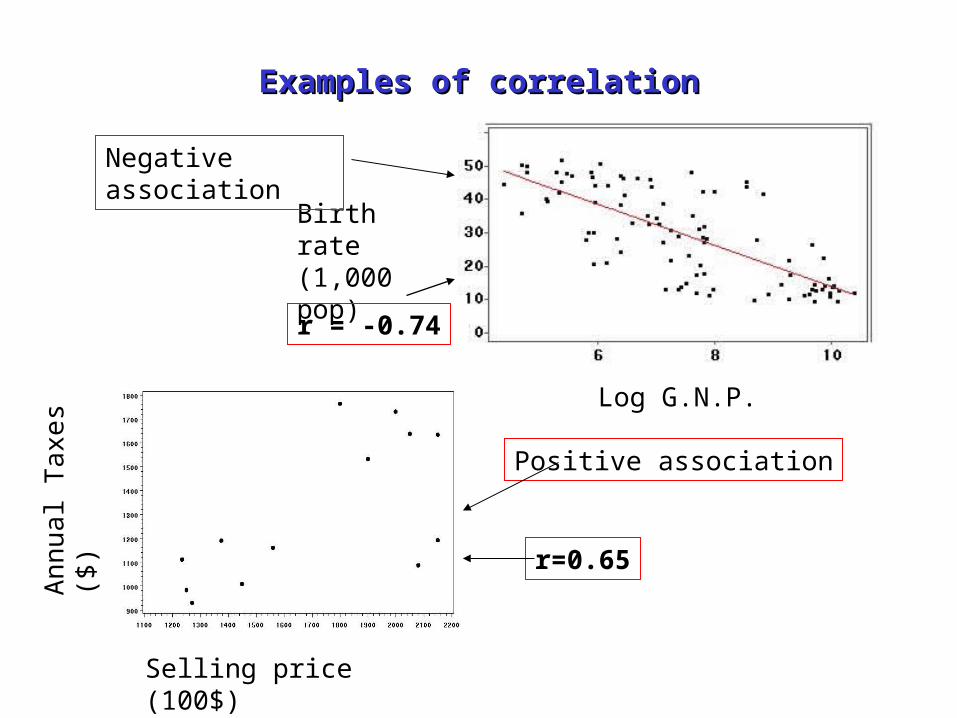
Examples of correlationExamples of correlation
Birth rate (1,000 pop)
Log G.N.P.
r = -0.74
Selling price (100$)
Ann
ual T
axes
($)
r=0.65
Negative association
Positive association
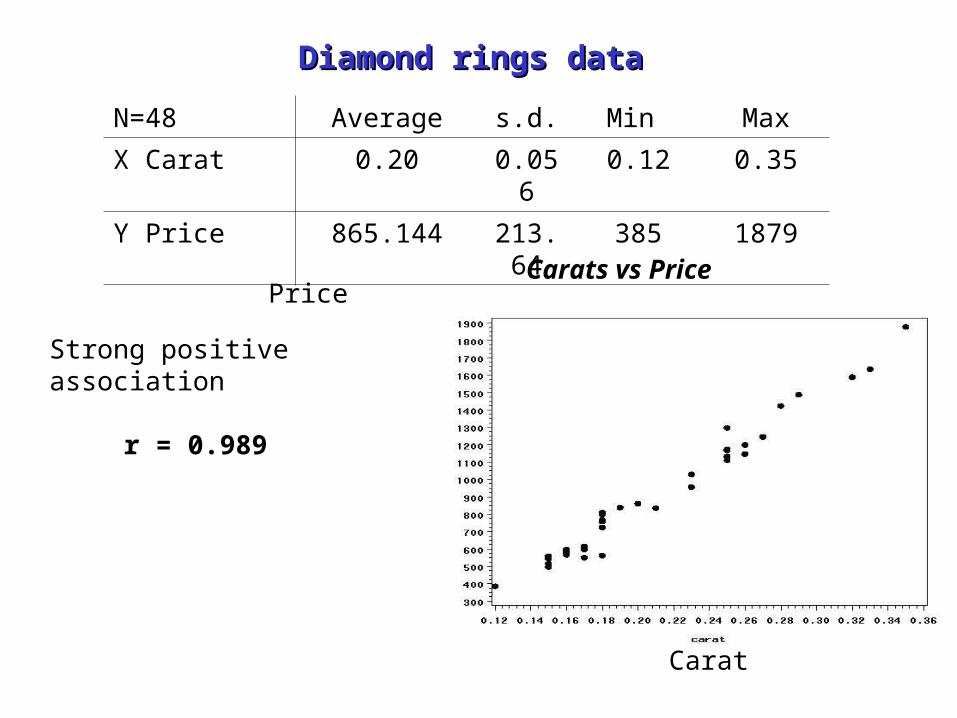
Diamond rings dataDiamond rings data
Carat
Price
N=48 Average s.d. Min Max
X Carat 0.20 0.056 0.12 0.35
Y Price 865.144 213.64 385 1879
Strong positive association
r = 0.989
Carats vs Price
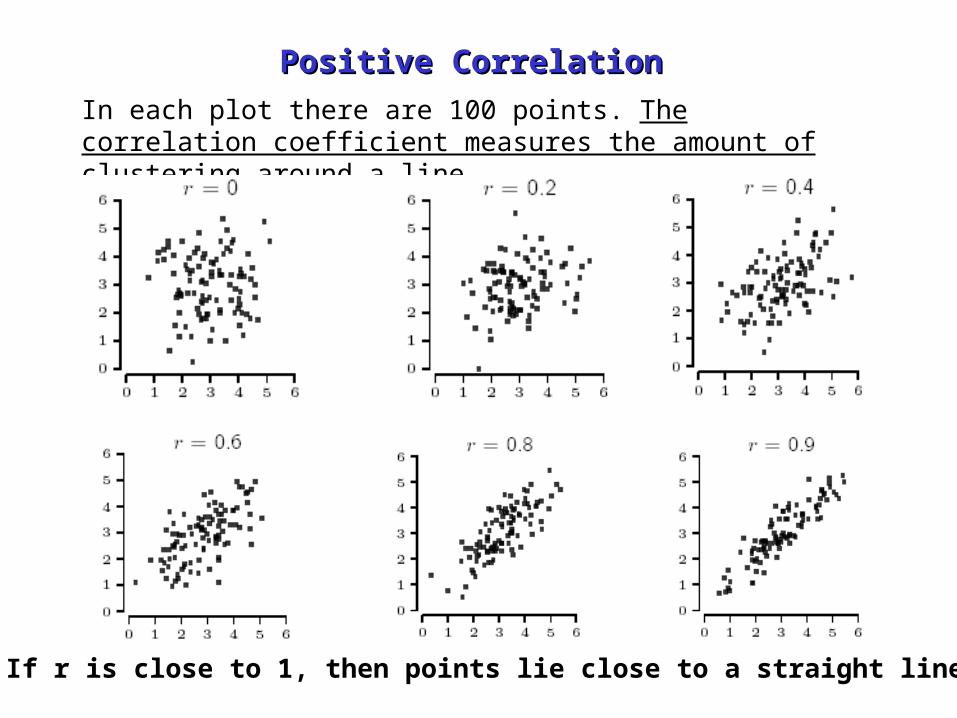
Positive CorrelationPositive Correlation
In each plot there are 100 points. The correlation coefficient measures the amount of clustering around a line
If r is close to 1, then points lie close to a straight line!!
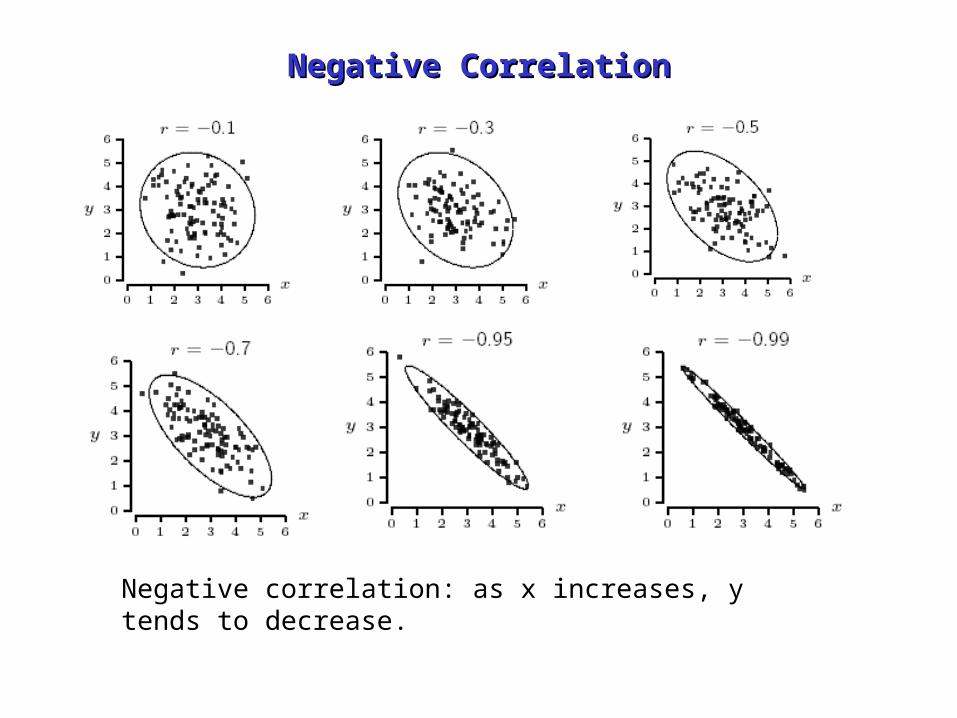
Negative CorrelationNegative Correlation
Negative correlation: as x increases, y tends to decrease.
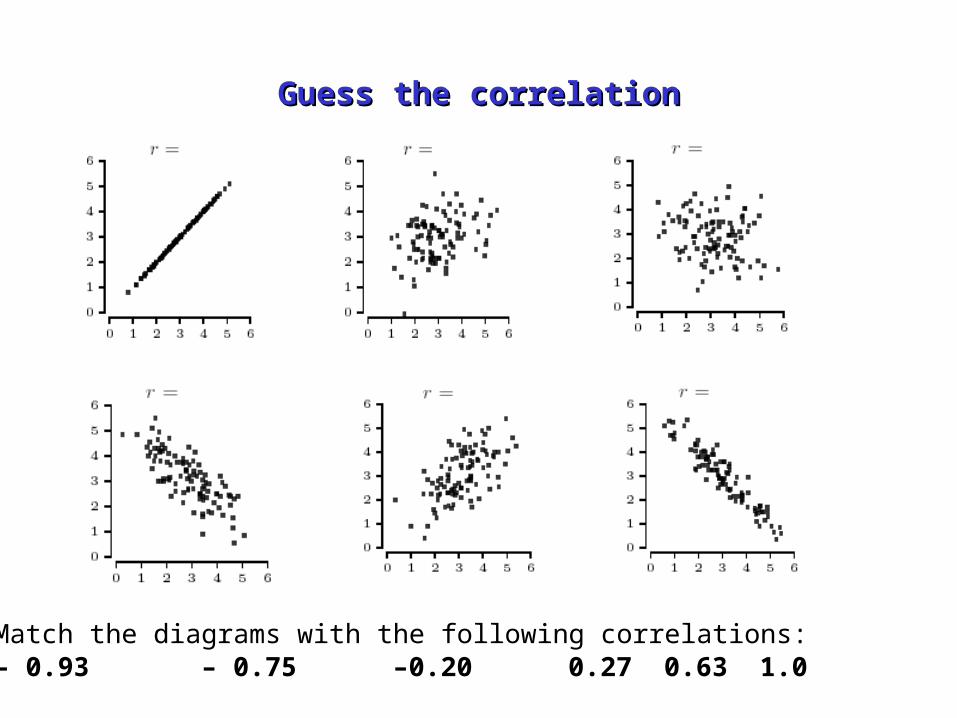
Guess the correlationGuess the correlation
Match the diagrams with the following correlations: – 0.93 – 0.75 –0.20 0.27 0.63 1.0
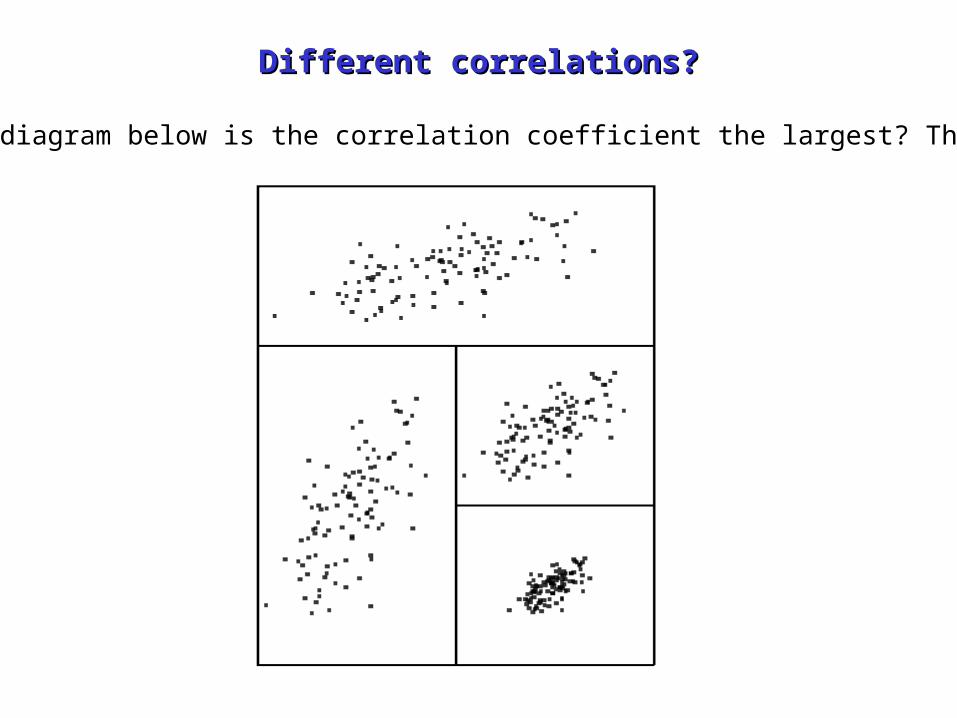
Different correlations?Different correlations?
In which diagram below is the correlation coefficient the largest? The smallest?
SummarySummary
The correlation coefficient r varies between –1 and 1. If r=0 then there no linear association between X and Y.
Positive r indicates positive association between X and Y. Negative r indicates negative association between X and Y. Both variables X and Y must be quantitative. The correlation coefficient between X and Y is the same as the correlation between Y and X
The correlation measures only the linear relationship between two variables
r can be strongly affected by the presence of outliers.
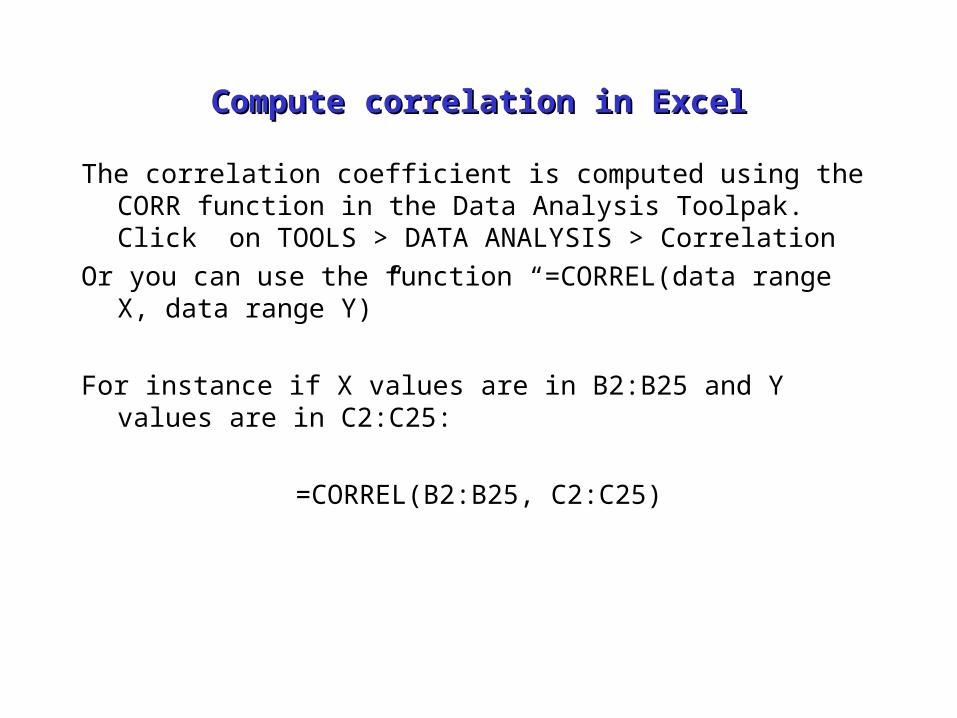
Compute correlation in ExcelCompute correlation in Excel
The correlation coefficient is computed using the CORR function in the Data Analysis Toolpak. Click on TOOLS > DATA ANALYSIS > Correlation
Or you can use the function “=CORREL(data range X, data range Y)”
For instance if X values are in B2:B25 and Y values are in C2:C25: