Page 1
RESEARCH ARTICLE
Association of visual and quantitative
heterogeneity of 18F-FDG PET images with
treatment response in locally advanced rectal
cancer: A feasibility study
Paula Martin-Gonzalez1, Estibaliz Gomez de Mariscal1,2, M. Elena Martino1,2, Pedro
M. Gordaliza1,2, Isabel Peligros2,3,4, Jose Luis Carreras2,3,5, Felipe A. Calvo2,4,6,
Javier Pascau1,2, Manuel Desco1,2,7,8*, Arrate Muñoz-Barrutia1,2
1 Departamento de Bioingenierıa e Ingenierıa Aeroespacial, Universidad Carlos III de Madrid, Madrid, Spain,
2 Instituto de Investigacion, Sanitaria Gregorio Marañon, Madrid, Spain, 3 Department of Pathology, Hospital
General Universitario Gregorio Marañon, Madrid, Spain, 4 School of Medicine, Universidad Complutense,
Madrid, Spain, 5 Department of Radiology and Medical Physics, Hospital General Universitario Gregorio
Marañon, Madrid, Spain, 6 Department of Oncology, Hospital General Universitario Gregorio Marañon,
Madrid, Spain, 7 Centro de Investigacion Biomedica en Red de Salud Mental (CIBERSAM), Madrid, Spain,
8 Centro de Investigaciones Cardiovasculares Carlos III (CNIC), Madrid, Spain
* [email protected]
Abstract
Background and purpose
Few tools are available to predict tumor response to treatment. This retrospective study
assesses visual and automatic heterogeneity from 18F-FDG PET images as predictors of
response in locally advanced rectal cancer.
Methods
This study included 37 LARC patients who underwent an 18F-FDG PET before their neoad-
juvant therapy. One expert segmented the tumor from the PET images. Blinded to the
patient´s outcome, two experts established by consensus a visual score for tumor heteroge-
neity. Metabolic and texture parameters were extracted from the tumor area. Multivariate
binary logistic regression with cross-validation was used to estimate the clinical relevance of
these features. Area under the ROC Curve (AUC) of each model was evaluated. Histopath-
ological tumor regression grade was the ground-truth.
Results
Standard metabolic parameters could discriminate 50.1% of responders (AUC = 0.685).
Visual heterogeneity classification showed correct assessment of the response in 75.4% of
the sample (AUC = 0.759). Automatic quantitative evaluation of heterogeneity achieved a
similar predictive capacity (73.1%, AUC = 0.815).
PLOS ONE
PLOS ONE | https://doi.org/10.1371/journal.pone.0242597 November 30, 2020 1 / 18
a1111111111
a1111111111
a1111111111
a1111111111
a1111111111
OPEN ACCESS
Citation: Martin-Gonzalez P, de Mariscal EG,
Martino ME, Gordaliza PM, Peligros I, Carreras JL,
et al. (2020) Association of visual and quantitative
heterogeneity of 18F-FDG PET images with
treatment response in locally advanced rectal
cancer: A feasibility study. PLoS ONE 15(11):
e0242597. https://doi.org/10.1371/journal.
pone.0242597
Editor: Jason Chia-Hsun Hsieh, Chang Gung
Memorial Hospital at Linkou, TAIWAN
Received: January 29, 2020
Accepted: November 5, 2020
Published: November 30, 2020
Copyright: © 2020 Martin-Gonzalez et al. This is an
open access article distributed under the terms of
the Creative Commons Attribution License, which
permits unrestricted use, distribution, and
reproduction in any medium, provided the original
author and source are credited.
Data Availability Statement: Data cannot be
shared publicly because of belonging to a third
party but all the data is available upon request.
Researchers interested in gaining access to data
should contact the corresponding author and
Ismael Buño, director of the Instituto de
Investigacion Sanitaria Gregorio Marañon (ismael.
[email protected] ). The authors did not receive any
special access privileges that other researchers
requesting the data wouldn’t get.
Page 2
Conclusion
A response prediction model in LARC based on tumor heterogeneity (assessed either visu-
ally or with automatic texture measurement) shows that texture features may complement
the information provided by the metabolic parameters and increase prediction accuracy.
Introduction
Advances in disease diagnosis and treatment have improved the outcome of Locally Advanced
Rectal Cancer (LARC). Nonetheless, most therapeutic decisions are still based on the Tumor,
Node and Metastasis staging system (TNM), together with the distal and circumferential resec-
tion margin [1–6]. LARC tumors are a highly diverse group of lesions that may exhibit differ-
ent responses to the same treatment, even in the same stage [7]. Therefore, early identification
of responders to neoadjuvant treatment (NAT) could facilitate the development of tailored
cancer therapies [4].
Medical imaging tools such as metabolic 18F-Fluorodeoxyglucose (FDG) PET imaging
have become crucial in oncology for staging and treatment evaluation [8,9]. Over the past
decades, 18F-FDG PET semi-quantitative metabolic activity descriptors derived from the
Standardized Uptake Value (SUV), such as SUVmean and SUVpeak have been clinically
used due to their prognostic ability [10–15]. More recent research recalls the interest of
other parameters such as Total Lesion Glycolysis (TLG) and Metabolic Tumor Volume
(MTV). These metrics provide information about metabolic activity in the whole volume.
Indeed, TLG and MTV prognosis accuracy has been reported to be significantly higher than
that of SUV values [16–18].
Nevertheless, the prognostic capacity of these metabolic features, even when combined
with volume descriptors, is very limited. Over the last years, tumor heterogeneity has shown to
be an additional source of information related with both prognosis and survival. It can be
hypothesized that heterogenous phenotypes in the macroscopic scale can be related to under-
lying tumor pathophysiology and thus capture tumor aggressiveness [19].
Recently, radiomics has emerged as a way of quantifying tumor heterogeneity captured by
radiological scans. The limited size of the available datasets for these purposes presents a limi-
tation for deep learning approaches. Indeed, the approach of radiomics is still primarily based
on handcrafted features used for regular machine learning predictive modelling [20]. Different
radiomic based Texture Analysis (TA) approaches have attempted to objectively capture het-
erogeneity information from 18F-FDG PET imaging studies [21–26]. Several flaws affect the
corroboration of texture analysis as a valuable predictor of therapeutic response, as most of the
published studies up to date did not perform multivariate analysis of the texture analysis fea-
tures nor performed a solid cross-validation [27]. Moreover, the quantitative texture features
obtained are complicatedly related to both the pathophysiological tumor processes and the
visual appearance of the images. This impairs a straightforward clinical usage of heterogeneity
features.
The aim of this multi-disciplinary study was to retrospectively evaluate the predictive capac-
ity of visually- and quantitatively assessed texture features in comparison with standard meta-
bolic parameters. A visual assessment scale of tumor texture and an open-source and carefully
revised workflow to automatize the texture analysis were introduced. Moreover, a multivariate
analysis combined with cross-validation was applied to generate robust results and their clini-
cal value was assessed.
PLOS ONE Tumor response prediction from PET image texture
PLOS ONE | https://doi.org/10.1371/journal.pone.0242597 November 30, 2020 2 / 18
Funding: This work was partially supported by the
Spanish Ministry of Economy and Competitiveness
(TEC2016–78052-R, PID2019-109820RB-I00) (to
AMB) and TEC2013-48251-C2 (to JP), Instituto de
Salud Carlos III and European Regional
Development Fund (FEDER) Funds from the
European Commission, “A way of making Europe”
(PI15/02121) and a Leonardo grant to Researchers
and Cultural Creators 2017, BBVA Foundation (to
AMB). PMG is supported by ‘Beca de Colaboracion’
of the Spanish Ministry of Education, Culture and
Sports. The CNIC is supported by the Ministry of
Economy, Industry and Competitiveness (MEIC)
and the Pro CNIC Foundation, and is a Severo
Ochoa Center of Excellence (SEV-2015-0505).
Competing interests: We have no conflicts of
interest to disclose.
Page 3
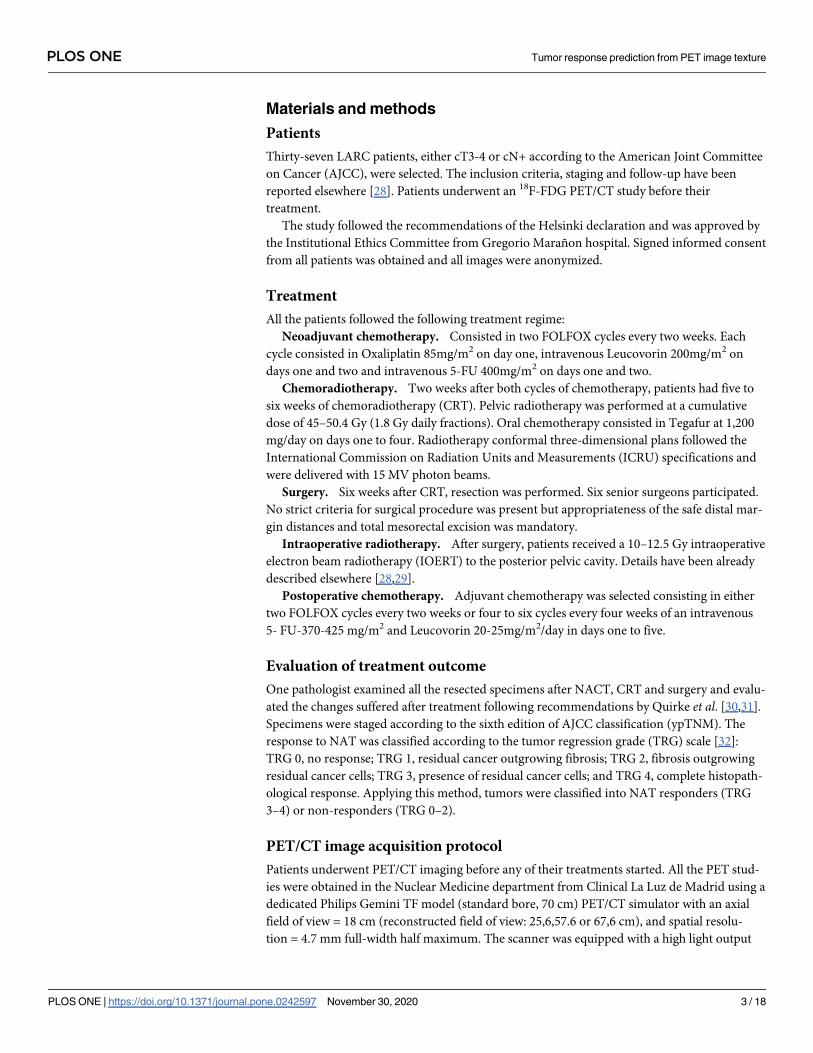
Materials and methods
Patients
Thirty-seven LARC patients, either cT3-4 or cN+ according to the American Joint Committee
on Cancer (AJCC), were selected. The inclusion criteria, staging and follow-up have been
reported elsewhere [28]. Patients underwent an 18F-FDG PET/CT study before their
treatment.
The study followed the recommendations of the Helsinki declaration and was approved by
the Institutional Ethics Committee from Gregorio Marañon hospital. Signed informed consent
from all patients was obtained and all images were anonymized.
Treatment
All the patients followed the following treatment regime:
Neoadjuvant chemotherapy. Consisted in two FOLFOX cycles every two weeks. Each
cycle consisted in Oxaliplatin 85mg/m2 on day one, intravenous Leucovorin 200mg/m2 on
days one and two and intravenous 5-FU 400mg/m2 on days one and two.
Chemoradiotherapy. Two weeks after both cycles of chemotherapy, patients had five to
six weeks of chemoradiotherapy (CRT). Pelvic radiotherapy was performed at a cumulative
dose of 45–50.4 Gy (1.8 Gy daily fractions). Oral chemotherapy consisted in Tegafur at 1,200
mg/day on days one to four. Radiotherapy conformal three-dimensional plans followed the
International Commission on Radiation Units and Measurements (ICRU) specifications and
were delivered with 15 MV photon beams.
Surgery. Six weeks after CRT, resection was performed. Six senior surgeons participated.
No strict criteria for surgical procedure was present but appropriateness of the safe distal mar-
gin distances and total mesorectal excision was mandatory.
Intraoperative radiotherapy. After surgery, patients received a 10–12.5 Gy intraoperative
electron beam radiotherapy (IOERT) to the posterior pelvic cavity. Details have been already
described elsewhere [28,29].
Postoperative chemotherapy. Adjuvant chemotherapy was selected consisting in either
two FOLFOX cycles every two weeks or four to six cycles every four weeks of an intravenous
5- FU-370-425 mg/m2 and Leucovorin 20-25mg/m2/day in days one to five.
Evaluation of treatment outcome
One pathologist examined all the resected specimens after NACT, CRT and surgery and evalu-
ated the changes suffered after treatment following recommendations by Quirke et al. [30,31].
Specimens were staged according to the sixth edition of AJCC classification (ypTNM). The
response to NAT was classified according to the tumor regression grade (TRG) scale [32]:
TRG 0, no response; TRG 1, residual cancer outgrowing fibrosis; TRG 2, fibrosis outgrowing
residual cancer cells; TRG 3, presence of residual cancer cells; and TRG 4, complete histopath-
ological response. Applying this method, tumors were classified into NAT responders (TRG
3–4) or non-responders (TRG 0–2).
PET/CT image acquisition protocol
Patients underwent PET/CT imaging before any of their treatments started. All the PET stud-
ies were obtained in the Nuclear Medicine department from Clinical La Luz de Madrid using a
dedicated Philips Gemini TF model (standard bore, 70 cm) PET/CT simulator with an axial
field of view = 18 cm (reconstructed field of view: 25,6,57.6 or 67,6 cm), and spatial resolu-
tion = 4.7 mm full-width half maximum. The scanner was equipped with a high light output
PLOS ONE Tumor response prediction from PET image texture
PLOS ONE | https://doi.org/10.1371/journal.pone.0242597 November 30, 2020 3 / 18
Page 4
scintillator (LYSO) that has high sensitivity, improved energy resolution and achieves a faster
system timing resolution of approximately 600 ps, enabling better time of flight measurement.
3D PET/CT scans with 16-slice CT (slice thickness 3mm, reconstruction slice thickness
1mm and interval 1.5 mm) were acquired through the pelvis from the anal verge to the iliac
crests in all patients. CT data was not acquired using a low-dose protocol. A rectal cancer CT
scan protocol was used for volumetric analysis [33]. The contrast agent was not administered
in these CT acquisitions. There are no differences in CT acquisitions among patients.
Whole-body PET emission images were acquired 45 min after intravenous injection of 5
MBq of FDG per kilogram of body weight. After radiotracer injection, patients rested and
were orally hydrated (>0.5 L of water). Patient preparation included fasting for at least 6 h
before the scan. In the morning of the scan day, patients were given a cleansing enema. PET
data were normalized (to correct the system response) and corrected for attenuation, scatter
radiation, random coincidences, dead time and decay. PET studies were normalized with
respect to the blood glucose level measured before FDG administration [22,23]. Reconstruc-
tion was performed using weighted ordered subsets expectation maximization (2 iterations
and 16 subsets) followed by the application of a smoothing filter (0.5 Hanning) and trilinear
interpolation. The PET scans had a voxel size of 4x4x4 mm and a matrix size of 144x144x87
voxels.
PET data analysis
The processing workflow of this study is summarized in Fig 1. One experienced nuclear medi-
cine specialist, blinded to the pathological status of the patients, obtained a Volume of Interest
(VOI) by segmenting the tumor with a threshold of 40% of the maximum activity. Features
related to tumor metabolism were calculated using 3-D Slicer open-source software Version
4.0.0. Harvard University, Cambridge, (MA) [34] and the PET-indiC module (Ethan Ulrich,
University of Iowa). For verification, a second nuclear medicine specialist examined the VOIs
based on the abovementioned scale and agreed on the classification performed.
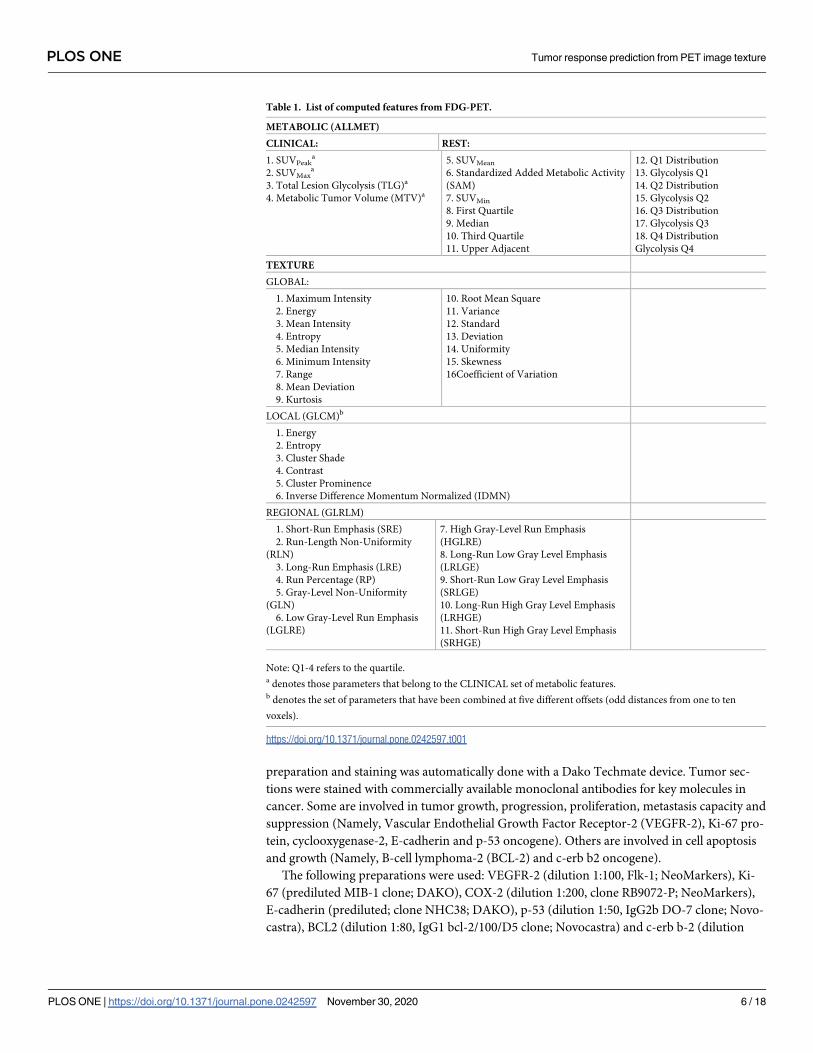
Table 1 presents the complete list of metabolic parameters measured, classified into two
sets: 1) standard clinical metabolic features (SUVMax, SUVPeak, Metabolic Tumor Volume
Fig 1. Summary of the workflow implemented for the estimation of the heterogeneity in the PET images: 1) The Volume of Interest (VOI) corresponding to the tumor
is extracted and the image quantized to 64 levels; (a) Quantitative metrics are measured: 2a. The metabolic parameters described in Table 1; 3a. The texture features–
First order, local (Gray Level Co-occurrence Matrix (GLCM)), regional (Gray Level Run Length Matrix (GLRLM)).
https://doi.org/10.1371/journal.pone.0242597.g001
PLOS ONE Tumor response prediction from PET image texture
PLOS ONE | https://doi.org/10.1371/journal.pone.0242597 November 30, 2020 4 / 18
Page 5
(MTV) and Total Lesion Glycolysis (TLG)), referred to as CLINICAL, and 2) the complete set
of metabolic variables, referred to as ALLMET. Characteristics referring to quartiles in glycoly-
sis are the lesion glycolysis calculated from the respective quarter of the grayscale range of the
tumour region.
Heterogeneity visual assessment
The same nuclear medicine specialist also classified all tumors in PET images according to two
visual scales by examining the whole tumour volume (Fig 2). The ‘heterogeneity’ visual scale
defined a zero (0) score when tumors were homogeneous in appearance or a one score (1) oth-
erwise. The ‘pattern’ visual scale assigned a zero (0) score to nodular tumors and one (1) to
multinodular or cavitated lesions. A second nuclear medicine expert examined the visual scor-
ing and both found consensus on the final classification.
Heterogeneity automatic assessment
Tumor VOIs were discretized to 64 gray levels as a way of normalizing the data, allowing inter-
patient comparison using the following equation [23]:
V xð Þ ¼ 64IðxÞ � min
i2Oi
maxi2O
i � mini2O
iþ 1
where V is the intensity of the resampled image, I represents the intensity of the original image
and O is the set of voxels inside the VOI. The range of 64 gray values has been previously iden-
tified as a tradeoff between noise removal and information loss [23]. Different image texture
definitions were used to obtain the heterogeneity automatic analysis (Table 1). The complete
set of automatic texture descriptors will be referred to as TEXTURE parameters.
In a first step, global texture features were extracted. They consist on a set of first and higher
order statistics extracted from the gray-level histogram allowing the quantification of overall
global changes in intensity within the VOI.
Secondly, intensity variations were studied with second-order or local texture features by
using the gray level co-occurrence matrix (GLCM) [35]. Six statistics explaining local intensity
variations were selected from the 21 originally described [35], based on previous literature to
define the smallest set of GLCM features able to capture texture information [35–38]. To cap-
ture changes in local intensity beyond direct neighbors and reduce noise in the measurements
[38,39], these features were calculated in a patch-wise manner using square kernels of different
sizes, selected after examining the images and estimating the distance between voxels that
characterized the texture pattern: 1,3,5,7 and 9 pixels.
Finally, intensity changes were studied using third-order or regional texture features using
the Gray Level Run Length Matrix. Ten different statistics capturing regional texture measures
were obtained from this matrix.
All texture features were calculated for the whole tumour volume. The first-order and
third-order texture features were calculated using the Heterogeneity-CAD module (Narayan,
V. et al, Harvard Medical School), from 3D Slicer [40,41]. We used in-house developed soft-
ware to obtain GLCM texture metrics with respect to tumor volume, according to previous
guidelines [35]. The Python software is available upon request.
Immunohistochemistry staining and evaluation
A representative biopsy sample from each of the 37 patients was obtained for immunohis-
tochemistry (IHC) procedures previous to the start of treatment. The standardization,
PLOS ONE Tumor response prediction from PET image texture
PLOS ONE | https://doi.org/10.1371/journal.pone.0242597 November 30, 2020 5 / 18
Page 6
preparation and staining was automatically done with a Dako Techmate device. Tumor sec-
tions were stained with commercially available monoclonal antibodies for key molecules in
cancer. Some are involved in tumor growth, progression, proliferation, metastasis capacity and
suppression (Namely, Vascular Endothelial Growth Factor Receptor-2 (VEGFR-2), Ki-67 pro-
tein, cyclooxygenase-2, E-cadherin and p-53 oncogene). Others are involved in cell apoptosis
and growth (Namely, B-cell lymphoma-2 (BCL-2) and c-erb b2 oncogene).
The following preparations were used: VEGFR-2 (dilution 1:100, Flk-1; NeoMarkers), Ki-
67 (prediluted MIB-1 clone; DAKO), COX-2 (dilution 1:200, clone RB9072-P; NeoMarkers),
E-cadherin (prediluted; clone NHC38; DAKO), p-53 (dilution 1:50, IgG2b DO-7 clone; Novo-
castra), BCL2 (dilution 1:80, IgG1 bcl-2/100/D5 clone; Novocastra) and c-erb b-2 (dilution
Table 1. List of computed features from FDG-PET.
METABOLIC (ALLMET)
CLINICAL: REST:
1. SUVPeaka
2. SUVMaxa
3. Total Lesion Glycolysis (TLG)a
4. Metabolic Tumor Volume (MTV)a
5. SUVMean
6. Standardized Added Metabolic Activity
(SAM)
7. SUVMin
8. First Quartile
9. Median
10. Third Quartile
11. Upper Adjacent
12. Q1 Distribution
13. Glycolysis Q1
14. Q2 Distribution
15. Glycolysis Q2
16. Q3 Distribution
17. Glycolysis Q3
18. Q4 Distribution
Glycolysis Q4
TEXTURE
GLOBAL:
1. Maximum Intensity
2. Energy
3. Mean Intensity
4. Entropy
5. Median Intensity
6. Minimum Intensity
7. Range
8. Mean Deviation
9. Kurtosis
10. Root Mean Square
11. Variance
12. Standard
13. Deviation
14. Uniformity
15. Skewness
16Coefficient of Variation
LOCAL (GLCM)b
1. Energy
2. Entropy
3. Cluster Shade
4. Contrast
5. Cluster Prominence
6. Inverse Difference Momentum Normalized (IDMN)
REGIONAL (GLRLM)
1. Short-Run Emphasis (SRE)
2. Run-Length Non-Uniformity
(RLN)
3. Long-Run Emphasis (LRE)
4. Run Percentage (RP)
5. Gray-Level Non-Uniformity
(GLN)
6. Low Gray-Level Run Emphasis
(LGLRE)
7. High Gray-Level Run Emphasis
(HGLRE)
8. Long-Run Low Gray Level Emphasis
(LRLGE)
9. Short-Run Low Gray Level Emphasis
(SRLGE)
10. Long-Run High Gray Level Emphasis
(LRHGE)
11. Short-Run High Gray Level Emphasis
(SRHGE)
Note: Q1-4 refers to the quartile.a denotes those parameters that belong to the CLINICAL set of metabolic features.b denotes the set of parameters that have been combined at five different offsets (odd distances from one to ten
voxels).
https://doi.org/10.1371/journal.pone.0242597.t001
PLOS ONE Tumor response prediction from PET image texture
PLOS ONE | https://doi.org/10.1371/journal.pone.0242597 November 30, 2020 6 / 18
Page 7
PLOS ONE Tumor response prediction from PET image texture
PLOS ONE | https://doi.org/10.1371/journal.pone.0242597 November 30, 2020 7 / 18
Page 8
1:40, IgG1 Clon 10A7; Novocastra). Slides were then evaluated in a light microscope at four
representative areas at x20 and x40 magnification. Positive and negative controls were pro-
vided respectively by normal tissue and omission of antibody. The level expression of each
marker in each patients’ sample was assessed by two pathologists in a quantitative percentage
from 0 to 100 based on IHC staining presence and intensity. They were blinded to patients’
characteristics and to the rest of IHC biomarkers. Staining was re-evaluated later and the
results were reproducible. The staining expression level was used for later comparison with
radiomic features.
Statistical analysis
Quantitative comparisons between responders and non-responders were carried out using the
Mann-Whitney’s U test for continuous variables and χ2 test for discrete variables.
Correlation between features used for modelling is presented in S1 Fig. Stepwise multivari-
ate binary logistic regression (Forward Wald’s, p< 0,05 for feature inclusion) was used to
assess the predictive ability of parameters extracted from pretreatment 18F-FDG PET regard-
ing patient´s response to NAT. To better validate and avoid over-fitting, multivariate binary
logistic models were evaluated using a k-fold cross-validation (k = 5) where 80% of the dataset
was used as training data and the remaining 20% was used as validation set. Mean accuracy
and mean area under the ROC curve (AUC) from all the runs were used to assess the accuracy
in the prediction of response, and 95% confidence intervals are reported in both cases.
The relationship between PET quantitative parameters and IHC biomarkers was assessed
by means of Pearson correlation coefficient.
For evaluating the correlation between visual scales and automatically computed texture
metrics, principal components were extracted from the automatically computed features for
each patient scan. Contribution of each individual feature into the principal components can
be found in S2 Fig. Principal components with eigenvalue greater than one were used. The cor-
relation of the principal components with the visual scale was evaluated with the Spearman
non-parametric correlation test.
Results
Baseline patient and tumour characteristics
No significant differences were found between treatment responders and non-responders in
terms of clinical (age, gender, time between first PET scan and first NACT session, distance to
anal verge and clinical staging risk group) and IHC characteristics (Table 2). Additionally, Fig
3 presents the most representative slice of each patient–selected to be the one containing SUV-
max of the resampled scans used for the analysis.
Visual scales for tumor response assessment
The comparison between responders and non-responders in the visual heterogeneity and pat-
tern scales (Table 3) yielded statistically significant differences between groups (χ2 = 11.926,
p = 0.003 in the case of visual heterogeneity and χ2 = 7,423, p = 0.013 in the case of visual pat-
tern, degrees of freedom (dof) were 35 in both cases). The ‘heterogeneity’ visual scale is a
Fig 2. Major axial plane of the extracted VOI from four of the tumors analyzed with VOI boundaries shown in yellow.
(a) and (c) show an example of homogeneous tumors with zero score in the visual heterogeneity scale; (b) and (d)
show an example of heterogeneous tumors with score one in the visual heterogeneity scale. (e) and (g) show an
example of tumors with zero score in the visual pattern scale; (f) and (h) show an example of tumors with score one in
the visual pattern scale.
https://doi.org/10.1371/journal.pone.0242597.g002
PLOS ONE Tumor response prediction from PET image texture
PLOS ONE | https://doi.org/10.1371/journal.pone.0242597 November 30, 2020 8 / 18
Page 9
dichotomic value that classifies the tumors in terms of their visual homogeneity in appearance.
The ‘pattern’ visual scale classifies between nodular tumors and multinodular or cavitated
lesions. They were correlated with r = 0.75 and p = 0.0012 (dof = 35).
Accordingly, prognostic ability of the visual heterogeneity and pattern scales were statisti-
cally significant in the univariate binary logistic regression (p = 0.003 and p = 0.015, respec-
tively). After cross validation, accuracy of prediction was 75,437±0,881% with an AUC of
0,759±0,009 for the visual heterogeneity scale and 69,268±0,890% with an AUC of 0,691±0,008
for the visual pattern scale.
When building a multivariate model to predict response including both visual scales, only
visual heterogeneity remained statistically significant (p = 0.003). Furthermore, when the
Table 2. Comparison of the baseline clinical and immunohistochemistry (IHC) characteristics of the patients. The p-value corresponds to the χ2 test for gender and
clinical staging risk group (degrees of freedom are 35 in both cases) and to the Mann-Whitney U test in the rest of variables.
Variable All patients
(n = 37)
Responders
(n = 18)
Non-responders
(n = 19)
p—
value
Clinical Gender, n (%)
Male 26 (70.27%) 13 (72.22%) 13 (68.42%) 0.91
Female 11 (29.73%) 5 (27.78%) 6 (31.58%)
Age (years), mean (standard deviation) 61.76 (8.65) 64.28 (7.63) 59.37(9.08) 0.07
Time between scan and first NACT session (days), mean
(standard deviation)
156.00 (40.67) 164.78 (45.96) 147.68(34.11) 0.13
Distance to anal verge (cm), mean (standard deviation) 7.41 (3.29) 8.27 (3.95) 6.58(2.32) 0.12
Clinical staging risk group, n (%)
Intermediate: T2 N1 or T3 N0 8 (21.62%) 5 (27,78%) 3 (15.79%) 0.66
Moderately high: T3 N1, T4 N0 27 (72.97%) 12 (66.67%) 15 (78.95%)
High: T3 N2, T4 N1/2 2 (5.41%) 1 (5.56%) 1 (5.26%)
IHC stains from diagnostic
biopsy
Ki67, mean (standard deviation) 77.97 (17.62) 79.72 (16.13) 76.32 (19.21) 0.32
p53, mean (standard deviation) 58.84 (40.97) 52.50 (40.59) 64.84(41.51) 0.15
VEGFR, mean (standard deviation) 83.78 (13.44) 86.11 (28.73) 81.58(38.04) 0.43
COX-2, mean (standard deviation) 58.78 (38.82) 51.94 (38.16) 65.26 (39.35) 0.12
BCL—2, mean (standard deviation) 1.21 (6.60) 2.22 (9.43) 0.26 (1.15) 0.49
CERB– 2, mean (standard deviation) 12.30 (26.60) 17.5 (35.82) 7.37 (12.29) 0.43
E-cadherine, mean (standard deviation) 90.27 (13.64) 90.56 (14.34) 90.0(13.33) 0.41
https://doi.org/10.1371/journal.pone.0242597.t002
Fig 3. Comparison of the most representative slide for each patient from the resampled scans used for the
heterogeneity analysis. Each slide was selected to contain the SUVmax in the tumour VOI of each patient. Non-
responders and responders are located in the left and right sides while the vertical order is given by decreasing uptake–
selected to be descending SUVmean.
https://doi.org/10.1371/journal.pone.0242597.g003
PLOS ONE Tumor response prediction from PET image texture
PLOS ONE | https://doi.org/10.1371/journal.pone.0242597 November 30, 2020 9 / 18
Page 10
logistic regression model included together the heterogeneity visual scale and clinical meta-
bolic features (CLINICAL), only the visual heterogeneity remained statistically significant
(p = 0.003).
Tumor response prediction using quantitative texture features
Responders and non-responders showed statistically significant differences for several meta-
bolic and texture features (Table 2).
Afterwards, we used multivariate binary logistic regression to study the response predictive
ability of the metabolic and quantitative texture features. Multivariate binary logistic regres-
sion models were fed with the statistically significant factors that appeared for each set of vari-
ables (CLINICAL, ALLMET, TEXTURE, ALLMET-TEXTURE). Their corresponding ROC
curves are shown in Fig 4.
When fitting a model with the set of four metabolic features with reported prognosis capac-
ity in previous literature (CLINICAL), only Total Lesion Glycolysis (TLG) resulted statistically
significant (p = 0.0488). After cross validation, the model obtained an accurate prediction in
50,149±0,293% of the cohort, with an AUC of 0,685±0,010.
When using the whole set of 19 metabolic variables (ALLMET), TLG was no longer
significant, while Glycolysis Q1 (p = 0,046) remained significant. The results with this
Table 3. Comparison of the visual scoring system and PET parameters in responders and non-responders together with the χ2 test results and Mann-Whitney U
test results respectively.
Non-Responders Responders p- value (χ2)
Heterogeneity Homogeneous (0) 5 14 0,003�
Heterogeneous (1) 14 4
Visual Pattern Nodular (0) 2 9 0,013�
Multinodular or
cavitating(1)
17 9
Non- Responders Responders p- value (Mann-
Whitney U)Median Minimum Maximum Median Minimum Maximum
Metabolic SAM 112,554 44,545 367,764 77,916 13,093 270,784 0,049�
TLG 112,554 44,545 367,764 77,916 13,093 270,784 0,049�
Glycolysis Q1 42,948 11,036 164,781 27,009 5,426 96,47 0,042�
Glycolysis Q2 38,388 9,487 127,259 24,796 3,883 120,262 0,061
Q1 Distribution 45,337 21,594 62,6 44,929 36,301 57,692 0,641
Texture Global COV 0,227 0,203 0,356 0,245 0,2 0,534 0,013�
Local
(GLCM)
Distance one
voxel
IDMN 0,459 0,328 0,582 0,4 0,309 0,59 0,039�
Contrast 222,422 102,549 498,948 295,176 90,339 563,788 0,046�
Distance three
voxels
Energy 0,012 0,002 0,138 0,025 0,007 0,222 0,408
Distance five
voxels
Energy 0,111 0,006 0,262 0,048 0 0,175 0,036�
Distance seven
voxels
IDMN 0,179 0 0,525 0,116 0 0,172 0,035�
Distance nine
voxels
Cluster Shade 52,12 0 399,925 0,002 -38,334 323,58 0,050�
Energy 0,012 0 0,171 0,015 0 0,108 0,766
Only those variables that remained significant (p-values marked with �) either here or in further analysis are shown. Note: SAM stands for Standardized Added
Metabolic Activity, Q1 and Q2 refer to the first and second quartiles respectively, COV stands for Coefficient of Variation and IDMN stands for Inverse Difference
Moment Normalize.
https://doi.org/10.1371/journal.pone.0242597.t003
PLOS ONE Tumor response prediction from PET image texture
PLOS ONE | https://doi.org/10.1371/journal.pone.0242597 November 30, 2020 10 / 18
Page 11
model after cross-validation yielded an accuracy of 63,586±0,986% with an AUC of 0,694
±0,011.
When entering the 57 automatic texture features (TEXTURE), GLCM Energy at distances
of three (p = 0,035), five (p = 0, 01) and nine voxels (p = 0,004) together with IDMN at distance
seven voxels (p = 0,023) were significant. When cross-validation was performed in this model,
an accuracy of 73,051±0,922% with an AUC of 0,815±0,009 were obtained.
When combining metabolic (ALLMET) and texture (TEXTURE) features, Glycolysis Q1
(p = 0,041 and GLCM Energy at distances of five (p = 0,037) were detected as statistically sig-
nificant. The results after cross-validation showed an accuracy of 70,154±0,883% with an AUC
of 0,768±0, 01. The correlation of radiomic features is presented in S1 Fig.
Correlation of quantitative PET parameters with biomarkers expression
To study the biological meaning of the PET quantitative parameters that remained significant
in the tumor response prediction models above (TLG, Glycolysis Q1, GLCM Energy at dis-
tances of three, five and nine voxels and GLCM IDMN at distance of seven voxels), their
Fig 4. Comparison of the ROC curves using the different sets of features proposed to predict tumor response.
https://doi.org/10.1371/journal.pone.0242597.g004
PLOS ONE Tumor response prediction from PET image texture
PLOS ONE | https://doi.org/10.1371/journal.pone.0242597 November 30, 2020 11 / 18
Page 12
correlation with VEGFR-2, Ki-67, COX-2, E-cadherin, p-53, BCL-2, c-erb b-2 was studied
using Pearson correlation.
VEGFR-2 significantly correlated with GLCM Energy at distance three voxels (r = -0,398,
p = 0,016) and with IDMN at distance seven voxels (r = -0,374, p = 0,025). COX-2 significantly
correlated with Glycolysis Q1 (r = -0,366, p = 0,024). E- cadherin significantly correlated with
GLCM Energy at distance three voxels (r = 0,382, p = 0,02). Ki-67 significantly correlated with
TLG (r = -0,337, p = 0,041) and Glycolysis Q1 (r = -0,366, p = 0,026). The degrees of freedom
are 35 for all the correlation tests above.
Correlation of visual and quantitative heterogeneity measurements
To study the relationship between the visual scales proposed and automatic texture, principal
components were extracted from TEXTURE database. Ten principal components were
obtained with a cumulative variance explained of 90,938%.The absolute value of the contribu-
tion of each radiomic feature to each principal component is presented in S2 Fig.
A Spearman correlation matrix was computed including the first five principal components
that explained 74,099% of the cumulative variance and both visual scales. The first principal
component (explained variance of 33,281%) correlated significantly with visual heterogeneity
(r = 0.430, p = 0.048, dof = 35) and visual pattern (r = 0.499, p = 0.02, dof = 35). The rest of the
principal components were not significantly correlated with any of the visual scales.
Discussion
This study shows that tumor heterogeneity in 18F-FDG PET images can discriminate between his-
topathological responders and non-responders. This information can be of great interest when
selecting the best approach for managing colorectal cancer patients as the treatment can be tailored
accordingly. The correct identification of non-responders allows their NAT to be intensified. Also,
the response prediction could guide optimization of the surgical approach by using less-aggressive
alternatives, and even mild postoperative chemotherapy could be prescribed in these cases.
Predictive capacity of metabolic (SUV related) features
Uptake parameters from PET defining the tumor metabolism (SUV, MTV, and TLG) are the only
features used clinically to evaluate the tumor aggressiveness and therapy effectiveness. The predic-
tion capacity of these clinical parameters (CLINICAL) was analyzed to establish the reference level
achieved. This reference was later compared to the prediction achieved with the new variables in
order to address the relevance of texture parameters. Since results obtained for CLINICAL variables
showed poor ability to predict response to NAT, additional parameters related to tumor uptake
(ALLMET) were introduced, but only one variable (Glycolysis Q1) remained significant in the mul-
tivariate analysis. As shown in Table 2 and Fig 3, only patient information and PET uptake parame-
ters show a poor ability to discriminate between responders and non-responders in this cohort.
Predictive capacity of texture features
Quantitative heterogeneity features (TEXTURE) seemed to outperform accuracy of metabolic
descriptors (AUC of 0,815 and 0,694, respectively). It can be noted that the ability to predict the
response is increased as compared with the reference parameters (CLINICAL). When texture is
combined with metabolic features (ALLMET-TEXTURE), the AUC reaches 0,768. Given the con-
fidence intervals obtained, the difference of prediction accuracy between using texture alone or
combined with metabolic parameters is not significant. These results suggest that the use of texture
features may be a promising approach to predict tumor response to NAT.
PLOS ONE Tumor response prediction from PET image texture
PLOS ONE | https://doi.org/10.1371/journal.pone.0242597 November 30, 2020 12 / 18
Page 13
In the multivariate analysis, several local texture parameters–i.e., study of PET intensity dif-
ferences in different neighborhoods capturing changes in uptake values of different localities
of the tumour—showed significant association with tumor response. The parameters that were
significantly associated with response in our model are consistent with others reported previ-
ously [27], although there is a high variability in the results obtained with local texture. Soussan
et al. [21] and Tixier et al. [23] reported how GLCM features could predict tumor response to
treatment in breast and esophageal cancer. Conversely, Lemarignier et al. [42] and Nakajo
et al. [24] observed no relationship in the same types of cancer. This discrepancy can be due to
a GLCM analysis [21,23,24,43] performed at only one-voxel distance, which is a parameter
dominated by noise rather than by real intensity differences in this type of images [41,42]. In
our work, the use of different distances chosen based on visual differences in intensities,
GLCM characteristics showed higher ability to predict tumor response.
No significance was found neither in with global texture metrics (i.e gray-level histogram
statistics capturing intensity changes across the whole lesion assuming tumour heterogeneity
is well-mixed) nor with regional texture descriptors (i.e. Gray Level Run Length Matrix) in the
multivariate analysis. These parameters have been reported to be associated with response and
long-term outcome in several types of cancer. Tixier et al. [23] and Nakajo et al [24] concluded
that regional texture descriptors showed better prognostic capacity in esophageal cancer than
SUV parameters. Bundschuh et al. [26] reported that global texture features could assess
response for patients with LARC.
Biological interpretation of the quantitative texture descriptors
One of the major concerns in radiomics resides in the biological meaning of the parameters
used, as the physiological processes underlying texture analysis remain unclear [44]. In this
line, we decided to study the correlation between quantitative features significant for response
prediction and several key molecules in cancer.
It was shown how the texture features that are able to predict tumor response are signifi-
cantly correlated with VEGFR and E-Cadherin. VEGFR expression has always been related
with angiogenesis and vascular permeability, which are processes characteristic of more
aggressive tumors [45]. Thus, this correlation seems to be coherent as new forming blood ves-
sels create local spots and increase heterogeneity of PET images which can be captured by
computer-vision quantitative textural features. Moreover, E-cadherin is associated with inva-
sion and metastasis due to the detaching of cancerous cells from the epithelial lining [46]. The
association of texture parameters with e-cadherin reinforces the relationship of local heteroge-
neity in PET with processes in the tumor vessels that may negatively impact tumor prognosis.
Regarding the relationship between because of the glucose metabolic basis of PET imaging,
it is not surprising to find that metabolic features correlate with biomarkers related with tumor
proliferation (Ki-67) [47] and growth (COX-2) [48]. Nevertheless, it is remarkable that in our
series TLG, one of the widely clinically used metabolic parameters, is outperformed by Glycol-
ysis Q1 both in prediction and in the relation with proliferation biomarkers. Glycolysis Q1
refers to the glycolysis calculated on the lower quartile of intensity values. Therefore this might
suggest that regions with lower activity concentration–therefore higher Q1 –are related with
tumours with lower proliferation rates.
Visual scores: Easy approach to clinical applicability of the findings
To our knowledge, one of the obstacles to use radiomic features clinically is the complicated
relationship with visual appearance of tumors. Thus, we proposed and evaluated a visual classi-
fication of heterogeneity to bridge this gap.
PLOS ONE Tumor response prediction from PET image texture
PLOS ONE | https://doi.org/10.1371/journal.pone.0242597 November 30, 2020 13 / 18
Page 14
Visual heterogeneity and pattern category showed significant association with response to
treatment. When both visual scores were introduced, heterogeneity remained significant
whereas pattern category did not. Visual scores were then combined with baseline metabolic
parameters (CLINICAL). In this case, only heterogeneity scale remained significant in the
multivariate model, further supporting the importance of heterogeneity for clinical stratifica-
tion [19,23,49].
The correlation between the visual scores and quantitative metrics suggests that they are
describing similar characteristics. This may aid in the usage of texture features in the clinical
procedures as the mathematical texture descriptors can be better understood through their
association with the visual score. Besides, this reinforces the necessity of introducing heteroge-
neity in the medical guidelines for cancer staging as it has clinical significance when evaluating
a treatment. Indeed, some PET-derived metrics are already used in the classification and early
response assessment of diseases such as lymphomas [50] and trends in PET-imaging feature
extraction suggest other types of cancer may also benefit from them [51,52].
We acknowledge several limitations of the study. First, this is a retrospective study with a
relatively small sample size without holdout test set available when training the prediction of
response. 5-fold cross validation was used to report the findings as a way to reduce biases so
our findings suggest significant association between PET parameters and treatment response
in LARC but they need to be validated in larger cohorts before claiming any robust prognostic
ability. Additionally, the reproducibility of the PET feature findings may depend on the scan-
ner and software. Future guidelines for standardizing procedures remain to be established in
the future [23]. Finally, the conclusions can only be applied to patients with LARC, so replica-
tion of the study in other pathologies is warranted.
Conclusion
In this paper, heterogeneity in PET images is shown to be of clinical relevance for the predic-
tion of response to NAT in LARC patients and to have a significant association with key
molecular biomarkers in cancer. The main results of this study show how a visual classification
of heterogeneity and a further automatic assessment of heterogeneity using texture analysis
could become an essential element in research or practical oncology procedures.
Prospective studies are needed to validate the inclusion of these heterogeneity-based met-
rics as a robust component of the multi-disciplinary approach for the prediction and model-
ling of response in rectal cancer. This could enable the development of tailored therapies that
improve patient´s outcome.
Supporting information
S1 Fig. Correlation matrix of the radiomic features used for training the response predic-
tion model.
(TIF)
S2 Fig. Absolute value of the weights of the radiomic features describing their contribution
in the principal components.
(JPG)
Author Contributions
Conceptualization: Paula Martin-Gonzalez, Estibaliz Gomez de Mariscal, M. Elena Martino,
Felipe A. Calvo, Manuel Desco, Arrate Muñoz-Barrutia.
PLOS ONE Tumor response prediction from PET image texture
PLOS ONE | https://doi.org/10.1371/journal.pone.0242597 November 30, 2020 14 / 18
Page 15
Data curation: M. Elena Martino, Isabel Peligros, Jose Luis Carreras, Felipe A. Calvo, Manuel
Desco, Arrate Muñoz-Barrutia.
Formal analysis: Paula Martin-Gonzalez, Estibaliz Gomez de Mariscal, Pedro M. Gordaliza,
Javier Pascau, Manuel Desco, Arrate Muñoz-Barrutia.
Funding acquisition: Arrate Muñoz-Barrutia.
Investigation: Arrate Muñoz-Barrutia.
Methodology: Paula Martin-Gonzalez, Estibaliz Gomez de Mariscal, Pedro M. Gordaliza,
Javier Pascau.
Resources: Javier Pascau, Manuel Desco, Arrate Muñoz-Barrutia.
Supervision: Pedro M. Gordaliza, Manuel Desco, Arrate Muñoz-Barrutia.
Validation: Arrate Muñoz-Barrutia.
Visualization: Manuel Desco, Arrate Muñoz-Barrutia.
Writing – original draft: Paula Martin-Gonzalez, Javier Pascau, Manuel Desco, Arrate
Muñoz-Barrutia.
Writing – review & editing: Paula Martin-Gonzalez, Javier Pascau, Manuel Desco, Arrate
Muñoz-Barrutia.
References
1. Heald RI. Ryall RD. Recurrence and survival after total mesorectal excision for rectal cancer. Lancet.
1986, 1:1479–1482. https://doi.org/10.1016/s0140-6736(86)91510-2 PMID: 2425199
2. Smith N, Brown G. Preoperative staging of rectal cancer. Acta Oncol. 2008; 47(1):20–31. https://doi.
org/10.1080/02841860701697720 PMID: 17957502
3. Nagtegaal ID, Van Krieken J. The role of pathologists in the quality control of diagnosis and treatment of
rectal cancer—an overview. Eur J Cancer. 2002; 38(7):964–972. https://doi.org/10.1016/s0959-8049
(02)00056-4 PMID: 11978521
4. Bosset J-F, Collette L, Calais G, et al. Chemotherapy with preoperative radiotherapy in rectal cancer. N
Engl J Med. 2006; 355(11):1114–1123. https://doi.org/10.1056/NEJMoa060829 PMID: 16971718
5. van Gijn W, Marijnen CAM, Nagtegaal ID, et al. Preoperative radiotherapy combined with total mesorec-
tal excision for resectable rectal cancer: 12-year follow-up of the multicentre, randomised controlled
TME trial. Lancet Oncol. 2011; 12(6):575–582. https://doi.org/10.1016/S1470-2045(11)70097-3 PMID:
21596621
6. Bujko K, Nowacki MP, Nasierowska-Guttmejer A, et al. Sphincter preservation following preoperative
radiotherapy for rectal cancer: report of a randomised trial comparing short-term radiotherapy vs. con-
ventionally fractionated radiochemotherapy. Radiother Oncol. 2004; 72(1):15–24. https://doi.org/10.
1016/j.radonc.2003.12.006 PMID: 15236870
7. Blomqvist L, Glimelius B. The “good”, the “bad”, and the “ugly”rectal cancers. Acta Oncol. 2008; 47:5–
8. https://doi.org/10.1080/02841860701802585 PMID: 18097776
8. Shields AF. Positron emission tomography measurement of tumor metabolism and growth: its expand-
ing role in oncology. Mol imaging Biol. 2006; 8(3):141–150. https://doi.org/10.1007/s11307-006-0039-2
PMID: 16534552
9. Ichiya Y, Kuwabara Y, Otsuka M, et al. Assessment of response to cancer therapy using fluorine-18-
fluorodeoxyglucose and positron emission tomography. J Nucl Med Off Publ Soc Nucl Med. 1991; 32
(9):1655–1660. PMID: 1880564
10. Capirci C, Rampin L, Erba PA, et al. Sequential FDG-PET/CT reliably predicts response of locally
advanced rectal cancer to neo-adjuvant chemo-radiation therapy. Eur J Nucl Med Mol Imaging. 2007;
34(10):1583–1593. https://doi.org/10.1007/s00259-007-0426-1 PMID: 17503039
11. Vliegen RFA, Beets-Tan RG, Vanhauten B, et al. Can an FDG-PET/CT predict tumor clearance of the
mesorectal fascia after preoperative chemoradiation of locally advanced rectal cancer? Strahlenthera-
pie und Onkol. 2008; 184(9):457–464. https://doi.org/10.1007/s00066-008-1858-7 PMID: 19016024
PLOS ONE Tumor response prediction from PET image texture
PLOS ONE | https://doi.org/10.1371/journal.pone.0242597 November 30, 2020 15 / 18
Page 16
12. Janssen MHM, Ollers MC, van Stiphout RGPM, et al. PET-based treatment response evaluation in rec-
tal cancer: prediction and validation. Int J Radiat Oncol Biol Phys. 2012; 82(2):871–876. https://doi.org/
10.1016/j.ijrobp.2010.11.038 PMID: 21377810
13. Capirci C, Rubello D, Chierichetti F, et al. Long-term prognostic value of 18F-FDG PET in patients with
locally advanced rectal cancer previously treated with neoadjuvant radiochemotherapy. Am J Roent-
genol. 2006; 187(2):W202–W208. https://doi.org/10.2214/AJR.05.0902 PMID: 16861513
14. Kalff V, Duong C, Drummond EG, Matthews JP, Hicks RJ. Findings on 18F-FDG PET scans after
neoadjuvant chemoradiation provides prognostic stratification in patients with locally advanced rectal
carcinoma subsequently treated by radical surgery. J Nucl Med. 2006; 47(1):14–22. PMID: 16391182
15. Calvo FA, Domper M, Matute R, et al. 18 F-FDG positron emission tomography staging and restaging in
rectal cancer treated with preoperative chemoradiation. Int J Radiat Oncol Biol Phys. 2004; 58(2):528–
535. https://doi.org/10.1016/j.ijrobp.2003.09.058 PMID: 14751524
16. Altini C, Niccoli Asabella A, De Luca R, et al. Comparison of 18F-FDG PET/CT methods of analysis for
predicting response to neoadjuvant chemoradiation therapy in patients with locally advanced low rectal
cancer. Abdom Imaging. 2015; 40(5):1190–1202. https://doi.org/10.1007/s00261-014-0277-8 PMID:
25348731
17. Choi E-S, Ha S-G, Kim H-S, Ha JH, Paeng JC, Han I. Total lesion glycolysis by 18F-FDG PET/CT is a
reliable predictor of prognosis in soft-tissue sarcoma. Eur J Nucl Med Mol Imaging. 2013; 40(12):1836–
1842. https://doi.org/10.1007/s00259-013-2511-y PMID: 23880967
18. Muralidharan V, Kwok M, Lee ST, Lau L, Scott AM, Christophi C. Prognostic Ability of 18F-FDG PET/
CT in the Assessment of Colorectal Liver Metastases. J Nucl Med. 2012; 53(9):1345–1351. https://doi.
org/10.2967/jnumed.112.102749 PMID: 22797376
19. Rutman A. M. and Kuo M. D., “Radiogenomics: Creating a link between molecular diagnostics and diag-
nostic imaging,” Eur. J. Radiol., vol. 70, no. 2, pp. 232–241, May 2009. https://doi.org/10.1016/j.ejrad.
2009.01.050 PMID: 19303233
20. Afshar P., Mohammadi A., Plataniotis K. N., Oikonomou A., and Benali H., “From handcrafted to deep-
learning-based cancer radiomics: Challenges and opportunities,” IEEE Signal Process. Mag., vol. 36,
no. 4, pp. 132–160, Jul. 2019.
21. Soussan M, Orlhac F, Boubaya M, et al. Relationship between Tumor Heterogeneity Measured on
FDG-PET/CT and Pathological Prognostic Factors in Invasive Breast Cancer. Singh PK, ed. PLoS
One. 2014; 9(4):e94017. https://doi.org/10.1371/journal.pone.0094017 PMID: 24722644
22. Xiong, Yu W., Ma J, Ren Y, Fu X., and Zhao J., “The Role of PET-Based Radiomic Features in Predict-
ing Local Control of Esophageal Cancer Treated with Concurrent Chemoradiotherapy,” Sci. Rep., vol.
8, no. 1, Dec. 2018. https://doi.org/10.1038/s41598-018-28243-x PMID: 29967326
23. Tixier F, Le Rest CC, Hatt M, et al. Intratumor Heterogeneity Characterized by Textural Features on
Baseline 18F-FDG PET Images Predicts Response to Concomitant Radiochemotherapy in Esophageal
Cancer. J Nucl Med. 2011; 52(3):369–378. https://doi.org/10.2967/jnumed.110.082404 PMID:
21321270
24. Nakajo M, Jinguji M, Nakabeppu Y, et al. Texture analysis of 18F-FDG PET/CT to predict tumour
response and prognosis of patients with esophageal cancer treated by chemoradiotherapy. Eur J Nucl
Med Mol Imaging. 2017; 44(2):206–214. https://doi.org/10.1007/s00259-016-3506-2 PMID: 27613542
25. Brown P. J. et al., “Prediction of outcome in anal squamous cell carcinoma using radiomic feature analy-
sis of pre-treatment FDG PET-CT,” Eur. J. Nucl. Med. Mol. Imaging, 2019. https://doi.org/10.1007/
s00259-019-04495-1 PMID: 31482428
26. Hatt M, Tixier F, Pierce L, Kinahan PE, Le Rest CC, Visvikis D. Characterization of PET/CT images
using texture analysis: the past, the present any future? Eur J Nucl Med Mol Imaging.2017; 44(1):151–
165. https://doi.org/10.1007/s00259-016-3427-0 PMID: 27271051
27. Calvo FA, Serrano FJ, Diaz-Gonzalez JA, et al. Improved incidence of pT0 downstaged surgical speci-
mens in locally advanced rectal cancer (LARC) treated with induction oxaliplatin plus 5-fluorouracil and
preoperative chemoradiation. Ann Oncol. 2006; 17(7):1103–1110. https://doi.org/10.1093/annonc/
mdl085 PMID: 16670204
28. Sole CV, Calvo FA, Alvarez E, Carreras JL. Metabolic and molecular relative percentage coreduction in
patients with locally advanced rectal cancer treated with neoadjuvant therapy. Eur J Nucl Med Mol
Imaging. 2016; 43(8):1444–1452. https://doi.org/10.1007/s00259-016-3313-9 PMID: 26883667
29. Calvo FA, Gomez-Espı M, Dıaz-Gonzalez JA, et al. Intraoperative presacral electron boost following
preoperative chemoradiation in T 3–4 N x rectal cancer: initial local effects and clinical outcome analy-
sis. Radiother Oncol. 2002; 62(2):201–206. https://doi.org/10.1016/s0167-8140(01)00477-7 PMID:
11937247
PLOS ONE Tumor response prediction from PET image texture
PLOS ONE | https://doi.org/10.1371/journal.pone.0242597 November 30, 2020 16 / 18
Page 17
30. Quirke P, Dixon MF, Durdey P, Williams NS. Local recurrence of rectal adenocarcinoma due to inade-
quate surgical resection: histopathological study of lateral tumor spread and surgical excision. Lancet.
1986; 328(8514):996–999.
31. Rodel C, Martus P, Papadoupolos T, et al. Prognostic Significance of Tumor Regression After Preoper-
ative Chemoradiotherapy for Rectal Cancer. J Clin Oncol. 2005; 23(34):8688–8696. https://doi.org/10.
1200/JCO.2005.02.1329 PMID: 16246976
32. Vecchio FM, Valentini V, Minsky BD, et al. The relationship of pathologic tumor regression grade (TRG)
and outcomes after preoperative therapy in rectal cancer. Int J Radiat Oncol Biol Phys. 2005; 62
(3):752–760. https://doi.org/10.1016/j.ijrobp.2004.11.017 PMID: 15936556
33. Calvo FA, Serrano FJ, Diaz-Gonza Lez JA, et al. Improved incidence of pT 0 downstaged surgical spec-
imens in locally advanced rectal cancer (LARC) treated with induction oxaliplatin plus 5-fluorouracil and
preoperative chemoradiation. Ann Oncol. 2006; 17:1103–1110. https://doi.org/10.1093/annonc/mdl085
PMID: 16670204
34. Fedorov A, Beichel R, Kalpathy-Cramer J, et al. 3D Slicer as an Image Computing Platform for the
Quantitative Imaging Network. Magn Reson Imaging. 2012; 30(9):1323–1341. https://doi.org/10.1016/j.
mri.2012.05.001 PMID: 22770690
35. Hall-Beyer M. GLCM Texture: A Tutorial. In National Council on Geographic Information and Analysis
Remote Sensing Core Curriculum; University of Calgary: Calgary, AB, Canada, 2000.
36. Conners RW, Harlow CA. A Theoretical Comparison of Texture Algorithms. IEEE Trans Pattern Anal
Mach Intell. 1980; PAMI-2(3):204–222. https://doi.org/10.1109/tpami.1980.4767008 PMID: 21868894
37. Segmentation of a high-resolution urban scene using texture operators. Comput Vision, Graph Image
Process. 1984; 25(3):273–310. https://doi.org/10.1016/0734-189X(84)90197-X
38. de Siqueira FR, Schwartz WR, Pedrini H, Multi-scale gray level co-occurrence matrices for texture
description, Neurocomputing, 2013, 120:336–345.
39. Liu S, Cai W, Wen L, Feng DD. Multiscale and multiorientation feature extraction with degenerative pat-
terns for 3D neuroimaging retrieval. In: 2012 19th IEEE International Conference on Image Processing.
IEEE; 2012:1249–1252. https://doi.org/10.1109/ICIP.2012.6467093
40. Aerts HJWL, Velazquez ER, Leijenaar RTH, et al., "Decoding tumour phenotype by noninvasive imag-
ing using a quantitative radiomics approach", vol. 5, Nat Communication, 2014. https://doi.org/10.1038/
ncomms5006 PMID: 24892406
41. Haralick RM, Shanmugam K, Dinstein I. Textural Features for Image Classification. IEEE Trans Syst
Man Cybern. 1973; SMC-3(6):610–621. https://doi.org/10.1109/TSMC.1973.4309314
42. Lemarignier C, Martineau A, Teixeira L, et al. Correlation between tumour characteristics, SUV mea-
surements, metabolic tumour volume, TLG and textural features assessed with 18F-FDG PET in a
large cohort of oestrogen receptor-positive breast cancer patients. Eur J Nucl Med Mol Imaging. 2017;
44(7):1145–1154. https://doi.org/10.1007/s00259-017-3641-4 PMID: 28188325
43. Nakajo M., Kajiya Y., Tani A., Jinguji M., Nakajo M., Kitazono M., et al. A pilot study for texture analysis
of 18F-FDG and 18F-FLT-PET/CT to predict tumor recurrence of patients with colorectal cancer who
received surgery. Eur J Nucl Med Mol Imaging. 2017; 44(13), 2158–2168. https://doi.org/10.1007/
s00259-017-3787-0 PMID: 28770274
44. Goel H. L., & Mercurio A. M. VEGF targets the tumour cell. Nature Reviews. Cancer. 2013; 13(12),
871–882. https://doi.org/10.1038/nrc3627 PMID: 24263190
45. Migheli F., & Migliore L. (2012). Epigenetics of colorectal cancer. Clinical Genetics. 2012; 81(4), 312–
318. https://doi.org/10.1111/j.1399-0004.2011.01829.x PMID: 22263639
46. FlugeØ., Gravdal K., Carlsen E., Vonen B., Kjellevold K., Refsum S. et al. Expression of EZH2 and Ki-
67 in colorectal cancer and associations with treatment response and prognosis. British Journal of Can-
cer. 2009; 101(8), 1282–1289. https://doi.org/10.1038/sj.bjc.6605333 PMID: 19773751
47. Gately S., & Li W. W. Multiple roles of COX-2 in tumor angiogenesis: a target for antiangiogenic therapy.
Seminars in Oncology. 2004; 31(2 Suppl 7), 2–11. https://doi.org/10.1053/j.seminoncol.2004.03.040
PMID: 15179620
48. Tixier F, Hatt M, Valla C, et al. Visual versus quantitative assessment of intratumor 18F-FDG PET
uptake heterogeneity: prognostic value in nonnsmall cell lung cancer. J Nucl Med. 2014; 55(8):1235–
1241. https://doi.org/10.2967/jnumed.113.133389 PMID: 24904113
49. Barrington SF, George Mikhaeel N, Kostakoglu L, et al. Role of Imaging in the Staging and Response
Assessment of Lymphoma: Consensus of the International Conference on Malignant Lymphomas
Imaging Working Group. J Clin Oncol. 32:3048–3058. https://doi.org/10.1200/JCO.2013.53.5229
PMID: 25113771
50. Hatt M, Tixier F, Visvikis D, Cheze Le Rest C. Radiomics in PET/CT: More Than Meets the Eye? J Nucl
Med. 2017; 58(3):365–366. https://doi.org/10.2967/jnumed.116.184655 PMID: 27811126
PLOS ONE Tumor response prediction from PET image texture
PLOS ONE | https://doi.org/10.1371/journal.pone.0242597 November 30, 2020 17 / 18
Page 18
51. Orlhac F, Nioche C, Soussan M, Buvat I. Understanding Changes in Tumor Texture Indices in PET: A
Comparison Between Visual Assessment and Index Values in Simulated and Patient Data. J Nucl Med.
2017; 58(3):387–392. https://doi.org/10.2967/jnumed.116.181859 PMID: 27754906
52. Bogowicz M, Vuong D, Huellner MW, et al. CT radiomics and PET radiomics: Ready for clinical imple-
mentation? Q J Nucl Med Mol Imaging. 2019; 63(4):355–370. https://doi.org/10.23736/S1824-4785.19.
03192-3 PMID: 31527578
PLOS ONE Tumor response prediction from PET image texture
PLOS ONE | https://doi.org/10.1371/journal.pone.0242597 November 30, 2020 18 / 18
Page 19
© 2020 Martin-Gonzalez et al. This is an open access article distributed underthe terms of the Creative Commons Attribution License:
http://creativecommons.org/licenses/by/4.0/(the “License”), which permitsunrestricted use, distribution, and reproduction in any medium, provided the
original author and source are credited. Notwithstanding the ProQuest Termsand Conditions, you may use this content in accordance with the terms of the
License.