Page 1
University of Rhode Island University of Rhode Island
DigitalCommons@URI DigitalCommons@URI
Open Access Master's Theses
2017
Associations Between Nighttime Eating and Total Caloric Intake Associations Between Nighttime Eating and Total Caloric Intake
in College-Aged Students in College-Aged Students
Marissa Christina Ruginski University of Rhode Island, [email protected]
Follow this and additional works at: https://digitalcommons.uri.edu/theses
Recommended Citation Recommended Citation Ruginski, Marissa Christina, "Associations Between Nighttime Eating and Total Caloric Intake in College-Aged Students" (2017). Open Access Master's Theses. Paper 1016. https://digitalcommons.uri.edu/theses/1016
This Thesis is brought to you for free and open access by DigitalCommons@URI. It has been accepted for inclusion in Open Access Master's Theses by an authorized administrator of DigitalCommons@URI. For more information, please contact [email protected] .
Page 2
ASSOCIATIONS BETWEEN NIGHTTIME
EATING AND TOTAL CALORIC INTAKE IN
COLLEGE-AGED STUDENTS
BY
MARISSA CHRISTINA RUGINSKI
A THESIS SUBMITTED IN PARTIAL FULFILLMENT OF THE
REQUIRMENTS FOR THE DEGREE OF
MASTER OF SCIENCE IN NUTRITION AND FOOD SCIENCES
UNIVERSITY OF RHODE ISLAND
2017
Page 3
MASTER OF SCIENCE THESIS
OF
MARISSA CHRISTINA RUGINSKI
APPROVED:
Thesis Committee:
Major Professor Kathleen Melanson
Geoff Greene
Colleen Redding
Nasser H. Zawia
DEAN OF THE GRADUATE SCHOOL
UNIVERSITY OF RHODE ISLAND
2017
Page 4
ii
ABSTRACT
Background: Obesity is a nationwide concern across all age groups including the
college-aged population. Approximately 35% of college students are reported to be
overweight or obese in America, as defined by a body mass index (BMI) over 25 kg/m2.
Increased caloric intake has shown to be associated with an elevated BMI. Nighttime
eating may be a contributing factor to increased total caloric intake, and it has been
associated with higher total caloric intake and weight gain in shift workers and older
adults. However, research has not examined whether an association exists between
nighttime eating and total daily caloric intake in college-aged students. Nighttime eating
has been identified by college students as a potential concern for weight gain, thus
making this an important and novel investigation.
Objective: The primary objective was to examine possible relationships between
nighttime eating and total caloric intake amongst college-aged undergraduate students
at the University of Rhode Island (URI) during three consecutive semesters. The
secondary objectives were to investigate associations between nighttime eating and
dietary quality and sleep patterns. The exploratory objectives were to consider
associations between nighttime eating and metabolic syndrome (MetS) risk and body
composition. The primary hypothesis was that nighttime eaters would have a higher
caloric intake.
Design and Methods: This cross-sectional data analysis was an add-on study to an
ongoing secondary data analysis project that examines the relationship between diet and
chronic disease risk in college-aged students, referred to as the Nutrition Assessment
Secondary Data Analysis Project. Undergraduate students (n=173, 72.25% females;
Page 5
iii
BMI=23.7kg/m2) completed the Nutrition Assessment Survey (NAS) to categorize
nighttime eaters and assess quantitative sleep patterns. Statistically controlled for
confounding variables included, gender and smoking status. The International Physical
Activity Questionnaire (IPAQ) assessed activity levels. The Diet History Questionnaire
(DHQ II), a web-based food frequency questionnaire, estimated total caloric intake. The
DHQ II was also used to calculate the total and component scores of the Healthy Eating
Index-2010 (HEI-2010), an indicator of dietary quality. Anthropometric and
biochemical measures were taken to determine the students’ number of risk factors for
MetS and body weight status.
Results: In this population, caloric intake within 2 hours of sleep or after 10:00PM
provided more accurate definitions of nighttime eating than in other populations. Caloric
intake after 10:00PM and within 2 hours (p=.015, r2=.034) of sleep onset was related to
higher caloric consumption (+235.56 - 543.07kcals), lower HEI-2010 total scores (-4.78
– 5.91), and more MetS risk factors.
Conclusion: This analysis aimed to determine if nighttime eating was associated with
differential total daily caloric intake, along with dietary quality, sleep patterns, MetS
risk, and BMI status. This study identified previously uninvestigated information
regarding the prevalence of nighttime eating, along with differences in several health-
related variables between students who engage in nighttime eating and those who do
not. Nighttime eating was associated with increased caloric intake and a poorer diet
quality in college students.
Page 6
iv
ACKNOWLEDGMENTS
First and foremost a warm and kind thank you to Doctor Kathleen Melanson, my
major professor, undergraduate professor, supervising professor for an undergraduate
teaching assistant, and the definition of a true role model. Some may say they would
not be where they are without one individual, and for myself that individual is you Dr.
Melanson. I would also like to thank my committee members Dr. Geoff Greene, Dr.
Colleen Redding, and my committee chair Dr. Lisa Weyandt. Last but not least a kind
thank you to my parents who have supported me through this long journey.
Page 7
v
PREFACE
This thesis is written in Manuscript Format, following the guidelines of the Journal
of American College Health. Once the preceding thesis is successfully defended it will
be submitted to the Journal of American College Health for publication consideration.
Page 8
vi
TABLE OF CONTENTS
ABSTRACT .................................................................................................................. ii
ACKNOWLEDGMENTS .......................................................................................... iv
PREFACE ......................................................................................................................v
TABLE OF CONTENTS ............................................................................................ vi
LIST OF TABLES .................................................................................................... viii
MANUSCRIPT ..............................................................................................................1
APPENDICES .............................................................................................................32
A: Review of Literature……………………….....………………………….......34
B: Methods Timeline………………………………………..……………….......43
C: Consent Forms …………..…………..……………....…..….……...…......…44
D: Nutrition Assessment Survey……..…………….……………………..…….48
E: International Physical Activity Questionnaire..…………………………....55
F: DHQ II Information …………………………...……...……..…...…...……..58
G: Biochemical Measures Document …………………….…………………….59
H: Anthropometric Instructional Document.……………...……….…….……60
I: Anthropometric Assessment Document………………………….…….……61
J: HEI-2010 Total Score Export Information………………………………....62
K: HEI-2010 Scoring Guide…………………………………………………….65
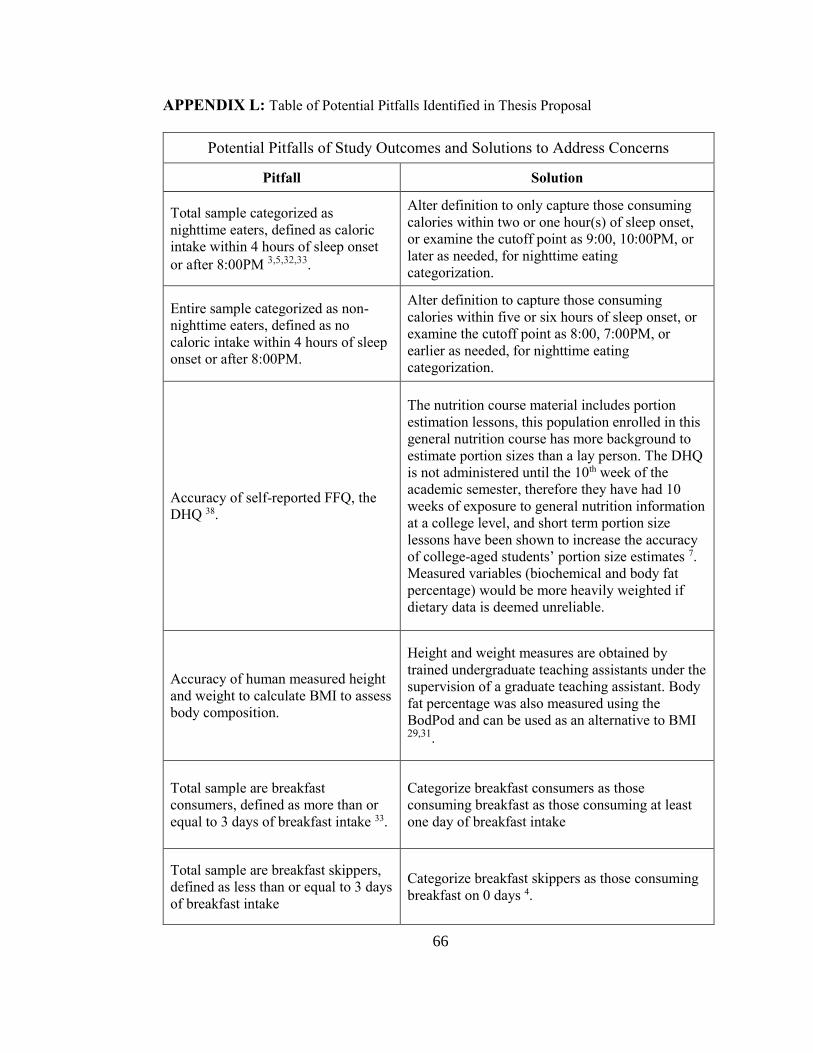
L: Table of Potential Pitfalls Identified in Thesis Proposal…………………...66
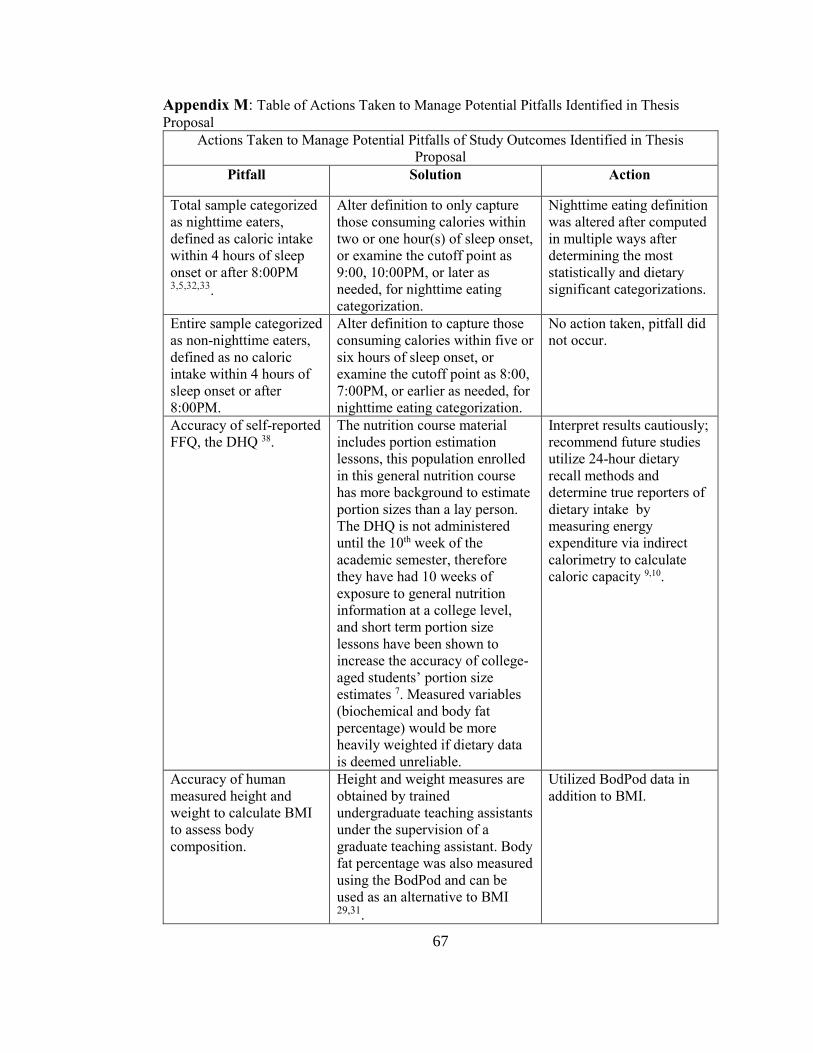
M: Table of Actions Taken to Manage Potential Pitfalls Identified in
Thesis Proposal…………………………………………………….……….........67
Page 9
vii
BIBLIOGRAPHY .......................................................................................................69
Page 10
viii
LIST OF TABLES
TABLE PAGE
Table 1. Group proportions …………………………………………………………..28
Table 2. T-test of total caloric intake by gender……………………….…………..…28
Table 3. Descriptive analysis of participant demographics…..………………………29
Table 4. Descriptive analysis of variables of interest………………………..……….30
Table 5. Analysis of normality of data …………………………………….……..…..31
Table 6. Correlations………………………………………………………………….31
Table 7. Total caloric intake between groups ……………..………………………....32
Table 8. total caloric intake between groups while controlling for gender and physical
activity level …………………………………………………...……………………..32
Table 9. HEI-2010 total score between groups…...…………………………………..33
Table 10. Body fat percent separated by gender and group…...……………………...33
Page 11
1
MANUSCRIPT INTRODUCTION PAGE
MANUSCRIPT- 1
To be submitted to The Journal of American College Health
ASSOCIATIONS BETWEEN NIGHTTIME EATING AND TOTAL CALORIC
INTAKE IN COLLEGE-AGED STUDENTS
Marissa Ruginski, Kathleen Melanson
Corresponding Author: Kathleen Melanson, PhD, RD, LDN
Department of Nutrition and Food Sciences
The University of Rhode Island
Upper College Rd, Fogarty Hall
Kingston, RI 02881
Phone: 401.874.4477
Email: [email protected]
Page 12
2
Marissa Ruginski and Kathleen J. Melanson
Department of Nutrition and Food Sciences, University of Rhode Island
Kingston, Rhode Island 02881
ABSTRACT
Objective: To examine possible relationships between nighttime eating and total caloric
intake in college-aged students, a previously unexamined population.
Participants: Data were collected on undergraduate students 18-25 years-old at the
University of Rhode Island during three consecutive semesters; January 2016 - April
2017.
Methods: This cross-sectional data analysis was an add-on study to an ongoing research
study. Participants completed surveys to categorize nighttime eaters, estimate total
caloric intake, assess sleep patterns, demographics, physical activity, and dietary quality
information. Anthropometric and biochemical measures were used to determine the
number of risk factors for metabolic syndrome and assess body composition.
Results: Nighttime eating was associated with increased caloric intake and lower HEI-
2010 total scores (-4.78–5.91), specifically intake within 2 hours (p=.015, r2=.034) of
sleep.
Conclusion: In college students, nighttime eating was associated with increased caloric
intake and poorer diet quality.
Page 13
3
INTRODUCTION
Obesity is a nationwide concern across all age groups including young adults
attending college. According to the American College Health Association-National
College Health Assessment II in Spring 2016 approximately 35% of college students
were reported to be overweight or obese in America1, as defined by a body mass index
(BMI) over 24.9 kg/m2 1-4. Increased caloric intake has been found to be associated with
an elevated body mass index (BMI) 5,6. Nighttime eating may be a contributing factor
to increased daily caloric intake; it has been associated with higher total caloric intake
and weight gain in shift workers and older adults 7-10. However, research has not
examined this association in college-aged students 7-10.
Nighttime eating has been classified by consumption of calories after a specific
clock time or within a specified number of hours before sleep onset. Baron et al.
classified nighttime eaters as those who consumed calories after 8:00PM or within 4
hours before sleep onset 7,9,10. Nighttime eating has been identified by college students
as a potential concern for weight gain, yet it has never been studied in this population
11. Therefore, relationships between nighttime eating and caloric intake were examined.
Physical activity and gender affect total caloric intake, therefore both were examined in
this analysis 8.
Results from investigations between nighttime eating and diet quality are limited
and contradicting, an association may exist for a later defined meal eating time. Reid
and Baron examined nighttime eating using earlier parameters than Wang et al. and had
found no difference in diet quality 3,32,33,38. Breakfast consumption is often coupled with
having a robust diet quality 37, and in comparison breakfast skipping is associated with
Page 14
4
weight gain, poor diet quality, and shifting caloric intake to later in the day 4,15,38.
Correlations have been found between higher caloric intake after 8:00PM and a higher
total daily caloric intake, shorter sleep duration, and later sleep timing 3. Repeated
positive associations between nighttime eating and BMI have been found 3,32,38, with the
exception of one study in which no correlations were found between meal timing and
BMI 33. This may be related to the lower BMI of the sample, and two longitudinal studies
reported that nighttime eaters gained more weight over time than non-nighttime eaters
2,17. To our knowledge body composition and nighttime eating have not been examined
using measured body fat percent.
The primary objective of this study was to examine possible relationships between
nighttime eating and total calorie intake among undergraduate students at the University
of Rhode Island (URI). The secondary objectives were to investigate associations
between nighttime eating and dietary quality and sleep patterns. The exploratory
objectives were to examine associations amongst nighttime eating and MetS risk and
body composition.
This analysis aimed to determine if nighttime eating was related to total caloric
intake, along with dietary quality, sleep patterns, metabolic syndrome (MetS) risk, and
BMI status. This study identifies previously uninvestigated information regarding the
prevalence of nighttime eating in college-aged students and correlations between
nighttime eating and MetS risk for any aged population.
Page 15
5
METHODS
Study Design
Undergraduate students enrolled in a general nutrition course at URI completed a
survey to identify nighttime eaters, and the validated Diet History Questionnaire II
(DHQ II) was used to measure total caloric intake, the primary variable of interest 12.
This was a supplemental study added to an ongoing Institutional Review Board
approved research project examining the relationship between diet and chronic disease
risk in college-aged students, (Nutrition Assessment Study [NAS]).
Nighttime eating was defined using data collected for the NAS in addition to
assessing demographics, sleep and nighttime eating. This study examined
anthropometric, biochemical, and survey data on students enrolled in the Applied
General Nutrition course. This was an add on study that investigated dietary data
collected during three semesters, spring 2016 through spring 2017 in college-aged
students.
Nighttime eating was the independent variable, and total daily caloric intake,
dietary quality examined by the Healthy Eating Index-2010 (HEI-2010) total score,
total hours of sleep, number of metabolic syndrome risk criteria, and BMI were
dependent variables. The primary hypothesis was that college-aged students defined as
nighttime eaters would have a higher total caloric intake compared to those who do not
participate in nighttime eating. The secondary hypotheses were that those who were
identified as nighttime eaters would have a poorer diet quality compared to those who
were not identified as nighttime eaters. Additionally, a higher proportion of identified
nighttime eaters would report lower sleep quantities (<7 hours) compared those who
Page 16
6
were not identified as nighttime eaters. The exploratory hypotheses were that
nighttime eaters would have more risk factors for MetS and a higher BMI status than
those who were not identified as nighttime eaters.
All data collection occurred during five of the course lab sessions, with
protocol guidelines in place for anthropometric, biochemical, and survey data. A
timeline of data collection can be found in Appendix B. Undergraduate and graduate
teaching assistants and research assistants were trained on proper protocol prior to the
data collection process for anthropometric measures and other data collection
techniques, and reliability of each measure was verified.
Data Collection
During the first lab, the study was explained; participating students read and
signed consent forms to allow data to be used for research. Participants were required
to be 18 years or older to participate; a copy of the consent form and surveys are
presented in Appendices C through F. Participating students identification numbers
were then entered into a password secure web portal, which provided students access
where they virtually completed the NAS, DHQ II, and International Physical Activity
Questionnaire (IPAQ) surveys 12,13. Anthropometric and biochemical data were entered
into the NAS web portal by research assistants.
The NAS survey and IPAQ were administered during lab two. Students logged
into the NAS web portal to access the survey. Biochemical data and anthropometric
measurements were collected during labs three and lab four respectively; Appendices
G through I. During the last visit of the protocol the students completed the DHQ II.
Page 17
7
Variable Measurements
Nighttime Eating Categorizations: NAS Survey
The NAS survey assessed multiple aspects of nutrition, including basic
demographic information, weight satisfaction, and eating behaviors. It provided data to
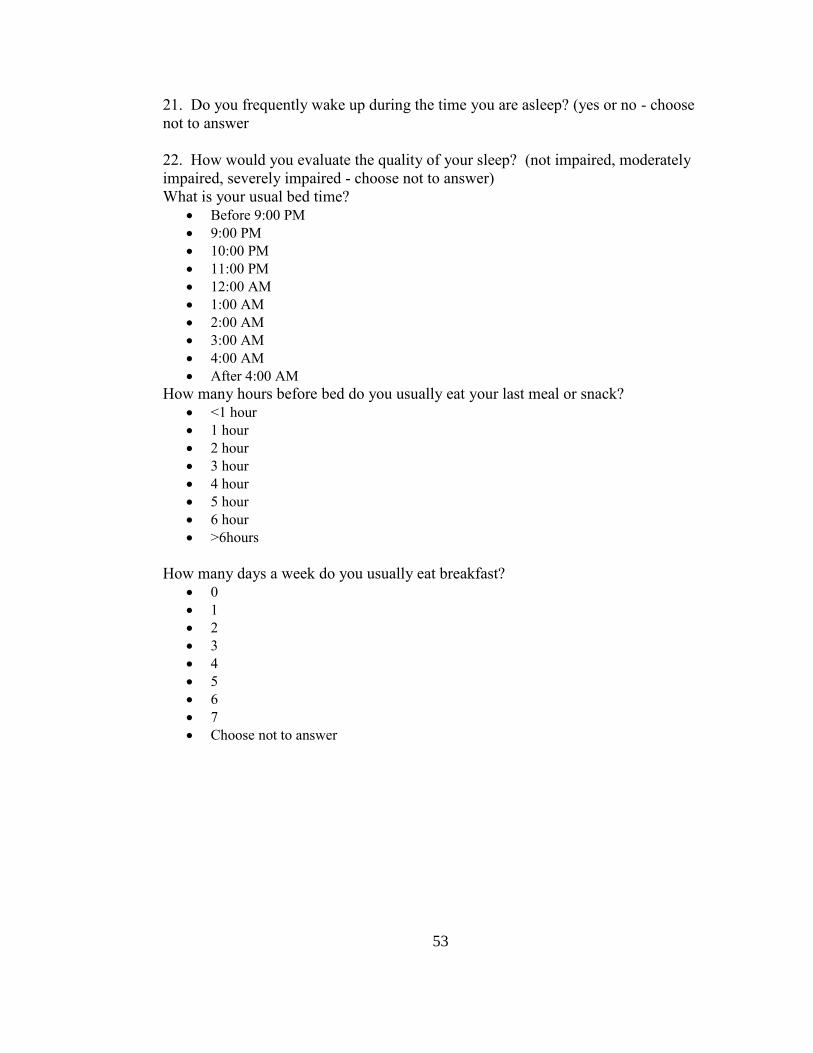
categorize students as nighttime eaters, and assess their sleep patterns. Specific survey
items included; ‘What is your usual bedtime?’; ‘How many hours before bed do you
usually eat your last meal or snack?’ and; ‘On average, how many hours of sleep do
you get in a 24-hour period?’.
Nighttime eating categorizations for caloric intake after 8:00PM was computed
by subtracting last meal time from reported bedtime (‘What is your usual bedtime?’ -
‘How many hours before bed do you usually eat your last meal or snack?’). Caloric
intake within 4 hours of sleep was determined by the item: ‘How many hours before
bed do you usually eat your last meal or snack?’.
Results are reported using population appropriate categorizations of nighttime
eating along with the literature defined measures of nighttime eating to demonstrate
the need for newly defined categories for this population. The definition of nighttime
eating was altered due to the large proportion of the sample being classified as
nighttime eaters, based on the literature based definition of caloric intake after 8:00
PM (89.6%) and intake within four hours of sleep (94.2%); Table 1.
The nighttime eating categorizations reported are caloric intake within 2 hours
of sleep and intake after 10:00PM. Categorization by specific hours (caloric intake
within 2 hours) before sleep may reduce sleep time variation. Group size for intake
within two hours of sleep (62.4% nighttime eaters, 37.6% non-nighttime eaters) was
Page 18
8
more evenly distributed than within four hours of sleep (62.4% nighttime eaters,
37.6% non-nighttime eaters). Additionally, significance was found in all examined
variables, apart from BMI, of note significance was not found between BMI and any
nighttime eating categorization. When categorizing nighttime eating by intake after
10:00 PM there was a large dietary difference in total caloric intake (+235.56kcal) and
equal group size was observed (54.3% nighttime eaters, 45.7% non-nighttime eaters).
Lastly, significance was demonstrated in the remaining variables.
Total calorie intake and Diet Quality: DHQ II
The DHQ II was the food frequency questionnaire (FFQ) that provided an
estimation of total daily caloric intake and evaluated dietary quality by providing the
HEI-2010 total scores. Login to the web-based FFQ was overseen by a trained
graduate teaching assistant and two undergraduate teaching assistants. Students took
about one hour and 15 minutes to complete the DHQ II.
The DHQ II provided HEI-2010 total scores through an indirect statistical
analysis software output, refer to Appendices J through K 15. The HEI-2010 is a
validated dietary quality index. Correlations between HEI-2010 total scores and BMI,
nutrients in the diet, and individual’s self-perception of diets have been identified 15,16.
The DHQ II was designed and tested by the National Cancer Institute, the version
utilized in this study asked about dietary patterns and intake for one year prior to
completing the FFQ 17.
Twenty-three participants were excluded from this analysis because they had
not completed the DHQ-II, possibly due to: lab absence, error in submission, or
logging off the website portal before DHQ II completion. Three participants were
Page 19
9
excluded from analyses due to reported intakes outside physiological possibilities,
<400 or >7000kcals 18.
Breakfast consumption: NAS Survey
The NAS provided breakfast consumption patterns with the question; ‘How
many days a week do you usually eat breakfast?’. Breakfast consumers were defined
as those eating breakfast at least three times weekly 10.
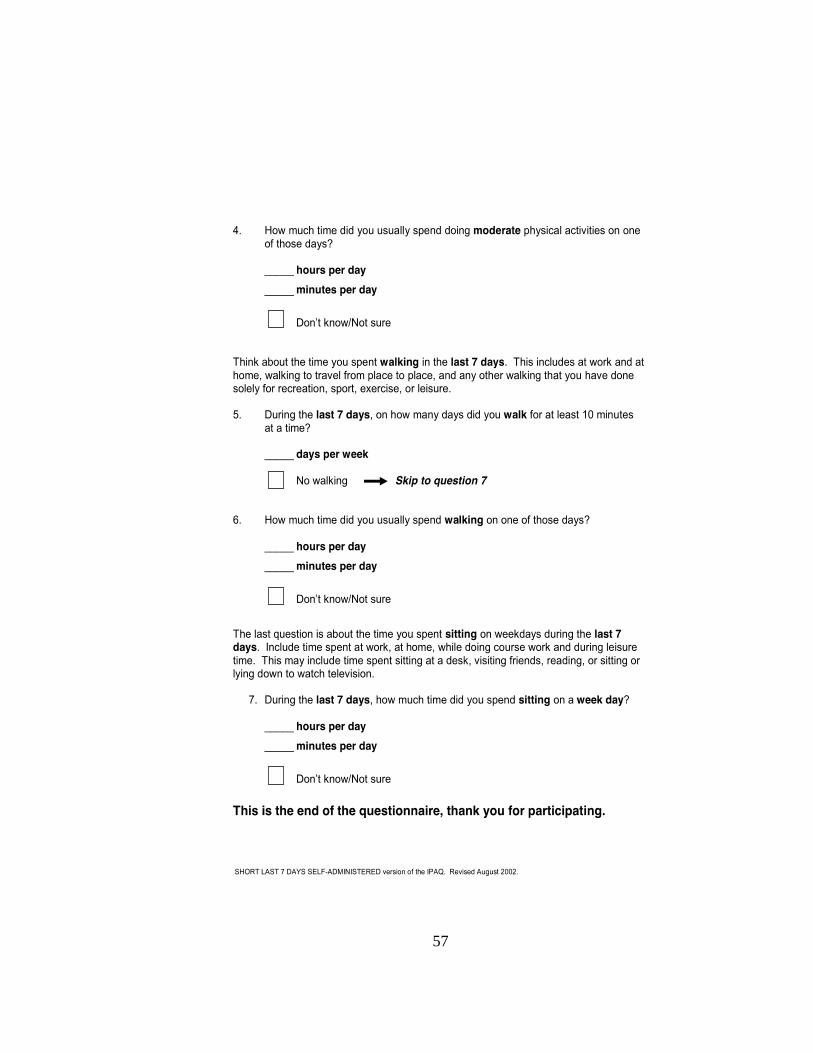
Physical activity assessment: IPAQ Short-Version
The IPAQ assesses physical activity level (PAL) in the students; this
instrument was selected as it was previously used in a cross sectional analysis on
nighttime eating 19, and with this age group 20.
There is high over reporting associated with the IPAQ and the IPAQ scoring
guide provides protocol on data truncation and outlier exclusion which was utilized
when analyzing the data 21. First reported combined vigorous and moderate physical
activity reported more than 960 minutes were excluded from physical activity analyses
21. Next, reported vigorous and moderate physical activity minutes more than 180
minutes were truncated to equate to 180 minutes 21.
A total of 23 participants were excluded from physical activity analyses. Per
scoring guidelines 38 cases for moderate physical activity and 53 cases for vigorous
physical activity were truncated to 180 minutes 21. Fourteen participants were
excluded from analyses for reporting >960 minutes, six participants did not complete
the IPAQ due to lab absence, and three entered ‘Choose not to answer.’
Page 20
10
Body Composition and Metabolic Syndrome Risk Assessment: Anthropometric
and Biochemical Measures
Height measures were taken after shoes and socks were removed, using a wall
mounted stadiometer. Prior to weight measurements, using a voided digital scale,
students removed any excess clothing, shoes, and socks. Height and weight
measurements were taken twice and repeated until they were within .2cm and .1 kg of
each other. These measures were used to calculate BMI to assess weight status 22,23;
being overweight or obese is defined by a BMI over 24.9 kg/m2 and 29.9 kg/m2,
respectively 1-4.
Body fat percent was privately measured using the Bod Pod; following
protocol preparation guidelines (Body Composition System manufactured by Life
Measurements (LMI) in California). The Bod Pod utilizes air displacement
plethysmography to provide a calculated estimation of body density and total body fat
percentage, which involves measuring body mass and volume, and thoracic lung
volume 24.
Height and weight measures (BMI) and BodPod measures were not completed
on 57 participants; due to missed appointments. For one of the 57 participants
information on BMI was not recorded on the form submitted to the instructor.
Hip and waist circumference were obtained using a Gulick measuring tape to
determine abdominal obesity. Hip and waist measurements were taken in a private
room with a separate check-in and waiting area. Waist circumference was measured at
the slimmest part below the ribcage and above the iliac crest and two measures were
taken; measures were repeated until they were within .5cm of each other 3,25.
Page 21
11
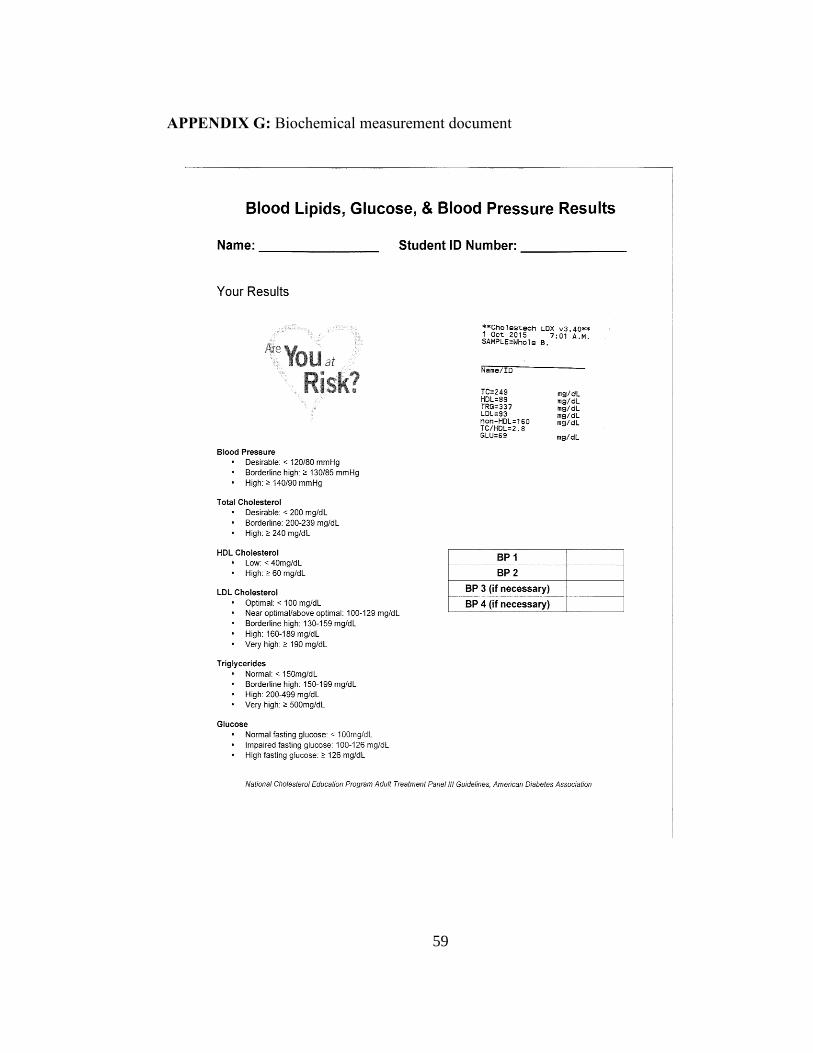
Fasting biochemical data included total cholesterol, low density lipoprotein
cholesterol (LDL-C), high density lipoprotein cholesterol (HDL-C), triacylglycerides
(TAG), and blood glucose levels. These values were collected via a finger stick and
assessed using the validated AlereCholestech® LDX System 26,27. Before blood was
drawn students were required to fast at least 8 to 12 hours overnight, during which
time water was encouraged to ensure proper hydration 3. Following the finger stick
sample, participants rested for five-minutes before blood pressure was obtained with
an automated computerized device (HEM-711DLX manufactured by Omron in
Bannockburn, Illinois). The anthropometric and biochemical data collected allowed
the researchers to determine MetS criteria. The clinical definition of MetS is having
any three of the five criteria 2. The criteria set forth by The American Heart
Association and the National Heart, Lung, and Blood Institute include elevated blood
pressure (≥ 130/85 mmHg), elevated fasting blood glucose (≥100mg/dL), elevated
TAG (≥150mg/dL), increased waist circumference (males ≥40”, females ≥35”), and
suboptimal HDL-C levels (males ≤40mg/dL, females ≤50mg/dL) 2,3,28.
Statistical Analysis
Statistical analyses were performed using SPSS (v24). Skewness and kurtosis
were used to assess normality of all variables’ distribution. Correlations were run for
all variables to determine any covariate influence. Previously identified covariates
from the reviewed literature included age, sex, physical activity, ethnicity, current
major, and smoking status 7,9,10,19,29-31.
The primary hypothesis was assessed between groups, nighttime eaters and
non-nighttime eaters; using an analysis of variance (ANOVA) followed by an analysis
Page 22
12
of covariance (ANCOVA) using co-variates previously identified. Secondary and
exploratory hypotheses were assessed using the same approaches. Total caloric intake
differed significantly between genders (p=.006, t=2.822), with males consuming more
calories (+681.99kcals) (Table 2). Thus, gender was used as a covariate when
analyzing the primary variable using an ANCOVA. Smoking was used as a covariate
when dietary quality was analyzed as previous nighttime eating and diet quality
studies have used this methodology 3-6, additionally smoking was negatively
associated with diet quality in adults7.
Page 23
13
RESULTS
Descriptive:
Population sample characteristics are displayed in Table 3 and Table 4. The
final sample (n=173) was predominantly female (72.25%) and Caucasian (81.40%),
with a mean age of 19.21(1.41) years. A small proportion (11.56%, n=20) of the
sample were nutrition majors. On average participants had a healthy BMI
(23.663.73), and 19.6% were either overweight or obese. An analysis of skewness
and kurtosis demonstrated the variables were overall normally distributed; Table 5.
Correlations are reported in Table 6.
Primary outcome: Total daily caloric intake
An ANOVA showed significant difference in total daily caloric intake between
nighttime and non-nighttime eaters; Table 7. Those who ate within 2 hours of sleep
onset (p=.015, η2p=.034, r2=.034, F(1,170)=6.008) reported significantly higher daily
caloric consumption (+476.26kcals). Even after controlling for gender and PAL
(p=.034, η2p=.031, r2=.127) students who consumed calories within 2 hours of sleep
onset reported a higher daily calorie intake. Both vigorous and moderate weekly
activity minutes were controlled for; Table 8 depicts the ANCOVA outcomes. As
noted earlier no association was found for intake after 10:00PM.
No significant associations were found with the literature based definitions of
nighttime eating; caloric intake after 8:00PM or within 4 hours of sleep. After
controlling for gender and PAL, caloric differences did not statistically change; caloric
intake after 8:00 PM (p=.370, η2p=.005, r2=.064) or within 4 hours of sleep (p=.250,
η2p=008, r2=.067). This relationship was found for caloric intake after 9:00PM (p=.016,
Page 24
14
η2p=.033, r2=.066), and after controlling for gender (p=.030, η2
p=.027, r2=.085), and
PAL (p=.027, η2p=.033, r2=.043).
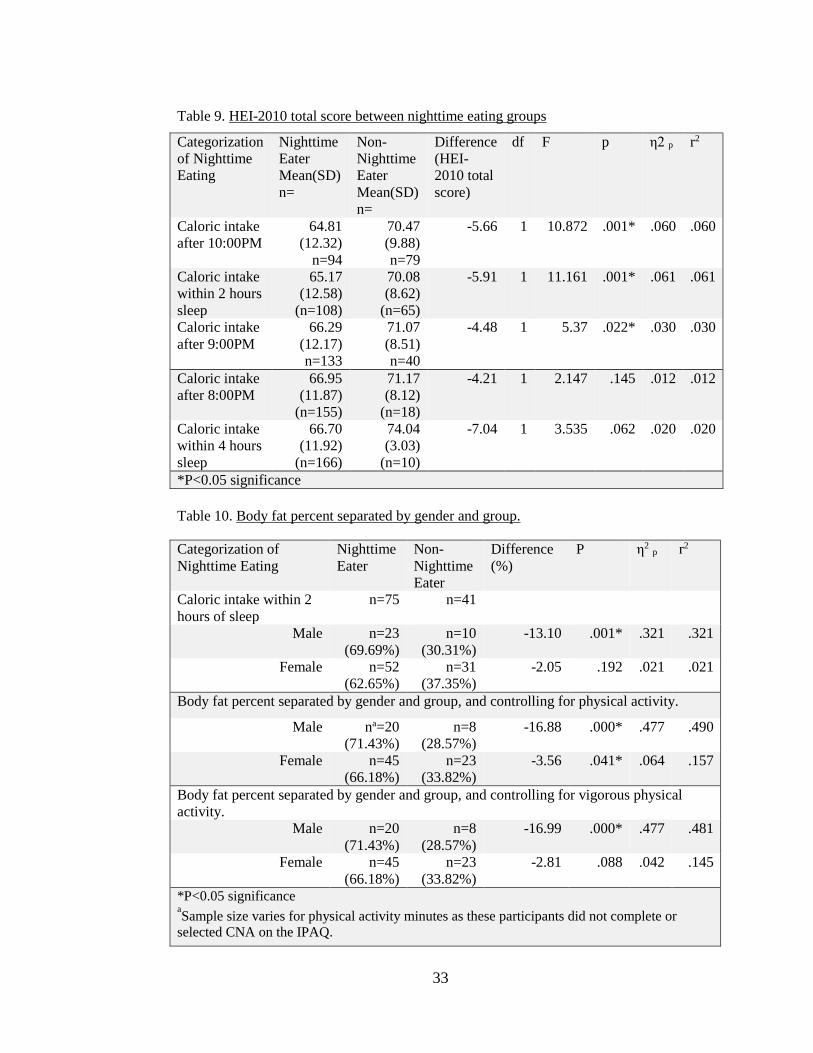
Secondary outcome: HEI-2010 Total Score
Nighttime eaters had a lower total HEI-2010 total score (-4.48 - 5.91)
compared to non-nighttime eaters; Table 9. When categorizing nighttime eating as
caloric intake after 10:00 PM (p=.001, η2p=.060, r2=.060), or intake within 2 hours of
sleep (p=.001, η2p=.061, r2=.061) there was a significant negative difference between
HEI-2010 total score between groups. Using the literature defined measures of
nighttime eating, significance was not found; caloric intake after 8:00 PM (p=.145,
η2p=.012, r2=.012) or within 4 hours of sleep (p=.062, η2
p=.020, r2=.020). Significance
was found for caloric intake after 9:00PM (p=.022, η2p=.030, r2=.030) and having a
lower HEI-2010 total score.
When controlling for smoking the association between total HEI-2010 total
score remained significant for caloric intake after 10:00 PM (p=.001, η2p=.064,
r2=.070), intake within 2 hours of sleep (p=.001, η2p=.064, r2=.069), and intake after
9:00PM (p=.019, η2p=.032, r2=.037). Controlling for smoking strengthened the
association between HEI-2010 total score and eating within 4 hours of sleep (p=.055,
η2p=.022, r2=.027), and the association for caloric intake after 8:00PM remained
nonsignificant.
Sleep Quantity
Nighttime eaters were significantly more likely to sleep less than 7 hours.
Significance was found only when nighttime eating was categorized as caloric intake
after 10:00 PM (x2=5.86, p=.015). A higher percentage of nighttime eaters (45.7%)
Page 25
15
reported less than seven hours of sleep each night, compared to non-nighttime eaters
(27.8%). Significance was not found for low sleep quantity and any other nighttime
eating categorization.
MetS
When the number of MetS risk factor criterion was analyzed in intervals (0 and
1-3 risk factors) no associations were found with any nighttime eating categorizations.
BMI and Body Fat Percent
No significant differences in group means were found between BMI and all
categorizations of nighttime eating. However, nighttime eating, defined as caloric
intake after 10:00PM was negatively associated with body fat percent in males (-
13.10%, p=.001, η2p=.321, r2=.321), but not in females (-2.05%, p=.192, η2
p=.021,
r2=.021). Controlling for physical activity in males (-16.88%, p=.000, η2p=.477,
r2=.490) and females (-3.56%, p=.041, η2p=.064, r2=.157) strengthened this
relationship for both genders. When controlling for only vigorous physical activity
negative body fat percent was no longer significant for female nighttime eaters (-
2.81%, p=.088, η2p=.042, r2=.145), but remained significant for male nighttime eaters
(-16.99%, p=.000, η2p=.477, r2=.481). Physical activity in conjunction with nighttime
eating had a negative effect on body fat percentage, primarily with males; results are
displayed in Table 10.
Page 26
16
COMMENT
Introduction
Research previously had not examined nighttime eating prevalence and
whether an association existed between nighttime eating and increased caloric intake
in college-aged students. This cross-sectional data analysis explored possible
relationships between new definitions of nighttime eating and a range of caloric and
metabolic outcomes. This study was of particular interest since traditional definitions
of nighttime eating did not apply to this population.
Discussion
This perspective study found that nighttime eaters consumed more daily
calories. Nighttime eating has been consistently found to be associated with increased
total daily caloric intake in adults and shift-workers 7,9,10,30,31,34. Nighttime eaters
consumed an average of 475-550kcals more than non-nighttime eaters and had lower
HEI-2010 total scores, supporting our primary and secondary hypotheses.
As an exploratory analysis of nighttime eating in a college-aged population
multiple categories of nighttime eating were calculated to explore the most appropriate
definition. This exploration demonstrated a new method to define nighttime eaters in
the college-aged population. The traditional nighttime eating definition of after
8:00PM or within 4 hours of sleep onset was a normal consumption time, as
demonstrated by 80-90% of this sample. Consumption after 10:00PM or within 2
hours of sleep onset was a more accurate representation of nighttime eating in this
population. Caloric intake within two hours of sleep represents the most accurate
nighttime eating classification for this population as it eliminates sleep timing
Page 27
17
variation. Traditional literature classifications were based on a previously used
definition of the average time of maximum caloric intake in normal eaters; both
researchers continued to use this cutoff in literature published after 7,9,10,14. Later
categorizations of nighttime eating may be attributed to later bed timings, as the most
frequently reported (34.10%) usual bedtime was midnight. The later bed timings for
college students may be due to range of studying and social events33.
This cross-sectional analysis contributes a more accurate definition of
nighttime eating for college-aged students to the body of literature, with the intention
to be used in further analysis of eating patterns for this population.
Nighttime eaters consuming calories within 2 hours of sleep reported
significantly higher daily caloric consumption (+476.26kcals) in our sample. This is
consistent with previous research examining total caloric intake and nighttime eating
in the middle- and older-aged population and shift workers 6-10,15,19,30,31, with the
exception of the behavior occurring closer to sleep onset in our sample. Future studies
examining associations between nighttime eating and college students should include
24-hour dietary recalls to assess the proportion of calories consumed during the
nighttime period and quality of foods consumed to determine if the proportion of
calories consumed is similar to findings in adults 6-10,15,19,30,31.
This study assessed dietary quality based on HEI-2010 total score. Previously,
relationships between diet quality and nighttime eating were examined using weekly
amounts of fast food meals and sugar sweetened beverages as the measure of diet
quality 7. This study also found nighttime eating to be associated with a poorer diet
quality 7. Relationships between breakfast intake and a higher diet quality have been
Page 28
18
found35. Bo et al. found 76% of nighttime eaters consumed breakfast 35, our study
found similar proportions, with 76-79% of nighttime eaters and 86-89% of non-
nighttime eaters consuming breakfast.
Along with previous research, this study has shown that eating closer to sleep
onset is associated with higher total daily caloric intake 10. Our study controlled for
physical activity where the previously study did not 10. Baron et al. found that
nighttime eating defined by clock time (caloric intake after 8:00PM) was no longer
related to total caloric intake or BMI after controlling for age, gender, and sleep.
However, significance remained for nighttime eating when classified by hours (
caloric intake within 4 hours), which may be due to decreased sleep timing variation.
Our study also demonstrated that after controlling for covariates, gender, physical
activity, and smoking status, relationships between nighttime eating (caloric intake
within 2 hours) and total caloric intake remained significant.
To our knowledge there is no previous literature examining MetS risk and
nighttime eating in any aged population. In this sample, there was no association found
between having zero or one to three MetS criteria and any nighttime eating
categorization. A separate study examining MetS and college students found a low
proportion of MetS in men (9.9-12%) and women (3-6%) 2,3. Additionally, 77% of the
college-aged students had one criterion of MetS. In our sample 30.05% had one
criterion of MetS 3. The lower proportion in this study may be due to the fact our
sample was only from one university and the other two studies examined three
universities over a geographical span 2,3. The lower proportion of MetS criterion may
also be related to this sample being relatively healthy (BMI status and body fat
Page 29
19
percent), and being younger in age. Over time elevated caloric intake, may lead to
development of more risk factors and/or accumulation of body weight 7,9,36-38, as
demonstrated with nighttime eaters in this sample and others 7,9,10,19,31,32.
Limited literature, with contradicting results, has explored the possible
relationships between nighttime eating and BMI 10,19. This study found no associations
between BMI and nighttime eating, but when body composition was examined using
body fat percent a negative association was found for nighttime eating after 10:00PM.
Similarly, other studies have found no correlations with meal timing and BMI 10, this
may be related to the lower BMI of the sample in previous studies 10,37, and in this
analysis, with 19.6% being either overweight or obese. Even though no relationship
with BMI was found, nighttime eating after 10:00PM was associated with a lower
body fat percentage (-5.45%); over time higher caloric intake is likely to lead to
weight gain unless offset by energy expenditure 10,37. Future studies should include
questions to assess timing of exercise and whether the participant is a student athlete.
Additionally, determining if nighttime eating is a new behavior adapted in college
from adjusting to studying, social events, or psychological reasons 33, or if the eating
behavior was adapted over time may explain the negative association between body fat
percentage and nighttime eating.
Nighttime eating and sleep duration are correlated and may be related to the
mechanism for increased weight gain from increased caloric intake due to habitual
nighttime eating 3. This may be because decreased sleep duration is associated with
hormonal disturbances; decreased leptin and increased ghrelin 14. These hormonal
changes may impact one’s weight status, as ghrelin increases appetite and leptin
Page 30
20
reduces appetite 14. Short sleep duration, linked to nighttime eating, was correlated
with emotional disturbances such as stress and pessimism, which may decrease one’s
ability to adhere to dietary and physical activity regiments and thus impact one’s
weight status 3,14.
An increase in total caloric intake related to nighttime calorie intake may be
due to the decreased satiety associated with late night food consumption, this is known
as the satiety ratio principle 9, 30,31. The satiety ratio is a decrease in satiety efficiency
throughout the day 30. The satiety ratio principle was demonstrated by de Castro,
where an increase in time spent eating and meal size occurred over the progression of
the day 30. Additionally, the after-meal interval decreased, even though more calories
had been consumed in meals 30. This study showed that as the day progresses,
individuals spent more time eating food and less time in between meals, even though
more calories were consumed at those later meals 30. This demonstrates that one’s
satiety level is not as greatly impacted with later meals compared to meals consumed
earlier in the day 30.
Limitations:
This was a cross-sectional data analysis therefore causation cannot be inferred
from the results. Future research should utilize longitudinal trials. The sample used
was a convenience sample, allowing us to examine nighttime eating in a the college
population for the first time. Since the sample was primarily female, future studies
should recruit a more diverse and representative college student population sample.
The independent variable, nighttime eating, was assessed by asking proximity
of consumption to sleep onset and relative to clock-time. These questions have not
Page 31
21
been validated in this study or in any other study of nighttime eating. This is a
limitation within the research as there is no validated measure to assess nighttime,
eating apart from a questionnaire that serves as a psychiatric diagnostic tool for
nighttime eating syndrome 8. Thus, this is an area of future work.
Reliability of self-reported dietary data was a limitation to this study. However,
since the nutrition course material includes portion estimation lessons, this population
had more background to estimate portion sizes than a lay person. The DHQ II was not
administered until the 10th week of the academic semester, therefore participants had
10 weeks of exposure to general nutrition information at a college level, and short term
portion size lessons have been shown to increase the accuracy of college-aged
students’ portion size estimates 39. These students elected to enroll in a nutrition course
and may have been a biased sample. The lower proportion of MetS criterion may also
be related to this sample being relatively healthy (BMI status and body fat percent),
and younger in age; potential pitfalls are discussed in Appendices L through M.
Strengths
The comparable nighttime eating studies primarily examine the middle-aged
population and shift workers 7,9,10,19,31, whereas this study examined the college-aged
population. This is the first known study to explore the prevalence of nighttime eating
in this population, and to explore relationships between MetS and nighttime eating.
Additionally, HEI-2010 total score was used as our assessment of diet quality rather
than non-validated measures that have been used 40,41. Further measures of body fat
percent, BMI, and blood objectively reflected health status.
Page 32
22
Conclusion
Nighttime eating, specifically caloric intake within 2 hours of sleep onset, was
related to higher caloric consumption (+476.26kcals), and lower HEI-2010 total scores
(-5.91) in the college aged population.
Page 33
23
REFERENCES
1. American College Health Association. American College Health Association-
National College Health Assessment II: reference group executive summary
spring 2016 2016:21.
2. Morrell JS, Byrd-Bredbenner C, Quick V, Olfert M, Dent A, Carey G.
Metabolic syndrome: comparison of prevalence in young adults at 3 land-grant
universities. J Am Coll Health. 2014;62(1):10.
3. Morrell JS, Lofgren IE, Burke J, Reilly R. Metabolic syndrome, obesity, and
related risk ractors among college men and women. J Am Coll Health.
2012;60(1):9.
4. Winklebey MA, Cubbin C. Changing patterns in health behaviors and risk
factors related to chronic diseases, 1990–2000. Behavior Change.
2004;19(1):8.
5. Al-Isa AN, Wijesekara N, Desapriya E. Multiple factors contribute to obesity
among Kuwaiti college women. Health. 2013;05(05):943-952.
6. Garaulet M, Gomez-Abellan P, Alburquerque-Bejar JJ, Lee YC, Ordovas JM,
Scheer F. Timing of food intake predicts weight loss effectiveness. Int J Obes
(Lond). 2013;37(4):604-611.
7. Baron KG, Reid KJ, Kern AS, Zee P. Role of sleep timing in caloric intake and
BMI. Obesity (Silver Spring). 2011;19(7):1374-1381.
8. Kinsey AW, Ormsbee M. The health impact of nighttime eating: old and new
perspectives. Nutrients. 2015;7(4):2648-2662.
9. Reid KJ, Baron KG, Horn LV, Zee P. Contribution of evening macronutrient
intake to total caloric intake and body mass index. Appetite. 2013;60(1):246-
251.
10. Reid KJ, Baron KG, Zee PC. Meal timing influences daily caloric intake in
healthy adults. Nutr Res. 2014;34(11):930-935.
Page 34
24
11. Nelson MC, Story M. Food environments in university dorms: 20,000 calories
per dorm room and counting. Am J Prev Med. 2009;36(6):523-526.
12. Beasley JM, Davis A, Riley W. Evaluation of a web-based, pictorial diet
history questionnaire. Public Health Nutr. 2009;12(5):651-659.
13. Rangul V, Holmen TL, Kurtze N, Cuypers K, Midthjell K. Reliability and
validity of two frequently used self-administered physical activity
questionnaires in adolescents. BMC Med Res Methodol. 2008;8:47.
14. Boston RC, Moate PJ, Allison KC, Lundgren JD, Stunkard AJ. Modeling
circadian rhythms of food intake by means of parametric deconvolution: results
from studies of the night eating syndrome. Am J Clin Nutr. 2008;87:5.
15. Sato-Mito N, Sasaki S, Murakami K, et al. The midpoint of sleep is associated
with dietary intake and dietary behavior among young Japanese women. Sleep
Med. 2011;12(3):289-294.
16. Gil A, Martinez de Victoria E, Olza J. Indicators for the evaluation of diet
quality. Nutr Hosp. 2015;31 Suppl 3:128-144.
17. Subar AF, Kipnis V, Troiano RP, et al. Using intake biomarkers to evaluate the
extent of dietary misreporting in a large sample of adults: the OPEN study.
American Journal of Epidemiology. 2003;158(1):13.
18. Vadiveloo M, Dixon LB, Mijanovich T, Elbel B, Parekh N. Dietary variety is
inversely associated with body adiposity among US adults using a novel food
diversity index. J Nutr. 2015;145(3):555-563.
19. Wang JB, Patterson RE, Ang A, Emond JA, Shetty N, Arab L. Timing of
energy intake during the day is associated with the risk of obesity in adults. J
Hum Nutr Diet. 2014;27 Suppl 2:255-262.
Page 35
25
20. Greaney ML, Less FD, White AA, et al. College students' barriers and enablers
for healthful weight management: a qualitative study. J Nutr Educ Behav.
2009;41(4):281-286.
21. Guidelines for data processing and analysis of the International Physical
Activity Questionnaire (IPAQ): short and long forms. IPAQ website
http://www.ipaq.ki.se/scoring.pdf. Updated 2005. Accessed December 13th,
2016
22. Raynor HA, Champagne CM. Position of the academy of nutrition and
dietetics: interventions for the treatment of overweight and obesity in adults. J
Acad Nutr Diet. 2016;116(1):129-147.
23. Ogden CL, Carroll MD, Kit BK, Flegal KM. Prevelance of obesity among
adults: United States, 2011-2012. NCHS Data Brief. 2013;131.
24. McCrory MA GT, Bernauer EM, Mole PA. . Evaluation of a new air
displacement plethysmograph for measuring human body composition. Med
Sci Sports Exer. 1995;27(12):1686-1691.
25. Lohman TG, Roche AF, Martorell R. Anthropometric Standardization
Reference Manual. Champaign, IL: Human Kinetics Books; 1988.
26. Dale RA, Jensen LH, Krantz MJ. Comparison of two point-of-care lipid
analyzers for use in global cardiovascular risk assessments. Ann Pharmacother.
2008;42(5):6.
27. Carey M, Markham C, Gaffney P, Boran C, Maher V. Validation of a point of
care lipid analyser using a hospital based reference laboratory. Ir J Med Sci.
2006;175(4):5.
28. Grundy SM, Cleeman JI, Daniels SR, et al. Diagnosis and management of the
metabolic syndrome: an American Heart Association and National Heart,
Lung, and Blood Institute Scientific Statement. Circulation.
2005;112(17):2735-2752.
Page 36
26
29. Flegal, KM, Graubard, BI Williamson, DF, Gail, MH. Excess deaths associated
with underweight, overweight, and obesity. JAMA. 2005;293(15):1861-1867,
30. de Castro J. The time of day of food intake influences overall intake in
humans. J Nutr. 2004;134:8.
31. de Castro JM. The time of day and the proportions of macronutrients eaten are
related to total daily food intake. Br J Nutr. 2007;98(5):1077-1083.
32. Mills JP, Perry CD, Reicks M. Eating frequency is associated with energy
intake but not obesity in midlife women. Obesity (Silver Spring).
2011;19(3):552-559.
33. Wang J, Yeh K. Research on staying up of college students:
an example of students in NCCU. NCCU; 2013.
34. Bo S, Musso G, Beccuti G, et al. Consuming more of daily caloric intake at
dinner predisposes to obesity. A 6-year population-based prospective cohort
study. PLoS One. 2014;9(9):e108467.
35. Andersen GS, Stunkard AJ, Sorensen TI, Petersen L, Heitmann BL. Night
eating and weight change in middle-aged men and women. Int J Obes Relat
Metab Disord. 2004;28(10):1338-1343.
36. Gluck M, Venti C, Salbe A, Krakoff J. Nighttime eating: commonly observed
and related to weight gain in an inpatient food intake study. Am J Clin Nutr.
2008;88:5.
37. Patel SR, Malhotra A, White DP, Gottlieb DJ, Hu FB. Association between
reduced sleep and weight gain in women. Am J Epidemiol. 2006;164(10):947-
954.
38. Byrd-Bredbenner C, Schwartz J. The effect of practical portion size
measurement aids on the accuracy of portion size estimates made by young
adults. J Hum Nutr Diet. 2004;17:6.
Page 37
27
39. Guenther PM, Casavale KO, Reedy J, et al. Update of the Healthy Eating
Index: HEI-2010. J Acad Nutr Diet. 2013;113(4):569-580.
40. Guenther PM, Kirkpatrick SI, Reedy J, et al. The Healthy Eating Index-2010 is
a valid and reliable measure of diet quality according to the 2010 Dietary
Guidelines for Americans. J Nutr. 2014;144(3):399-407.
Page 38
28
Tables
Table 2. T-test of total caloric intake by gender
Mean caloric intake p t
Male 2703.66 .006* 2.822
Female 2021.66
Mean Difference (kcal) -681.99
N= 173
*P<0.05 significance
Table 1. Group proportions
Classifications of Nighttime Eating Nighttime Eaters Non-Nighttime Eaters
N (%) N (%)
Caloric Intake after 8:00PM 155 (89.6%) 18 (10.4%)
Caloric Intake after 9:00PM 133 (76.9%) 40 (23.1%)
Caloric Intake after 10:00PM 94 (54.3%) 79 (45.7%)
Caloric Intake after 11:00PM 66 (38.2%) 107 (61.8%)
Within 4 Hours Sleep 163 (94.2%) 10 (5.8%)
Within 3 Hours Sleep 141 (81.5%) 32 (18.5%)
Within 2 Hours Sleep 108 (62.4%) 65 (37.6%)
Within 1 Hour Sleep 51 (29.5%) 122 (70.5%)
Page 39
29
Table 3. Descriptive Analysis of Participant
Demographics
Mean SD
Age 19.21 1.41 N %
Gender
Male 48 27.75
Female 125 72.25
BMI Status
Underweight 5 2.9
Normal weight 110 63.6
Overweight 27 15.6
Obese 7 4.0
Ethnicity
Caucasian 140 81.40
Hispanic/Latin 16 9.30
Mixed 8 4.65
African American 3 1.74
Asian 4 2.33
Chose Not to Answer 2 1.16
School Year
Freshman 91 52.6
Sophomore 48 27.75
Junior 26 15.03
Senior 8 4.62
Smoking Status
Smoker 31 17.92
Non-Smoker 142 82.08
Page 40
30
Table 4. Descriptive Analysis of Variables of Interest
Na Mean Standard
Deviation
Total Daily Caloric Intake 173 2210.89 1255.56
Male 48 2703.66
Female 125 2021.66
HEI-2010 Total Score 173 67.40 11.59
Body Mass Index 115 23.66 3.73
Body Fat Percentb 116 25.73 9.04
Moderate Physical Activity
Minutes Weekly
150 93.26 68.82
Vigorous Physical Activity
Minutes Weekly
153 103.29 77.28
Sleep Quantity c 173
Adequate sleep 65 (37.57%)
Inadequate sleep 108 (63.43%)
Cigarette Smoking d
Smoker 31 (17.92%)
Non-smoker 142 (82.08%)
Metabolic Syndrome Risk 150
Participants with Zero Risk Factors 75 (50.00%)
Participants with One Risk Factor 52 (34.66%)
Participants with Two Risk Factors 20 (13.33%)
Participants with Three Risk Factors 3 (2.00%)
Participants with Four Risk Factors 0 (0.00%)
aSample size varies for BMI, body fat percent, physical activity minutes, and metabolic
syndrome risk frequency as these participants did not come to the scheduled anthropometric
and/or biochemical assessment appointments or selected CNA on the IPAQ. bBody fat percent obtained from Bod Pod measurement.
cAdequate sleep quantity defined as >7 hours per night and inadequate sleep quantity as <7
hours per night. dSmokers are those defined as having smoked >1000 lifetime cigarettes and non-smokers as
those who have smoked <1000 lifetime cigarettes.
Page 41
31
Table 5. Analysis of Normality of Data
Skewness Kurtosis
N Statistic Std. Error Statistic Std. Error
Age 173 1.499 .185 2.299 .367
Total Daily Caloric Intake 173 1.594 .185 2.884 .367
HEI-2010 Total Score 173 -.730 .185 .252 .367
Body Mass Indexa 115 1.265 .226 2.720 .447
Body Fat Percentb 116 -.096 .225 -.454 .446
Moderate Physical Activity
Minutes Weekly
150 -.038 .198 -1.540 .394
Vigorous Physical Activity
Minutes Weekly
153 -.289 .196 -1.672 .390
aSample size varies for BMI and Body Fat Percent as these participants did not come to the
scheduled anthropometric appointments. bBody fat percent obtained from Bod Pod measurement.
Table 6. Correlations
Total
caloric
intake
HEI-
2010
Total
Score
Age BMI Body
Fat
Percent
Vigorous
Physical
Activity
Minutes
Moderate
Physical
Activity
Minutes
Total caloric
intake
HEI-2010 Total
Score
-.231**
Age .063 .073
BMI .044 -.039 .130
Body Fat Percent -.246** -.080 -.234* .472**
Vigorous
Physical Activity
Minutes
-.096 .218** .052 -.075 -.251**
Moderate
Physical Activity
Minutes
-.105 .043 -.035 -.039 -.109
*Correlation is significant at P<0.05
**Correlation is significant at P<0.01
Page 42
32
Table 8. Total caloric intake difference between groups, controlling for gender and
physical activity level
Categorization of
Nighttime Eating
Nighttime
Eater
Mean(SD)
na=
Non-
Nighttime
Eater
Mean(SD)
n=
df F p η2 p r2
Caloric intake after
10:00PM
2274.89
(1349.57)
n=82
2100.74
(1180.38)
n=66
1 .392 .532 .003 .101
Caloric intake within
2 hours of sleep
2362.07
(1441.00)
n=94
1910.28
(858.82)
n=54
1 4.607 .034* .031 .127
Caloric intake after
9:00PM
2323.87
(1371.28)
n=111
1817.31
(837.29)
n=37
1 2.986 .086 .020 .117
Caloric intake after
8:00PM
2244.71
(1316.36)
n=130
1854.26
(883.17)
n=18
1 .515 .474 .004 .102
Caloric intake within
4 hours of sleep
2231.34
(1298.77)
n=138
1726.44
(798.16)
n=10
1 .912
.341 .006 .105
*P<0.05 significance aSample size varies for physical activity minutes as these participants did not complete or
selected CNA on the IPAQ.
Table 7. Total caloric intake between groups
Categorization
of Nighttime
Eating
Nighttime
Eater
Mean(SD)
n=
Non-
Nighttime
Eater
Mean(SD)
n=
Difference
(kcal)
df F p η2 p r2
Caloric intake
after 10:00PM
2318.46
(1351.17)
n=94
2082.90
(1126.46)
n=79
+235.56 1 1.510 .220 .009 .009
Caloric intake
within 2 hours
sleep
2389.46
(1418.30)
n=108
1913.57
(854.24)
n=65
+476.26 1 6.008 .015* .034 .034
Caloric intake
after 9:00PM
2336.46
(1336.81)
n=133
1793.37
(819.39)
n=40
+543.07 1 5.918 .016* .033 .033
Caloric intake
after 8:00PM
2252.30
(1418.30)
n=155
1854.26
(1418.30)
n=18
+398.04 1 1.627 .204 .009 .009
Caloric intake
within 4 hours
sleep
2240.61
(1418.30)
n=163
1726.44
(1418.30)
n=10
+514.17 1 1.585 .210 .009 .009
*P<0.05 significance
Page 43
33
Table 10. Body fat percent separated by gender and group.
Categorization of
Nighttime Eating
Nighttime
Eater
Non-
Nighttime
Eater
Difference
(%)
P η2 p r2
Caloric intake within 2
hours of sleep
n=75 n=41
Male n=23
(69.69%)
n=10
(30.31%)
-13.10 .001* .321 .321
Female n=52
(62.65%)
n=31
(37.35%)
-2.05 .192 .021 .021
Body fat percent separated by gender and group, and controlling for physical activity.
Male na=20
(71.43%)
n=8
(28.57%)
-16.88 .000* .477 .490
Female n=45
(66.18%)
n=23
(33.82%)
-3.56 .041* .064 .157
Body fat percent separated by gender and group, and controlling for vigorous physical
activity.
Male n=20
(71.43%)
n=8
(28.57%)
-16.99 .000* .477 .481
Female n=45
(66.18%)
n=23
(33.82%)
-2.81 .088 .042 .145
*P<0.05 significance aSample size varies for physical activity minutes as these participants did not complete or
selected CNA on the IPAQ.
Table 9. HEI-2010 total score between nighttime eating groups
Categorization
of Nighttime
Eating
Nighttime
Eater
Mean(SD)
n=
Non-
Nighttime
Eater
Mean(SD)
n=
Difference
(HEI-
2010 total
score)
df F p η2 p r2
Caloric intake
after 10:00PM
64.81
(12.32)
n=94
70.47
(9.88)
n=79
-5.66 1 10.872 .001* .060 .060
Caloric intake
within 2 hours
sleep
65.17
(12.58)
(n=108)
70.08
(8.62)
(n=65)
-5.91 1 11.161 .001* .061 .061
Caloric intake
after 9:00PM
66.29
(12.17)
n=133
71.07
(8.51)
n=40
-4.48 1 5.37 .022* .030 .030
Caloric intake
after 8:00PM
66.95
(11.87)
(n=155)
71.17
(8.12)
(n=18)
-4.21 1 2.147 .145 .012 .012
Caloric intake
within 4 hours
sleep
66.70
(11.92)
(n=166)
74.04
(3.03)
(n=10)
-7.04 1 3.535 .062 .020 .020
*P<0.05 significance
Page 44
34
APPENDICES
APPENDIX A: Review of Literature
Obesity:
Obesity is measured through body mass index (BMI), a BMI greater
than 30kg/m2 is considered an obese status, and a BMI between 25 to 29.9kg/m2
is considered an overweight status 29,31. Currently 60% of the total United States
population is either overweight or obese 31, in college aged students the
prevalence is 35%, which is less than the national prevalence 1. Young adults
are coming from an age group (2-17 year olds) that weighs more than their
ancestors did during those years of life 6.
This is problematic as obesity earlier in life has been found to increase
the risk for chronic diseases in adulthood, including cancers, diabetes,
cardiovascular disease, mobility limitations, and arthritis 21,22,35. College
students have identified many barriers to healthful weight control, including
nighttime eating, social stimulations such as going out to eat, alcohol
consumption, and peer influences that hinder healthful behaviors.
Environmental barriers were also identified, including over availability of food
in dining halls, large portion sizes offered, fast food accessibility, emotional
eating, and lack of time and healthful food options 8,19,26,28.
College-aged students are of interest due to their overall declining health
profile; increased obesity rates in all gender and racial/ethnic groups, decreased
fruit and vegetable intake, and higher levels of sedentary behavior 20,39. In
young adults (18-25 years old), obesity is overshadowed by health risks
Page 45
35
associated with sexual violence or substance abuse and the fact that most
college-aged students do not view themselves at risk for chronic disease later in
life 26. Longitudinal studies have found college students can gain an average of
4.3kg over the traditional four-year length of college and thus are at risk for
weight gain 21.
Nighttime eating:
The literature based definition of nighttime eating is defined as any
caloric intake after 8:00PM or within four hours of sleep onset, 8:00PM has
been defined as the average time of maximum caloric intake for persons without
an eating disorder 3,32,33. Multiple mechanisms may explain nighttime calorie
intake as a predictor for weight gain from increased total caloric intake
9,10,13,15,23,32,33,38. In middle aged shift workers, nighttime calorie intake has
shown to decrease total energy expenditure, with a reduction in resting
metabolic rate (RMR) as the possible mechanism (15). Having a lower relative
RMR may be a predictor to an elevated BMI or increase the risk of future
weight gain 24. During the evening fat oxidation is reduced, this may be another
mechanism related to increased weight gain with nighttime eating 24.
Nighttime eating and sleep duration are correlated 3. Decreased sleep
duration is associated with hormonal disturbances, including decreased leptin
and increased ghrelin 14. These hormonal changes may impact one’s weight
status, as ghrelin increases appetite and leptin reduces appetite 14. Short sleep
duration, linked to nighttime eating, was found to be correlated with emotional
disturbances such as stress and pessimism3,14. These disturbances may decrease
Page 46
36
one’s ability to adhere to dietary and physical activity regiments and thus
impact one’s weight status 3,14.
An increase in total caloric intake related to nighttime calorie intake may
be due to the decreased satiety of late night food consumption, which is known
as the satiety ratio principle 9,10,32. The satiety ratio principle is described as a
decrease in satiety efficiency throughout the day 10. The satiety ratio principle
was demonstrated by de Castro, where an increase in meal time and size
occurred over the progression of the day 10. Additionally, the after-meal interval
decreased, even though more calories had been consumed in the meals. This
study showed that as the day progresses individuals spent more time eating food
and less time in between meals, even though more calories were consumed at
those later meals. This demonstrates that one’s satiety level is not as greatly
impacted with later meals compared to meals consumed earlier in the day 10. It
is also theorized that higher total caloric intake related to nighttime eating may
have an evolutionary basis, in which there are increased opportunities to eat into
the night hours due to technological advances 9,10.
Nighttime eating and total calorie intake:
Nighttime eating has been consistently found to be associated with
increased total daily caloric intake 3,9,10,25,32,33. Over time, higher caloric intake
related to nighttime eating was positively associated with weight gain 2,17. The
evidence for a higher BMI is variable amongst studies, with most finding a
positive association 3,32,38, with the exception of one 33. All researchers had
Page 47
37
examined an adult population, with a mean age of 30; none targeted the college-
aged population 3,9,10,25,32,33.
Wang et al. controlled for confounding variables (gender, age, total
calorie intake, education level, body size, physical activity, and over/under-
reporting) and examined nighttime eating by using the proportion of calories
consumed at meal times to analyze total caloric intake 38. In the study a web
based dietary recall system was used to assess total caloric intake and timing of
intake 38. It was found that those who consumed more than 33% of their total
caloric intake in the evening were twice as likely to be obese 38. It was not
investigated whether the nighttime eaters (>33% total caloric intake between
5:00PM-12:00AM) had higher total daily caloric intakes, but it was found that
participants consuming a higher proportion of their calories during the evening
were more likely to be obese 38.
Wang et al. was not the first to investigate nighttime eating in the
middle-aged population using proportions of energy intake 38, de Castro did as
well 9,10. In de Castro’s studies, it was found that caloric intake was highest
between the hours of 6:00PM-10:00PM after removing calories consumed from
beverages10. These results were then replicated by de Castro and a positive
association was found with and without removal of beverage calories 9.
Additionally, the subjects who engaged in nighttime eating had a higher total
caloric intake compared to those who did not eat at nighttime 9,10.
Page 48
38
Nighttime eating and BMI:
Repeated positive associations between nighttime eating and BMI have
been found 3,32,38, additionally nighttime eaters have been found to gain more
weight over time than non-nighttime eaters 2,17. Gluck measured participants at
a 3.4 (± 1.8) year follow-up visit, and found significant weight gain in nighttime
eaters 17. As part of an 11-year prospective study, Andersen et al. found an
association between nighttime eating and weight gain in individuals who
previously had a higher BMI 2. Reid et al. found that eating one’s last meal later
in the day and eating closer to sleep onset were associated with greater total
caloric intake, though there were no correlations were found with meal timing
and BMI 33. This may be related to the lower BMI of the sample, not controlling
for sleep duration, or not distinguishing reliable reporters from the general
sample 17,33. Additionally, even though no relationship was found over time
higher caloric intake may lead to weight gain 17,33.
Other studies have previously found an association between nighttime
eating, total calorie intake and BMI when controlling for sleep duration 3,32.
Wang et al. found significance between total caloric intake and BMI, with the
reliable reporters identified by doubly labeled water 38. As weight gain is a
concern for the college-aged population, and nighttime eating has been
identified by students as a barrier to weight management this was a novel
association to investigate in this age group.
Page 49
39
Nighttime eating and diet quality:
Investigations into a relationship between nighttime eating and diet
quality are limited and contradicting 3,38. Diet quality is the total measure of
high quality eating patterns in a diet, such as higher fruit and vegetable and
lower processed food intake 3,36. Total caloric intake has primarily been
examined in nighttime eating studies, while research on diet quality has been
overlooked 9,10.Wang et al. found no association in the percentage of calories
from fat, protein, or carbohydrate, grams of fiber, and servings of fruits or
vegetables per a day between participants who consumed <30% of their total
calories in the evening (or any meal period) and those who consumed >30% of
kcals in evening 38. Reid and Baron found that middle aged late sleepers had
later meal timings for breakfast, lunch, dinner, and last meal, and poorer diet
quality, which was defined as increased intake of sugar sweetened beverages
and fast food 3.
Further investigations into possible relationships between nighttime
eating and diet quality are needed. An association may exist for a later defined
meal eating time, as Reid and Baron examined nighttime eating in the
parameters of caloric consumption after 8:00PM or within four hours before
sleep, whereas Wang used between 5:00PM-12:00AM as cutoff points 3,32,33,38.
Breakfast consumption is often coupled with having a robust diet quality
and is a preventative factor for weight gain 37. Breakfast skipping is associated
with weight gain, poor diet quality, and shifting caloric intake to later in the day
4,15,38. Baron et al. looked at nighttime eating in late and non-late sleepers and
Page 50
40
found no significant difference in outcomes for those who did or did not
consume breakfast 33. A study done in the Mediterranean on 520 adults
averaging 41 years old found that nighttime eaters frequently skipped breakfast
15, whereas Bo et al. found 76% of nighttime eaters consumed breakfast 4. The
variability of findings for relationships between nighttime eating and breakfast
consumption warrant further investigation, furthermore most research designs
focus on the younger school age population for breakfast consumption studies
38.
Nighttime eating and sleep quality:
It has been continuously found that adolescent late sleepers, compared to
non-late sleepers, had a poorer diet quality 11,16,18,34. Additionally, caloric
consumption after 8:00PM was found to be associated with a later sleeping
time, shorter sleep duration, and elevated BMI 3. Those with a short sleep
duration, less than 7 hours of sleep, have a greater likelihood of being obese or
experiencing weight gain 2,12,14. Gangwisch examined epidemiological data on
all age groups and found short sleep duration was associated with weight gain
and obesity, decreased leptin and increased ghrelin levels, and emotional
disturbances, including stress and pessimism 14. A 16-year prospective study on
middle aged women found a shorter sleep duration increased the relative risk for
modest weight gain and obesity in middle-aged persons 30. Correlations were
also found among elevated BMI and later sleep timing 3,18, consumption of
calories after 8:00PM, increased fast food consumption, and shorter sleep
duration 3.
Page 51
41
Late sleepers had a higher caloric intake after 8:00PM compared to those
who did not sleep as late, but not higher total daily caloric intake 3,32. There
were correlations found between higher caloric intake after 8:00PM and a
higher total daily caloric intake, shorter sleep duration, and later sleep timing 3.
These interactions between nighttime eating, higher total caloric intake and
problematic sleep patterns in middle aged individuals, highlighted the
importance to investigate this association in college-aged students.
Reid and Baron have found such novel associations related to sleep
patterns that they examined nighttime eating based on closeness of consumption
to sleep onset and total daily caloric intake, rather than using meal times 33.
Sleep timing was measured by utilizing wrist actigraphy data 33. Eating closer to
sleep onset was found to be associated with higher total daily caloric intake 3,33,
this strengthens their previous findings that nighttime consumption and higher
total caloric intake are associated in middle aged adults. Unfortunately, physical
activity was not controlled for in either study, which impacts sleep patterns and
calorie intake 3,33. When examining adolescents (9 to 16-year-olds), Golley
found correlations between sleep timing, diet quality, and BMI z-score 18. These
correlations were found with or without controlling for physical activity, energy
intake, and sleep duration 18.
Nighttime eating and MetS:
Due to high rates of overweight/obesity and MetS the college-aged
population is at risk for developing chronic diseases in adulthood, including
diabetes mellitus and cardiovascular risk 27. Being either overweight and obesity
Page 52
42
increases the number of MetS criteria in college age men and women 27. MetS is
a group of disorders that puts one at risk for chronic disease, including
cardiovascular disease. Criteria for MetS includes having three or more of the
following risk factors: elevated abdominal obesity measured in waist
circumference, blood lipid panel (TAG, HDL), blood pressure, and insulin
resistance in blood glucose levels 27.
One study examined MetS in three colleges located in various regions in
the United States 27. It was found that 9.9-12% men and 3-6% women had three
MetS risk factors, 26,27, and 77% of the college-aged students had one criterion
of MetS 27. Lower physical activity was associated with an increased risk for
being over-fat, having increased abdominal obesity, and meeting the criteria for
the definition of MetS in these college students 26. To our knowledge there has
been no research specially examining nighttime eating and MetS in the college
aged population, making this is a novel association.
Page 53
43
APPENDIX B: Methods timeline
*Week number correlates to university semester schedule.
Page 54
44
APPENDIX C: Consent Forms
Consent Form Valid 12/15/2015-1/7/2017
Page 56
46
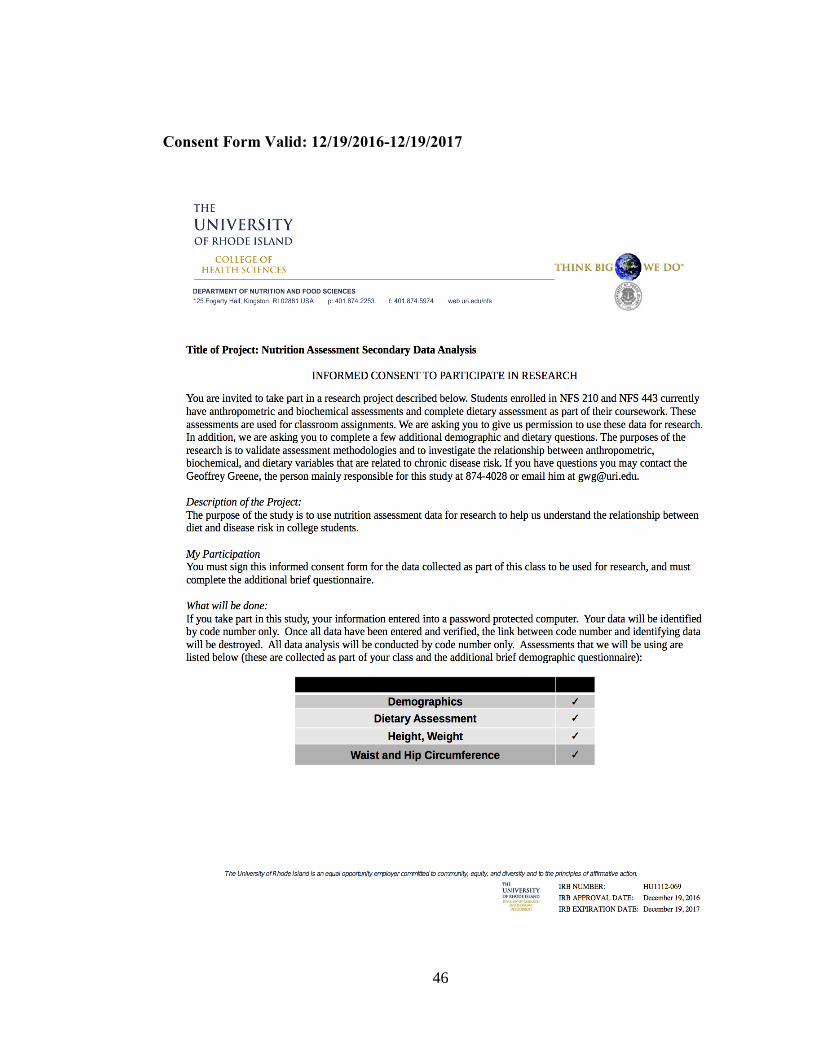
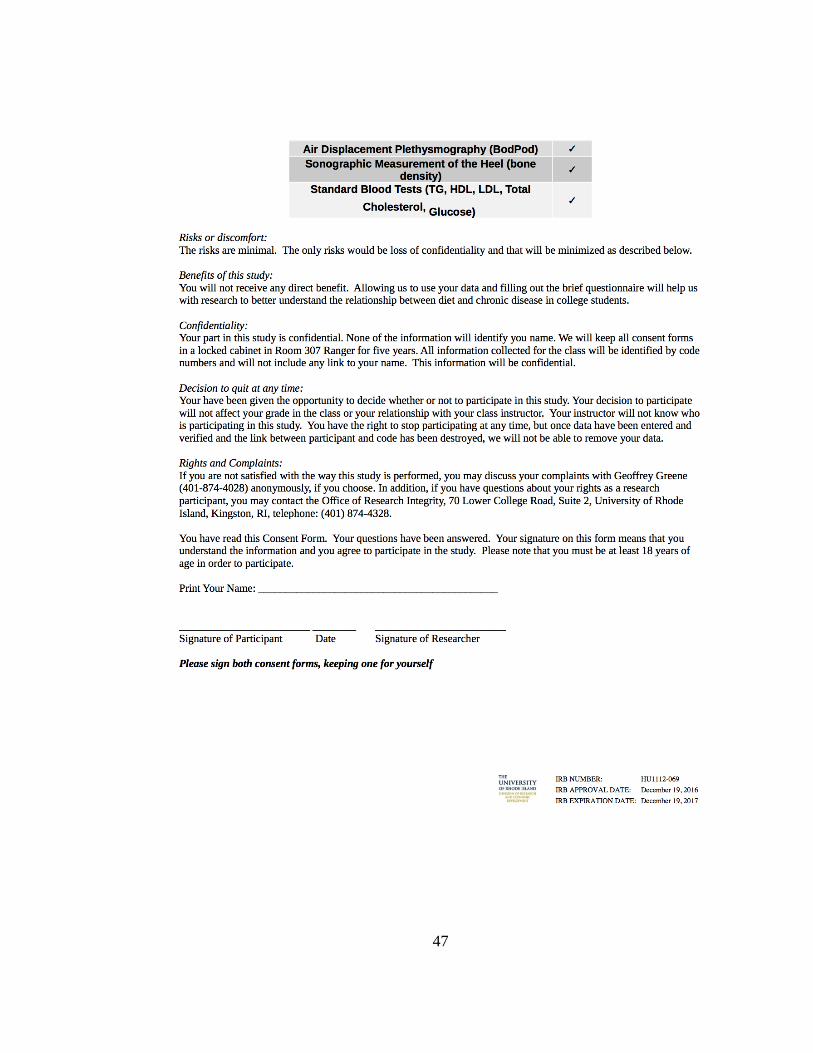
Consent Form Valid: 12/19/2016-12/19/2017
Page 58
48
APPENDIX D: Nutrition Assessment Survey
NAS STARTS 1. What is your age? Less than 18 years
18 years
19 years
20 years
21 years
22 years
23 years
24 years
25 years
26 years
27 years
28 years
29 years
30 years
31 years
32 years
33 years
34 years
35 years
36 years
37 years
38 years
39 years
40 years
41 years
42 years
43 years
44 years
45 years
46 years
47 years
48 years
49 years
50 years
51 years
52 years
53 years
54 years
55 years
56 years
57 years
58 years
59 years
60 or more years
Page 59
49
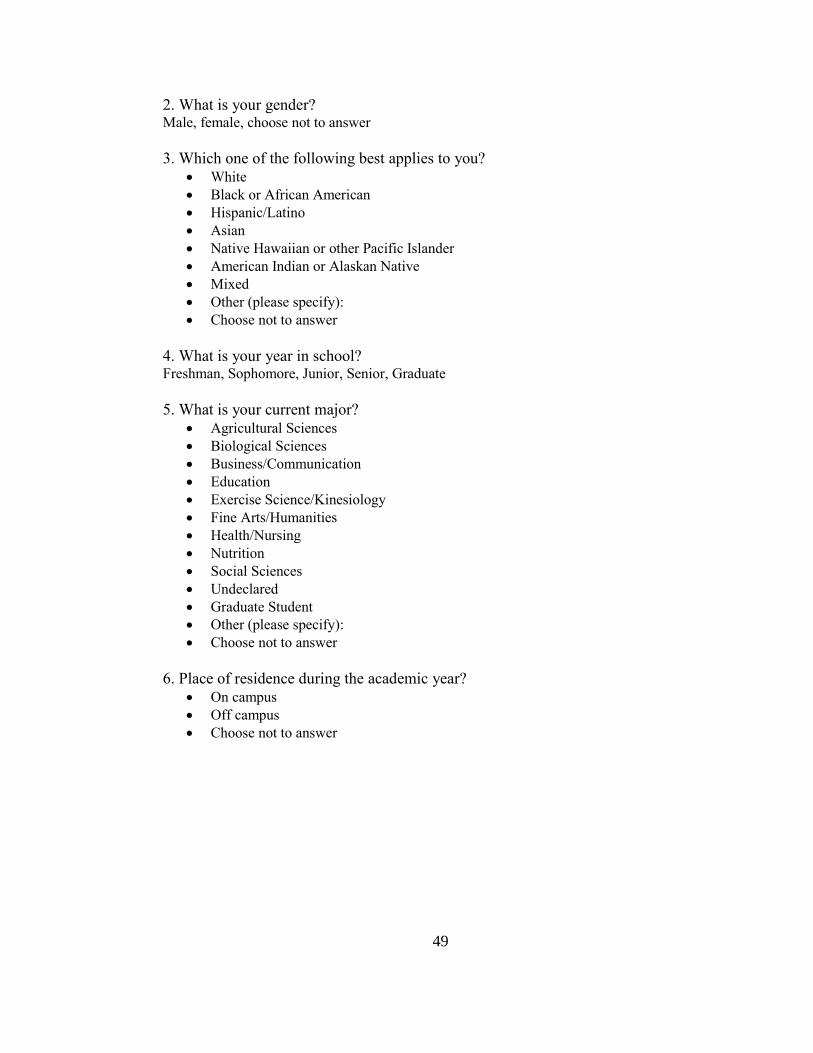
2. What is your gender? Male, female, choose not to answer
3. Which one of the following best applies to you?
White
Black or African American
Hispanic/Latino
Asian
Native Hawaiian or other Pacific Islander
American Indian or Alaskan Native
Mixed
Other (please specify):
Choose not to answer
4. What is your year in school? Freshman, Sophomore, Junior, Senior, Graduate
5. What is your current major?
Agricultural Sciences
Biological Sciences
Business/Communication
Education
Exercise Science/Kinesiology
Fine Arts/Humanities
Health/Nursing
Nutrition
Social Sciences
Undeclared
Graduate Student
Other (please specify):
Choose not to answer
6. Place of residence during the academic year?
On campus
Off campus
Choose not to answer
Page 60
50
7. Green Eating is: Eating locally grown foods, limited amounts of processed/fast
foods, eating meatless meals at least one day per week, choosing organic foods as
much as possible, and only taking what you plan on eating.
Are you a green eater?
No, and I do not intend to start within the next 6 months
No, but I am thinking about becoming a green eater within the next 6 months
No, but I am planning on becoming a green eater within the next 30 days
Yes, I am a green eater and have been for less than 6 months
Yes, I am a green eater and have been doing so for 6 months or more
I choose not to answer
8. Which of the following best describes the MAJORITY of your meals during the
academic year?
I eat meals prepared at home.
I purchase frozen or ready-to-eat meals
I eat at dining halls/restaurants
I get fast food/take-out
Choose not to answer
9. Do you have a campus meal plan?
Yes
No
Choose not to answer
F1all 2011
10. What is your usual rate of eating? Very Slow Medium Fast Very fast Choose not to
slow answer
1 2 3 4 5 6
11. Do you experience abdominal discomfort such as cramping, bloating, or excess
gas? (this refers to gastrointestinal discomfort, NOT menstrual discomfort)
Never or very seldom
Seldom, less than once per month
Occasionally, a few times per month
Fairly often, once or twice per week
Very often, several times per week or daily
Choose not to answer
Page 61
51
12. If you experience abdominal discomfort, how severe is it?
I do not experience abdominal discomfort
Very mild –not very noticeable
Moderate – noticeable but not too bad
Somewhat uncomfortable – it’s kind of bad, but manageable
Very uncomfortable – I cannot carry out my normal activities
Choose not to answer
13. Please select the answer that BEST describes your usual behavior. Barely
ever to
never
Rarely
(25%)
Sometimes
(50%)
Often
(75%)
Almost
always Choose
Not to
Answer - Locally grown
foods are grown
within 100 miles
of your location.
Based on this,
how often do you
eat locally grown
foods?
o o o o o
- When in season,
how often do you
shop at farmer’s
markets?
o o o o o
- How often do
you choose foods
that are labeled
certified organic?
o o o o o
- How often do
you select meats,
poultry, and dairy
products that are
raised without
antibiotics or
hormones?
o o o o o
- How often do
you select food or
beverages that are
labeled fair trade
certified?
o o o o o
- How often do
you buy meat or
poultry products
labeled "free
range" or "cage
free"?
o o o o o
Page 62
52
14. Have you smoked at least 100 cigarettes in your entire life? (NOTE: 5 packs =
100 cigarettes)
Yes
No
I choose not to answer
15. Do you NOW smoke cigarettes every day, some days, or not at all?
Every day
Some days
Not at all
I choose not to answer
16. What would you like to weigh in pounds? ________ Put CNA if you choose not
to answer
17. How would YOU describe your current weight?
Very underweight
Slightly underweight
About the right weight
Slightly overweight
Very overweight
I choose not to answer
18. How do you feel about your current weight?
I am happy with my current weight
I don’t care about my current weight
I am upset about my current weight
Choose not to answer
19. On average, how many hours of sleep do you get in a 24-hour period? Think
about the time you actually spent sleeping or napping, not just the amount of sleep you
think you should get. How many hours do you usually get each day and night?
1 hour or less
2 hours
3 hours
4 hours
5 hours
6 hours
7 hours
8 hours
9 hours
10 hours or more
Choose not to answer
20. Are you often sleepy during the day? (yes or no – choose not to answer)
Page 63
53
21. Do you frequently wake up during the time you are asleep? (yes or no - choose
not to answer
22. How would you evaluate the quality of your sleep? (not impaired, moderately
impaired, severely impaired - choose not to answer)
What is your usual bed time?
Before 9:00 PM
9:00 PM
10:00 PM
11:00 PM
12:00 AM
1:00 AM
2:00 AM
3:00 AM
4:00 AM
After 4:00 AM
How many hours before bed do you usually eat your last meal or snack?
<1 hour
1 hour
2 hour
3 hour
4 hour
5 hour
6 hour
>6hours
How many days a week do you usually eat breakfast?
0
1
2
3
4
5
6
7
Choose not to answer
Page 64
54
23. Stress management includes regular relaxation and physical activity, talking with
others and/or making time for social activities.
Do you effectively practice stress management in your daily life?
No, and I do NOT intend to in the next 6 months
No, but I intend to in the in the next 6 months
No, but I intend to in the next 30 days
Yes, but I have been for LESS than 6 months
Yes and I have been for MORE than 6 months
I choose not to answer
END NAS
Page 65
55
APPENDIX E: International Physical Activity Questionnaire
Page 68
58
APPENDIX F: Dietary History Questionnaire II
A. Further detailed information can be found on the DHQ II at:
https://epi.grants.cancer.gov/dhq2/about/
Page 69
59
APPENDIX G: Biochemical measurement document
Page 70
60
APPENDIX H: Anthropometric instructional document
NFS 210 Applied General Nutrition
Instructions for Preparation for Anthropometric and Bone Density Measurements
Name __________________________________________ Lab Section___________________
Appointment Day/Time____________________________
Come to Fogarty Hall room 105 at your scheduled time for the following measurements and tests.
• Height
• Weight
• Waist and hip circumference
• Body composition – BOD POD
• Bone density – Bone Ultrasonometer
Instructions for Preparation
Do not eat or exercise within 2 hours prior to the appointment. Come well-hydrated but don’t drink large amounts of fluid within 2 hours prior to the appointment.
Specific instructions for preparation for BOD POD testing
The surface area of clothing and hair can have a significant impact on volume measurements. For accurate
results, it is important that you wear minimal, form-fitting clothing. If possible, wear the following recommended clothing under your outer clothing to cut down on time needed for changing.
For MALES, recommended clothing is either:
(1) Form-fitting Speedo® or other Lycra®/spandex-type swim suit; or
(2) Single-layer compression shorts (only shorts without padding)
For FEMALES, recommended clothing is either:
(1) Form-fitting Speedo® or other Lycra®/spandex-type swim suit; or
(2) Single-layer compression shorts (only shorts without padding) and single-layer (not padded) jog bra.
You should not wear any other article of clothing except for what is specified above (i.e. jewelry, socks,
eyeglasses, etc.).
During the volume measurements that are part of a body composition test, you must wear a swim cap (this will be provided). It is also important that all of your hair is in the swim cap and any air pockets under the cap are
pushed out. Even people with very little hair should wear the swim cap during testing. Deviations from this protocol will likely result in invalid results.
If necessary, prior to a body composition test, you should use the restroom.
Cell phones should not be used while the BOD POD is in operation.
If you have any questions or concerns about any of these procedures, discuss it with your instructor.
If you miss your appointment without a valid university-approved excuse, you will lose lab points.
Page 71
61
APPENDIX I: Anthropometric assessment document
\
Page 72
62
APPENDIX J: HEI-2010 Total Score Export Information
Page 75
65
APPENDIX K: HEI-2010 Scoring Guide
Page 76
66
APPENDIX L: Table of Potential Pitfalls Identified in Thesis Proposal
Potential Pitfalls of Study Outcomes and Solutions to Address Concerns
Pitfall Solution
Total sample categorized as
nighttime eaters, defined as caloric
intake within 4 hours of sleep onset
or after 8:00PM 3,5,32,33.
Alter definition to only capture those consuming
calories within two or one hour(s) of sleep onset,
or examine the cutoff point as 9:00, 10:00PM, or
later as needed, for nighttime eating
categorization.
Entire sample categorized as non-
nighttime eaters, defined as no
caloric intake within 4 hours of sleep
onset or after 8:00PM.
Alter definition to capture those consuming
calories within five or six hours of sleep onset, or
examine the cutoff point as 8:00, 7:00PM, or
earlier as needed, for nighttime eating
categorization.
Accuracy of self-reported FFQ, the
DHQ 38.
The nutrition course material includes portion
estimation lessons, this population enrolled in this
general nutrition course has more background to
estimate portion sizes than a lay person. The DHQ
is not administered until the 10th week of the
academic semester, therefore they have had 10
weeks of exposure to general nutrition information
at a college level, and short term portion size
lessons have been shown to increase the accuracy
of college-aged students’ portion size estimates 7.
Measured variables (biochemical and body fat
percentage) would be more heavily weighted if
dietary data is deemed unreliable.
Accuracy of human measured height
and weight to calculate BMI to assess
body composition.
Height and weight measures are obtained by
trained undergraduate teaching assistants under the
supervision of a graduate teaching assistant. Body
fat percentage was also measured using the
BodPod and can be used as an alternative to BMI 29,31.
Total sample are breakfast
consumers, defined as more than or
equal to 3 days of breakfast intake 33.
Categorize breakfast consumers as those
consuming breakfast as those consuming at least
one day of breakfast intake
Total sample are breakfast skippers,
defined as less than or equal to 3 days
of breakfast intake
Categorize breakfast skippers as those consuming
breakfast on 0 days 4.
Page 77
67
Appendix M: Table of Actions Taken to Manage Potential Pitfalls Identified in Thesis
Proposal
Actions Taken to Manage Potential Pitfalls of Study Outcomes Identified in Thesis
Proposal Pitfall Solution Action
Total sample categorized
as nighttime eaters,
defined as caloric intake
within 4 hours of sleep
onset or after 8:00PM 3,5,32,33.
Alter definition to only capture
those consuming calories within
two or one hour(s) of sleep onset,
or examine the cutoff point as
9:00, 10:00PM, or later as
needed, for nighttime eating
categorization.
Nighttime eating definition
was altered after computed
in multiple ways after
determining the most
statistically and dietary
significant categorizations.
Entire sample categorized
as non-nighttime eaters,
defined as no caloric
intake within 4 hours of
sleep onset or after
8:00PM.
Alter definition to capture those
consuming calories within five or
six hours of sleep onset, or
examine the cutoff point as 8:00,
7:00PM, or earlier as needed, for
nighttime eating categorization.
No action taken, pitfall did
not occur.
Accuracy of self-reported
FFQ, the DHQ 38.
The nutrition course material
includes portion estimation
lessons, this population enrolled
in this general nutrition course
has more background to estimate
portion sizes than a lay person.
The DHQ is not administered
until the 10th week of the
academic semester, therefore
they have had 10 weeks of
exposure to general nutrition
information at a college level,
and short term portion size
lessons have been shown to
increase the accuracy of college-
aged students’ portion size
estimates 7. Measured variables
(biochemical and body fat
percentage) would be more
heavily weighted if dietary data
is deemed unreliable.
Interpret results cautiously;
recommend future studies
utilize 24-hour dietary
recall methods and
determine true reporters of
dietary intake by
measuring energy
expenditure via indirect
calorimetry to calculate
caloric capacity 9,10.
Accuracy of human
measured height and
weight to calculate BMI
to assess body
composition.
Height and weight measures are
obtained by trained
undergraduate teaching assistants
under the supervision of a
graduate teaching assistant. Body
fat percentage was also measured
using the BodPod and can be
used as an alternative to BMI 29,31.
Utilized BodPod data in
addition to BMI.
Page 78
68
Total sample are
breakfast consumers,
defined as more than or
equal to 3 days of
breakfast intake 33.
Categorize breakfast consumers
as those consuming breakfast as
those consuming at least one day
of breakfast intake
No action taken, pitfall did
not occur.
Total sample are
breakfast skippers,
defined as less than or
equal to 3 days of
breakfast intake
Categorize breakfast skippers as
those consuming breakfast on 0
days 4.
No action taken, pitfall did
not occur.
Page 79
69
BIBLIOGRAPHY
Alkerwi A, Baydarlioglu B, Sauvageot N, et al. Smoking status is inversely
associated with overall diet quality: Findings from the ORISCAV-LUX study.
Clin Nutr. 2016.
American College Health Association. American College Health Association-
National College Health Assessment II: Reference Group Executive Summary
Spring 2016 2016:21.
Andersen GS, Stunkard AJ, Sorensen TI, Petersen L, Heitmann BL. Night eating
and weight change in middle-aged men and women. Int J Obes Relat Metab
Disord. 2004;28(10):1338-1343.
Baron KG, Reid KJ, Kern AS, Zee P. Role of sleep timing in caloric intake and
BMI. Obesity (Silver Spring). 2011;19(7):1374-1381.
Bo S, Musso G, Beccuti G, et al. Consuming more of daily caloric intake at dinner
predisposes to obesity. A 6-year population-based prospective cohort study. PLoS
One. 2014;9(9):e108467.
Boston RC, Moate PJ, Allison KC, Lundgren JD, Stunkard AJ. Modeling circadian
rhythms of food intake by means of parametric deconvolution: results from studies
of the night eating syndrome. Am J Clin Nutr. 2008;87:5.
Burke JD, Reilly RA, Morrell JS, Lofgren IE. The University of New Hampshire's
Young Adult Health Risk Screening Initiative. J Am Diet Assoc.
2009;109(10):1751-1758.
Byrd-Bredbenner C, Schwartz J. The effect of practical portion size measurement
aids on the accuracy of portion size estimates made by young adults. J Hum Nutr
Diet. 2004;17:6.
Cluskey M, Grobe D. College weight gain and behavior transitions: male and
female differences. J Am Diet Assoc. 2009;109(2):325-329.
Page 80
70
de Castro J. The time of day and the proportions of macronutrients eaten are
related to total daily food intake. British Journal of Nutrition. 2007;98:6.
de Castro J. The Time of Day of Food Intake Influences Overall Intake in Humans.
J Nutr. 2004;134:8.
Fleig D, Randler C. Association between chronotype and diet in adolescents based
on food logs. Eat Behav. 2009;10(2):115-118.
Ford ES, Li C, Wheaton AG, Chapman DP, Perry GS, Croft JB. Sleep duration
and body mass index and waist circumference among U.S. adults. Obesity (Silver
Spring). 2014;22(2):598-607.
Galgani J, Ravussin E. Energy metabolism, fuel selection and body weight
regulation. Int J Obes (Lond). 2008;32 Suppl 7:S109-119.
Gangwisch JE. Epidemiological evidence for the links between sleep, circadian
rhythms and metabolism. Obes Rev. 2009;10 Suppl 2:37-45.
Garaulet M, Gomez-Abellan P, Alburquerque-Bejar JJ, Lee YC, Ordovas JM,
Scheer F. Timing of food intake predicts weight loss effectiveness. Int J Obes
(Lond). 2013;37(4):604-611.
Giannotti F, Cortesi F, Sebastiani T, Ottaviano S. Circadian preference, sleep and
daytime behaviour in adolescence. J Sleep Res. 2002;11:8.
Gluck M, Venti C, Salbe A, Krakoff J. Nighttime eating: commonly observed and
related to weight gain in an inpatient food intake study. Am J Clin Nutr. 2008;88:5.
Golley RK, Maher CA, Matricciani L, Olds TS. Sleep duration or bedtime?
Exploring the association between sleep timing behaviour, diet and BMI in
children and adolescents. Int J Obes (Lond). 2013;37(4):546-551.
Greaney ML, Less FD, White AA, et al. College students' barriers and enablers for
healthful weight management: a qualitative study. J Nutr Educ Behav.
2009;41(4):281-286.
Page 81
71
Greene GW, Schembre SM, White AA, et al. Identifying clusters of college
students at elevated health risk based on eating and exercise behaviors and
psychosocial determinants of body weight. J Am Diet Assoc. 2011;111(3):394-400.
Gropper SS, Simmons KP, Connell LJ, Ulrich PV. Weight and Body Composition
Changes during the First Three Years of College. J Obes. 2012;2012:634048.
Houston DK, Ding J, Nicklas BJ, et al. Overweight and obesity over the adult life
course and incident mobility limitation in older adults: the health, aging and body
composition study. Am J Epidemiol. 2009;169(8):927-936.
Kinsey AW, Ormsbee M. The health impact of nighttime eating: old and new
perspectives. Nutrients. 2015;7(4):2648-2662.
Koebnick C, Smith N, Huang K, et al. OBAYA (obesity and adverse health
outcomes in young adults): feasibility of a population-based multiethnic cohort
study using electronic medical records. Population Health Metrics. 2012;10(15):8.
Mills JP, Perry CD, Reicks M. Eating frequency is associated with energy intake
but not obesity in midlife women. Obesity (Silver Spring). 2011;19(3):552-559.
Morrell JS, Byrd-Bredbenner C, Quick V, Olfert M, Dent A, Carey G. Metabolic
syndrome: comparison of prevalence in young adults at 3 land-grant universities. J
Am Coll Health. 2014;62(1):10.
Morrell JS, Lofgren IE, Burke J, Reilly R. Metabolic syndrome, obesity, and
related risk ractors among college men and women. J Am Coll Health.
2012;60(1):9.
Nelson MC, Story M. Food environments in university dorms: 20,000 calories per
dorm room and counting. Am J Prev Med. 2009;36(6):523-526.
Ogden CL, Carroll MD, Kit BK, Flegal KM. Prevelance of obesity among adults:
United States, 2011-2012. NCHS data brief 2013;131.
Page 82
72
Patel SR, Malhotra A, White DP, Gottlieb DJ, Hu FB. Association between
reduced sleep and weight gain in women. Am J Epidemiol. 2006;164(10):947-954.
Raynor HA, Champagne CM. Position of the Academy of Nutrition and Dietetics:
Interventions for the Treatment of Overweight and Obesity in Adults. J Acad Nutr
Diet. 2016;116(1):129-147.
Reid KJ, Baron KG, Horn LV, Zee P. Contribution of evening macronutrient
intake to total caloric intake and body mass index. Appetite. 2013;60(1):246-251.
Reid KJ, Baron KG, Zee PC. Meal timing influences daily caloric intake in healthy
adults. Nutr Res. 2014;34(11):930-935.
Sato-Mito N, Sasaki S, Murakami K, et al. The midpoint of sleep is associated
with dietary intake and dietary behavior among young Japanese women. Sleep
Med. 2011;12(3):289-294.
Services. USDoHaH. The Surgeon General’s Call to Action to Prevent and
Decrease Overwt and Obesity. US Department of Health and Human Services
Public Health Service. 2001:39.
Vadiveloo M, Dixon LB, Mijanovich T, Elbel B, Parekh N. Dietary variety is
inversely associated with body adiposity among US adults using a novel food
diversity index. J Nutr. 2015;145(3):555-563.
van der Heijden AA, Hu FB, Rimm EB, van Dam RM. A Prospective Study of
Breakfast Consumption and Weight Gain among U.S. Men. Obesity (Silver
Spring). 2007;15:6.
Wang JB, Patterson RE, Ang A, Emond JA, Shetty N, Arab L. Timing of energy
intake during the day is associated with the risk of obesity in adults. J Hum Nutr
Diet. 2014;27 Suppl 2:255-262.
Winklebey MA, Cubbin C. Changing patterns in health behaviors and risk factors
related to chronic diseases, 1990–2000. Behavior Change 2004;19(1):8.