144
Assuring dairy cattle welfare Towards efficient assessment and improvement Marion de Vries

Assuring dairy cattle welfare
Towards efficient assessment and improvement
Marion de Vries

Thesis committee
Promotor
Prof. dr. ir. I.J.M. de Boer
Professor of Animal Production Systems
Wageningen University
Co-promotors
Dr. ir. E.A.M. Bokkers
Assistant professor, Animal Production Systems
Wageningen University
Dr. T. Dijkstra
Cattle health specialist, Animal Health Service, Deventer
Other members
Prof. dr. ir. B. Kemp, Wageningen University
Prof. dr. M. Nielen, Utrecht University
Dr. ir. C.G. van Reenen, Wageningen UR Livestock research
Dr. I. Veissier, Institut National de la Recherche Agronomique, France
This research was conducted under the auspices of the Graduate School of Wageningen Institute of Animal Sciences (WIAS)

Assuring dairy cattle welfare
Towards efficient assessment and improvement
Marion de Vries
Thesis
submitted in fulfilment of the requirements for the degree of doctor
at Wageningen University
by the authority of the Rector Magnificus
Prof. dr. M.J. Kropff,
in the presence of the
Thesis Committee appointed by the Academic Board
to be defended in public
on Tuesday 18 June 2013
at 1.30 p.m. in the Aula.

De Vries, Marion
Assuring dairy cattle welfare. Towards efficient assessment and improvement.
PhD thesis, Wageningen University, The Netherlands (2012).
With references, with summaries in English and in Dutch.
ISBN: 978-94-6173-566-9

It is not enough to study animal welfare;
our responsibility is to promote it
- A.J.F. Webster –


Abstract
In many countries, there is an increasing interest to assure the welfare of production animals. On-farm assessment of dairy cattle welfare, however, is time-consuming and, therefore, expensive. Besides this, effects of housing and management interventions that are aimed at improving welfare can be conflicting for different indicators of dairy cattle welfare. The research described in this thesis aimed to contribute to assurance of dairy cattle welfare by evaluating strategies to improve time-efficiency of welfare assessment and by identifying housing and management interventions for welfare improvement. Results presented are based on an observational study among 194 selected Dutch dairy herds. From these herds, data relating to housing, management, and indicators of the Welfare Quality (WQ) protocol for dairy cattle was collected on-farm, and routine herd data (RHD), relating to demography, management, milk production, milk composition, and fertility, was extracted from several national databases. Because in many countries RHD are regularly collected from dairy farms, it was hypothesized that RHD could be used to identify herds with potentially poor animal welfare and, therefore, reduce the number of on-farm assessments that are needed to identify these herds. Results of the literature review showed that variables of RHD have been associated with almost half of the welfare indicators in the WQ protocol for dairy cattle. When RHD and welfare data collected in the observational study were used to evaluate the value of RHD for predicting dairy cattle welfare at the herd level, predictions based on RHD for welfare indicators varied from less to highly accurate. For most welfare indicators, therefore, RHD can serve as a pre-screening test for detecting herds with poor welfare and reduce the number of on-farm assessments. In order to decide whether a herd should be visited following a pre-screening, however, value judgments about the overall welfare of herds need to be made. This requires combining welfare indicators in an overall score that reflects the multidimensional nature of welfare and the relative importance of indicators. The relative importance of indicators was evaluated for welfare classification of our study herds based on the WQ multicriteria evaluation model. Results showed that a limited number of indicators had a strong influence on classification of herds, and classification was not very sensitive to indicators of good health, such as prevalence of severely lame cows. As a different strategy for improving time-efficiency of welfare assessment, reduction of the time per on-farm assessment of the WQ protocol for dairy cattle was explored. Reduction of on-farm assessment time was simulated by omitting welfare indicators from the WQ protocol, and replacing observed values of omitted indicators by predictions based on remaining welfare indicators in the protocol. Because results showed that agreement between predicted and observed values of indicators was poor to moderate, it was concluded that this strategy has little potential to reduce on-farm assessment time. To contribute to knowledge of housing and management interventions that may lead to improvement of dairy cattle welfare, housing and management factors associated with various indicators in the WQ protocol were identified and compared. Surface of the lying area and pasturing in summer were commonly associated with the prevalence of lameness, lesions or swellings, and dirty hindquarters, but no common risk factors were identified for the average frequency of displacements and other welfare indictors. In conclusion, the present work shows that routine herd data can be used to improve time-efficiency of welfare assessment, whereas replacing welfare indicators by predictions based on other welfare indicators cannot. The WQ multicriteria evaluation model for classification of dairy cattle welfare has limitations in its current form. A softer surface of the lying area and pasturing in summer can enhance simultaneous improvement of multiple welfare indicators.


Table of contents
Chapter 1 General introduction 1
Chapter 2 Associations between variables of routine herd data and dairy cattle welfare indicators
9
Chapter 3 Exploring the value of routinely collected herd data for estimating dairy cattle welfare
33
Chapter 4 Evaluating results of the Welfare Quality multicriteria evaluation model for classification of dairy cattle welfare at the herd level
55
Chapter 5 Assessment time of the Welfare Quality protocol for dairy cattle
69
Chapter 6 Housing and management factors associated with indicators of dairy cattle welfare
83
Chapter 7 General discussion 103
Summary 116
Samenvatting 120
Curriculum vitae 124
Publications 125
Education certificate 127
Dankwoord 128
Colophon 131


2 Chapter 1
Worldwide, there is an increasing interest to assure the welfare of production animals (Bracke, 2009; Thornton, 2010; Bayvel et al., 2012). Especially in Western societies, this interest is driven by an increased public concern for animal welfare, which has evolved from changing socio-cultural values (Verbeke and Viaene, 2000; European Commission, 2007a). The increasing interest for assuring animal welfare is a driver for changes along livestock production chains. The World Organisation for Animal Health, for example, has drawn up international standards for specific issues, such as animal transport (OIE, 2012). In Europe, animal welfare legislation has led to, for example, a ban on crates for veal calves in 2007, a ban on conventional battery cages for laying hens in 2012, and minimum space allowances for different livestock species (e.g. EU, 1997a, b, 1999). Although mainly focussed on welfare of intensively kept livestock, public concerns also apply to dairy cattle (European Commission, 2007b). In the private sector, these concerns have led to an increasing number of agribusiness companies (e.g. McDonald’s Corporation, 2004; Marks and Spencer Group plc, 2010) starting programmes to assure their customers of a certain standard animal welfare in the production of the food products they sell (Fraser, 2006; Blokhuis et al., 2008). Point of origin regarding animal welfare Animal welfare knows many definitions, e.g. ‘the state of an individual as regards its attempts to cope with its environment’ (Broom, 1986) or ‘fit and feeling good’ (Webster, 2005). These definitions illustrate that animal welfare is a multidimensional concept (Fraser, 1995). The definition ‘fit and feeling good’, for example, implies that animal welfare comprises physical aspects (i.e. health and vigour) as well as psychological aspects (i.e. sense and feeling). Assessing animal welfare, therefore, requires a combination of different indicators. The Five Freedoms (FAWC, 1992) provide a generally supported comprehensive framework for choosing indicators of animal welfare: ‘freedom from hunger and thirst, freedom from physical and thermal discomfort, freedom from pain, injury and disease, freedom from fear and stress, and freedom to exhibit normal behaviour’.
Assuring dairy cattle welfare Assuring a certain level of welfare for dairy cattle requires assessment of welfare on a regular basis and, if needed, improvement of housing and management practices on farms. These activities can be organised in welfare assurance schemes. A welfare assurance scheme is a certification scheme that aims to provide consumers and retailers with assurances on animal welfare (Main and Mullan, 2012). This scheme consists of three steps that are repeated on a regular basis: on-farm assessment of dairy cattle welfare, feedback of results and advice to the farmer, and implementation of interventions in housing and/or management to improve dairy cattle welfare (Figure 1; modified after Blokhuis et al., 2003; University of Bristol, 2004; Webster, 2009; Blokhuis et al., 2010). Assessment of dairy cattle welfare In the first step of a welfare assurance scheme, the level of animal welfare is estimated in an on-farm welfare assessment at the farm level (Figure 1). Indicators that are included in protocols for on-farm assessment of animal welfare should meet the criteria of validity (the extent to which indicators reflect animal welfare), reliability (the extent to which the same results are obtained among different

General introduction 3
Figure 1. Cyclical process of a welfare assurance scheme for assessment and improvement of dairy cattle welfare. observers, within observers, and over time), and feasibility (the extent to which the measurements are possible and practical in the on-farm situation (e.g. practical and economic; Martin and Bateson, 1993; Webster, 2005; EFSA, 2012). Traditionally, on-farm assessment protocols use mainly housing and management-based indicators, which measure the state of the animal’s environment and the way the animal is taken care of. Animal-based indicators, however, are gaining preference over housing and management-based indicators for inclusion in on-farm assessment protocols. Animal-based indicators, which measure the state of the animal, are assumed to possess a higher validity than housing and management-based indicators because they are more closely linked to the actual welfare state of animals (Whay et al., 2003; Webster et al., 2004). Feasibility of on-farm assessment of dairy cattle welfare is a main challenge with regard to time-efficiency, especially when animal-based indicators are used (Mülleder et al., 2007; Knierim and Winckler, 2009; Blokhuis et al., 2010). For example, the Welfare Quality assessment protocol for dairy cattle, which includes a large proportion of animal-based indicators, ranges from about 4.4 to 7.7 hours for dairy herds of 25 to 200 cows (Welfare Quality, 2009). As a consequence, the number of days needed to assess dairy cattle welfare in a population approaches the number of herds in that population. Assessment time and associated costs of on-farm assessments may, therefore, hamper implementation of welfare assurance schemes. Various studies have shown associations between indicators of dairy cattle welfare. Lame cows, for instance, were associated with a lower body condition and changes in lying behaviour (Bowell et al 2003; Ito et al 2010; Blackie et al 2011). Therefore, a strategy that could potentially reduce the time required for an on-farm assessment is to omit indicators from the protocol, and replace observed values of these omitted indicators by predictions based on the remaining welfare indicators in the

4 Chapter 1
protocol. Another way to increase time-efficiency of on-farm assessment of dairy cattle welfare is to reduce the number of herds that are assessed. A promising strategy for this is to first estimate the level of dairy cattle welfare based on information in national databases. Especially in developed countries, a large amount of data are routinely collected from dairy farms, relating to, for example, identification and registration, housing, productivity, milk quality, and fertility. Therefore, they may provide a continuous, easy, and inexpensive opportunity to estimate the level of animal welfare on farms. So far, only few studies have investigated the value of routine herd data for estimating dairy cattle welfare (Sandgren et al., 2009; Nyman et al., 2011). Depending on the accuracy of this estimate, routine herd data might serve to pre-screen dairy herds for potential welfare problems, or to attribute a binding welfare status to herds. To decide whether a herd should be visited following a pre-screening or to attribute a welfare status to a herd requires a classification of the level of welfare in dairy herds. To this end, scores for individual welfare indicators need to be combined in an overall score. Besides other methods for combining welfare indicators (e.g. Bartussek et al., 2000; Bracke et al., 2002; Sandgren et al., 2009), a model was developed specifically for aggregation of indicators in the Welfare Quality assessment protocol for dairy cattle (Welfare Quality, 2009). This model assigns herds to one of four welfare classes (unacceptable, acceptable, enhanced, or excellent class), which should reflect the multidimensional nature of welfare and relative importance of various welfare indicators (Botreau et al., 2007a; Botreau et al., 2007b; Botreau et al., 2009). So far, however, it has not been demonstrated to which extent this is reflected in classification of herds. Such a validation is essential to evaluate if the model is suitable for its intended purpose. Moreover, sound welfare classes are essential because they might guide improvements that should positively affect the welfare of dairy cattle. Improvement of dairy cattle welfare In the second step of a welfare assurance scheme, results of the on-farm welfare assessment should be communicated to a farmer, as well as advice about housing and management interventions that can potentially lead to improved welfare (Figure 1). This gives him/her the opportunity to make interventions that can consolidate or improve the level of welfare (i.e. step 3 in Figure 1). The fact that animal welfare is a multidimensional concept, however, complicates coherent advice about housing and management interventions for overall welfare improvement. Changes in housing and management may have synergetic or opposing effects on different welfare indicators. So far, only few studies have investigated associations between housing and management factors and indicators related to different aspects of animal welfare simultaneously (e.g. Burow et al., 2012). Knowledge of potential synergies and trade-offs of interventions is essential for farmers who aim to improve the overall level of dairy cattle welfare in their herd.

General introduction 5
General aim and outline of the thesis The general aim of this thesis is to contribute to assurance of dairy cattle welfare by evaluating strategies to improve time efficiency of welfare assessment and by identifying housing and management interventions for welfare improvement. The research presented in the following chapters of this thesis concern different steps of the theoretical framework for a welfare assurance scheme shown in Figure 2. In this scheme, the cyclical process of a basic welfare assurance scheme is extended with an extra cyclical process for estimation of the level of dairy cattle based on routine herd data.
Figure 2. Theoretical framework for this thesis: extended cyclical process of welfare assurance scheme for assessment and improvement of dairy cattle welfare. Numbers refer to chapter numbers in this thesis In CChapter 2, scientific literature is reviewed to evaluate which variables of routine herd data have been associated with dairy cattle welfare indicators. In CChapter 3, the value of routine herd data for estimating dairy cattle welfare at the herd level is explored, based on an observational study among 194 commercial Dutch dairy herds. In CChapter 4, the relative importance of single welfare indicators is evaluated for classification of these 194 herds, based on the Welfare Quality Multicriteria Evaluation model. In CChapter 5, the possibility to reduce on-farm assessment time of the Welfare Quality protocol for dairy cattle is explored. In CChapter 6, housing and management factors associated with the prevalence of lameness, lesions or swellings, dirty hindquarters, and the frequency of displacements are identified and compared. Finally, in CChapter 7, the relevance of the results of this thesis for efficient assessment and improvement of dairy cattle welfare are discussed.

6 Chapter 1
References Bartussek, H., C. H. M. Leeb, and S. Held. 2000. Animal Needs Index for Cattle: ANI35L/2000 cattle. Federal Research Institute for
Agriculture in Alpine Regions BAL Gumpenstein, Irdning, Austria. Bayvel, A. C. D., T. J. Diesch, and N. Cross. 2012. Animal welfare: a complex international public policy issue: economic, policy,
societal, cultural and other drivers and constraints. A 20-year international perspective. Anim. Welf. 21: 11-18. Blokhuis, H. J., R. B. Jones, R. Geers, M. Miele, and I. Veissier. 2003. Measuring and monitoring animal welfare: Transparency in
the food product quality chain. Anim. Welf. 12: 445-455. Blokhuis, H. J., L. J. Keeling, A. Gavinelli, and J. Serratosa. 2008. Animal welfare's impact on the food chain. Trends Food Sci Tech
19: S79-S87. Blokhuis, H. J., I. Veissier, M. Miele, and B. Jones. 2010. The Welfare Quality® project and beyond: Safeguarding farm animal
well-being. Acta Agric. Scand. Sect. A-Anim. Sci. 60: 129-140. Botreau, R., M. Bonde, A. Butterworth, P. Perny, M. B. M. Bracke, J. Capdeville, and I. Veissier. 2007a. Aggregation of measures to
produce an overall assessment of animal welfare. Part 1: a review of existing methods. Animal 1: 1179-1187. Botreau, R., M. B. M. Bracke, P. Perny, A. Butterworth, J. Capdeville, C. G. Van Reenen, and I. Veissier. 2007b. Aggregation of
measures to produce an overall assessment of animal welfare. Part 2: analysis of constraints. Animal 1: 1188-1197. Botreau, R., I. Veissier, and P. Perny. 2009. Overall assessment of animal welfare: strategy adopted in Welfare Quality. Anim. Welf.
18: 363-370. Bracke, M. B. M., B. M. Spruijt, J. H. M. Metz, and W. G. P. Schouten. 2002. Decision support system for overall welfare assessment
in pregnant sows A: Model structure and weighting procedure. J. Anim. Sci. 80: 1819-1834. Bracke, M. B. M. 2009. Animal Welfare in a Global Perspective - A Survey of Foreign Agricultural Services and case studies on
poultry, aquaculture and wildlife. Wageningen UR Livestock Research, Lelystad. Broom, D. M. 1986. Indicators of poor welfare. Brit. Vet. J. 142: 524-526. Burow, E., T. Rousing, P. T. Thomsen, N. D. Otten, and J. T. Sorensen. 2012. Effect of grazing on the cow welfare of dairy herds
evaluated by a multidimensional welfare index. Animal 17: 1-9. EFSA. 2012. Scientific Opinion on the use of animal-based measures to assess welfare of dairy cows. European Food Safety
Authority (EFSA), Parma, Italy. EU. 1997a. Council Directive 97/2/EC, amending Directive 91/629/EEC laying down minimum standards for the protection of
calves. Official Journal of the European Communities, No L 25/24. EU. 1997b. Commission Decision 97/182/EC, amending Directive 91/629/EEC laying down minimum standards for the protection
of calves. Official Journal of the European Communities, No L 76/30. EU. 1999. Council Directive 1999/74/EC of 19 July 1999 laying down minimum standards for the protection of laying hens.
Official Journal of the European Communities L203, 03/08/1999: 0053 - 0057. European Commission. 2007a. Special Eurobarometer 270. Attitudes of EU citizens towards Animal Welfare, Wave 66.1. TNS
Opinion & Social, European Commission. European Commission. 2007b. Special Eurobarometer 229 (2). Attitudes of consumers towards the welfare of farmed animals,
Wave 64.4. TNS Opinion & Social, European Commission. FAWC. 1992. Farm Animal Welfare Council updates the five freedoms. Vet. Rec. 131: 357. Fraser, D. 1995. Science, Values and Animal Welfare: Exploring the 'Inextricable Connection'. Anim. Welf. 4: 103-117. Fraser, D. 2006. Animal welfare assurance programs in food production: a framework for assessing the options. Anim. Welf. 15:
93-104. Knierim, U. and C. Winckler. 2009. On-farm welfare assessment in cattle: validity, reliability and feasibility issues and future
perspectives with special regard to the Welfare Quality approach. Anim. Welf. 18: 451-458. Main, D. C. J. and S. Mullan. 2012. Economic, education, encouragement and enforcement influences within farm assurance
schemes. Anim. Welf. 21: 107-111. Marks and Spencer Group plc. 2010. Our Plan A Commitments 2010-2015, London, UK. Martin, P. and P. Bateson. 1993. Measuring Behaviour - An introductory guide. Cambridge University Press, Cambridge, UK. McDonald’s Corporation. 2004. McDonald’s Worldwide Corporate Responsibility Report 2004, Oak Brook, Il. Mülleder, C., J. Troxler, G. Laaha, and S. Waiblinger. 2007. Can environmental variables replace some animal-based parameters in
welfare assessment of dairy cows? Anim. Welf. 16: 153-156. Nyman, A.-K., A. Lindberg, and C. H. Sandgren. 2011. Can pre-collected register data be used to identify dairy herds with good
cattle welfare? Acta Vet. Scand. 53 Suppl 1: S8.

General introduction 7
OIE. 2012. Terrestrial Animal Health Code, 21th Edition. OIE, Paris, France Sandgren, C. H., A. Lindberg, and L. J. Keeling. 2009. Using a national dairy database to identify herds with poor welfare. Anim.
Welf. 18: 523-532. Thornton, P. K. 2010. Livestock production: recent trends, future prospects. Philos. Trans. R. Soc. B-Biol. Sci. 365: 2853-2867. University of Bristol. 2004. Bristol Welfare Assurance Programme: Cattle Assessment, Version 2.0 University of Bristol, Bristol, UK. Verbeke, W. and J. Viaene. 2000. Ethical challenges for livestock production: Meeting consumer concerns about meat safety and
animal welfare. J. Agric. Environ. Ethics 12: 141-151. Webster, A. J. F., D. C. J. Main, and H. R. Whay. 2004. Welfare assessment: Indices from clinical observation. Anim. Welf. 13
(Suppl.): S93-S98. Webster, A. J. F. 2005. Animal Welfare: Limping towards Eden. Blackwell Publishing Ltd., Oxford, UK. Webster, A. J. F. 2009. The Virtuous Bicycle: a delivery vehicle for improved farm animal welfare. Anim. Welf. 18: 141-147. Welfare Quality. 2009. Welfare Quality® Assessment Protocol for Cattle. Welfare Quality® Consortium, Lelystad, Netherlands. Whay, H. R., D. C. J. Main, L. E. Green, and A. J. F. Webster. 2003. Animal-based measures for the assessment of welfare state of
diary cattle, pigs and laying hens: Consensus of expert opinion. Anim. Welf. 12: 205-217.

8 Chapter 1


10 Chapter 2
Associations between variables of routine herd data and dairy cattle welfare indicators M. de Vries1, E.A.M. Bokkers1, T. Dijkstra2, G. van Schaik2, and I.J.M. de Boer1 1 Animal Production Systems group, Wageningen University, Wageningen, the Netherlands, 2 GD Animal Health Service, Deventer, the Netherlands Published in Journal of Dairy Science 94: 3213-3228
Abstract As farm animal welfare is high on the political and societal agendas of many countries, considerable pressure exists to establish audit programs in which farm animal welfare is routinely monitored. On-farm assessment of animal welfare, however, is time-consuming and costly. A promising strategy to monitor animal welfare more efficiently is to first estimate the level of animal welfare on a farm based on routine herd data that are available in national databases. It is not currently known which variables of routine herd data (VRHD) are associated with dairy cattle welfare indicators (WI). Our aim was to identify VRHD that are associated with WI in a literature review. The 27 VRHD used in this review included the main types of data that are currently collected in national herd databases of developed countries, and related to identification and registration, management, milk production, and reproduction of dairy herds. The 34 WI used in this review were based on the Welfare Quality Assessment Protocol for Cattle. The search yielded associations in 146 studies. Twenty-three VRHD were associated with 16 WI. The VRHD that related to milk yield, culling and reproduction were associated with the largest number of WI. Few associations were found for WI that referred to behavioral aspects of animal welfare, nonspecific disease symptoms or resources-based indicators. For 18 WI, associations with VRHD were not significant (n = 5 WI) or no studies were found that investigated associations with VRHD (n = 13 WI). It was concluded that many VRHD have potential to estimate the level of animal welfare on dairy farms. As strengths of associations were not considered in this review, however, the true value of these VRHD should be further explored. Moreover, associations found at the animal level and in an experimental setting might not appear at the farm level and in common practice and should be investigated. Cross-sectional studies using integrated welfare scores at the farm level are needed to more accurately determine the potential of VRHD to estimate levels of animal welfare on dairy farms.

Herd data and dairy cattle welfare: literature review 11
Introduction As farm animal welfare is high on the political and societal agendas of many countries, considerable pressure exists to establish welfare audit programs in which farm animal welfare is routinely monitored. These programs should be able to attribute a level of animal welfare to farms and eventually lead to improvement of living conditions of farm animals. Programs require the use of on-farm animal welfare assessments, in which a farm is visited and assessed against compliance with a set of animal welfare criteria. In the past decades, various on-farm assessment protocols have been developed, for example, the Animal Needs Index (Bartussek et al., 2000) and the Bristol Welfare Assurance Programme (Leeb et al., 2004). More recently, knowledge of animal welfare experts in Europe has been integrated in the Welfare Quality (WQ) project to develop on-farm assessment protocols for cattle, pigs and poultry. The WQ protocols use mainly animal-based, validated welfare indicators to assess animal welfare on a farm. Animal-based indicators are increasingly preferred to resource-based indicators because they are more closely linked to the welfare of animals and can measure the actual state of animals regardless of how they are housed or managed (Webster et al., 2004). One factor impeding the use of such animal-based protocols in welfare audit programs, is that they are time consuming and expensive (Knierim and Winckler, 2009). Application of the WQ protocol for dairy cattle, for example, takes approximately one day per herd (Welfare Quality, 2009). The number of days needed to visit and assess all dairy farms in a country is equal to the number of farms in that country. A promising strategy to monitor animal welfare more efficiently is to first estimate the level of animal welfare, based on national herd databases. Especially in developed countries, herd data are routinely collected from dairy farms, relating, for example, to identification and registration (I&R), housing, productivity, milk quality and fertility. An advantage of routine herd data is that they are regularly collected and assembled, providing a continuous, easy and inexpensive opportunity to estimate the level of animal welfare on farms. It is still unknown, however, which variables of routine herd data (VRHD) are associated with dairy cattle welfare indicators (WI). Many studies showed associations of VRHD with a single WI, some with various WI (e.g. Mülleder et al., 2007; Sandgren et al., 2009), but none with a complete set of WI of a validated on-farm assessment protocol. Our aim was to identify VRHD that are associated with WI through a literature review.
Materials and methods Variables of routine herd data The VRHD that were used in this review (Table 1) included the main types of data that are currently collected in a uniform* way in national herd databases of developed countries. In many of these countries, VRHD are regularly collected from residential dairy farms through identification and registration systems, dairy processors, rendering plants, monitoring systems for milk quality, and breeding enterprises. Data are collected at both the animal- and the herd level and collection frequency varies depending on the variable. Although not many countries have such a comprehensive national herd database as described in Table 1, inclusion of such a wide range of VRHD offers the possibility to specify associations between VRHD and WI for different national herd databases.

12 Chapter 2
Table 1. Categories, units and sampling levels of variables of routine herd data (VRHD)
Category VRHD Unit Level Identification and registration (I&R) Birth date animal Slaughter Date animal On-farm death date animal Herd size number Herd Management Geographic location Herd Type of housing loose/tethered Herd Certified organic y/n herd Breed % animal Herd biosecurity status open/closed herd Access to pasture y/n herd Use of antibiotics mg/kg/day herd Milk production Yield kg/d animal, herd Predicted yield kg/d animal DIM number animal Milk composition Fat % animal, herd Protein % animal, herd Lactose % animal, herd Urea mg/dl herd Nitrogen mg/dl herd SCC cells/ml animal, herd Conjugated linoleic acid mg/dl herd Bacterial count germs/ml herd Freezing point degrees celcius herd Antibiotics y/n herd Reproduction Insemination date date animal Calving date date animal
The VRHD in Table 1 are often combined in studies to generate other variables. Combining insemination date and calving date, for example, can provide a pregnancy rate at first service of cows on a farm. Combined VRHD that were included in this review can all be linked to the VRHD that are listed in Table 1. Dairy cattle welfare indicators We used WI as defined in the Welfare Quality Assessment Protocol for Dairy Cattle (WQ protocol, Welfare Quality, 2009) because these indicators are mainly animal-based and are regarded as sufficiently valid, reliable and feasible (Knierim and Winckler, 2009). WI in the WQ protocol are grouped into 12 welfare criteria, which are based on principles of good feeding, good housing, good health and appropriate behavior (Table 2). A welfare criterion score is calculated at the herd level from scores of one or more WI. For example, a score for “absence of injuries” (criterion 6) is derived from the percentage of moderately and severely lame cows, and the percentage of cows with integument alterations (i.e., lesions, swellings, and hairless patches) on a farm. Although most of the WI in the WQ protocol are animal-based, some WI are resource-, or management-based because animal-based indicators were not feasible. The WQ protocol can be applied to lactating cows and dry cows in any type of housing system. Associations between VRHD and WI Associations between VRHD and WI were searched, using WI in Table 2 as single keywords in the scientific search engines Scopus and ISI Web of Knowledge. If the number of hits exceeded 100, WI

Herd data and dairy cattle welfare: literature review 13
were combined with VRHD as keywords in the search engines. With the term “association”, it is emphasized that relationships are not necessarily causal. We focused on direct associations between VRHD and WI. If indicators of dairy cattle welfare, other than the WI indicators in the WQ protocol, were associated with VRHD, they were mentioned only if the indicator was a valid alternative to the WI in the WQ protocol. Water intake of cows, for example, is a valid (but not a feasible) alternative to the resource-based indicators for absence of prolonged thirst that are used in the WQ protocol. As indicators for “thermal comfort” are absent in the WQ protocol, this criterion was not considered in this review. Only significant associations in peer-reviewed publications in English were included in this review. The review was limited to studies focusing on pregnant heifers, lactating and dry cows located in developed countries. We did not differentiate among studies with regard to housing, management, or herd characteristics. Both associations on both the animal and herd levels were included. As a last step, the number of VRHD associated with one or more WI and the number of WI associated with one or more VRHD were counted. If various VRHD were combined in a variable (e.g. insemination date and calving date are combined in pregnancy rate at first service), all of these VRHD were counted. Strengths of associations were not considered in this review because studies differ in conditions, association measures and key parameters. Different types of association measures, e.g. correlation coefficients, odds ratios, hazard ratios or relative risks, are not always comparable. In addition, various key parameters can be used for one VRHD. For example, studies that investigate the VRHD “milk yield” may use peak milk yield, cumulative 60, 90, 270, or 305 d milk yield, fat and protein corrected milk yield or milk yield acceleration as key parameters, whereas others compare “lower” yielding cows with “higher” yielding cows.
Results The search yielded associations in 146 studies. The VRHD were either associated or not with WI, or no studies were found that investigated associations between VRHD and WI (Table 3). The following sections describe the VRHD that were associated or not associated with WI. As WI in the WQ protocol are categorized within welfare criteria (Table 2), associations are shown with criteria as main headings and VRHD categories (Table 1) as subheadings. Absence of prolonged hunger Only a few studies explored associations between VRHD and the percentage of very lean cows at the farm level, whereas many studies associated BCS of individual cows. As the percentage of very lean cows is based on on-farm measurements of BCS of individual cows, associations between VRHD and BCS are relevant and were included in this review. In the WQ protocol BCS of individual cows is measured at a random moment in lactation, but most studies quantified BCS at specific moments in lactation. We included studies that measured BCS at the time of dry-off (dry-off BCS), BCS at the time of calving (calving BCS), and the lowest BCS over lactation (nadir BCS). Unless mentioned otherwise, the following results represent associations at the animal level, using BCS on a scale of 1 to 5 (Wildman et al., 1982) and classifying cows with BCS < 2 as “very lean”. If studies used a different BCS scale, scores were converted according to conversion equations described in Roche et al. (2004).

14 Chapter 2
Prolonged hunger, I&R and management Body condition score in lactating cows is affected by age, parity, and the cow’s genotype (Roche et al., 2009). Body condition score was higher in primiparous cows than in second or third parity cows (Gallo et al., 1996; Dechow et al., 2001; Friggens and Badsberg, 2007). One study found a negative assocation between the number of cows in a lactation group and their average BCS (Bowell et al., 2003), but the association with total herd size was not investigated. Cows with a lower dry-off BCS, calving BCS, and nadir BCS were more likely to be culled and had a shorter survival time than cows with higher BCS (Hoedemaker et al., 2009; Machado et al., 2010). At the farm level, the percentage of very lean cows was positively associated with mortality rate of calves (Sandgren et al., 2009). Prolonged hunger and milk production We found studies showing negative associations between BCS and milk yield (e.g. Garnsworthy and Topps, 1982; Treacher et al., 1986; Garnsworthy and Jones, 1987; Domecq et al., 1997b), positive associations (e.g. Domecq et al., 1997b; Markusfeld et al., 1997; Stockdale, 2001) and no associations between BCS and milk yield (e.g. Holter et al., 1990; Ruegg et al., 1992). These contradicting results may be explained by the nonlinear character of the association between BCS and milk yield (Roche et al., 2009). Various studies found a positive association between BCS and milk yield up to an optimum BCS, but a negative association thereafter (Bourchier et al., 1987; Waltner et al., 1993; Berry et al., 2007; Roche et al., 2007a). The association was nonlinear before the optimum BCS; the lower the BCS, the faster milk yield decreased. In the following results we focus on studies assuming such a positive, nonlinear association between BCS and milk yield. These studies associated BCS with milk yield, using peak milk yield, cumulative 60-, 90-, 270-, and 305-d milk yield, and milk yield acceleration as key parameters. Up to the optimum BCS, peak milk yield was positively associated with BCS. With lower BCS, differences in peak milk yields were larger. For example, peak milk yields of cows with calving BCS of 2.25 were 5.0-5.9 kg higher than yields of cows with calving BCS of 1.25, but yields of cows with calving BCS of 3.75 were only 1.0 to 2.9 kg higher than yields of cows with calving BCS of 2.25 (Bourchier et al., 1987; Roche et al., 2007a; Roche et al., 2009). Similar to peak milk yields, 60-, 90-, 270-, and 305-d cumulative milk yields were positively associated with BCS up to the optimum BCS, and differences in yields were larger with lower BCS (Waltner et al., 1993; Berry et al., 2007; Roche et al., 2007a). Cumulative 90-d FCM yields of cows with calving BCS of 2.0, for example, were 619 kg higher than yields of cows with calving BCS of 1.0, but 90-d FCM yields of cows with calving BCS of 3.0 were only 322 kg higher than yields of cows with calving BCS of 2.0 (Waltner et al., 1993). Except for one study in which calving BCS of primiparous cows was positively associated with milk yield acceleration during the first 15 d of lactation (Domecq et al., 1997b), no other study found an association between BCS and milk yield acceleration. Prolonged hunger and milk composition Studies showed a positive linear association between nadir BCS and fat, protein and lactose contents of milk of individual cows. A single unit higher nadir BCS was associated with a 0.05 to 0.13% higher fat content, a 0.05 to 0.12% higher protein content, and 0.02 to 0.03% higher lactose content in milk (Berry et al., 2007; Roche et al., 2007a). Some studies found no association (Ruegg and Milton, 1995),

Herd data and dairy cattle welfare: literature review 15
whereas others found a nonlinear association between BCS and SCC. In these studies, cows with low BCS showed a higher probability to have an SCC > 199,000 cells/ml (Berry et al., 2007; Breen et al., 2009a). At the herd level, the percentage of lean cows was associated with high and low urea content of milk (Sandgren et al., 2009). Prolonged hunger and reproduction Various studies found a nonlinear association between BCS and reproductive performance (Gillund et al., 2001; Pryce et al., 2001; Buckley et al., 2003; Roche et al., 2007b) , whereas others only found tendencies (Ruegg and Milton, 1995; Domecq et al., 1997a). Nadir BCS was negatively associated with the postpartum anestrus interval (Buckley et al., 2003; Roche et al., 2007b; Bewley and Schutz, 2008), and positively associated with pregnancy rate at first service and pregnancy at 21, 42 and 84 d after planned start of mating (Buckley et al., 2003; Roche et al., 2007b). A low dry-off BCS and BCS at 10 wk postpartum was associated with a low pregnancy rate at 200 DIM (Hoedemaker et al., 2009; Machado et al., 2010). Averaged BCS over the first 10 weeks postpartum were positively associated with pregnancy rate at first service, and negatively associated with calving interval (Pryce et al., 2001). In another study, however, percentage of lean cows at the herd level was positively associated with average calving interval, and negatively associated with variation in calving interval among cows (Sandgren et al., 2009). Absence of prolonged thirst Prolonged thirst and milk production To our knowledge, in only two studies the effect of number of animals per drinker and water flow on milk yield was analyzed (Andersson et al., 1984; Andersson, 1987). Neither number of water bowls, nor water flow was associated with milk yield. The effect of water flow, however, was studied for tied cows only, and, despite the low flow rate, the lowest water intake per day was reasonably high (i.e. 77 L). Lactating dairy cows drink approximately 14 to 171 L of water per day (Meyer et al., 2004), depending on milk yield, body weight, diet, and ambient temperature. Results showed that the number of animals per drinker, and water flow were not associated with VRHD. Various other studies, however, associated VRHD with water intake per cow, which is an animal-based indicator of thirst. As water intake has been associated with number of animals per drinker, length of water troughs, and water flow (Andersson et al., 1984; Andersson, 1987; Pinheiro Machado Filho et al., 2004; Teixeira et al., 2006), it facilitates an indirect association between WQ indicators of thirst and VRHD. Water intake and VRHD Water intake has been associated with milk production and composition. Daily water intake of individual cows was influenced by expected milk yield: high yielding cows drank more water than low yielding cows (Meyer et al., 2004; Cardot et al., 2008). Each additional kilogram of milk was associated with an additional demand of drinking water between 0.6 and 2.53 l (Castle and Thomas, 1975; Holter and Urban, 1992; Dahlborn et al., 1998; Meyer et al., 2004; Kramer et al., 2008). This correlation increased with lactation stage (Kramer et al., 2008). In case of insufficient water intake, milk yield

16 Chapter 2
Ta
ble
2. W
elfa
re p
rinci
ples
, crit
eria
and
indi
cato
rs o
f Wel
fare
Qua
lity
(WQ
) on-
farm
ass
essm
ent p
roto
col f
or d
airy
cat
tle (W
elfa
re Q
ualit
y, 2
009)
Indi
cato
rs
% v
ery
lean
cow
s1 N
umbe
r of a
nim
als
per d
rinke
r and
/or c
m tr
ough
, fun
ctio
ning
, wat
er fl
ow a
nd c
lean
lines
s of
drin
kers
M
ean
time
need
ed to
lie
dow
n, %
cow
s co
llidi
ng w
ith h
ousin
g eq
uipm
ent,
% c
ows
lyin
g pa
rtly
or
com
plet
ely
outs
ide
lyin
g ar
ea
% c
ows
with
dirt
y lo
wer
hin
d le
gs, h
indq
uart
ers
and
udde
r As
yet
no
indi
cato
r is
deve
lope
d Pr
esen
ce o
f tet
herin
g, n
umbe
r of d
ays
per y
ear a
nd h
ours
per
day
with
acc
ess
to p
astu
re a
nd o
utdo
or
loaf
ing
area
%
mod
erat
ely
and
seve
rely
lam
e2 cow
s %
cow
s w
ith h
airle
ss p
atch
es, %
cow
s w
ith le
sions
and
sw
ellin
gs
Mea
n nu
mbe
r of c
ough
s pe
r cow
per
hou
r, %
on-
farm
mor
talit
y, %
dow
ner c
ows,
% c
ows
with
nas
al
disc
harg
e, o
cula
r disc
harg
e, h
ampe
red
resp
iratio
n, d
iarr
hoea
, vul
var d
ischa
rge,
dys
toci
a,
SCC
> 4
00,0
00 c
ells/
ml
Disb
uddi
ng, d
ehor
ning
, and
tail-
dock
ing,
and
met
hods
and
use
of a
naes
thet
ics
and
anal
gesic
s du
ring
proc
edur
e M
ean
num
ber o
f hea
d bu
tts
and
disp
lace
men
ts p
er c
ow p
er h
our
Num
ber o
f day
s/ye
ar a
nd h
ours
/day
with
acc
ess
to p
astu
re
% c
ows
that
can
be
appr
oach
ed3 0
to 1
0 cm
, > 1
0 to
50
cm, >
50
to 1
00 c
m, a
nd >
100
cm
Sc
ores
of 2
0 te
rms
of th
e Q
ualit
ativ
e Be
havi
our A
sses
smen
t4 1
The
cate
gory
"ver
y le
an" c
orre
spon
ds w
ith a
BCS
<2 in
typi
cal d
airy
bre
eds a
nd a
BCS
<2.5
in ty
pica
l mea
t or d
ual p
urpo
se b
reed
s on
a 1
(ver
y le
an) t
o 5
(ver
y fa
t) po
int B
CS sc
ale
(Wild
man
et a
l., 19
82).
2
The
cate
gorie
s "m
oder
atel
y la
me"
and
"sev
erel
y la
me"
cor
resp
ond
with
scor
e 3
and
scor
es 4
and
5, r
espe
ctiv
ely,
on th
e 1
(" nor
mal
gai
t") t
o 5
("doe
s not
supp
ort o
n on
e lim
p or
st
rong
relu
ctan
ce to
put
wei
ght o
n lim
b in
two
or m
ore
limbs
") po
int s
cale
of t
he la
men
ess s
corin
g sy
stem
des
crib
ed in
Win
ckle
r and
Will
en (2
001)
. 3
Avoi
danc
e di
stan
ce is
mea
sure
d by
app
roac
hing
dai
ry c
ows f
rom
a d
istan
ce o
f 2.5
m a
t the
feed
bun
k an
d m
easu
ring
the
dist
a nce
bet
wee
n ha
nd a
nd m
uzzle
at t
he m
omen
t the
an
imal
with
draw
s (W
elfa
re Q
ualit
y, 20
09).
4
Posit
ive
emot
iona
l sta
te is
mea
sure
d by
qua
ntita
tive
valu
atio
n of
20
term
s of t
he Q
ualit
ativ
e Be
havi
our A
sses
smen
t (Ro
usin
g an
d W
emel
sfel
der,
2006
; Wem
elsf
elde
r, 20
07):
activ
e,
rela
xed,
fear
ful,
agita
ted,
cal
m, c
onte
nt, i
ndiff
eren
t, fru
stra
ted,
frie
ndly
, bor
ed, p
layf
ul, p
ositi
vely
occ
upie
d, li
vely
, inq
uisit
ive,
irrit
able
, une
asy,
socia
ble,
apa
thet
ic, h
appy
, and
dist
ress
ed.
Crite
rion
Ab
senc
e of
pro
long
ed h
unge
r Ab
senc
e of
pro
long
ed th
irst
Com
fort
aro
und
rest
ing
Rest
ing
beha
vior
Clea
nlin
ess
Ther
mal
com
fort
Ea
se o
f mov
emen
t
Abse
nce
of in
jurie
s La
men
ess
Inte
gum
ent a
ltera
tions
Ab
senc
e of
dise
ase
Abse
nce
of p
ain
indu
ced
by
man
agem
ent p
roce
dure
s
Expr
essio
n of
soc
ial b
ehav
iour
s Ex
pres
sion
of o
ther
beh
avio
urs
Goo
d hu
man
-ani
mal
rela
tions
hip
Posit
ive
emot
iona
l sta
te
1 2 3 3a
3b
4 5 6 6a
6b
7 8 9 10
11
12
Prin
cipl
e
Goo
d fe
edin
g G
ood
hous
ing
G
ood
heal
th
Appr
opria
te
beha
vior

Herd data and dairy cattle welfare: literature review 17
Tabl
e 3.
Wel
fare
indi
cato
rs (W
I) of
the
Wel
fare
Qua
lity
prot
ocol
for d
airy
cat
tle th
at w
ere
asso
ciat
ed (n
=16
) and
WI t
hat w
ere
not a
ssoc
iate
d (n
=5)
with
var
iabl
es o
f rou
tine
herd
dat
a (V
RHD
), an
d W
I for
whi
ch n
o as
soci
atio
n st
udie
s w
ere
foun
d (n
=13
)
No
asso
ciat
ion
stud
ies
foun
d - Fu
nctio
ning
and
cle
anlin
ess
of
drin
kers
% c
ows
colli
ding
with
hou
sing
equi
pmen
t, %
cow
s ly
ing
part
ly/c
ompl
etel
y ou
tsid
e ly
ing
area
N
umbe
r of d
ays
and
hour
s/da
y w
ith a
cces
s to
out
door
loaf
ing
area
- M
ean
num
ber o
f cou
ghs
per c
ow
per h
our,
% c
ows
with
nas
al
disc
harg
e, o
cula
r disc
harg
e
Disb
uddi
ng, d
ehor
ning
, met
hods
an
d us
e of
ana
esth
etic
s an
d/or
an
alge
sics
durin
g pr
oced
ure
- - - Scor
es o
f 20
term
s of
the
Qua
litat
ive
Beha
viou
r Ass
essm
ent
WI n
ot a
ssoc
iate
d w
ith V
RHD
- N
umbe
r of a
nim
als
per d
rinke
r an
d/or
cm
trou
gh, w
ater
flow
of
drin
kers
M
ean
time
need
ed to
lie
dow
n
- - Tail-
dock
ing,
use
of
anae
sthe
tics
durin
g ta
il-do
ckin
g
- - - -
WI a
ssoc
iate
d w
ith V
RHD
%
ver
y le
an c
ows
- % c
ows
with
dirt
y lo
wer
hin
d le
gs,
hind
quar
ters
and
/or u
dder
No
indi
cato
rs a
vaila
ble
Pres
ence
of t
ethe
ring,
num
ber o
f da
ys/y
ear a
nd h
ours
/day
with
acc
ess
to
past
ure
% m
oder
atel
y an
d/or
sev
erel
y la
me
cow
s, %
cow
s w
ith h
airle
ss p
atch
es,
lesio
ns a
nd/o
r sw
ellin
gs
% o
n-fa
rm m
orta
lity,
dys
toci
a, S
CC >
40
0.00
0 ce
lls/m
l, di
arrh
oea,
% d
owne
r co
ws,
vulv
ar d
ischa
rge,
ham
pere
d re
s pira
tion
- Mea
n nu
mbe
r of h
ead
butt
s an
d di
spla
cem
ents
per
cow
per
hou
r N
umbe
r of d
ays/
year
and
hou
rs/d
ay
with
acc
ess
to p
astu
re
% c
ows
that
can
be
appr
oach
ed a
t the
fe
ed b
unk
Crite
rion
Ab
senc
e of
pro
long
ed h
unge
r Ab
senc
e of
pro
long
ed th
irst
Com
fort
aro
und
rest
ing
Ther
mal
com
fort
Ea
se o
f mov
emen
t
Abse
nce
of in
jurie
s
Abse
nce
of d
iseas
e
Abse
nce
of p
ain
indu
ced
by
man
agem
ent p
roce
dure
s
Expr
essio
n of
soc
ial
beha
viou
rs
Expr
essio
n of
oth
er
beha
viou
rs
Goo
d hu
man
-ani
mal
re
latio
nshi
p Po
sitiv
e em
otio
nal s
tate
1 2 3 4 5 6 7 8 9 10
11
12
Prin
cipl
e
Goo
d fe
edin
g G
ood
hous
ing
Goo
d he
alth
Appr
opria
te
beha
viou
r

18 Chapter 2
decreased (Little and Shaw, 1978; Little et al., 1980; Andersson et al., 1984; Andersson, 1987; Burgos et al., 2001; e.g. Bjerg et al., 2005). When drinking water intake was restricted by 10, 40, or 50% of the normal intake, milk yields decreased after approximately one day by 3, 16, and 27% (Little and Shaw, 1978; Little et al., 1980; Burgos et al., 2001). With regard to milk composition, temporary water restriction was associated with a decreased freezing point of milk and an increased milk fat content (Bjerg et al., 2005). In another study, however, milk fat content did not change significantly when cows were given 50% water restriction, but 3% more urea and 58% more nitrogen were excreted in milk (Burgos et al., 2001). Comfort around resting: Resting behavior To our knowledge, no studies have associated VRHD with the percentage of cows colliding with housing equipment, or the percentage of cows lying partly or completely outside the lying area. Resting behavior, I&R and management The time needed for individual cows to lie down was not associated with their parity (Krohn and Munksgaard, 1993). Plesch et al. (2010) found an effect of housing system on mean time needed to lie down, percentage of cows colliding with housing equipment and percentage of cows lying partly or completely outside lying area, but did not specify differences between deep litter, cubicle housing and tie-stalls in post hoc analyses. In other studies, time needed to lie down did not differ between cows housed in tie-stalls and loose housing (Krohn and Munksgaard, 1993; Jensen, 1999). Comfort around resting: Cleanliness Cleanliness, I&R and management Parity was positively associated with dirty lower hind legs, hindquarter and udder in individual cows (Reneau et al., 2005). During winter, cows in conventional farming systems were dirtier than cows in certified organic farming systems (Ellis et al., 2007). Mortality of calves up to 90 d old was higher in herds with more dirty cows (Sandgren et al., 2009). Cleanliness and milk production Days in milk was positively associated with dirty lower hind legs and hindquarter in individual cows (Ward et al., 2002; Reneau et al., 2005), but cows were dirtier during lactation than in the dry period (Ward et al., 2002; Ellis et al., 2007). According to one study, cows with high and average milk yield were dirtier than low yielding cows (Ellis et al., 2007). Another study, however, found no association between cow cleanliness scores and milk yield (Fregonesi and Leaver, 2001). Cleanliness and milk composition Bulk tank milk SCC was positively associated with a higher percentage of dirty cows in the herd, especially in organic farms (Ellis et al., 2007). Individual cow SCC was also positively associated with dirty lower hind legs and udder (Schreiner and Ruegg, 2003; Reneau et al., 2005), although one study showed opposite results (Breen et al., 2009a). Individual cow SCC was not associated with dirty hindquarters (Reneau et al., 2005). Reneau et al. (2005) studied associations between cleanliness and high bulk tank milk SCC among herds with mastitis problems caused by environmental pathogens. In these herds, 1-point change in herd mean cleanliness score (composite udder-hind limbs score on a 1

Herd data and dairy cattle welfare: literature review 19
(clean) to 5 (dirty) scale) was positively associated with a 40,000 to 50,000 cells/mL change in bulk tank milk SCC. Ellis et al. (2007) found an association between cow cleanliness and major mastitis pathogens (Streptococcus uberis and Staphylococcus aureus) in bulk tank milk, but not with bactoscan counts and clinical mastitis incidence. In other studies, contagious and environmental mastis pathogens were associated with dirty udders, but not with dirty lower hind legs (Schreiner and Ruegg, 2003; Breen et al., 2009b). Thermal comfort As indicators of “thermal comfort” are absent in the WQ protocol, this criterion was not considered in this review. Ease of movement Presence of tethering is a variable in the WQ protocol (Table 2), as well as in the list of VRHD (Table 1). Hence, presence of tethering can be directly monitored by VRHD. Access to pasture is also a variable in the list of VRHD, but is dichotomous (yes/no); the VRHD stands for a minimum number of days per year and hours per day, but not for the exact number of days per year and hours per day with access to pasture. For associations between VRHD and the exact number of days per year and hours per day with access to pasture, see paragraph about Expression of other behaviors. Number of days per year and hours per day with access to an outdoor loafing area are not variables in VRHD. No studies were found that investigated associations between access to an outdoor loafing area and VRHD. Absence of injuries: Lameness Lameness and I&R A higher age and parity of cows was associated with lameness (Rowlands et al., 1985; Groehn et al., 1992; Pryce et al., 1999; Green et al., 2002; Hirst et al., 2002; Haskell et al., 2006; Dippel et al., 2009; Rutherford et al., 2009). In particular heifers showed lameness less often than cows in second or later lactations (Dippel et al., 2009). Many studies found a positive association between lameness and culling (Dohoo and Martin, 1984; Collick et al., 1989; Esslemont and Kossaibati, 1997; Rajala-Schultz and Gröhn, 1999; Hernandez et al., 2001; Booth et al., 2004; Bicalho et al., 2007b), whereas few studies found no association or a negative association (Beaudeau et al., 1994; Pasman et al., 1995). The risk of culling due to lameness is highest early in lactation, and decreases with time (Dohoo and Martin, 1984; Booth et al., 2004). Lame cows may be kept in the herd if the primary culling decision is based on other factors (e.g. reproductive performance), if no replacements are available, or if the herd is expanding (Rutherford et al., 2009). Lameness was found to be the main reason, or one of the main reasons, for on-farm death, explaining 11 to 21% of all (unassisted or assisted) on-farm deaths (Menzies et al., 1995; Thomsen et al., 2004; McConnel et al., 2008; Thomsen and Sørensen, 2009). Lameness and management Although good stall design may reduce lameness in zero-grazing systems, zero-grazing is generally positively associated with the number of lame cows in freestalls (Somers et al., 2003; Haskell et al., 2006; Hernandez-Mendo et al., 2007; Olmos et al., 2009). Some studies found a lower prevalence of lameness in organic farming systems (Rutherford et al., 2008; Dippel et al., 2009), whereas others found

20 Chapter 2
no difference between conventional and organic dairy farms (Langford et al., 2009). An open herd biosecurity status increased risk of lameness (Rutherford et al., 2009). Lameness and milk production and composition Days in milk was negatively associated with lameness, with risk of lameness being highest during the first 3 months after calving (Green et al., 2002; Hirst et al., 2002; Knott et al., 2007). Many studies have associated lameness with milk yield, whereas one study found no association between lameness and milk yield (Haskell et al., 2006). At the herd level, mean locomotion scores were higher (i.e., more lame) in high yielding herds (i.e., >9,000 L/cow per yr) than in medium yielding herds (i.e., 7,000 to 8,500 L/cow per yr) (Bowell et al., 2003; Rutherford et al., 2009). At the cow level, however, a negative linear relationship was found between locomotion score and milk yield (Domecq et al., 1997b; Rajala-Schultz and Gröhn, 1999; Warnick et al., 2001; Hernandez et al., 2002; Hernandez et al., 2005; Amory et al., 2008). Lame cows had 0.5 to 2.8 kg/d and 424 kg/305 d lower milk yield compared with healthy cows (Rajala-Schultz and Gröhn, 1999; Warnick et al., 2001; Bicalho et al., 2008; Archer et al., 2010). In preceding lactations, however, lame cows showed higher milk yields compared with healthy cows (Barkema et al., 1994; Bicalho et al., 2007b; Bicalho et al., 2008). A lowered milk yield was mainly associated with lameness in second or later parity (Domecq et al., 1997b; Warnick et al., 2001; Hernandez et al., 2002; Hernandez et al., 2005). Among primiparous cows, variation in average daily milk yield was higher when more cows in a herd were lame (Sandgren et al., 2009). Cows with a milk protein content < 3.2 or > 3.8% had higher risk of being lame (Dippel et al., 2009). Somatic cell score was not associated with lameness (Mülleder et al., 2007). Lameness and reproduction Lower age at first calving was associated with a higher lameness prevalence (Rutherford et al., 2009). Another study, however, found no association between age at calving and lameness (Hirst et al., 2002). Lameness was associated with a longer interval between calving and first service, a longer interval from first service to conception and thus a longer interval between calving and conception (Lucey et al., 1986; Collick et al., 1989; Barkema et al., 1994; Hernandez et al., 2001). Compared with that in healthy cows, the interval between calving and first service was 4 d longer, and the interval calving to conception was 14 to 50 d longer for lame cows (Collick et al., 1989; Hernandez et al., 2005). Pregnancy rate to first service in lame cows was 10% less than in healthy cows, and 0.42 more services were required per conception (Collick et al., 1989). At the herd level, the percentage of lame cows was positively associated with the percentage of cows with late ongoing services (Sandgren et al., 2009). Lame and severely lame cows were at a 15 and 24% lower risk of pregnancy than healthy cows, respectively (Bicalho et al., 2007b). Absence of injuries: Integument alterations Integument alterations, I&R and management Age and parity were positively associated with prevalence, number and severity of integument alterations per cow (Weary and Taszkun, 2000; Haskell et al., 2006; Rutherford et al., 2008; Kielland et al., 2009), whereas one study found no association (Busato et al., 2000). Hairless patches, swellings and lesions of the hock were more prevalent in conventional than in organic farming systems (Rutherford

Herd data and dairy cattle welfare: literature review 21
et al., 2008; Kielland et al., 2009) and more prevalent in tie stalls than in loose housing systems (Østerås et al., 1990; Busato et al., 2000; Regula et al., 2004; Simensen et al.). Access to pasture was positively associated with the percentage of cows with knee swellings (Haskell et al., 2006), whereas other studies found no associations between integument alterations and access to pasture, nor with herd size (Busato et al., 2000; Kielland et al., 2009). Integument alterations and milk production and composition Days in milk was associated with integument alterations; cows in late lactation showed more integument alterations of the hock, but fewer integument alterations of the knee and more skin lesions on the neck compared with cows in early lactation (Kielland et al., 2009; Kielland et al., 2010). Herds with lower milk yields had more knee swellings than herds with higher yields (Haskell et al., 2006). A hock and teat injury was associated with a decrease of 109 and 155 kg cumulated milk yield of individual cows, from the day of onset to the day of recovery (Bareille et al., 2003). Other studies, however, found no associations of integument alterations with DIM (Weary and Taszkun, 2000), or with milk yield (Busato et al., 2000). Integument alterations were not associated with SCC of individual cows (Mülleder et al., 2007). A higher percentage of cows with integument alterations was associated with a lower percentage of cows with high and low urea levels in milk (Sandgren et al., 2009). Integument alterations and reproduction Integument alterations were associated with a lower age of first mating (Rutherford et al., 2008; Kielland et al., 2009). One study found an association between a high percentage of cows with integument alterations and a short calving interval and little variation between cows in calving interval (Sandgren et al., 2009), whereas studies at the cow level found no association with calving interval (Rutherford et al., 2008; Kielland et al., 2009). Absence of disease The percentage of cows with a SCC > 400,000 cells/ml and the percentage of on-farm mortality are variables in the list of VRHD (i.e. SCC and date of on-farm death of individual cows, Table 1). Assocations between these WI and other VRHD, therefore, are not discussed in the following paragraphs. Disease, I&R and management Vulvar discharge was associated with twinning and higher calf mortality (Peeler et al., 1994). Respiratory problems were associated with on-farm mortality (McConnel et al., 2008). Downer cows were most often culled in the start of lactation, and were 3.5 times more likely to be culled as healthy cows (Milian-Suazo et al., 1988). In the study of Cox et al. (1986), cows were defined as downer cows when they were nonambulatory for at least 24 h and did not die within 3 d after becoming nonambulatory. Thirty-three percent of the downer cows in this study recovered, 23% were slaughtered and 44% died or were euthanized on-farm. Currently, the transport of downer cows is prohibited in various countries; therefore, downer cows are less often slaughtered and more often recover or die on-farm. Farms with pasture as the predominant flooring surface in winter had a lower risk of having downer cows (Green et al., 2008). Dystocia occurred more in primiparous cows than in

22 Chapter 2
multiparous cows and more often with bull calves than with heifer calves (Lombard et al., 2007). Dystocia was associated with increased death rates (Dematawewa and Berger, 1997) and decreased cow survival (i.e. days from calving to culling or death, Bicalho et al., 2007a), whereas it was not associated with culling until 200 DIM (Tenhagen et al., 2007). Dystocia was also associated with a higher risk of stillbirth and mortality of calves (Martinez et al., 1983; Correa et al., 1993; Peeler et al., 1994; Lombard et al., 2007; Tenhagen et al., 2007). Access to pasture and certified organic farming systems were associated with less dystocia (Bendixen et al., 1986; Bruun et al., 2002; Langford et al., 2009). Disease and milk production and composition Diarrhea was associated with a 35.6 kg lower cumulated milk yield from the day of onset to the day of recovery (Bareille et al., 2003). Days in milk was negatively associated with downer cows, and the downer cow syndrome occured most often in the first day after calving (Cox et al., 1986; Correa et al., 1993). In the study of Cox et al. (1986), 58% of the downer cows became nonambulatory within 1 d, and an additional 37% within 100 d after calving. The downer syndrome was associated with high herd milk yields (Cox et al., 1986; Green et al., 2008). Green et al. (2008) found an association between a rolling herd average of > 9,090 kg of milk and the risk of having downer cows on a farm. Dystocia was negatively associated with milk yield and fat and protein contents of milk (Djemali et al., 1987; Dematawewa and Berger, 1997; Domecq et al., 1997b; Fourichon et al., 1999; Bareille et al., 2003; Bicalho et al., 2007a), whereas others found no association (Deluyker et al., 1991; Tenhagen et al., 2007). According to Dematawewa and Berger (1997), loss in milk yield and fat and protein contents due to dystocia were highest in cows with lower parity. Dystocia was not associated with SCC (Tenhagen et al., 2007). Disease and reproduction One study, which used vulvar discharge as an indicator for postpartum metritis, found an association between vulvar discharge, and a lower pregnancy rate and calving in summer (Gautam et al., 2010). Dystocia was associated with decreased conception (Djemali et al., 1987; Dematawewa and Berger, 1997; Bicalho et al., 2007a; Tenhagen et al., 2007) and with a higher number of services in primiparous cows (Dematawewa and Berger, 1997). Absence of pain induced by management procedures The act of tail docking and use of anesthetics in adult cows did not affect milk production (Tom et al., 2002). Although tail docking is generally performed to reduce the risk of mastitis, various studies have found no effect on SCC or bacterial cultures of mastitis (Eicher et al., 2001; Tucker et al., 2001; Schreiner and Ruegg, 2002). No studies were found that investigated associations between VRHD and intact tails in lactating cows or the act of tail docking in calves. Animals can be disbudded when they are less than 3 months of age, and dehorned when they are older. To our knowledge, no studies investigated associations between VRHD and disbudding in calves, dehorning in older animals, or absence of horns in lactating cows.

Herd data and dairy cattle welfare: literature review 23
Results showed no associations between VRHD and disbudding, dehorning, or tail docking. Indirect associations, however, might exist. Docked cows, for example, had higher fly numbers (Eicher et al., 2001) and higher fly numbers were associated with a lower milk yield (Jonsson and Mayer, 1999). Expression of social behaviors Social behaviors and I&R Average age and herd size were associated with agonistic interactions (Mülleder et al., 2007) and interactions were doubled when new cows were introduced individually into the herd instead of pairwise (Neisen et al., 2009). Introduction of new cows into a herd was associated with a 2.6-fold increase of displacements in the feeding area (Von Keyserlingk et al., 2008). Number of displacements did not differ between parities (Proudfoot et al., 2009). Social behaviors and milk production and composition The dominance rank of cows, based on frequencies of displacements, was associated with individual milk yield (Phillips and Rind, 2002; Val-Laillet et al., 2008), but it was cautioned that, for example, age and parity could be confounded with milk yield. Others, however, found no association between frequency of head butts and displacements and daily milk yield (Andersson et al., 1984; Fregonesi and Leaver, 2001). A higher dominance rank of cows was associated with higher fat content of milk (Andersson et al., 1984). Somatic cell count was not associated with agonistic interactions (Mülleder et al., 2007). Expression of other behaviors The number of days per year and hours per day with access to pasture is available in the list of VRHD, but as a dichotomous (yes/no) variable (“access to pasture”, Table 1). The variable implies that cows have or do not have access to pasture for a minimum number of days per year and hours per day. The exact number of days per year and hours per day, however, is unknown. In the following paragraphs, therefore, we describe associations between VRHD and the total number of days per year and hours per day with access to pasture. As much variety exists in the characteristics of indoor- and outdoor- housing systems, effects of access to pasture should be interpreted with care (Rushen et al., 2008). Access to pasture, I&R and management. Obviously, the number of days per year cows spend on pasture largely depends on a farm’s geographic location, due to the length of the grazing season which varies by climate and soil type. Cows in certified organic farming systems are obliged to have access to pasture. Systems with access to pasture had lower culling rates than zero-grazing systems (Washburn et al., 2002; White et al., 2002) and grazing systems in the United States had less land and fewer cows (Gillespie et al., 2009). Access to pasture and milk production and composition Cows with access to pasture produce less milk per lactation than cows in zero-grazing systems (Rust et al., 1995; Soriano et al., 2001; Washburn et al., 2002; White et al., 2002; Hernandez-Mendo et al., 2007; Gillespie et al., 2009), whereas one study reported higher milk yields with access to pasture (Dillon et al., 2002) and another reported equal milk yields with only overnight access to pasture (Chapinal et al.,

24 Chapter 2
2010). One study found higher milk protein content in milk of cows with access to pasture compared with cows with zero-grazing (Dillon et al., 2002), whereas other studies found no difference in milk protein, fat, and lactose contents and SCC (Goldberg et al., 1992; Rust et al., 1995; Soriano et al., 2001; Kennedy et al., 2009). Access to pasture decreased prevalence of streptococci other than Streptococcus agalactiae (Goldberg et al., 1992), and increased conjugated linoleic acid and milk fat C18:1 trans 11 concentration (Khanal et al., 2008). The concentration of conjugated linoleic acid reached its maximum and plateau level after 23 d of access to pasture and declined to the pre-pasture level after 4 d of indoor housing. Access to pasture and reproduction Access to pasture was not associated with reproductive performance (Washburn et al., 2002; White et al., 2002). Good human-animal relationship Avoidance distance, I&R and milk production The percentage of cows that could be touched was negatively associated with herd size (Waiblinger et al., 2003). Avoidance distance was not associated with milk yield (Waiblinger et al., 2002). Besides herd size, no other associations with avoidance distance were found. Various studies, however, found associations between other human-animal relationship tests and milk production and composition, and reproduction parameters. Other human-animal relationship tests and VRHD Aversive handling of cows by stockpeople was negatively associated with milk yield and protein and fat content of milk (Seabrook, 1984; Breuer et al., 2000; Hemsworth et al., 2000; Hemsworth et al., 2002; Waiblinger et al., 2002), whereas one study found no assocation (Munksgaard et al., 2001). The presence of an aversive stockperson increased residual milk by 70% (Rushen et al., 1999). Breuer et al. (2000) suggested that 19% of the variation in milk yield among farms could be ascribed to fear of humans. Flinch, step and kick responses during milking were negatively associated with milk yield (Breuer et al., 2000; Bertenshaw et al., 2008). The association between approach behavior to a human and milk yield was not significant in one study (Hemsworth et al., 2000), but was positive in another study (Breuer et al., 2000). Approach behavior to a human was positively associated with conception rate at first service (Hemsworth et al., 2000). Flight distance was moderately associated with milk yield (Breuer et al., 2000; Bertenshaw et al., 2008). Positive emotional state We found no associations between Qualitative Behavior Assessment scores and VRHD. Nevertheless, the Qualitative Behavior Assessment has been associated with quantitative assessments of social behavior in cattle (Rousing and Wemelsfelder, 2006). Some of these social behavior indicators have been associated with VRHD (see paragraph about Expression of social behaviors).

Herd data and dairy cattle welfare: literature review 25
Discussion The aim of this review was to identify VRHD that were associated with WI. We searched for associations between 27 VRHD and 34 WI. The search yielded associations in 146 studies. For 18 of 34 WI, associations with VRHD were not significant (n = 5 WI) or no studies were found that investigated associations with VRHD (n = 13 WI). Sixteen of 34 WI were associated with VRHD. Almost all VRHD (n = 23) were associated with at least one WI. The WI in this review were taken from the Welfare Quality Assessment Protocol for Dairy Cattle. If welfare audit programs use other on-farm assessment protocols, the results found in this review might be less useful. Although welfare indicators are often based on the same fundamentals, on-farm assessment protocols may include indicators other than the ones used in this review, which could yield different associations with VRHD. Besides this, we used a wide range of VRHD whereas not many countries collect all of these VRHD. Potential of VRHD to estimate the animal welfare may vary among different national herd databases. WI not associated The lack of association with more than half the WI suggests that VRHD may only hold a potential in estimating few aspects of animal welfare. This statement, however, requires some moderation. For most of the 18 WI that were not associated, no studies were found that investigated associations with VRHD. Studies may have been absent because associations were not investigated, or results may not have been published. Associations between VRHD and these WI remain to be explored. With regard to the other WI that yielded non-significant associations with one or more VRHD, no associations were found with these VRHD, but associations with other VRHD were not investigated. Hence, associations between VRHD and the 18 WI that were not associated in this review are largely unknown and require further exploration. We can propose some plausible reasons why associations between WI and VRHD may be absent. First, few associations were found where WI referred to behavioral instead of physiological aspects of animal welfare (e.g. WI of the criteria comfort around resting, expression of social behaviors, good human-animal relationship, and positive emotional state). On the one hand, this might indicate that VRHD have little potential to identify behavioral problems on farms. On the other hand, studies associating behavioral indicators of animal welfare with VRHD are scarce compared with studies associating physiological indicators of animal welfare with VRHD. Because behavioral indicators are important in the assessment of animal welfare (Dawkins, 2003), it is important that associations between VRHD and behavioral WI are included when VRHD are used to estimate the level of animal welfare on farms. Second, few studies were found where WI referred to non-specific disease symptoms (e.g. mean number of coughs, hampered respiration, diarrhea and nasal, ocular and vulvar discharge). Non-specific symptoms are symptoms that are not associated with a particular disease, but rather with several diseases. These diseases have been associated with VRHD, but studies rarely associate non-specific symptoms with VRHD directly. Diarrhea, for example, has not been associated with VRHD but is a sign of, for example, clinical salmonellosis in cows. Clinical salmonellosis, in turn, has been associated with VRHD (e.g. decreased milk production and abortion, Divers and Peek, 2007). Third, few associations were found for resources-based WI (e.g. WI of criteria 2 and 8, Table 2). Resources-based

26 Chapter 2
indicators are those that relate to the environment of the animal, whereas animal-based indicators relate to the state of the animal itself. Resource-based indicators are often favored in on-farm assessment protocols when they are more feasible or reliable than animal-based indicators (Knierim and Winckler, 2009). The fact that some WI in this review were not animal-based, might explain their lack of association with VRHD. Water intake, for example, is an animal-based indicator for absence of thirst and, in contrast to number and water flow of drinkers, water intake was associated with VRHD. Presumably, VRHD (e.g., animal productivity) are more closely related to the state of the animal than to its resources. Hence, the use of animal-based indicators in an on-farm assessment protocol could enhance the potential of VRHD to estimate the level of animal welfare on farms. VRHD associated with WI Almost all VRHD were associated with WI, which indicates that many VRHD are related to the level of animal welfare on farms. This does not necessarily imply that the potential of VRHD to estimate level of animal welfare on farms is high. Variables relating to milk yield, culling and reproduction were associated with the largest number of WI, but using such measures of productivity to monitor animal welfare is controversial (e.g. Main et al., 2003; Whay et al., 2003). Especially when the precise cause of poor animal welfare is unknown, changes or differences in productivity are generally considered to be of little relevance to assess animal welfare. Small changes or structural differences in productivity are found to be associated with many factors besides WI, such as breed or management decisions, and therefore strengths of associations with WI are often low (Mülleder et al., 2007). It was not possible to consider strengths of associations in this review, because studies differed in conditions, association measures and key parameters. Strengths of associations are, however, highly important in indicating the true potential of VRHD to estimate levels of animal welfare on farms, and should be included in future research. Large abrupt changes in productivity may be of greater interest than small changes or structural differences to estimate levels of dairy cattle welfare on farms. A large decrease in individual daily milk yield or a strong increase in individual SCC, for example, does not normally occur in cows with good welfare. Although the exact cause of change may be unknown, animal welfare is likely to be affected in such cases. A few other factors explain why associations found in this study should be interpreted with care. Many studies that were included in this review concerned experimental designs. Associations can be significant in such an experimental setting but not always in common practice. In addition, we included associations between VRHD and WI at the animal level whereas welfare assessments are made at the farm level. Associations at the animal level do not by definition apply at the farm level. For example, individual cow BCS < 1.5 was associated with an SCC > 199,000 cells/mL, but this does not necessarily imply that the percentage of cows with BCS < 1.5 is associated with a higher bulk tank milk SCC. Extrapolation of associations from the animal to the farm level depends on other risk factors, on-farm prevalence, and variation between farms. Besides this, we included mainly univariate associations between VRHD and WI in this review, but we found that VRHD was frequently associated with more than one WI. The numerous causes and effects of changes in productivity emphasize the multifactorial character of VRHD. Multivariate analyses and integration of WI scores may yield interesting results. In the study of Thomsen et al. (2007), for example, integrated scores at the animal level for lameness, body condition, hock lesions, other cutaneous lesions, vaginal discharge, condition of hair coat and

Herd data and dairy cattle welfare: literature review 27
general condition were associated with various VRHD. Existing aggregation methods (e.g. as developed by Botreau et al., 2007a; Botreau et al., 2007b) could be used to integrate WI scores. Cross sectional studies using integrated welfare scores at the farm level are needed to more accurately determine the value of VRHD to estimate levels of animal welfare on farms.
Conclusions Twenty-three VRHD were associated with 16 WI. Associations between VRHD and other WI were not significant (n = 5 WI) or no studies were found that investigated associations with VRHD (n = 13 WI). The VRHD that related to milk yield, culling and reproduction were associated with the largest number of WI. Few associations were found with WI that referred to behavioral aspects of animal welfare, non-specific disease symptoms or resources-based indicators. It was concluded that many VRHD are associated with WI, but the true potential of these VRHD to estimate the level of animal welfare on dairy farms should be further explored.
References Amory, J. R., Z. E. Barker, J. L. Wright, S. A. Mason, R. W. Blowey, and L. E. Green. 2008. Associations between sole ulcer, white line
disease and digital dermatitis and the milk yield of 1824 dairy cows on 30 dairy cow farms in England and Wales from February 2003-November 2004. Prev. Vet. Med. 83: 381-391.
Andersson, M. 1987. Effects of number and location of water bowls and social rank on drinking behaviour and performance of loose-housed dairy cows. Appl. Anim. Behav. Sci. 17: 19-31.
Andersson, M., J. Schaar, and H. Wiktorsson. 1984. Effects of drinking water flow rates and social rank on performance and drinking behaviour of tied-up dairy cows. Livest. Prod. Sci. 11: 599-610.
Archer, S. C., M. J. Green, and J. N. Huxley. 2010. Association between milk yield and serial locomotion score assessments in UK dairy cows. J. Dairy Sci. 93: 4045-4053.
Bareille, N., F. Beaudeau, S. Billon, A. Robert, and P. Faverdin. 2003. Effects of health disorders on feed intake and milk production in dairy cows. Livest. Prod. Sci. 83: 53-62.
Barkema, H. W., J. D. Westrik, K. A. S. van Keulen, Y. H. Schukken, and A. Brand. 1994. The effects of lameness on reproductive performance, milk production and culling in Dutch dairy farms. Prev. Vet. Med. 20: 249-259.
Bartussek, H., C. H. M. Leeb, and S. Held, 2000. Animal Needs Index for Cattle- ANI35L/2000 - cattle. Federal Research Institute for Agriculture in Alpine Regions BAL Gumpenstein, Irdning, Austria.
Beaudeau, F., K. Frankena, C. Fourichon, H. Seegers, B. Faye, and J. P. T. M. Noordhuizen. 1994. Associations between health disorders during two consecutive lactations and culling in dairy cows. Livest. Prod. Sci. 38: 207-216.
Bendixen, P. H., B. Vilson, I. Ekesbo, and D. B. Åstrand. 1986. Disease frequencies of tied zero-grazing dairy cows and of dairy cows on pasture during summer and tied during winter. Prev. Vet. Med. 4: 291-306.
Berry, D. P., F. Buckley, and P. Dillon. 2007. Body condition score and live-weight effects on milk production in Irish Holstein-Friesian dairy cows. Animal 1: 1351-1359.
Bertenshaw, C., P. Rowlinson, H. Edge, S. Douglas, and R. Shiel. 2008. The effect of different degrees of 'positive' human-animal interaction during rearing on the welfare and subsequent production of commercial dairy heifers. Appl. Anim. Behav. Sci. 114: 65-75.
Bewley, J. M. and M. M. Schutz. 2008. Review: An interdisciplinary review of body condition scoring for dairy cattle. Prof. Anim. Sci. 24: 507-529.
Bicalho, R. C., S. H. Cheong, K. N. Galvao, L. D. Warnick, and C. L. Guard. 2007a. Effect of twin birth calvings on milk production, reproductive performance, and survival of lactating cows. J. Am. Vet. Med. Assoc. 231: 1390-1397.
Bicalho, R. C., F. Vokey, H. N. Erb, and C. L. Guard. 2007b. Visual locomotion scoring in the first seventy days in milk: Impact on pregnancy and survival. J. Dairy Sci. 90: 4586-4591.
Bicalho, R. C., L. D. Warnick, and C. L. Guard. 2008. Strategies to analyze milk losses caused by diseases with potential incidence throughout the lactation: A lameness example. J. Dairy Sci. 91: 2653-2661.
Bjerg, M., M. D. Rasmussen, and M. O. Nielsen. 2005. Changes in freezing point of blood and milk during dehydration and rehydration in lactating cows. J. Dairy Sci. 88: 3174-3185.

28 Chapter 2
Booth, C. J., L. D. Warnick, Y. T. Gröhn, D. O. Maizon, C. L. Guard, and D. Janssen. 2004. Effect of lameness on culling in dairy cows. J. Dairy Sci. 87: 4115-4122.
Botreau, R., M. Bonde, A. Butterworth, P. Perny, M. B. M. Bracke, J. Capdeville, and I. Veissier. 2007a. Aggregation of measures to produce an overall assessment of animal welfare. Part 1: a review of existing methods. Animal 1: 1179-1187.
Botreau, R., M. B. M. Bracke, P. Perny, A. Butterworth, J. Capdeville, C. G. Van Reenen, and I. Veissier. 2007b. Aggregation of measures to produce an overall assessment of animal welfare. Part 2: analysis of constraints. Animal 1: 1188-1197.
Bourchier, C. P., J. M. Hutchinson, and T. A. Benson. 1987. The relationship between milk yield, body condition and reproductive performance in high yielding dairy cows. Anim. Prod. 44: 460-460.
Bowell, V. A., L. J. Rennie, G. Tierney, A. B. Lawrence, and M. J. Haskell. 2003. Relationships between building design, management system and dairy cow welfare. Anim. Welf. 12: 547-552.
Breen, J. E., A. J. Bradley, and M. J. Green. 2009a. Quarter and cow risk factors associated with a somatic cell count greater than 199,000 cells per milliliter in United Kingdom dairy cows. J. Dairy Sci. 92: 3106-3115.
Breen, J. E., M. J. Green, and A. J. Bradley. 2009b. Quarter and cow risk factors associated with the occurrence of clinical mastitis in dairy cows in the United Kingdom. J. Dairy Sci. 92: 2551-2561.
Breuer, K., P. H. Hemsworth, J. L. Barnett, L. R. Matthews, and G. J. Coleman. 2000. Behavioural response to humans and the productivity of commercial dairy cows. Appl. Anim. Behav. Sci. 66: 273-288.
Bruun, J., A. K. Ersboll, and L. Alban. 2002. Risk factors for metritis in Danish dairy cows. Prev. Vet. Med. 54: 179-190. Buckley, F., K. O'Sullivan, J. F. Mee, R. D. Evans, and P. Dillon. 2003. Relationships among milk yield, body condition, cow weight,
and reproduction in spring-calved Holstein-Friesians. J. Dairy Sci. 86: 2308-2319. Burgos, M. S., M. Senn, F. Sutter, M. Kreuzer, and W. Langhans. 2001. Effect of water restriction on feeding and metabolism in
dairy cows. Am. J. Physiol. Regul. Integr. Comp. Physiol. 280: R418-R427. Busato, A., P. Trachsel, and J. W. Blum. 2000. Frequency of traumatic cow injuries in relation to housing systems in Swiss organic
dairy herds. J. Vet. Med. Ser. A 47: 221-229. Cardot, V., Y. Le Roux, and S. Jurjanz. 2008. Drinking behavior of lactating dairy cows and prediction of their water intake. J. Dairy
Sci. 91: 2257-2264. Castle, M. E. and T. P. Thomas. 1975. The water intake of British Friesian cows on rations containing various forages. Anim. Prod.
20: 181-189. Chapinal, N., C. Goldhawk, A. M. de Passillé, M. A. G. von Keyserlingk, D. M. Weary, and J. Rushen. 2010. Overnight access to
pasture does not reduce milk production or feed intake in dairy cattle. Livest. Sci. 129: 104-110. Collick, D. W., W. R. Ward, and H. Dobson. 1989. Associations between types of lameness and fertility. Vet. Rec. 125: 103-106. Correa, M. T., H. N. Erb, and J. M. Scarlett. 1993. Risk factors for downer cow syndrome. J. Dairy Sci. 76: 3460-3463. Cox, V. S., W. E. Marsh, G. R. Steuernagel, T. F. Fletcher, and J. S. Onapito. 1986. Downer cow occurrence in Minnesota dairy herds.
Prev. Vet. Med. 4: 249-260. Dahlborn, K., M. Åkerlind, and G. Gustafson. 1998. Water intake by dairy cows selected for high or low milk-fat percentage when
fed two forage to concentrate ratios with hay or silage. Sw. J. Agric. Res. 28: 167-176. Dawkins, M. S. 2003. Behaviour as a tool in the assessment of animal welfare. Zoology 106: 383-387. Dechow, C. D., G. W. Rogers, and J. S. Clay. 2001. Heritabilities and correlations among body condition scores, production traits,
and reproductive performance. J. Dairy Sci. 84: 266-275. Deluyker, H. A., J. M. Gay, L. D. Weaver, and A. S. Azari. 1991. Change of milk yield with clinical diseases for a high producing
dairy herd. J. Dairy Sci. 74: 436-445. Dematawewa, C. M. B. and P. J. Berger. 1997. Effect of dystocia on yield, fertility, and cow losses and an economic evaluation of
dystocia scores for Holsteins. J. Dairy Sci. 80: 754-761. Dillon, P., S. Crosse, B. O'Brien, and R. W. Mayes. 2002. The effect of forage type and level of concentrate supplementation on the
performance of spring-calving dairy cows in early lactation. Grass Forage Sci. 57: 212-223. Dippel, S., M. Dolezal, C. Brenninkmeyer, J. Brinkmann, S. March, U. Knierim, and C. Winckler. 2009. Risk factors for lameness in
freestall-housed dairy cows across two breeds, farming systems, and countries. J. Dairy Sci. 92: 5476-5486. Divers, T. J. and S. F. Peek. 2007. Rebhun’s Diseases of Dairy Cattle. 2nd ed. Saunders Elsevier, St. Louis, Mo. Djemali, M., A. E. Freeman, and P. J. Berger. 1987. Reporting of dystocia scores and effects of dystocia on production, days open,
and days dry from dairy herd improvement data. J. Dairy Sci. 70: 2127-2131. Dohoo, I. R. and S. W. Martin. 1984. Disease, production and culling in Holstein-Friesian cows, V: Survivorship. Prev. Vet. Med. 2:
771-784. Domecq, J. J., A. L. Skidmore, J. W. Lloyd, and J. B. Kaneene. 1997a. Relationship between body condition scores and conception
at first artificial insemination in a large dairy herd of high yielding Holstein cows. J. Dairy Sci. 80: 113-120. Domecq, J. J., A. L. Skidmore, J. W. Lloyd, and J. B. Kaneene. 1997b. Relationship between body condition scores and milk yield in
a large dairy herd of high yielding Holstein cows. J. Dairy Sci. 80: 101-112. Eicher, S. D., J. L. Morrow-Tesch, J. L. Albright, and R. E. Williams. 2001. Tail-docking alters fly numbers, fly-avoidance behaviors,
and cleanliness, but not physiological measures. J. Dairy Sci. 84: 1822-1828. Ellis, K. A., G. T. Innocent, M. Mihm, P. Cripps, W. G. McLean, C. V. Howard, and D. Grove-White. 2007. Dairy cow cleanliness and
milk quality on organic and conventional farms in the UK. J. Dairy Res. 74: 302-310. Esslemont, R. J. and M. A. Kossaibati. 1997. Culling in 50 dairy herds in England. Vet. Rec. 140: 36-39.

Herd data and dairy cattle welfare: literature review 29
Fourichon, C., H. Seegers, N. Bareille, and F. Beaudeau. 1999. Effects of disease on milk production in the dairy cow: a review. Prev. Vet. Med. 41: 1-35.
Fregonesi, J. A. and J. D. Leaver. 2001. Behaviour, performance and health indicators of welfare for dairy cows housed in strawyard or cubicle systems. Livest. Prod. Sci. 68: 205-216.
Friggens, N. C. and J. H. Badsberg. 2007. The effect of breed and parity on curves of body condition during lactation estimated using a non-linear function. Animal 1: 565-574.
Gallo, L., P. Carnier, M. Cassandro, R. Mantovani, L. Bailoni, B. Contiero, and G. Bittante. 1996. Change in body condition score of Holstein cows as affected by parity and mature equivalent milk yield. J. Dairy Sci. 79: 1009-1015.
Garnsworthy, P. C. and G. P. Jones. 1987. The influence of body condition at calving and dietary protein supply on voluntary food intake and performance in dairy cows. Anim. Prod. 44: 347-353.
Garnsworthy, P. C. and J. H. Topps. 1982. The effect of body condition of dairy cows at calving on their food intake and performance when given complete diets. Anim. Prod. 35: 113-119.
Gautam, G., T. Nakao, K. Koike, S. T. Long, M. Yusuf, R. M. S. B. K. Ranasinghe, and A. Hayashi. 2010. Spontaneous recovery or persistence of postpartum endometritis and risk factors for its persistence in Holstein cows. Theriogenology 73: 168-179.
Gillespie, J., R. Nehring, C. Hallahan, and C. Sandretto. 2009. Pasture-based dairy systems: Who are the producers and are their operations more profitable than conventional dairies? J. Agric. Res. Econ. 34: 412-427.
Gillund, P., O. Reksen, Y. T. Gröhn, and K. Karlberg. 2001. Body condition related to ketosis and reproductive performance in Norwegian dairy cows. J. Dairy Sci. 84: 1390-1396.
Goldberg, J. J., E. E. Wildman, J. W. Pankey, J. R. Kunkel, D. B. Howard, and B. M. Murphy. 1992. The influence of intensively managed rotational grazing, traditional continuous grazing, and confinement housing on bulk tank milk quality and udder health. J. Dairy Sci. 75: 96-104.
Green, A. L., J. E. Lombard, L. P. Garber, B. A. Wagner, and G. W. Hill. 2008. Factors associated with occurrence and recovery of nonambulatory dairy cows in the United States. J. Dairy Sci. 91: 2275-2283.
Green, L. E., V. J. Hedges, Y. H. Schukken, R. W. Blowey, and A. J. Packington. 2002. The impact of clinical lameness on the milk yield of dairy cows. J. Dairy Sci. 85: 2250-2256.
Groehn, J. A., J. B. Kaneene, and D. Foster. 1992. Risk-factors associated with lameness in lactating dairy cattle in Michigan. Prev. Vet. Med. 14: 77-85.
Haskell, M. J., L. J. Rennie, V. A. Bowell, M. J. Bell, and A. B. Lawrence. 2006. Housing system, milk production, and zero-grazing effects on lameness and leg injury in dairy cows. J. Dairy Sci. 89: 4259-4266.
Hemsworth, P. H., G. J. Coleman, J. L. Barnett, and S. Borg. 2000. Relationships between human-animal interactions and productivity of commercial dairy cows. J. Anim. Sci. 78: 2821-2831.
Hemsworth, P. H., G. J. Coleman, J. L. Barnett, S. Borg, and S. Dowling. 2002. The effects of cognitive behavioral intervention on the attitude and behavior of stockpersons and the behavior and productivity of commercial dairy cows. J. Anim. Sci. 80: 68-78.
Hernandez-Mendo, O., M. A. G. von Keyserlingk, D. M. Veira, and D. M. Weary. 2007. Effects of pasture on lameness in dairy cows. J. Dairy Sci. 90: 1209-1214.
Hernandez, J., J. K. Shearer, and D. W. Webb. 2001. Effect of lameness on the calving to conception interval in dairy cows. J. Am. Vet. Med. Assoc. 218: 1611-1614.
Hernandez, J., J. K. Shearer, and D. W. Webb. 2002. Effect of lameness on milk yield in dairy cows. J. Am. Vet. Med. Assoc. 220: 640-644.
Hernandez, J. A., E. J. Garbarino, J. K. Shearer, C. A. Risco, and W. W. Thatcher. 2005. Comparison of milk yield in dairy cows with different degrees of lameness. J. Am. Vet. Med. Assoc. 227: 1292-1296.
Hirst, W. M., R. D. Murray, W. R. Ward, and N. P. French. 2002. Generalised additive models and hierarchical logistic regression of lameness in dairy cows. Prev. Vet. Med. 55: 37-46.
Hoedemaker, M., D. Prange, and Y. Gundelach. 2009. Body condition change ante- and postpartum, health and reproductive performance in German Holstein cows. Reprod. Domest. Anim. 44: 167-173.
Holter, J. B., M. J. Slotnick, H. H. Hayes, C. K. Bozak, W. E. Urban, and M. L. McGilliard. 1990. Effect of prepartum dietary energy on condition score, postpartum energy, nitrogen partitions, and lactation production responses. J. Dairy Sci. 73: 3502-3511.
Holter, J. B. and W. E. Urban. 1992. Water partitioning and intake prediction in dry and lactating Holstein cows. J. Dairy Sci. 75: 1472-1479.
Jensen, M. B. 1999. Adaptation to tethering in yearling dairy heifers assessed by the use of lying down behaviour. Appl. Anim. Behav. Sci. 62: 115-123.
Jonsson, N. N. and D. G. Mayer. 1999. Estimation of the effects of buffalo fly (Haematobia irritans exigua) on the milk production of dairy cattle based on a meta-analysis of literature data. Med. Vet. Entomol. 13: 372-376.
Kennedy, E., M. McEvoy, J. P. Murphy, and M. O'Donovan. 2009. Effect of restricted access time to pasture on dairy cow milk production, grazing behavior, and dry matter intake. J. Dairy Sci. 92: 168-176.
Khanal, R. C., T. Dhiman, and R. L. Boman. 2008. Changes in fatty acid composition of milk from lactating dairy cows during transition to and from pasture. Livest. Sci. 114: 164-175.
Kielland, C., L. E. Ruud, A. J. Zanella, and O. Østerås. 2009. Prevalence and risk factors for skin lesions on legs of dairy cattle housed in freestalls in Norway. J. Dairy Sci. 92: 5487-5496.

30 Chapter 2
Kielland, C., E. Skjerve, O. Østerås, and A. J. Zanella. 2010. Dairy farmer attitudes and empathy toward animals are associated with animal welfare indicators. J. Dairy Sci. 93: 2998-3006.
Knierim, U. and C. Winckler. 2009. On-farm welfare assessment in cattle: validity, reliability and feasibility issues and future perspectives with special regard to the Welfare Quality approach. Anim. Welf. 18: 451-458.
Knott, L., J. F. Tarlton, H. Craft, and A. J. F. Webster. 2007. Effects of housing, parturition and diet change on the biochemistry and biomechanics of the support structures of the hoof of dairy heifers. Vet. J. 174: 277-287.
Kramer, E., E. Stamer, K. Mahlkow, W. Lüpping, and J. Krieter. 2008. Relationship between water intake, dry matter intake and daily milk yield on a German research farm. Livest. Sci. 115: 99-104.
Krohn, C. C. and L. Munksgaard. 1993. Behaviour of dairy cows kept in extensive (loose housing/pasture) or intensive (tie stall) environments II. Lying and lying-down behaviour. Appl. Anim. Behav. Sci. 37: 1-16.
Langford, F. M., K. M. Rutherford, M. C. Jack, L. Sherwood, A. B. Lawrence, and M. J. Haskell. 2009. A comparison of management practices, farmer-perceived disease incidence and winter housing on organic and non-organic dairy farms in the UK. J. Dairy Res. 76: 6-14.
Leeb, C. H., D. C. J. Main, H. R. Whay, and A. J. F. Webster, 2004. Bristol welfare assurance programme – Cattle assessment. University of Bristol, UK.
Little, W., K. A. Collis, P. T. Gleed, B. F. Sansom, W. M. Allen, and A. J. Quick. 1980. Effect of reduced water intake by lactating dairy cows on behaviour, milk yield and blood composition. Vet. Rec. 106: 547-551.
Little, W. and S. R. Shaw. 1978. A note on the individuality of the intake of drinking water by dairy cows. Anim. Prod. 26: 225–227. Lombard, J. E., F. B. Garry, S. M. Tomlinson, and L. P. Garber. 2007. Impacts of dystocia on health and survival of dairy calves. J.
Dairy Sci. 90: 1751-1760. Lucey, S., G. J. Rowlands, and A. M. Russell. 1986. The association between lameness and fertility in dairy cows. Vet. Rec. 118:
628-631. Machado, V. S., L. S. Caixeta, J. A. A. McArt, and R. C. Bicalho. 2010. The effect of claw horn disruption lesions and body condition
score at dry-off on survivability, reproductive performance, and milk production in the subsequent lactation. J. Dairy Sci. 93: 4071-4078.
Main, D. C. J., H. R. Whay, L. E. Green, and A. J. F. Webster. 2003. Preliminary investigation into the use of expert opinion to compare the overall welfare of dairy cattle farms in different farm assurance schemes. Anim. Welf. 12: 565-569.
Markusfeld, O., N. Galon, and E. Ezra. 1997. Body condition score, health, yield and fertility in dairy cows. Vet. Rec. 141: 67-72. Martinez, M. L., A. E. Freeman, and P. J. Berger. 1983. Genetic relationship between calf livability and calving difficulty of
Holsteins. J. Dairy Sci. 66: 1494-1502. McConnel, C. S., J. E. Lombard, B. A. Wagner, and F. B. Garry. 2008. Evaluation of factors associated with increased dairy cow
mortality on United States dairy operations. J. Dairy Sci. 91: 1423-1432. Menzies, F. D., D. G. Bryson, T. McCallion, and D. I. Matthews. 1995. A study of mortality among suckler and dairy cows in
Northern Ireland in 1992. Vet. Rec. 137: 615-615. Meyer, U., M. Everinghoff, D. Gadeken, and G. Flachowsky. 2004. Investigations on the water intake of lactating dairy cows. Livest.
Prod. Sci. 90: 117-121. Milian-Suazo, F., H. N. Erb, and R. D. Smith. 1988. Descriptive epidemiology of culling in dairy cows from 34 herds in New York
State. Prev. Vet. Med. 6: 243-251. Mülleder, C., J. Troxler, G. Laaha, and S. Waiblinger. 2007. Can environmental variables replace some animal-based parameters in
welfare assessment of dairy cows? Anim. Welf. 16: 153-156. Munksgaard, L., A. M. DePassillé, J. Rushen, M. S. Herskin, and A. M. Kristensen. 2001. Dairy cows' fear of people: social learning,
milk yield and behaviour at milking. Appl. Anim. Behav. Sci. 73: 15-26. Neisen, G., B. Wechsler, and L. Gygax. 2009. Choice of scan-sampling intervals: An example with quantifying neighbours in dairy
cows. Appl. Anim. Behav. Sci. 116: 134-140. Olmos, G., L. Boyle, A. Hanlon, J. Patton, J. J. Murphy, and J. F. Mee. 2009. Hoof disorders, locomotion ability and lying times of
cubicle-housed compared to pasture-based dairy cows. Livest. Sci. 125: 199-207. Østerås, O., I. Vågsholm, and A. Lund. 1990. Teat lesions with reference to housing and milking management. J. Vet. Med. Ser. A
37: 520-524. Pasman, E. J., M. J. Otte, and R. J. Esslemont. 1995. Influences of milk yield, fertility and health in the first lactation on the length
of productive life of dairy cows in Great Britain. Prev. Vet. Med. 24: 55-63. Peeler, E. J., M. J. Otte, and R. J. Esslemont. 1994. Interrelationships of periparturient diseases in dairy cows. Vet. Rec. 134: 129-
132. Phillips, C. J. C. and M. I. Rind. 2002. The effects of social dominance on the production and behavior of grazing dairy cows
offered forage supplements. J. Dairy Sci. 85: 51-59. Pinheiro Machado Filho, L. C., D. L. Teixeira, D. M. Weary, M. A. G. von Keyserlingk, and M. J. Hötzel. 2004. Designing better water
troughs: dairy cows prefer and drink more from larger troughs. Appl. Anim. Behav. Sci. 89: 185-193. Plesch, G., N. Broerkens, S. Laister, C. Winckler, and U. Knierim. 2010. Reliability and feasibility of selected measures concerning
resting behaviour for the on-farm welfare assessment in dairy cows. Appl. Anim. Behav. Sci. 126: 19-26. Proudfoot, K. L., D. M. Veira, D. M. Weary, and M. A. G. von Keyserlingk. 2009. Competition at the feed bunk changes the feeding,
standing, and social behavior of transition dairy cows. J. Dairy Sci. 92: 3116-3123.

Herd data and dairy cattle welfare: literature review 31
Pryce, J. E., M. P. Coffey, and G. Simm. 2001. The relationship between body condition score and reproductive performance. J. Dairy Sci. 84: 1508-1515.
Pryce, J. E., B. L. Nielsen, R. F. Veerkamp, and G. Simm. 1999. Genotype and feeding system effects and interactions for health and fertility traits in dairy cattle. Livest. Prod. Sci. 57: 193-201.
Rajala-Schultz, P. J. and Y. T. Gröhn. 1999. Culling of dairy cows. Part I. Effects of diseases on culling in Finnish Ayrshire cows. Prev. Vet. Med. 41: 195-208.
Regula, G., J. Danuser, B. Spycher, and B. Wechsler. 2004. Health and welfare of dairy cows in different husbandry systems in Switzerland. Prev. Vet. Med. 66: 247-264.
Reneau, J. K., A. J. Seykora, B. J. Heins, M. I. Endres, R. J. Farnsworth, and R. F. Bey. 2005. Association between hygiene scores and somatic cell scores in dairy cattle. J. Am. Vet. Med. Assoc. 227: 1297-1301.
Roche, J. R., P. G. Dillon, C. R. Stockdale, L. H. Baumgard, and M. J. VanBaale. 2004. Relationships among international body condition scoring systems. J. Dairy Sci. 87: 3076-3079.
Roche, J. R., N. C. Friggens, J. K. Kay, M. W. Fisher, K. J. Stafford, and D. P. Berry. 2009. Invited review: Body condition score and its association with dairy cow productivity, health, and welfare. J. Dairy Sci. 92: 5769-5801.
Roche, J. R., J. M. Lee, K. A. Macdonald, and D. P. Berry. 2007a. Relationships among body condition score, body weight, and milk production variables in pasture-based dairy cows. J. Dairy Sci. 90: 3802-3815.
Roche, J. R., K. A. Macdonald, C. R. Burke, J. M. Lee, and D. P. Berry. 2007b. Associations among body condition score, body weight, and reproductive performance in seasonal-calving dairy cattle. J. Dairy Sci. 90: 376-391.
Rousing, T. and F. Wemelsfelder. 2006. Qualitative assessment of social behaviour of dairy cows housed in loose housing systems. Appl. Anim. Behav. Sci. 101: 40-53.
Rowlands, G. J., A. M. Russell, and L. A. Williams. 1985. Effects of stage of lactation, month, age, origin and heart girth on lameness in dairy cattle. Vet. Rec. 117: 576-580.
Ruegg, P. L., W. J. Goodger, C. A. Holmberg, L. D. Weaver, and E. M. Huffman. 1992. Relation among body condition score, milk production, and serum urea nitrogen and cholesterol concentrations in high-producing Holstein dairy cows in early lactation. Am. J. Vet. Res. 53: 5-9.
Ruegg, P. L. and R. L. Milton. 1995. Body condition scores of Holstein cows on Prince Edward Island, Canada: relationships with yield, reproductive performance, and disease. J. Dairy Sci. 78: 552-564.
Rushen, J., A. M. de Passillé, and L. Munksgaard. 1999. Fear of people by cows and effects on milk yield, behavior, and heart rate at milking. J. Dairy Sci. 82: 720-727.
Rushen, J., A. M. de Passillé, M. A. G. von Keyserlingk, and D. M. Weary. 2008. The welfare of cattle. Springer, Dordrecht, the Netherlands.
Rust, J. W., C. C. Sheaffer, V. R. Eidman, R. D. Moon, and R. D. Mathison. 1995. Intensive rotational grazing for dairy cattle feeding. Am. J. Alt. Agric. 10: 147-151.
Rutherford, K. M. D., F. M. Langford, M. C. Jack, L. Sherwood, A. B. Lawrence, and M. J. Haskell. 2008. Hock injury prevalence and associated risk factors on organic and nonorganic dairy farms in the United Kingdom. J. Dairy Sci. 91: 2265-2274.
Rutherford, K. M. D., F. M. Langford, M. C. Jack, L. Sherwood, A. B. Lawrence, and M. J. Haskell. 2009. Lameness prevalence and risk factors in organic and non-organic dairy herds in the United Kingdom. Vet. J. 180: 95-105.
Sandgren, C. H., A. Lindberg, and L. J. Keeling. 2009. Using a national dairy database to identify herds with poor welfare. Anim. Welf. 18: 523-532.
Schreiner, D. A. and P. L. Ruegg. 2002. Effects of tail docking on milk quality and cow cleanliness. J. Dairy Sci. 85: 2503-2511. Schreiner, D. A. and P. L. Ruegg. 2003. Relationship between udder and leg hygiene scores and subclinical mastitis. J. Dairy Sci.
86: 3460-3465. Seabrook, M. F. 1984. The psychological interaction between the stockman and his animals and its influence on performance of
pigs and dairy-cows. Vet. Rec. 115: 84-87. Simensen, E., O. Østerås, K. E. Boe, C. Kielland, L. E. Ruud, and G. Naess. 2010. Housing system and herd size interactions in
Norwegian dairy herds; associations with performance and disease incidence. Acta Vet. Scand. 52. Somers, J. G. C. J., K. Frankena, E. N. Noordhuizen-Stassen, and J. H. M. Metz. 2003. Prevalence of claw disorders in Dutch dairy
cows exposed to several floor systems. J. Dairy Sci. 86: 2082-2093. Soriano, F. D., C. E. Polan, and C. N. Miller. 2001. Supplementing pasture to lactating Holsteins fed a total mixed ration diet. J.
Dairy Sci. 84: 2460-2468. Stockdale, C. R. 2001. Body condition at calving and the performance of dairy cows in early lactation under Australian conditions:
A review. Aust. J. Exp. Agric. 41: 823-839. Teixeira, D. L., M. J. Hötzel, and L. C. P. Machado Filho. 2006. Designing better water troughs: 2. Surface area and height, but not
depth, influence dairy cows' preference. Appl. Anim. Behav. Sci. 96: 169-175. Tenhagen, B. A., A. Helmbold, and W. Heuwieser. 2007. Effect of various degrees of dystocia in dairy cattle on calf viability, milk
production, fertility and culling. J. Vet. Med. Ser. A 54: 98-102. Thomsen, P. T., A. M. Kjeldsen, J. T. Sørensen, and H. Houe. 2004. Mortality (including euthanasia) among Danish dairy cows
(1990-2001). Prev. Vet. Med. 62: 19-33. Thomsen, P. T., S. Ostergaard, J. T. Sørensen, and H. Houe. 2007. Loser cows in Danish dairy herds: Definition, prevalence and
consequences. Prev. Vet. Med. 79: 116-135.

32 Chapter 2
Thomsen, P. T. and J. T. Sørensen. 2009. Factors affecting the risk of euthanasia for cows in Danish dairy herds. Vet. Rec. 165: 43-45.
Tom, E. M., I. J. H. Duncan, T. M. Widowski, K. G. Bateman, and K. E. Leslie. 2002. Effects of tail docking using a rubber ring with or without anesthetic on behavior and production of lactating cows. J. Dairy Sci. 85: 2257-2265.
Treacher, R. J., I. M. Reid, and C. J. Roberts. 1986. Effect of body condition at calving on the health and performance of dairy cows. Anim. Prod. 43: 1-6.
Tucker, C. B., D. Fraser, and D. M. Weary. 2001. Tail docking dairy cattle: Effects on cow cleanliness and udder health. J. Dairy Sci. 84: 84-87.
Val-Laillet, D., A. M. de Passillé, J. Rushen, and M. A. G. von Keyserlingk. 2008. The concept of social dominance and the social distribution of feeding-related displacements between cows. Appl. Anim. Behav. Sci. 111: 158-172.
Von Keyserlingk, M. A. G., D. Olenick, and D. M. Weary. 2008. Acute behavioral effects of regrouping dairy cows. J. Dairy Sci. 91: 1011-1016.
Waiblinger, S., C. Menke, and G. Coleman. 2002. The relationship between attitudes, personal characteristics and behaviour of stockpeople and subsequent behaviour and production of dairy cows. Appl. Anim. Behav. Sci. 79: 195-219.
Waiblinger, S., C. Menke, and D. W. Folsch. 2003. Influences on the avoidance and approach behaviour of dairy cows towards humans on 35 farms. Appl. Anim. Behav. Sci. 84: 23-39.
Waltner, S. S., J. P. McNamara, and J. K. Hillers. 1993. Relationships of body condition score to production variables in high producing Holstein dairy cattle. J. Dairy Sci. 76: 3410-3419.
Ward, W. R., J. W. Hughes, W. B. Faull, P. J. Cripps, J. P. Sutherland, and J. E. Sutherst. 2002. Observational study of temperature moisture, pH and bacteria in straw bedding, and faecal consistency, cleanliness and mastitis in cows in four dairy herds. Vet. Rec. 151: 199-206.
Warnick, L. D., D. Janssen, C. L. Guard, and Y. T. Grohn. 2001. The effect of lameness on milk production in dairy cows. J. Dairy Sci. 84: 1988-1997.
Washburn, S. P., S. L. White, J. T. Green Jr, and G. A. Benson. 2002. Reproduction, mastitis, and body condition of seasonally calved Holstein and Jersey cows in confinement or pasture systems. J. Dairy Sci. 85: 105-111.
Weary, D. M. and I. Taszkun. 2000. Hock lesions and free-stall design. J. Dairy Sci. 83: 697-702. Webster, A. J. F., D. C. J. Main, and H. R. Whay. 2004. Welfare assessment: Indices from clinical observation. Anim. Welf. 13: S93-
S98. Welfare Quality. 2009. Welfare Quality Assessment Protocol for Cattle. Welfare Quality Consortium, Lelystad, the Netherlands. Wemelsfelder, F. 2007. How animals communicate quality of life: the qualitative assessment of behaviour. Anim. Welf. 16: 25-31. Whay, H. R., D. C. J. Main, L. E. Green, and A. J. F. Webster. 2003. Assessment of the welfare of dairy cattle using animal-based
measurements: Direct observations and investigation of farm records. Vet. Rec. 153: 197-202. White, S. L., G. A. Benson, S. P. Washburn, and J. T. Green Jr. 2002. Milk production and economic measures in confinement or
pasture systems using seasonally calved Holstein and Jersey cows. J. Dairy Sci. 85: 95-104. Wildman, E. E., G. M. Jones, P. E. Wagner, R. L. Boman, H. F. Troutt Jr, and T. N. Lesch. 1982. A dairy cow body condition scoring
system and its relationship to selected production characteristics. J. Dairy Sci. 65: 495-501. Winckler, C. and S. Willen. 2001. The reliability and repeatability of a lameness scoring system for use as an indicator of welfare in
dairy cattle. Acta Agric. Scand. A Anim. Sci.: 103-107.


34 Chapter 3
Exploring the value of routinely collected herd data for estimating dairy cattle welfare M. de Vries1, E.A.M. Bokkers1, G. van Schaik2, B. Engel3, T. Dijkstra2, and I.J.M. de Boer1 1 Animal Production Systems group, Wageningen University, Wageningen, the Netherlands, 2 GD Animal Health Service, Deventer, the Netherlands, 3 Biometris, Wageningen University, Wageningen, the Netherlands
Submitted to Journal of Dairy Science
Abstract Routine on-farm assessment of dairy cattle welfare is time-consuming and, therefore, expensive. A promising, more efficient strategy is to first estimate the level of animal welfare based on herd data available in national databases, in order to reduce the number of on-farm assessments. Our aim was to explore the value of routine herd data for estimating dairy cattle welfare at the herd level. From November 2009 through March 2010, seven trained observers collected data for 41 welfare indicators in a selected sample of 183 loose housed- and 13 tethered Dutch dairy herds (herd size: 10 to 211 cows) using the Welfare Quality protocol for cattle. For the same herds, routine herd data relating to demography, management, milk production and composition, and fertility were extracted from several national databases. Routine herd data were used as potential predictors for each welfare indicator in logistic regression at the herd level. Nineteen welfare indicators were excluded from the predictions, because they showed a prevalence below 5% (15 indicators), or were already listed as routine herd data (four indicators). Predictions were less accurate for seven welfare indicators, moderately accurate for 14 indicators, and highly accurate for one indicator. By forcing to detect nearly all herds with a welfare problem (sensitivity of at least 97.5%), specificity ranged from 0 to 81%. By forcing almost no herds to be incorrectly classified as having a welfare problem (specificity of at least 97.5%), sensitivity ranged from 0 to 67%. Overall, the best performing prediction models were those for the indicators access to at least two drinkers (resource-based), percentage of very lean cows, cows lying outside the supposed lying area, and cows with vulvar discharge (animal-based). Most frequently included predictors in final models were percentages of on-farm mortality in different lactation stages. It was concluded that, for most welfare indicators, routinely collected herd data have value for estimating dairy cattle welfare. Routine herd data can serve as a pre-screening tool for detecting herds with a welfare problem, and consequently reduce the number of farm visits needed for routine welfare assessments. Routine herd data also hold value for continuous monitoring of dairy cattle welfare. Prediction models developed in this study, however, should first be validated in additional field studies.

Herd data and dairy cattle welfare: observational study 35
Introduction
Because farm animal welfare is high on political and societal agendas of many countries, pressure exists to establish welfare assurance programs in which farm animal welfare is routinely assessed. These programs require the use of on-farm animal welfare assessments, in which farms are visited and assessed against compliance with a set of animal welfare criteria. Routine on-farm assessment of dairy cattle welfare, however, is time-consuming and, therefore, expensive (Knierim and Winckler, 2009; Blokhuis et al., 2010). This is especially true when on-farm assessments use mainly animal-based indicators, which are increasingly preferred over resource-based indicators because they are more closely linked to the welfare of animals (Webster et al., 2004). The Welfare Quality assessment protocol for dairy cattle, for example, in which the majority of indicators is animal-based, takes about 4.4 to 7.7 h for herds of 25 to 200 cows (Welfare Quality, 2009). The time and consequent costs of on-farm assessment protocols may inhibit their use in welfare assurance programs. A promising, more efficient strategy may be to first estimate the level of animal welfare based on national herd databases, leading to a reduction in the number of on-farm assessments. Especially in developed countries, all kind of data are routinely collected from dairy farms, relating, for example, to demography, milk quality, productivity, and fertility. These routine herd data (RHD) are regularly collected and assembled, and therefore might provide a continuous, easy, and inexpensive opportunity to estimate the level of animal welfare on farms. Various studies have shown associations between variables of RHD and dairy cattle welfare indicators (WI; De Vries et al., 2011). Milk yield, for example, has been associated with body condition, water intake, lameness, integument alterations, social behaviors, and various indicators of disease (e.g. Burgos et al., 2001; Phillips and Rind, 2002; Bareille et al., 2003; Haskell et al., 2006; Bicalho et al., 2008; Roche et al., 2009). These studies investigated mainly univariable associations, associations in an experimental setting, or associations at the animal level. Because WI are often associated with various RHD, it has been suggested that the potential of RHD for estimating dairy cattle welfare may increase when they are combined in multivariable analyses (De Vries et al., 2011). To determine its suitability for practical application, this potential should be evaluated in an observational study at the herd level. To our knowledge, only two studies have explored the value of RHD for estimating dairy cattle welfare in an observational study at the herd level, using multivariable analyses. Sandgren et al. (2009) used RHD to identify herds with poor welfare in 55 Swedish dairy herds. A herd was considered to have poor welfare if it was among the 10% worst scoring herds for at least two of nine animal-based indicators assessed. Based on the same dataset, Nyman et al. (2011) aimed to identify herds with good welfare, which were herds that were not among the 10% worst scoring herds for any of the nine animal-based indicators assessed. In both studies, sensitivity and specificity were optimized, and used to evaluate performance of final prediction models. Sensitivity is the probability of correctly identifying a herd with poor welfare, whereas specificity is the probability of correctly identifying a herd with no poor welfare. In our study, we included a larger number of dairy herds and more WI to evaluate the value of RHD for estimating dairy cattle welfare than Sandgren et al. (2009) and Nyman et al. (2011). We focused on the fact that a high sensivity, a high specificity, or an optimum value for both sensitivity and specificity may be demanded in different decision-making contexts (Greiner et al., 2000). A high sensitivity, for

36 Chapter 3
example, may be required when overlooking herds with poor welfare is considered unacceptable, whereas a high specificity may be demanded when costs of on-farm welfare assessments are a serious impediment. Optimizing both sensitivity and specificity may be required if the purpose is to estimate welfare levels in a population for which the prevalence is unknown, or to monitor welfare over time. In these three contexts, RHD could be used as a pre-screening-, instant assessment-, or monitoring tool, respectively. However, a trade-off exists between sensitivity and specificity (Dohoo et al., 2009). The higher the proportion of herds that are correctly identified as having poor welfare (i.e. high sensivity), for example, the higher the proportion of herds that are incorrectly identified as having poor welfare (i.e. more false-positives, thus low specificity). These trade-offs must be evaluated in order to judge the value of RHD for different applications. Our aim, therefore, was to explore the value of routine herd data for estimating dairy cattle welfare at the herd level, by using different levels of sensitivity and specificity.
Materials and methods
Sources of routine herd data Both for herd selection and evaluation of their potential for estimating dairy cattle welfare, we used data from several national databases containing RHD relating to demography, management, milk production, milk composition, and reproduction (Table 1). Data stored in these databases are routinely collected from Dutch dairy farms by the Dutch identification and registration (I&R) system, the rendering plant, the milk quality assurance company (participation legally required), the animal health service, and the cattle improvement syndicate (voluntary participation). Sampling frequency at the farm varies from continuous (e.g. slaughter date) to approximately four weeks (e.g. individual milk yield), and registration is at the animal or the herd level, depending on the variable. These databases cover all Dutch dairy herds for most data, except for test-day data of the cattle improvement syndicate, which covers about 80% of all Dutch dairy herds.
Herd selection To properly evaluate the value of RHD for estimating dairy cattle welfare, we aimed for data from herds that span a wide range of levels of animal welfare. For approximately 5,000 herds in the RHD database participating in a health program of a Dutch dairy cooperative, we calculated a composite health score (CHS) between 0 (worst) and 50 (best). CHS, for which RHD was used from January 2008 through June 2009, consisted of five variables shown to be associated with animal welfare (De Vries et al., 2011): cow and young stock mortality, bulk tank milk SCC, new udder infections, and fluctuations in standardized milk production. A herd was assigned zero points per variable when it was among the 10% worst values, and 10 points when it was among the 90% best values of all herds in the RHD database in 2004. Subsequently, 500 herds were approached to participate in the study: 250 herds were randomly selected from the 5% lowest CHS (i.e. CHS 40) and 250 herds from the 95% highest CHS (i.e. CHS > 40). From these 500 herds, 163 farmers responded positively, 75 negatively and 262 failed to respond. Non-responders were contacted by phone. In total, 196 farmers agreed to participate: 90 from the 5% lowest CHS, and 106 from the 95% highest CHS.

Herd data and dairy cattle welfare: observational study 37
Table 1. Categories, units, and sampling levels of routine herd data (RHD) at the original sampling level, and variables of RHD at the herd level
Category RHD (sampling level) Unit Level RHD (herd level) Demography Birth date Animal Herd size (n cows), change in herd size (%),
average age (months), cows older than 5 y (%), cows < 60 DIM (%), replacement (%), slaughter (%), slaughter of cows < 210 DIM (y/n), on-farm mortality of cattle in different age categories (%), on-farm mortality of cows in different lactation stages (y/n)
Slaughter date Animal On-farm mortality date Animal
Management Type of housing1 loose/tethered Herd Loose housing (y/n), pasturing (y/n), herd biosecurity status (open/closed), certified disease-free status for BVD (y/n), IBR (y/n), Salmonella (y/n)
Access to pasture1 yes/no Herd Herd biosecurity status open/closed Herd Certified disease-free
status yes/no Herd
Certified organic1,2 yes/no Herd Milk production Yield kg/d Herd Average milk yield per cow/d (kg), net result (€)3,
change in net result (%), average DIM, Yield kg/d Animal Predicted yield kg/d Animal Days in milk (DIM) number Animal Milk composition Fat % Herd Average fat (%), average protein (%), average
urea (%), average proportion fat/protein of cows 0-60 DIM, FFA (mmol/100 g), butryric acid bacteria (y/n), bulk tank milk SCC (cells/mL), cows with udder infection4 (%), cows with new udder infection4 (%), heifers with udder infection4 (%), average SCC of cows in different lactation stages (cells/mL)
Fat % Animal Protein % Herd Protein % Animal Lactose % Herd Urea mg/dL Herd FFA mmol/100 g Herd Butyric acid bacteria yes/no Herd Antibiotics2 yes/no Herd SCC cells/mL Herd SCC cells/mL Animal Reproduction Artificial insemination date Animal Non-return 56 d (%), average services per cow,
cows with more than 2 services (%), abortion (%), average expected calving interval (d), average realized calving interval (d), average interval calving to first service (d)
Calving date Animal
1 Data was obtained during farm visit 2 Variable excluded from analysis due to observed prevalence < 5% 3 Economic returns per average kg milk, fat, and protein, based on 305 d milk yield, fat contents, and protein contents, corrected for calving interval, and age and season of calving. 4 Udder infection is defined as SCC > 150,000 cells / mL in first parity cows and SCC > 250,000 cells / mL in second or higher parity cows Data collection and processing Dairy cattle welfare Seven observers, all with previous experience in dairy production and handling, were trained to use the Welfare Quality assessment protocol for dairy cattle (Welfare Quality, 2009) in a three-day course given by delegates of the Welfare Quality consortium. Each observer visited 14 to 48 herds during the winter months of November 2009 through March 2010, when cows had been denied access to pasture for at least 2 weeks. During a farm visit, observers collected data for 41 WI using assessment methods described briefly below (details can be found in Welfare Quality (2009)).

38 Chapter 3
Table 2. Threshold values1 for conversion of continuous welfare indicators to a binary scale (‘minor’ or ‘major’ problem) and observed prevalence per class for 194 selected Dutch dairy herds
Level Assessment method Indicator Minor problem Major problem threshold n herds threshold n herds Avoidance distance test Avoidance distance index > 57.8 141 57.8 47 Qualitative behavior assessment
Qualitative behavior index > -2.7 145 -2.7 49
Behavioral observations Mean frequency of head butts per cow/h 1.1 145 > 1.1 49 Mean frequency of displacements per cow/h 0.55 145 > 0.55 49 Mean time to lie down (s) 6.3 116 > 6.3 78 Cows colliding with stall components (%) 30 104 > 30 90 Cows lying outside lying area (%) 5 169 > 5 25 Mean frequency of coughing per cow/15 min2 6 194 > 6 0 Clinical observations Very lean cows (%) 6.7 148 > 6.7 46 Moderately lame cows (%) 33.0 146 > 33.0 48 Severely lame cows (%)3 11.8 136 > 11.8 45 Cows with hairless patches (%) 44.1 144 > 44.1 49 Cows with lesions or swellings (%) 58.8 144 > 58.8 49 Cows with dirty hind legs (%) 50 43 > 50 151 Cows with dirty udder (%) 19 125 > 19 69 Cows with dirty hindquarter (%) 19 52 > 19 142 Cows with ocular discharge (%)2 6 172 > 6 22 Cows with nasal discharge (%) 10 186 > 10 8 Cows with diarrhea (%) 6.5 146 > 6.5 48 Cows with vulvar discharge (%) 4.5 175 > 4.5 19 Cows with hampered respiration (%)2 6.5 194 > 6.5 0 Resources checklist No. (or length (cm)) of drinkers per 15 cows 1 ( 60) 161 < 1 (< 60) 33 Cows have access to at least two drinkers Yes 176 No 18 Clean drinkers2 Yes 192 No 2 Dehorned young stock (%) < 15 13 15 181 - Method2 Thermal 180 Chemical 1 - Use of analgesics2 Yes 8 No 172 - Use of anaesthetics2 Yes 3 No 150 Dehorned adult cattle (%)2 < 15 194 15 0 - Use of analgesics2 Yes 0 No 0 - Use of anaesthetics2 Yes 0 No 0 Cows tail docked (%)2 < 15 194 15 0 - Method2 Rubber ring 0 Surgery 0 - Use of analgesics2 Yes 0 No 0 - Use of anaesthetics2 Yes 0 No 0 Interview No. of days lactating cows are tethered per year4 < 15 181 15 13 Tethered cows have exercise >1 h per day2 Yes 0 No 13 On-farm mortality (%)4 4.5 194 > 4.5 0 Cows with SCC > 400,000 (%)4 4.5 20 > 4.5 167 Dystocia (%) 5.5 121 > 5.5 72 Access to pasture (days per year)4 > 0 145 0 49 1 Threshold values adapted from Welfare Quality (2009). If not available in Welfare Quality (2009), threshold value was based on the 25% worst scoring herds in this study 2 Indicator excluded from predictions due to observed prevalence < 5% for one of the two classes 3 Assessed in loose housing systems only 4 Indicator excluded from predictions because it was in the list of routine herd data

Herd data and dairy cattle welfare: observational study 39
For the avoidance distance at the feeding rack (AD), which was measured on a predefined sample of lactating and dry cows (Welfare Quality, 2009), the observer approached individual cows from the front starting at a distance of 2 m on the feed bunk. The avoidance distance was estimated at the moment the cow moved back, turned, or pulled back the head, and was categorized in one of four categories: > 100 cm, 100 to > 50 cm, 50 to > 0 cm, or touched. The percentage of cows in each AD category was weighted and aggregated into an ‘AD index’ ranging from 0 (worst) to 100 (best). For the qualitative behavior (QB) assessment (Wemelsfelder, 2007), cows were observed in segments of the barn for 20 minutes, regardless of the number of cows in the herd or in a segment. After this observation, 20 descriptors were scored on a visual analogue scale between 0 (expressive quality of the descriptor was entirely absent in any of the animals) and 125 mm (dominant across all observed animals). The 20 descriptors were weighted and aggregated into a ‘QB index’ ranging from –10 (worst) to 7 (best). Subsequently, lying behavior, agonistic behavior, and coughing were recorded in segments (with a maximum of approximately 25 lactating cows) using continuous behavior sampling (Martin and Bateson, 1993). During clinical observations, 13 health indicators (Table 2) were assessed for a predefined sample of lactating and dry cows. Body condition was scored on a 5 points scale, and grouped into classes “very lean” (score 1) and “not very lean” (score 2). Locomotion was scored on a 5 points scale, and grouped into classes “not lame” (scores 1 and 2), “lame” (score 3) and “severely lame” (scores 4 and 5). Assessment details of other indicators of the clinical observations can be found in the WQ protocol (2009). Besides this, 20 WI were collected using a resources checklist and an interview. Identical indicators were used for cattle in loose housing and tie stalls, except for lameness. Cows in tie stalls were categorized in two lameness classes (not lame or lame), instead of three (not lame, lame or severely lame). Data collected at the animal level was expressed as WI at the herd level (Table 2). Continuous WI were converted to a binary scale representing a minor or severe problem based on threshold values for a ‘serious problem’ or ‘alarm’ described in Welfare Quality (2009; Table 2). When threshold values were not available in the Welfare Quality protocol, WI were dichotomized using the 75th percentile as a threshold value. Routine herd data After all farm visits were done, RHD described in Table 1 were extracted from the RHD database for the quarter of the year in which the on-farm welfare assessment was performed: October through December 2009, or January through March 2010. For some RHD, data was extracted for a larger period of time in order to ensure sufficient prevalence (slaughter and on-farm mortality), to include changes over time (change in herd size and net result, new udder infections), to avoid seasonal variation (milk fat, protein, and urea), or to include reproduction parameters (e.g. calving interval). Missing values in the RHD database were replaced - if available - with the herd average of quarters of the year 2009. Besides data available in the RHD database, additional data (Table 1) were obtained during the farm visits that could potentially be used as RHD because they are easy to register. Raw data were expressed as 46 variables of RHD at the herd level (Table 1).

40 Chapter 3
Statistical analyses To explore associations between continuous variables of RHD and WI, Spearman rank correlations were calculated. They were preferred over Pearson correlations, because a number of variables could not be assumed to be (approximately) normally distributed. Variables of RHD and WI were not included in the statistical analyses when the standard deviation was zero (for continuous variables) or the prevalence among classes less than 5% (for binary variables). Calculations for correlations and building of prediction models were performed with GenStat (GenStat for Windows, 2011), and evaluation of the predictive ability of models with IBM SPSS Statistics 19.0 (SPSS Inc., 2010). Building prediction models Dichotomized WI were considered as response variables (Y) and variables of RHD as predictors (X) in logistic regression with herd as sampling unit. To judge their potential for prediction, each predictor was first screened individually by fitting a simple generalized linear model (McCullagh and Nelder, 1989) specifying a Bernouilli distribution with a logit link function. Quadratic terms of some predictors were included in the analyses to capture potential nonlinear associations with the response variable (De Vries et al., 2011). Predictors with a P-value (from the Wald test) below 0.20 in the first screening were included in subsequent multivariate analyses. The number of predictors was further reduced in the multivariate analyses using both backward and forward stepwise procedures, with Akaike’s Information Criterion (AIC) as a selection criterion. On the union of the two final models of the stepwise procedures, predictors were selected in best subset selection based on a minimum AIC value. Only predictors with a P-value (from the Wald test) below 0.10 were retained in the final model. For each WI, the final model yielded a posterior probability (between 0 and 1) for each herd to be in the severe problem class. A cutoff value could be chosen in the next steps for this posterior probability to classify herds as having a minor (probability < cutoff value) or severe problem (probability cutoff value). Evaluating predictive ability of the models Predictive ability of each model was evaluated based on sensitivity and specificity for the observed and predicted classification of herds. Sensitivity was defined as the proportion of herds correctly predicted to have a severe problem. Specificity was similarly defined for herds in the minor problem class. A trade-off exists between sensitivity and specificity; lowering the cutoff value for the posterior probability results in an increased sensitivity and decreased specificity, whereas raising the cutoff value results in the opposite effect (Dohoo et al., 2009). To evaluate the overall performance of each prediction model, sensitivity and specificity were calculated for various cutoff values. Sensitivity and 1-specificity (i.e. proportion of false-positives) were plotted in a Receiver Operating Curve (ROC) and the area under the ROC curve (AUC) was calculated. The AUC is a summary statistic of diagnostic accuracy, equivalent to the probability that the model will rank a randomly chosen herd with a severe problem higher than a randomly chosen herd with a minor problem (Greiner et al., 2000). AUC values were interpreted using an informal classification system for accuracy of prediction as suggested by Greiner et al. (2000): non-informative (AUC = 0.5), less accurate (0.5 < AUC 0.7), moderately accurate (0.7 < AUC 0.9), highly accurate (0.9 < AUC < 1.0), and
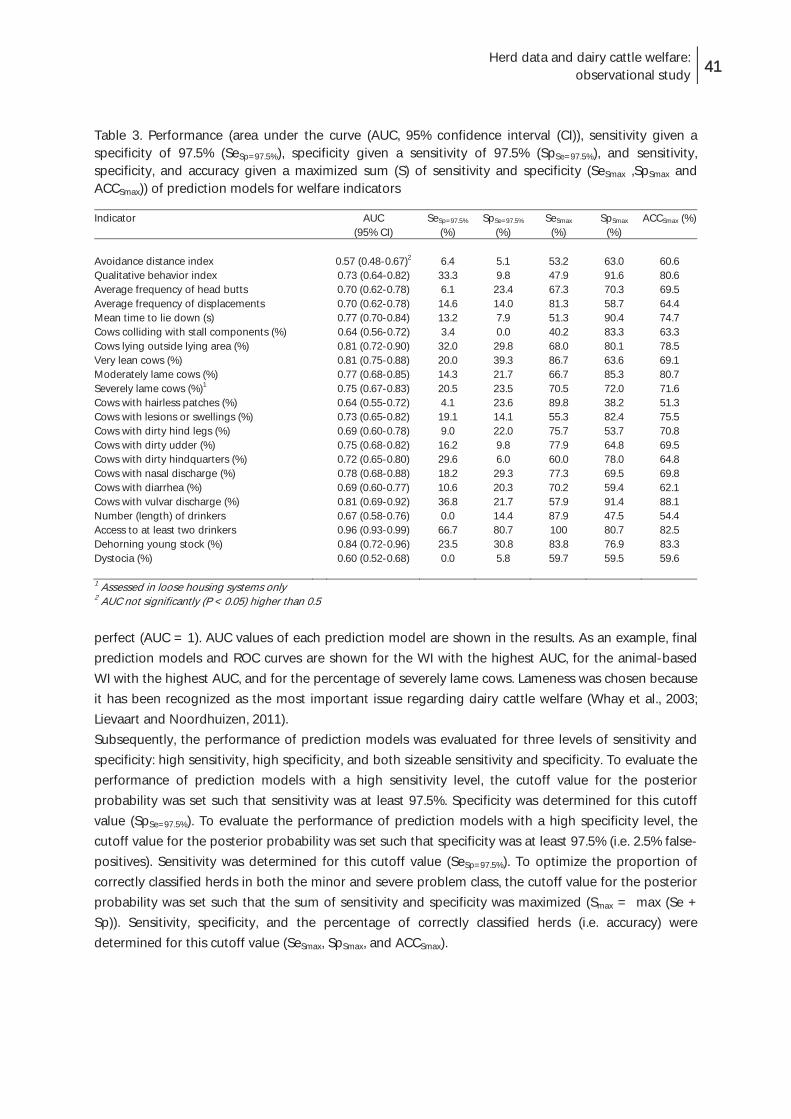
Herd data and dairy cattle welfare: observational study 41
Table 3. Performance (area under the curve (AUC, 95% confidence interval (CI)), sensitivity given a specificity of 97.5% (SeSp=97.5%), specificity given a sensitivity of 97.5% (SpSe=97.5%), and sensitivity, specificity, and accuracy given a maximized sum (S) of sensitivity and specificity (SeSmax ,SpSmax and ACCSmax)) of prediction models for welfare indicators
Indicator AUC (95% CI)
SeSp=97.5% (%)
SpSe=97.5% (%)
SeSmax (%)
SpSmax (%)
ACCSmax (%)
Avoidance distance index 0.57 (0.48-0.67)2 6.4 5.1 53.2 63.0 60.6 Qualitative behavior index 0.73 (0.64-0.82) 33.3 9.8 47.9 91.6 80.6 Average frequency of head butts 0.70 (0.62-0.78) 6.1 23.4 67.3 70.3 69.5 Average frequency of displacements 0.70 (0.62-0.78) 14.6 14.0 81.3 58.7 64.4 Mean time to lie down (s) 0.77 (0.70-0.84) 13.2 7.9 51.3 90.4 74.7 Cows colliding with stall components (%) 0.64 (0.56-0.72) 3.4 0.0 40.2 83.3 63.3 Cows lying outside lying area (%) 0.81 (0.72-0.90) 32.0 29.8 68.0 80.1 78.5 Very lean cows (%) 0.81 (0.75-0.88) 20.0 39.3 86.7 63.6 69.1 Moderately lame cows (%) 0.77 (0.68-0.85) 14.3 21.7 66.7 85.3 80.7 Severely lame cows (%)1 0.75 (0.67-0.83) 20.5 23.5 70.5 72.0 71.6 Cows with hairless patches (%) 0.64 (0.55-0.72) 4.1 23.6 89.8 38.2 51.3 Cows with lesions or swellings (%) 0.73 (0.65-0.82) 19.1 14.1 55.3 82.4 75.5 Cows with dirty hind legs (%) 0.69 (0.60-0.78) 9.0 22.0 75.7 53.7 70.8 Cows with dirty udder (%) 0.75 (0.68-0.82) 16.2 9.8 77.9 64.8 69.5 Cows with dirty hindquarters (%) 0.72 (0.65-0.80) 29.6 6.0 60.0 78.0 64.8 Cows with nasal discharge (%) 0.78 (0.68-0.88) 18.2 29.3 77.3 69.5 69.8 Cows with diarrhea (%) 0.69 (0.60-0.77) 10.6 20.3 70.2 59.4 62.1 Cows with vulvar discharge (%) 0.81 (0.69-0.92) 36.8 21.7 57.9 91.4 88.1 Number (length) of drinkers 0.67 (0.58-0.76) 0.0 14.4 87.9 47.5 54.4 Access to at least two drinkers 0.96 (0.93-0.99) 66.7 80.7 100 80.7 82.5 Dehorning young stock (%) 0.84 (0.72-0.96) 23.5 30.8 83.8 76.9 83.3 Dystocia (%) 0.60 (0.52-0.68) 0.0 5.8 59.7 59.5 59.6 1 Assessed in loose housing systems only 2 AUC not significantly (P < 0.05) higher than 0.5 perfect (AUC = 1). AUC values of each prediction model are shown in the results. As an example, final prediction models and ROC curves are shown for the WI with the highest AUC, for the animal-based WI with the highest AUC, and for the percentage of severely lame cows. Lameness was chosen because it has been recognized as the most important issue regarding dairy cattle welfare (Whay et al., 2003; Lievaart and Noordhuizen, 2011). Subsequently, the performance of prediction models was evaluated for three levels of sensitivity and specificity: high sensitivity, high specificity, and both sizeable sensitivity and specificity. To evaluate the performance of prediction models with a high sensitivity level, the cutoff value for the posterior probability was set such that sensitivity was at least 97.5%. Specificity was determined for this cutoff value (SpSe=97.5%). To evaluate the performance of prediction models with a high specificity level, the cutoff value for the posterior probability was set such that specificity was at least 97.5% (i.e. 2.5% false-positives). Sensitivity was determined for this cutoff value (SeSp=97.5%). To optimize the proportion of correctly classified herds in both the minor and severe problem class, the cutoff value for the posterior probability was set such that the sum of sensitivity and specificity was maximized (Smax = max (Se + Sp)). Sensitivity, specificity, and the percentage of correctly classified herds (i.e. accuracy) were determined for this cutoff value (SeSmax, SpSmax, and ACCSmax).

42 Chapter 3
Figure 1. Spearman rank correlation coefficients per welfare indicator when compared with routine herd data (AD = avoidance distance, QB = qualitative behavior).
Results Animal welfare and routine herd data were collected from 196 Dutch dairy herds, yielding data for 41 WI and 46 variables of RHD. Data of two herds was excluded from the analyses because the WQ protocol could not be executed correctly in these herds. In the remaining 194 herds, herd size ranged from 10 to 211 lactating cows and average milk production from 9.7 to 34.5 kg per cow/d. Cows were loose-housed on 181 farms, and tied on 13 farms. On 153 farms, cows had access to pasture in summer, and 42 herds had an automatic milking system. Twelve herds showed missing values of RHD. In four of these herds, missing values were replaced by historical data of the year 2009. Nineteen WI were excluded from the statistical analyses because they showed a prevalence of less than 5% (15 WI), or were already listed as variables of RHD (four WI; Table 2). Correlations between continuous WI and variables of RHD ranged from -0.33 (average milk production per cow/d versus percentage of cows with dirty hindquarters) to 0.31 (average SCC of cows 120-210 days in milk versus percentage of moderately lame cows; Figure 2). For dichotomized WI, the number of severe problems ranged from three to 17 per herd. Out of the 46 variables of RHD that were considered, 36 were included in final prediction models of one or more WI (Appendix). Variables of RHD relating to demography were included in the largest number of prediction models, followed by variables relating to milk composition, management, milk production, and fertility. The variable of RHD most frequently included in final models was on-farm mortality of cows less than 60 days in milk (included in models of eight WI).

Herd data and dairy cattle welfare: observational study 43
Figure 2. Receiver operating curves representing the predictive ability of the models for three welfare indicators: access to at least two drinkers, percentage of very lean cows, and percentage of severely lame cows (AUC = area under the receiver operating curve (95% confidence interval); diagonal line represents an AUC of 0.5). Overall performance of prediction models Median AUC was 0.73, ranging from 0.57 (AD index) to 0.96 (access to at least two drinkers; Table 3). Except for the AD index, AUC was significantly higher than 0.5 for all WI. AUC values were interpreted as a less accurate prediction for seven WI, a moderately accurate prediction for 14 WI, and a highly accurate prediction for one WI (resource-based). When AUC of animal-based WI were compared only, AUC ranged from 0.57 (AD index) to 0.81 (percentage of cows lying (partly) outside the supposed lying area, percentage of very lean cows, and percentage of cows with vulvar discharge), which was interpreted as a less to moderately accurate prediction. Figure 2 shows ROC curves for the WI with the highest AUC (access to at least two drinkers), for the animal-based WI with the highest AUC and smallest 95% confidence interval (percentage of very lean cows), and for percentage of severely lame cows. Access to less than two drinkers was associated with a smaller herd size and a lower replacement rate (Table 4). The risk of more than 6.7% very lean cows was associated with a higher replacement rate, higher on-farm mortality and higher SCC of cows less than 60 days in milk, no on-farm mortality of cows 120-210 days in milk, more services per cow, shorter expected calving interval, and was non-linearly associated with milk fat contents and the interval from calving to first service (Table 5). The risk of more than 12% severely lame cows was associated with zero-grazing, a larger herd size, higher on-farm mortality of cows 0-60 days in milk,

44 Chapter 3
Table 4. Results from a logistic regression of access to at least two drinkers on routine herd data (193 herds, mean deviance = 31.9, P-value < 0.001)
Predictor Estimate (s.e.) P-value Constant 6.6 (2.0) Herd size -0.12 (0.03) <.001 Replacement (%) -0.08 (0.05) 0.098 Table 5. Results from a logistic regression of percentage of very lean cows on routine herd data (184 herds, mean deviance = 4.5, P-value < 0.001)
Predictor Estimate (s.e.) P-valueConstant -127.3 (59.2) Replacement (%) 0.07 (0.03) 0.018On-farm mortality of cows 0-60 days in milk (%) 0.21 (0.11) 0.047On-farm mortality of cows 120-210 days in milk (y/n) -1.4 (0.52) 0.009Milk fat (%) 65.5 (32.0) 0.040Milk fat (%) squared -9.2 (4.4) 0.037Average SCC of cows 0-60 days in milk (103 cells/mL) 0.003 (0.001) 0.023Average services per cow 4.1 (1.4) 0.003Average expected calving interval -0.05 (0.02) 0.028Interval calving to first service (d) 0.3 (0.13) 0.017Interval calving to first service (d) squared -0.001 (0.0006) 0.059 Table 6. Results from a logistic regression of percentage severely lame cows on routine herd data (175 herds, mean deviance = 3.6, P-value < 0.001)
Predictor Estimate (s.e.) P-valueConstant -24.1 (8.7) Access to pasture -0.79 (0.46) 0.087Herd size 0.009 (0.005) 0.074Mortality of cows < 60 days in milk (%) 0.05 (0.03) 0.065Mortality of cows 120-210 days in milk (%) 0.50 (0.24) 0.035Average days in milk (d) 0.16 (0.08) 0.057Average days in milk (d), squared term -0.0004 (0.0002) 0.074Proportion fat to protein of cows < 60 days in milk 4.8 (2.3) 0.039 on-farm mortality of cows 120-210 days in milk, a higher proportion fat/protein of cows less than 60 days in milk, and was non-linearly associated with average days in milk (Table 6). Performance of models for different levels of sensitivity and specificity By forcing nearly all herds with a severe problem to be detected (i.e. a sensitivity of 97.5%), median SpSe=97.5% was 21.0%, ranging from 0.0% (percentage of cows colliding with components of the stall) to 80.7% (access to at least two drinkers; Table 3). This indicates that 19.3 to 100% of the herds were incorrectly assumed to have a severe problem (i.e. false-positives). When SpSe=97.5% of animal-based WI were compared only, the highest SpSe=97.5% was 39.3% (percentage of very lean cows). By forcing almost no herds to be incorrectly classified as having a severe problem (i.e. a specificity of 97.5%), median SeSp=97.5% was 15.4%, ranging from 0.0% (percentage of dystocia) to 66.7% (access to at least two drinkers; Table 3). When SeSp=97.5% of animal-based WI were compared only, the highest SeSp=97.5% was 36.8% (percentage of cows with vulvar discharge).

Herd data and dairy cattle welfare: observational study 45
By optimizing the proportion of correctly classified herds in the minor and severe problem class (i.e. a maximum sum of sensitivity and specificity), median SeSmax was 69.1% and median SpSmax was 71.2%. Similar to AUC, the maximized sum of sensitivity and specificity was lowest for the AD index (SeSmax = 53.2 and SpSmax = 63.0; Table 3) and highest for access to at least two drinkers (SeSmax = 100 and SpSmax = 80.7). When animal-based indicators were considered only, the maximized sum of sensitivity and specificity was highest for percentage of moderately lame cows (SeSmax = 66.7 and SpSmax = 85.3). The median percentage of correctly classified herds was 69.7%, ranging from 51.3% (percentage of cows with hairless patches) to 88.1% (percentage of cows with vulvar discharge; Table 3).
Discussion Our aim was to explore the value of routine herd data for estimating dairy cattle welfare at the herd level, by using different levels of sensitivity and specificity. To this end, the predictive potential of 46 variables of RHD was evaluated for each of the 41 WI of the Welfare Quality protocol for dairy cattle. Four of these WI were already listed as RHD: the percentage of on-farm mortality, the percentage of cows with an SCC > 400,000, access to pasture, and tethering of cows. These WI can be instantly assessed without needing to verify the values in an on-farm welfare assessment. Fifteen other WI showed a prevalence of less than 5%. With the exception of five WI relating to issues that are regulated by law in many countries (tail docking and use of anaesthetics for dehorning young stock), we do not recommend exclusion of these indictors from the Welfare Quality protocol because herds in our study may not be representative for other populations and prevalence can change over time. Herds in this study were selected on the basis of a composite health score to achieve more variation in the level of animal welfare. The composite health score consisted of five variables of RHD, which were also used for prediction of WI. This has most likely resulted in stronger correlations between observed and predicted WI values, and may have slightly inflated estimated sensitivity and specificity, because herds with more extreme values are easier to detect for predictors. However, the evaluation of the multiple regression models can be expected to be markedly more accurate for selected herds than for random herds, which was the prevailing argument for selection of herds. Because our aim was to evaluate the potential of RHD for prediction of WI, causalities of associations between RHD and WI were not considered, nor was confounding. Therefore, it has to be emphasized that associations found in this study do not necessarily imply a direct causal relationship between RHD and WI. Despite the fact that a causal relationship might not exist, some of the predictors included in the final models for prediction of WI were possibly indicative of management styles related to welfare in herds, e.g. the certification for a BVD-, IBR-, or salmonella-free status. For some other predictors, an association with the outcome variable was not expected. A result contradictory to our expectation, for example, was an association between a reduction in herd size and a severe problem for the percentage of cows lying (partly) outside the supposed lying area. Including variables in the prediction model where a causal relationship is doubtful might make future predictions less accurate (Dohoo et al., 2009). As in any study where prediction variables are selected and the number to select from is relatively large, an element of overfitting and chance relationships is involved. Therefore, promising prediction models should be validated in additional field studies before they can be applied in

46 Chapter 3
practice. They should be regularly re-evaluated thereafter, because indirect relationships between predictors and WI may change. Performance of final models
Despite modest correlations between individual variables of RHD and WI, predictions of WI were less to highly accurate. This suggests that RHD have value for estimating almost all WI in the Welfare Quality protocol for dairy cattle. The prediction model for the index for avoidance distance towards cows at the feeding rack did not do better than a random guess. This does not imply that this WI is not a valid indicator for animal welfare, but it shows that little association existed with variables of RHD included in this study. Associations between RHD and this WI were also absent in earlier studies (Waiblinger et al., 2002; Waiblinger et al., 2003). For other types of human-animal relationship tests, however, associations have been found with milk yield and conception rate at first service (Breuer et al., 2000; Hemsworth et al., 2000; Bertenshaw et al., 2008). Also, aversive handling by stockpeople was negatively associated with milk yield in various studies (Rushen et al., 1999; Breuer et al., 2000; Hemsworth et al., 2000; Hemsworth et al., 2002). Hence, RHD might be more relevant for indicators showing the human-animal relationship other than the avoidance distance at the feeding rack. The best performing prediction model was the model for access to at least two drinkers, which is a resource-based indicator. This WI was strongly associated with herd size; farms in which cows had access to at least two drinkers housed 91 cows on average, whereas farms in which cows had access to less than two drinkers housed 36 cows. Housing system was probably a confounding factor for this association. Thirteen of the 18 herds with access to less than two drinkers were housed in tie-stalls, and providing more than one drinker per cow is not common for tie-stalls in the Netherlands. When animal-based WI were considered only, best performing models were those of the percentage of cows lying (partly) outside the supposed lying area, percentage of very lean cows, and percentage of cows with vulvar discharge. To our knowledge, no other studies have investigated associations between variables of RHD and cows lying outside the supposed lying area, except for one study who found an association with housing system (Plesch et al., 2010). The association between a severe problem for the percentage of very lean cows and a higher replacement rate was comparable to results of Hoedemaker et al.(2009) and Machado et al.(2010), who found that cows with a lower BCS were more likely to be culled and had a shorter survival time than cows with higher BCS. Similar to our results, other studies showed an association of very lean cows with lower milk fat contents (Berry et al., 2007a; Roche et al., 2007a), higher SCC (Berry et al., 2007b; Breen et al., 2009), and worse reproductive performance (e.g. Buckley et al., 2003; Roche et al., 2007b). Associations between vulvar discharge and calf mortality or pregnancy rate (Peeler et al., 1994; Gautam et al., 2010) were not found in our study. To our knowledge, associations between vulvar discharge and age, mortality, urea contents of milk, and certified disease free statuses in our study have not been investigated in other studies so far. Predictions of WI measured in behavioral observations were only slightly less accurate than predictions of WI measured in clinical observations (median AUC = 0.70 vs 0.75). So far, few other studies have investigated associations between behavioral WI and variables of RHD (De Vries et al., 2011). Similar to the results of our study, agonistic interactions (i.e. head butts and displacements) have been associated with average age (Mülleder et al., 2007). Agonistic interactions increase when new animals (which are often heifers) are introduced into established social groups (Von Keyserlingk et al., 2008). Also, a
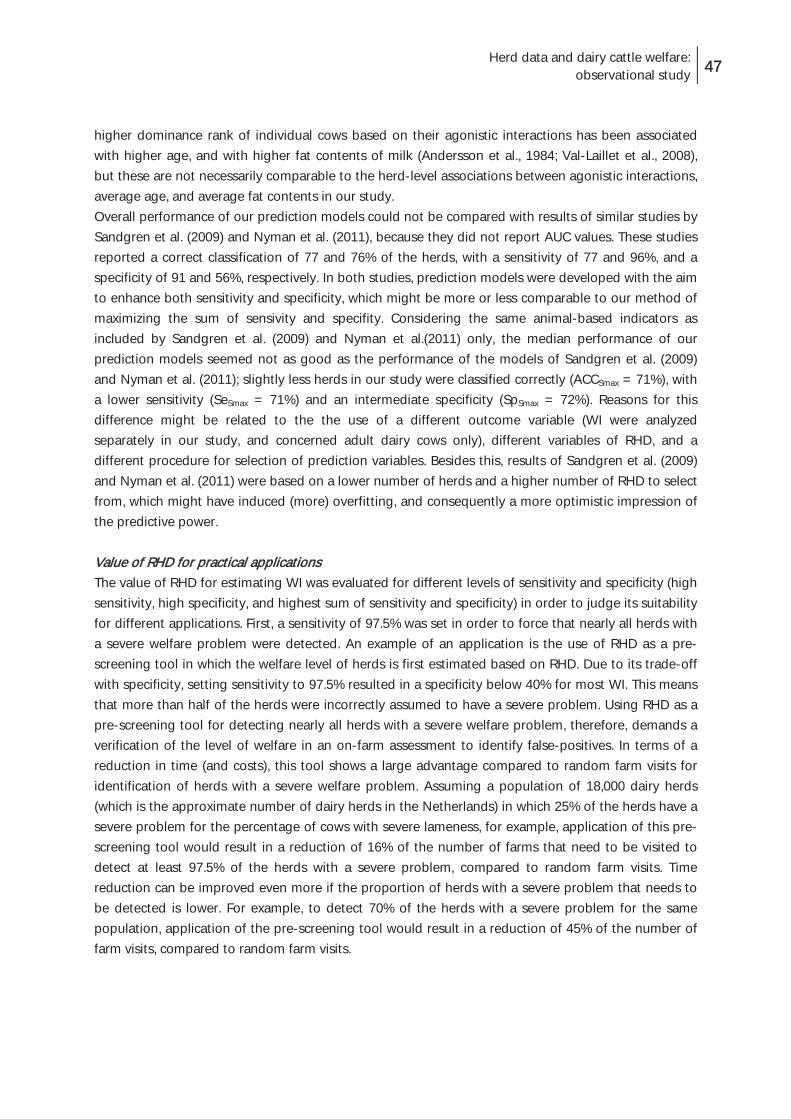
Herd data and dairy cattle welfare: observational study 47
higher dominance rank of individual cows based on their agonistic interactions has been associated with higher age, and with higher fat contents of milk (Andersson et al., 1984; Val-Laillet et al., 2008), but these are not necessarily comparable to the herd-level associations between agonistic interactions, average age, and average fat contents in our study. Overall performance of our prediction models could not be compared with results of similar studies by Sandgren et al. (2009) and Nyman et al. (2011), because they did not report AUC values. These studies reported a correct classification of 77 and 76% of the herds, with a sensitivity of 77 and 96%, and a specificity of 91 and 56%, respectively. In both studies, prediction models were developed with the aim to enhance both sensitivity and specificity, which might be more or less comparable to our method of maximizing the sum of sensivity and specifity. Considering the same animal-based indicators as included by Sandgren et al. (2009) and Nyman et al.(2011) only, the median performance of our prediction models seemed not as good as the performance of the models of Sandgren et al. (2009) and Nyman et al. (2011); slightly less herds in our study were classified correctly (ACCSmax = 71%), with a lower sensitivity (SeSmax = 71%) and an intermediate specificity (SpSmax = 72%). Reasons for this difference might be related to the the use of a different outcome variable (WI were analyzed separately in our study, and concerned adult dairy cows only), different variables of RHD, and a different procedure for selection of prediction variables. Besides this, results of Sandgren et al. (2009) and Nyman et al. (2011) were based on a lower number of herds and a higher number of RHD to select from, which might have induced (more) overfitting, and consequently a more optimistic impression of the predictive power. Value of RHD for practical applications The value of RHD for estimating WI was evaluated for different levels of sensitivity and specificity (high sensitivity, high specificity, and highest sum of sensitivity and specificity) in order to judge its suitability for different applications. First, a sensitivity of 97.5% was set in order to force that nearly all herds with a severe welfare problem were detected. An example of an application is the use of RHD as a pre-screening tool in which the welfare level of herds is first estimated based on RHD. Due to its trade-off with specificity, setting sensitivity to 97.5% resulted in a specificity below 40% for most WI. This means that more than half of the herds were incorrectly assumed to have a severe problem. Using RHD as a pre-screening tool for detecting nearly all herds with a severe welfare problem, therefore, demands a verification of the level of welfare in an on-farm assessment to identify false-positives. In terms of a reduction in time (and costs), this tool shows a large advantage compared to random farm visits for identification of herds with a severe welfare problem. Assuming a population of 18,000 dairy herds (which is the approximate number of dairy herds in the Netherlands) in which 25% of the herds have a severe problem for the percentage of cows with severe lameness, for example, application of this pre-screening tool would result in a reduction of 16% of the number of farms that need to be visited to detect at least 97.5% of the herds with a severe problem, compared to random farm visits. Time reduction can be improved even more if the proportion of herds with a severe problem that needs to be detected is lower. For example, to detect 70% of the herds with a severe problem for the same population, application of the pre-screening tool would result in a reduction of 45% of the number of farm visits, compared to random farm visits.

48 Chapter 3
Next, a specificity of 97.5% was set in order to force that almost none of the herds was incorrectly assumed to have a severe problem (i.e. few false-positives). An example of an application is the use of RHD as an instant assessment tool for the level of dairy cattle welfare of herds, in which an incorrect assumption of herds having a severe problem is hardly permissible. Hence, it is assumed that the predicted classification needs no verification in an on-farm assessment. Because of a trade-off between sensitivity and specificity, however, sensitivity was below 40% for most WI, and below 15% for half of the WI, when specificity was set to 97.5%. This means that, by keeping the number of false-positives at a minimum, only a small part of the herds with a severe welfare problem will be detected. Except for WI that are already listed as RHD (on-farm mortality, SCC > 400,000, pasturing, and tethering), applying RHD as an assessment tool might lead to detection of only a very small proportion of the herds with a severe welfare problem, whilst many other herds with a severe problem are overlooked. In the last step, the sum of sensitivity and specificity was maximized in order to optimize the proportion of correctly classified herds in both the minor and severe problem class. An example of an application is the use of RHD as a monitoring tool to estimate the level of welfare in a population for which the prevalence is unknown, or to monitor levels of animal welfare over time. Results showed that, based on RHD, up to 81% herds could be classified correctly for the minor- and 100% for the severe problem class of a resource-based indicator, and up to 85 and 67% for an animal-based indictor. This shows that RHD have value for estimating levels of dairy cattle welfare, but does not inform us how accurate levels of welfare would be estimated in a population for which the prevalence is unknown. Therefore, the use of RHD as a monitoring tool should be evaluated in additional field studies. Predictors of dairy cattle welfare Prediction variables most frequently included in final models were RHD relating to demography (18 WI), especially on-farm mortality in different lactation stages (15 WI). This is consistent with results of Sandgren et al. (2009) and Nyman et al. (2011), who considered nine animal-based indicators: cleanliness, body condition (assessed in calves, young stock, and dairy cows), injuries and inflammations, lameness, and rising behavior (assessed in dairy cows only). Besides mortality rates, Sandgren et al. (2009) and Nyman et al. (2011) included fertility measures, stillbirth rate, mastitis incidence, and incidence of feed-related diseases as predictors in their final models. In our study, RHD relating to fertility and stillbirth were predictors for similar WI: the percentage of cows with dirty hindlegs, with dirty hindquarter, and with diarrhea, very lean cows, moderately lame cows, and cows lying (partly) outside the supposed lying area. Mastitis incidence and incidence of feed-related diseases are not routinely collected in the Netherlands. Type of housing was initially included in models of five WI, but dropped from the final model because the P-value exceeded 0.10. The lack of significance was probably due to the small number of tie-stalls in our study, but, because of large differences between tie-stalls and loose-housing systems, it might as well indicate that associations between variables of RHD and WI are very different for these two types of housing systems. Therefore, more data are needed to evaluate associations between variables of RHD and WI in tie-stalls separately.

Herd data and dairy cattle welfare: observational study 49
Suggestions for improvement Threshold values distinguishing between good and poor for an overall level of dairy cattle welfare are essential for decision making, e.g. for assigning a welfare status to a herd, or deciding to visit a herd for advisory services. Because no threshold values were available in the Welfare Quality protocol for nine WI, we decided to use threshold values based on the 25% worst scoring herds. This was a somewhat arbitrary choice, especially because herds were not randomly selected and therefore not representative for the Dutch dairy population. Preferably, threshold values should be decided upon by experts. To distinguish between good and poor for an overall level of dairy cattle welfare, however, WI also need to be aggregated to an overall score. Among other existing methods to aggregate WI, a method based on expert opinion has been developed specifically for aggregating Welfare Quality indicators, assigning herds to an unacceptable, acceptable, enhanced, or excellent class (Botreau et al., 2009). This enhances the opportunity to evaluate the potential of RHD for estimating an overall score for dairy cattle welfare at the herd level. This Welfare Quality classification method, however, needs further validation (M. de Vries, unpublished data). Routine herd data were extracted from the RHD database for the quarter of the year in which the on-farm welfare assessment was performed and converted to variables of RHD at the herd level based on average herd values. However, as WI were selected for the Welfare Quality protocol based on their long-term consistency (among other criteria), variables of RHD might show a stronger correlation with WI when they cover a longer period of time. In addition, because many associations between variables of RHD and WI have been found at the individual cow level (De Vries et al., 2011), coefficients of variation might show potential to increase the value of RHD for estimating dairy cattle welfare. Besides this, additional data that can be easily obtained might contribute to more accurate predictions, such as results of post-mortem inspections at abattoirs (e.g. Herva et al., 2011). The potential of these data for predicting WI at the herd level should be further investigated.
Conclusions Routinely collected herd data have value for estimating dairy cattle welfare. For most welfare indicators, RHD can serve as pre-screening tool for detection of herds with a severe welfare problem, and consequently reduce the number of farm visits that are needed for routine assessment of animal welfare. RHD also hold value for continuous monitoring of animal welfare, but are not very suitable for instant-assessment of dairy cattle welfare. The true value of RHD for estimating dairy cattle welfare, however, should be validated in additional field studies. Besides this, the potential of RHD to estimate an overall welfare score for herds, and additional data that can be easily obtained should be investigated in order to increase the value of RHD for estimating dairy cattle welfare.
Acknowledgements The authors gratefully acknowledge farmers for participating in this study, observers for their commitment to collecting the welfare data, and Henriëtte Brouwer-Middelesch for her help with organizing the routine herd data.

50 Chapter 3
References Andersson, M., J. Schaar, and H. Wiktorsson. 1984. Effects of drinking water flow rates and social rank on performance and
drinking behaviour of tied-up dairy cows. Livest. Prod. Sci. 11: 599-610. Bareille, N., F. Beaudeau, S. Billon, A. Robert, and P. Faverdin. 2003. Effects of health disorders on feed intake and milk production
in dairy cows. Livest. Prod. Sci. 83: 53-62. Berry, D. P., F. Buckley, and P. Dillon. 2007a. Body condition score and live-weight effects on milk production in Irish Holstein-
Friesian dairy cows. Animal 1: 1351-1359. Berry, D. P., J. M. Lee, K. A. Macdonald, K. Stafford, L. Matthews, and J. R. Roche. 2007b. Associations Among Body Condition
Score, Body Weight, Somatic Cell Count, and Clinical Mastitis in Seasonally Calving Dairy Cattle. J. Dairy Sci. 90: 637-648. Bertenshaw, C., P. Rowlinson, H. Edge, S. Douglas, and R. Shiel. 2008. The effect of different degrees of 'positive' human-animal
interaction during rearing on the welfare and subsequent production of commercial dairy heifers. Appl. Anim. Behav. Sci. 114: 65-75.
Bicalho, R. C., L. D. Warnick, and C. L. Guard. 2008. Strategies to analyze milk losses caused by diseases with potential incidence throughout the lactation: A lameness example. J. Dairy Sci. 91: 2653-2661.
Blokhuis, H. J., I. Veissier, M. Miele, and B. Jones. 2010. The Welfare Quality® project and beyond: Safeguarding farm animal well-being. Acta Agric. Scand. Sect. A-Anim. Sci. 60: 129-140.
Botreau, R., I. Veissier, and P. Perny. 2009. Overall assessment of animal welfare: strategy adopted in Welfare Quality. Anim. Welf. 18: 363-370.
Breen, J. E., A. J. Bradley, and M. J. Green. 2009. Quarter and cow risk factors associated with a somatic cell count greater than 199,000 cells per milliliter in United Kingdom dairy cows. J. Dairy Sci. 92: 3106-3115.
Breuer, K., P. H. Hemsworth, J. L. Barnett, L. R. Matthews, and G. J. Coleman. 2000. Behavioural response to humans and the productivity of commercial dairy cows. Appl. Anim. Behav. Sci. 66: 273-288.
Buckley, F., K. O'Sullivan, J. F. Mee, R. D. Evans, and P. Dillon. 2003. Relationships among milk yield, body condition, cow weight, and reproduction in spring-calved Holstein-Friesians. J. Dairy Sci. 86: 2308-2319.
Burgos, M. S., M. Senn, F. Sutter, M. Kreuzer, and W. Langhans. 2001. Effect of water restriction on feeding and metabolism in dairy cows. Am. J. Physiol. 280: R418-R427.
De Vries, M., E. A. M. Bokkers, T. Dijkstra, G. van Schaik, and I. J. M. de Boer. 2011. Invited review: Associations between variables of routine herd data and dairy cattle welfare indicators. J. Dairy Sci. 94: 3213-3228.
Dohoo, I. R., S. W. Martin, and H. Stryhn. 2009. Veterinary Epidemiologic Research. 2 ed. VER, Inc., Charlottetown, Canada. Gautam, G., T. Nakao, K. Koike, S. T. Long, M. Yusuf, R. M. S. B. K. Ranasinghe, and A. Hayashi. 2010. Spontaneous recovery or
persistence of postpartum endometritis and risk factors for its persistence in Holstein cows. Theriogenology 73: 168-179. GenStat for Windows, 2011. GenStat for Windows Release 14. VSN International Ltd, Hemel Hempstead, UK. Greiner, M., D. Pfeiffer, and R. D. Smith. 2000. Principles and practical application of the receiver-operating characteristic analysis
for diagnostic tests. Prev. Vet. Med. 45: 23-41. Haskell, M. J., L. J. Rennie, V. A. Bowell, M. J. Bell, and A. B. Lawrence. 2006. Housing system, milk production, and zero-grazing
effects on lameness and leg injury in dairy cows. J. Dairy Sci. 89: 4259-4266. Hemsworth, P. H., G. J. Coleman, J. L. Barnett, and S. Borg. 2000. Relationships between human-animal interactions and
productivity of commercial dairy cows. J. Anim. Sci. 78: 2821-2831. Hemsworth, P. H., G. J. Coleman, J. L. Barnett, S. Borg, and S. Dowling. 2002. The effects of cognitive behavioral intervention on
the attitude and behavior of stockpersons and the behavior and productivity of commercial dairy cows. J. Anim. Sci. 80: 68-78.
Herva, T., A. Huuskonen, A.-M. Virtala, and O. Peltoniemi. 2011. On-farm welfare and carcass fat score of bulls at slaughter. Livestock Science 138: 159-166.
Hoedemaker, M., D. Prange, and Y. Gundelach. 2009. Body condition change ante- and postpartum, health and reproductive performance in German Holstein cows. Reprod. Domest. Anim. 44: 167-173.
Knierim, U. and C. Winckler. 2009. On-farm welfare assessment in cattle: validity, reliability and feasibility issues and future perspectives with special regard to the Welfare Quality approach. Anim. Welf. 18: 451-458.
Lievaart, J. J. and J. P. T. M. Noordhuizen. 2011. Ranking experts’ preferences regarding measures and methods of assessment of welfare in dairy herds using Adaptive Conjoint Analysis. J. Dairy Sci. 94: 3420-3427.
Machado, V. S., L. S. Caixeta, J. A. A. McArt, and R. C. Bicalho. 2010. The effect of claw horn disruption lesions and body condition score at dry-off on survivability, reproductive performance, and milk production in the subsequent lactation. J. Dairy Sci. 93: 4071-4078.
Martin, P. and P. Bateson. 1993. Measuring Behaviour - An introductory guide. Cambridge University Press, Cambridge, UK. McCullagh, P. and J. A. Nelder. 1989. Generalized Linear Models. Chapman and Hall, London, UK. Mülleder, C., J. Troxler, G. Laaha, and S. Waiblinger. 2007. Can environmental variables replace some animal-based parameters in
welfare assessment of dairy cows? Anim. Welf. 16: 153-156. Nyman, A.-K., A. Lindberg, and C. H. Sandgren. 2011. Can pre-collected register data be used to identify dairy herds with good
cattle welfare? Acta Vet. Scand. 53 Suppl 1: S8.

Herd data and dairy cattle welfare: observational study 51
Peeler, E. J., M. J. Otte, and R. J. Esslemont. 1994. Interrelationships of periparturient diseases in dairy cows. Vet. Rec. 134: 129-132.
Phillips, C. J. C. and M. I. Rind. 2002. The effects of social dominance on the production and behavior of grazing dairy cows offered forage supplements. J. Dairy Sci. 85: 51-59.
Plesch, G., N. Broerkens, S. Laister, C. Winckler, and U. Knierim. 2010. Reliability and feasibility of selected measures concerning resting behaviour for the on-farm welfare assessment in dairy cows. Appl. Anim. Behav. Sci. 126: 19-26.
Roche, J. R., J. M. Lee, K. A. Macdonald, and D. P. Berry. 2007a. Relationships among body condition score, body weight, and milk production variables in pasture-based dairy cows. J. Dairy Sci. 90: 3802-3815.
Roche, J. R., K. A. Macdonald, C. R. Burke, J. M. Lee, and D. P. Berry. 2007b. Associations among body condition score, body weight, and reproductive performance in seasonal-calving dairy cattle. J. Dairy Sci. 90: 376-391.
Roche, J. R., N. C. Friggens, J. K. Kay, M. W. Fisher, K. J. Stafford, and D. P. Berry. 2009. Invited review: Body condition score and its association with dairy cow productivity, health, and welfare. J. Dairy Sci. 92: 5769-5801.
Rushen, J., A. M. de Passillé, and L. Munksgaard. 1999. Fear of people by cows and effects on milk yield, behavior, and heart rate at milking. J. Dairy Sci. 82: 720-727.
Sandgren, C. H., A. Lindberg, and L. J. Keeling. 2009. Using a national dairy database to identify herds with poor welfare. Anim. Welf. 18: 523-532.
SPSS Inc., 2010. IBM SPSS Statistics version 19, Release Version 19.0.0.1. Chicago, IL. Val-Laillet, D., A. M. de Passillé, J. Rushen, and M. A. G. von Keyserlingk. 2008. The concept of social dominance and the social
distribution of feeding-related displacements between cows. Appl. Anim. Behav. Sci. 111: 158-172. Von Keyserlingk, M. A. G., D. Olenick, and D. M. Weary. 2008. Acute behavioral effects of regrouping dairy cows. J. Dairy Sci. 91:
1011-1016. Waiblinger, S., C. Menke, and G. Coleman. 2002. The relationship between attitudes, personal characteristics and behaviour of
stockpeople and subsequent behaviour and production of dairy cows. Appl. Anim. Behav. Sci. 79: 195-219. Waiblinger, S., C. Menke, and D. W. Folsch. 2003. Influences on the avoidance and approach behaviour of dairy cows towards
humans on 35 farms. Appl. Anim. Behav. Sci. 84: 23-39. Webster, A. J. F., D. C. J. Main, and H. R. Whay. 2004. Welfare assessment: Indices from clinical observation. Anim. Welf. 13
(Suppl.): S93-S98. Welfare Quality. 2009. Welfare Quality® Assessment Protocol for Cattle. Welfare Quality® Consortium, Lelystad, Netherlands. Wemelsfelder, F. 2007. How animals communicate quality of life: the qualitative assessment of behaviour. Anim. Welf. 16: 25-31. Whay, H. R., D. C. J. Main, L. E. Green, and A. J. F. Webster. 2003. Animal-based measures for the assessment of welfare state of
diary cattle, pigs and laying hens: Consensus of expert opinion. Anim. Welf. 12: 205-217.

52 Chapter 3
Appendix. Significance of predictors1,2 used in the final multivariable logistic regression models for
Pred
icto
r Dem
ogra
phy
Her
d siz
e (n
cow
s)
Chan
ge in
her
d siz
e (%
)
Repl
acem
ent (
%)
Slau
ghte
r (%
)
Slau
ghte
r <21
0 da
ys in
milk
(DIM
, y/n
)
On-
farm
mor
talit
y of
cat
tle:
- ag
ed 0
-3 d
(%)
- ag
ed 4
d –
1 y
(%)
- ag
ed >
2 y
(%)
- 0-
60 D
IM (%
)
- 60
-120
DIM
- 12
0-21
0 D
IM
- >
210
DIM
Aver
age
age
(mon
ths)
Cow
s ag
ed >
5 y
(%)
Cow
s 0-
60 D
IM (%
)
Man
agem
ent
Tie-
stal
l (vs
loos
e ho
used
)
Zero
-gra
zing
(vs
past
ure)
Her
d bi
osec
urity
sta
tus
(ope
n/cl
osed
)
Welfare indicator
Qualitative behavior index (*,*) *
Freq. head butts/cow/h † (*,*)
Freq.displacements/cow/h *
Mean time to lie down (s) * *
% of cows:
- colliding with stall † *
- lying outside lying area * *
- dirty hind legs
- dirty udder *
- dirty hind quarters
- nasal discharge * ** **
- diarrhea
- vulvar discharge † * †
- dystocia *
- very lean * * **
- moderately lame *
- severely lame * † * †
- hairless patches † (†)
- lesions/swellings * *
No. (length) of drinkers *
2 drinkers *** †
% dehorned young stock 1 Significance of effect indicated by ~ (0.10 < P < 0.25), † (0.05 < P < 0.10), * (0.01 < P < 0.05), ** (0.001 < P < 0.01), quadratic term) for a non-linear association, and not highlighted nor brackets for a positive effect. 3 Significance of effects not

Herd data and dairy cattle welfare: observational study 53
prediction of a severe problem for dairy cattle welfare indicators3
Cert
ified
dise
ase-
free
stat
us:
- B
VD
- IB
R -
Sal
mon
ella
M
ilk p
rodu
ctio
n
Aver
age
yiel
d/co
w/d
(kg)
Net
resu
lt (€
)
Chan
ge in
net
resu
lt (%
)
Aver
age
DIM
Milk
com
posit
ion
Aver
age
fat (
%)
Aver
age
prot
ein
(%)
Aver
age
fat/
prot
ein
of c
ows
in 0
-60
DIM
Aver
age
urea
(%)
Buty
ric a
cid
bact
eria
(y)
FFA
(mm
ol/1
00g)
Bulk
milk
SCC
(cel
ls/m
L)
Udd
er in
fect
ion
(%)
New
udd
er in
fect
ion
(%)
Hei
fer u
dder
infe
ctio
n (%
)
Aver
age
SCC
(cel
ls/m
L) o
f cow
s:
- 0
-60
DIM
- 6
0-12
0 D
IM
- 1
20-2
10 D
IM
- >
210
DIM
Ferti
lity
Non
-ret
urn
56 d
(%)
Aver
age
serv
ices
per
cow
Cow
s w
ith >
2 se
rvic
es (%
)
Still
birt
h (%
)
Aver
age
calv
ing
inte
rval
(d)
Aver
age
expe
cted
cal
ving
inte
rval
(d)
Inte
rval
cal
ving
to fi
rst s
ervi
ce (d
)
(†,†) (*,*) * *
† †
* *
* * * † ** *
†
(*,*) * † (†,~)
* * **
(†,*) * † **
* ** (*,*)
† †
* † † †
* * *
†
(*) * ** * (*)
* * * † (†)
(†) *
(*) (†) * *
†
* ***
*** (P < 0.001). 2 Direction of effect highlighted grey for a negative effect, between brackets (significance linear term, significance shown for the index for avoidance distance at the feeding rack because final regression model was not significant.

54 Chapter 3


56 Chapter 4
Evaluating results of the Welfare Quality multicriteria evaluation model for classification of dairy cattle welfare at the herd level M. de Vries1, E.A.M. Bokkers1, G. van Schaik2, R. Botreau3, B. Engel4, T. Dijkstra2, and I.J.M. de Boer1 1 Animal Production Systems group, Wageningen University, the Netherlands, 2 Animal Health Service Deventer, the Netherlands, 3 Institut National de la Recherche Agronomique, France, 4 Biometris, Wageningen University, the Netherlands Submitted to Journal of Dairy Science
Abstract The Welfare Quality multicriteria evaluation (WQ-ME) model aggregates scores of single welfare measures into an overall assessment for the level of animal welfare in dairy herds. It assigns herds to four welfare classes: unacceptable, acceptable, enhanced, or excellent. The aim of this study was to demonstrate the relative importance of single welfare measures for WQ-ME classification of a selected sample of Dutch dairy herds. Seven trained observers quantified 63 welfare measures of the Welfare Quality protocol in 183 loose housed- and 13 tethered Dutch dairy herds (herd size: 10 to 211 cows). First, values of welfare measures were compared among the four welfare classes, using Kruskal-Wallis and Chi-square tests. Second, observed values of single welfare measures were replaced with a fictitious value, which was the median value of herds classified in the next highest class, to see if improvement would enable a herd to reach a higher class. Sixteen herds were classified unacceptable, 85 acceptable, 78 enhanced, and none excellent. Classification could not be calculated for 17 herds because data were missing (15 herds) or data was deemed invalid because the stockperson disturbed behavioral observations (two herds). Herds classified unacceptable showed significantly more very lean cows, more severely lame cows, and more often an insufficient number of drinkers than herds classified acceptable. Herds classified acceptable showed significantly more cows with high SCC, with lesions, that could not be approached closer than 1 m, colliding with components of the stall while lying down, lying outside the lying area, fewer cows with diarrhea, more often an insufficient number of drinkers, and scored lower for the descriptors “relaxed” and “happy” than herds classified enhanced. Increasing the number of drinkers and reducing the percentage of cows colliding with components of the stall while lying down were the changes that were most effective in allowing herds classified unacceptable and acceptable, respectively, to reach a higher class. The WQ-ME model was not very sensitive to improving single measures of good health. It was concluded that a limited number of welfare measures had a strong influence on classification of dairy herds, especially for herds classified unacceptable. Classification of herds based on the WQ-ME model in its current form might lead to a focus on improving these specific measures, and divert attention from improving other welfare measures. The role of expert opinion and the type of algorithmic operator used in this model should be reconsidered.

Classification of dairy cattle welfare 57
Introduction The need for methods to assess the overall level of animal welfare on farms has been stressed frequently (e.g. European Commission, 2002; Blokhuis et al., 2003). An overall level of farm animal welfare can facilitate product labeling, encourage producers to improve animal welfare, and, in the future, might even become part of export legislation (Blokhuis et al., 2010). There are various measures used to assess animal welfare, e.g. animal behavior, heart rate, or cortisol levels in blood (Broom and Fraser, 2007). Measures need to be combined, however, to determine overall level of animal welfare on farms. Although it has been argued that science should not attempt to perform overall welfare assessment because value judgments are inherently involved (e.g. Fraser, 1995), others state that overall welfare assessment is not arbitrary and high level of accuracy can be achieved (Bracke et al., 1999). In spite of different viewpoints, various models have been developed to assess overall level of animal welfare, e.g. the Animal Needs Index in Austria and Germany (Bartussek et al., 2000), and a decision support system for overall welfare assessment of sows in the Netherlands (Bracke et al., 2002). More recently, Welfare Quality multicriteria evaluation (WQ-ME) models were developed for different livestock species in the Welfare Quality project (Botreau et al., 2009). Input for the WQ-ME model for dairy cattle are on-farm welfare measures described in the Welfare Quality assessment protocol (Welfare Quality, 2009). Compared with other models that combine welfare measures in an overall score, a large proportion of welfare measures in this WQ-ME model are animal-based. Animal-based measures for assessing welfare are increasingly preferred over resource-based measures among animal welfare scientists, because they are more closely linked to the welfare of animals and can measure the actual state of animals, regardless of how they are housed or managed (Bartussek, 1999; Whay et al., 2003; Webster, 2009; Rushen et al., 2011). The WQ-ME model uses different algorithmic operators, e.g. a decision tree or a weighted sum, to aggregate measures into an overall score (Botreau et al., 2008b). These operators were parameterized based on value judgments of animal and social scientists, and partners and members of the Welfare Quality project on the relative importance of the different welfare measures in the Welfare Quality protocol (Botreau et al., 2008a; Botreau et al., 2008b; Botreau et al., 2009). The WQ-ME model assigns dairy herds to four welfare classes: unacceptable, acceptable, enhanced, or excellent. These welfare classes should reflect the multidimensional nature of welfare and relative importance of various welfare measures (Botreau et al., 2007a,b). The WQ-ME model was tested on 69 commercial European dairy herds visited during the Welfare Quality project, and partly adjusted according to these results. Although classification of some of these herds was compared with the general impression of observers who audited the farms (Botreau et al., 2009), it has not yet been demonstrated to what extent classification reflected the relative importance of welfare measures and multidimensional nature of welfare. Such a validation is essential, however, to evaluate if the model is suitable for its intended purpose. Moreover, besides validity of the model for the 69 herds of the source population (i.e. internal validity), validity of the model should be tested in other herds (i.e. external validity (Dohoo et al., 2009)). Sound welfare classes are essential because they will guide improvements that should positively affect the welfare of farm animals. The aim of this study, therefore, was to demonstrate the relative importance of single welfare measures for WQ-ME classification of a selected sample of Dutch dairy herds.

58 Chapter 4
Materials and methods Herd selection To properly demonstrate the relative importance of single welfare measures for WQ-ME classification, we aimed for data from herds that span a wide range of levels of animal welfare. Therefore, herds were selected based on a composite health score (CHS). For 5,000 Dutch dairy herds participating in a health scheme of a Dutch dairy cooperative, we calculated a CHS between 0 (worst) and 50 (best). CHS, for which we used readily available data in herd databases from January 2008 through June 2009, consisted of five variables that have been shown to correlate with animal welfare (De Vries et al., 2011): cow and young stock mortality, bulk tank milk SCC, new udder infections, and fluctuations in standardized milk production. Herds were assigned zero points per variable when it was among the 10% worst values, and 10 points when it was among the 90% best values of all dairy herds in 2004. Subsequently, 500 herds were approached to participate in the study: 250 herds were randomly selected from the 5% lowest CHS (i.e. CHS 40) and 250 herds from the 95% highest CHS (i.e. CHS > 40). From the 500 herds, 163 farmers responded positively, 75 negatively and 262 failed to respond. In these three respective groups, 45, 49, and 64% were from the 5% lowest CHS (i.e. CHS 40). Non-responders were contacted by phone. In total, 196 farmers agreed to participate: 90 from the 5% lowest CHS, and 106 from the 95% highest CHS. Farm visits Seven observers, each with previous experience in dairy production and handling, were trained to use the Welfare Quality assessment protocol for dairy cattle (Welfare Quality, 2009). Herds were randomly distributed among these observers, who were blind for the herds’ CHS. Each observer visited 14 to 48 herds once from November 2009 through March 2010, when cows had been denied access to pasture for at least 2 weeks. Observations were made on a predefined number of lactating and dry cows (for sample sizes, see Welfare Quality, 2009). Data were collected on cow and herd level, depending on the type of measurement. After data collection, data were expressed as welfare measures at herd level. These welfare measures could be either continuous or categorical, and were expressed on different scales depending on the measure (e.g. percentage of severely lame cows or mean time to lie down). Aggregation of welfare measures into a WQ-ME classification The Welfare Quality assessment protocol for dairy cattle consists of 63 welfare measures, which were aggregated following a three step aggregation process (Welfare Quality, 2009, Figure 1): 63 welfare measures were aggregated into 12 criteria, these 12 criteria were aggregated into four principles, and these four principles were aggregated into one classification. Different types of algorithmic operators were used in this aggregation process: decision tree, weighted sum, linear combination, conversion to ordinal score, least squares spline curve fitting, and Choquet integral (Figure 1). In the first step of the aggregation process, decision trees were used to aggregate categorical measures into three criteria. A decision tree leads to a number of possible outcomes, each of which was attributed a criterion score (based on expert opinion). For other criteria, welfare measures were first combined into a weighted sum or converted to an ordinal score representing, for example, no
Classification of dairy cattle welfare 59
Table 1. Median (range) of welfare measures1 for herds selected from the 5% lowest-, and 95% highest composite health scores2 (CHS)
Herds selected from Welfare measure 5% lowest CHS
(n = 90) 95% highest CHS
(n = 89) P-value
Percentage of cows:
- very lean 3.1 (0-28.6) 2.0 (0-20.0) 0.086 - dirty udder 15.1 (0-93.9) 11.4 (0-64.7) 0.074
- dirty hindquarters 45.7 (0-100) 28.0 (0-100) 0.015
- lame 26.6 (0-52.5) 21.3 (3.3-58.7) 0.090
- severely lame 6.2 (0-46.9) 3.8 (0-65.9) 0.087
- milk SCC > 400,000 13.8 (2.6-36.3) 8.4 (0-24.9) 0.000
- diarrhea 0 (0-46.5) 2.1 (0-34.2) 0.016
- on-farm mortality 0.8 (0-30.0) 0.4 (0-3.1) 0.000
Average number of coughs per cow/15 min 0.07 (0-0.4) 0.06 (0-0.2) 0.077
Tethered (n herds) no (81) no (88) 0.010
yes (9) yes (1)
Dehorning calves (n herds) no (10) no (1) 0.005 yes (80) yes (88) QBA descriptors3: relaxed, agitated, calm, content, fearful, happy, irritable, lively, positively
< 0.10
1 Measures with P > 0.10 not shown. 2 CHS based on cow and young stock mortality, bulk tank milk SCC, new udder infections, and fluctuations in standardized milk production. 3 Median and range of descriptors for the Qualitative Behavior Assessment (QBA) not shown. problem, a moderate problem, or a severe problem. The number of moderate and severe problems were then combined into a weighted sum, a so-called index value, on a scale from 0 (worst) to 100 (best). Finally, these index values and remaining welfare measures were converted to a criterion score (expressed on the same 0-100 scale), employing spline functions (Ramsay, 1988) that were fitted by least-square methods. A detailed description and the rationale behind the use of algorithmic operators in the construction of criteria can be found in Botreau et al. (2007b, 2008a,b) and Veissier et al. (2011). In the second step, a Choquet integral (Choquet, 1953; Grabisch et al., 2008) was used to aggregate the 12 criteria into four principles (Figure 1). This integral uses weights to combine the different criterion scores into one principle score (expressed on the 0-100 scale), while limiting the possibility that a poor score of one criterion is compensated by excellent scores of others (Botreau et al., 2007b; Veissier et al., 2011). These weights, therefore, depend on the values of the criterion scores, whereas the sum of these weights equals 1. For example, when the criterion score for Absence of prolonged hunger was lower than the criterion score for Absence of prolonged thirst, the weights attributed to Absence of prolonged hunger and Absence of prolonged thirst were 0.73 and 0.27. When the criterion score for Absence of prolonged hunger was higher than the score for Absence of prolonged thirst, however, the weights attributed to Absence of prolonged hunger and Absence of prolonged thirst were 0.12 and 0.88. Values for weights were based on expert opinion (Botreau et al., 2008b).

60 Chapter 4
deci
sion
tree
leas
t squ
ares
splin
ecu
rve f
ittin
gle
ast s
quar
es
splin
ecu
rve
fittin
g
Refe
renc
epr
ofile
sex
celle
nt (a
ll pr
inci
ples
5
5 an
d at
leas
t tw
o pr
inci
ples
8
0);
enha
nced
(all
prin
cipl
es
20
and
at le
ast t
wo
prin
cipl
es
55)
; ac
cept
able
(all
prin
cipl
es
10
and
at le
ast t
hree
prin
ciple
s 2
0); a
nd
unac
cept
able
(at l
east
one
prin
cipl
e <1
0 or
at l
east
two
prin
cipl
es <
20)
Choq
ueti
nteg
ral
Choq
ueti
nteg
ral
Choq
ueti
nteg
ral
Choq
ueti
nteg
ral
% v
ery
lean
cow
s Suffi
cien
t no.
of d
rinke
rs
Clea
n dr
inke
rs
At le
ast 2
drin
kers
/cow
Mea
n tim
e to
lie
dow
n (s
)%
cow
s co
llidi
ng w
ith s
tall
% c
ows
lyin
g ou
tsid
e st
all
% c
ows
with
dirt
y hi
nd le
gs%
cow
s w
ith d
irty
udde
r
No.
of d
ays
teth
ered
cow
s ha
ve
exer
cise
No.
of d
ays
cow
s ha
ve a
cces
s to
pa
stur
e pe
r yea
r
% m
oder
atel
y la
me
cow
s%
sev
erel
y la
me
cow
s
% d
ehor
ning
(ca
lves
)-m
etho
d -a
naes
thet
ics
-ana
lges
ics
% d
ehor
ning
(ad
ults
)-a
naes
thet
ics
-ana
lges
ics
% ta
il-do
cked
-m
etho
d -a
naes
thet
ics
-ana
lges
ics
Aver
age
frequ
ency
of c
ough
ing/
cow
/15
min
% o
n-fa
rm m
orta
lity
% d
owne
r co
ws
% c
ows
with
:-m
ilk S
CC>4
00,0
00-d
ysto
cia
-ocu
lar d
ischa
rge
-ham
pere
d re
spira
tion
-nas
al d
ischa
rge
-dia
rrhoe
a-v
ulva
r disc
harg
eAver
age
frequ
ency
of h
ead
butts
per
cow
per
hou
rAv
erag
e fre
quen
cy o
f di
spla
cem
ents
per
cow
per
ho
ur
% c
ows
appr
oach
ed:
> 10
to 5
0 cm
>
50 to
100
cm
>
100
cm
Num
ber o
f day
s w
ith a
cces
s to
past
ure
Des
crip
tors
Qua
litat
ive
Beha
vior
Ass
essm
ent:
Activ
eAg
itate
dAp
athe
ticBo
red
Calm
Cont
ent
Dist
ress
edFe
arfu
lFr
iend
lyFr
ustra
ted
Hap
pyIn
diffe
rent
Inqu
isitiv
eIrr
itabl
eLi
vely
Play
ful
Posit
ivel
y oc
cupi
edRe
laxe
dSo
ciab
leUn
easy
leas
t squ
ares
sp
linec
urve
fitti
ng
deci
sion
tree
conv
ersio
n to
or
dina
lsco
re
linea
r com
bina
tions
leas
t squ
ares
splin
ecu
rve
fittin
gde
cisio
ntr
ee
% c
ows
with
ha
irles
s pa
tche
s %
cow
s w
ith
lesio
ns/s
wel
lings
Part
ials
core
la
men
ess
Part
ials
core
in
tegu
men
t al
tera
tions
linea
r co
mbi
natio
ns
leas
t squ
ares
sp
linec
urve
fit
tingCh
oque
t int
egra
tion
linea
r com
bina
tions
-(As
yet
no
indi
cato
r is
deve
lope
d)
high
ests
core
good
feed
ing
good
hou
sing
good
hea
lthap
prop
riate
beh
avio
ur
abse
nce
of
prol
onge
dhu
nger
abse
nce
of
prol
onge
dth
irstco
mfo
rt a
roun
dre
stin
g
ther
mal
co
mfo
rt
ease
of
mov
emen
tab
senc
e of
in
jurie
sab
senc
e of
di
seas
eab
senc
e of
pa
inex
pres
sion
of
soci
al b
ehav
iour
sexpr
essio
n of
ot
her
beha
viou
rs
good
hum
an-
anim
alre
latio
nshi
pposi
tive
emot
iona
l st
ate
clas
sific
atio
n
leas
t squ
ares
sp
linec
urve
fit
ting
conv
ersio
n to
or
dina
l sco
re
linea
r com
bina
tions
linea
r com
bina
tions
linea
r com
bina
tions
leas
t squ
ares
sp
line
curv
e fit
ting
leas
t squ
ares
sp
linec
urve
fitti
ng
leas
t squ
ares
sp
linec
urve
fitti
ng
CRITERIA(n=12)PRINCIPLES (n=4) WELFARE MEASURES (n=63)CLASS
linea
r co
mbi
natio
ns
Figu
re 1
. Wel
fare
mea
sure
s, cr
iteria
, and
prin
cipl
es o
f the
Wel
fare
Qua
lity
mul
ticrit
eria
eva
luat
ion
mod
el (a
dapt
ed fr
om W
elfa
re Q
ualit
y, 2
009)
.

Classification of dairy cattle welfare 61
Finally, herds were assigned to one of four welfare classes: unacceptable, acceptable, enhanced, or excellent, based on reference profiles for the four principles (Botreau et al., 2009): to be classified excellent, a herd must score at least 55 for each principle and at least 80 for two principles; to be classified enhanced, each principle must be above 20 and at least two above 55; to be classified acceptable, each principle must be above 10 and at least three above 20. Herds that did not comply with the minimum aspirational scores were classified unacceptable, which means that at least one principle was below 10 or at least two below 20. To parameterize the algorithmic operators used for aggregation of welfare measures and criteria, virtual and empirical datasets were presented to expert panels of 13 animal scientists (measures) and 14 animal and social scientists (criteria), who individually ranked farms and gave an absolute score on the 0-100 scale for each farm presented in each of the datasets (Botreau et al., 2008a; Botreau et al., 2008b). Partners of the Welfare Quality project, a task force, and members of the Management Committee and Advisory Committee (i.e. stakeholder representatives) were consulted to agree upon parameters for the aggregation of principles into an overall classification (Botreau et al., 2009). The WQ-ME model was programmed in GenStat for Windows Release 14 (VSN International Ltd, Hemel Hempstead, UK) following the Welfare Quality report for the construction of criteria (Botreau et al., 2008a) and the Welfare Quality assessment protocol for dairy cattle (Welfare Quality, 2009) for the construction of principles and classification. Data analyses To evaluate if herd selection based on CHS resulted in a wider range of animal welfare levels and in a larger proportion of herds in lower WQ-ME classes, we compared welfare measures and classification of herds selected from the 5% lowest CHS with herds selected from the 95% highest CHS. In addition, we evaluated whether herds in the two CHS groups (5% lowest versus 95% highest) were distributed equally across observers. Mann-Whitney U and Chi-square tests were used, since the assumption of normality was often not appropriate. To demonstrate the relative importance of single welfare measures for WQ-ME classification, classification of herds was evaluated in two ways: by comparing of welfare measures of herds in the four WQ-ME classes, to determine whether groups of herds in these classes differed; and by evaluating of the impact of replacing observed values for welfare measures with improved, fictitious values on herd classification (sensitivity analyses), to determine which improvements were most effective in allowing herds to reach a higher classification. Comparison of WQ-ME classes We compared welfare measures for herds in the different WQ-ME classes using the Kruskal-Wallis and Chi-square tests, since the assumption of normality was often not appropriate. Post-hoc pairwise comparisons were made using Mann-Whitney U and Chi-square tests. Analyses were performed in SPSS 17.0 (IBM SPSS Inc., Chicago, USA). Welfare measures were not considered for analyses when the standard deviation was zero or the prevalence was less than 5%.

62 Chapter 4
Table 2. Median (range) of welfare measures that differed between herds classified unacceptable, acceptable, and enhanced
Class Welfare measure Unacceptable
(n = 16) Acceptable
(n = 85) Enhanced (n = 78)
Overall P-value
Percentage of cows: - very lean 9.2a (0-20.0) 3.3b (0-23.7) 1.7b (0-28.6) 0.001 - colliding with components of the stall while lying down
37.5a (10.0-66.7) 40.0a (0-100) 19.4b (0-88.2) 0.004
- lying outside lying area 0.7ab (0-12.8) 1.5a (0-15.4) 0.3b (0-8.6) 0.001
- severely lame 9.3a (0-65.9) 5.3b (0-46.9) 3.5b (0-25.4) 0.020
- lesions or swellings 40.4ab (3.3-94.7) 42.9a (0-97.6) 29.4b (3.3-95.1) 0.005
- milk SCC > 400,000 10.8ab (5.4-20.9) 12.5a (0-26.9) 10.2b (1.1-36.3) 0.045
- diarrhea 0ab (0-36.4) 0b (0-30.3) 2.2a (0-46.5) 0.011
- not approached < 1 m 25.3ab (11.9-47.3) 24.4a (0-74.4) 17.8b (0-66.0) 0.049
Sufficient no. of drinkers (n herds) noa (14) nob (44) noc (31) 0.008 yes (2) yes (41) yes (47) Happy 42ab (1-90) 40b (1-123) 59a (1-115) 0.003
Relaxed 66ab (1-117) 51b (1-118) 69a (1-117) 0.014 a-c Medians within a row with different superscripts differ between classes (P < 0.05) Sensitivity analyses For welfare measures that differed between adjacent classes, herds were assigned an improved, fictitious value to see whether improving this single measure enabled a herd to reach a higher WQ-ME classification. The improved value, which replaced the observed value, was the median value of herds classified in the next highest class. This median value was considered to be a realistic and feasible value that farmers aspire to when aiming to improve their classification. For categorical measures, such as sufficiency of the number of drinkers, the improved value was the mode of herds in the next highest class. After assigning an improved value to a herd, a new classification was computed. For each single measure, the effect of improvement was evaluated by counting the number of herds that reached a higher classification.
Results Of a selected sample of 196 Dutch dairy herds, the WQ-ME model classified 16 herds as unacceptable, 85 as acceptable, 78 as enhanced, and none as excellent. Classification could not be calculated for 17 herds, because data of one or more welfare measures were missing (15 herds) or data was deemed invalid because the stockperson disturbed behavioral observations (two herds). Eight welfare measures, related to drinking, tethering, dehorning, and tail-docking, were excluded from the statistical analysis due to no variability (SD = 0) or a prevalence less than 5%. Median size of the 179 herds included was 67 lactating cows (ranging from 10 to 211 cows), with a milk production of 25.4 kg / cow per day (ranging from 10.0 to 35.2 kg). Cows were in loose housing in 169 herds and tethered in 10 herds. In summer, cows had access to pasture for at least 6 h per day in 132 herds. Herd size, milk production, type of housing, access to pasture, and observer did not differ among WQ-ME classes.

Classification of dairy cattle welfare 63
Table 3. Number of herds changing to a higher classification when welfare measures, of which the median value differed between adjacent welfare classes, were replaced with an improved value Herds changed class to2 Original class Welfare measure Original value
(median) Improved
value1 Acceptable Enhanced Excellent
Unacceptable Very lean cows (%) 9.2 3.3 11 0 0 (n=16) Sufficient no. of drinkers (n herds) no (14) no (0) 9 4 0 yes (2) yes (16) Severely lame cows (%) 9.3 5.3 1 0 0 Acceptable Sufficient no. of drinkers (n herds) no (44) no (0) 9 0 (n=85) yes (41) yes (85) Cows colliding with components of
the stall while lying down (%) 40.0 19.4 21 0
Cows lying outside lying area (%) 1,5 0,3 9 0 Cows with lesions or swellings (%) 42.9 29.4 1 0 Cows with SCC > 400,000 (%) 12.5 10.2 0 0 Cows not approached < 1 m (%) 24.4 17.8 7 0 Happy 40 59 0 0 Relaxed 51 69 0 0
1 The improved score was the median score of herds in the next highest classification. 2 The same herds can appear in different rows. Median (range) of welfare measures for herds selected from the 5% lowest and 95% highest CHS are in Table 1. Herds selected from the 5% lowest CHS showed more cows housed in tie-stalls, more with dirty hindquarters, more with SCC > 400,000, fewer with diarrhea, higher on-farm mortality, fewer calves disbudded, and scored lower for eight descriptors of the Qualitative Behavior Assessment (Rousing and Wemelsfelder, 2006; Wemelsfelder, 2007) than herds selected from the 95% highest CHS (P < 0.05). Herds in the two CHS groups (5% lowest versus 95% highest) did not differ in WQ-ME class, nor in observer. Comparison of WQ-ME Classes Median (range) of welfare measures for herds classified unacceptable, acceptable, and enhanced are in Table 2. Because no herds were classified excellent, this class could not be compared with other WQ-ME classes. Unacceptable compared with acceptable and enhanced Herds classified unacceptable showed 5.9 and 7.5% more very lean cows, 4.0 and 5.8% more severely lame cows, and 1.7 and 2.2 times more often an insufficient number of drinkers than herds classified acceptable and enhanced (Table 2). In addition, herds classified unacceptable showed 18.1% more cows colliding with components of the stall while lying down than herds classified enhanced. No differences were found for the other 59 welfare measures. Acceptable compared with enhanced More, but generally smaller, differences in welfare measures were found between herds classified acceptable and enhanced than between herds classified unacceptable and other classes. Herds

64 Chapter 4
classified acceptable showed 20.6% more cows colliding with components of the stall while lying down, 1.2% more lying outside the lying area, 13.5% more with lesions or swellings, 2.3% more with an SCC > 400,000, 2.2% fewer with diarrhea, 6.6% more that could not be approached closer than 1 m, showed 1.3 times more often an insufficient number of drinkers, and scored 18 and 19 points less for the descriptors “relaxed” and “happy” for the Qualitative Behavior Assessment than herds classified enhanced. Since herds classified enhanced showed more cows with diarrhea, this measure was not included in the sensitivity analysis.
Sensitivity analysis Number of herds that changed to a higher classification when observed values of single welfare measures were replaced with an improved value are in Table 3. Herds originally classified unacceptable Replacing observed values of single measures with improved values resulted in a higher class for 14 of the 16 herds originally classified unacceptable. When the observed percentage of very lean cows was replaced with an improved percentage of 3.3% (i.e., the median score of herds classified acceptable), 11 of the 16 herds originally classified unacceptable changed to acceptable. When the number of drinkers was changed to sufficient, 13 herds changed class from unacceptable: nine to acceptable and four to enhanced. When the percentage of severely lame cows was lowered to 5.3%, one herd changed to acceptable. Herds originally classified acceptable Replacing observed values of single measures with improved values resulted in an enhanced class for 38 of the 85 herds originally classified acceptable. Most of these herds changed to enhanced when the percentage of cows colliding with the stall, lying outside the lying area, that could not be approached closer than 1 m were lowered, and when the number of drinkers was changed to sufficient. Replacing the percentage of cows with lesions or swellings, with milk SCC > 400,000, and descriptors for the Qualitative Behavior Assessment “happy” and “relaxed” with an improved value rarely resulted in an enhanced class.
Herds originally classified enhanced A median value of the next highest class was not available for herds originally classified enhanced, because no herds were classified excellent. When we replaced values for welfare measures of herds originally classified enhanced by an improved value that was equal to the maximum value of all herds, no herds changed to excellent.
Discussion The WQ-ME model classified 16 herds as unacceptable, 85 as acceptable, 78 as enhanced, and none as excellent. The distribution of herds among classes was not representative of the Dutch dairy sector, because herds in this study were selected based on CHS.

Classification of dairy cattle welfare 65
The CHS was useful in selecting for variation in a large number of welfare measures. Although it was expected that herd selection based on CHS would increase the proportion of herds in lower WQ-ME classes, no differences among herds with varying CHS were found in the final classification. Selection based on CHS apparently concerned welfare measures other than the ones that were responsible for classification. Associations between variables that formed the CHS and welfare measures mainly responsible for classification of herds (e.g. number of drinkers) are also absent in literature (De Vries et al., 2011). Relative importance of welfare measures for WQ-ME classification Most important welfare measures for classifying herds unacceptable in our study were percentage of very lean cows and sufficiency of drinkers. Herds classified unacceptable showed a higher percentage of severely lame cows than herds classified acceptable, but this measure appeared to have little influence on classification when a sensitivity analyses was performed. Although there is no golden standard for the overall level of animal welfare against which results of the WQ-ME model can be validated, results can be compared to expert opinion on the relative importance of welfare measures in other studies. In the study of Lievaart and Noordhuizen (2011), animal welfare experts ranked competition for feed and water as the second most important measure of dairy cattle welfare, which could be considered consistent with percentage of very lean cows and sufficiency of drinkers being the most important welfare measures for classifying herds unacceptable in our study. Number of drinkers is a resource-based measure, however, that is less closely linked to animal welfare than an animal-based measure (Webster et al., 2004; Blokhuis, 2008). Water intake is associated with the number and size of drinkers in herds (Pinheiro Machado Filho et al., 2004; Teixeira et al., 2006), but can be influenced by various other factors, such as diet or climate conditions (Dahlborn et al., 1998; Meyer et al., 2004). The value of such a resource-based measure being responsible for the class unacceptable, therefore, is questionable. In two studies, animal welfare experts ranked lameness as the most important measure of dairy cattle welfare (Whay et al., 2003; Lievaart and Noordhuizen, 2011). In our study, except for one herd, high prevalence of (severely) lame cows did not result in herds classified unacceptable. Percentage of severely lame cows was up to 47% in herds classified acceptable and 25% in herds classified enhanced. Mastitis, which was represented by cows with SCC > 400,000 in our study, was among the most important measures of dairy cattle welfare in the study of Whay et al. (2003). Although the percentage of cows with SCC > 400,000 was up to 36% in our study, high prevalence of cows with SCC > 400,000 did not result in herds classified unacceptable. On the contrary, a herd with 36% cows with SCC > 400,000 was classified enhanced. Compared to herds classified unacceptable and acceptable, more differences were found between herds classified acceptable and enhanced, which was evident in welfare measures of each of the four principles of the WQ-ME model. This finding achieved the aim of the WQ-ME model in reflecting the multidimensional concept of animal welfare (Botreau et al., 2007c). Improving measures of principles good feeding and good housing was effective in a large number of herds originally classified acceptable to reach a higher class, however, whereas improving measures of good health was effective in almost none of these herds. This lack of effect was because little difference existed between median measure scores of herds classified acceptable and enhanced. This showed that, in spite of substantial

66 Chapter 4
variation in measure scores among our study herds, relative importance of measures of good health for classification was low. This contradicts with results of Whay et al. (2003), in which health records were ranked as the second most important measure of dairy cattle welfare. It should be emphasized, however, that analyses in this study were limited to single welfare measures. Effects of improving combinations of welfare measures should be further investigated. None of the herds in our study was classified excellent. A similar result was found by Botreau et al. (2009), who classified a sample of 69 dairy herds in Austria, Germany, and Italy. The reason that no herds were classified excellent in our study was a lack of simultaneous excellent scores for a large number of welfare measures. High scores were lacking especially for welfare measures of the principles good health and appropriate behavior. Improvement of welfare measures in herds originally classified enhanced did not lead to a changed class of excellent. Apparently, improvement of more than one welfare measure is needed to reach excellent. Reasons for a lack of influence of lameness and SCC on WQ-ME classification The lack of effect of lameness on herd classification was caused mainly by compensating mechanisms in the first two steps of the aggregation process in the WQ-ME model: the construction of the criterion absence of injuries and the principle good health. A herd with 48% moderately lame cows, 29% severely lame cows, 57% cows with lesions and swellings, and 7% cows with hairless patches, for example, obtained a score of 14 for the criterion absence of injuries. In the construction of the principle good health, this criterion score was compensated by a score of 65 for the criterion absence of disease and 52 for the criterion absence of pain, leading to a principle score of 26. Given the reference profiles for classification, a herd is classified unacceptable only when principle scores are below 20. Therefore, this principle score did not lead to an unacceptable class. High percentages of cows with SCC > 400,000 did not result in herds classified unacceptable because this measure was converted to an ordinal score (no, moderate, or severe problem) to calculate a score for the criterion absence of disease. Because this percentage represented a severe problem whenever it was higher than 4.5%, the WQ-ME model did not distinguish between, for example, herds with 27% cows and herds with 5% cows with SCC > 400,000. Moreover, a severe problem for the percentage of cows with SCC > 400,000 was compensated by other welfare measures that represented no problem, because they were linearly combined for the criterion absence of disease. Similar to lameness and SCC, other welfare measures of the principle good health rarely influenced classification. This is illustrated by the principle good health which, despite a large variation in welfare measures, ranged from 21 to 58 (95% range), compared with the principle good feeding which ranged from 7.5 to 100 (95% range). As a consequence of the lack of effect on herd classification, farmers might not be motivated to improve welfare measures of good health. In summary, there are two major reasons why severe welfare problems did not result in herds classified unacceptable. First, although it was emphasized in the development of the WQ-ME model that welfare scores should not compensate each other (Veissier et al., 2011), compensation occurred for welfare measures that were aggregated using linear combinations and the Choquet integral in the first two aggregation steps of the WQ-ME model. The extent of compensation depended on the weight given to welfare measures and criteria, which was derived from expert opinion (Botreau et al., 2008a). The role of expert opinion in the WQ-ME model requires further investigation. Grouping a large number of

Classification of dairy cattle welfare 67
welfare measures in a principle may have increased compensation. In contrast to the principle good feeding, for example, which considers four welfare measures-, the principle good health considers 20 welfare measures simultaneously. Second, conversion of welfare measures to an ordinal score makes it impossible for the WQ-ME model to distinguish between herds that slightly or largely exceeded thresholds for severe problems. Consequently, severe welfare problems, such as SCC > 400,000 in more than 35% of the cows, did not cause an unacceptable classification. In addition to evaluating the role of expert opinion in the WQ-ME model, reconsidering the choice of algorithmic operator might help to ensure that herds with severe welfare problems are classified more appropriately.
Conclusions The aim of this study was to demonstrate the relative importance of single welfare measures for WQ-ME classification of a selected sample of Dutch dairy herds. A limited number of welfare measures had a strong influence on classification of dairy herds in this study, especially for herds classified unacceptable. Classification of herds based on the WQ-ME model in its current form might, on the one hand, lead to improving these specific measures, but, on the other hand, divert attention from improving other measures. The role of expert opinion and the type of algorithmic operator used to aggregate welfare measures in the WQ-ME model need to be reconsidered, to assign herds to the most appropriate of the four welfare classes.
Acknowledgements The authors gratefully acknowledge farmers for participating in this study, and Kees van Reenen, Wim Swart, Jac Thissen, Ingrid den Uijl, and Pieter Vereijken for their stimulating discussions and ideas.
References
Bartussek, H. 1999. A review of the animal needs index (ANI) for the assessment of animals' well-being in the housing systems
for Austrian proprietary products and legislation. Livest. Prod. Sci. 61: 179-192. Bartussek, H., C. H. M. Leeb, and S. Held. 2000. Animal Needs Index for Cattle: ANI35L/2000 cattle. Federal Research Institute for
Agriculture in Alpine Regions BAL Gumpenstein, Irdning, Austria. Blokhuis, H. J., R. B. Jones, R. Geers, M. Miele, and I. Veissier. 2003. Measuring and monitoring animal welfare: Transparency in
the food product quality chain. Anim. Welf. 12: 445-455. Blokhuis, H. J. 2008. International cooperation in animal welfare: the Welfare Quality project. Acta Vet. Scand. 50 (Suppl. 1): S10. Blokhuis, H. J., I. Veissier, M. Miele, and B. Jones. 2010. The Welfare Quality® project and beyond: Safeguarding farm animal
well-being. Acta Agric. Scand. Sect. A-Anim. Sci. 60: 129-140. Botreau, R., M. Bonde, A. Butterworth, P. Perny, M. B. M. Bracke, J. Capdeville, and I. Veissier. 2007a. Aggregation of measures to
produce an overall assessment of animal welfare. Part 1: a review of existing methods. Animal 1: 1179-1187. Botreau, R., M. B. M. Bracke, P. Perny, A. Butterworth, J. Capdeville, C. G. Van Reenen, and I. Veissier. 2007b. Aggregation of
measures to produce an overall assessment of animal welfare. Part 2: analysis of constraints. Animal 1: 1188-1197. Botreau, R., I. Veissier, A. Butterworth, M. B. M. Bracke, and L. J. Keeling. 2007c. Definition of criteria for overall assessment of
animal welfare. Anim. Welf. 16: 225-228. Botreau, R., J. Capdeville, B. Engel, P. Perny, and I. Veissier. 2008a. Reports on the construction of welfare criteria for different
livestock species, part 2: subcriteria construction for dairy cows on farm. Deliverable 2.8b, subtask 2.3.1.2. Welfare Quality® (EU Food-CT-2004-506508).

68 Chapter 4
Botreau, R., J. Capdeville, P. Perny, and I. Veissier. 2008b. Multicriteria evaluation of animal welfare at farm level: An application of MCDA methodologies. Foundations of Computing and Decision Sciences 33: 1-18.
Botreau, R., I. Veissier, and P. Perny. 2009. Overall assessment of animal welfare: strategy adopted in Welfare Quality. Anim. Welf. 18: 363-370.
Bracke, M. B. M., B. M. Spruijt, and J. H. M. Metz. 1999. Overall animal welfare assessment reviewed. Part 1: Is it possible? Netherlands Journal of Agricultural Science 47: 279-291.
Bracke, M. B. M., B. M. Spruijt, J. H. M. Metz, and W. G. P. Schouten. 2002. Decision support system for overall welfare assessment in pregnant sows A: Model structure and weighting procedure. J. Anim. Sci. 80: 1819-1834.
Broom, D. M. and A. F. Fraser. 2007. Domestic Animal Behaviour and Welfare, 4th edition. CABI, Cambridge, USA. Choquet, G. 1953. Theory of capacities. Annales de l’Institut Fourier 5: 132-295. Dahlborn, K., M. Åkerlind, and G. Gustafson. 1998. Water intake by dairy cows selected for high or low milk-fat percentage when
fed two forage to concentrate ratios with hay or silage. Swed. J. Agric. Res. 28: 167-176. De Vries, M., E. A. M. Bokkers, T. Dijkstra, G. van Schaik, and I. J. M. de Boer. 2011. Invited review: Associations between variables
of routine herd data and dairy cattle welfare indicators. J. Dairy Sci. 94: 3213-3228. Dohoo, I. R., S. W. Martin, and H. Stryhn. 2009. Veterinary Epidemiologic Research. 2 ed. VER, Inc., Charlottetown, Canada. European Commission. 2002. Communication from the European commission to the council and the European parliament on
animal welfare legislation on farmed animals in third countries and the implications for the EU. EU, Brussels, Belgium. Fraser, D. 1995. Science, Values and Animal Welfare: Exploring the 'Inextricable Connection'. Anim. Welf. 4: 103-117. Grabisch, M., I. Kojadinovic, and P. Meyer. 2008. A review of methods for capacity identification in Choquet integral based multi-
attribute utility theory applications of the Kappalab R package. European Journal of Operational Research 186: 766-785. Lievaart, J. J. and J. P. T. M. Noordhuizen. 2011. Ranking experts’ preferences regarding measures and methods of assessment of
welfare in dairy herds using Adaptive Conjoint Analysis. J. Dairy Sci. 94: 3420-3427. Meyer, U., M. Everinghoff, D. Gadeken, and G. Flachowsky. 2004. Investigations on the water intake of lactating dairy cows. Livest.
Prod. Sci. 90: 117-121. Pinheiro Machado Filho, L. C., D. L. Teixeira, D. M. Weary, M. A. G. von Keyserlingk, and M. J. Hötzel. 2004. Designing better water
troughs: dairy cows prefer and drink more from larger troughs. Appl. Anim. Behav. Sci. 89: 185-193. Ramsay, J. O. 1988. Monotone Regression Splines in Action. Statistical Science 3: 425-441. Rousing, T. and F. Wemelsfelder. 2006. Qualitative assessment of social behaviour of dairy cows housed in loose housing
systems. Appl. Anim. Behav. Sci. 101: 40-53. Rushen, J., A. Butterworth, and J. C. Swanson. 2011. Farm animal welfare assurance: Science and application. J. Anim. Sci. 89:
1219-1228. Teixeira, D. L., M. J. Hötzel, and L. C. Pinheiro Machado Filho. 2006. Designing better water troughs: 2. Surface area and height,
but not depth, influence dairy cows' preference. Appl. Anim. Behav. Sci. 96: 169-175. Veissier, I., K. K. Jensen, R. Botreau, and P. Sandoe. 2011. Highlighting ethical decisions underlying the scoring of animal welfare
in the Welfare Quality scheme. Anim. Welf. 20: 89-101. Webster, A. J. F., D. C. J. Main, and H. R. Whay. 2004. Welfare assessment: Indices from clinical observation. Anim. Welf. 13
(Suppl.): S93-S98. Webster, A. J. F. 2009. The Virtuous Bicycle: a delivery vehicle for improved farm animal welfare. Anim. Welf. 18: 141-147. Welfare Quality. 2009. Welfare Quality® Assessment Protocol for Cattle. Welfare Quality® Consortium, Lelystad, Netherlands. Wemelsfelder, F. 2007. How animals communicate quality of life: the qualitative assessment of behaviour. Anim. Welf. 16: 25-31. Whay, H. R., D. C. J. Main, L. E. Green, and A. J. F. Webster. 2003. Animal-based measures for the assessment of welfare state of
diary cattle, pigs and laying hens: Consensus of expert opinion. Anim. Welf. 12: 205-217.


70 Chapter 5
Assessment time of the Welfare Quality protocol for dairy cattle M. de Vries1, B. Engel2, I. den Uijl3, G. van Schaik3, T. Dijkstra3, I.J.M. de Boer1, and E.A.M. Bokkers1
1 Animal Production Systems group, Wageningen University, Wageningen, the Netherlands, 2 Biometris, Wageningen University, Wageningen, the Netherlands, 3 GD Animal Health Service, Deventer, the Netherlands
Published in Animal Welfare 22: 85-93
Abstract The Welfare Quality (WQ) protocols are increasingly used for assessing welfare of farm animals. These protocols are time consuming (about one day per farm) and, therefore, costly. Our aim was to assess the scope for reduction of on-farm assessment time of the WQ protocol for dairy cattle. Seven trained observers quantified animal-based indicators of the WQ protocol in 181 loose housed- and 13 tied Dutch dairy herds (herd size from 10 to 211 cows). Four assessment methods were used: avoidance distance at the feeding rack (ADF, 44 minutes), qualitative behaviour assessment (QBA, 25 minutes), behavioural observations (BO, 150 minutes), and clinical observations (CO, 132 minutes). To simulate reduction of on-farm assessment time, a set of WQ indicators belonging to one assessment method was omitted from the protocol. Observed values of omitted indicators were replaced by predictions based on WQ indicators of the remaining three assessment methods, resources checklist, and interview, thus mimicking the performance of the full WQ protocol. Agreement between predicted and observed values of WQ indicators, however, was low for ADF, moderate for QBA, slight to moderate for BO, and poor to moderate for CO. It was concluded that replacing animal-based WQ indicators by predictions based on remaining WQ indicators shows little scope for reduction of on-farm assessment time of the Welfare Quality protocol for dairy cattle. Other ways to reduce on-farm assessment time of the WQ protocol for dairy cattle, such as the use of additional data or automated monitoring systems, should be investigated.

On-farm assessment time 71
Introduction The use of animal-based indicators is gaining increased preference over resource- and management-based indicators in farm animal welfare assessment schemes. Animal-based indicators, which measure the state of the animal rather than its environment, are assumed to possess a higher validity than resource- and management-based indicators because they are more closely linked to the actual welfare state of animals (Webster et al., 2004; Blokhuis et al., 2010). Duration of assessing animal-based indicators on-farm, however, is a main constraint with regard to feasibility (Mülleder et al., 2007; Knierim and Winckler, 2009; Blokhuis et al., 2010). In the Welfare Quality (WQ) protocol for dairy cattle, for example, 60% of the indicators are animal-based, but take about 90% of the total on-farm assessment time (depending on herd size, Welfare Quality, 2009). Consequently, on-farm assessment time of the WQ protocol ranges from about 4.4 to 7.7 hours for herds of 25 to 200 cows (Welfare Quality, 2009). Assessment time and associated costs of on-farm assessments may hamper the practical implementation of the WQ protocol in welfare audit programs (Knierim and Winckler, 2009). Various studies have shown associations between indicators of dairy cattle welfare. Lame cows, for instance, were associated with a lower body condition and changes in lying behaviour (Bowell et al., 2003; Ito et al., 2010; Blackie et al., 2011). Also, a higher frequency of agonistic behaviour in dairy herds was associated with larger avoidance distances towards cows (Waiblinger et al., 2003). Although these associations may not always involve causal relationships, it suggests that animal-based indicators may have potential to predict other animal-based indicators. Such predictions could replace on-farm observations, and reduce on-farm assessment time of the WQ protocol. So far, mainly resource- and/or management-based indicators have been considered for prediction of animal-based indicators (eg Mülleder et al., 2007). Two out of four assessment methods in the WQ protocol contain more than one animal-based indicator (Welfare Quality, 2009): behavioural observations (BO, six indicators), and clinical observations (CO, 13 indicators). When an indicator belonging to one of these assessment methods is replaced, cows still need to be observed to collect data for the other WQ indicators, which takes an equal (BO), or only slightly less (CO) amount of time. Hence, all indicators of an assessment method should be considered together in order to reduce assessment time. Our aim was to evaluate the performance of a reduced protocol, in which a set of WQ indicators belonging to one assessment method is replaced by predictions based on remaining animal-, resource- and management-based indicators, in order to assess the scope for reduction of on-farm assessment time of the WQ protocol for dairy cattle.
Materials and methods Herd selection To properly assess the scope for prediction of animal-based WQ indicators, we aimed for data from herds that span a wide range of levels of animal welfare. Therefore, herds were selected based on a composite health score. From 5 000 Dutch herds participating in a health scheme of a Dutch dairy co-operative, a composite health score between 0 (worst) and 50 (best) was determined over the period January 2008 to June 2009. This score consisted of five parameters that have been shown to correlate with different WQ indicators (De Vries et al., 2011): cow and young stock mortality, bulk tank milk

72 Chapter 5
somatic cell count (SCC), new udder infections, and fluctuations in standardized milk production. Herds were attributed zero points per parameter when the parameter value was among the 10% worst, and 10 points when it was among the 90% best values of all dairy herds in 2004. To ensure a minimum sample of 100 herds from the 5% lowest composite health scores and 100 herds from the rest of the population, 250 herds were randomly selected from each of these respective categories. Of the selected herds, 163 farmers responded positively, 75 negatively and 262 failed to respond. Due to the insufficient positive response rate, non-responders were further contacted by telephone. Finally, 196 farmers agreed to participate: 90 from the 5% lowest composite health scores, and 106 from the rest of the population. Composite health scores of the participating herds (median = 40, 95% range = 27.5 to 50) were similar to the original selection of 500 herds (median = 35, 95% range = 27.5 to 50). Farm visits Seven observers, all with previous experience in dairy production and handling, were trained to use the Welfare Quality assessment protocol for dairy cattle (Welfare Quality, 2009) in a three-day course given by delegates of the Welfare Quality consortium. Observers visited 14 to 48 herds during the winter months of November 2009 through to March 2010 when the cows had been denied access to pasture for at least 2 weeks. During a farm visit, observers collected data for 17 resource- and management-based (Table 1) and 24 animal-based (Tables 1 and 2a, b) WQ indicators in six assessment methods. Assessment methods, which were executed in a fixed order, are described briefly (details can be found in Welfare Quality (2009)) below. For avoidance distance at the feeding rack (ADF), which was measured on a pre-defined sample of lactating and dry cows (Welfare Quality, 2009), individual cows were approached from a distance of 2 m on the feed bunk. The avoidance distance was estimated at the moment the cow moved back, turned, or pulled back the head, and was categorized in one of four categories: > 100 cm, 100 to > 50 cm, 50 to > 0 cm, or touched. For the Qualitative Behaviour Assessment (QBA), cows were observed in segments of the barn for 20 minutes, regardless of the number of cows in the herd or in a segment. After this observation, 20 descriptors were scored on a visual analogue scale between 0 (expressive quality of the descriptor was entirely absent in any of the animals) and 125 mm (dominant across all observed animals). For BO, lying behaviour, agonistic behaviour, and coughing was recorded in segments (with a maximum of approximately 25 lactating cows) using continuous behaviour sampling (Martin and Bateson, 1993). For CO, 13 health indicators (Table 2) were assessed for a pre-defined sample of lactating and dry cows. Body condition was scored on a five-point scale, and grouped into classes “very lean” (score 1) and “not very lean” (score 2). Locomotion was scored on a five-point scale, and grouped into classes “not lame” (scores 1 and 2), “lame” (score 3) and “severely lame” (scores 4 and 5). Assessment details of other indicators of CO can be found in the WQ protocol (2009). Besides this, four resource-based, 13 management-based, and three animal-based indicators (Table 1) were collected using a resources checklist and an interview. Identical indicators were used for cattle in loose housing and tie stalls, except for lameness. Cows in tie stalls were categorized into two lameness classes (not lame or lame), instead of three (not lame, lame or severely lame).

On-farm assessment time 73
Table 1. Descriptive statistics of Welfare Quality indicators collected using a resources checklist or interview Assessment method Resource- and management-based indicators (categorical) Category (n herds)
Resources Type of housing loose (181), tied (13) checklist Sufficient number of drinkers yes (97), partly (64), no (33) Clean drinkers1 yes (192), no (2) At least 2 drinkers per cow yes (177), no (17) Interview Access to pasture (with at least 6 h per day) yes (145), no (49) Releasing cows from tie stalls for at least 1 hour per day in winter1 yes (0), no (13) Dehorning young stock (in at least 15% of animals) yes (181), no (13) - Method of dehorning1 chemical (1), thermal (180) - Use of analgesics1 yes (3), no (178) - Use of anaesthetics1 yes (173), no (8) Dehorning adult cattle (in at least 15% of animals)1 yes (0), no (194) - Use of analgesics1 N.A.2 - Use of anaesthetics1 N.A.2 Tail-docking (in at least 15% of animals)1 yes (0), no (194) - Method of tail-docking1 N.A.2 - Use of analgesics1 N.A.2 - Use of anaesthetics1
N.A.2
Animal-based indicators (continuous) Median (range) Interview % on-farm mortality 0.6 (0, 3.1) % cows with SCC > 400 000 11.0 (0, 36.3) % dystocia 5.0 (0, 50) 1 Indicator excluded from predictions due to observed prevalence < 5% 2 N.A. = not applicable Time needed per assessment method and total assessment time per herd were not recorded during the farm visits, but were estimated based on the information given in the WQ protocol (Welfare Quality, 2009). For this study, on-farm assessment time was estimated for an average Dutch dairy herd (78 lactating cows, LEI, 2008). Total estimated assessment time, therefore, was 381 minutes: 44 for ADF (1 minute per animal), 25 for QBA, 150 for BO, 132 for CO (3 minutes per animal), 15 for the resources checklist, and 15 for the interview. Data processing Data collected from the herds were expressed as “WQ indicators” at the herd level, using weights for the aggregation of ADF categories and QBA descriptors, and threshold values for the conversion into ordinal indicators as described in the WQ protocol (2009). The percentage of cows in each ADF category was weighted and aggregated into an “ADF index” ranging from 0 (worst) to 100 (best). For QBA, the 20 descriptors were weighted and aggregated into a “QBA index” ranging from -10 (worst) to 7 (best). Data related to lying behaviour, cleanliness, and disease were converted to an ordinal scale representing a minor-, moderate-, or severe problem (Table 3). WQ indicators were not included in the statistical analyses when the standard deviation was zero or the prevalence was less than 5%. Because ignorance of missing values can lead to reduced power (Donders et al., 2006; Dohoo et al., 2009), multiple imputation (MI) was used to replace missing values. MI is a technique in which a missing value is replaced by a value that was drawn from an estimate of the distribution of this variable (Donders et al., 2006).

74 Chapter 5
Table 2a. Observed and predicted prevalence and agreement (Cohen’s kappa, positive (PR) and negative rate (NR) with 95% confidence intervals (CI)) between observed and predicted values of categorical animal-based indicators assessed in behavioural observations, and clinical observations Indicator Problems (n herds) Agreement2 Observed Predicted1 PR NR Minor Moderate Severe Minor Moderate Severe (95% CI) (95% CI)
Behavioral observations Mean time to lie down (s) 41 75 78 10 92 88 0.14 97% (92-99) 12% (4-26) % cows colliding with stall components
81 23 90 90 0 102 0.44 72% (62-80) 73% (62-83)
% cows lying outside lying area
152 17 25 183 0 10 0.19 15% (6-29) 97% (93-99)
Frequency coughing per cow/15 minutes3
194 0 0 - - - - - -
Clinical observations % cows with: - dirty hind legs 15 28 151 0 0 194 0.00 100% (98-100) 0% (0-22) - dirty udder 80 45 69 132 0 60 0.25 41% (32-51) 83% (72-90) - dirty hindquarters 28 24 142 1 0 193 0.07 100% (98-100) 4% (0-18) - ocular discharge 170 16 8 194 0 0 0.00 0% (0-7) 100% (97-100) - nasal discharge 145 27 22 193 0 0 0.00 0% (0-14) 100% (98-100) - diarrhoea 126 20 48 191 0 2 -0.03 0% (0-5) 98% (94-100) - vulvar discharge 149 31 14 192 0 2 0.03 2% (0-12) 99% (96-100) - hampered respiration3 190 4 0 - - - - - - 1 Some herds excluded because highest predicted odds were equal for two or more categories 2 Results based on two classes: “minor problem” and “moderate or severe problem” 3 Indicator excluded from predictions due to observed prevalence < 5% Statistical analysis Spearman rank correlations between animal-based WQ indicators were calculated. They were preferred over Pearson correlations, because a number of variables could not be assumed to be (approximately) normally distributed. Subsequently, individual animal-based WQ indicators of each of the four assessment methods were predicted, using WQ indicators of the remaining three assessment methods, resources checklist, and interview as potential predictors. For example, to predict an indicator of BO (the “outcome indicator”), indicators of ADF, QBA, CO, resources checklist, and interview were used as potential predictors. In a first univariate screening, each predictor variable was selected in turn to judge its potential for prediction. A multinomial distribution with a logit link function was used when the outcome indicator involved categorical data, a binomial distribution with a logit link function for binary data, and a Poisson distribution with a log link function and a multiplicative overdispersion parameter for count data (all models were generalized linear models (McCullagh and Nelder, 1989)). Subsequently, the outcome indicator was predicted using multiple predictors that were selected (P-value of Wald test < 0.20) in the first screening. The final prediction model was selected based on the lowest value for Akaike’s Information Criterion (AIC). For categorical indicators, herds were assigned to the category with the highest predicted odds.

On-farm assessment time 75
Table 2b. Difference (y- ) and Spearman rank correlation (rs) between observed (y) and predicted ( ) values of continuous animal-based indicators assessed in the avoidance distance at the feeding rack (ADF), Qualitative Behaviour Assessment (QBA), behavioural observations (BO), and clinical observations (CO)
y y- Method Indicator median (95% range) median (95% range) median (95% range) rs
ADF ADF index 68.0 (25.6, 92.3) 67.9 (54.7, 76.2) 2.2 (-33.9, 24.2) 0.31QBA QBA index -1.0 (-8.8, 4.6) -1.2 (-3.8, 2.8) 0.4 (-6.1, 4.1) 0.54BO Frequency of head butts
per cow/h 0.7 (0.1, 2.8) 0.8 (0.4, 1.4) -0.1 (-0.8, 1.6) 0.38
Frequency of displacements per cow/h
0.3 (0, 1.5) 0.4 (0.0, 0.8) -0.0 (-0.5, 0.8) 0.46
CO % very lean cows 2.4 (0, 20.0) 3.8 (0.9, 12.0) -1.2 (-7.6, 15.5) 0.43 % moderately lame cows 24.1 (3.6, 51.4) 24.1 (14.6, 36.3) -0.43 (-21.6, 24.0) 0.39 % severely lame cows1 6.0 (0, 28.9) 6.9 (1.8, 24.1) -1.8 (-11.9, 17.0) 0.50 % cows with hairless patches 33.3 (3.3, 61.5) 32.8 (21.8, 42.3) -0.1 (-26.2, 29.9) 0.33 % cows with lesions or swellings 35.3 (4.6, 94.7) 39.4 (24.3, 72.6) -4.4 (-30.7, 43.4) 0.491 Prediction concerns only loose housing systems because severe lameness was not assessed in tie stalls The level of agreement between observed and predicted values of continuous WQ indicators was shown by their absolute difference and Spearman rank correlation (rs). The latter correlation was interpreted by an informal classification system as suggested by Martin and Bateson (1993) for a Pearson correlation: slight (rs 0.2), low (rs > 0.2 to 0.4), moderate (rs > 0.4 to 0.7), high (rs > 0.7 to 0.9), and very high (rs > 0.9 to 1.0). For categorical WQ indicators, agreement between observed and predicted values was assessed by Cohen’s kappa coefficient ( , Cohen, 1960). This coefficient was interpreted by an informal classification system as described by Landis and Koch (1977): poor ( 0), slight ( > 0 to 0.2), low ( > 0.2 to 0.4), moderate ( > 0.4 to 0.6), high ( > 0.6 to 0.8), and very high ( > 0.8 to 1.0). In addition, positive (PR) and negative (NR) rates (which are similar to sensitivity and specificity of a diagnostic test) were calculated. To that end, observed and predicted values were grouped into classes “minor problem” and “moderate or severe problem”. The PR is defined as the probability for “moderate or severe problem” being predicted, given a “moderate or severe problem” being observed. The NR is similarly defined for the “minor problem” class. All calculations were performed with GenStat (GenStat for Windows, 2011).
Results The WQ protocol was executed in 196 dairy herds. Data from two herds were excluded because the protocol could not be executed correctly in these herds. In the remaining 194 herds, with herd size ranging between 10 and 211 lactating cows, cows were loose housed on 181 farms, and tied on 13 farms. On 145 farms, cows had access to pasture in summer. Twelve resource- and management-based (Table 1) and two animal-based WQ indicators (Table 2a) showed a prevalence of less than 5% and were therefore excluded from the statistical analyses. Missing values were replaced using MI in eight indicators: the number of days with access to pasture (missing in three herds), percentage of cows with lesions and swellings (one herd), with hairless patches (one herd), with SCC > 400 000 (seven herds), with dystocia (one herd), and ADF (could not be executed in six herds).

76 Chapter 5
Table 3. Threshold values for categorical indicators representing a minor, moderate, or severe problem (adapted from Welfare Quality, 2009)
Indicator Minor problem Moderate problem Severe problem Mean time to lie down (s) 5.2 > 5.2 and 6.3 > 6.3 % cows colliding with components of the stall 20 > 20 and 30 > 30 % cows lying outside lying area 3 > 3 and 5 > 5 % cows with dirty hind legs 20 > 20 and 50 > 50 % cows with dirty udder 10 > 10 and 19 > 19 % cows with dirty hindquarters 10 > 10 and 19 > 19 % cows with ocular discharge 3 > 3 and 6 > 6 % cows with nasal discharge 5 > 5 and 10 > 10 % cows with diarrhoea 3.25 > 3.25 and 6.5 > 6.5 % cows with vulvar discharge 2.25 > 2.25 and 4.5 > 4.5 Percentage of cows with hampered respiration 3.25 > 3.25 and 6.5 > 6.5 Average frequency of coughing per 100 cows and 15 minutes
3 > 3 and 6 > 6
Correlations between animal-based indicators Correlations between animal-based WQ indicators ranged from -0.51 (percentage of cows with hairless patches versus lesions) to 0.75 (percentage of cows with dirty udder versus dirty hindquarter). When animal-based WQ indicators belonging to different assessment methods were compared, correlations ranged from -0.26 (frequency of displacements versus QBA index) to 0.35 (percentage of very lean cows versus percentage of cows colliding with components of the stall while lying down, Figure 1). Predicting ADF The correlation between observed and predicted values for the ADF index was 0.31, which was interpreted as a low agreement. The difference between the observed and predicted values for the index ranged between -33.9 and 24.2 (95% range, Table 2b), which is comparable to an over- and underestimation of 33.9 and 24.2%, respectively, of cows that could not be approached closer than 100 cm. The final prediction model for the ADF index comprised percentage of cows with dirty hind legs, lame, lying outside the supposed lying area, and QBA index as predictors (see Appendix). Predicting QBA Prediction of the QBA index resulted in a correlation of 0.54 between observed and predicted values. This was interpreted as a moderate agreement. The difference between the observed and predicted values ranged from -7.0 to 6.5 (95% range, Table 2b). The difference at the index level is hard to interpret at the level of descriptors due to the large number of terms in the QBA index. The final prediction model comprised percentage of cows with vulvar discharge, SCC > 400 000, lying outside the lying area, lame, severely lame, frequency of displacements, sufficient number of drinkers, ADF index, and herd size as predictors (Appendix).

On-farm assessment time 77
Figure 1. Spearman rank correlation coefficients per animal-based indicator when compared with indicators belonging to different assessment methods (avoidance distance at the feeding rack (ADF), Qualitative Behaviour Assessment (QBA), behavioural observations, or clinical observations). Predicting BO The correlation between observed and predicted values was 0.38 for frequency of head butts and 0.46 for displacements, which was interpreted as a low and a moderate correlation. The difference between the observed and predicted values ranged from -0.8 to 1.6 head butts and -0.5 to 0.8 displacements per cow per hour (95% range, Table 2b). The final prediction model for frequency of head butts comprised percentage of cows with dirty hind legs, dirty hindquarters, diarrhoea, hairless patches, mortality, and lameness as predictors. For frequency of displacements, the final prediction model comprised percentage of cows that was very lean, dirty hind legs, nasal discharge, vulvar discharge, type of housing, and QBA index as predictors (Appendix). For the indicators of lying behaviour, ranged from 0.14 (mean time to lie down) to 0.44 (percentage of cows colliding with components of the stall, Table 2a). This was interpreted as a low to moderate agreement. NR was 12% for the mean time to lie down (Table 2a), which indicates that the probability for predicting a minor problem for this indicator, given a minor problem being observed, was low. PR was 15% for the percentage of cows lying outside the lying area, which indicates that the probability for predicting a moderate or severe problem, given a moderate or severe problem being observed, was low. The final prediction models for the indicators of lying behaviour comprised indicators relating to type of housing, lesions, lameness, body condition, diarrhoea, ocular discharge, cleanliness, and QBA index as predictors (Appendix).

78 Chapter 5
Predicting CO For the continuous indicators of CO, correlation between observed and predicted values ranged from 0.33 (percentage of cows with hairless patches) to 0.50 (percentage of severely lame cows, Table 2b). This was interpreted as a low to moderate agreement. The largest difference (based on a 95% range) between observed and predicted values ranged from 15.5% for the percentage of very lean cows to 43.4% for the percentage of cows with lesions or swellings. For the categorical indicators, ranged from -0.03 (percentage of cows with diarrhoea) to 0.07 (percentage of cows with dirty hindquarter), except for the percentage of cows with dirty udder, which showed a of 0.25 (Table 2a). This was interpreted as a poor to low agreement. NR was 0 and 4% for dirty hind legs and hindquarters, respectively, whereas PR ranged from 0 to 2% for the percentage of cows with diarrhoea, ocular-, nasal-, and vulvar discharge (Table 2a). None of the herds were assigned to a “moderate problem”, although a substantial number of herds were observed in this category. The final prediction model for the percentage of very lean cows comprised herd size, the percentage of cows colliding with components of the stall while lying down, dehorning, and frequency of displacements as predictors (Appendix). For the percentage of lame and severely lame cows, final prediction models were rather similar, comprising indicators relating to drinkers, mean time to lie down, frequency of head butts, ADF index, and QBA index as predictors. In addition, the model for the percentage of severely lame cows included herd size, access to pasture, frequency of coughing, the percentage of cows with SCC > 400 000, and mortality as predictors. Final prediction models for the percentage of cows with hairless patches and with lesions or swellings comprised indicators relating to drinkers, lying behaviour, agonistic behaviour, mortality, access to pasture, ADF index, and QBA index as predictors. With regard to indicators relating to cleanliness, final prediction models comprised indicators relating to lying behaviour, SCC, agonistic behaviour, type of housing, access to pasture, and ADF index as predictors. For indicators relating to disease (diarrhoea, ocular, nasal and vulvar discharge), final prediction models comprised indicators relating to drinkers, lying behaviour, agonistic behaviour, access to pasture, and coughing as predictors.
Discussion Our aim was to assess the scope for reduction of on-farm assessment time of the WQ protocol for dairy cattle. To this end, performance was evaluated of a reduced protocol, in which a set of WQ indicators belonging to one assessment method was omitted and replaced by predictions based on remaining animal-, resource- and management-based indicators. Omitting indicators belonging to BO and CO from the protocol were estimated to result in the highest time gain: 150 and 132 minutes. Omitting indicators of ADF and QBA were estimated to result in 44 and 25 minutes time gain. Herds in this study were selected on the basis of a composite health score to achieve more variation in the level of animal welfare. At the same time, this may have resulted in a better agreement between observed and predicted values. Consequently, a lower level of agreement might be found when herds are selected randomly. To avoid reduced power due to missing values (Donders et al., 2006; Dohoo et al., 2009), multiple imputation was used to replace missing values. The percentage of missing values in our study was less than 1%. This technique has shown to be an appropriate method to deal with much larger proportions of missing values (Schafer and Olsen, 1998). Therefore, the use of multiple

On-farm assessment time 79
imputation is not expected to have affected the results of this study to the extent of practical relevance. More than one-third of the 41 indicators in the WQ protocol showed a prevalence of less than 5%. Because the majority of these indicators were resource- or management-based, exclusion of these indicators from the WQ protocol would result in approximately 15 minutes time gain only. With the exception of five indicators that were related to issues regulated by the Dutch law (tail-docking and use of anaesthetics for dehorning young stock), exclusion of these indicators is not recommended because prevalence may change over time and space, and herds that participated in this study may not be indicative for future populations. Agreement between observed and predicted values was poor to moderate. The fact that WQ indicators provided little predictive value for other WQ indicators may reflect the aim of the Welfare Quality project to select a minimum set of welfare criteria (Botreau et al., 2007). On the other hand, factors inherent to the quality of the WQ monitoring system may have influenced predictive value. For example, the level of agreement between predicted and observed values is likely to be negatively affected by low inter-observer reliability (IOR) of indicators. This effect can be illustrated as follows: when indicator ‘A’ has a high IOR (ie little variation among different observers) and indicator ‘B’ has a low IOR (ie large variation among different observers), a low association between indicators ‘A’ and ‘B’ can be expected. Hence, a low IOR of ‘B’ negatively affects the prediction of ‘A’ by ‘B’. A high IOR, for example, has been shown for the lameness scoring method used in our study (Winckler and Willen, 2001), whereas IOR was found to be low for QBA (Kendall’s W between 0.14 and 0.62, Bokkers et al., 2012). If two observers, assessing lameness and QBA on the same farms, find similar percentages of severely lame cows but different scores for the QBA index, prediction of lameness by QBA (and vice versa) will be negatively affected. Obviously, the level of agreement deteriorates even more if IOR of both outcome and predictor are low. Another possible reason for poor agreement between observed and predicted values, was that the observed classification was rather skewed for categorical indicators. Half of the indicators of BO and CO were categorical, whereas QBA and ADF contained no categorical indicators. For six of the twelve categorical indicators, more than two-thirds of the herds were in the “minor problem” category. For two other indicators, more than two-thirds of the herds were in the “severe problem” category. Prediction models assigned nearly all herds to the most frequent category. Consequently, herds with problems were overlooked (poor PR), or herds with proper welfare were incorrectly assumed to have a problem (poor NR). Six indicators showed a moderate agreement between observed and predicted values; percentage of cows colliding with stall components, very lean, severely lame, with lesions or swellings, QBA index, and frequency of displacements. However, only omission of the QBA index from the WQ protocol would imply a reduction of on-farm assessment time, because, contrary to the other indicators, the assessment method (QBA) contains only one indicator. Despite its low IOR (Bokkers et al., 2012), the QBA index showed the highest agreement (rs = 0.54) between observed and predicted values. The QBA index was predicted by frequency of displacements, amongst others, for which a correlation was also found in another study (Rousing and Wemelsfelder, 2006). The ADF index was another important predictor for the QBA index. However, since ADF was assessed before QBA during the farm visit the QBA scoring might have been influenced by the observations on the cows during the ADF.

80 Chapter 5
The “moderate” agreement between observed and predicted values for six indicators in the WQ protocol suggests that these observations and predictions were not completely unrelated. However, it also means that less than 30% of the observed variance was explained by the prediction models. This lack of predictive value was also illustrated by the large absolute differences between observed and predicted values. Therefore, it is not recommended to use these predictions as a replacement for omitted indicators in the WQ protocol. In order to enhance the use of the WQ protocol in welfare audit programs, other ways to reduce on-farm assessment time should be investigated. For example, few herd health records and resource- and management-based variables were used to predict WQ indicators in this study, whereas such variables have shown to correlate with a large number of WQ indicators (eg Mülleder et al., 2007; Sandgren et al., 2009). Compared to animal-based WQ indicators, collecting herd health records and data for resource- and management-based variables is less time-consuming and costly. Prediction of WQ indicators based on a larger share of herd health records and resource- and management-based variables, therefore, should be further investigated. Because in many countries herd health records are available in national databases, these could even be used for a first estimate of the level of animal welfare before an on-farm assessment is performed (Sandgren et al., 2009; De Vries et al., 2011). Besides the use of additional data, automated monitoring systems show the potential to reduce on-farm assessment time of the WQ protocol. Mainly for the assessment methods BO and CO, animal activity sensors or video recordings could replace direct visual observations for monitoring of, for example, lying behaviour or lameness (e.g. Flower et al., 2005; Bewley et al., 2010; Pluk et al., 2012). Conclusion Replacing a set of animal-based WQ indicators belonging to one assessment method with predictions based on remaining WQ indicators showed little scope for reduction of on-farm assessment time of the WQ protocol for dairy cattle. Therefore, except for indicators regulated by law, it is not recommended to omit indicators of the WQ protocol for dairy cattle. Other ways to reduce on-farm assessment time of the WQ protocol, such as the use of additional data or automated monitoring systems, should be investigated.
Acknowledgements
The authors gratefully acknowledge the farmers participating in this study, and Kees van Reenen, Wim Swart, Jac Thissen, and Pieter Vereijken for their stimulating discussions and ideas.
References Bewley, J. M., R. E. Boyce, J. Hockin, L. Munksgaard, S. D. Eicher, M. E. Einstein, and M. M. Schutz. 2010. Influence of milk yield,
stage of lactation, and body condition on dairy cattle lying behaviour measured using an automated activity monitoring sensor. J. Dairy Res. 77: 1-6.
Blackie, N., J. Amory, E. Bleach, and J. Scaife. 2011. The effect of lameness on lying behaviour of zero grazed Holstein dairy cattle. Appl. Anim. Behav. Sci. 134: 85-91.
Blokhuis, H. J., I. Veissier, M. Miele, and B. Jones. 2010. The Welfare Quality® project and beyond: Safeguarding farm animal well-being. Acta Agric. Scand. Sect. A-Anim. Sci. 60: 129-140.

On-farm assessment time 81
Bokkers, E. A. M., M. de Vries, I. Antonissen, and I. J. M. de Boer. 2012. Inter- and intra-observer reliability of experienced and inexperienced observers for the Qualitative Behaviour Assessment in dairy cattle. Anim. Welf. 21: 307-318.
Botreau, R., M. B. M. Bracke, P. Perny, A. Butterworth, J. Capdeville, C. G. Van Reenen, and I. Veissier. 2007. Aggregation of measures to produce an overall assessment of animal welfare. Part 2: analysis of constraints. Animal 1: 1188-1197.
Bowell, V. A., L. J. Rennie, G. Tierney, A. B. Lawrence, and M. J. Haskell. 2003. Relationships between building design, management system and dairy cow welfare. Anim. Welf. 12: 547-552.
Cohen, J. 1960. A coefficient of agreement for nominal scales. Educ. Psychol. Meas. 20: 37-46. De Vries, M., E. A. M. Bokkers, T. Dijkstra, G. van Schaik, and I. J. M. de Boer. 2011. Invited review: Associations between variables
of routine herd data and dairy cattle welfare indicators. J. Dairy Sci. 94: 3213-3228. Dohoo, I. R., S. W. Martin, and H. Stryhn. 2009. Veterinary Epidemiologic Research. 2 ed. VER, Inc., Charlottetown, Canada. Donders, A. R. T., G. J. M. G. van der Heijden, T. Stijnen, and K. G. M. Moons. 2006. Review: A gentle introduction to imputation of
missing values. J. Clin. Epidemiol. 59: 1087-1091. Flower, F. C., D. J. Sanderson, and D. M. Weary. 2005. Hoof Pathologies Influence Kinematic Measures of Dairy Cow Gait. J. Dairy
Sci. 88: 3166-3173. GenStat for Windows, 2011. GenStat for Windows Release 14. VSN International Ltd, Hemel Hempstead, UK. Ito, K., M. A. G. von Keyserlingk, S. J. LeBlanc, and D. M. Weary. 2010. Lying behavior as an indicator of lameness in dairy cows. J.
Dairy Sci. 93: 3553-3560. Knierim, U. and C. Winckler. 2009. On-farm welfare assessment in cattle: validity, reliability and feasibility issues and future
perspectives with special regard to the Welfare Quality approach. Anim. Welf. 18: 451-458. Landis, J. R. and G. G. Koch. 1977. The Measurement of Observer Agreement for Categorical Data. Biometrics 33: 159-174. LEI. 2008. Farm Accountancy Data Network 2009. Web page http://www.lei.wur.nl/UK/statistics/Binternet/. Accessed May 29,
2012. LEI, The Hague, Netherlands. Martin, P. and P. Bateson. 1993. Measuring Behaviour - An introductory guide. Cambridge University Press, Cambridge, UK. McCullagh, P. and J. A. Nelder. 1989. Generalized Linear Models. Chapman and Hall, London, UK. Mülleder, C., J. Troxler, G. Laaha, and S. Waiblinger. 2007. Can environmental variables replace some animal-based parameters in
welfare assessment of dairy cows? Anim. Welf. 16: 153-156. Pluk, A., C. Bahr, A. Poursaberi, W. Maertens, A. van Nuffel, and D. Berckmans. 2012. Automatic measurement of touch and
release angles of the fetlock joint for lameness detection in dairy cattle using vision techniques. J. Dairy Sci. 95: 1738-1748. Rousing, T. and F. Wemelsfelder. 2006. Qualitative assessment of social behaviour of dairy cows housed in loose housing
systems. Appl. Anim. Behav. Sci. 101: 40-53. Sandgren, C. H., A. Lindberg, and L. J. Keeling. 2009. Using a national dairy database to identify herds with poor welfare. Anim.
Welf. 18: 523-532. Schafer, J. L. and M. K. Olsen. 1998. Multiple imputation for multivariate missing-data problems: A data analyst's perspective.
Multivar. Behav. Res. 33: 545-571. Waiblinger, S., C. Menke, and D. W. Folsch. 2003. Influences on the avoidance and approach behaviour of dairy cows towards
humans on 35 farms. Appl. Anim. Behav. Sci. 84: 23-39. Webster, A. J. F., D. C. J. Main, and H. R. Whay. 2004. Welfare assessment: Indices from clinical observation. Anim. Welf. 13
(Suppl.): S93-S98. Welfare Quality. 2009. Welfare Quality® Assessment Protocol for Cattle. Welfare Quality® Consortium, Lelystad, Netherlands. Winckler, C. and S. Willen. 2001. The reliability and repeatability of a lameness scoring system for use as an indicator of welfare in
dairy cattle. Acta Agric. Scand. A Anim. Sci. 51: 103-107.

82 Chapter 5
Appendix. Probabilities1 of predictors2 used in the final models for prediction of animal-based Welfare Quality® indicators
Anim
al-b
ased
wel
fare
in
dica
tor (
outc
ome)
ADF
inde
x
QBA
inde
x +
10
Freq
. hea
d bu
tts/
cow
/h
Freq
.disp
lace
men
ts/c
ow/h
Mea
n tim
e to
lie
dow
n (s
)
% o
f cow
s:
- col
lidin
g w
ith s
tall
- lyi
ng o
utsid
e ly
ing
area
- dirt
y hi
nd le
gs
- dirt
y ud
der
- dirt
y hi
nd q
uart
ers
- ocu
lar d
ischa
rge
- nas
al d
ischa
rge
diar
rhoe
a
vulv
ar d
ischa
rge
very
lean
lam
e
seve
rely
lam
e
hairl
ess
patc
hes
lesio
ns/s
wel
lings
Predictor
Herd size **** ** *** ***
ADF index **** *** **** **** ***
QBA index **** **** *** **** **** **
Head butts(/cow/h) *** **** **** ** ** **
Displacements(/cow/h) *** **** **
Coughing (/cow/15min) *** *** Time to lie down (s) ** *** ****
% of cows:
- colliding with stall *** * **** **** ***
- lying outside lying area *** *** *** **** ****
- dirty hind legs *** **** * ***
- dirty udder *** * - dirty hindquarters ***
- ocular discharge *** ****
- nasal discharge ***
- diarrhoea **** **
- vulvar discharge ** ***
- hampered respiration
- very lean **** *** **** - lame **** *** *** **
- severely lame ****
- hairless patches ****
- lesions/swellings *** ****
- SCC > 400 000 ** *** *** *
- dystocia - died on-farm *** *** **
Type of housing (loose/tied) **** **** ***
Sufficient drinkers (y/n) *** * **** ** **** ***
2 drinkers/cow (y/n) *** *
Access to pasture (y/n) ** *** **** ** ****
Dehorning young stock (y/n) *** 1 P-value of F-test. Significance of association indicated by * (0.10 < P < 0.25), ** (0.05 < P < 0.10, *** (0.01 < P < 0.05), **** (P < 0.01) 2 Indicators were not used as potential predictors when they belonged to the same assessment method as the outcome variable (indicated in grey)


84 Chapter 6
Housing and management factors associated with indicators of dairy cattle welfare
M. de Vries1, E.A.M. Bokkers1, C.G. van Reenen2, B. Engel3, G. van Schaik4, T. Dijkstra4 and I.J.M. de Boer1 1 Animal Production Systems group, Wageningen University, Wageningen, the Netherlands, 2 Livestock Research, Wageningen UR, Wageningen, the Netherlands, 3 Biometris, Wageningen University, Wageningen, the Netherlands, 4 GD Animal Health Service, Deventer, the Netherlands
Abstract Knowledge of potential synergies and trade-offs of housing and management factors for different aspects of animal welfare is essential for farmers who aim to improve the level of welfare in their herd. Our aim was to identify and compare housing and management factors associated with the prevalence of lameness, lesions or swellings, dirty hindquarters, and the average frequency of displacements in dairy herds in free-stall housing. Seven trained observers collected data regarding housing and management characteristics of 179 Dutch dairy herds (herd size: 22 to 211 cows) in free-stall housing during winter. Lame cows, cows with lesions or swellings, and cows with dirty hindquarters were counted for a sample of cows and occurrence of displacements was recorded in the whole barn during 120 min of observation. For each of the four welfare indicators, housing and management factors associated with the welfare indicator were selected in a succession of simple and multiple logistic or log linear regression analyses. Prevalence of lameness was associated with the surface of the lying area, summer pasturing, herd biosecurity status, and far-off and close-up dry cow groups (P < 0.05). Prevalence of lesions or swellings was associated with the surface of the lying area, summer pasturing, light intensity in the barn, and number of days in milk when the maximum amount of concentrates is fed (P < 0.05). Prevalence of dirty hindquarters was associated with the surface of the lying area, the proportion of stalls with fecal contamination, head lunge impediments in stalls, and the number of roughage types (P < 0.05). Average frequency of displacements was associated with the time of introducing heifers in the lactating group, the use of cow brushes, continuous availability of roughage, floor scraping frequency, herd size, and the proportion cows to stalls (P < 0.05). Both the prevalence of lameness and lesions or swellings were lower in herds that had soft mats or mattresses (odd ratio (OR) = 0.66 and 0.58, confidence interval (CI) = 0.48-0.91 and 0.39-0.85) or deep bedding (OR = 0.48 and 0.48, CI = 0.32-0.71 and 0.30-0.77) in stalls, compared with concrete, and in herds with summer pasturing (OR = 0.68 and 0.41, CI = 0.51-0.90 and 0.27-0.61), compared with zero-grazing. Deep bedding in stalls was negatively associated with the prevalence of dirty hindquarters (OR = 0.54, CI = 0.32-0.92), compared with hard mats. It was concluded that some aspects of housing and management are common protective factors for prevalence of lameness, lesions or swellings, and dirty hindquarters, but not for frequency of displacements.

Housing and management factors and dairy cattle welfare 85
Introduction Animal welfare varies considerably among dairy herds. Prevalence of lameness and hock injuries, for example, have been reported to range from 0% up to 100% (Fourichon et al., 2001; Von Keyserlingk et al., 2012; Brenninkmeyer et al., in press). At the same time, a considerable variation is found in housing and management factors that are thought to affect dairy cattle welfare (Von Keyserlingk et al., 2012). This suggests that there is room for improvement of dairy cattle welfare. An aspect complicating the improvement of the overall welfare level on farms is that animal welfare is a multidimensional concept (Fraser, 1995). This multidimensionality is illustrated by the fact that animal welfare comprises not only physical (i.e. health and vigor), but also psychological aspects (i.e. sense and feeling; Webster, 2005). As a consequence, animal welfare assessment requires the use of multiple indicators. The Welfare Quality protocol for cattle, for example, includes indicators relating to the aspects feeding, housing, health, and behavior (Welfare Quality, 2009). Indicators that relate to similar aspects of animal welfare have been associated with similar housing and management factors. This may be partly due to the existence of biological relations between these indicators. Lameness and skin lesions, for example, are indicators relating to health, and both have been associated with surface of the lying area in free-stalls and pasturing (e.g. Haskell et al., 2006; Chapinal et al., 2013; Brenninkmeyer et al., in press). For indicators relating to different aspects of animal welfare, however, it is largely unknown whether they are influenced by similar-, or by different housing and management factors, and whether a change in a factor has an opposing (trade-off) or synergic effect on these indicators. Positioning the neck rail of the free-stall further from the rear curb, for example, has been associated with decreased cow cleanliness due to defecation in the stall (trade-off), but was a protective factor for lameness and hair loss at the hocks (synergy; e.g. Bernardi et al., 2009; Dippel et al., 2009; Fregonesi et al., 2009; Potterton et al., 2011). Knowing potential synergies and trade-offs of housing and management factors for different aspects of animal welfare is essential for farmers who aim to improve the overall welfare level of their herd. However, housing and management factors associated with dairy cattle welfare can differ across regions, due to, for example, geographical difference in housing design and popular opinions of best practices in the area (Chapinal et al., 2013). Therefore, identification and comparison of factors associated with dairy cattle welfare is preferably done in the same population. Only few studies have investigated associations between housing and management factors and indicators relating to different aspects of dairy cattle welfare simultaneously (e.g. Burow et al., 2012; Husfeldt and Endres, 2012). In the current study, we consider four indicators included in the Welfare Quality protocol for dairy cattle (2009) relating to three aspects of animal welfare: prevalence of lameness, lesions or swellings (related to health), dirty hindquarters (housing), and average frequency of displacements (behavior). These indicators were selected because of availability of explanatory housing and management data, and expected similarity (e.g. lameness, lesions or swellings) or difference (e.g. lameness and displacements) of explanatory housing and management factors. Our aim was to identify and compare housing and management factors associated with the prevalence of lameness, lesions or swellings, and dirty hindquarters, and the average frequency of displacements in dairy herds in free-stall housing.

86 Chapter 6
Materials and methods Herd selection To identify factors associated with dairy cattle welfare, we aimed for data from herds that span a wide range of levels of animal welfare. We used several national databases containing routine herd data relating to demography, milk production, and milk composition (details of these databases can be found in De Vries et al. (Chapter 3 of this thesis)) to calculate a composite health score (CCHS) between 0 (worst) and 50 (best) for approximately 5,000 herds participating in a health program of a Dutch dairy cooperative. This CHS, for which data was used from January 2008 through June 2009, consisted of five variables of routine herd data shown to be associated with animal welfare (De Vries et al., 2011): cow and young stock mortality, bulk tank milk somatic cell count, new udder infections, and fluctuations in standardized milk production. A herd was assigned zero points per variable when it was among the 10% worst values, and 10 points when it was among the 90% best values of all herds in the databases in 2004. Subsequently, 500 herds were approached to participate in the study: 250 herds were randomly selected from the 5% lowest CHS (i.e. CHS 40) and 250 herds from the 95% highest CHS (i.e. CHS > 40). From these 500 herds, 163 farmers responded positively, 75 negatively and 262 failed to respond. Non-responders were contacted by phone. In total, 196 farmers agreed to participate: 90 from the 5% lowest CHS, and 106 from the 95% highest CHS. Of the selected herds, 13 herds were housed in tie-stalls and two in straw yards. Because the number of herds for these two housing systems was too small for statistical analyses of risk factors, herds in tie-stalls and straw yards were excluded from the analyses. Data of two herds in free-stall housing were also excluded, because the WQ protocol could not be executed correctly in these herds. In the remaining 179 herds, herd size ranged from 22 to 211 cows and average milk production from 13.5 to 34.5 kg per cow/d. Data collection and processing Seven observers, each with previous experience in dairy production and handling, were trained to use the Welfare Quality assessment protocol for dairy cattle (Welfare Quality, 2009). Herds were randomly distributed among these observers, who were not informed about the herds’ CHS. Each observer visited 14 to 48 herds once from November 2009 through March 2010 (winter), when cows had been denied access to pasture for at least 2 weeks. Observers collected data for lameness, lesions and swellings, dirty hindquarter, displacements, and housing- and management factors (Table 1). Data collection methods are described briefly below (details can be found in Welfare Quality (2009)). Lameness Lameness was assessed for a predefined number of lactating and dry cows (sample size depended on herd size, see Welfare Quality, 2009), walking in a straight line and on a hard, level surface, using a 5 points scoring system described by Winckler and Willen (2001). Cows were grouped into classes ‘not lame’ (scores 1 and 2), and ‘lame’ (score 3, 4 and 5). Data were expressed at the herd level, as percentages of assessed cows that were lame.

Housing and management factors and dairy cattle welfare 87
Table 1. Herd-level factors considered in univariable analyses Factor Level General herd characteristics
Herd size (n lactating cows) < 61 61 - 79 > 79 Breed (in at least 10% of the cows) Holstein-Fr. Other
Housing Air inlet side walls Yes No Air inlet roof top Yes No Light intensity1 Light Dark Cow brushes No brushes Fixed Rotating Average width of alleys (cm) < 222 222 - 250 > 250 Average width of passages (cm) < 185 185 - 223 > 223 Alleys with dead ends No Yes Type of flooring system Slatted Solid Slippery floor2 No Yes Floor scraping frequency (times/day) < 3 3 - 5 > 5 Rims or pit in the floor No Yes
Stalls Proportion cows to stalls < 0.91 0.91 - 1.04 > 1.04 Predominant surface of lying area Concrete Hard mat Soft mat/mattress Deep bedding Stall divisions Cantilever Mushroom Other Average stall width (cm) < 110.2 110.2 – 111.5 > 111.5 Average stall length (cm) < 220.5 220.5 – 228.7 > 228.7 Average height of stall neck rail (cm) < 109.2 109.2 - 114.5 > 114.5 Head lunge impediments All stalls Some stalls No stalls Bedding height (cm) < 0.56 0.56 - 1.75 > 1.75 Stalls with fecal contamination3 (%) < 50 50 Cleaning frequency (times/day) 2 > 2 Littering frequency (times/day) < 2 2
Feeding Average feed space per cow (cm) < 56.0 56.0 - 67.7 > 67.7 Average feeding rack height (cm) < 138 138 - 146 > 146 Roughage fed at fixed times of the day No Yes Different types of roughage No Yes, fed mixed Yes, fed separately Continuous availability4 of roughage No Yes Roughage contaminated with manure and/or moulds, or heat coming out
No Yes
Concentrate dispensers in the stable No Yes Max. amount of concentrates (kg DS/cow/day) < 9.5 9.5 - 10 > 10 DIM when max. amount of concentrates is fed < 22 22 - 28 > 28 Group drinkers No Yes Sufficient number and/or length5 of drinkers Yes Partly No
Milking practices Automatic milking No Yes Lactation groups No Yes Maximum waiting time for milking (min) < 45 45 - 75 > 75 Temporary fixing of cows in feeding rack after each milking
No Yes
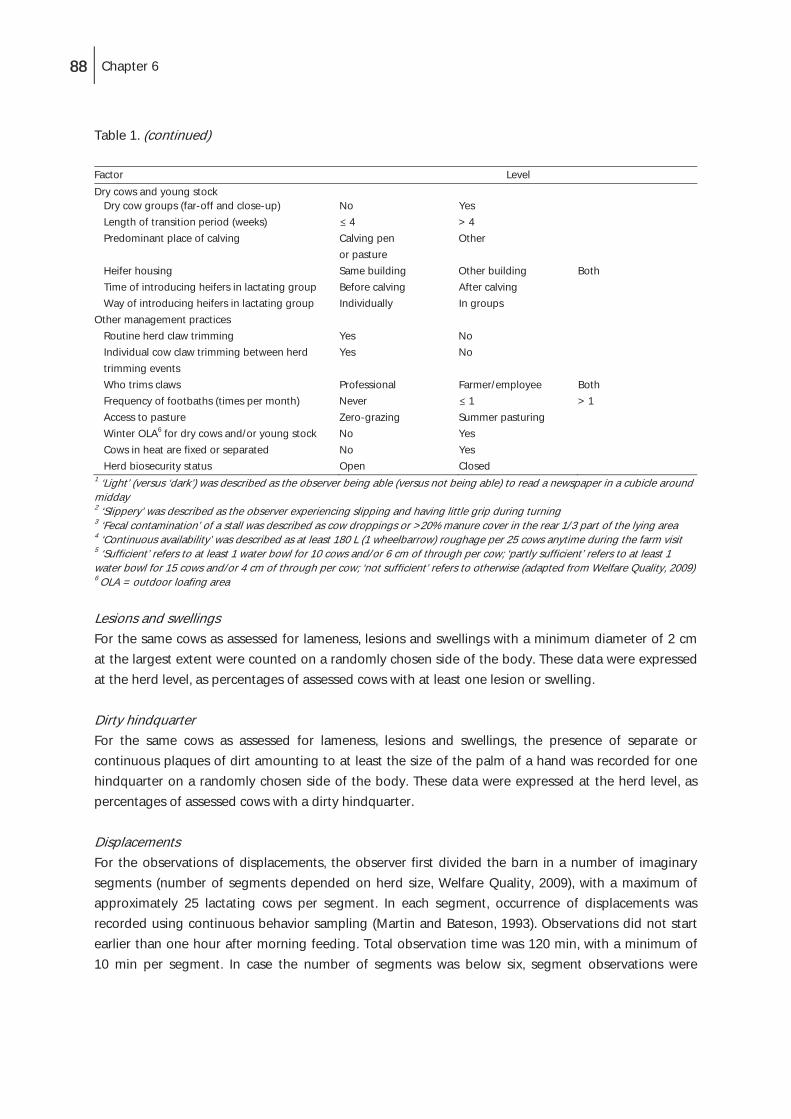
88 Chapter 6
Table 1. (continued) Factor Level Dry cows and young stock
Dry cow groups (far-off and close-up) No Yes Length of transition period (weeks) 4 > 4 Predominant place of calving Calving pen
or pasture Other
Heifer housing Same building Other building Both Time of introducing heifers in lactating group Before calving After calving Way of introducing heifers in lactating group Individually In groups
Other management practices Routine herd claw trimming Yes No Individual cow claw trimming between herd trimming events
Yes No
Who trims claws Professional Farmer/employee Both Frequency of footbaths (times per month) Never 1 > 1 Access to pasture Zero-grazing Summer pasturing Winter OLA6 for dry cows and/or young stock No Yes Cows in heat are fixed or separated No Yes Herd biosecurity status Open Closed
1 ‘Light’ (versus ‘dark’) was described as the observer being able (versus not being able) to read a newspaper in a cubicle around midday 2 ‘Slippery’ was described as the observer experiencing slipping and having little grip during turning 3 ‘Fecal contamination’ of a stall was described as cow droppings or >20% manure cover in the rear 1/3 part of the lying area 4 ‘Continuous availability’ was described as at least 180 L (1 wheelbarrow) roughage per 25 cows anytime during the farm visit 5 ‘Sufficient’ refers to at least 1 water bowl for 10 cows and/or 6 cm of through per cow; ‘partly sufficient’ refers to at least 1 water bowl for 15 cows and/or 4 cm of through per cow; ‘not sufficient’ refers to otherwise (adapted from Welfare Quality, 2009) 6 OLA = outdoor loafing area Lesions and swellings For the same cows as assessed for lameness, lesions and swellings with a minimum diameter of 2 cm at the largest extent were counted on a randomly chosen side of the body. These data were expressed at the herd level, as percentages of assessed cows with at least one lesion or swelling. Dirty hindquarter For the same cows as assessed for lameness, lesions and swellings, the presence of separate or continuous plaques of dirt amounting to at least the size of the palm of a hand was recorded for one hindquarter on a randomly chosen side of the body. These data were expressed at the herd level, as percentages of assessed cows with a dirty hindquarter.
Displacements For the observations of displacements, the observer first divided the barn in a number of imaginary segments (number of segments depended on herd size, Welfare Quality, 2009), with a maximum of approximately 25 lactating cows per segment. In each segment, occurrence of displacements was recorded using continuous behavior sampling (Martin and Bateson, 1993). Observations did not start earlier than one hour after morning feeding. Total observation time was 120 min, with a minimum of 10 min per segment. In case the number of segments was below six, segment observations were

Housing and management factors and dairy cattle welfare 89
repeated in the second hour of observation. A displacement was described as an interaction involving physical contact where the actor is butting, hitting, thrusting, striking, or pushing the receiver with a forceful movement, and the receiver gives up its present position with at least half a body length or width (Welfare Quality, 2009). A displacement was recorded only when the actor’s head was inside the segment of observation. Animals present in the segment were counted at the start and the end of each segment observation, and observation time per segment was recorded. Data collected at the segment level was expressed as average frequency of displacements per cow per hour at the herd level, using the expression:
where n = number of segments, s = segment 1, ..., n , DPs = number of displacements in segment s, OTs = observation time (h) in segment s, nstarts = number of animals present at the start of the observation in segment s, nends = number of animals present at the end of the observation in segment s. Housing and management data Measures relating to herd characteristics, housing, feeding, milking, dry cow and young stock, and other management practices (Table 1) were collected using a checklist and an interview with the stockperson. Data analyses To explore associations between welfare indicators, Spearman rank correlations (rs) were calculated. They were preferred over Pearson correlations, because indicators could not be assumed to be normally distributed. Next, separate regression analyses were carried out for each welfare indicator, considering the welfare indicator as response variable and variables described in Table 1 as explanatory variables, with herd as experimental unit. To this end, continuous explanatory variables (e.g. herd size) were converted into class variables. The two tertiles, i.e. the points that divide the ordered observations in three approximately equal groups, were taken as threshold values for the classes (Table 1). All calculations were performed with GenStat (GenStat for Windows 2011). First, univariable analyses were performed to evaluate the association between the response variable and each of the explanatory variables, using generalized linear models (McCullagh & Nelder 1989). A binomial distribution with a logit link function was specified for the prevalence of lameness, lesions or swellings, and dirty hindquarters, whereas a Poisson distribution with a log link function was specified for the average frequency of displacements. In both cases, a multiplicative overdispersion parameter was included in the variance function. Explanatory variables showing an association with the response variable with P-value < 0.20 were included in subsequent multivariable analyses. Second, in the multivariable analyses, explanatory variables were selected by a backward and by a forward stepwise procedure, using adjusted R2 as selection criterion. Explanatory variables that were selected by either of the two stepwise procedures were included in best subset selection, again with adjusted R2 as the selection criterion. Explanatory variables in the best subset, i.e. the subset with the highest adjusted R2,

90 Chapter 6
Figure 1. Prevalence of lameness, lesions or swellings, dirty hindquarter, and frequency of displacements among the selected study herds.
which were significantly (P < 0.05) associated with the response variable were retained in the final model. As a final check on possible confounding, each explanatory variable that was dropped from consideration was added to the final model in turn, to inspect its effect upon the contribution of the other selected variables. Variables that were (partially) confounded were not simultaneously included in the model, but only the variable that made most biological sense was retained. In a final step, two-way interactions were evaluated among the explanatory variables that were retained in the final model. For numerical reasons, both for lameness prevalence and frequency of displacements, the number of explanatory variables retained in the final models of the stepwise procedures proved to be too large for the best subset selection procedures. Therefore, the explanatory variables were put in a random order and split in two groups, which could then be analyzed separately in best subset selection. To avoid an effect of the random splitting on selection of explanatory variables, this procedure was repeated fifteen times. Explanatory variables that were significantly associated with the response variable (P < 0.05) in the thirty models were combined in a final best subset selection, and the same procedure as described above was followed for retaining significantly associated explanatory variables in the final model, and checking upon possible confounding.
Results and discussion
The median within-herd prevalence observed was 32.3% lame cows, 35.9% cows with lesions or swellings, and 38.9% cows with dirty hindquarters. The median number of displacements per cow per hour was 0.43. Prevalences varied largely among herds (Figure 1), which indicated room for improvement. Ranges found in our study were similar to those found in other studies that investigated welfare indicators (e.g. Von Keyserlingk et al., 2012). However, because herds in the present study were

Housing and management factors and dairy cattle welfare 91
Table 2. Overall P-values1 of effects of selected factors for prevalence of lameness (adjusted R2 = 12.7%), and odds ratios with associated P-values for pairwise comparison of factor levels with a reference level (i.e. odds ratio = 1) Factor and level Estimated
prevalence (%) Overall P-value Odds ratio
95% CI of odds ratio
P-value pairwise comparison
Predominant surface of lying area Concrete 42.8 0.00 1 - - Hard mat 36.5 0.76 0.54-1.09 0.14 Soft mat/mattress 33.4 0.66 0.48-0.91 0.01 Deep bedding 26.6 0.48 0.32-0.71 0.00 Access to pasture Zero grazing 39.1 0.01 1 - - Summer pasturing 30.5 0.68 0.51-0.90 0.01 Herd biosecurity status Open 37.8 0.03 1 - - Closed 31.8 0.76 0.60-0.97 0.03 Dry cow groups No 38.1 0.02 1 - - Yes 31.5 0.74 0.57-0.96 0.02
1 Based on a likelihood ratio test, referring to an F- or Chi-square distribution
not selected randomly, the observed prevalence was not representative of the population of Dutch dairy farms as a whole. Besides this, our selection procedure may have increased the variation among herds for the four welfare indicators and, consequently, inflated the degree of association between management and housing factors and welfare indicators. The evaluation of the multiple regression models, however, can be expected to be markedly more accurate for selected herds than for random herds, which was the prevailing argument for selection of herds. No significant associations were found between the four welfare indicators, except between prevalence of lameness and lesions or swellings (rs = 0.37, P < 0.001). Factors associated with lameness Twenty-six explanatory variables were associated (P < 0.20) with prevalence of lameness in the univariable analyses (Appendix). In the multivariable analyses, average stall width was dropped in favor of predominant surface of the lying area, since these were confounded. Odds ratios and associated confidence intervals of the explanatory variables retained in the final model are shown in Table 2. Prevalence of lameness was negatively associated with the use of soft mats or mattresses, or deep bedding as the predominant surface of the lying area, pasturing, a closed herd status, and separating dry cows into a far-off and a close-up group. The negative association between prevalence of lameness and the use of soft mats or mattresses, or deep bedding in stalls and pasturing was consistent with other studies (e.g. Haskell et al., 2006; Hernandez-Mendo et al., 2007; Dippel et al., 2009; Burow et al., 2012; Husfeldt and Endres, 2012; Chapinal et al., 2013). Similar to the positive association between the prevalence of lameness and an open biosecurity status of a herd in our study, Frankena et al. (1991) and Holzhauer et al. (2008) showed a higher risk of lameness and sole ulcers for herds purchasing heifers. A possible explanation might be that a closed herd prevents introduction of lameness-related infectious agents. To our

92 Chapter 6
Table 3. Overall P-values1 of effects of selected factors for prevalence of lesions or swellings (adjusted R2 = 18.0%), and odds ratios with associated P-values for pairwise comparison of factor levels with a reference level (i.e. odds ratio = 1) Factor and level Estimated
prevalence (%) Overall P-value Odds ratio
95% CI of odds ratio
P-value pairwise comparison
Predominant surface of lying area Concrete 58.4 0.00 1 - - Hard mat 59.8 1.07 0.70-1.63 0.77 Soft mat/mattress 46.0 0.58 0.39-0.85 0.01 Deep bedding 41.8 0.48 0.30-0.77 0.00 Access to pasture Zero grazing 61.6 0.00 1 - - Summer pasturing 41.3 0.41 0.27-0.61 0.00 Light intensity2 0.00 Dark 59.2 1 - - Light 43.8 0.50 0.34-0.75 0.00 DIM when maximum amount of concentrates is fed
0.01
< 22 51.2 0.71 0.46-1.08 0.11 22 – 28 59.0 1 - > 28 44.3 0.52 0.32-0.83 0.01 Interaction pasturing and light intensity 0.04 Zero grazing and dark 73.6 1 - - Zero grazing and light 49.6 0.34 0.16-0.69 0.00 Pasturing and dark 44.7 0.27 0.14-0.55 0.00 Pasturing and light 38.0 0.21 0.10-0.40 0.00
1 Based on a likelihood ratio test, referring to an F- or Chi-square distribution 2 ‘Light’ (versus ‘dark’) was described as the observer being able (versus not being able) to read a newspaper in a cubicle around midday
knowledge, no other studies found associations between prevalence of lameness and separation of dry cows in far-off and close-up groups. The negative association between lameness and dry cow groups might indicate a beneficial effect of strategic feeding in these groups. Diet composition around calving, for example, is thought to affect the occurrence of laminitis via lactic acidosis (Nocek, 1997; Donovan et al., 2004). Another explanation for this negative association might be that dry cow groups are more often kept in straw yards instead of free-stalls. A lower occurrence of hoof problems has been found in straw yards compared to free-stalls (Webster, 2002; Somers et al., 2003). On the other hand, Barker et al. (2007) found that keeping dry cows in straw yards was associated with increased lameness. They hypothesized that keeping cows temporarily in straw yards can thin the sole horn, which may lead to sole ulcers when cows are kept on hard floors after calving. Contrary to other studies, we did not find an association between the prevalence of lameness and other housing and management factors, e.g. other aspects of stall design (e.g. Bernardi et al., 2009; Rouha-Mulleder et al., 2009), alley flooring (Barker et al., 2010; Fjeldaas et al., 2011), space allowance (Barker et al., 2007), or claw trimming routines (Barker et al., 2007). Possibly, a lack of association was due to the type of measures considered in our study (e.g. height of the neck rail instead of distance to the rear curb).

Housing and management factors and dairy cattle welfare 93
Table 4. Overall P-values1 of effects of selected factors for prevalence of dirty hindquarters (adjusted R2 = 25.4%), and odds ratios with associated P-values for pairwise comparison of factor levels with a reference level (i.e. odds ratio = 1) Factor and level Estimated
prevalence (%) Overall P-value Odds ratio
95% CI of odds ratio
P-value pairwise comparison
Predominant surface of lying area Concrete 42.3 0.03 0.72 0.44-1.15 0.17 Hard mat 49.3 1 - - Soft mat/mattress 46.3 0.87 0.56-1.34 0.52 Deep bedding 36.8 0.54 0.32-0.92 0.03 Stalls with fecal contamination2 50% 49.9 0.00 1 - - < 50% 37.5 0.55 0.39-0.76 0.00 Head lunge impediments All stalls 62.8 0.00 1 - - Some stalls 38.7 0.31 0.17-0.56 0.00 No stalls 29.6 0.20 0.10-0.43 0.00 Different type of roughage No 55.4 0.01 1 - - Yes, fed mixed 36.0 0.38 0.20-0.74 0.01 Yes, fed separately 39.6 0.43 0.21-0.88 0.02 Interaction head lunge impediments and different types of roughage
All stalls and one type 88.2 0.00 1 - - All stalls and mixed 36.7 0.07 0.02-0.33 0.00 All stalls and separate 63.6 0.22 0.05-1.04 0.06 Some stalls and one type 48.4 0.12 0.03-0.52 0.06 Some stalls and mixed 36.7 0.07 0.02-0.30 0.00 Some stalls and separate 30.8 0.05 0.01-0.23 0.00 No stalls and one type 29.6 0.05 0.01-0.30 0.00 No stalls and mixed 34.5 0.06 0.01-0.30 0.00 No stalls and separate 24.6 0.04 0.01-0.21 0.00
1 Based on a likelihood ratio test, referring to an F- or Chi-square distribution 2 ‘Fecal contamination’ of a stall was described as cow droppings or >20% manure cover in the rear 1/3 part of the lying area
Factors associated with lesions or swellings Twenty explanatory variables were associated (P < 0.20) with the prevalence of lesions or swellings in the univariable analyses (Appendix). In the multivariable analyses, frequency of footbaths was positively associated with the prevalence of lesions or swellings. Strength of this association changed when prevalence of lameness was introduced to the model. Because the use of footbaths was probably practiced because of poor claw health rather than a cause of lesions and swellings, it was dropped from the model. Odds ratios and associated confidence intervals of the explanatory variables retained in the final model are shown in Table 3. Prevalence of lesions or swellings was negatively associated with the use of soft mats or mattresses, or deep bedding as the predominant surface of the lying area, pasturing, light, and a higher number of days in milk when the maximum amount of concentrates is fed. In particular, the combination of zero grazing and little light intensity was positively associated with prevalence of lesions or swellings.

94 Chapter 6
Table 5. Overall P-values1 of effects of selected factors for average frequency of displacements (DP) per cow per hour (adjusted R2 = 19.8%), and relative risks with associated P-values for pairwise comparison of factor levels with a reference level (i.e. relative risk = 1) Factor and level Estimated
frequency (DP/cow/hour)
Overall P-value Relative risk
95% CI of
relative risk P-value pairwise
comparison Time of introducing heifers in lactating group
Before calving 0.29 0.02 0.76 0.61-0.95 0.02 After calving 0.38 1 - -
Cow brushes No brushes 0.26 0.01 0.63 0.47-0.85 0.00 Fixed 0.34 0.84 0.64-1.09 0.19 Rotating 0.40 1 - -
Continuous availability2 of roughage No 0.25 0.00 0.62 0.43-0.88 0.01 Yes 0.41 1 - -
Floor scraping frequency (times/day) < 3 0.41 0.00 1 - - 3 – 5 0.22 0.54 0.37-0.78 0.00 > 5 0.37 0.90 0.70-1.16 0.42
Herd size < 61 0.37 0.00 1 - - 61 – 79 0.39 1.07 0.83-1.38 0.62 > 79 0.23 0.62 0.46-0.84 0.00
Proportion cows to stalls < 0.91 0.34 0.01 0.87 0.67-1.14 0.32 0.91 – 1.04 0.26 0.65 0.49-0.87 0.00 > 1.04 0.39 1 - - 1 Based on a likelihood ratio test, referring to an F- or Chi-square distribution 2 ‘Continuous availability’ was described as at least 180 L (1 wheelbarrow) roughage per 25 cows anytime during the farm visit The negative association between the prevalence of lesions or swellings and the use of soft mats or mattresses, or deep bedding in stalls and pasturing was consistent with results of other studies (e.g. Weary and Taszkun, 2000; Haskell et al., 2006; Fulwider et al., 2007; Lombard et al., 2010; Husfeldt and Endres, 2012; Burow et al., 2013; Brenninkmeyer et al., in press). To our knowledge, there are no other studies that found associations between prevalence of lesions or swellings and light intensity in the barn, or days in milk when the maximum amount of concentrates is fed. We hypothesize that light intensity reflects a number of superior underlying or associated housing and management practices, because herds with a light barn more often had, e.g., higher feeding racks, wider alleys, and longer, cleaner stalls with a higher neck rail and no head lunge impediments (P < 0.01). This could also explain the interaction between pasturing and light intensity; effects of superior housing and management practices become more important when cows are indoors year-round. Prevalence of lesions or swellings was lower in herds where cows were at least 28 days in milk when the maximum amount of concentrates was fed. High intake of concentrates, and fewer and shorter bouts of intake, have been shown to result in laminitis and clinical signs of lameness (Manson and Leaver, 1988; Bergsten, 1994). This might partially explain the effect of feeding concentrates on lesions and swellings, because the prevalence of lesions or swellings and the prevalence of lameness were associated. Odds ratios for the association between concentrate feeding and lesions or swellings dropped about 10% when lameness prevalence was introduced in the model. We did not find associations between lesions or swellings and

Housing and management factors and dairy cattle welfare 95
other housing and management factors, contrary to other studies that found associations with, e.g., aspects of stall design (e.g. Brenninkmeyer et al., in press), feed space (Rutherford et al., 2008), or breed (Burow et al., 2013). Other studies, however, mostly investigated lesions and swellings on the hock, whereas we considered lesions and swellings on the whole body. Factors associated with dirty hindquarters Fourteen explanatory variables were associated (P < 0.20) with the prevalence of dirty hindquarters in the univariable analyses (Appendix). The multivariable analyses showed that temporal fixing of cows after milking was positively associated with the prevalence of dirty hindquarters, but also collinear with the use of deep bedding in stalls (P = 0.004). Because temporal fixing of cows was probably practiced for reasons of udder health rather than a cause of dirty hindquarters, it was dropped from the model. Odds ratios and associated confidence intervals of the explanatory variables retained in the final model are shown in Table 4. Prevalence of dirty hindquarters was negatively associated with concrete, soft mats or mattress, or deep bedding as the predominant surface of the lying area, fewer stalls with fecal contamination, fewer stalls with head lunge impediments (e.g. a wall or bars), and feeding different types of roughage. In particular, the combination of stalls having head lunge impediments and feeding a single type of roughage was positively associated with prevalence of dirty hindquarters. To our knowledge, no other studies investigated factors associated with cleanliness of the hindquarter, but similar associations have been found for deep bedding in stalls, stall cleanliness, and udder cleanliness (Fregonesi et al., 2009; Plesch and Knierim, 2012). The positive association between the prevalence of dirty hindquarters and head lunge impediments in the stall is difficult to explain because more restricted stalls have often been associated with cleaner cows (e.g. Fregonesi et al., 2009; Plesch and Knierim, 2012). The association between dirty hindquarters and feeding one type of roughage was due to manure plaques found on both sides of the tail, probably caused by diarrhea. Hence, feeding a single type of roughage is likely accompanied by digestive problems. Manure plaques on both sides of the tail were most observed in herds that fed one type of roughage, compared to herds feeding different types of roughage mixed and separately (5.6%, 1.6% and 0%; P < 0.001). Contrary to other studies, we did not find an association between dirty hindquarters and other housing and management factors, e.g. neck rail height or stall bed length (e.g. Bernardi et al., 2009; Fregonesi et al., 2009; Plesch and Knierim, 2012). Factors associated with frequency of displacements Twenty-three explanatory variables were associated (P < 0.20) with the average frequency of displacements in the univariable analyses (Appendix). In the multivariable analyses, routine herd claw trimming was negatively associated with the frequency of displacements, but was also collinear with floor scraping frequency and the use of cow brushes (P < 0.001). Because no direct causal relation could be assumed with frequency of displacements, herd claw trimming was dropped from the model. Relative risks and associated confidence intervals of the explanatory variables retained in the final model are shown in Table 5. Average frequency of displacements was negatively associated with introducing heifers in the lactating group before calving, not using cow brushes, not having a continuous availability of roughage, a floor scraping frequency of 3 to 5 times per day, a herd size > 79 cows, and a proportion cows to stalls between 0.91 and 1.04.

96 Chapter 6
Three of the six factors associated with the frequency of displacements were likely to be related to competition around resources with limited access, such as feed, cow brushes, and stalls. Average frequency of displacements was lower in herds that introduced heifers in the lactating group before calving, compared to introduction after calving. Introduction of new animals in a group is known to increase displacements due to re-establishment of social relationships (Kondo and Hurnik, 1990; Bøe and Færevik, 2003), and can lead to a decrease in dry matter intake of regrouped cows by 10% (Schirmann et al., 2011). Fewer displacements might have been observed due to pregnant heifers being less motivated to compete for feed, because they require less energy prepartum compared to postpartum. Besides this, frequency of displacements increased with continuous availability of feed at the feed bunk. The number of displacements has been shown to increase over 3.5 times when feeding non-uniform feed (Huzzey et al., 2013). A higher frequency of displacements, therefore, might be explained by a larger variation in quality of the feed after the feed was selected by cows during morning feeding. The frequency of displacements was lower among herds with no cow brushes, which might indicate that cows are motivated for using brushes. Possibly, the ratio brushes to cows was too small. Similar to the results of Fregonesi and Leaver (2002), frequency of displacements was lower in herds with 0.9 to 1.04 cows per stall compared to herds with more than 1.04 cows per stall. This can be due competition for stalls (Fregonesi et al., 2007) or to cows spending more time in alleys instead of stalls (Wierenga and Hopster, 1990), which increases the chance of encountering a conspecific. A frequency of 3-5 floor scraping events per day was associated with fewer displacements, compared with < 3 floor scraping events. This was contrary to our expectation because a higher floor scraping frequency usually results in dryer concrete floors, which enable cows to show a higher walking speed, less slipping, and longer strides compared to cows walking on slurry-covered concrete (Phillips and Morris, 2000; Rushen and de Passille, 2006). Therefore, with a higher floor scraping frequency, it was expected that cows feel more secure to start agonistic interactions, such as displacements. Possibly, this effect is only found when the floor scraping frequency is > 5 (Table 5). Contrary to Telezhenko et al. (2012), we found an association between herd size and displacements. The negative association between herd size and displacements might imply that a cow can use relatively more space in a larger herd than in a smaller herd (given an equal amount of space per animal), because more space is shared (described for broilers in Bokkers et al (2011)). This relative additional space in large herds might be used by cows to avoid conflicts with conspecifics. Contrary to other studies, we did not find an association between frequency of displacements and other factors, e.g. feed space per cow (DeVries et al., 2004; Huzzey et al., 2006). Possibly, this was due to that fact that occurrence of displacements were recorded at a specific time of the day in our study (i.e. at least one hour after feeding). Factors associated with multiple welfare indicators Housing and management factors identified in our study were partly the same for prevalences of lameness, lesions or swellings, and dirty hindquarters. The two welfare indicators that were most correlated - prevalence of lameness and lesions or swellings – had two explanatory factors in common. Results of this study suggest that changing the surface of the lying area and pasturing can help decrease the prevalence of welfare problems for multiple welfare indicators. However, associations of these factors with other indicators of dairy cattle welfare, e.g. prevalence of mastitis, should be investigated.

Housing and management factors and dairy cattle welfare 97
Housing and management factors did not show conflicting effects for different welfare indicators. Conflicts were expected due to associations found in other studies. For example, introducing heifers to the lactating group before calving was associated with a lower frequency of displacement in our study, but has been associated with increased lameness in a study by Barker et al. (2007). No common housing and management factors were found for frequency of displacements and other welfare indicators. This might be partly due to absence of a biological relation between the average frequency of displacements and other indicators, which was supported by our finding that they were not correlated. Nevertheless, significant associations between being displaced and increased lameness have been found at the animal level (e.g. Galindo et al., 2000), and it has been suggested that these low-ranking cows spent more time walking and standing. Results of our study suggested that lameness, lesions or swellings, and dirty hindquarters were more influenced by the quality (e.g. softness, space, and cleanliness) of lying and walking surfaces, whereas frequency of displacements was mainly influenced by competition around limited resources.
Conclusions Fifteen housing and management factors were associated with four indicators of dairy cattle welfare. Two of these factors, surface of the lying area and access to pasture, were commonly associated with prevalence of lameness, lesions or swellings, or dirty hindquarters. No common housing and management factors were identified for frequency of displacements and other welfare indicators. Lameness, lesions or swellings, and dirty hindquarters were more often associated with factors relating to the quality of lying and walking surfaces, whereas frequency of displacements was more often associated with factors relating to limited resources.
References Barker, Z. E., J. R. Amory, J. L. Wright, R. W. Blowey, and L. E. Green. 2007. Management factors associated with impaired
locomotion in dairy cows in England and Wales. J. Dairy Sci. 90: 3270-3277. Barker, Z. E., K. A. Leach, H. R. Whay, N. J. Bell, and D. C. J. Main. 2010. Assessment of lameness prevalence and associated risk
factors in dairy herds in England and Wales. J. Dairy Sci. 93: 932-941. Bergsten, C. 1994. Haemorrhages of the sole horn of dairy cows as a retrospective indicator of laminitis: an epidemiological
study. Acta Vet Scand 35: 55-66. Bernardi, F., J. Fregonesi, C. Winckler, D. M. Veira, M. A. G. von Keyserlingk, and D. M. Weary. 2009. The stall-design paradox:
Neck rails increase lameness but improve udder and stall hygiene. J. Dairy Sci. 92: 3074-3080. Bøe, K. E. and G. Færevik. 2003. Grouping and social preferences in calves, heifers and cows. Appl. Anim. Behav. Sci. 80: 175-190. Bokkers, E. A. M., I. J. M. De Boer, and P. Koene. 2011. Space needs of broilers. Anim. Welf. 20: 623-632. Brenninkmeyer, C., S. Dippel, J. Brinkmann, S. March, C. Winckler, and U. Knierim. in press. Hock lesion epidemiology in cubicle
housed dairy cows across two breeds, farming systems and countries. Prev Vet Med. Burow, E., T. Rousing, P. T. Thomsen, N. D. Otten, and J. T. Sorensen. 2012. Effect of grazing on the cow welfare of dairy herds
evaluated by a multidimensional welfare index. Animal 17: 1-9. Burow, E., P. T. Thomsen, T. Rousing, and J. T. Sorensen. 2013. Daily grazing time as a risk factor for alterations at the hock joint
integument in dairy cows. Animal 7: 160-166. Chapinal, N., A. K. Barrientos, M. A. G. von Keyserlingk, E. Galo, and D. M. Weary. 2013. Herd-level risk factors for lameness in
freestall farms in the northeastern United States and California. J. Dairy Sci. 96: 318-328. De Vries, M., E. A. M. Bokkers, T. Dijkstra, G. van Schaik, and I. J. M. de Boer. 2011. Invited review: Associations between variables
of routine herd data and dairy cattle welfare indicators. J. Dairy Sci. 94: 3213-3228.

98 Chapter 6
DeVries, T. J., M. A. G. von Keyserlingk, and D. M. Weary. 2004. Effect of Feeding Space on the Inter-Cow Distance, Aggression, and Feeding Behavior of Free-Stall Housed Lactating Dairy Cows. J. Dairy Sci. 87: 1432-1438.
Dippel, S., M. Dolezal, C. Brenninkmeyer, J. Brinkmann, S. March, U. Knierim, and C. Winckler. 2009. Risk factors for lameness in freestall-housed dairy cows across two breeds, farming systems, and countries. J. Dairy Sci. 92: 5476-5486.
Donovan, G. A., C. A. Risco, G. M. DeChant Temple, T. Q. Tran, and H. H. van Horn. 2004. Influence of Transition Diets on Occurrence of Subclinical Laminitis in Holstein Dairy Cows. J. Dairy Sci. 87: 73-84.
Fjeldaas, T., A. M. Sogstad, and O. Osteras. 2011. Locomotion and claw disorders in Norwegian dairy cows housed in freestalls with slatted concrete, solid concrete, or solid rubber flooring in the alleys. J. Dairy Sci. 94: 1243-1255.
Fourichon, C., F. Beaudeau, N. Bareille, and H. Seegers. 2001. Incidence of health disorders in dairy farming systems in western France. Livest. Prod. Sci. 68: 157-170.
Frankena, K., E. N. Stassen, J. Noordhuizen, J. O. Goelema, J. Schipper, H. Smelt, and H. Romkema. 1991. Prevalence of lameness and risk indicators of dermatitis digitalis during pasturing and housing of dairy cattle. Proc. Annual Symposium Society for Veterinary Epidemiology and Preventive Medicine, London: 107-118.
Fraser, D. 1995. Science, Values and Animal Welfare: Exploring the 'Inextricable Connection'. Anim. Welf. 4: 103-117. Fregonesi, J. A. and J. D. Leaver. 2002. Influence of space allowance and milk yield level on behaviour, performance and health of
dairy cows housed in strawyard and cubicle systems. Livest. Prod. Sci. 78: 245-257. Fregonesi, J. A., C. B. Tucker, and D. M. Weary. 2007. Overstocking Reduces Lying Time in Dairy Cows. J. Dairy Sci. 90: 3349-3354. Fregonesi, J. A., M. A. G. von Keyserlingk, C. B. Tucker, D. M. Veira, and D. M. Weary. 2009. Neck-rail position in the free stall
affects standing behavior and udder and stall cleanliness. J. Dairy Sci. 92: 1979-1985. Fulwider, W. K., T. Grandin, D. J. Garrick, T. E. Engle, W. D. Lamm, N. L. Dalsted, and B. E. Rollin. 2007. Influence of Free-Stall Base
on Tarsal Joint Lesions and Hygiene in Dairy Cows. J. Dairy Sci. 90: 3559-3566. Galindo, F., D. M. Broom, and P. G. G. Jackson. 2000. A note on possible link between behaviour and the occurrence of lameness
in dairy cows. Appl. Anim. Behav. Sci. 67: 335-341. Haskell, M. J., L. J. Rennie, V. A. Bowell, M. J. Bell, and A. B. Lawrence. 2006. Housing system, milk production, and zero-grazing
effects on lameness and leg injury in dairy cows. J. Dairy Sci. 89: 4259-4266. Hernandez-Mendo, O., M. A. G. von Keyserlingk, D. M. Veira, and D. M. Weary. 2007. Effects of pasture on lameness in dairy
cows. J. Dairy Sci. 90: 1209-1214. Holzhauer, M., C. Hardenberg, and C. J. Bartels. 2008. Herd and cow-level prevalence of sole ulcers in The Netherlands and
associated-risk factors. Prev. Vet. Med. 85: 125-135. Husfeldt, A. W. and M. I. Endres. 2012. Association between stall surface and some animal welfare measurements in freestall
dairy herds using recycled manure solids for bedding. J. Dairy Sci. 95: 5626-5634. Huzzey, J. M., T. J. DeVries, P. Valois, and M. A. G. von Keyserlingk. 2006. Stocking Density and Feed Barrier Design Affect the
Feeding and Social Behavior of Dairy Cattle. J. Dairy Sci. 89: 126-133. Huzzey, J. M., J. A. Fregonesi, M. A. G. von Keyserlingk, and D. M. Weary. 2013. Sampling behavior of dairy cattle: Effects of
variation in dietary energy density on behavior at the feed bunk. J. Dairy Sci. 96: 247-256. Kondo, S. and J. F. Hurnik. 1990. Stabilization of social hierarchy in dairy cows. Appl. Anim. Behav. Sci. 27: 287-297. Lombard, J. E., C. B. Tucker, M. A. G. von Keyserlingk, C. A. Kopral, and D. M. Weary. 2010. Associations between cow hygiene,
hock injuries, and free stall usage on US dairy farms. J. Dairy Sci. 93: 4668-4676. Manson, F. J. and J. D. Leaver. 1988. The influence of concentrate amount on locomotion and clinical lameness in dairy cattle.
Animal Science 47: 185-190. Martin, P. and P. Bateson. 1993. Measuring Behaviour - An introductory guide. Cambridge University Press, Cambridge, UK. Nocek, J. E. 1997. Bovine Acidosis: Implications on Laminitis. J. Dairy Sci. 80: 1005-1028. Phillips, C. J. C. and I. D. Morris. 2000. The locomotion of dairy cows on concrete floors that are dry, wet, or covered with a slurry
of excreta. J. Dairy Sci. 83: 1767-1772. Plesch, G. and U. Knierim. 2012. Effects of housing and management conditions on teat cleanliness of dairy cows in cubicle
systems taking into account body dimensions of the cows. Animal 6: 1360-1368. Potterton, S. L., M. J. Green, J. Harris, K. M. Millar, H. R. Whay, and J. N. Huxley. 2011. Risk factors associated with hair loss,
ulceration, and swelling at the hock in freestall-housed UK dairy herds. J. Dairy Sci. 94: 2952-2963. Rouha-Mulleder, C., C. Iben, E. Wagner, G. Laaha, J. Troxler, and S. Waiblinger. 2009. Relative importance of factors influencing
the prevalence of lameness in Austrian cubicle loose-housed dairy cows. Prev. Vet. Med. 92: 123-133. Rushen, J. and A. M. de Passille. 2006. Effects of roughness and compressibility of flooring on cow locomotion. J. Dairy Sci. 89:
2965-2972.

Housing and management factors and dairy cattle welfare 99
Rutherford, K. M. D., F. M. Langford, M. C. Jack, L. Sherwood, A. B. Lawrence, and M. J. Haskell. 2008. Hock injury prevalence and associated risk factors on organic and nonorganic dairy farms in the United Kingdom. J. Dairy Sci. 91: 2265-2274.
Schirmann, K., N. Chapinal, D. M. Weary, W. Heuwieser, and M. A. G. von Keyserlingk. 2011. Short-term effects of regrouping on behavior of prepartum dairy cows. J. Dairy Sci. 94: 2312-2319.
Somers, J. G. C. J., K. Frankena, E. N. Noordhuizen-Stassen, and J. H. M. Metz. 2003. Prevalence of claw disorders in Dutch dairy cows exposed to several floor systems. J. Dairy Sci. 86: 2082-2093.
Telezhenko, E., M. A. G. von Keyserlingk, A. Talebi, and D. M. Weary. 2012. Effect of pen size, group size, and stocking density on activity in freestall-housed dairy cows. J. Dairy Sci. 95: 3064-3069.
Von Keyserlingk, M. A. G., A. Barrientos, K. Ito, E. Galo, and D. M. Weary. 2012. Benchmarking cow comfort on North American freestall dairies: Lameness, leg injuries, lying time, facility design, and management for high-producing Holstein dairy cows. J. Dairy Sci. 95: 7399-7408.
Weary, D. M. and I. Taszkun. 2000. Hock lesions and free-stall design. J. Dairy Sci. 83: 697-702. Webster, A. J. F. 2002. Effects of housing practices on the development of foot lesions in dairy heifers in early lactation. Vet. Rec.
151: 9-12. Webster, A. J. F. 2005. Animal Welfare: Limping towards Eden. Blackwell Publishing Ltd., Oxford, UK. Welfare Quality. 2009. Welfare Quality® Assessment Protocol for Cattle. Welfare Quality® Consortium, Lelystad, Netherlands. Wierenga, H. K. and H. Hopster. 1990. The significance of cubicles for the behaviour of dairy cows. Appl. Anim. Behav. Sci. 26:
309-337. Winckler, C. and S. Willen. 2001. The reliability and repeatability of a lameness scoring system for use as an indicator of welfare in
dairy cattle. Acta Agric. Scand. A Anim. Sci. 51: 103-107.

100 Chapter 6
Appendix. Results1 of one-way analyses of single potential risk factors for the prevalence of lameness, lesions or swellings, cow with dirty hindquarter, and frequency of displacements
Potential risk factor % lame cows % cows with
lesions/swellings% cows with dirty
flank Freq. of
displacements General herd characteristics
Herd size * * *** Breed *
Housing Air inlet side walls ** *** * Air inlet roof top *** * Light intensity ** *** ** Brushes * * Average width of alleys *** Average width of passages ** Alleys with dead ends **** Type of flooring system Slippery floor **** Floor scraping frequency * * *** Rims or pit in the floor **** *
Stalls Proportion cows to stalls *** Predominant surface of lying area **** **** * Stall divisions ** * ** Average stall width *** *** Average stall length * ** *** Average height of stall neck rail **** Head lunge impediments **** * Bedding height *** Stalls with fecal contamination **** Cleaning frequency ** * Littering frequency *** **
Feeding Average feed space per cow * Average feeding rack height *** * ** * Roughage fed at fixed times of the day * Different types of roughage ** **** Continuous availability of roughage ** Roughage contaminated with manure and/or moulds, or heat coming out
** *
Concentrate dispensers in the stable **** *** Maximum amount of concentrates **** DIM when max. amount of concentrates is fed ** Group drinkers * Sufficient number and/or length of drinkers ***
Milking practices Automatic milking Lactation groups ** * Maximum waiting time for milking Temporary fixing of cows after milking ** ***

Housing and management factors and dairy cattle welfare 101
Appendix. (continued)
Potential risk factor % lame cows % cows with
lesions/swellings% cows with dirty
flank Freq. of
displacements Dry cows and young stock
Dry cow groups (far-off and close-up) *** Length of transition period Predominant place of calving ** Heifer housing ** Time of introducing heifers in lactating group *** Way of introducing heifers in lactating group
Other management practices Routine herd claw trimming * * * Individual cow claw trimming between herd trimming events
***
Who trims claws * Frequency of footbaths *** **** *** Pasturing *** **** * * Winter OLA for dry cows and/or young stock * Cows in heat are fixed or separated Herd biosecurity status ***
1 P-value of F-test. Significance of association indicated by * (0.10 < P < 0.20) , ** (0.05 < P < 0.10), *** (0.01 < P < 0.05), **** (P < 0.01)

102 Chapter 6


104 Chapter 7
Introduction Assuring a certain level of welfare for dairy cattle requires regular assessment of the level of welfare on dairy farms. Results should be communicated to farmers, as well as advice about housing and management interventions to improve welfare. The cyclical process of welfare assessment, feedback and advice to the farmer, and intervention in management and resources is the basis of a welfare assurance scheme (described in detail in Chapter 1). There are some issues, however, that may hamper implementation of welfare assurance schemes and, as a consequence, improvement of dairy cattle welfare. First, on-farm assessment of animal welfare is time-consuming and, therefore, expensive. Second, interventions in housing and management may be conflicting for different indicators of dairy cattle welfare. In this thesis, we explored two strategies to improve time efficiency of assessing dairy cattle welfare (Chapter 2, 3, and 5), and we evaluated associations of housing and management factors with indicators of dairy cattle welfare (Chapter 6). Furthermore, we evaluated the Welfare Quality multicriteria evaluation (WQ-ME) model for classification of dairy cattle welfare (Chapter 4), because of its potential role for decision-making in welfare assurance schemes. In the current chapter, the relevance of the results of this thesis for efficient assessment and improvement of dairy cattle welfare is discussed. The potential reduction in the number of on-farm assessments is shown for each welfare indicator of the Welfare Quality protocol for dairy cattle. The essence of an overall welfare score of herds for identifying herds with poor welfare is explained, as well as a potential reason why WQ-ME classification was strongly influenced by a limited number of welfare indicators. Furthermore, effectiveness of welfare assurance schemes for improvement of dairy cattle welfare is discussed, using empirical evidence from other studies. This chapter finishes with conclusions and recommendations regarding the general aim of this thesis: to contribute to assurance of dairy cattle welfare by evaluating strategies to improve time efficiency of welfare assessment and by identifying housing and management interventions for welfare improvement. For all studies in this thesis, we used the Welfare Quality protocol for cattle (Welfare Quality, 2009) as a golden standard for assessing dairy cattle welfare. This is the most recent protocol for on-farm assessment of dairy cattle, and includes a large proportion of animal-based indicators, which are considered to possess a higher validity for animal welfare than resource-based indicators (Webster et al., 2004). Because the objective of Welfare Quality was to develop a protocol built on evidence-based indicators, we did not evaluate the reliability (the extent to which the same results are obtained among observers, within observers, and over time (Knierim and Winckler, 2009)) of the indicators in this study. This does not necessarily imply, however, that reliability of all indicators is high. Bokkers et al. (2012), for example, reported low reliability of the Qualitative Behavior Assessment, and Winckler et al (2007) showed low reliability of frequencies of agonistic behavior over time. Low reliability may have resulted in a weaker association of welfare indicators with routine herd data (Chapter 3), with other welfare indicators in the Welfare Quality protocol (Chapter 5), and with housing and management factors (Chapter 6). This potential bias is discussed in more detail in Chapter 5. Herd data presented in this thesis is not representative for the Dutch dairy population because herds were not selected randomly. Because the selection increased variation in welfare among herds in our study, this may have resulted in a stronger association of welfare indicators with routine herd data (RHD; Chapter 3), other welfare indicators (Chapter 5), and housing and management factors (Chapter

General discussion 105
6). Absolute strengths of associations may, therefore, be different for the general population of dairy herds. However, the direction of the associations and the order of importance is expected to be representative for the general population. The extent to which the results can be extrapolated to herds in other countries may vary depending on, e.g., similarity of housing (e.g. design of stalls or flooring) or management (e.g. feeding or pasturing) practices. With regard to the evaluation of the WQ-ME model in Chapter 4, we expect that the conclusions of this chapter are relevant for herds in similar housing and management in other countries as well, as herds in our study spanned a wide range of animal welfare. Efficient assessment of dairy cattle welfare The time required for on-farm welfare assessment of dairy herds in a population can be reduced in two ways. The first way is to reduce the number of on-farm assessments, either by assessing fewer herds in a population or making fewer assessments per herd over time. In this thesis, we evaluated a strategy for reducing the number of on-farm assessments in a population, based on routine herd data available in national databases (Chapter 2 and 3). The second way is to reduce the time needed per on-farm assessment. The approach followed in this thesis was to replace indicators of an on-farm assessment protocol by predictions based on remaining welfare indicators (Chapter 5). Obviously, a combination of reducing the number of on-farm assessments as well as on-farm assessment time would result in the largest reduction of on-farm assessment time for a population of dairy herds. Reducing the number of on-farm assessments In many developed countries, RHD are regularly collected from dairy farms, relating to, for example, demography, milk quality, productivity, and fertility. The results of the literature review in Chapter 2 showed that individual variables of RHD have been associated with a large number of dairy cattle welfare indicators in other studies. Therefore, it was hypothesized that a combination of these variables of RHD could provide a continuous, easy, and inexpensive opportunity to estimate the level of animal welfare on farms. Results of the observational study in 196 selected Dutch dairy herds in Chapter 3 showed that herd-level estimates for welfare indicators in the Welfare Quality protocol based on RHD were less to highly accurate. RHD were considered little suitable for attributing a binding welfare status to dairy herds, because a large proportion of herds was incorrectly identified as a herd with poor welfare. Nonetheless, RHD appeared useful as a pre-screening test for identification of herds with potentially poor welfare, in order to reduce the number of on-farm assessments compared to random farm visits. Because this pre-screening test also yields false-positive herds, the true welfare level of herds needs to be validated in an on-farm assessment. Application of RHD as a pre-screening test Application of RHD as a pre-screening test for identification of herds with poor welfare adds an extra cycle to the basic cyclical process of assessment, feedback and advice to farmers, and intervention in the basic welfare assurance scheme (Figure 1). In this extended cyclical process, herds are regularly pre-screened for the level of animal welfare based on RHD (circle on the left-hand side of Figure 1). The frequency of screening depends on the sampling frequency of RHD at the farm, which may differ between variables of RHD. In our study herds, sampling frequency varied from continuous to

106 Chapter 7
Figure 1. Extended cyclical process of welfare assurance scheme for assessment of dairy cattle welfare approximately every four weeks. Welfare of herds that test positive (i.e. poor welfare) in the pre-screening should be validated in an on-farm assessment (circle on the right-hand side of Figure 1). Based on this assessment, only true-positive1 herds may be retained in the cycle to communicate results with the farmer, as well as advice about interventions in dairy housing and management that potentially lead to welfare improvement. The pre-screening test could be adjusted to avoid repeated unnecessary visits to false-positive2 herds by, e.g., lowering the frequency of on-farm welfare assessments in these herds. The level of welfare in a dairy herds can fluctuate over time, due to, e.g., seasonal variation in feed quality, temporary manifestation of disease, or access to pasture during some part of the year. Because RHD are regularly collected from farms, they provide a dynamic pre-screening system for dairy cattle welfare that may be able to signal fluctuations in the level of welfare of herds over time. Time gain due to the use of the pre-screening test According to the information given in the Welfare Quality protocol for cattle (Welfare Quality, 2009), on-farm assessment time is approximately six hours for a herd of about 80 lactating cows (average size of a Dutch dairy herd (LEI, 2008)). This is practically equal to one assessment per day. The number of on-farm assessments that are needed for identification of herds with poor welfare using the pre-screening test developed in Chapter 3, can be compared to a situation in which herds are visited with no prior information (i.e. random farm visits). The amount of reduction in the number of on-farm assessments depends on the performance of the pre-screening test and the prevalence of herds with poor welfare in a population, which are different for each welfare indicator (Table 1). A better performance of the prescreening test and a lower prevalence of herds with poor welfare are
1 True-positive: a herd correctly identified as having poor welfare 2 False-positive: a herd incorrectly identified as having poor welfare

General discussion 107
Figure 2. Welfare assurance scheme for the prevalence of severe lameness (with herd with poor welfare defined as having more than 12% severely lame cows, for a population of 18 000 herds with 20.2% (weighted percentage5) herds with poor welfare, and a pre-screening test with 97.5% sensitivity and 23.5% specificity (Chapter 3)). accompanied by a larger relative reduction in the number of on-farm assessments. The performance of the pre-screening test can be described by its sensitivity3 and specificity4. The relative reduction in the number of on-farm assessments based on a pre-screening test can be calculated as follows:
, where = percentage of reduction in the number of on-farm assessments compared to random farm visits given a prevalence of herds with poor welfare prev, and a sensitivity of the pre-screening test of 97.5% Se, and the specificity of the pre-screening test given a sensitivity Se. The implications of this formula for the absolute reduction in on-farm welfare assessments are illustrated using prevalence of severe lameness in 18 000 commercial dairy herds in the Netherlands as an example. For the purpose of this example, we estimate that 20.2%5 of these herds have poor welfare (i.e. more than 12% severely lame cows). Without a pre-screening test, all 18 000 herds have to be visited to detect these 3 636 herds with poor welfare. With a pre- screening test (with 97.5% sensitivity and 23.5% specificity (Chapter 3)), 14 534 herds are visited to detect 97.5% of herds with poor welfare (3 545 herds; Figure 2).
3 Sensitivity: the proportion of herds correctly identified as having poor welfare 4 Specificity: the proportion of herds correctly identified as having ‘good’ welfare 5 Study herds were selected based on a composite health score (see details in Chapter 3). The percentage presented is a weighted average of the proportion of herds with >12% severely lame cows selected from the 5% worst (weight = 0.05) and 95% best (weight = 0.95) composite health scores.

108 Chapter 7
Table 1. Relative reduction in the number of on-farm assessments needed for identification of herds with a welfare problem1,2 using routine herd data as a pre-screening test, compared to random farm visits (given a weighted percentage3 of herds with a welfare problem, and a pre-screening test with a sensitivity of 97.5%)
Principle Indicator Herds with a welfare problem
(weighted %)3
SpSe=97.5%
(%) % reduction in
on-farm assessments
Good Very lean cows (%) 20.2 39.3 31.9 feeding Number (length) of drinkers 15.1 14.4 12.6 Cows have access to 2 drinkers 3.6 80.7 77.9 Good Time to lie down (s) 40.6 7.9 5.7 housing Cows colliding with stall components (%) 44.7 0.0 1.7 Cows lying outside lying area (%) 9.3 29.8 27.3 Cow with dirty hind legs 76.4 22.0 7.1 Cow with dirty udder 31.2 9.8 7.5 Cow with dirty hindquarter 70.6 6.0 3.5 Good Moderately lame cows (%) 21.2 21.7 17.6 health Severely lame cows (%) 20.2 23.5 19.3 Cows with: - hairless patches (%) 26.6 23.6 18.0 - lesions or swellings (%) 26.6 14.1 11.0 - nasal discharge (%) 13.6 29.3 25.7 - diarrhea (%) 31.0 20.3 14.8 - vulvar discharge (%) 7.8 21.7 6.6 - dystocia (%) 41.1 5.8 4.4 Dehorned young stock (%) 98.4 30.8 3.0 Appropriate Average freq. of head butts 24.8 23.4 18.2 behavior Average freq. of displacements 24.8 14.0 11.1 Avoidance distance index 19.4 5.1 4.6 Qualitative behavior index 19.5 9.8 8.4
1 Thresholds values for a welfare problem were partly based on values given in the Welfare Quality assessment protocol for dairy cattle, and partly based on 25% worst scoring herds in our study (thresholds values can be found in Chapter 3) 2 Concerns only indicators showing a welfare problem in at least 5% of the herds in our study 3 Because our study herds were selected based on a composite health score (see details in Chapter 3), observed percentages of herds with a welfare problem are not representative for the Dutch population. The percentage presented in this table is a weighted average of the percentage of herds with a welfare problem selected from the 5% worst (weight = 0.05) and 95% best (weight = 0.95) composite health scores.
A larger relative reduction in the number of on-farm assessments can be realized when a lower detection probability of the herds with poor welfare (i.e. a lower sensitivity) is acceptable. This may be relevant when costs of assessments are an impediment. The optimal sensitivity for detection of herds with more than 12% severely lame cows was 70.5%, which resulted in a considerable reduction in the proportion of false-positive herds (see Figure 2 in Chapter 3). With this pre-screening test (with 70.5% sensitivity and 72.0% specificity (Chapter 3)), 6 585 herds should be visited to detect 70.5% of the herds with poor welfare (i.e. 2 563 herds). In this situation, the relative reduction in the number of on-farm assessments is 63.4%, compared to random farm visits. Table 1 shows the relative reduction in the number of on-farm assessments for each welfare indicator in the Welfare Quality protocol for dairy cattle. On average, the percentage of on-farm assessments is reduced by 15.4% compared to random farm visits. However, there are some aspects of this calculation

General discussion 109
that need to be discussed. First, pre-screening tests developed in this thesis might perform differently in another population (i.e. other than our study herds). Therefore, performance of these tests should be validated in other herds, as well as the corresponding reduction in the number of on-farm assessments. Second, the relative reduction in the number of on-farm assessments varies from 0.9% to 77%, depending on the welfare indicator (Table 1). Hence, when all of these indicators are considered simultaneously, the overall reduction in the number of on-farm assessments is equal to 0.9%. Moreover, as different herds might test positive for different indicators, the overall reduction depends on the total number of herds testing positive among all indicators. In our dataset, for example, all herds tested positive for at least one indicator, which implies all herds should be visited in case all indicators are equally important. The relative importance of indicators for addressing dairy cattle welfare, however, differs according to animal welfare experts (Whay et al., 2003; Lievaart and Noordhuizen, 2011). For example, animal welfare experts ranked lameness as a more important welfare indicator than skin lesions (Whay et al., 2003). Moreover, thresholds for good or poor welfare were based partly on the 25% worst scoring herds in our study, which was an arbitrary choice. Hence, when various indicators are to be assessed simultaneously, value judgments about an overall welfare score of herds inevitably need to be made to decide whether a herd should be visited following a pre-screening. Can routine herd data be used for prediction of an overall welfare score? Two other studies explored the value of RHD for predicting dairy cattle welfare. In these studies, a herd was considered to have overall poor welfare if it was among the 10% worst scoring herds for at least two of nine indicators assessed (Sandgren et al., 2009; Nyman et al., 2011). Similar to some other methods that combine indicators in an overall score, this method shows a number of drawbacks. First, defining a threshold value for poor welfare based on the 10% worst scoring herds is an arbitrary choice. In the absence of an objective judgment, thresholds can at best be based on value judgments by animal welfare experts. Second, setting a single threshold value does not account for variation of severity of a problem within the threshold categories. For example, with a threshold set at 12%, a herd showing 80% severely lame cows is not classified worse than a herd showing 20% severely lame cows, and this score can be equally compensated with good scores for other indicators. Third, the method does not account for differences in relative importance of indicators. A herd showing a high percentage of cows with hairless patches, for example, is classified the same as a herd showing a high percentage of severely lame cows. The Welfare Quality multicriteria evaluation (WQ-ME) model was developed with the aim to provide an overall welfare score that reflects the multidimensional nature of welfare and relative importance of welfare indicators. To address the potential drawbacks of an aggregation model like the one mentioned above, the model employs various algorithmic operators that are parameterized based on value judgments of animal welfare experts (Botreau et al., 2009). An evaluation of the WQ-ME model in Chapter 4, however, showed that current classification of our study herds was strongly influenced by a limited number of welfare indicators. Though the percentage of severely lame cows ranged up to 66% in our study herds, classification was almost not influenced by lameness. Other animal welfare experts, however, have ranked lameness as the most important indicator of dairy cattle welfare (Whay et al., 2003; Lievaart and Noordhuizen, 2011). The fact that classification was not very sensitive to indicators

110 Chapter 7
that were considered important by experts in other studies suggests that the WQ-ME model needs to be improved. As soon as this model is improved, the value of RHD for pre-screening of classification of herds can be investigated. Improvement of the Welfare Quality multicriteria evaluation model Assuring dairy cattle welfare requires value judgments about poor or good overall welfare. Though improvement is needed, the WQ-ME model seems a relatively appropriate technique for classification of dairy cattle welfare. In chapter 4, two research directions were suggested for improvement of the WQ-ME model, in terms of its ability to reflect the relative importance of welfare indicators. These research directions aimed at investigating the choice of algorithmic operators and the role of expert opinion in the model, because of their apparent influence on the extent of compensation among indicators. In an MSc study, we explored the effect of changing the composition of experts in the WQ-ME model on herd classification. We randomly eliminated some expert scores and replaced them by a score of one of the remaining experts. Preliminary results show that a slightly different composition of experts can significantly influence classification of herds. This might explain why, based on the WQ-ME model in its current form, some welfare indicators are relatively unimportant for classification. The exact cause of this difference (e.g. scientific expertise, nationality, or attitude of omitted experts) requires further investigation. Including a larger number of experts or adjusting for the level of agreement among the experts (Lievaart and Noordhuizen, 2011) might help to improve the robustness of WQ-ME classification of dairy herds. Besides this, experts might rank herds differently when they know underlying indicator scores (e.g. the percentage of severely lame cows). In practice, however, this might be difficult due to the large number of indicators included in the WQ-ME model. Reducing on-farm assessment time The second way to reduce on-farm assessment time is to reduce the time needed per on-farm assessment (approximately six hours for a herd of about 80 lactating cows). It was shown in Chapter 5 that replacing indicators of an on-farm assessment protocol by predictions based on remaining welfare indicators did not reduce on-farm assessment time, because welfare indicators were little associated. Similar to our results, Andreasen et al. (2013) concluded that one indicator, the Qualitative Behavior Assessment, could not be used to replace other indicators in the WQ protocol for cattle. Other promising strategies for reducing on-farm assessment time are widely investigated, such as adjusting sampling strategies for locomotion scoring (e.g. Main et al., 2010), automated monitoring of sickness by measuring feeding behavior (Weary et al., 2009), or the use of image analysis, weigh scales, or accelerometers attached to the leg for detection of lame cows (Chapinal et al., 2010; Pluk et al., 2012). Three-dimensional accelerometers could also be used for measuring resting behavior (Ito et al., 2010). In Chapter 5, it was emphasized that reduction of assessment time of individual indicators is useless when other indicators in an assessment method (i.e. behavioral observations or clinical observations) still need to be assessed. This is relevant for other research that aims to reduce on-farm assessment time. If assessment of the six indicators in behavioral observations is automated, for example, on-farm assessment time of the Welfare Quality protocol could be reduced by approximately 150 minutes (Welfare Quality, 2009), whereas no time would be gained by automating less than six indicators because other indicators still need to be assessed.

General discussion 111
Improvement of dairy cattle welfare On-farm welfare assessment should be succeeded by feedback of results to farmers (Figure 1). Assessment and feedback gives the farmer opportunities to consolidate or improve the level of welfare in the herd. Science-based advice about housing and management interventions for welfare improvement can assist the farmer in making effective changes. The fact that animal welfare is assessed by multiple indicators, however, challenges a coherent advice, because it is largely unknown whether housing and management factors have opposing or synergic effects for different indicators. In Chapter 6, we studied associations of housing and management factors with four indicators relating to different aspects of animal welfare. It was found that indicators relating to good housing and health were partly associated with similar factors, whereas the indicator relating to appropriate behavior was not. Associations of housing and management factors with other indicators in the Welfare Quality protocol should be investigated. In a recent study, Burow et al. (2012) found both negative and positive associations between pasturing and 17 indicators assessed in the Welfare Quality protocol. When these indicators were linearly combined in a self-developed overall score for dairy cattle welfare, a positive association was found between pasturing and the overall score. In this thesis, we did not evaluate to which extent interventions result in improvement of the level of welfare in herds (Figure 1). Main et al. (2012) reported that on-farm assessment only led to a reduction of lameness in herds. Studies that evaluated effects of interventions have found reduction in, e.g., prevalence of lameness, mastitis, and herd somatic cell count (Green et al., 2007; Main et al., 2012), but some other studies did not find a significant decrease (Bell et al., 2009; Barker et al., 2012). We also did not evaluate to which extent farmers are motivated to intervene in housing and management for improvement of dairy cattle welfare. It has been emphasized, however, that development of welfare assurance schemes should focus on promoting farmer engagement (Main and Mullan, 2012), and that a facilitated approach to discuss interventions for improvement can be at least as effective as a direct advisory approach (Whay et al., 2012). In a study by Leach et al. (2010a), farmers ranked time and labor as most important limiting factors for lameness control activities, rather than a lack of information or high investment costs. Farm assurance status was not considered very important for farmers to control lameness (Leach et al., 2010b). Therefore, it is uncertain whether technical advice on interventions for improvement of animal welfare, such as the ones proposed in Chapter 6, will be adopted by farmers. These aspects require investigation, in order to further contribute to assurance of dairy cattle welfare.
General conclusions
Routine herd data in national herd databases are associated with various indicators of dairy cattle welfare (Chapter 2);
Routine herd data have value for estimating dairy cattle welfare at the herd level (Chapter 3); Using routine herd data as a pre-screening test can reduce the number of farm visits needed
for identification of herds with poor welfare (Chapter 3); Routine herd data hold value for continuous monitoring of the level of dairy cattle welfare
(Chapter 3);

112 Chapter 7
A limited number of welfare indicators has a strong influence on classification of dairy herds based on the Welfare Quality multicriteria evaluation model in its current form, especially for herds classified unacceptable (Chapter 4);
Classification based on the Welfare Quality multicriteria evaluation model in its current form is not very sensitive to improving single indicators of good health (Chapter 4);
Replacing indicators in the Welfare Quality protocol for dairy cattle by predictions based on remaining indicators shows little scope for reduction of on-farm assessment time per herd (Chapter 5);
Some aspects of housing and management are common risk factors for prevalence of lameness, lesions or swellings, and dirty hindquarters, but not for frequency of displacements (Chapter 6).
Recommendations The pre-screening tests developed in this thesis for identification of herds with poor welfare might perform differently in another population (i.e. other than our study herds). Therefore, performance of these tests should be validated in other herds, as well as the corresponding reduction in the number of on-farm assessments. The system of pre-screening and subsequent on-farm assessment requires an overall score for the level of welfare in dairy herds. Therefore, the Welfare Quality multicriteria evaluation model should be improved in terms of its ability to reflect the relative importance of welfare indicators. This should involve an evaluation of the type of algorithmic operators and the role of expert opinion in this model. As soon as this model is improved, the value of RHD for pre-screening of classification of herds can be investigated. To reduce on-farm assessment time per herd, other strategies, such as automated monitoring, should be applied rather than the one investigated in this thesis. When other strategies are evaluated in terms of their ability to reduce on-farm assessment time, it should be taken into account that omission of individual indicators from the Welfare Quality protocol does not necessarily imply a reduction of assessment time. Finally, associations between housing and management factors and welfare indicators, other than the ones studied in Chapter 5, should be investigated, to contribute to knowledge of housing and management interventions that can potentially improve the level of dairy cattle welfare.

General discussion 113
References Andreasen, S. N., F. Wemelsfelder, P. Sandøe, and B. Forkman. 2013. The correlation of Qualitative Behavior Assessments with
Welfare Quality® protocol outcomes in on-farm welfare assessment of dairy cattle. Appl. Anim. Behav. Sci. 143: 9-17. Barker, Z. E., J. L. Wright, R. W. Blowey, J. R. Amory, and L. E. Green. 2012. Uptake and effectiveness of interventions to reduce
claw lesions in 40 dairy herds in the UK. Anim. Welf. 21: 563-576. Bell, N. J., M. J. Bell, T. G. Knowles, H. R. Whay, D. J. Main, and A. J. F. Webster. 2009. The development, implementation and
testing of a lameness control programme based on HACCP principles and designed for heifers on dairy farms. Vet. J. 180: 178-188.
Bokkers, E. A. M., M. de Vries, I. Antonissen, and I. J. M. de Boer. 2012. Inter- and intra-observer reliability of experienced and inexperienced observers for the Qualitative Behaviour Assessment in dairy cattle. Anim. Welf. 21: 307-318.
Botreau, R., I. Veissier, and P. Perny. 2009. Overall assessment of animal welfare: strategy adopted in Welfare Quality. Anim. Welf. 18: 363-370.
Burow, E., T. Rousing, P. T. Thomsen, N. D. Otten, and J. T. Sorensen. 2012. Effect of grazing on the cow welfare of dairy herds evaluated by a multidimensional welfare index. Animal 17: 1-9.
Chapinal, N., A. M. de Passille, J. Rushen, and S. Wagner. 2010. Automated methods for detecting lameness and measuring analgesia in dairy cattle. J. Dairy Sci. 93: 2007-2013.
Green, M. J., K. A. Leach, J. E. Breen, L. E. Green, and A. J. Bradley. 2007. National intervention study of mastitis control in dairy herds in England and Wales. Vet. Rec. 160: 287-293.
Ito, K., M. A. G. von Keyserlingk, S. J. LeBlanc, and D. M. Weary. 2010. Lying behavior as an indicator of lameness in dairy cows. J. Dairy Sci. 93: 3553-3560.
Knierim, U. and C. Winckler. 2009. On-farm welfare assessment in cattle: validity, reliability and feasibility issues and future perspectives with special regard to the Welfare Quality approach. Anim. Welf. 18: 451-458.
Leach, K. A., H. R. Whay, C. M. Maggs, Z. E. Barker, E. S. Paul, A. K. Bell, and D. C. J. Main. 2010a. Working towards a reduction in cattle lameness: 1. Understanding barriers to lameness control on dairy farms. Res.Vet. Sci. 89: 311-317.
Leach, K. A., H. R. Whay, C. M. Maggs, Z. E. Barker, E. S. Paul, A. K. Bell, and D. C. J. Main. 2010b. Working towards a reduction in cattle lameness: 2. Understanding dairy farmers' motivations. Res.Vet. Sci. 89: 318-323.
LEI. 2008. Farm Accountancy Data Network 2009. Web page www.lei.wur.nl/UK/statistics/Binternet/. Accessed May 29, 2012. LEI, The Hague, Netherlands.
Lievaart, J. J. and J. P. T. M. Noordhuizen. 2011. Ranking experts’ preferences regarding measures and methods of assessment of welfare in dairy herds using Adaptive Conjoint Analysis. J. Dairy Sci. 94: 3420-3427.
Main, D. C. J., H. R. Whay, L. E. Green, and A. J. F. Webster. 2003. Effect of the RSPCA Freedom Food scheme on the welfare of dairy cattle. Vet. Rec. 153: 227-231.
Main, D. C. J., Z. E. Barker, K. A. Leach, N. J. Bell, H. R. Whay, and W. J. Browne. 2010. Sampling strategies for monitoring lameness in dairy cattle. J. Dairy Sci. 93: 1970-1978.
Main, D. C. J., K. A. Leach, Z. E. Barker, A. K. Sedgwick, C. M. Maggs, N. J. Bell, and H. R. Whay. 2012. Evaluating an intervention to reduce lameness in dairy cattle. J. Dairy Sci. 95: 2946-2954.
Main, D. C. J. and S. Mullan. 2012. Economic, education, encouragement and enforcement influences within farm assurance schemes. Anim. Welf. 21: 107-111.
Nyman, A.-K., A. Lindberg, and C. H. Sandgren. 2011. Can pre-collected register data be used to identify dairy herds with good cattle welfare? Acta Vet. Scand. 53 Suppl 1: S8.
Pluk, A., C. Bahr, A. Poursaberi, W. Maertens, A. van Nuffel, and D. Berckmans. 2012. Automatic measurement of touch and release angles of the fetlock joint for lameness detection in dairy cattle using vision techniques. J. Dairy Sci. 95: 1738-1748.
RSPCA. 2001. RSPCA Welfare Standards for Dairy Cattle. RSPCA, Horsham, UK. Sandgren, C. H., A. Lindberg, and L. J. Keeling. 2009. Using a national dairy database to identify herds with poor welfare. Anim.
Welf. 18: 523-532. Weary, D. M., J. M. Huzzey, and M. A. G. von Keyserlingk. 2009. Board-invited review: Using behavior to predict and identify ill
health in animals. J. Anim. Sci. 87: 770-777. Webster, A. J. F., D. C. J. Main, and H. R. Whay. 2004. Welfare assessment: Indices from clinical observation. Anim. Welf. 13
(Suppl.): S93-S98. Welfare Quality. 2009. Welfare Quality® Assessment Protocol for Cattle. Welfare Quality® Consortium, Lelystad, Netherlands. Whay, H. R., D. C. J. Main, L. E. Green, and A. J. F. Webster. 2003. Animal-based measures for the assessment of welfare state of
diary cattle, pigs and laying hens: Consensus of expert opinion. Anim. Welf. 12: 205-217. Whay, H. R., Z. E. Barker, K. A. Leach, and D. C. J. Main. 2012. Promoting farmer engagement and activity in the control of dairy
cattle lameness. Vet. J. 193: 617-621. Winckler, C., J. Brinkmann, and J. Glatz. 2007. Long-term consistency of selected animal-related welfare parameters in dairy
farms. Anim. Welf. 16: 197-199.

114 Chapter 7


116 Summary
Summary In many countries, there is an increasing interest to assure the welfare of production animals.
Assuring a certain level of welfare in dairy herds requires regular welfare assessment, as well as feedback and advice to farmers about interventions in housing and management to improve welfare. On-farm assessment of dairy cattle welfare, however, is time-consuming and, therefore, expensive. Besides this, effects of housing and management interventions can be conflicting for different indicators of dairy cattle welfare. These issues may hamper implementation of welfare assurance schemes and, therefore, improvement of dairy cattle welfare. The main objective of this thesis was to contribute to assurance of dairy cattle welfare by evaluating strategies to improve time-efficiency of welfare assessment and by identifying housing and management interventions for welfare improvement. Results presented are based on an observational study among 181 loose-housed and 13 tied commercial Dutch dairy herds, which were selected with a composite score for mortality, udder health, and milk production. From November 2009 through March 2010, data relating to housing, management, and indicators of the Welfare Quality protocol for dairy cattle was collected from each herd. After all farms were visited, routine herd data (RHD) relating to demography, management, milk production, milk composition, and fertility were extracted for the same herds from several national databases (i.e. the Dutch identification and registration system, the rendering plant, the milk quality assurance company, the animal health service, and the cattle improvement syndicate). Because herds in the present study were not selected randomly, the observed prevalence was not representative of the population of Dutch dairy farms as a whole.
In many developed countries, RHD are regularly collected from dairy farms. It was hypothesized that RHD could be used to identify herds with potentially poor animal welfare. This could reduce the number of on-farm assessments that are needed to identify these herds. In CChapter 2, scientific literature was reviewed to evaluate which variables of RHD had been associated with indicators of the Welfare Quality protocol for dairy cattle. Results showed that 23 out of 27 variables of RHD had been associated with 16 out of 34 welfare indicators. RHD related to milk yield, culling, and reproduction were associated with the largest number of welfare indicators. It was concluded that many variables of RHD have potential to estimate the level of welfare on dairy farms. Associations in the literature reviewed, however, were mainly univariable associations evaluated at the animal level or in an experimental setting. The true value of these data needs to be determined in common practice, using multiple variables of RHD for predicting dairy cattle welfare at the farm level.
In CChapter 3, the value of RHD for predicting dairy cattle welfare at the herd level was evaluated for each indicator of the Welfare Quality protocol for dairy cattle, using the RHD and welfare data collected in the observational study described above. Results showed that predictions based on RHD for welfare indicators varied from less to highly accurate. RHD related to on-farm mortality were associated with the largest number of welfare indicators. When prediction models were forced to detect nearly all herds with a welfare problem (sensitivity of at least 97.5%), specificity ranged from 0 to 81%. By forcing almost no herds to be incorrectly classified as having a welfare problem (specificity of at least 97.5%), sensitivity ranged from 0 to 67%. It was concluded that, for most welfare indicators, RHD have value for predicting dairy cattle welfare. Not only can RHD serve as a pre-screening test for

Summary 117
detecting herds with poor welfare to reduce the number of on-farm assessments, RHD also hold value for continuous monitoring of dairy cattle welfare.
In order to decide whether a herd should be visited following a pre-screening, value judgments about the overall welfare of herds need to be made. This requires combining welfare indicators in an overall score. The European project Welfare Quality developed a multicriteria evaluation model to provide an overall score that should reflect the multidimensional nature of welfare and relative importance of indicators. In CChapter 4, we evaluated the relative importance of welfare indicators for classification of our study herds, based on the Welfare Quality multicriteria evaluation model. Results showed that herds classified unacceptable showed more very lean cows, more severely lame cows, and more often an insufficient number of drinkers than herds classified acceptable. Herds classified acceptable showed more cows with high somatic cell count, with lesions, that could not be approached closer than 1 m, colliding with components of the stall while lying down, lying outside the lying area, fewer cows with diarrhea, more often an insufficient number of drinkers, and scored lower for the descriptors “relaxed” and “happy” than herds classified enhanced. Increasing the number of drinkers and reducing the percentage of cows colliding with components of the stall while lying down were the changes that were most effective in allowing herds classified unacceptable and acceptable, respectively, to reach a higher class. The Welfare Quality multicriteria evaluation model was not very sensitive to improving single indicators of good health (e.g. prevalence of severely lame cows or cows with a high somatic cell count). It was concluded that a limited number of welfare indicators had a strong influence on classification of dairy herds, especially for herds classified unacceptable.
A different strategy for improving time efficiency of welfare assessment is to reduce the time needed per on-farm assessment. In CChapter 5, we explored the possibility to reduce on-farm assessment time of the Welfare Quality protocol for dairy cattle, using the welfare data collected in the observational study described above. Assessment time of this protocol is approximately six hours for a herd of about 80 lactating cows, divided over four assessment methods: avoidance distance at the feeding rack (ADF, 44 min), qualitative behavior assessment (QBA, 25 min), behavioral observations (BO, 150 min), and clinical observations (CO, 132 min). To simulate reduction of on-farm assessment time, a set of welfare indicators belonging to one assessment method was omitted from the protocol. Observed values of omitted indicators were replaced by predictions based on welfare indicators of the remaining three assessment methods, resources checklist, and interview, thus mimicking the performance of the full protocol. Results showed that agreement between predicted and observed values of welfare indicators was low for ADF, moderate for QBA, slight to moderate for BO, and poor to moderate for CO. It was concluded that replacing animal-based welfare indicators by predictions based on remaining welfare indicators has little potential to reduce on-farm assessment time of the Welfare Quality protocol for dairy cattle.
A welfare assessment should be succeeded by feedback of results to the farmer, which gives him or her opportunities to consolidate or improve the level of welfare in the herd. To improve the level of welfare, knowledge of housing and management interventions that may potentially lead to improvement, as well as their potential synergies and trade-offs for different welfare indicators, is essential. In CChapter 6, we identified and compared housing and management factors associated with the prevalence of lameness, lesions or swellings, dirty hindquarters, and the average frequency of displacements. For this purpose, we used the housing, management, and welfare data collected from

118 Summary
herds in free-stall housing in the observational study described above. Results showed that both the prevalence of lameness and lesions or swellings were lower in herds that had soft mats/mattresses or deep bedding in stalls compared with concrete, and in herds with summer pasturing compared with zero-grazing. Deep bedding in stalls was negatively associated with the prevalence of dirty hindquarters, compared with hard mats. No common risk factors were identified for the average frequency of displacements and other welfare indictors. It was concluded that changes in surface of the lying area and pasturing in summer can potentially lead to simultaneous improvement of multiple welfare indicators.
Finally, in CChapter 7, the relevance of the results of this thesis for efficient assessment and improvement of dairy cattle welfare was discussed. The potential reduction in the number of on-farm assessments was shown for each welfare indicator of the Welfare Quality protocol for dairy cattle. The essence of an overall welfare score of herds for identifying herds with poor welfare was explained, as well as a potential reason why a limited number of welfare indicators strongly influence classification in the Welfare Quality multicriteria evaluation model. Furthermore, effectiveness of welfare assurance schemes for improvement of dairy cattle welfare was discussed, using empirical evidence from other studies. The final conclusions from the research presented in this thesis were:
Routine herd data in national herd databases are associated with various indicators of dairy cattle welfare (Chapter 2);
Routine herd data have value for estimating dairy cattle welfare at the herd level (Chapter 3); Using routine herd data as a pre-screening test can reduce the number of farm visits needed
for identification of herds with poor welfare (Chapter 3); Routine herd data hold value for continuous monitoring of the level of dairy cattle welfare
(Chapter 3); A limited number of welfare indicators has a strong influence on classification of dairy herds
based on the Welfare Quality multicriteria evaluation model in its current form, especially for herds classified unacceptable (Chapter 4);
Classification based on the Welfare Quality multicriteria evaluation model in its current form is not very sensitive to improving single indicators of good health (Chapter 4);
Replacing indicators in the Welfare Quality protocol for dairy cattle by predictions based on remaining indicators shows little scope for reduction of on-farm assessment time per herd (Chapter 5);
Some aspects of housing and management are common risk factors for prevalence of lameness, lesions or swellings, and dirty hindquarters, but not for frequency of displacements (Chapter 6).
A number of general recommendations for future research can be given based on the studies presented in this thesis. The pre-screening tests developed in this thesis for identification of herds with poor welfare should be validated in other herds, as well as the corresponding reduction in the number of on-farm assessments. The Welfare Quality multicriteria evaluation model should be improved in

Summary 119
terms of its ability to reflect the relative importance of welfare indicators. As soon as this model is improved, the value of RHD for pre-screening of classification of herds can be investigated. To reduce on-farm assessment time per herd, other strategies such as automated monitoring should be applied rather than the one investigated in this thesis. Finally, associations between housing and management factors and welfare indicators, other than the ones studied in Chapter 5, should be investigated. This contributes to knowledge of housing and management interventions that can potentially improve the level of dairy cattle welfare.

120 Samenvatting
Samenvatting
In veel landen is er een toenemende behoefte om het welzijn van dieren in de veehouderij te waarborgen. Om een bepaald niveau van dierenwelzijn te kunnen waarborgen moet het welzijn met regelmaat worden beoordeeld. Daarnaast moeten resultaten van de beoordeling, en advies over aanpassingen in huisvesting en management om het welzijn te verbeteren, worden teruggekoppeld aan de veehouder. Wanneer dierenwelzijn op het bedrijf zelf beoordeeld wordt is dit echter tijdrovend, en daardoor kostbaar. Daarnaast kunnen aanpassingen in huisvesting en management conflicterende effecten hebben op verschillende indicatoren van dierenwelzijn. Deze bezwaren kunnen de implementatie van een kwaliteitssysteem voor dierenwelzijn, en daardoor tevens een mogelijke verbetering van dierenwelzijn, belemmeren. Het doel van het onderzoek beschreven in dit proefschrift was een bijdrage te leveren aan het waarborgen van het welzijn van melkvee, enerzijds door strategieën te evalueren die de tijdsefficiëntie van welzijnsbeoordeling kunnen verhogen, en anderzijds door aanpassingen in huisvesting en management voor het verbeteren van welzijn te identificeren.
De resultaten beschreven in dit proefschrift zijn gebaseerd op een observationele studie op commerciële Nederlandse melkveebedrijven gehuisvest in 181 loopstallen en 13 grupstallen. Deze bedrijven waren geselecteerd op basis van een samengestelde score voor sterfte, uiergezondheid, en melkproductie. Tussen november 2009 en maart 2010 is op elk bedrijf data verzameld over huisvesting, management, en welzijnsindicatoren volgens het Welfare Quality protocol voor melkvee. Nadat alle bedrijven waren bezocht zijn bedrijfskengetallen van deze bedrijven, met betrekking tot demografie, management, melkproductie, melksamenstelling en vruchtbaarheid, geëxtraheerd uit verscheidene nationale databanken (I&R, Rendac, Qlip, Gezondheidsdienst voor Dieren en CRV). Aangezien de bedrijven in de onderliggende studie niet aselect gekozen waren zijn de gepresenteerde prevalenties niet representatief voor de Nederlandse populatie als geheel.
In veel ontwikkelde landen worden met regelmaat bedrijfskengetallen van melkveebedrijven verzameld. Een hypothese in dit proefschrift was dat bedrijfskengetallen gebruikt kunnen worden om bedrijven te identificeren waar koeien een laag welzijnsniveau hebben. Dit zou het aantal bedrijfsbezoeken kunnen reduceren dat nodig is om deze bedrijven te identificeren. In HHoofdstuk 2 van dit proefschrift is op basis van wetenschappelijke literatuur geëvalueerd welke bedrijfskengetallen geassocieerd zijn met welzijnsindicatoren van het Welfare Quality protocol voor melkvee. Drieëntwintig van de 27 onderzochte bedrijfskengetallen waren geassocieerd met 16 van de 34 onderzochte welzijnsindicatoren. Bedrijfskengetallen gerelateerd aan melkproductie, afvoer en vruchtbaarheid waren met het grootste aantal welzijnsindicatoren geassocieerd. Geconcludeerd werd dat veel bedrijfskengetallen potentie hebben om het niveau van dierenwelzijn op melkveebedrijven te voorspellen. Associaties die gevonden werden in de bestudeerde literatuur betroffen echter voornamelijk univariabele associaties die geëvalueerd waren op dierniveau of in een experimentele setting. De werkelijke waarde van de bedrijfskengetallen moet worden bepaald op praktijkbedrijven, gebruikmakend van meerdere bedrijfskengetallen voor het voorspellen van welzijn van melkvee op bedrijfsniveau.
In HHoofdstuk 3 is de waarde van bedrijfskengetallen voor het voorspellen van welzijn van melkvee op bedrijfsniveau onderzocht voor iedere indicator van het Welfare Quality protocol voor melkvee, waarbij gebruik werd gemaakt van de data verzameld in de hierboven beschreven

Samenvatting 121
observationele studie. Uit de resultaten bleek dat voorspellingen van welzijn op basis van bedrijfskengetallen varieerde van weinig tot hoog accuraat, afhankelijk van de welzijnsindicator. Bedrijfskengetallen gerelateerd aan sterfte op het bedrijf waren geassocieerd met het hoogste aantal welzijnsindicatoren. Wanneer predictiemodellen zodanig werden ingesteld dat alle bedrijven met een welzijnsprobleem werden gedetecteerd (i.e. een sensitiviteit van tenminste 97.5%), varieerde de specificiteit van 0 tot 81% tussen welzijnsindicatoren. Wanneer de modellen zo werden ingesteld dat bijna geen bedrijven onterecht geclassificeerd werden als een bedrijf met een welzijnsprobleem (i.e. een specificiteit van tenminste 97.5%), varieerde de sensitiviteit van 0 tot 67% tussen welzijnsindicatoren. Er werd geconcludeerd dat bedrijfskengetallen voor de meeste welzijnsindicatoren waarde hebben voor het voorspellen van welzijn van melkvee. Bedrijfskengetallen kunnen worden gebruikt als een screening voor het identificeren van bedrijven met een laag dierenwelzijnsniveau waardoor het aantal bedrijfsbezoeken gereduceerd kan worden. Daarnaast hebben bedrijfskengetallen waarde om dierenwelzijn met regelmaat te monitoren.
Om te beslissen of een bedrijf bezocht moet worden na een screening is een oordeel nodig over het algehele niveau van dierenwelzijn. Hiervoor moeten individuele welzijnsindicatoren worden gecombineerd tot één geïntegreerde score. Het Europese project Welfare Quality heeft hiervoor een multicriteria-evaluatiemodel ontwikkeld. Met dit model krijgen bedrijven een welzijnsclassificatie toegewezen die het multidimensionale karakter van dierenwelzijn en het relatieve belang van indicatoren zou moeten weerspiegelen. In HHoofdstuk 4 is het relatieve belang van de indicatoren voor de classificatie van de bedrijven uit onze observationele studie onderzocht, gebaseerd op het Welfare Quality multicriteria-evaluatiemodel. Uit de resultaten bleek dat bedrijven die geclassificeerd werden als onacceptabel meer magere en ernstig kreupele koeien hadden, en vaker onvoldoende drinkbakken hadden dan bedrijven die geclassificeerd werden als acceptabel. Bedrijven die geclassificeerd werden als acceptabel hadden meer koeien met een hoog celgetal, met verwondingen, die niet dichter dan 1 m benaderd konden worden, die zich tegen de boxafscheiding stoten bij het gaan liggen en die buiten het ligbed lagen, maar minder koeien met diarree dan de bedrijven die geclassificeerd werden als goed. Daarnaast hadden deze bedrijven vaker onvoldoende drinkbakken, en scoorden slechter voor de termen “relaxed” en “happy”. Om een hogere classificering te krijgen was het verhogen van het aantal drinkbakken het meest effectief voor bedrijven geclassificeerd als onacceptabel, en het verlagen van het percentage koeien die zich stoten tegen de boxafscheiding het meest effectief voor bedrijven geclassificeerd als acceptabel. Het Welfare Quality multicriteria-evaluatiemodel was niet erg gevoelig voor verbetering van individuele indicatoren van goede gezondheid (bijv. het verlagen van het percentage ernstig kreupele koeien of het percentage koeien met een hoog celgetal). Geconcludeerd werd dat een beperkt aantal welzijnsindicatoren een sterke invloed heeft op classificatie van melkveebedrijven, met name voor bedrijven die geclassificeerd zijn als onacceptabel.
Een andere strategie voor het verbeteren van de tijdsefficiëntie van welzijnsbeoordelingen is de reductie van de tijd die nodig is per bedrijf. In HHoofdstuk 5 hebben we de mogelijkheid onderzocht om de tijd per bedrijfsbeoordeling voor het Welfare Quality protocol voor melkvee te reduceren, waarbij gebruik werd gemaakt van de data verzameld in de hierboven beschreven observationele studie. De tijd per bedrijfsbeoordeling van dit protocol is ongeveer zes uur voor een bedrijf met ongeveer 80 koeien in lactatie, verdeeld over vier beoordelingsmethoden: een ontwijktest aan het voerhek (44 minuten), een kwalitatieve gedragsbeoordeling (25 minuten), gedragsobservaties (150

122 Samenvatting
minuten), en klinische observaties (132 minuten). Om de reductie van een bedrijfsbeoordeling te simuleren werd een set welzijnsindicatoren behorende bij één beoordelingsmethode uit het protocol verwijderd. De geobserveerde waarden van de verwijderde indicatoren werden vervolgens vervangen door voorspelde waarden gebaseerd op de indicatoren in de andere drie beoordelingsmethoden, en gegevens over huisvesting en management. Als zodanig werd het protocol als geheel nagebootst. Uit de resultaten bleek dat de overeenkomst tussen de voorspelde en geobserveerde waarden van welzijnsindicatoren laag was voor de ontwijktest, middelmatig voor de kwalitatieve gedragsbeoordeling, gering tot middelmatig voor de gedragsobservaties, en slecht tot middelmatig voor de klinische observaties. Geconcludeerd werd dat het vervangen van welzijnsindicatoren door voorspellingen gebaseerd op resterende welzijnsindicatoren weinig potentie heeft voor het reduceren van de tijd per bedrijfsbeoordeling voor het Welfare Quality protocol voor melkvee.
Een welzijnsbeoordeling moet worden opgevolgd door een terugkoppeling van de resultaten naar de veehouder, zodat hij/zij de mogelijkheid krijgt het welzijnsniveau van zijn/haar veestapel te behouden of te verbeteren. Om het welzijnsniveau te verbeteren is kennis van zowel aanpassingen in huisvesting en management ter verbetering van welzijn als kennis van eventuele synergetische en conflicterende effecten van deze aanpassingen op verschillende welzijnsindicatoren essentieel. In Hoofstuk 6 zijn huisvestings- en managementfactoren geassocieerd met de prevalentie van kreupelheid, verwondingen en zwellingen, bevuilde flanken, en de gemiddelde frequentie van verplaatsingen geïdentificeerd en vergeleken. Hierbij is gebruik gemaakt van huisvestings-, management- en welzijnsdata die verzameld zijn in ligboxenstallen in de hierboven beschreven observationele studie. Uit de resultaten bleek dat zowel de prevalentie van kreupelheid als de prevalentie van verwondingen en zwellingen lager was op bedrijven met zachte matten/matrassen of diepstrooiselboxen dan die met alleen beton als ligbed, en lager op bedrijven met zomerbeweiding dan op bedrijven zonder beweiding. De prevalentie van bevuilde flanken was lager op bedrijven met diepstrooiselboxen dan op bedrijven met harde matten. Risicofactoren voor de frequentie van verplaatsingen en andere welzijnsindicatoren waren niet identiek. Geconcludeerd werd dat aanpassingen in het ligbedoppervlak en zomerweidegang mogelijk kunnen leiden tot simultane verbetering van verschillende welzijnsindicatoren.
In HHoofdstuk 7 is de relevantie van de resultaten van dit proefschrift voor efficiënte beoordeling en verbetering van welzijn van melkvee bediscussieerd. De potentiële reductie in het aantal bedrijfsbeoordelingen is beschreven voor elke welzijnsindicator in het Welfare Quality protocol voor melkvee. De essentie van een geïntegreerde score voor melkveebedrijven voor het identificeren van bedrijven met een laag welzijnsniveau is toegelicht, alsmede een potentiële verklaring van de bevinding dat een beperkt aantal welzijnsindicatoren een sterke invloed uitoefent op de classificatie van het Welfare Quality multicriteria-evaluatiemodel. Ten slotte is de effectiviteit van een kwaliteitssysteem voor het verbeteren van dierenwelzijn bediscussieerd aan de hand van empirisch bewijs uit andere wetenschappelijke studies.

Samenvatting 123
De conclusies van het onderzoek beschreven in dit proefschrift waren:
Bedrijfskengetallen in nationale databanken zijn geassocieerd met diverse welzijnsindicatoren voor melkvee (Hoofdstuk 2);
Bedrijfskengetallen hebben potentie om het welzijn van melkvee op bedrijfsniveau te voorspellen (Hoofdstuk 3);
Door bedrijfskengetallen te gebruiken als screening test kan het aantal bedrijfsbezoeken dat nodig is voor het identificeren van bedrijven met verminderd welzijn worden gereduceerd (Hoofdstuk 3);
Bedrijfskengetallen hebben waarde voor het continu monitoren van dierenwelzijn (Hoofdstuk 3);
Een beperkt aantal welzijnsindicatoren heeft sterke invloed op de welzijnsclassificatie van melkveebedrijven gebaseerd op het huidige Welfare Quality multicriteria-evaluatiemodel, met name voor bedrijven die geclassificeerd zijn als onacceptabel (Hoofdstuk 4);
Classificatie op basis van het huidige Welfare Quality multicriteria-evaluatiemodel is weinig gevoelig voor verbetering van individuele indicatoren van goede diergezondheid (Hoofdstuk 4);
Vervanging van indicatoren in het Welfare Quality protocol voor melkvee door voorspelde waarden gebaseerd op resterende indicatoren heeft weinig potentie voor het reduceren van de tijd per bedrijfsbeoordeling (Hoofdstuk 5);
Diverse huisvestings- en managementaspecten zijn gezamenlijke risicofactoren voor de prevalentie van kreupelheid, verwondingen en zwellingen, en bevuilde flanken, maar niet voor de frequentie van verplaatsingen (Hoofdstuk 6).
Op basis van het onderzoek beschreven in dit proefschrift kan een aantal algemene aanbevelingen voor toekomstig onderzoek worden gegeven. De screening test ontwikkeld in dit onderzoek voor het identificeren van bedrijven met verminderd welzijn moet op andere bedrijven gevalideerd worden, alsmede de overeenkomstige reductie in het aantal bedrijfsbezoeken. Het Welfare Quality multicriteria-evaluatiemodel moet worden verbeterd wat betreft zijn vermogen om het relatieve belang van welzijnsindicatoren te reflecteren. Met een verbeterd model kan de waarde van bedrijfskengetallen voor het voorspellen van een classificatie van bedrijven worden onderzocht. Om de tijd per bedrijfsbeoordeling te reduceren zouden andere strategieën, zoals geautomatiseerde monitoring van dierenwelzijn, gebruikt moeten worden in plaats van de strategie onderzocht in dit proefschrift. Ten slotte zouden, in aanvulling op de associaties gevonden in Hoofdstuk 5, associaties tussen huisvestings- en managementfactoren en andere welzijnsindicatoren onderzocht moeten worden om bij te dragen aan kennis die kan leiden tot verbetering van het welzijn van melkvee.

124 Curriculum Vitae
Curriculum Vitae Marion de Vries was born in Groningen on May 22th 1981, and grew up in Bedum. After completing secondary school at ‘Wessel Gansfortcollege’ in Groningen (1999), she studied Animal Sciences at the former Agricultural University in Wageningen. Her first master thesis investigated decision-making of poultry farmers regarding the ban of the battery cage system. Results of this thesis were published in a popular magazine (De Pluimveehouderij, 2005). Her second master thesis investigated dioxin levels in organic eggs, resulting in a scientific publication (De Vries et al., 2006). After receiving her master’s degree in 2005, she worked at the Food and Agriculture Organization to contribute to a report regarding the state of the world’s animal genetic resources (FAO, 2007) and at Agro Eco as consultant in organic agriculture. Before starting her PhD research, she worked as a researcher at the Animal Production Systems group of Wageningen University. She developed a distance learning course, wrote a NWO proposal about sustainability of South East Asian smallholder farming systems, and published a review paper about environmental impact of livestock products (De Vries and De Boer, 2010). In November 2008 she started her PhD research in the Animal Production Systems group directed at assurance of dairy cattle welfare by evaluating strategies for efficient welfare assessment and improvement, financed by the Animal Health Service Deventer. Her PhD-thesis work was awarded with the NZV travel grant at the WIAS Science day in 2009 and the ELANCO award at the ISVEE (International Society for Veterinary Epidemiology and Economics) conference in 2012. Since completing her PhD research in March 2013 she has been working as postdoctoral fellow at the Animal Production Systems group of Wageningen University.

Publications 125
Publications Refereed scientific journals De Vries, M., R.P. Kwakkel, and A. Kijlstra (2006). Dioxins in organic eggs: a review. NJAS Wageningen
Journal of Life Sciences 54: 207-221. De Vries, M., and I.J.M. de Boer (2010). Comparing environmental impacts for livestock products: A
review of life cycle assessments. Livestock Science 128: 1-11. De Vries, M., E.A.M. Bokkers, T. Dijkstra, G. van Schaik, and I.J.M. de Boer (2011). Invited review:
Associations between variables of routine herd data and dairy cattle welfare indicators. Journal of Dairy Science 94: 3213-3228.
Bokkers, E.A.M., M. de Vries, I.C.M.A. Antonissen, and I.J.M. de Boer (2012). Inter- and intra-observer
reliability of experienced and inexperienced observers for the Qualitative Behaviour Assessment in dairy cattle. Animal Welfare 21: 307-318.
De Vries, M., B. Engel, I. den Uijl, G. van Schaik, T. Dijkstra, I.J.M. de Boer, and E.A.M. Bokkers (2013).
Assessment time of the Welfare Quality protocol for dairy cattle. Animal Welfare 22: 85-93. De Vries, M., E.A.M. Bokkers, G. van Schaik, R. Botreau, B. Engel, T. Dijkstra, and I.J.M. de Boer.
Evaluating results of the Welfare Quality multicriteria evaluation model for classification of dairy cattle welfare at the herd level. Submitted to Journal of Dairy Science.
De Vries, M., E.A.M. Bokkers, G. van Schaik, B. Engel, T. Dijkstra, and I.J.M. de Boer. Exploring the value
of routinely collected herd data for estimating dairy cattle welfare. Submitted to Journal of Dairy Science.
Abstracts in conference proceedings De Vries, M., E.A.M. Bokkers, T. Dijkstra, G. van Schaik, and I.J.M. de Boer (2009). Potential of routinely
collected farm data to monitor dairy cattle welfare. In: Book of abstracts (no 15) of the 60th Annual Meeting of the European Association for Animal Production, 24 - 27 August 2009, Barcelona, Spain.
De Vries, M., E.A.M. Bokkers, T. Dijkstra, G. van Schaik, and I.J.M. de Boer (2010). Are welfare of dairy
cows and young stock related? In: Proceedings of the 44th congress of the International Society for Applied Ethology (ISAE): coping in large groups, 4 - 7 August 2010, Uppsala, Sweden.
De Vries, M., G. van Schaik, E.A.M. Bokkers, T. Dijkstra, and I.J.M. de Boer (2011). Characteristics of dairy
herds in different Welfare Quality categories. In: Proceedings of the 5th International Conference on

126 Publications
the Assessment of Animal Welfare at Farm and Group Level (WAFL), 8 - 11 August 2011, Guelph, Canada.
De Vries, M., G. van Schaik, T. Dijkstra, I.J.M. de Boer, and E.A.M. Bokkers (2012). Reducing assessment
time of the Welfare Quality protocol for dairy cattle. In: Book of Abstracts of the 13th International Symposium on Veterinary Epidemiology and Economics, 20 - 24 August 2012, Maastricht, the Netherlands.
Other publications De Vries, M., W. Koops, A. Kuipers, P. van Horne, and F. Leenstra (2005). Gehecht aan de kooi:
omschakelen naar alternatief gaat niet van harte. De Pluimveehouderij 24: 8-9. FAO (2007). Subregional reports on animal genetic resources: East Africa, North and West Africa,
Southern Africa, Europe, and the Caucasus. Annex to The State of the World’s Animal Genetic Resources for Food and Agriculture. Rome.
Den Uijl, I. , M. de Vries, E.A.M. Bokkers, T. Dijkstra, and G. van Schaik (2011). Verkorten van het Welfare
Quality protocol voor melkveebedrijven. Gezondheidsdienst voor Dieren, Deventer.

Educations certificate 127
Education certificate Completed Training and Supervision Plan
Description Year ECTS1
The basic package - WIAS Introduction Course 2009 1.5 - Ethics and Philosophy of Animal Science 2009 1.5 International conferences - EAAP, Barcelona, Spain 2009 1.2 - ISAE, Uppsala, Sweden 2010 1.2 - WAFL, Guelph, Canada 2011 1.2 - ISVEE, Maastricht, the Netherlands 2012 1.4 Seminars and workshops - Workshop Monitoring of Animal Welfare, Brussels, Belgium 2009 0.2 - VEEC workshop, GD Deventer 2009 0.2 - WIAS Science day, Wageningen 2009-12 1.2 - Symposium "Meer welzijn zonder pijn", Lelystad 2010 0.2 - Scientific Research in Animal Welfare: Do we make a difference?, Wageningen 2011 0.1 - Dutch Bovine Conference, Houten 2011 0.3 Presentations - WIAS Science day, Wageningen, poster (NZV award) 2009 1.0 - EAAP, Barcelona, Spain, oral 2009 1.0 - ISAE, Uppsala, Sweden, poster 2010 1.0 - WAFL, Guelph, Canada, oral 2011 1.0 - WIAS Science day, Wageningen, oral 2012 1.0 - ISVEE, Maastricht, poster (ELANCO award) 2012 1.0 In-Depth Studies - WIAS course: Use of biomass: food, feed or fuel? 2007 1.5 - WIAS Advanced statistics course: Design of Animal Experiments 2009 1.0 - WIAS Course Statistics for the Life Sciences 2010 2.0 - PE-RC Course Generalized Linear Models 2012 0.6 - PhD Animal Welfare Discussion Group 2010-11 1.2 Professional Skills Support Courses - Project- and Time Management 2011 1.2 - Supervising MSc thesis 2011 1.0 - Techniques for Writing and Presenting Scientific Papers 2011 1.2 - Theater Skills in Education 2011 0.4 Didactic Skills Training - Preparation distance learning course "Animal sciences under a macroscope", WUR 2008 2.0 - Supervision practicals "System Approach in Animal Sciences", WUR 2008 0.4 - Lectures "Animal Production Systems, Issues and Options”, WUR 2008/11 0.4 - Supervision BSc and MSc theses, WUR 2010-13 6.0 - Tutorship "Inleiding Dierwetenschappen", WUR 2010/11 0.6 - Lectures "Omgevingsbewust bouwen", AOC/NHL 2011 0.2 - Lectures "Global & Sustainable Animal Production in the 21st century", WUR 2011/12 0.4 - Training dairy cattle welfare assessment for veterinarians, MUH, Germany 2012 0.8 Management Skills Training - Organization Seminar "Scientific Research in Animal Welfare: Do we make a difference?" 2011 1.0 - Organization WIAS Science Day
2012 1.0
Total 39.0 1 one ECTS credit equals a study load of approximately 28 hours

128 Dankwoord
Dankwoord Een proefschrift schrijven kan je niet alleen. Achter de grote hoeveelheid tekst, getallen en lijnen in dit proefschrift gaan onmisbare bijdragen schuil van een groot aantal mensen. Zonder hen zou dit proefschrift er niet gekomen zijn. Ik ben er trots op dat zoveel mensen samengewerkt hebben om bij te dragen aan de verbetering van het welzijn van melkvee. Allereerst wil ik mijn promotor Imke de Boer bedanken voor haar kennis, bevlogenheid en betrokkenheid bij dit onderzoek. Jouw enthousiasme voor het onderzoek werkt aanstekelijk. Al voor de start van mijn promotietraject heb je me op een gedreven manier alles geleerd over het opzetten, uitvoeren en opschrijven van goed onderzoek. Daarmee is de basis gelegd voor dit proefschrift. Ik ben dan ook heel blij dat je mijn promotor wilde worden. Mijn co-promotor Eddie Bokkers is mijn belangrijkste sparringpartner geweest voor het gedachtegoed achter de studies in dit proefschrift. Het aantal pennen dat ik gedurende de aflopen vier jaar van jou heb ontvreemd is een goede indicator van de mate waarin ik je deur heb platgelopen. Ik ben je erg dankbaar voor je behulpzaamheid, het inzicht en de kennis waarvan je me voorzag bij het opzetten en uitvoeren van dit promotieonderzoek. Ik zie er naar uit onze samenwerking voort te zetten als collega’s bij DPS. Het karakter van het onderzoek in dit proefschrift vereiste kennis van zowel systeembenadering en dierenwelzijn als epidemiologie, welke goed vorm kreeg door de samenwerking met Thomas Dijkstra en Gerdien van Schaik van de Gezondheidsdienst van Dieren. Als co-promotor ben ik Thomas zeer erkentelijk voor het inzetten van zijn veterinaire kennis en zijn pragmatische aanpak bij dit onderzoek, waardoor met de name de observatieperiode een succes werd. Gerdien, jouw kennis van veterinaire epidemiologie en scherpe, praktisch-doch-wetenschappelijke blik was onmisbaar, vooral in de laatste twee jaar van dit onderzoek. Ik ben je erg dankbaar voor onze plezierige samenwerking. Op deze plek wil ik ook graag twee andere mensen bedanken die voor dit promotietraject van bijzonder belang zijn geweest. Akke van der Zijpp wil ik graag bedanken voor haar hulp en vertrouwen in mij om te kunnen uitgroeien tot een goed onderzoeker. Bas Engel is voor mij een mentor geweest tijdens dit promotietraject. Bas, bedankt voor je kundige advies over het statistisch onderzoek in dit proefschrift, en voor je toewijding en enthousiasme waardoor onze samenwerking voor mij erg plezierig was. I am very grateful to the members of the thesis committee, professor Bas Kemp, professor Miriam Nielen, doctor Kees van Reenen, and doctor Isabelle Veissier, for participating in this committee, and for their critical evaluation of this manuscript. Aan de observatieperiode van dit promotieonderzoek heeft een groot aantal personen meegewerkt. Firstly, I would like to thank Christoph Winckler and Lissy Gratzer for providing the 3-day training for observers to apply the Welfare Quality protocol for dairy cattle, as well as their invaluable help and advice in setting up the observational study. Dankzij de ontwikkeling van programmatuur voor de handcomputers door Hans van den Heuvel is de opslag en verwerking van data van de

Dankwoord 129
bedrijfsbezoeken zeer efficiënt verlopen. Ook de medewerkers van proefaccommodatie de Ossekampen en de familie Hulshof in Lievelde wil ik bedanken voor het beschikbaar stellen van hun bedrijf voor de training van de waarnemers. Fons en Ria, ook heel hartelijk dank dat ik in jullie huis in de stilte van het platteland aan mijn proefschrift kon werken! Graag wil ik ook de 196 veehouders bedanken die hun melkveebedrijf openstelden voor dit onderzoek. Zonder hun medewerking was dit onderzoek niet mogelijk geweest. De belangrijkste personen achter de data die gepresenteerd zijn in dit proefschrift zijn de waarnemers die gezamenlijk deze 196 bedrijven hebben bezocht in de winter van 2009/2010: Thomas Dijkstra, Anton Gosselink, Hans Miltenburg, Fokje Steenstra, Rik Vlemminx, en Jan van Vliet. Er zijn heel wat lange dagen, bevroren tenen, en slaapverwekkende gedragsobservaties aan voorafgegaan om aan deze grote hoeveelheid data te komen. Dank voor jullie geweldige inzet en doorzettingsvermogen! Fokje, bedankt ook nog voor je hulp bij het ontwikkelen van de interviews, de lay-out van het proefschrift en je bijdrage aan het gedachtegoed achter dit proefschrift door onze discussies en gezamenlijke begeleiding van studenten. Bij de Gezondheidsdienst voor Dieren ben ik Henriëtte Brouwer zeer dankbaar voor haar uitleg over de bedrijfskengetallen die zijn gebruikt voor het onderzoek in dit proefschrift, en het opvragen en bewerken daarvan. Jouw eerste adviezen voor dit project waren erg waardevol voor de uitkomsten die hier in dit proefschrift staan beschreven! Graag wil ik ook Wim Swart en Ingrid den Uijl bedanken voor het meedenken over dit onderzoek en voor hun statistische adviezen die mij, vooral in de beginfase, goed in het zadel hebben geholpen. Bedankt! Onmiskenbaar is ook het vriendelijke onthaal, de hulp en gezelligheid van de andere dames op de ‘epi-kamer’: Anouk, Inge en Maaike, bedankt! Verschillende mensen hebben mij geholpen met de analyses van de data die zijn verzameld tijdens de observatieperiode. I am very grateful to Raphaelle Botreau for her help in building and understanding the Welfare Quality multicriteria evaluation model, as well as her help in writing and interpretation of results in the final paper. Ik wil Jac Thissen danken voor het bouwen van het Welfare Quality model in Genstat, en Willem Buist voor zijn hulp bij het opzetten en interpreteren van de risico analyses. Ook wil ik de studenten die met de data van dit onderzoek hebben gewerkt bedanken voor hun enthousiasme en de inzichten die door hun werk zijn verkregen: Margret, Marike, Fleur, Erwin, Ep, Evie, Rik, Ilse, Koen en Jerome. I would like to thank Mike Grossman, who taught me the art of scientific writing, for his contribution to the quality of this manuscript and to the brevity of the title! Linda Koenis wil ik bedanken voor haar hulp met de lay-out, en Bart de Gouw voor zijn inspanningen en goede samenwerking voor het cover design en de foto’s in dit proefschrift. Mijn vrienden Ryan en Sarah, fijn dat ik met jullie kon sparren over de stellingen! Graag wil ik ook de familie Thybaut uit Bedum bedanken. Bij jullie op het bedrijf heb ik in mijn jeugd een belangrijke basis gelegd voor mijn passie en kennis van het boerenbedrijf, dank daarvoor!

130 Dankwoord
Aan het begin van mijn promotietraject had ik me voorgenomen om het dankwoord hierbij te laten. Al snel bleek echter dat het onmogelijk was om een promotietraject en privéleven gescheiden te houden. Collega’s werden vrienden en vormden een warme, inspirerende werkomgeving waarin ik me erg thuis voelde. Collega’s van Dierlijke Productiesystemen – alle AIO’s, Eddie, Erwin, Fokje, Henk, Imke, Theo, Simon en Ymkje - heel erg bedankt voor jullie motivatie, steun en gezelligheid! Ymkje, door jou heb ik me vanaf dag 1 bij DPS zeer welkom gevoeld, en dat gevoel is nooit meer verdwenen. Yo men, oudere AIO-collega’s Heleen, Corina, en Laura. Met jullie is het AIO zijn een vreugde. De simpele uitspattingen in de gezellige AIO kamer (“nou-ja-zeg!”), onderonsjes met Heleen, polonaises bij een geaccepteerd paper, maar ook het enthousiasme voor het vak zoals dat zich uitte in de AIO-avondjes, midterm proposition parties, vrijdagmiddagborrels en “turkish pizza” etentjes. De afgelopen vier jaar kende veel ups maar ook downs, waarbij ik in verschillende vormen veel steun heb gevonden bij veel lieve vrienden. Was het in niet in ontspanning of sport, dan was het wel een motiverende discussie over de inhoud van ons werk of een schouder om op te huilen. In het bijzonder wil ik Lucie en Judith noemen, vanwege onze oneindige vriendschap en het dagelijks aanbellen . Ynte, door jouw enthousiasme en betrokkenheid was het logisch dat jij mijn paranimf werd! Lieve papa en mama, jullie hebben me een brede belangstelling, ijzersterk doorzettingsvermogen en een gezonde dosis noordelijke nuchterheid meegegeven waardoor ik zo ver kon komen. Terwijl ik regelmatig achter mijn laptop verdween stonden jullie altijd voor me klaar. Ik vind het bijzonder en ben ontzettend blij dat jullie er allebei op mijn promotiedag zijn. Mijn lieve broer Stefan, die altijd achter mij staat, staat op mijn promotiedag naast mij. Ik ben ontzettend trots dat jij mijn paranimf bent! Een speciaal woordje ook voor Senne, die mij de wijsheid gegeven heeft dat niet alles nuttig en diepgaand hoeft te zijn. Maris, met jouw geduld, onvoorwaardelijke steun, begrip, rust, en humor ben jij mijn perfecte tegenwicht geweest in deze tijd. Vanaf nu hoeven we geen datum meer te noemen!
Marion

Colophon 131
Colophon The research described in this thesis was financially supported by the Animal Health Service Deventer Cover design and pictures by Bart de Gouw and Marion de Vries Printed by GVO drukkers & vormgevers B.V. | Ponsen & Looijen, Ede, the Netherlands © M. de Vries, 2013

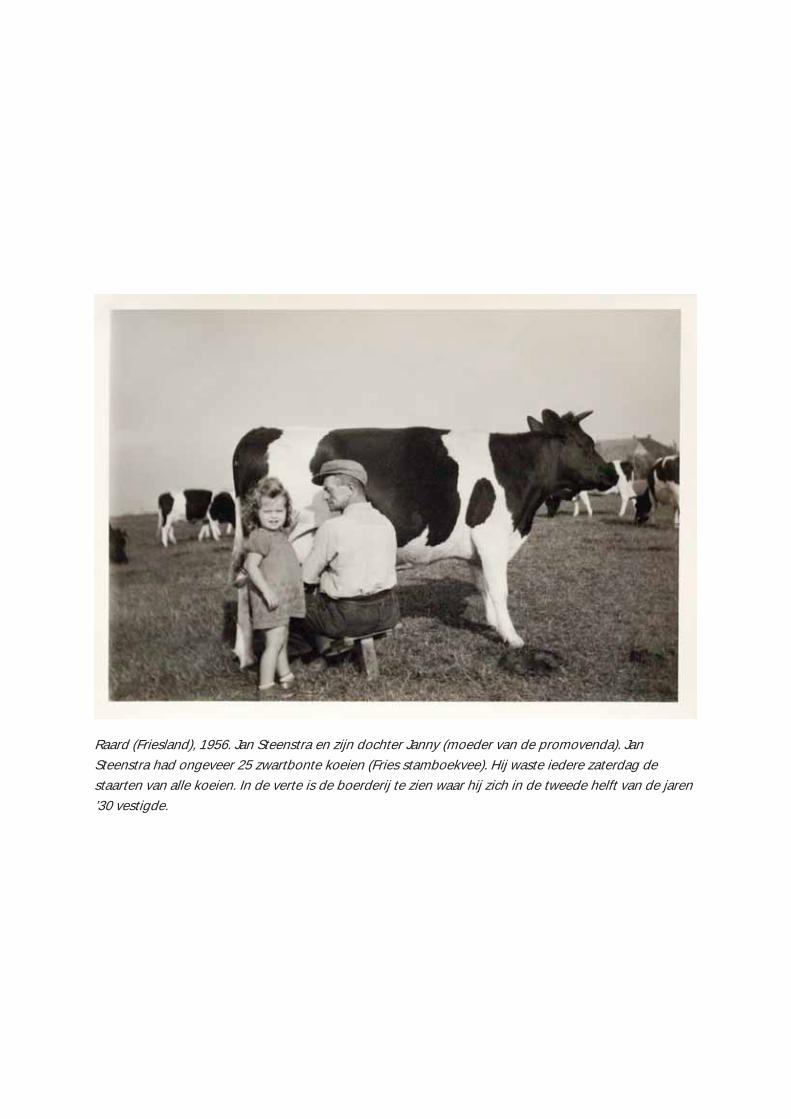
Raard (Friesland), 1956. Jan Steenstra en zijn dochter Janny (moeder van de promovenda). Jan Steenstra had ongeveer 25 zwartbonte koeien (Fries stamboekvee). Hij waste iedere zaterdag de staarten van alle koeien. In de verte is de boerderij te zien waar hij zich in de tweede helft van de jaren ’30 vestigde.


