ASSURING VIRTUAL NETWORK RELIABILITY AND RESILIENCE By Baker Alrubaiey This thesis submitted in total fulfilment of the requirements for the degree of Doctor of Philosophy School of Information Technology Faculty of Science, Engineering and Built Environment Deakin University June 2016
Transcript
ASSURING VIRTUAL NETWORK RELIABILITY AND RESILIENCE
By
Baker Alrubaiey
This thesis submitted in total fulfilment of the requirements for the degree of
Doctor of Philosophy
School of Information Technology Faculty of Science, Engineering and Built Environment
Deakin University
June 2016
sfol
Retracted Stamp
sfol
Retracted Stamp
Acknowledgments
Acknowledgments
I would like to express my sincere gratitude to my supervisor Professor Jemal Abawajy for his
patience, motivation, enormous knowledge and continuous support throughout my PhD
studies. His assistance helped me in all aspects of the research and writing of this thesis.
I would like to thank my family for their continued spiritual support of me throughout
my PhD studies, writing this thesis and my life in general. In particular, my heartiest thanks to
my wife Hadeel and my daughters Russel and Youser for their support and patience while I
was busy with my studies.
Last, but not the least, I thank my God (ALLAH) for allowing me to finish my degree
and helping me with the difficulties throughout my PhD studies.
i
Publications
Publications
The following papers that I either authored or co-authored have been published or are currently
under consideration for publication. These papers are reprinted in this dissertation with the full
permission of all co-authors.
Journals
1. B. Alrubaiey and J. Abawajy. “Virtual networks dependability assessment framework.”
Int. J. High Performance Computing and Networking, 2016 in press
Conference Papers
2. B. Alrubaiey and J. Abawajy. “Prediction of Virtual Networks Substrata Failures.” In
The 6th IEEE International Conference on Big Data and Cloud Computing (BDCloud
2016) - Accepted 20-8-2016.
3. B. Alrubaiey and J. Abawajy. Failure Prediction in Virtual Network Infrastructures
Using Support Vector Regression and Time Series, the Second International
Symposium on Dependability in Sensor, Cloud, and Big Data Systems and
Applications (DependSys2016)- Accepted 25-8-2016.
4. B. Alrubaiey and J. Abawajy. “Failure Detection in Virtual Network Environment.” In
26th International Telecommunication Networks and Applications Conference
(ITNAC)-Accepted 12-9-2016.
5. B. Alrubaiey, M. Chowdhury, A. Sajjanhur 2013, “Smart Interactive Advertising
Board,” in IEEE 2013. 2013 Second IIAI International Conference on Advanced
Applied Informatics. Proceedings, Matsue, Japan 2013 pp. 312–317.
ii
Publications
Book Chapter
6. B. Alrubaiey, M. Chowdhury, and A. Sajjanhar. “Intelligent Billboard Based on
Ambient System (IBBAS).” In Applied Computing and Information Technology, pp.
1-17. Springer International Publishing, 2014.
iii
Abstract
Abstract
Network virtualisation is an enabling technology that will allow the future Internet to overcome
the obstacles of the current Internet to architecture change. The future Internet architecture will
be separated into virtual networks that can concurrently run network services and architectures
over a shared substrate network. Although virtual networks offer enormous advantages in terms
of cost and accessibility, virtual networks are vulnerable to failure due to different factors.
Therefore, reliability in a virtual network environment (VNE) is an important issue that needs
to be addressed before a virtual network can be used. The aim of this thesis was to improve the
virtual network reliability by designing a reliable VNE that can operate normally, even in the
event of link or node substrate failure. A framework developed that uses reliability block
diagrams and continuous-time Markov chains to model and analyse the reliability and
availability of a VNE. The framework can be used for the design and construction of more
reliable VNE. In addition, to minimise the unpredicted failures and reduce the impact of failure
on a virtual network, a dynamic solution proposed for detecting a failure before it occurs in the
VNE. The detection mechanism is based on a conservative time-synchronisation algorithm
with a message passing interface. Moreover, to predict failure and establish a tolerable
maintenance plan before failure occurs in the VNE, a failure prediction method developed
based on time series and support vector regression models. The proposed prediction mechanism
for VNE can be used to minimise the unpredicted failures, reduce backup redundancy and
maximise system performance. The results show that the framework can use reliability as a
level of a service required by the client to allocate resources for virtual networks according to
the quality of service. A framework for evaluating reliability and availability achieved high
performance compared with previous work. In addition, the failure detection mechanism
showed a very small number of messages exchanged in event of failure. Our approach achieved
iv
Abstract
a high performance compared with previous work in the detection of failure in VNE. Finally,
the failure prediction method achieved very high accuracy in prediction the future failures in
VNE because the predicted results were very close to the observed values.
v
Abstract
Table of Contents Acknowledgments ............................................................................................................................................... i Publications ......................................................................................................................................................... ii Abstract ............................................................................................................................................................... iv Table of Contents .................................................................................................................................................. vi List of Figures ...................................................................................................................................................viii List of Tables....................................................................................................................................................... ix Abbreviations ..................................................................................................................................................... x Chapter 1: Introduction............................................................................................................................... 1
1.1. Background ......................................................................................................................................... 1 1.2. Thesis Aims.......................................................................................................................................... 2 1.3. Motivation............................................................................................................................................ 3 1.4. Research Problems and Major Contributions.................................................................................. 6
1.4.1. Handling Substrate Link Failures................................................................................................. 7 1.4.2. Handling Substrate Node Failures ................................................................................................ 7 1.4.3. Handling Correlated Substrate Link and Node Failures ............................................................ 8
1.5. Significance of Contributions............................................................................................................. 8 1.6. Research Methodology ....................................................................................................................... 9 1.7. Thesis Organisation .......................................................................................................................... 12
2.2.1. Internet In a Slice Architecture ................................................................................................... 16 2.2.2. CABO Architecture of Future Internet ...................................................................................... 17 2.2.3. AGAVE.......................................................................................................................................... 18 2.2.4. FEDERICA ................................................................................................................................... 18
2.3. Review of Reliability of Virtual Network Due to Substrate Link Failure .................................... 19 2.4. Review of Reliability of Virtual Network Due to Substrate Node Failure ................................... 25 2.5. Review of Reliability of Virtual Network Due to Substrate Link and Node Failures ................. 29
3.2.1. System Model ................................................................................................................................ 37 3.2.2. Problem overview ......................................................................................................................... 38
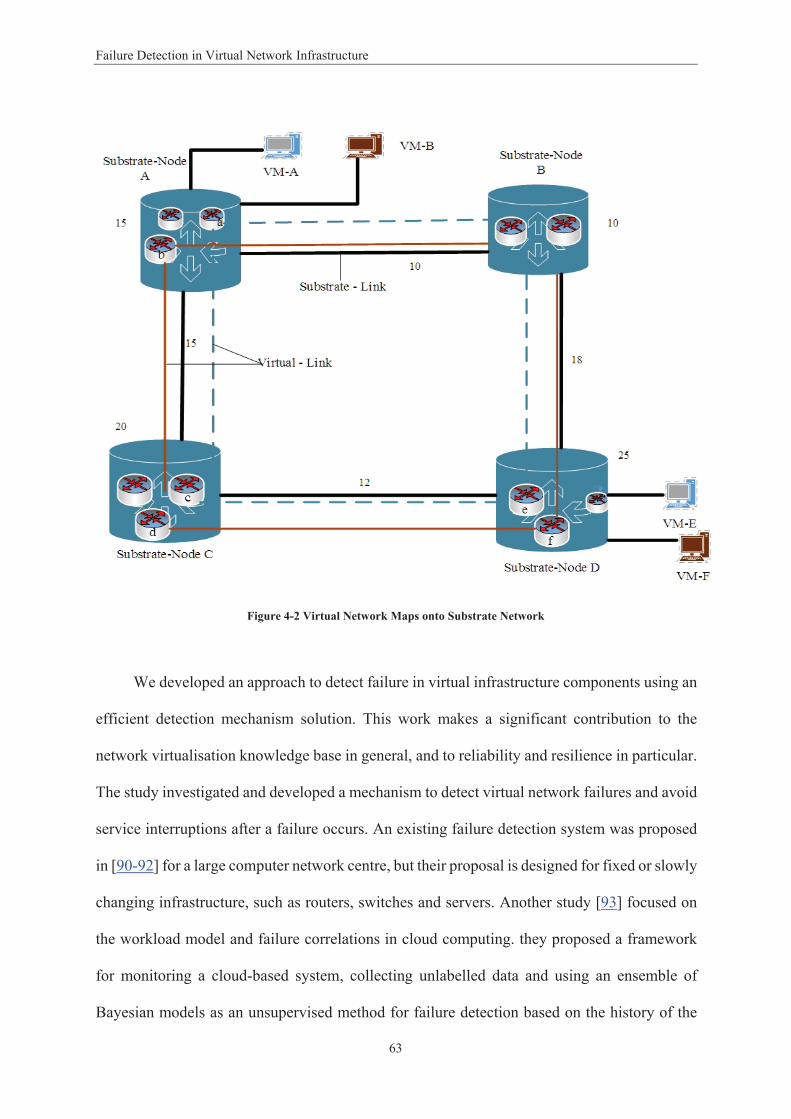
4.1. Introduction....................................................................................................................................... 59 4.2. Problem Overview............................................................................................................................. 61 4.3. System Model .................................................................................................................................... 64
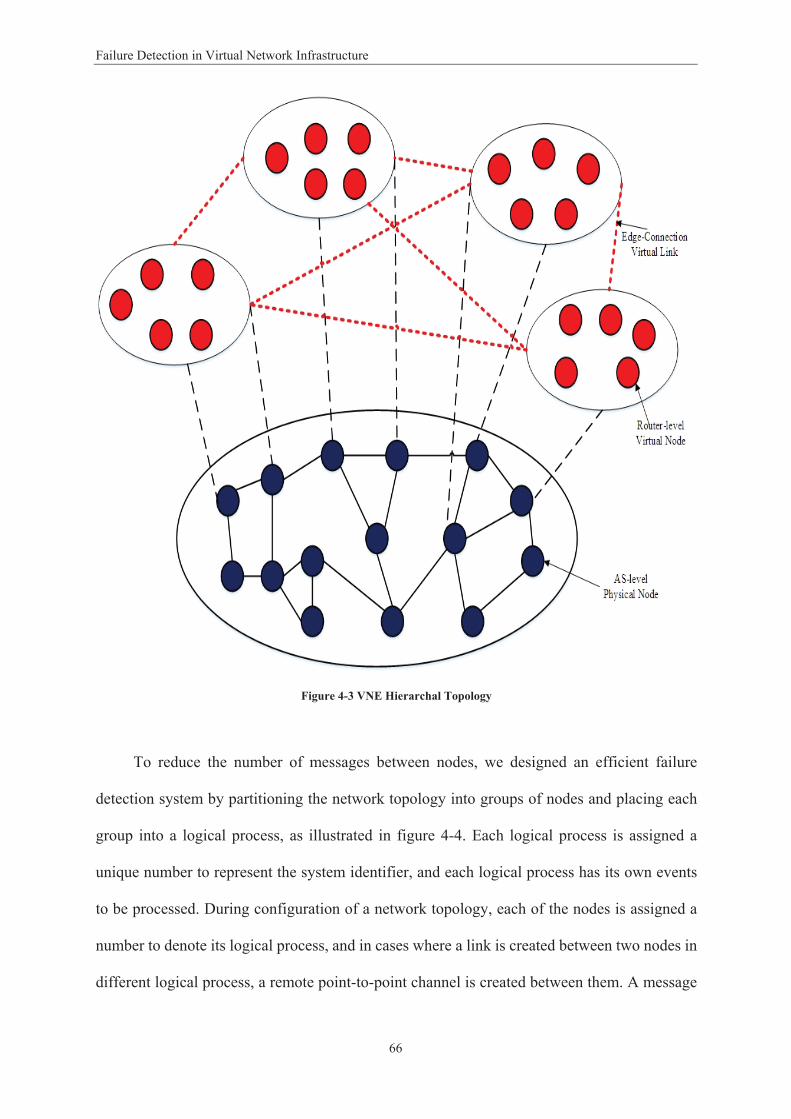
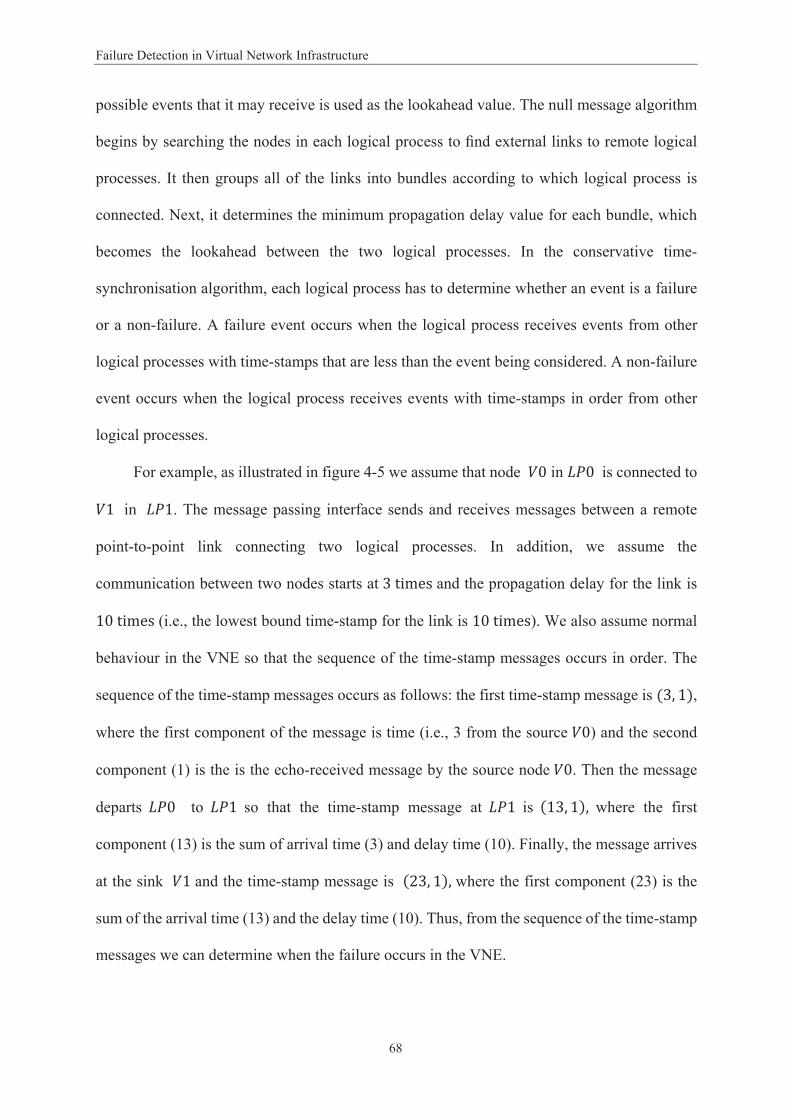
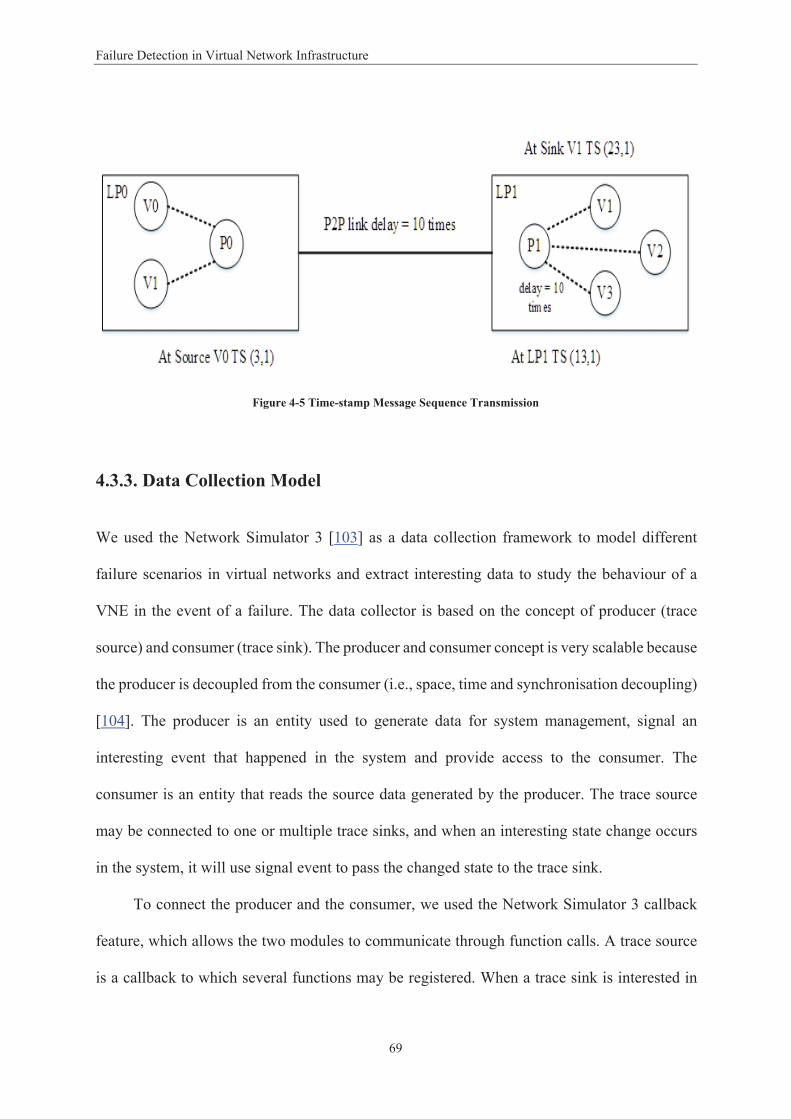
4.3.1. VNE Topology ................................................................................................................................... 65 4.3.2. Fault Detection Model ........................................................................................................................ 67 4.3.3. Data Collection Model........................................................................................................................ 69 4.3.4. Metrics Used....................................................................................................................................... 70
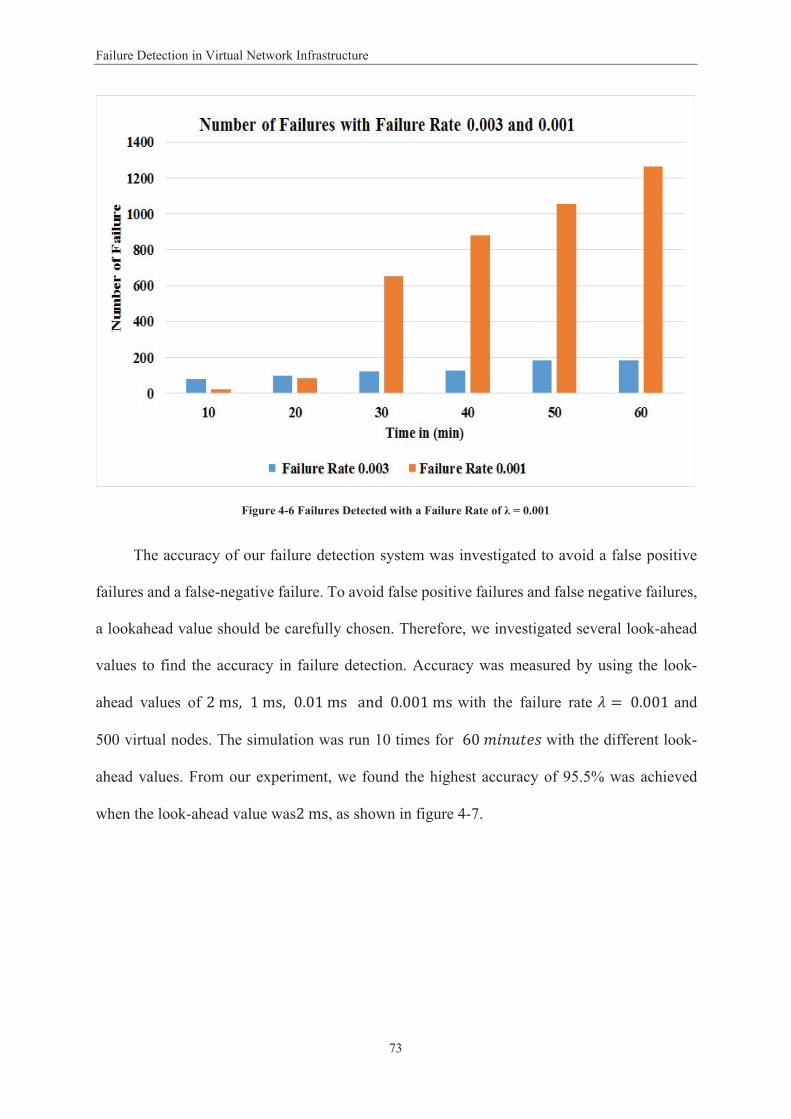
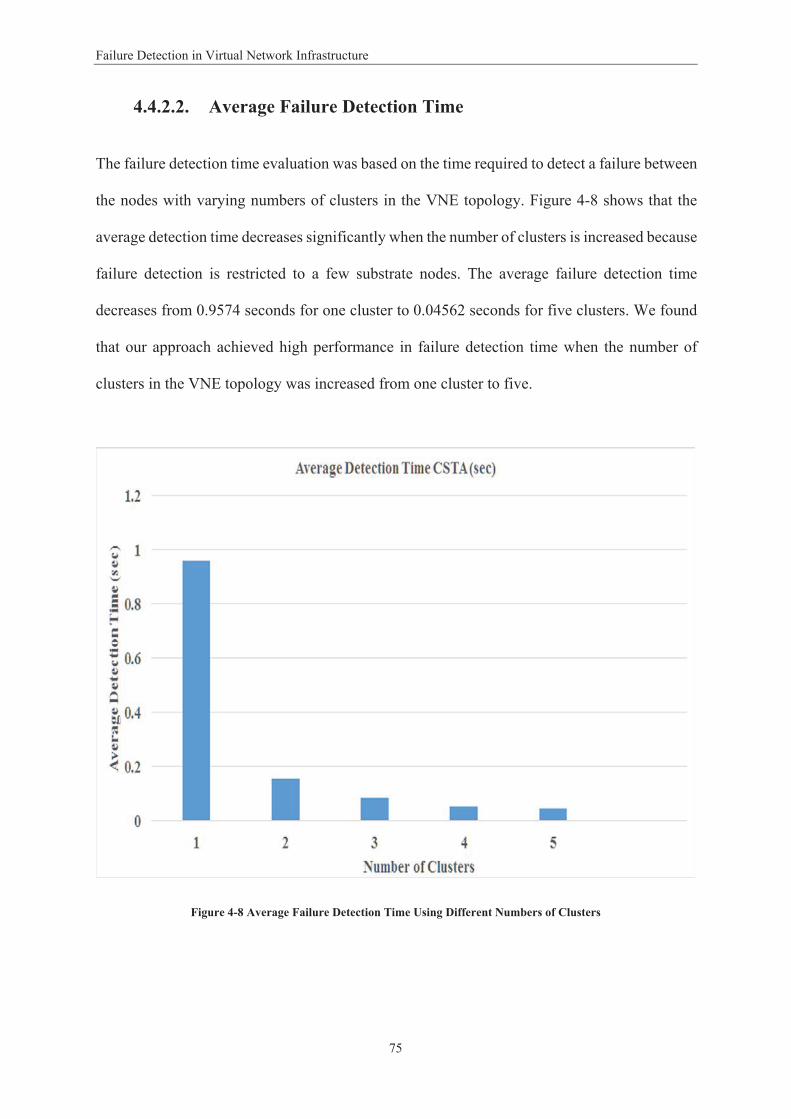
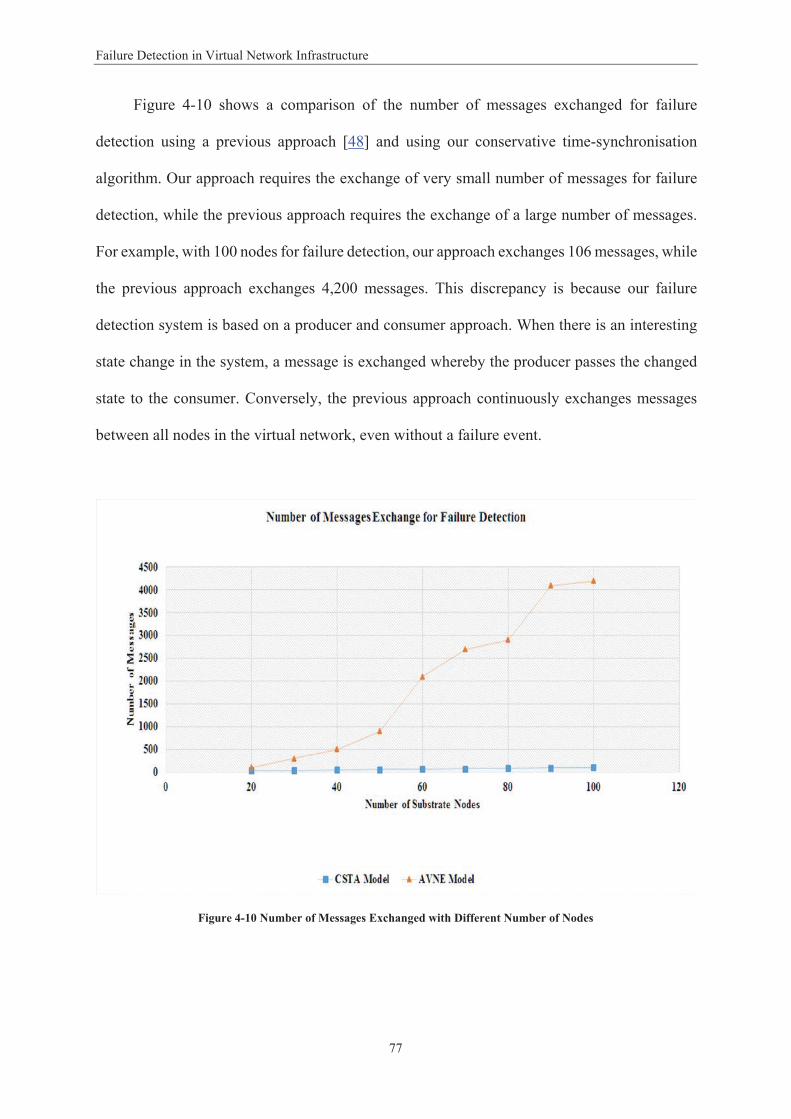
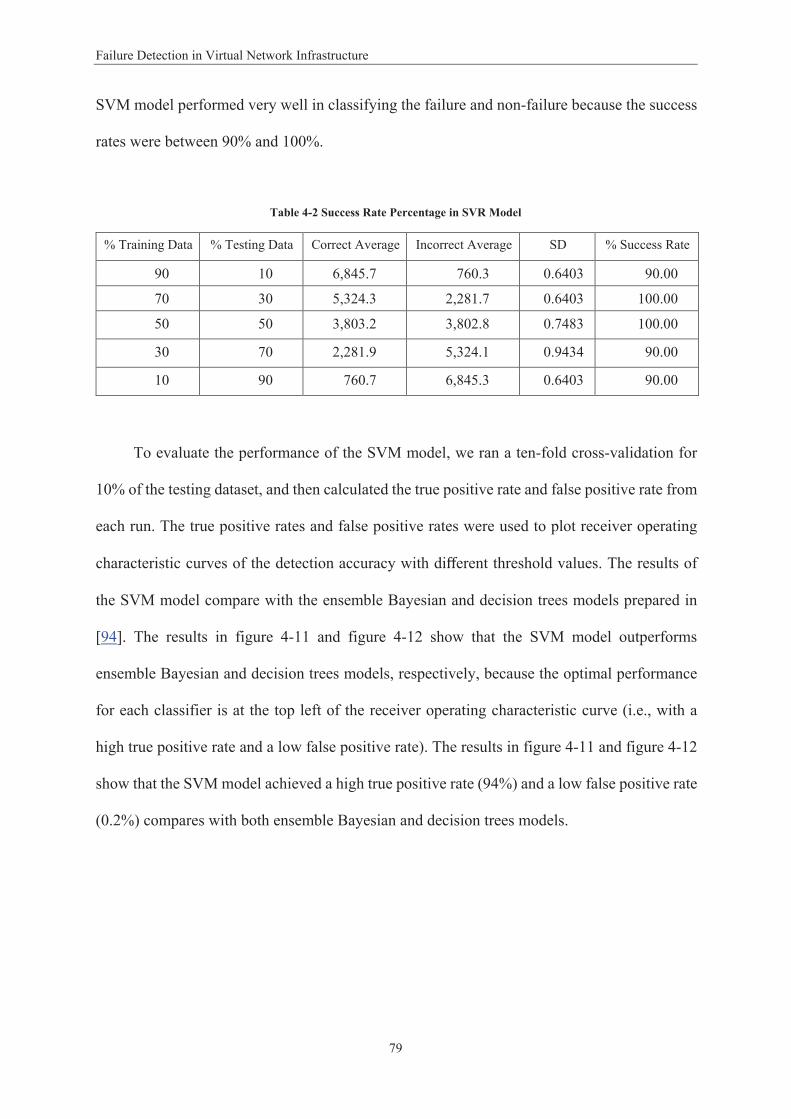
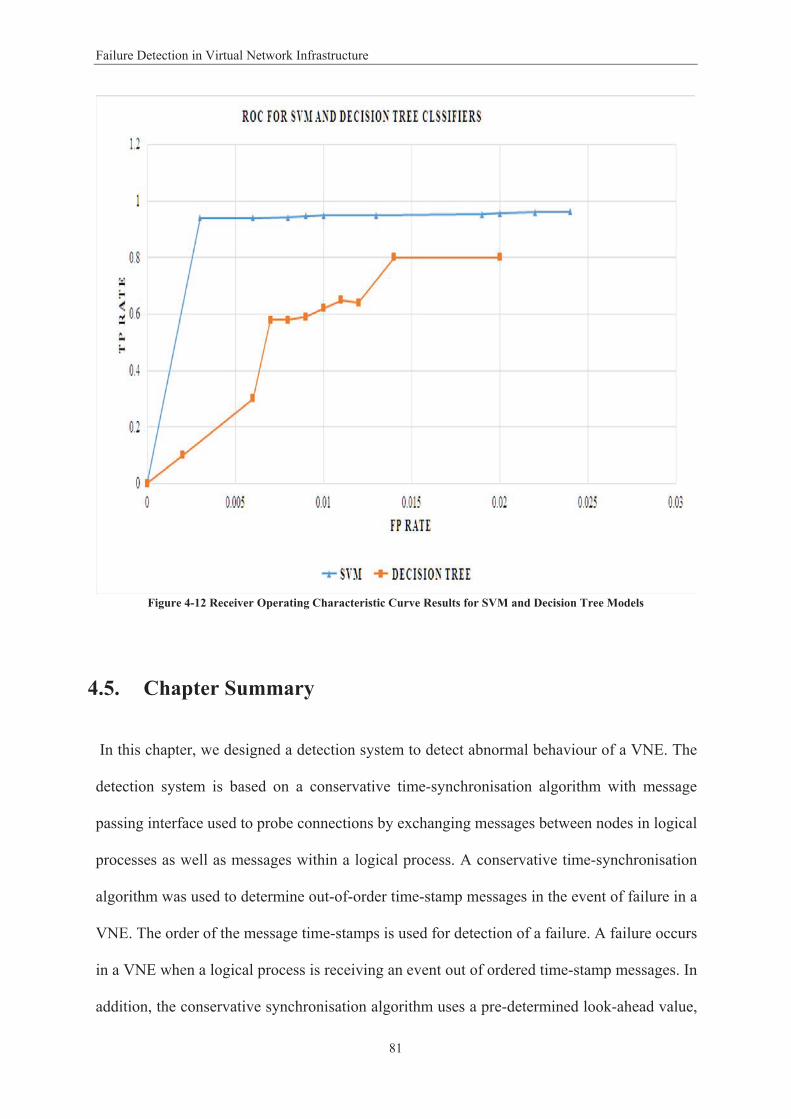
4.4. Performance Analysis ....................................................................................................................... 71 4.4.1. Experimental Set-up ..................................................................................................................... 71 4.4.2. Results and Discussion ................................................................................................................. 71 4.4.2.1. Accuracy.................................................................................................................................... 72 4.4.2.2. Average Failure Detection Time ............................................................................................. 75 4.4.2.3. Average Number of Messages Exchanged.............................................................................. 76 4.4.3. SVM Model Detection Results ..................................................................................................... 78
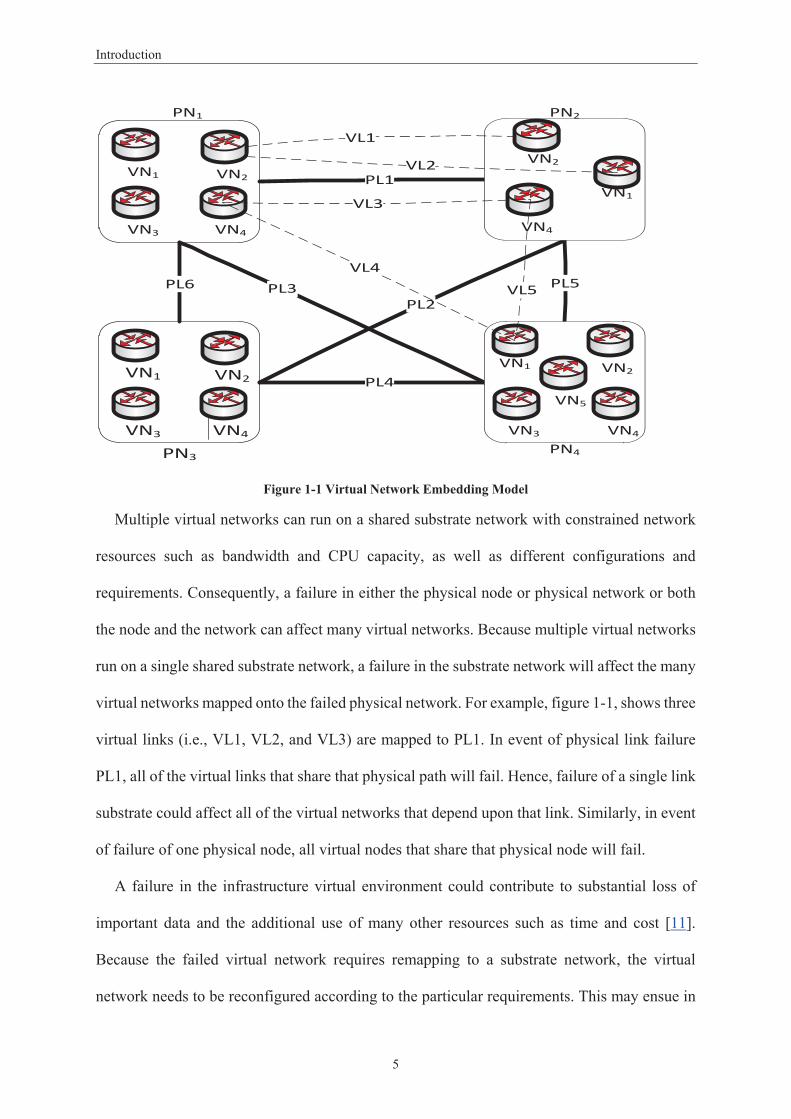
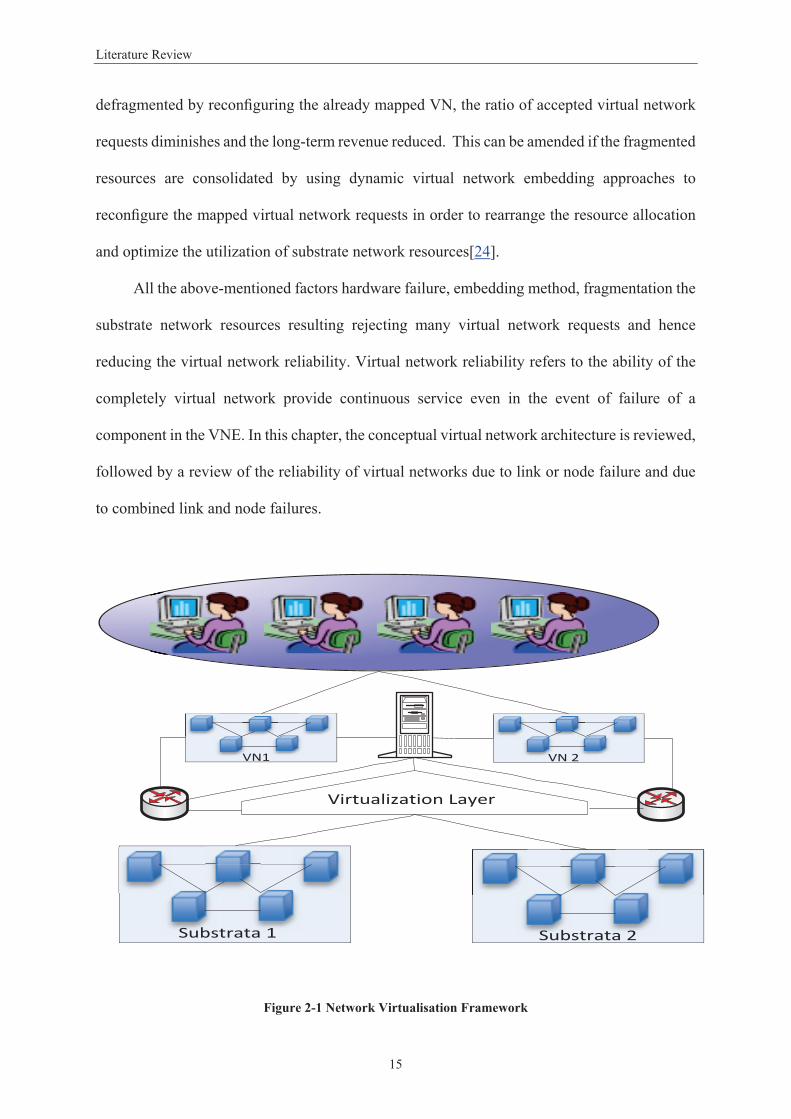
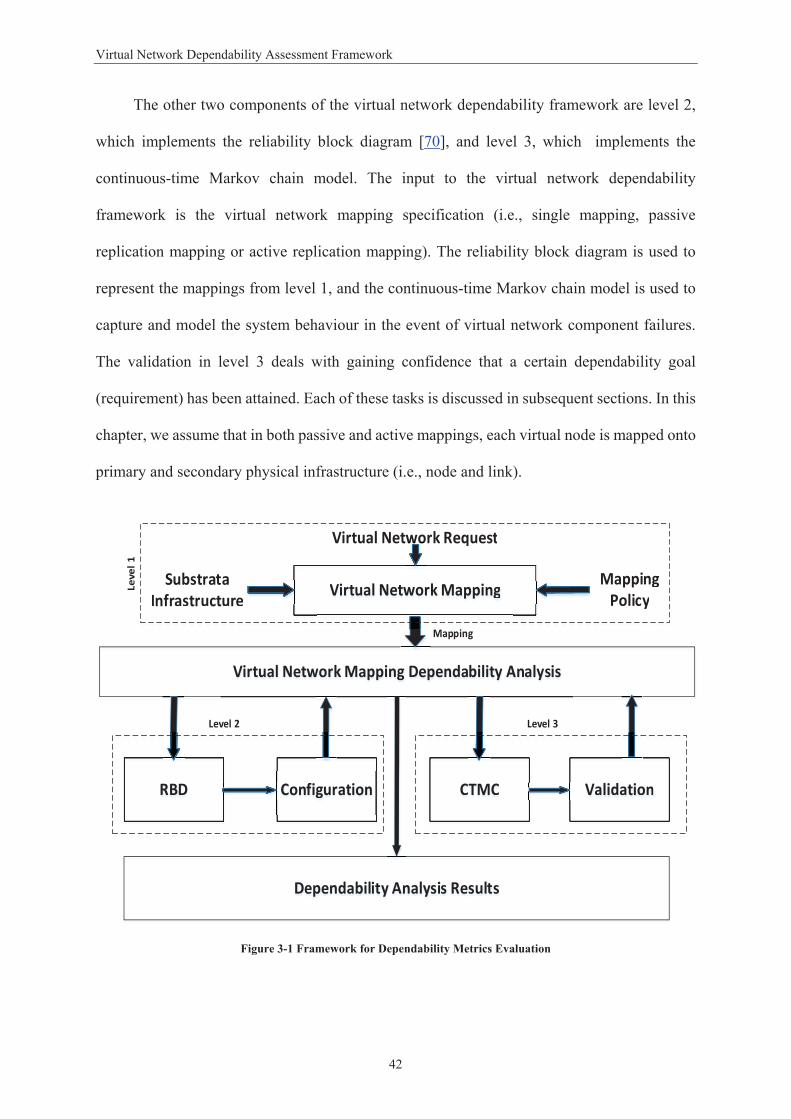
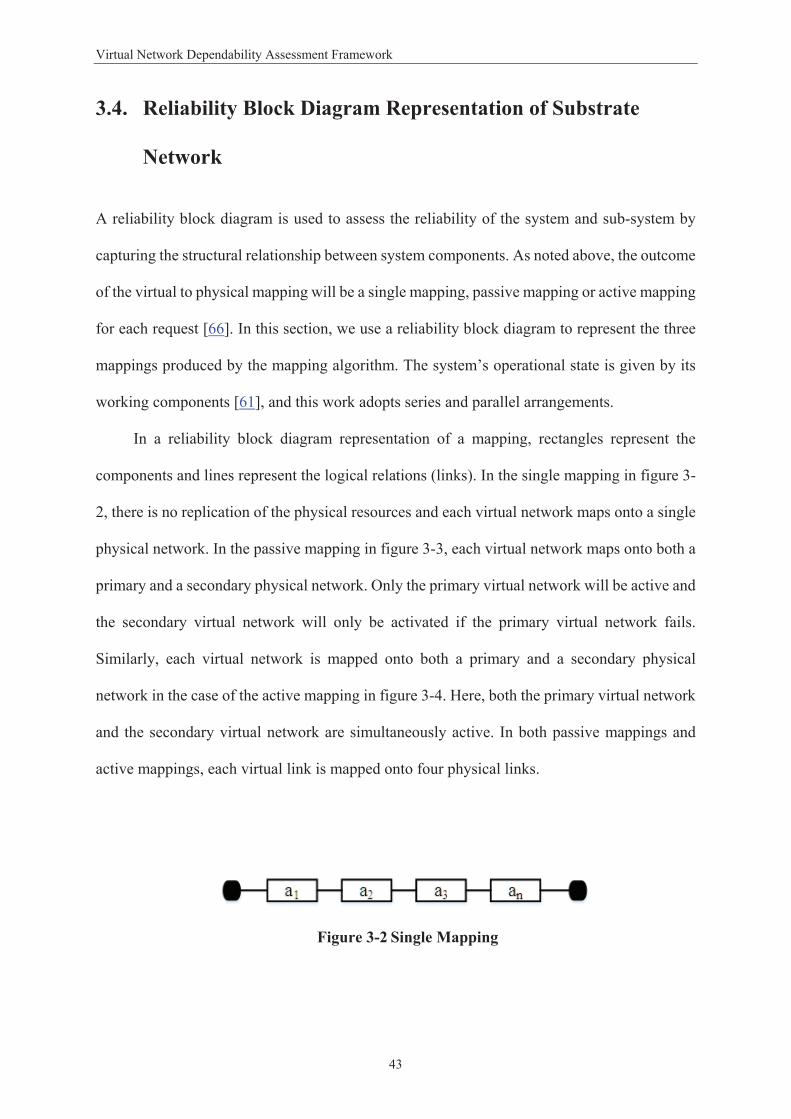
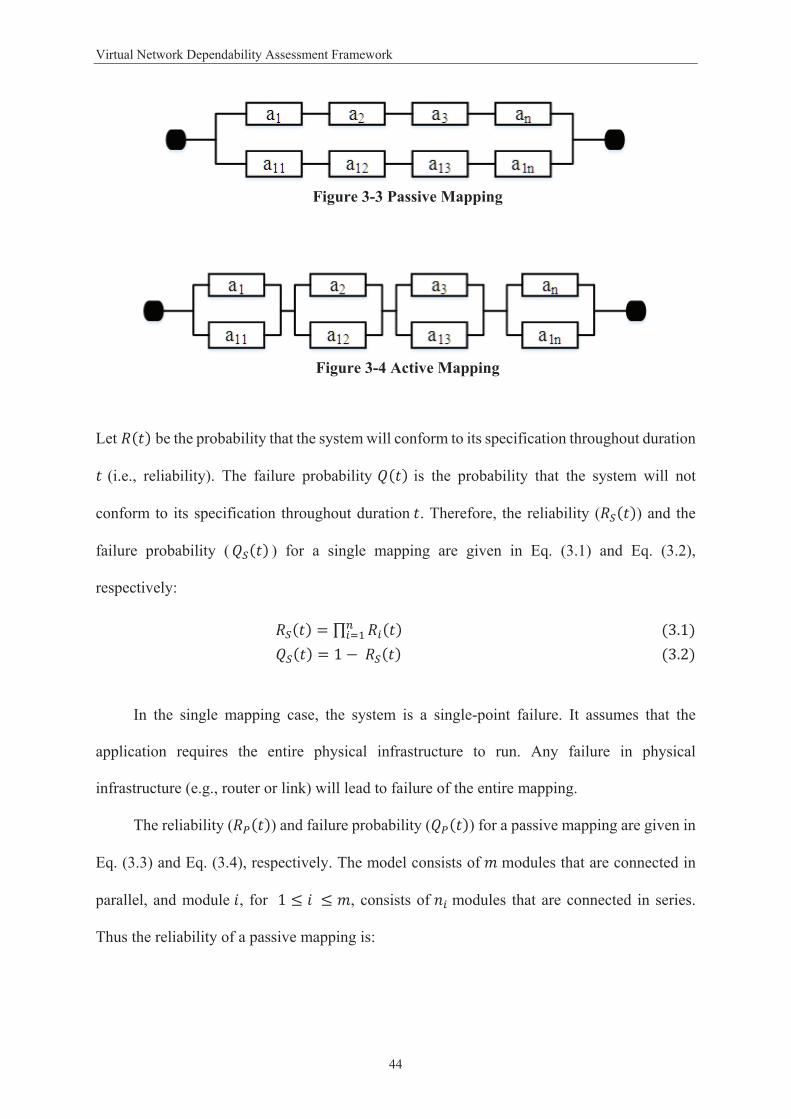
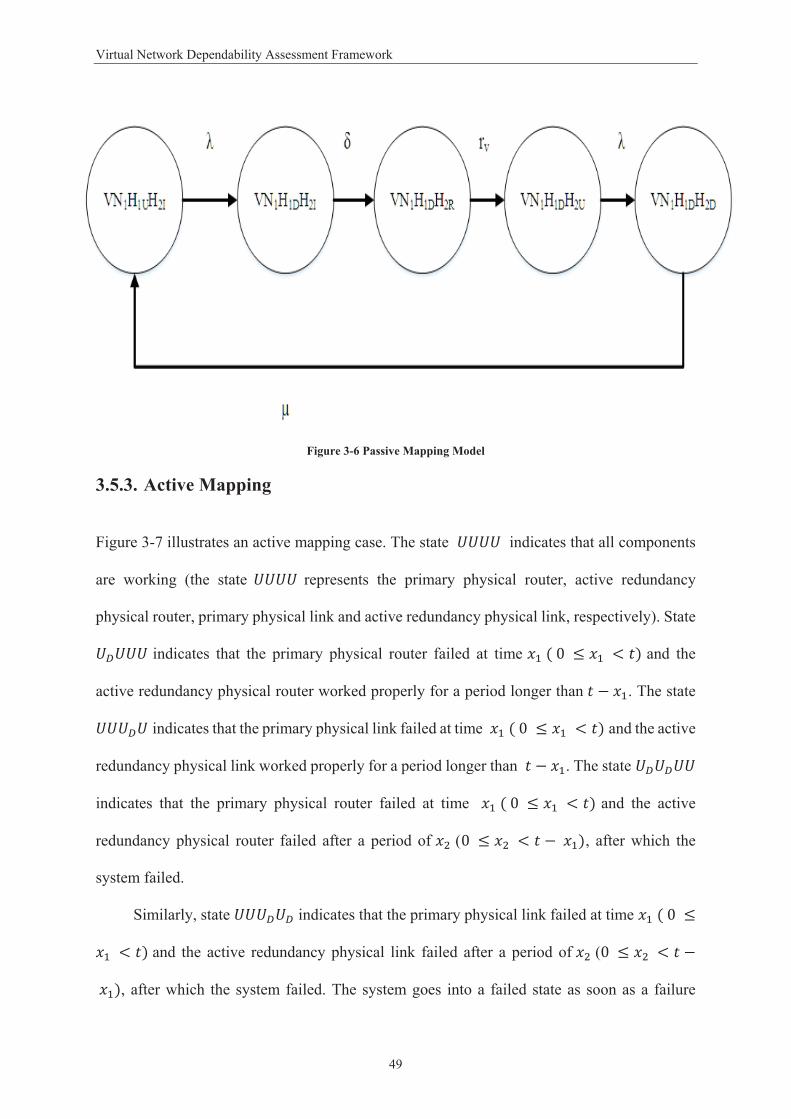
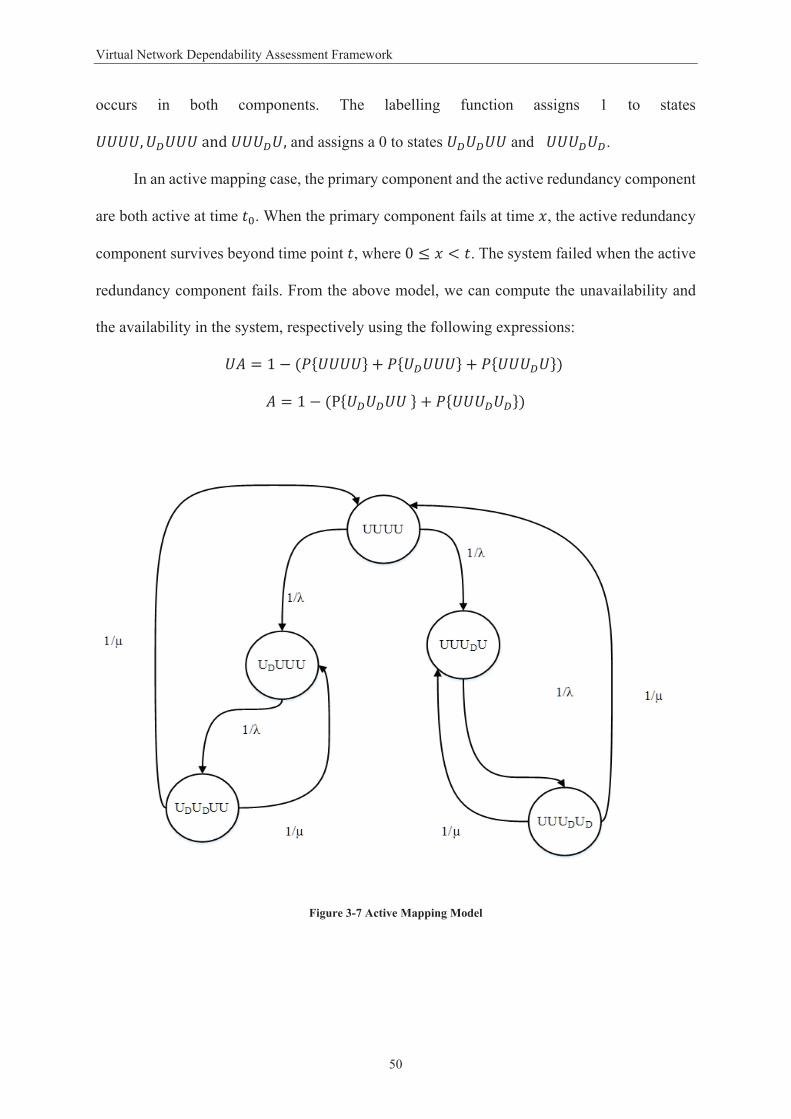
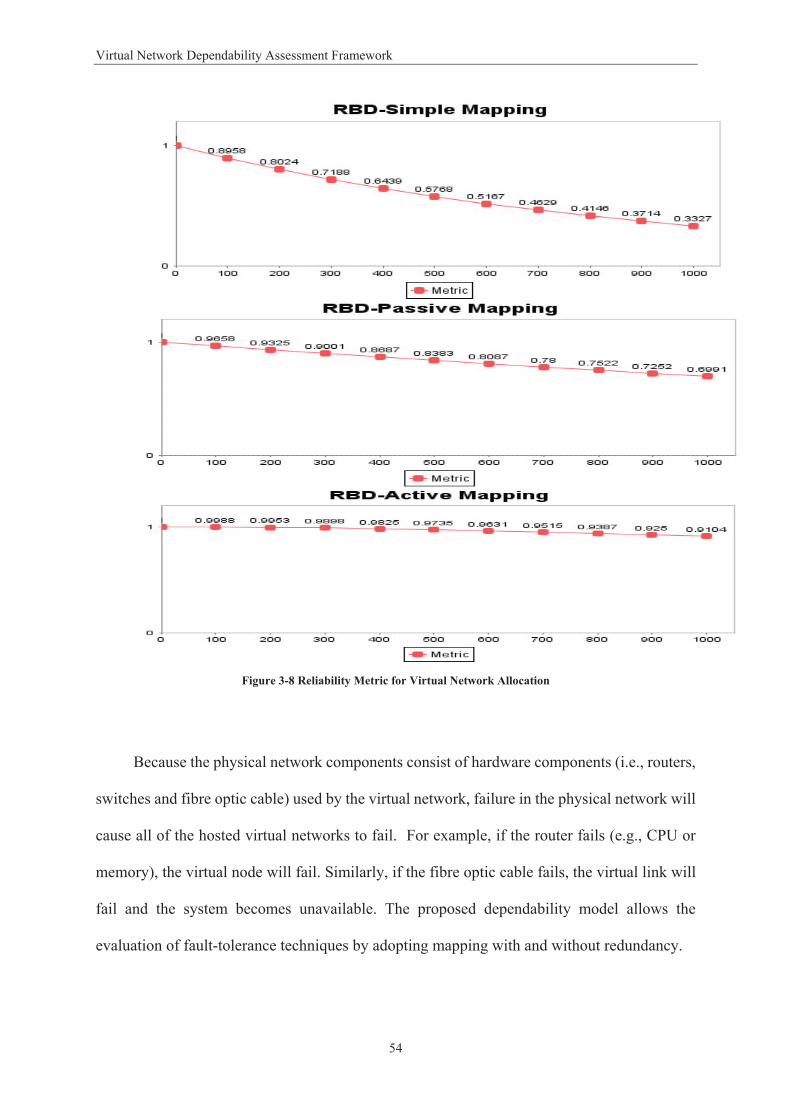
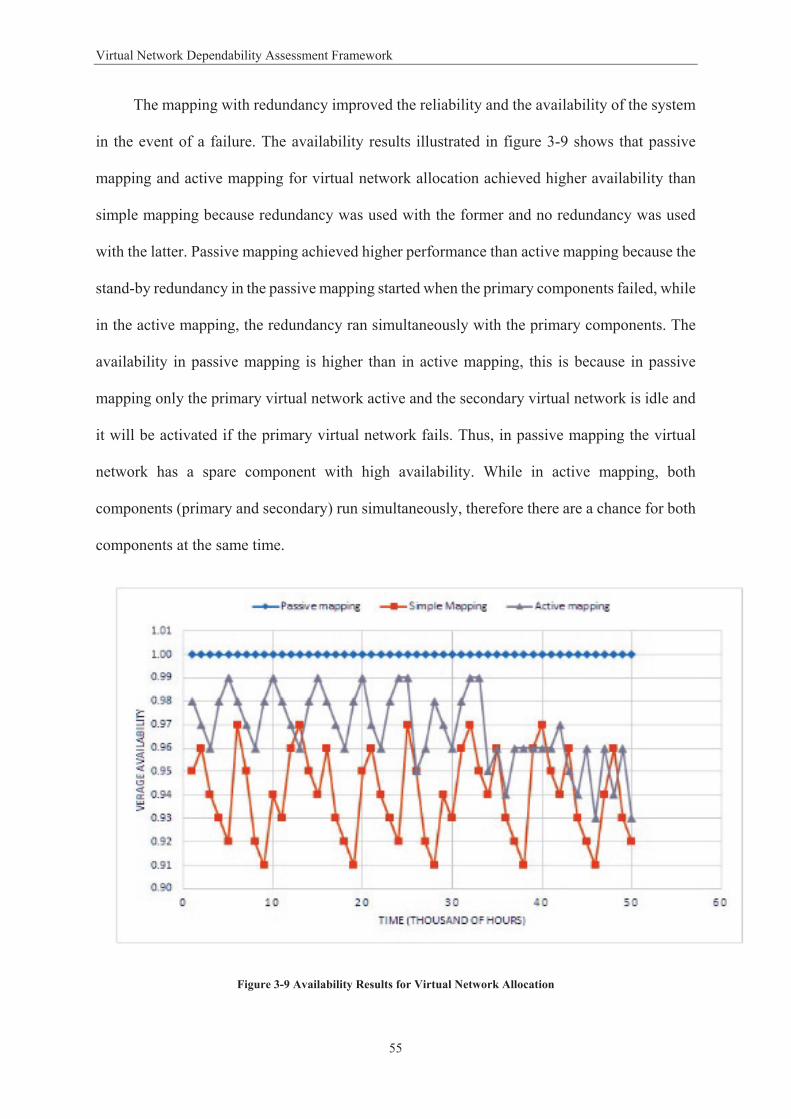
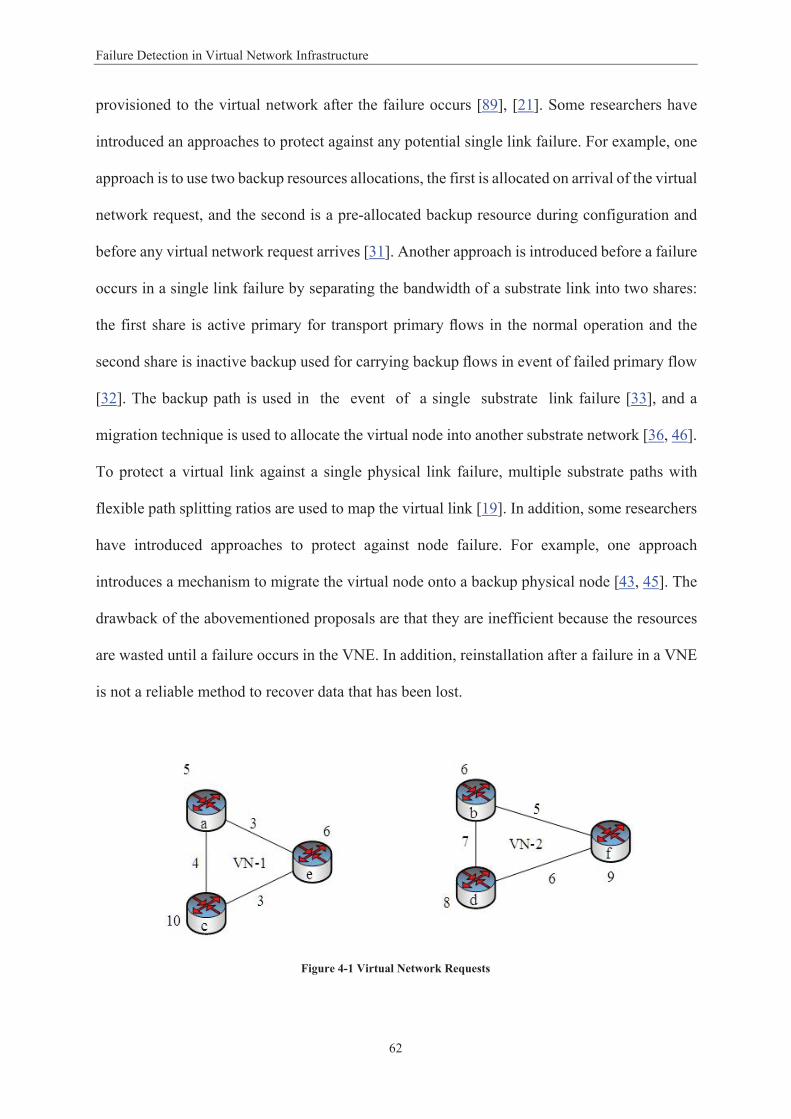
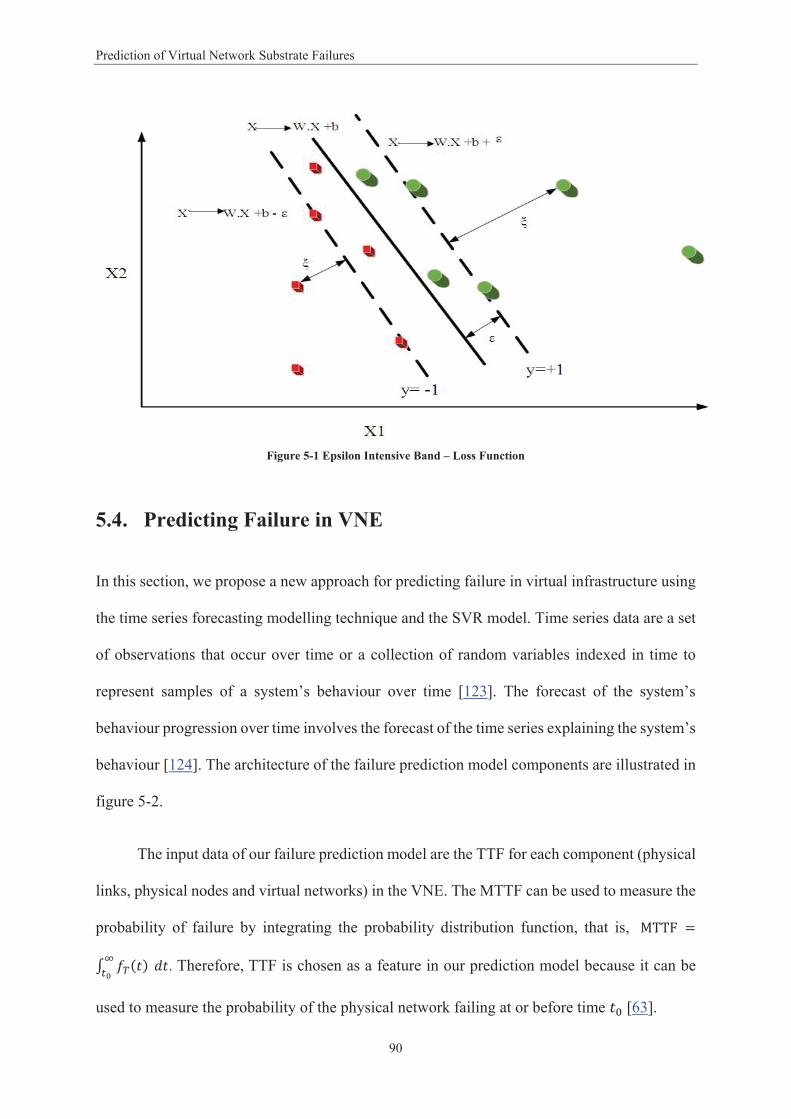
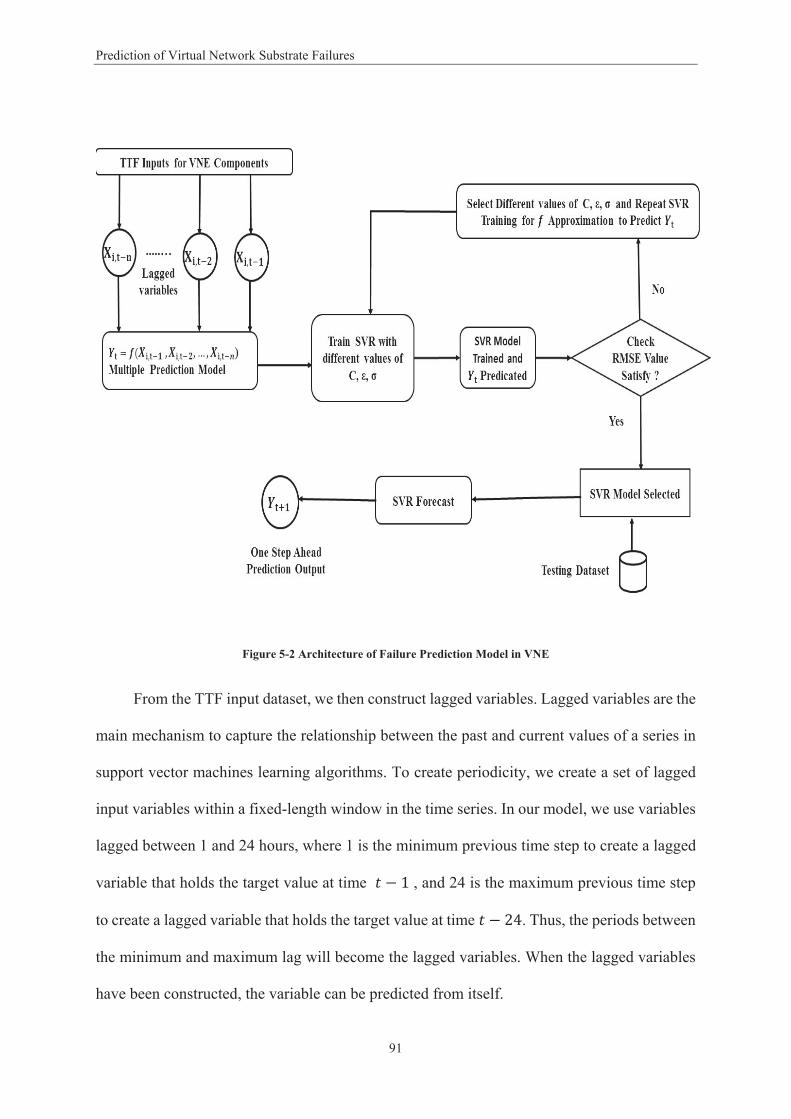
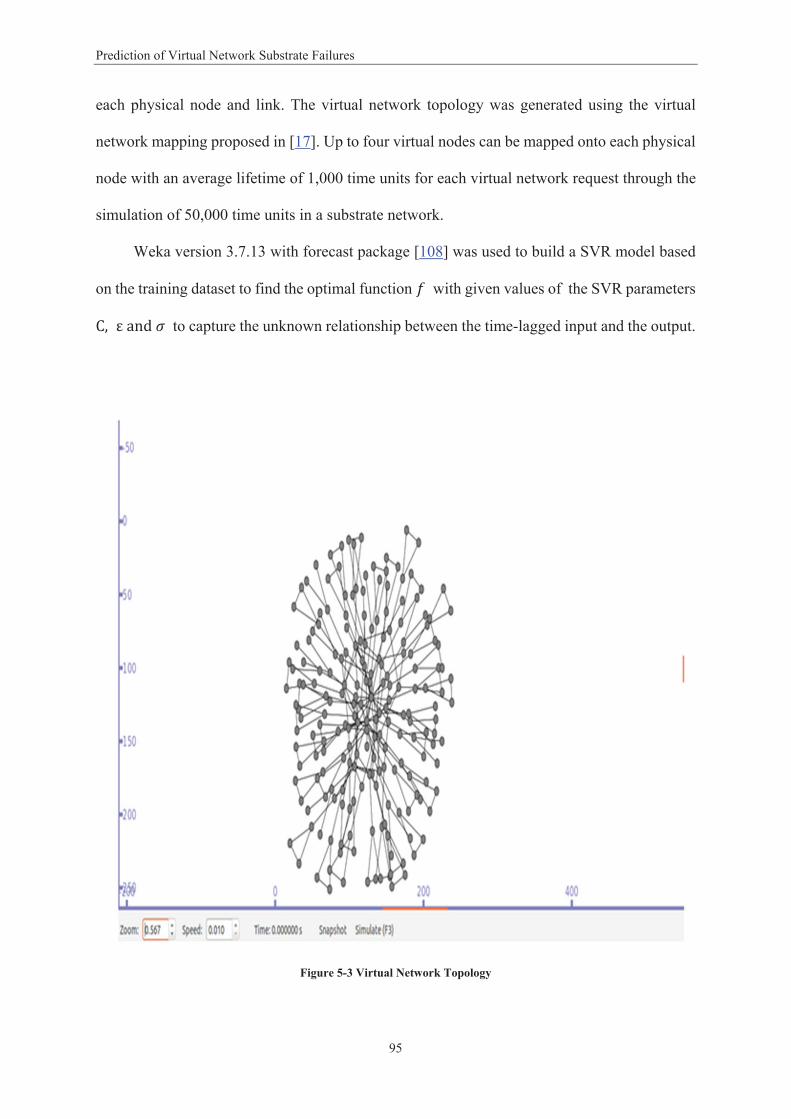
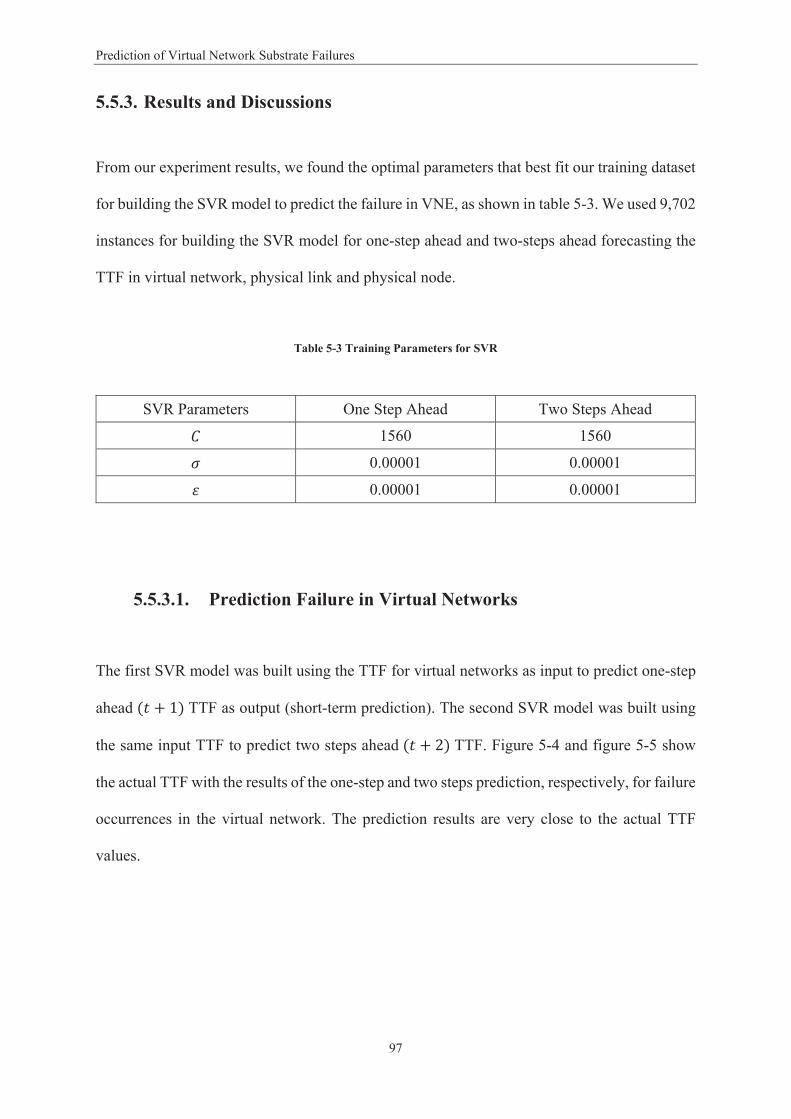
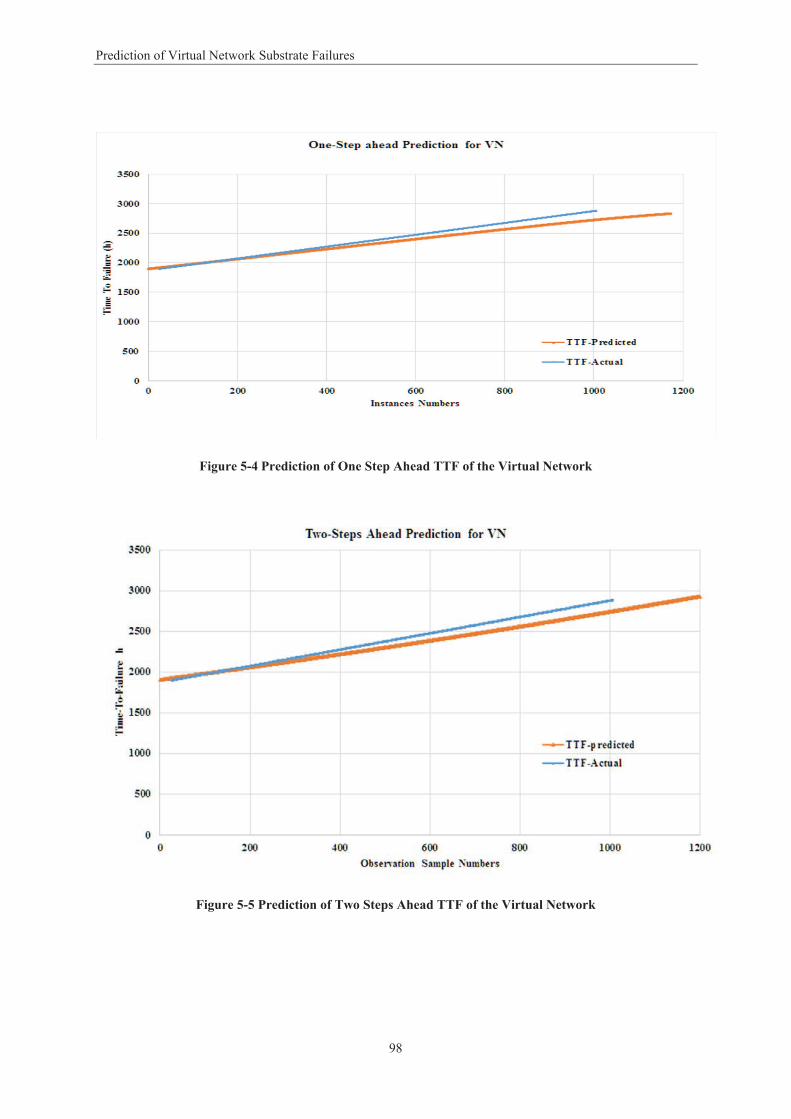
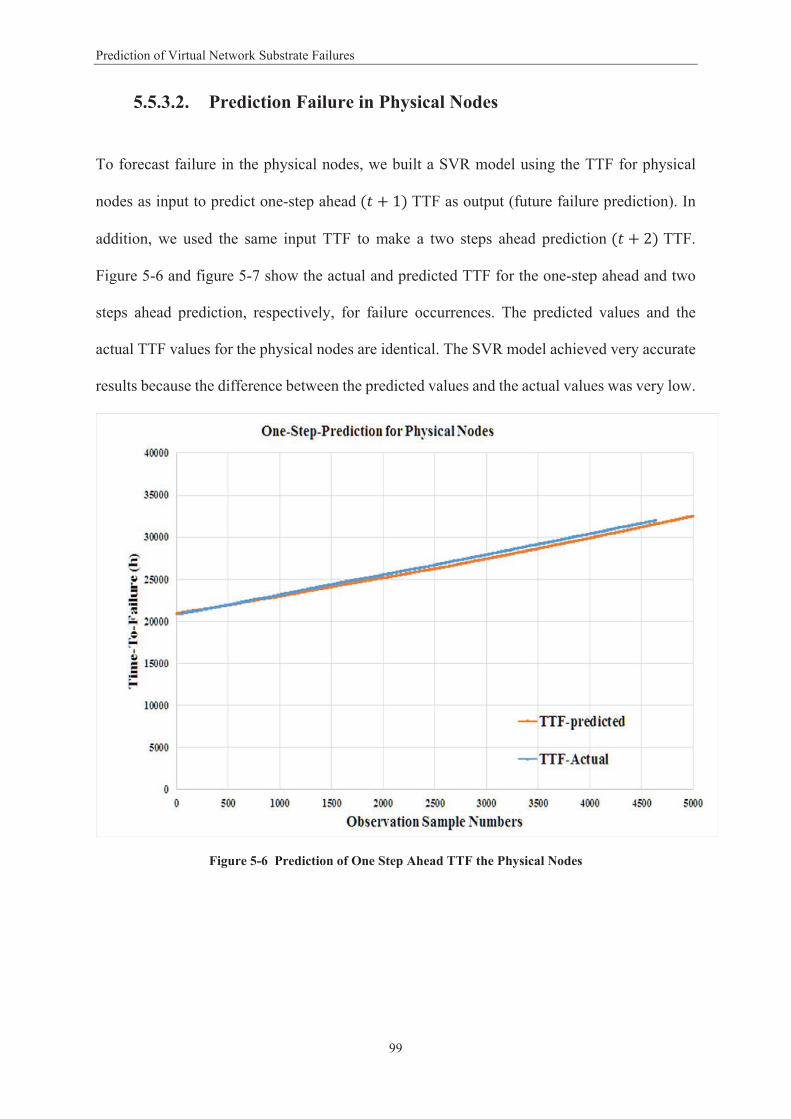
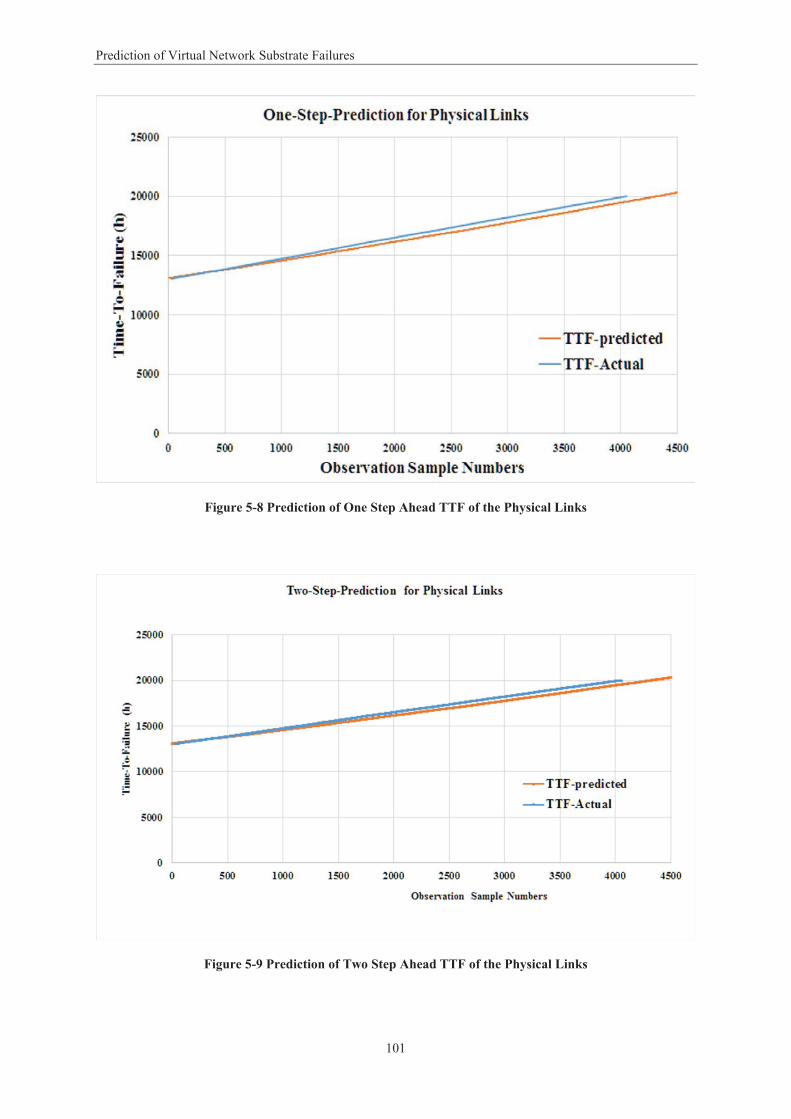
Figure 1-1 Virtual Network Embedding Model ....................................................................................... 5 Figure 2-1 Network Virtualisation Framework ..................................................................................... 15 Figure 3-1 Framework for Dependability Metrics Evaluation ............................................................... 42 Figure 3-2 Single Mapping .................................................................................................................... 43 Figure 3-3 Passive Mapping .................................................................................................................. 44 Figure 3-4 Active Mapping .................................................................................................................... 44 Figure 3-5 Single Mapping Model ......................................................................................................... 46 Figure 3-6 Passive Mapping Model ....................................................................................................... 49 Figure 3-7 Active Mapping Model ......................................................................................................... 50 Figure 3-8 Reliability Metric for Virtual Network Allocation ................................................................ 54 Figure 3-9 Availability Results for Virtual Network Allocation .............................................................. 55 Figure 3-10 Availability Results ............................................................................................................. 56 Figure 4-1 Virtual Network Requests .................................................................................................... 62 Figure 4-2 Virtual Network Maps onto Substrate Network .................................................................. 63 Figure 4-3 VNE Hierarchal Topology .................................................................................................... 66 Figure 4-4 Partitioned Network Topology with Two LPs ...................................................................... 67 Figure 4-5 Time-stamp Message Sequence Transmission .................................................................... 69 Figure 4-6 Failures Detected with a Failure .............................................................. 73 Figure 4- ................. Error! Bookmark not defined. Figure 4-8 Accuracy with Different Look-ahead Values ........................................................................ 74 Figure 4-9 Average Failure Detection Time Using Different Numbers of Clusters ............................... 75 Figure 4-10 Number of Messages Exchanged with Different Numbers of Clusters ............................. 76 Figure 4-11 Number of Messages Exchanged with Different Number of Nodes ................................. 77 Figure 4-12 Receiver Operating Characteristic Curve Results for SVM and Naïve Bayesian Models ... 80 Figure 4-13 Receiver Operating Characteristic Curve Results for SVM and Decision Tree Models ...... 81 Figure 5-1 Epsilon Intensive Band – Loss Function ............................................................................... 90 Figure 5-2 Architecture of Failure Prediction Model in VNE ................................................................ 91 Figure 5-3 Virtual Network Topology .................................................................................................... 95 Figure 5-4 Prediction of One Step Ahead TTF of the Virtual Network .................................................. 98 Figure 5-5 Prediction of Two Steps Ahead TTF of the Virtual Network ................................................ 98 Figure 5-6 Prediction of One Step Ahead TTF the Physical Nodes ....................................................... 99 Figure 5-7 Prediction of Two Step Ahead TTF of the Physical Nodes ................................................. 100 Figure 5-8 Prediction of One Step Ahead TTF of the Physical Links.................................................... 101 Figure 5-9 Prediction of Two Step Ahead TTF of the Physical Links ................................................... 101
viii
Abstract
List of Tables
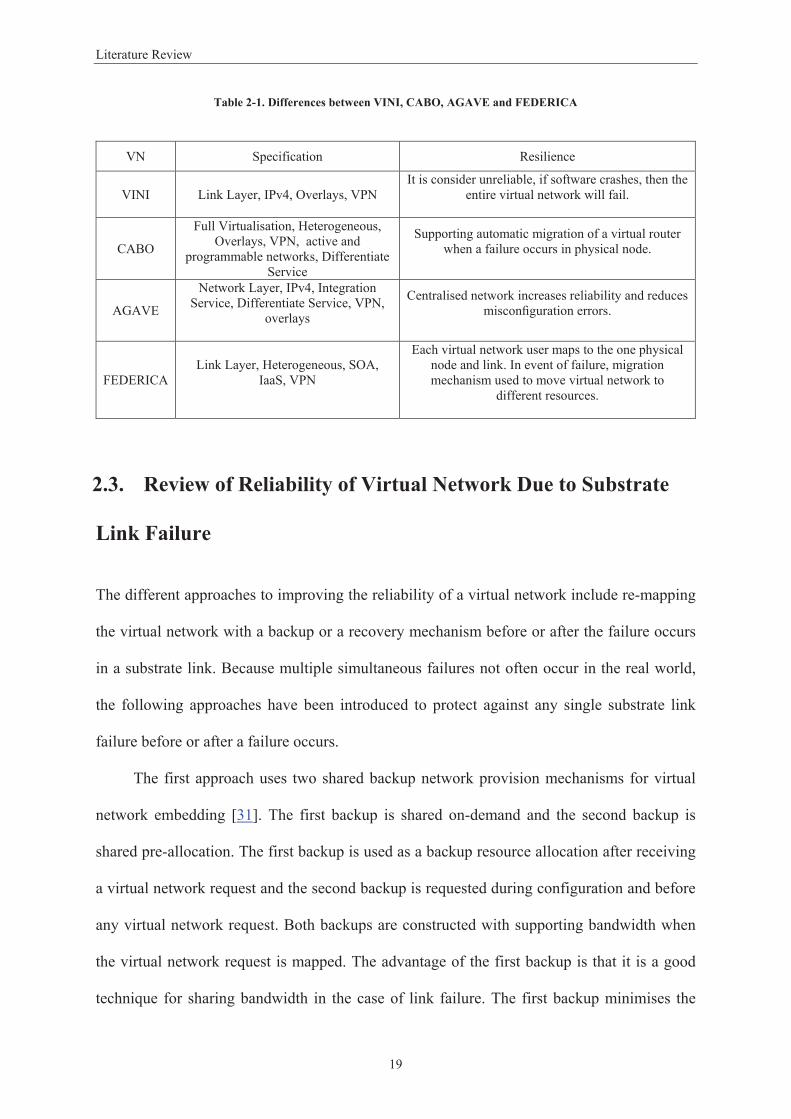
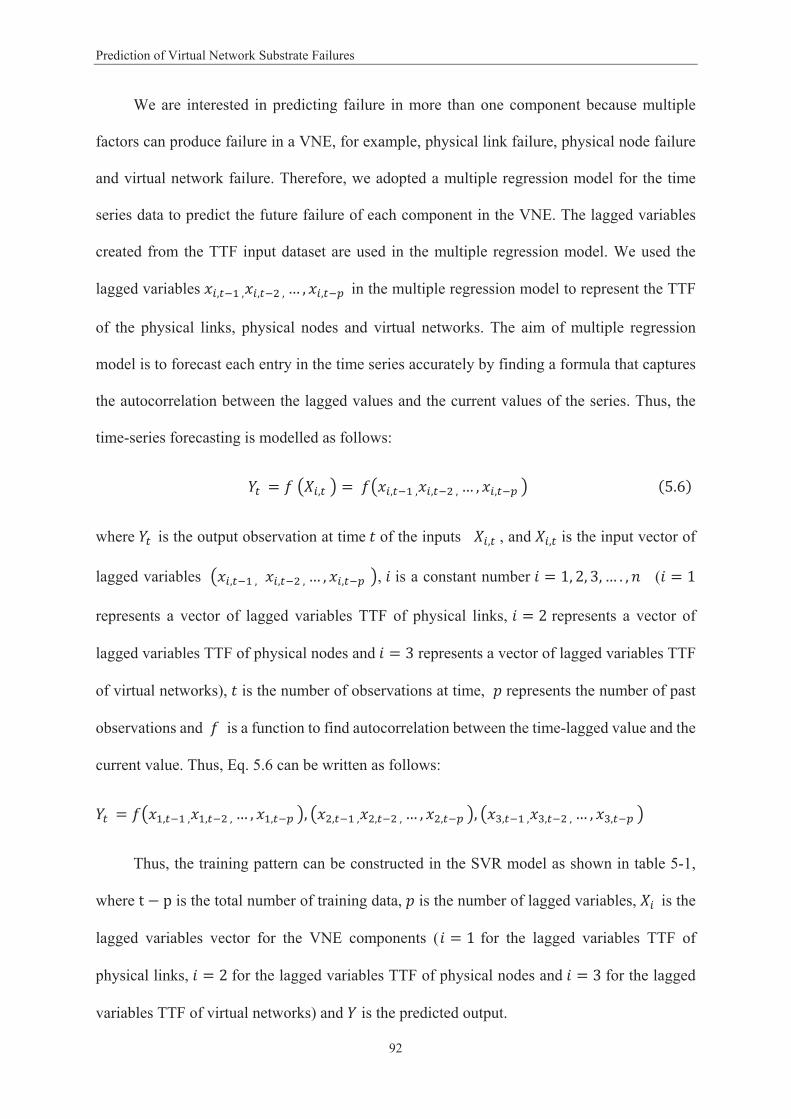
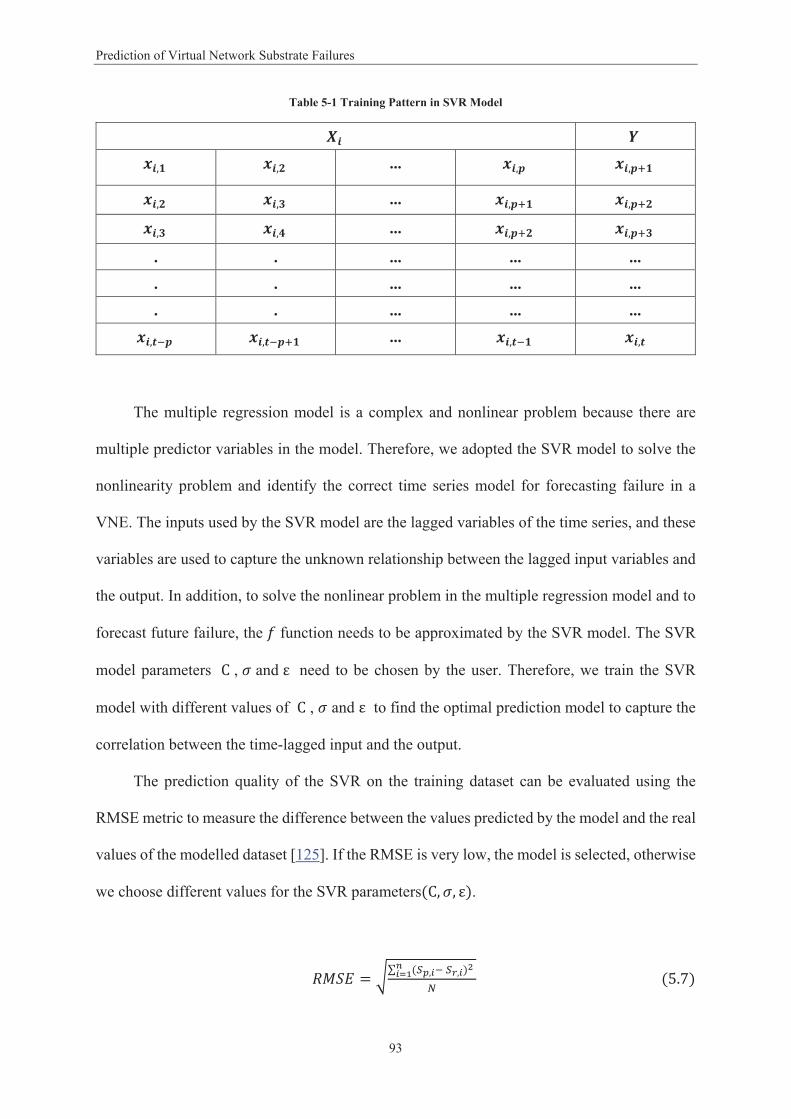
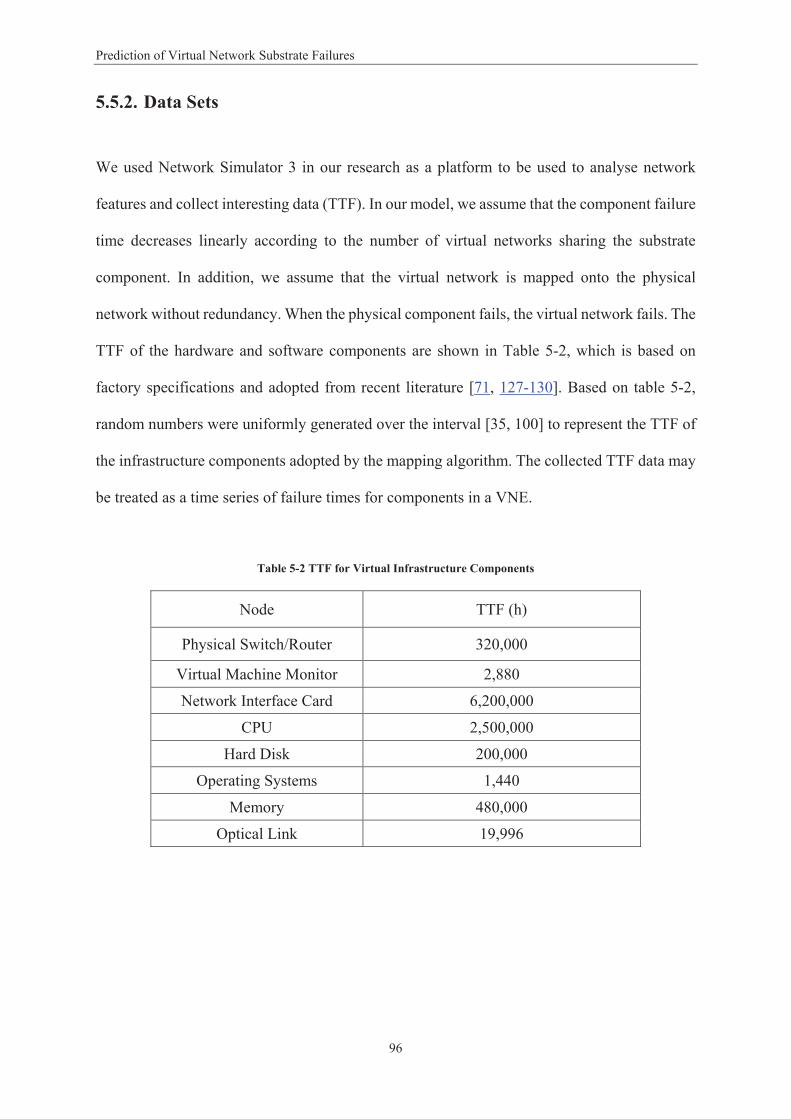
Table 2-1. Differences between VINI, CABO, AGAVE and FEDERICA .................................................... 19 Table 3-1 Component MTTF and MTTR ................................................................................................ 52 Table 3-2 Availability Measurements for Virtual Network Mapping .................................................... 57 Table 4-1 True Positive Rate and False Negative Rate .......................................................................... 74 Table 4-2 Success Rate Percentage in SVR Model ................................................................................ 79 Table 5-1 Training Pattern in SVR Model .............................................................................................. 93 Table 5-2 TTF for Virtual Infrastructure Components........................................................................... 96 Table 5-3 Training Parameters for SVR ................................................................................................ 97 Table 5-4 RMSE for SVR Model of Virtual Network Component ........................................................ 102 Table 5-5 NRMSE for Virtual Network SVR, MLP and Gaussian Process Models ............................... 103 Table 5-6 NRMSE for Physical Node SVR, MLP and Gaussian Process Models ................................... 104 Table 5-7 NRMSE for Physical Link SVR, MLP and Gaussian Process Models ..................................... 104
ix
Abbreviations
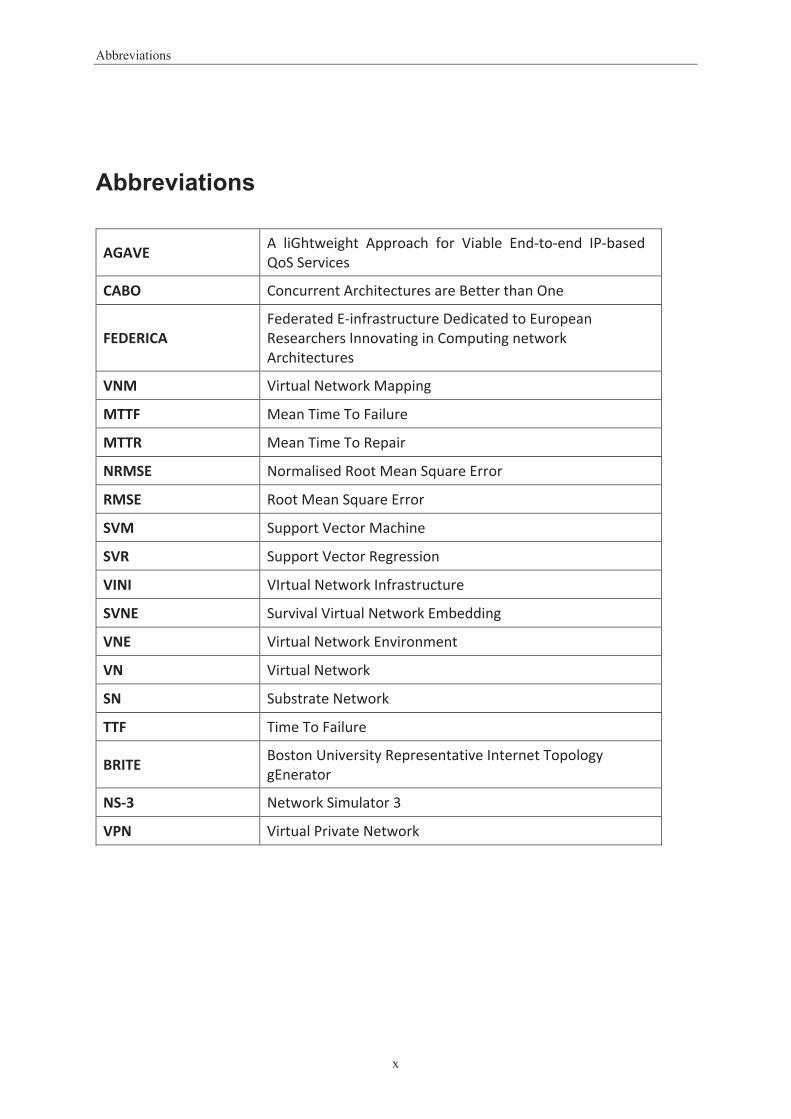
Abbreviations
AGAVE A liGhtweight Approach for Viable End-to-end IP-based QoS Services
CABO Concurrent Architectures are Better than One
FEDERICA Federated E-infrastructure Dedicated to European Researchers Innovating in Computing network Architectures
VNM Virtual Network Mapping
MTTF Mean Time To Failure
MTTR Mean Time To Repair
NRMSE Normalised Root Mean Square Error
RMSE Root Mean Square Error
SVM Support Vector Machine
SVR Support Vector Regression
VINI VIrtual Network Infrastructure
SVNE Survival Virtual Network Embedding
VNE Virtual Network Environment
VN Virtual Network
SN Substrate Network
TTF Time To Failure
BRITE Boston University Representative Internet Topology gEnerator
NS-3 Network Simulator 3
VPN Virtual Private Network
x
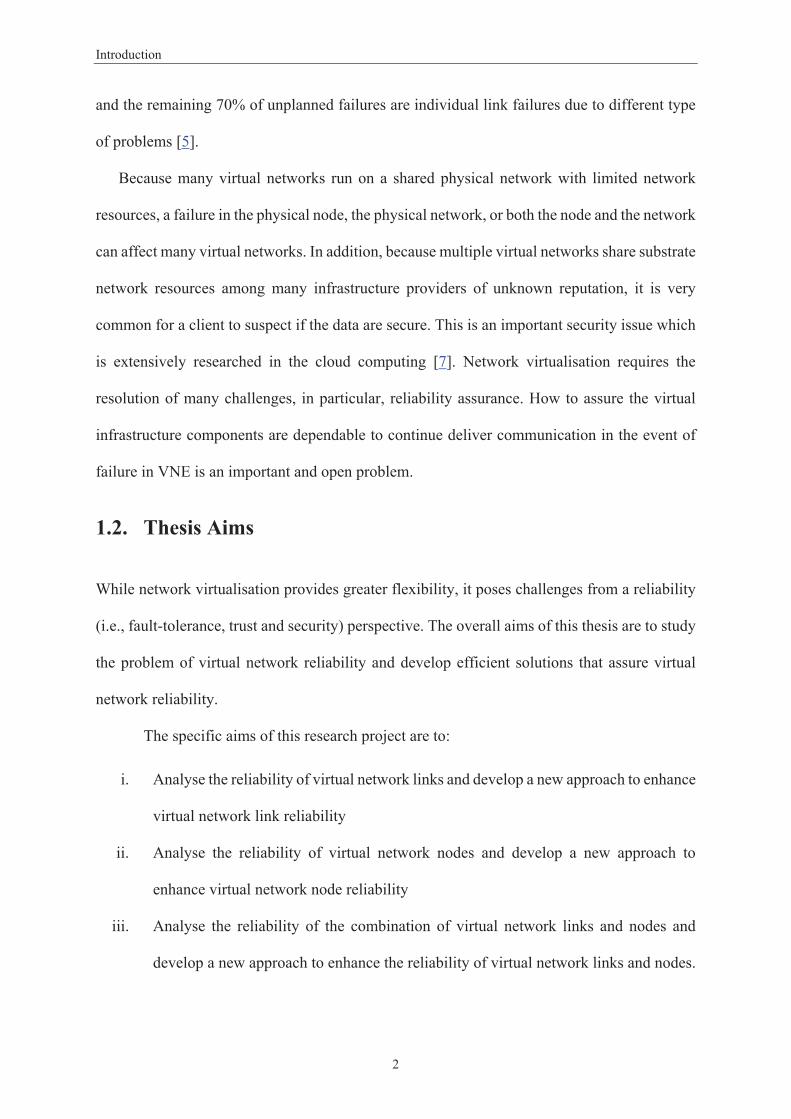
Introduction
Chapter 1: Introduction
1.1. Background
Internet architecture does not easily accommodate fundamental changes. Network
virtualisation has been recognised as an enabling technology for the future Internet [1] and
Centralised network increases reliability and reduces
FEDERICALink Layer, Heterogeneous, SOA,
IaaS, VPN
Each virtual network user maps to the one physical node and link. In event of failure, migration mechanism used to move virtual network to
different resources.
19
Literature Review
usage of communication resources and maximises the profit of the infrastructure provider by
increasing the time that the virtual network is available to the service provider. The
disadvantage of the second backup is that it is inefficient at low virtual network request loads
because it always holds the backup bandwidth regardless of a virtual network request.
Survivable virtual network embedding is a reactive backup mechanism that has been
prepared for virtual network mapping to protect against single substrate link failure [32]. In the
reactive backup mechanism, the bandwidth of a substrate link is shared between
and backup flow, primary flow is reserved for transport in the normal situation and the backup
flow is reserved for transport upon failure occurs in primary flow. When a failure occurs in the
substrate link failure, a reactive backup mechanism is used to by
using the allocated backup bandwidth of other links. The disadvantage of this mechanism is
that more resources are needed because each substrate link requires a backup path to protect
against any failure. The backup mechanism cannot assure 100% recovery with an increase in
traffic load and a great amount of data loss due to failure occurrence in VNE. In addition, the
bandwidth resources are used for new virtual network requests and there may be insufficient
resources left on for recovery. While the outcome of various bandwidth sharing for the
substrate links has been assessed, sharing.
An algorithm proposed for restoration of a single link failure involves adopting an
intelligent bandwidth sharing mechanism [33]. The algorithm uses existing embedding
techniques [19, 34] for mapping virtual networks to substrate networks with the restoration
path selection to be used as a backup path in the case of a single substrate link failure. Online
virtual network service resource allocation is used to minimise the joint failure probability
between the primary path and the backup path. The advantage of this work is that it offered a
solution to the complex of minimising network resource usage while allocating sufficient
resources to handle the failure. The disadvantage is that it minimises network resource usage
20
Literature Review
and this could increase the number of rejections of virtual network mapping requests.
Protecting the substrate link failure by using facility nodes as primary mapping for the
virtual nodes and facility nodes as backup for virtual nodes, after the substrate failure occurs
in the primary node, the virtual node migrates to one of the backup nodes [35]. In
addition, the proposal introduced in [35] used + , 1 facility nodes and + , 1
substrate paths to protect virtual network against a link failure in the substrate network. The
advantage of this method is that it minimises the resources used by the substrate facility node
when a failure occurs in the substrate node and the virtual node is allocated to another substrate
node. The disadvantage of this method is that allocating redundant links to enhance the virtual
network may consume a lot of bandwidth that may not be used if a failure does not occur.
Another approach has been proposed to tolerate substrate link failure by optimising
network and computing resources and extending the shared protection mechanism by
combining a node migration method [36]. Node migration is used to move a mapped node onto
another facility node in the event of a substrate link failure. The advantage is that the migratory
shared protection mechanism is safer than a traditional backup technique. The relocated node
saves resources because it needs a shorter backup path length to the destination node before the
migration. The disadvantage is that because of the cost of using computing and communication
resources, node migration backup protection is more expensive than tradition backup
protection. Therefore, traditional backup protection is preferred over migration backup
protection.
An embedding algorithm prepares to recover the substrate link failure first by mapping
the virtual node to a specific substrate node and then mapping the virtual link over multiple
substrate paths with flexible path splitting ratios [19]. Online request mapping is introduced by
path splitting and migration of an inefficient substrate path to a different path using different
splitting ratios for each path. The advantage of this approach is that it introduces a solution to
21
Literature Review
the link failure by path splitting and path migration over multiple substrate links with flexible
path splitting ratios. In addition, the algorithm introduces optimisation for cost-effective virtual
network embedding by allowing substrate path splitting and migration for better resource
usage. The disadvantage of this approach is that because the mapping task is achieved in two
steps, it scales down the operation of the virtual network mapping and requires more time.
Furthermore, the algorithm is concerned with link remapping without any solution of its
relation to the node remapping in the event of failure.
A failure could involve an entire computing cluster or just one or more processors that
are executing a specific task with no spare processors left in the same cluster. The failure could
be due to a power outage or occur in either the hardware or the software. A technique has been
proposed to recover a link failure in a wavelength-division multiplexing network [37]. This
technique is used for fault tolerance and involves the migration of the task to a spare cluster
with sufficient light path connectivity and the existence of other clusters processing in the same
distributed computing job. In [37] the problem formulated as integer linear programming to
find an optimal virtual private network that can satisfy the traffic requirements. However, when
the link failure in the virtual private network remains connected there is no guarantee that the
remaining virtual private network connection can support the required traffic matrix.
An effective resilience virtual network mapping against substrate link failure while
providing enhanced quality of service can be achieved by allocating backup paths that do not
share common links in the substrate network with their related operating paths [38]. The
algorithm introduced in [38] maps virtual nodes onto substrate nodes sequentially by selecting
substrate nodes with higher quality. After mapping each virtual node, the virtual links are
mapped onto substrate paths with backup paths. The heuristic in [38] is similar to the heuristics
in [39, 40] but has some different features: firstly, the number of intermediate substrate
candidate nodes for link mapping is limited to two; secondly, backtracking is required for
22
Literature Review
virtual nodes mapped previously when the current virtual node cannot be mapped using the
sequential mapping procedure. Moreover, the heuristic in [38] is different from the other
heuristics in [39, 40] because they provide improved quality of service and resilience against
substrate network failures. The disadvantage of this heuristic is that it suffers a high run-time
if backtracking is uncontrolled if there is no solution occurs.
Increasing the reliability of a virtual network in the event of failure, an alternative
mechanism constructs high-quality one-hop routes via intermediary virtual nodes [39-42]. To
obtain a high quality of service mapping of virtual nodes to the substrate nodes, only the direct
path between two substrate nodes is taken. The alternative routes serve as a backup for direct
virtual network routes and provide improved reliability against changing network conditions.
The quality of both paths (direct and indirect) is high enough to meet or exceed application
quality of service constraints, and an application can use either of these paths without disrupting
quality of service requirements for loss rate and message delay. This approach combines
quality of service with the resilience of a virtual network, but it is not an efficient mechanism
for using substrate resources with specific quality of service demands while leaving the other
resources unusable.
Table 2-2 summarises the previous work on increasing the reliability of virtual networks
in the event of physical link failure, which is the predominant failure type in virtual networks.
23
Literature Review
Table 2-2 Assuring Resilience of Physical Link Failure in a Virtual Network
Reference Resilience Mechanism Research Limitations
Shared backup network provision for virtual network embedding [31]
Resilience link failure before a failure occurs by provision two shared backup
It is inefficient mechanism since reserve virtual infrastructure resources as a backup before virtual network request arrive.
Survivable virtual network embedding [32]
A restoration mechanism to protect against a single substrate link failure
The restoration mechanism cannot guarantee 100% recovery because the backup activated after the failure occurs.
Resilient virtual network service provision in network virtualization environment’s [33]
Reactive after failure (restoration) with optimisation objective minimisethe path failure probability
The objective to minimise the network resources could decrease the number of virtual network requests.
Migration based protection for virtual infrastructure survivability for link failure [35]
Proactive before failure with optimisation objective minimise sum of costs
The cost of using computing and communication resources formigration as a backup protection is higher than traditional backup protection.
A novel virtual node migration approach to survive a substrate link failure [36]
Proactive before failure with optimisation objective minimise the substrate resources usage
Allocating redundant links to enhance virtual network consume a lot of bandwidth and may be not used in case of no failure occurs.
Rethinking virtual network embedding: substrate support for path splitting and migration [19]
splitting path over multiple substrate links with flexible path splitting ratios to recover link failure
The mapping task is achieved in two steps, which reduces the performance of virtual network mapping because it requires more time.
Multi-layer resilient design for Layer-1 VPNs [37]
This technique for fault tolerance is migration the task to spare cluster with a sufficient light path connectivity
When the link failure occurred, the virtual private network remains connected but there is no guarantee that the remaining connection of the virtual private network can support the required traffic matrix.
Achieving effective resilience for QoS-aware application mapping [38]
Allocating a backup substrate path for virtual network which doesn’t share common links with their corresponding working path
Required high run-time forbacktracking if there is no solution exists.
Efficient and dependable overlay networks [39-42]
Constructs high-quality one-hop routes via intermediary virtual nodes. The alternative routes serve as a backup for direct virtual network routes and provide improved reliability against changing network conditions
It is not an efficient mechanism because it uses substrate resources with specific quality of servicedemands and leaving the other resources unusable.
24
Literature Review
2.4. Review of Reliability of Virtual Network Due to Substrate
Node Failure
The following approaches have been introduced to improve the reliability of a virtual network,
by remapping the virtual nodes into the substrate nodes with a backup or recovery mechanism
before or after the failure occur at a substrate node.
A proposed two-step solution was introduced to restore virtual infrastructure from
substrate node failure [43]. The first step is enhancing the virtual infrastructure with backup of
the virtual nodes and links with spare computing and communication resources. The second
step is mapping the enhanced virtual infrastructure to a substrate network. The virtual
infrastructure is enhanced by two approaches 1-redundant and K-redundant virtual
infrastructure with + 1 or + nodes, respectively. When a facility node fails, the virtual
infrastructure node mapped to it is migrated to a backup facility node and the associated virtual
links required to be migrated as well. In the 1-redundant scheme solution, one additional virtual
infrastructure node is added. When the virtual nodes failed, then it will be migrated to the
backup node as well as the connection of the failed node required to be migrated. In the K-
redundant solution, each critical node has a corresponding backup node and the K-redundant
virtual infrastructure nodes are then mapped onto the substrate nodes. The advantage of this
method that it is very efficient in the event of failure because each critical virtual infrastructure
node has a backup node that can be used to replace the failed node. This two-step solution has
a significant impact on conserving backup resources and may improve resource usage by using
redundant links when the facility node fails. The disadvantage is that by minimising the
network resources, costs may increase because more resources are allocated for both active and
backup nodes. In addition, the K-solution needs to reserve a backup node for every critical node
and link to every adjacent node.
25
Literature Review
Introduced location constraint in virtual network mapping and an optimal resources
allocation for active and backup to protecting any single substrate node failure in VNE [44].
The integer linear programming model was formulated to determine the optimal solution for
resource allocation for operations and backup demand. For online mapping, a sequential
survivable embedding algorithm has been proposed to resolve the problem in two steps. In the
first step, the working address is mapped by adopting the embedding algorithm proposed in
[17], and the second step is backup request mapping. The integer linear programming model
was based on constructing a graph to map each virtual node to substrate nodes while satisfying
location and capacity constraints. The disadvantage of the linear programming model is that it
consumes many resources to check that all virtual nodes have been allocated to backup nodes.
In addition, introducing the location constraint with the existing capacity constraint makes
virtual network embedding more complicated.
A recovery mechanism called enhanced virtual network has been proposed for a single
failure in a facility node due to power outage, virus attack, disk failure or software crash [45].
The enhanced virtual network uses a two-step approaches: the first step creates an enhanced
virtual network by adding service nodes and additional service links such that to
the virtual network. The second step involves mapping the enhanced virtual network to + 1
facility nodes and + paths in the substrate. When the service node is affected by a failure,
the service node needs to be migrated to a backup facility node at a different geographical
location. When any node fails, the role of the failed node will be taken up by other nodes after
a rearrangement of all the nodes including the backup node. Graphical transformation or
decomposition and bipartite graph matching is used to find the optimal path with the least
computing and communication resources. The advantages of the enhanced virtual network
design are that it requires a fewer virtual resources, such as bandwidth resources for links or
computing resources for service nodes, after mapping the enhanced virtual network to the
26
Literature Review
substrate. The enhanced virtual network mapping is efficient because it shares resources among
other nodes in the event of a failure. The disadvantage is that, if a failure occurs, a large number
of virtual nodes require migration to the working nodes, which makes the approach less feasible
in a large network.
A solution has been presented for solving the problem of survival virtual network
mapping against any failure in facility nodes in a single region of a federated computing and
networking system [46]. Facility nodes from a data centre are interconnected in a federated
computing and networking system and need to be backed up to achieve a survival virtual
network mapping. In [46] redundant facility nodes are used at different geographical locations
and redundant links and has the provision to map to virtual infrastructure in case of failure.
Two failure-dependent survival virtual network mapping algorithms have been developed. The
first solves the non-survivable virtual network mapping problem with a heuristic, the second
extends the heuristic to solve the survival virtual network mapping problem. The first heuristic
is called separate optimisation with unconstrained mapping which is separating the problem
into non-survival problems for each probable regional failure and one for primary functioning
mappings. This minimises the costs of the resources used. The second approach is called
incremental optimisation with constrained mapping and first maps the primary functioning
mapping, and then maps each regional failure. The advantage of incremental optimisation with
constrained mapping is that it is a more effective algorithm and minimises cost by using less
resources. Separate optimisation with unconstrained mapping provides better failure recovery
probability because it uses additional computing resources to overcome the failure. The
disadvantage of a federated computing and networking system is that it has a constraint with
computing and communication resources, and therefore, certain failures cannot be recovered.
Moreover, the separate optimisation with unconstrained mapping algorithm requires re-
computing virtual mapping of unaffected nodes, which takes time and costs more.
27
Literature Review
A service-aware approach groups multiple virtual machines and their backups to form a
survival virtual infrastructure for a service [47]. The problem is classified into two-sub
problems. The cirtual machine placement sub-problem uses an efficient backtracking algorithm
based on a depth first search to calculate the virtual link mappingusing a linear program. For
the virtual machine placement sub-problem, the optimal mapping of survival virtual
infrastructure to the physical data centre network, which is cost-effective subject to constraints
in computing and communication resources use. For the virtual link mapping sub-problem a
polynomial time algorithm is used to solve the bandwidth demands of virtual machines that
can be guaranteed before and after the failure. The advantage of this approach is that the
reserved bandwidth can be used as a backup in the event of link failure and may also share
links. The disadvantage of this approach is that it has a high computing overhead due to the
virtual machine placement problem that requires extensive calculations for virtual link mapping
for a possible solution. This high computing overhead for a large network may not be
guaranteed to get close to the optimum solution.
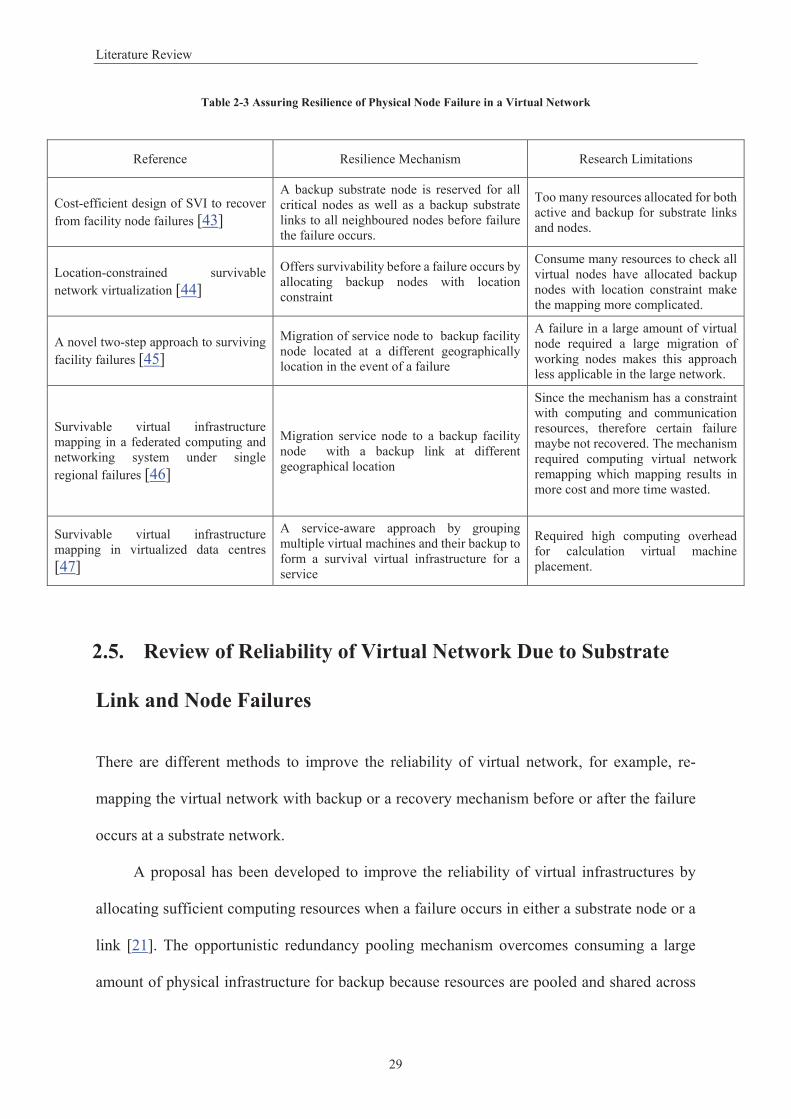
Table 2-3 shows the previous study done on increasing the reliability of virtual network
in the case of physical node failure in a VNE.
28
Literature Review
Table 2-3 Assuring Resilience of Physical Node Failure in a Virtual Network
2.5. Review of Reliability of Virtual Network Due to Substrate
Link and Node Failures
There are different methods to improve the reliability of virtual network, for example, re-
mapping the virtual network with backup or a recovery mechanism before or after the failure
occurs at a substrate network.
A proposal has been developed to improve the reliability of virtual infrastructures by
allocating sufficient computing resources when a failure occurs in either a substrate node or a
link [21]. The opportunistic redundancy pooling mechanism overcomes consuming a large
amount of physical infrastructure for backup because resources are pooled and shared across
Reference Resilience Mechanism Research Limitations
Cost-efficient design of SVI to recover from facility node failures [43]
A backup substrate node is reserved for all critical nodes as well as a backup substrate links to all neighboured nodes before failurethe failure occurs.
Too many resources allocated for both active and backup for substrate links and nodes.
Offers survivability before a failure occurs byallocating backup nodes with location constraint
Consume many resources to check all virtual nodes have allocated backup nodes with location constraint make the mapping more complicated.
A novel two-step approach to surviving facility failures [45]
Migration of service node to backup facility node located at a different geographically location in the event of a failure
A failure in a large amount of virtual node required a large migration of working nodes makes this approach less applicable in the large network.
Survivable virtual infrastructure mapping in a federated computing and networking system under single regional failures [46]
Migration service node to a backup facility node with a backup link at different geographical location
Since the mechanism has a constraint with computing and communication resources, therefore certain failure maybe not recovered. The mechanism required computing virtual network remapping which mapping results in more cost and more time wasted.
Survivable virtual infrastructure mapping in virtualized data centres[47]
A service-aware approach by grouping multiple virtual machines and their backup to form a survival virtual infrastructure for a service
Required high computing overhead for calculation virtual machine placement.
29
Literature Review
multiple virtual infrastructures. Opportunistic redundancy pooling ensures that virtual
infrastructures limit the connection of redundant nodes in the links. Reliability is increased
when the number of backup nodes increases. Opportunistic redundancy pooling shares these
redundancies for both independent and cascading types of failure by reducing the number of
backup nodes and increases reliability by sharing backup resources with other virtual
infrastructures. The advantage of opportunistic redundancy pooling is that it minimises
redundant resources for backup by reducing the computing and communication resources that
are used by the virtual infrastructures. The disadvantage is that the mechanism for backup
recovery is not efficient because it allocates backup resources before a failure has occurred and
does not provided a solution for unexpected failure.
There are three types of resource failures: virtual node failure, substrate node failure and
link failure. A distributed fault-tolerant embedding algorithm has been proposed to detect and
identify local changes through monitoring node or link failure and finding new resources to
maintain virtual network topologies [48]. The monitoring is based on a multi-agent approach
to guarantee distributed negotiation and synchronisation between the substrate nodes [49]. In
the event of failure in each substrate node, the agent selected the substrate node attributes that
should be matched to the virtual node attributes. Each agent computes a dissimilarity metric
between non-functional attributes requested by virtual node and the non-functional attributes
of its associated substrate node. The non-functional attributes may be different types, such as
binary, nominal or interval [50]. The advantage of this approach is that it handles failure of a
virtual node, substrate node or link, as well as monitoring and detecting any failure
autonomously and informing other substrate nodes about the failure. The distributed fault-
tolerant embedding algorithm replaces the failed node or link using available resources. The
disadvantage of this mechanism is that in the event of failure, the search procedure for finding
match resources for the virtual network is repeated, which makes the algorithm inefficient with
30
Literature Review
increased overhead.
A concurrent failure can occur in a computing cluster due to power outrage, virus attack
or link failure due to a fibre cut. Two technique have been developed to recover concurrent
multi-layer failures in the cluster or a link [51]. The first technique is called cluster and path
protection and the second technique is called virtual network protection. Cluster and path
protection is a mechanism to protect each logical connection from a link failure by establishing
two disjointed paths and two clusters to survive any single cluster failure. Virtual network
protection uses three disjoint clusters and makes provision to survive one link failure and one
cluster failure. The advantage of the cluster and path protection method is that it is a first offer
recovery mechanism for a multiple clusters or links and has introduced a concurrent recovery
facility to the substrate node and link. The disadvantage of cluster and path protection is that it
takes more bandwidth resources because a logical link in the cluster and path protection can
share physical links with virtual network protection that requires more CPU resources.
Consequently, these mechanisms make mapping more complex due to different resource
isolation and the study did not determine which approaches perform better for an existing
virtual network.
A hierarchical and heterogeneous modelling to depict redundant architectures and compare
their availability taking in account computers acquisition costs [52, 53]. A hierarchical and
heterogeneous are based on RBD and Markov chains, a high-level model based on RBD
denotes the Eucalyptus platform subsystems and a low-level model based on Markov chains
represents the respective subsystems employing warm standby replication. In the analytical
models, the failure in hardware and software are considered in the cloud computing [52, 53].
A framework is proposed to specify the virtualized infrastructures allocation that takes into
consideration the reliability support in virtual networks [54]. The framework has a specification
language, which describes the reliability metric to be adopted in a resource allocation
31
Literature Review
algorithm. The disadvantage of this study is that it does not offer dependability model for
evaluation the general assessment risk and the maintenance is not considered.
A cloud dependability model that uses system-level virtualisation is proposed in [55], but
this work focuses on cloud security and evaluates the virtualised component dependability
properties at the system level. The proposed reliability block diagrams to assess the system
reliability of cloud computing. The drawback is that dependability is assessed only at the host
level and the model is too simple to describe the complex behaviour of underlying hardware as
well as software components.
A framework proposed to model and evaluate the dependability of a virtual network
based on the reliability block diagrams and continuous-time Markov chains [56]. The proposed
framework will be helpful to the design and construction of more dependable. The important
characteristic of continuous-time Markov chain models is the representation of system
behaviour along the time scale. The continuous-time Markov chain model was chosen for it is
greater simplicity than discrete time models. If time is discrete, the model has to consider that
multiple events may occur between two consecutive time marks and search the effects of all
possible combinations of these events. Continuous time scale models use appropriate
probabilistic assumptions and it is possible to take only one event into consideration [57].
Table 2-4 summarises previous work on increasing the reliability of virtual network in the
case of combination physical link and node failure in virtual network.
32
Literature Review
Table 2-4 Assuring Resilience of Physical Link & Node Failure in a Virtual Network
Reference Resilience Mechanism Research Limitations
Designing and embedding reliable virtual infrastructures [21]
Recover a failure occurs in either a substrate node or a link by allocating sufficient computing resources by using opportunistic redundancy pooling to pool and share across multiple virtual infrastructures
It is not an efficient mechanism since backup resources allocated before failures occur. Moreover it recovered only one node failure thus, the mechanism cannot be applied when more than one node failure
Adaptive virtual network provisioning [48]
Monitoring substrate node and link failure and finding new resources to maintain the virtual networktopology
The matching virtual networkprocedure that repeated again that made the algorithm inefficient.
Robust application specific and agile private (ASAP) networks withstanding multi-layer failures [51]
A mechanism to protect againstlink and cluster failure by establishing two disjoint paths and two clusters to survive from any single cluster failure
The mechanism makes mapping more complex due to the different resource isolation.
An Availability Model for Eucalyptus Platform, Models for Dependability Analysis of Cloud Computing Architectures for Eucalyptus Platform [52, 53]
a warm-standby replication mechanism is considered to protect both hardware and software failure in cloud computing environment
The study only consider the dependability and cost in designing cloud infrastructure without evaluation the performance which is very important metric in cloud computing
Reliability Support in Virtual Infrastructures [54]
A framework is proposed to efficiently specify and control the reliability of the virtualized infrastructure components at runtime.
The framework is not considered the general assessment risk and the maintenance in the evaluation model.
A dependability model to enhance security of cloud environment using system-level virtualization techniques[55]
Dependability model to evaluate the virtualised component dependability properties at the system level
The dependability is evaluated only at the host level
Average NRMSE 0.0015 0.0017 0.0700 0.0091 1.4508 0.3186
Table 5-7 shows that the SVR model achieves the lowest NRMSE values for one-step
ahead and two steps ahead prediction of failure in the physical link component in a VNE.
Therefore, the SVR outperforming Gaussian process and MLP models for forecasting the TTF
of physical link components in VNE.
We conclude that SVR models achieved high performance with a big dataset or small
dataset because the predictors depend on their parameters to fit the data into a model.
Table 5-7 NRMSE for Physical Link SVR, MLP and Gaussian Process Models
% Testing Dataset Physical Link – SVR Physical Link – MLP Physical Link – Gaussian Process
104
Prediction of Virtual Network Substrate Failures
1 step 2 steps 1 step 2 steps 1 step 2 steps
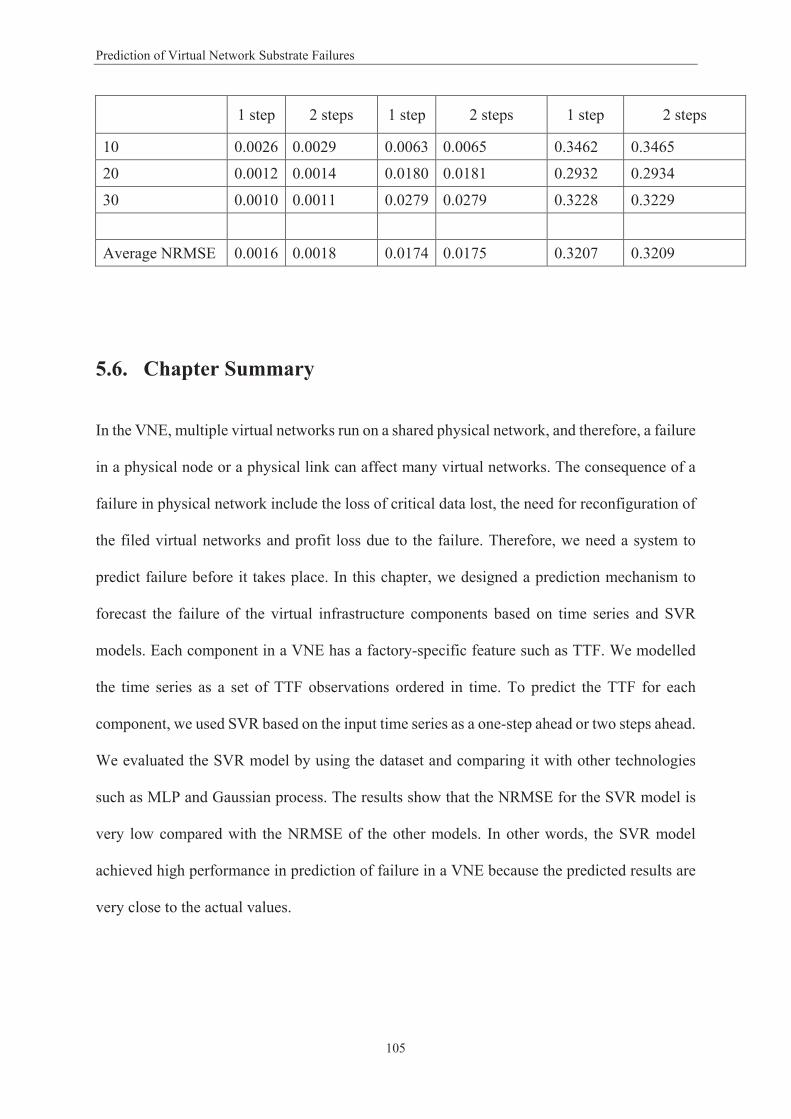
10 0.0026 0.0029 0.0063 0.0065 0.3462 0.3465
20 0.0012 0.0014 0.0180 0.0181 0.2932 0.2934
30 0.0010 0.0011 0.0279 0.0279 0.3228 0.3229
Average NRMSE 0.0016 0.0018 0.0174 0.0175 0.3207 0.3209
5.6. Chapter Summary
In the VNE, multiple virtual networks run on a shared physical network, and therefore, a failure
in a physical node or a physical link can affect many virtual networks. The consequence of a
failure in physical network include the loss of critical data lost, the need for reconfiguration of
the filed virtual networks and profit loss due to the failure. Therefore, we need a system to
predict failure before it takes place. In this chapter, we designed a prediction mechanism to
forecast the failure of the virtual infrastructure components based on time series and SVR
models. Each component in a VNE has a factory-specific feature such as TTF. We modelled
the time series as a set of TTF observations ordered in time. To predict the TTF for each
component, we used SVR based on the input time series as a one-step ahead or two steps ahead.
We evaluated the SVR model by using the dataset and comparing it with other technologies
such as MLP and Gaussian process. The results show that the NRMSE for the SVR model is
very low compared with the NRMSE of the other models. In other words, the SVR model
achieved high performance in prediction of failure in a VNE because the predicted results are
very close to the actual values.
105
Conclusions and Future Directions
Chapter 6: Conclusions and Future Directions
This chapter provides an overall summary and discusses the proposed methodologies, results
and the conclusions in this thesis. The first section discusses the accomplishments of this work,
and the second section highlights possible future research directions.
6.1. Accomplishments
The first question addressed in this thesis was: what is the probability that the substrate network
functions? The answer to this question is we have presented a framework to estimate the
probability of the system providing the required functionalities, as presented in Chapter 3. The
probability that the system is working or failed during time can be calculated using reliability
block diagrams to assess system and sub-system reliability. A reliability block diagram is a
combinatorial model used for analysing the reliability of components arranged in series, in
parallel or a combination of both series and parallel. The functionality of the system depends
on the arrangement of its components. For example, in a series system, if any component fails,
then all the whole system will fail, while in a parallel system, the system will fail when all of
the components in the system fail. Reliability block diagrams were used to represent the three
different mappings and the reliability of the system operational state given by its working
components based on its series and parallel arrangements. We adopted series and parallel
arrangements to model virtual network mapping onto a substrate network as a single mapping,
passive mapping or active mapping. In the single mapping case, the reliability of the system is
single-point failure. Therefore, it requires all physical infrastructure components to be working,
and any failure in physical infrastructure (router or link) will lead to failure of the entire
mapping. The reliability and failure probabilities for passive mapping and active mapping are
higher than for single mapping because active and passive mapping uses a combination of
106
Conclusions and Future Directions
parallel and series component connections. The results in Chapter 3 shows that the reliability
decreased significantly from 89% to 33% for simple mapping when the virtual networks
increased from 100 to 1000 virtual nodes mapped onto the substrate network. In addition, the
results in Chapter 3 show that the reliability for active and passive mapping was higher than
for single mapping. For example, the reliability decreased from 99% to 91% and from 97% to
70% for active and passive mapping, respectively, when virtual networks increased from 100
to 1000 virtual nodes mapped onto the substrate network.
The second question addressed in this thesis was: how to make virtual networks reliable
with the least resources? This problem was solved using the continuous-time Markov chain
model to represent virtual network mapping without redundancy (simple mapping) or with
redundancy (passive mapping) for analysing the reliability and availability of virtual network.
The lifetime of a virtual network can be estimated from the MTTF and the MTTR for substrate
network components. MTTF and MTTR are used for analysing the lifetime for each substrate
network component and the lifetime of the system. The lifetime or MTTF of a virtual network
increases by mapping the virtual network onto more than one component of the substrate
network. The reliability of the simple mapping decreased dramatically when the virtual
network was mapped into one component (i.e., the MTTF for the series system decreased). The
reliability of the passive mapping increased when the substrate components were connected in
parallel (i.e., the MTTF for the parallel system increased). Thus, we can increase the lifetime
of the system by adopting the virtual network mapping with redundancy. In addition, passive
mapping achieved very high performance with fewer resources than active mapping because
the stand-by redundancy in the passive mapping starts when the primary components fail. In
passive mapping, the primary active component is in the working state while the secondary
component in stand-by state. Thus, the MTTF for the system is increased by combining the
MTTF of primary components and the redundancy of stand-by components. The results in
107
Conclusions and Future Directions
Chapter 3 show that the availability of the system increased with the least resources (i.e.,
passive mapping is 100% all the time during 50 hours running the virtual network). While the
results show active mapping decreased availability from 99% to 93% and simple mapping
decreased availability from 97% to 92% during the 50 hours of running the virtual network.
The third question addressed in this thesis was: how to check if the component of
substrate network is functioning? To check whether the component is functioning or not, we
developed a failure detection mechanism based on the conservative time-synchronisation
algorithm and message passing interface. The message-passing interface is used for probing
connections between point-to-point nodes by message exchange and the conservative time-
synchronisation algorithm is used to determine the time-out before considering that a failure
event has occurred in the VNE. The failure detection system was designed to work in a large-
scale virtual network with small numbers of message exchanged and short time for failure
detection. The results in Chapter 4 show that the failure detection system achieved a high true
positive failure rate (95.5%) and a low false negative failure rate (5%). Because we partitioned
the VNE topology into multiple clusters, failure detection is restricted to a few substrate nodes.
Therefore, the failure detection approach achieved efficiency in the time to failure detection
(0.04562 seconds for five clusters) and the number of messages exchanged (seven messages
for five clusters).
The fourth question addressed in this thesis was: when does the failure occur in the
substrate network? To check when the substrate component failed, we developed a prediction
mechanism to forecast failure in more than one component in the VNE. The failure prediction
method is based on time series and SVR models. We constructed lagged-variables from the
TTF of physical links, physical nodes and virtual networks. The time series was modelled using
multiple regression that was integrated with the SVR model for forecasting the future failure
in these components. The results in Chapter 5 show that our prediction method achieved high
108
Conclusions and Future Directions
accuracy in forecasting the failure. The RMSE values are very low (0.16%, 3.13% and 1.83 for
the virtual network–SVR, physical node–SVR and physical link–SVR models respectively),
and therefore, the SVR model achieved very high accuracy in forecasting the failure in the
VNE. In addition, the SVR models achieved high performance in forecasting the failure of
substrate components compared with the MLP and Gaussian process. For example, the
NRMSE value was 0.0008 for forecasting the failure in virtual network by the SVR model.
While the MLP and Gaussian process models show, higher NRMSE values (0.0461 and 0.3355,
respectively). Thus, this means that the SVR model achieved higher performance than the
Gaussian process and MLP models for forecasting the failure in VNE components.
6.2. Limitations and Future Work
In spite of we have introduced various techniques to enhance the virtual infrastructures
dependability but there are still some limitations and challenges that need to be addressed
before these techniques can be deployed in real world scenario. For future work, we plan to
pursue several extensions to this thesis as follows:
We are considering assessing optimal reliability design for the virtual network allocation
in physical network. To assure system reliability, the virtual network is mapped onto the
physical network with sufficient backup for virtual nodes and links. While a backup
mechanism increases system reliability, the use of the physical resources may be
significantly reduced. Thus, we plan to extend our dependability model to guarantee
optimal reliability for a virtual network with optimal physical resources allocation. These
techniques can reduce the use of physical resources for virtual network while
guaranteeing system reliability
109
Conclusions and Future Directions
We plan to use reliability importance to provide a numerical rank to determine which
components are more important to system reliability or more critical to system failure. In
addition, reliability importance will be used to analyse the system availability according
to the most important components.
We used continuous-time Markov chain to model the VNE to capture the dynamic
behaviour of the system in the event of failure. We plan to use a different model, such as
the stochastic Petri net model, to analyse system reliability by adopting different recovery
strategies with several redundant topologies and considering different failure modes to
further enhance VNE dependability.
We used two approaches for mapping virtual network onto a physical network to
guarantee reliability. The first approach is passive mapping that maps the virtual network
onto two physical routers, and when the primary physical router fails, the stand-by
physical router starts working. The second approach is active mapping that maps the
virtual network onto a primary router and a backup router running simultaneously. While
the two approaches keep redundancy for reliable operation, keeping redundancy idle in
normal operation leads wasting the cost and the resources of operation. Therefore, we
will study a different approach that shares the backup between different critical nodes
and find intelligent mechanisms to increase the reliability of the VNE.
In our detection of failure in VNE mechanism, we used a hierarchal topology to represent
a VNE. In future, we plan to study different virtual network topologies such as mesh
topology. In addition, we focused in our study about scalability, flexibility and autonomic
features in detection a failure in virtual network in one domain, further work required
when virtual networks mapped into more than one domain.
110
Conclusions and Future Directions
In detection the failure in VNE, we used message-passing interface for probing
connection between point-to-point nodes and a conservative time-synchronisation
algorithm to determine out of order time-stamp messages in Network Simulator 3. In
future, we will apply the same detection mechanism to an actual VNE and compare the
results with different algorithms.
The proposed prediction mechanism is based on TTF feature of VNE components. In
future, we will extend the features that include CPU, bandwidth and memory to predict
failure in a VNE.
111
References
References
[1] K. Tutschku, T. Zinner, A. Nakao, and P. Tran-Gia, "Network virtualization: Implementation steps towards the future internet," Electronic Communications of the EASST, vol. 17, 2009.
[2] N. Feamster, L. Gao, and J. Rexford, "How to lease the Internet in your spare time," ACM SIGCOMM Computer Communication Review, vol. 37, pp. 61-64, 2007.
[3] A. Markopoulou, G. Iannaccone, S. Bhattacharyya, C.-N. Chuah, Y. Ganjali, and C. Diot, "Characterization of failures in an operational IP backbone network," IEEE/ACM Transactions on Networking (TON), vol. 16, pp. 749-762, 2008.
[4] P. Gill, N. Jain, and N. Nagappan, "Understanding network failures in data centers: measurement, analysis, and implications," in ACM SIGCOMM Computer Communication Review, 2011, pp. 350-361.
[5] A. Markopoulou, G. Iannaccone, S. Bhattacharyya, C.-N. Chuah, and C. Diot, "Characterization of failures in an IP backbone," in INFOCOM 2004. Twenty-third AnnualJoint Conference of the IEEE Computer and Communications Societies, 2004, pp. 2307-2317.
[6] P. Gill, N. Jain, and N. Nagappan, "Understanding network failures in data centers: measurement, analysis, and implications," in Proceedings of the ACM SIGCOMM 2011 conference, Toronto, Ontario, Canada, 2011, pp. 350-361.
[7] M. Osma, A. Elizondo, J. Sanchez, M. Boucadair, B. Decraene, B. Lemoine, et al., "D1. 1: Parallel internets framework," 2006.
[8] M. Melo, J. Carapinha, S. Sargento, L. Torres, P. N. Tran, U. Killat, et al., "Virtual network mapping–an optimization problem," in Mobile Networks and Management, ed: Springer, 2011, pp. 187-200.
[9] J. Nogueira, M. Melo, J. Carapinha, and S. Sargento, "Virtual network mapping into heterogeneous substrate networks," in Computers and Communications (ISCC), 2011 IEEE Symposium on, 2011, pp. 438-444.
[10] A. Haider, R. Potter, and A. Nakao, "Challenges in resource allocation in network virtualization," in 20th ITC Specialist Seminar, 2009, p. 20.
[11] M. Chowdhury, F. Samuel, and R. Boutaba, "PolyViNE: policy-based virtual network embedding across multiple domains," in Proceedings of the second ACM SIGCOMM workshop on Virtualized infrastructure systems and architectures, 2010, pp. 49-56.
[12] W. Szeto, Y. Iraqi, and R. Boutaba, "A multi-commodity flow based approach to virtual network resource allocation," in Global Telecommunications Conference, 2003. GLOBECOM'03. IEEE, 2003, pp. 3004-3008.
[13] C. Harris. (2011, 10/06). IT Downtime Costs. Available: http://www.informationweek.com/it-downtime-costs-$265-billion-in-lost-revenue/d/d-id/1097919
[14] N. Chowdhury and R. Boutaba, "Network virtualization: state of the art and research challenges," Communications Magazine, IEEE, vol. 47, pp. 20-26, 2009.
[15] P. Maciel, K. Trivedi, R. Matias, and D. Kim, "Performance and Dependability in Service Computing: Concepts, Techniques and Research Directions, ser," Premier Reference Source. Igi Global, 2011.
[16] A. Callado, C. Kamienski, G. Szabó, B. P. Gerö, J. Kelner, S. Fernandes, et al., "A survey on internet traffic identification," Communications Surveys & Tutorials, IEEE, vol. 11, pp. 37-52, 2009.
112
References
[17] M. Chowdhury, M. R. Rahman, and R. Boutaba, "ViNEYard: Virtual Network Embedding Algorithms With Coordinated Node and Link Mapping," Networking, IEEE/ACM Transactions on, vol. 20, pp. 206-219, 2012.
[18] S. Zhang, Z. Qian, J. Wu, S. Lu, and L. Epstein, "Virtual Network Embedding with Opportunistic Resource Sharing," Parallel and Distributed Systems, IEEE Transactions on, vol. PP, pp. 1-11, 2013.
[19] M. Yu, Y. Yi, J. Rexford, and M. Chiang, "Rethinking virtual network embedding: substrate support for path splitting and migration," ACM SIGCOMM Computer Communication Review, vol. 38, pp. 17-29, 2008.
[20] X. Cheng, S. Su, Z. Zhang, H. Wang, F. Yang, Y. Luo, et al., "Virtual network embedding through topology-aware node ranking," ACM SIGCOMM Computer Communication Review, vol. 41, pp. 38-47, 2011.
[21] W.-L. Yeow, C. Westphal, and U. C. Kozat, "Designing and embedding reliable virtual infrastructures," SIGCOMM Comput. Commun. Rev., vol. 41, pp. 57-64, 2011.
[22] A. Fischer, J. F. Botero, M. Till Beck, H. De Meer, and X. Hesselbach, "Virtual network embedding: A survey," Communications Surveys & Tutorials, IEEE, vol. 15, pp. 1888-1906, 2013.
[23] Y. Zhu and M. H. Ammar, "Algorithms for Assigning Substrate Network Resources to Virtual Network Components," in INFOCOM, 2006.
[24] I. Fajjari, N. Aitsaadi, G. Pujolle, and H. Zimmermann, "Vnr algorithm: A greedy approach for virtual networks reconfigurations," in Global Telecommunications Conference (GLOBECOM 2011), 2011 IEEE, 2011, pp. 1-6.
[25] S. Natarajan and T. Wolf, "Security issues in network virtualization for the future Internet," in Computing, Networking and Communications (ICNC), 2012 International Conference on, 2012, pp. 537-543.
[26] N. M. M. K. Chowdhury and R. Boutaba, "Network virtualization: state of the art and research challenges," Communications Magazine, IEEE, vol. 47, pp. 20-26, 2009.
[27] A. Bavier, N. Feamster, M. Huang, L. Peterson, and J. Rexford, "In VINI veritas: realistic and controlled network experimentation," presented at the Proceedings of the 2006 conference on Applications, technologies, architectures, and protocols for computer communications, Pisa, Italy, 2006.
[28] M. Handley, E. Kohler, A. Ghosh, O. Hodson, and P. Radoslavov, "Designing extensible IP router software," in Proceedings of the 2nd conference on Symposium on Networked Systems Design & Implementation-Volume 2, 2005, pp. 189-202.
[29] E. Kohler, R. Morris, B. Chen, J. Jannotti, and M. F. Kaashoek, "The Click modular router," ACM Transactions on Computer Systems (TOCS), vol. 18, pp. 263-297, 2000.
[30] P. Szegedi, S. Figuerola, M. Campanella, V. Maglaris, and C. Cervelló-Pastor, "With evolution for revolution: Managing federica for future internet research," Communications Magazine, IEEE, vol. 47, pp. 34-39, 2009.
[31] G. Tao, W. Ning, K. Moessner, and R. Tafazolli, "Shared Backup Network Provision for Virtual Network Embedding," in Communications (ICC), 2011 IEEE International Conference on, 2011, pp. 1-5.
[32] M. Rahman, I. Aib, and R. Boutaba, "Survivable Virtual Network Embedding," in NETWORKING 2010. vol. 6091, M. Crovella, L. Feeney, D. Rubenstein, and S. V. Raghavan, Eds., ed: Springer Berlin Heidelberg, 2010, pp. 40-52.
[33] Y. Chen, J. Li, T. Wo, C. Hu, and W. Liu, "Resilient virtual network service provision in network virtualization environments," in Parallel and Distributed Systems (ICPADS), 2010 IEEE 16th International Conference on, 2010, pp. 51-58.
113
References
[34] Z. Yong and M. Ammar, "Algorithms for Assigning Substrate Network Resources to Virtual Network Components," in INFOCOM 2006. 25th IEEE International Conference on Computer Communications. Proceedings, 2006, pp. 1-12.
[35] H. Yu, V. Anand, C. Qiao, and H. Di, "Migration based protection for virtual infrastructure survivability for link failure," in Optical Fiber Communication Conference, 2011, p. OTuR2.
[36] G. Bingli, Q. Chunming, H. Yongqi, C. Zhangyuan, X. Anshi, H. Shanguo, et al., "A novel virtual node migration approach to survive a substrate link failure," in Optical Fiber Communication Conference and Exposition (OFC/NFOEC), 2012 and the National Fiber Optic Engineers Conference, 2012, pp. 1-3.
[37] C. Cavdar, A. G. Yayimli, and B. Mukherjee, "Multi-Layer Resilient Design for Layer-1 VPNs," in Optical Fiber communication/National Fiber Optic Engineers Conference, 2008. OFC/NFOEC 2008. Conference on, 2008, pp. 1-3.
[38] X. Zhang, X. Chen, and C. Phillips, "Achieving effective resilience for QoS-aware application mapping," Computer Networks The International Journal of Computer and Telecommunications Networking, p. 3179, 2012.
[39] J. Shamsi and M. Brockmeyer, "Efficient and dependable overlay networks," in Parallel and Distributed Processing, 2008. IPDPS 2008. IEEE International Symposium on, 2008, pp. 1-8.
[40] J. Shamsi and M. Brockmeyer, "QoSMap: Achieving Quality and Resilience through Overlay Construction," in Internet and Web Applications and Services, 2009. ICIW '09. Fourth International Conference on, 2009, pp. 58-67.
[41] J. Shamsi and M. Brockmeyer, "QoSMap: QoS aware Mapping of Virtual Networks for Resiliency and Efficiency," in Globecom Workshops, 2007 IEEE, 2007, pp. 1-6.
[42] J. Shamsi and M. Brockmeyer, "Predictable service overlay networks: Predictability through adaptive monitoring and efficient overlay construction and management," Journal of Parallel and Distributed Computing, vol. 72, pp. 70-82, 2012.
[43] H. Yu, V. Anand, C. Qiao, and G. Sun, "Cost efficient design of survivable virtual infrastructure to recover from facility node failures," in Communications (ICC), 2011 IEEE International Conference on, 2011, pp. 1-6.
[44] H. Qian, W. Yang, and C. Xiaojun, "Location-constrained survivable network virtualization," in Sarnoff Symposium (SARNOFF), 2012 35th IEEE, 2012, pp. 1-5.
[45] Q. Chunming, G. Bingli, H. Shanguo, W. Jianping, W. Ting, and G. Wanyi, "A novel two-step approach to surviving facility failures," in Optical Fiber Communication Conference and Exposition (OFC/NFOEC), 2011 and the National Fiber Optic Engineers Conference, 2011, pp. 1-3.
[46] Y. Hongfang, Q. Chunming, V. Anand, L. Xin, D. Hao, and G. Sun, "Survivable Virtual Infrastructure Mapping in a Federated Computing and Networking System under Single Regional Failures," in Global Telecommunications Conference (GLOBECOM 2010), 2010 IEEE, 2010, pp. 1-6.
[47] X. Jielong, T. Jian, K. Kwiat, Z. Weiyi, and X. Guoliang, "Survivable Virtual Infrastructure Mapping in Virtualized Data Centers," in Cloud Computing (CLOUD), 2012 IEEE 5th International Conference on, 2012, pp. 196-203.
[48] I. Houidi, W. Louati, D. Zeghlache, P. Papadimitriou, and L. Mathy, "Adaptive virtual network provisioning," in Proceedings of the second ACM SIGCOMM workshop on Virtualized infrastructure systems and architectures, New Delhi, India, 2010, pp. 41-48.
[49] I. Houidi, W. Louati, and D. Zeghlache, "A distributed virtual network mapping algorithm," in Communications, 2008. ICC'08. IEEE International Conference on,2008, pp. 5634-5640.
114
References
[50] I. Houidi, W. Louati, and D. Zeghlache, "A Distributed and Autonomic Virtual Network Mapping Framework," in Autonomic and Autonomous Systems, 2008. ICAS 2008. Fourth International Conference on, 2008, pp. 241-247.
[51] L. Xin, Q. Chunming, and W. Ting, "Robust Application Specific and Agile Private (ASAP) networks withstanding multi-layer failures," in Optical Fiber Communication - incudes post deadline papers, 2009. OFC 2009. Conference on, 2009, pp. 1-3.
[52] J. Dantas, R. Matos, J. Araujo, and P. Maciel, "An availability model for eucalyptus platform: An analysis of warm-standy replication mechanism," in Systems, Man, and Cybernetics (SMC), 2012 IEEE International Conference on, 2012, pp. 1664-1669.
[53] J. Dantas, R. Matos, J. Araujo, and P. Maciel, "Models for dependability analysis of cloud computing architectures for eucalyptus platform," International Transactions on Systems Science and Applications, vol. 8, pp. 13-25, 2012.
[54] G. Koslovski, W.-L. Yeow, C. Westphal, T. T. Huu, J. Montagnat, and P. Vicat-Blanc, "Reliability support in virtual infrastructures," in Cloud Computing Technology and Science (CloudCom), 2010 IEEE Second International Conference on, 2010, pp. 49-58.
[55] D. Sun, G. Chang, Q. Guo, C. Wang, and X. Wang, "A dependability model to enhance security of cloud environment using system-level virtualization techniques," in Pervasive Computing Signal Processing and Applications (PCSPA), 2010 First International Conference on, 2010, pp. 305-310.
[56] B. Alrubaiey and J. Abawajy, "Virtual networks dependability assessment framework," Int. J. High Performance Computing and Networking, 2016.
[57] M. A. Marsan, "Stochastic Petri nets: an elementary introduction," in Advances in Petri Nets 1989, ed: Springer, 1990, pp. 1-29.
[58] J. Carapinha and J. Jiménez, "Network virtualization: a view from the bottom," in Proceedings of the 1st ACM workshop on Virtualized infrastructure systems and architectures, 2009, pp. 73-80.
[59] V. Lira, E. Tavares, S. Fernandes, and P. Maciel, "Dependable virtual network mapping," Computing, pp. 1-23, 2014.
[60] B. Wei, C. Lin, and X. Kong, "Dependability modeling and analysis for the virtual data center of cloud computing," in High Performance Computing and Communications (HPCC), 2011 IEEE 13th International Conference on, 2011, pp. 784-789.
[61] A. Avizienis, J.-C. Laprie, and B. Randell, Fundamental concepts of dependability:University of Newcastle upon Tyne, Computing Science, 2001.
[62] A. Callado, C. Kamienski, G. Szabo, B. Gero, J. Kelner, S. Fernandes, et al., "A Survey on Internet Traffic Identification," Communications Surveys & Tutorials, IEEE, vol. 11, pp. 37-52, 2009.
[63] C. E. Ebeling, An introduction to reliability and maintainability engineering: Tata McGraw-Hill Education, 2004.
[64] D. M. Nicol, W. H. Sanders, and K. S. Trivedi, "Model-based evaluation: from dependability to security," Dependable and Secure Computing, IEEE Transactions on, vol. 1, pp. 48-65, 2004.
[65] M. A. Marsan, G. Balbo, G. Conte, S. Donatelli, and G. Franceschinis, Modelling with generalized stochastic Petri nets: John Wiley & Sons, Inc., 1994.
[66] V. Lira, E. Tavares, S. Fernandes, and P. Maciel, "Dependable virtual network mapping," Computing, vol. 97, pp. 459-481, 2015.
[67] A. Callado, C. Kamienski, G. Szabó, B. Gero, J. Kelner, S. Fernandes, et al., "A survey on internet traffic identification," Communications Surveys & Tutorials, IEEE, vol. 11, pp. 37-52, 2009.
115
References
[68] P. Maciel, K. Trivedi, and D. Kim, "Dependability Modeling In: Performance and Dependability in Service Computing: Concepts, Techniques and Research Directions," Hershey: IGI Global, Pennsylvania, USA, vol. 13, 2010.
[69] I. B. Barla, D. A. Schupke, M. Hoffmann, and G. Carle, "Optimal design of virtual networks for resilient cloud services," in Design of Reliable Communication Networks (DRCN), 2013 9th International Conference on the, 2013, pp. 218-225.
[70] Assessment of Power System Reliability, ed: Springer London, 2011, pp. 119-123.
[71] X. Hu, S. Liu, and L. Ma, "Research on dependability of virtual computing system based on Stochastic Petri nets," in Computer Application and System Modeling (ICCASM), 2010 International Conference on, 2010, pp. V8-239-V8-243.
[72] X. Zhang, C. Lin, and X. Kong, "Model-driven dependability analysis of virtualization systems," in Computer and Information Science, 2009. ICIS 2009. Eighth IEEE/ACIS International Conference on, 2009, pp. 199-204.
[73] T. Thein and J. S. Park, "Availability analysis of application servers using software rejuvenation and virtualization," Journal of computer science and technology, vol. 24, pp. 339-346, 2009.
[74] Z. Hong, Y. Wang, and M. Shi, "CTMC-based availability analysis of cluster system with multiple nodes," in Advances in Future Computer and Control Systems, ed: Springer, 2012, pp. 121-125.
[75] S. Fernandes, E. Tavares, M. Santos, V. Lira, and P. Maciel, "Dependability assessment of virtualized networks," in Communications (ICC), 2012 IEEE International Conference on, 2012, pp. 2711-2716.
[76] H. V. Ramasamy and M. Schunter, "Architecting dependable systems using virtualization," in Workshop on Architecting Dependable Systems, 2007.
[77] A. Rezaei and M. Sharifi, "Rejuvenating high available virtualized systems," in Availability, Reliability, and Security, 2010. ARES'10 International Conference on,2010, pp. 289-294.
[78] M. Rosenblum and T. Garfinkel, "Virtual machine monitors: Current technology and future trends," Computer, vol. 38, pp. 39-47, 2005.
[79] V. I. A. H. A. VMware, "Services with VMware HA," VMWARE Technical Note, 2007.[80] B. Silva, G. Callou, E. Tavares, P. Maciel, J. Figueiredo, E. Sousa, et al., "Astro: An
integrated environment for dependability and sustainability evaluation," Sustainable Computing: Informatics and Systems, vol. 3, pp. 1-17, 2013.
[81] E. W. Zegura, K. L. Calvert, and S. Bhattacharjee, "How to model an internetwork," in INFOCOM'96. Fifteenth Annual Joint Conference of the IEEE Computer Societies. Networking the Next Generation. Proceedings IEEE, 1996, pp. 594-602.
[82] J. H. Abawajy, "Adaptive hierarchical scheduling policy for enterprise grid computing systems," Journal of network and computer applications, vol. 32, pp. 770-779, 2009.
[83] J. Lu and J. Turner, "Efficient mapping of virtual networks onto a shared substrate," 2006.
[84] N. M. K. Chowdhury and R. Boutaba, "A survey of network virtualization," Computer Networks, vol. 54, pp. 862-876, 2010.
[85] N. F. Butt, M. Chowdhury, and R. Boutaba, Topology-awareness and reoptimization mechanism for virtual network embedding: Springer, 2010.
[86] A. Berl, A. Fischer, and H. de Meer, "Using system virtualization to create virtualized networks," Electronic Communications of the EASST, vol. 17, 2009.
[87] Y. Xu, J. Luo, and L. Chen, "An Advance Resource Allocation Algorithm in Network Virtualization," in Green Communications and Networks, ed: Springer, 2012, pp. 1207-1216.
116
References
[88] A. Basta, B. Barla, M. Hoffmann, G. Carle, and D. A. Schupke, "Failure coverage in optimal virtual networks," in Optical Fiber Communication Conference, 2013, p. OTh3E. 2.
[89] H. Yu, V. Anand, C. Qiao, H. Di, and X. Wei, "A cost efficient design of virtual infrastructures with joint node and link mapping," Journal of Network and Systems Management, vol. 20, pp. 97-115, 2012.
[90] M. L. Massie, B. N. Chun, and D. E. Culler, "The ganglia distributed monitoring system: design, implementation, and experience," Parallel Computing, vol. 30, pp. 817-840, 2004.
[91] H. B. Newman, I. C. Legrand, P. Galvez, R. Voicu, and C. Cirstoiu, "Monalisa: A distributed monitoring service architecture," arXiv preprint cs/0306096, 2003.
[92] S. Andreozzi, N. De Bortoli, S. Fantinel, A. Ghiselli, G. L. Rubini, G. Tortone, et al.,"GridICE: a monitoring service for Grid systems," Future Generation Computer Systems, vol. 21, pp. 559-571, 2005.
[93] B. Javadi, J. Abawajy, and R. Buyya, "Failure-aware resource provisioning for hybrid Cloud infrastructure," Journal of parallel and distributed computing, vol. 72, pp. 1318-1331, 2012.
[94] Q. Guan, Z. Zhang, and S. Fu, "Ensemble of bayesian predictors and decision trees for proactive failure management in cloud computing systems," Journal ofCommunications, vol. 7, pp. 52-61, 2012.
[95] Y. Wei, J. Wang, C. Wang, and C. Wang, "Bandwidth allocation in virtual network based on traffic prediction," in Computer Design and Applications (ICCDA), 2010 International Conference on, 2010, pp. V5-304-V5-307.
[96] S. Clayman, A. Galis, and L. Mamatas, "Monitoring virtual networks with lattice," in Network Operations and Management Symposium Workshops (NOMS Wksps), 2010 IEEE/IFIP, 2010, pp. 239-246.
[97] T. A. Funkhouser, "Network Topologies for Scalable Multi-User Virtual Environments," in vrais, 1996, p. 222.
[98] S. Russell, P. Norvig, and A. Intelligence, "A modern approach," Artificial Intelligence. Prentice-Hall, Egnlewood Cliffs, vol. 25, 1995.
[100] J. Pelkey and G. Riley, "Distributed simulation with MPI in ns-3," in Proceedings of the 4th International ICST Conference on Simulation Tools and Techniques, 2011, pp. 410-414.
[101] K. M. Chandy and J. Misra, "Distributed simulation: A case study in design and verification of distributed programs," Software Engineering, IEEE Transactions on, pp. 440-452, 1979.
[102] R. E. Bryant, "Simulation of packet communication architecture computer systems," 1977.
[103] NS-3. (2015, 15/9). Available: https://www.nsnam.org/[104] S. Hasan, S. O'Riain, and E. Curry, "Approximate semantic matching of heterogeneous
events," in Proceedings of the 6th ACM International Conference on Distributed Event-Based Systems, 2012, pp. 252-263.
[105] G. Riley and T. Henderson, "The ns-3 network simulator modeling and tools for network simulation," Modeling and Tools for Network Simulation, pp. 15-34.
[106] A. Medina, A. Lakhina, I. Matta, and J. Byers, "BRITE: An approach to universal topology generation," in Modeling, Analysis and Simulation of Computer and Telecommunication Systems, 2001. Proceedings. Ninth International Symposium on,2001, pp. 346-353.
117
References
[107] C.-C. Chang and C.-J. Lin, "LIBSVM: a library for support vector machines," ACM Transactions on Intelligent Systems and Technology (TIST), vol. 2, p. 27, 2011.
[108] M. Hall, E. Frank, G. Holmes, B. Pfahringer, P. Reutemann, and I. H. Witten, "The WEKA data mining software: an update," ACM SIGKDD explorations newsletter, vol. 11, pp. 10-18, 2009.
[109] Q. Guan, Z. Zhang, and S. Fu, "Ensemble of bayesian predictors for autonomic failure management in cloud computing," in Computer Communications and Networks (ICCCN), 2011 Proceedings of 20th International Conference on, 2011, pp. 1-6.
[110] S. Di, D. Kondo, and W. Cirne, "Host load prediction in a Google compute cloud witha Bayesian model," in Proceedings of the International Conference on High Performance Computing, Networking, Storage and Analysis, 2012, p. 21.
[111] J. W. Mickens and B. D. Noble, "Exploiting availability prediction in distributed systems," Ann Arbor, vol. 1001, p. 48103, 2006.
[112] J. Gu, Z. Zheng, Z. Lan, J. White, E. Hocks, and B.-H. Park, "Dynamic meta-learning for failure prediction in large-scale systems: A case study," in Parallel Processing, 2008. ICPP'08. 37th International Conference on, 2008, pp. 157-164.
[113] W. Cui and M. A. Bassiouni, "Virtual private network bandwidth management with traffic prediction," Computer Networks, vol. 42, pp. 765-778, 2003.
[114] S. F. Bush, "Active virtual network management prediction: complexity as a frameworkfor prediction, optimization, and assurance," in DARPA Active NEtworks Conference and Exposition, 2002. Proceedings, 2002, pp. 534-553.
[115] J. J. Prevost, K. Nagothu, B. Kelley, and M. Jamshidi, "Prediction of cloud data center networks loads using stochastic and neural models," in System of Systems Engineering (SoSE), 2011 6th International Conference on, 2011, pp. 276-281.
[116] W. Fang, Z. Lu, J. Wu, and Z. Cao, "RPPS: a novel resource prediction and provisioning scheme in cloud data center," in Services Computing (SCC), 2012 IEEE Ninth International Conference on, 2012, pp. 609-616.
[117] D. J. Dean, H. Nguyen, and X. Gu, "Ubl: unsupervised behavior learning for predicting performance anomalies in virtualized cloud systems," in Proceedings of the 9thinternational conference on Autonomic computing, 2012, pp. 191-200.
[118] Q. Guan, Z. Zhang, and S. Fu, "A failure detection and prediction mechanism for enhancing dependability of data centers," International Journal of Computer Theory and Engineering, vol. 4, pp. 726-730, 2012.
[119] P.-F. Pai, "System reliability forecasting by support vector machines with genetic algorithms," Mathematical and Computer Modelling, vol. 43, pp. 262-274, 2006.
[120] V. Vapnik, The nature of statistical learning theory: Springer Science & Business Media, 2013.
[121] D. Meyer and F. T. Wien, "Support vector machines," The Interface to libsvm in package e1071, 2015.
[122] F. E. Tay and L. Cao, "Application of support vector machines in financial time series forecasting," Omega, vol. 29, pp. 309-317, 2001.
[123] W. A. Fuller, Introduction to statistical time series vol. 428: John Wiley & Sons, 2009.[124] C. Chatfield, The analysis of time series: an introduction: CRC press, 2013.[125] T. Chai and R. R. Draxler, "Root mean square error (RMSE) or mean absolute error
(MAE)?–Arguments against avoiding RMSE in the literature," Geoscientific Model Development, vol. 7, pp. 1247-1250, 2014.
[126] R. J. Hyndman and A. B. Koehler, "Another look at measures of forecast accuracy," International journal of forecasting, vol. 22, pp. 679-688, 2006.
[127] B. Schroeder and G. A. Gibson, "Disk failures in the real world: What does an MTTF of 1, 000, 000 hours mean to you?," in FAST, 2007, pp. 1-16.
118
References
[128] K. V. Vishwanath and N. Nagappan, "Characterizing cloud computing hardware reliability," in Proceedings of the 1st ACM symposium on Cloud computing, 2010, pp. 193-204.
[129] F. Longo, R. Ghosh, V. K. Naik, and K. S. Trivedi, "A scalable availability model for infrastructure-as-a-service cloud," in Dependable Systems & Networks (DSN), 2011 IEEE/IFIP 41st International Conference on, 2011, pp. 335-346.
[130] P. Saripalli and B. Walters, "Quirc: A quantitative impact and risk assessment framework for cloud security," in Cloud Computing (CLOUD), 2010 IEEE 3rd International Conference on, 2010, pp. 280-288.
[131] Z. Zheng, H. Ma, M. R. Lyu, and I. King, "Collaborative Web Service QoS Prediction via Neighborhood Integrated Matrix Factorization," IEEE Transactions on Services Computing, vol. 6, pp. 289-299, 2013.