AST EQA scheme for human Salmonella and Campylobacter infections in EU/EEA Johanna Takkinen Food- and Waterborne Diseases and Zoonoses Programme European Centre for Disease Prevention and Control 6 th EURL-AR workshop, Kgs. Lyngby, Denmark, 23 April 2012
Transcript
AST EQA scheme for human Salmonella and Campylobacter infections in EU/EEA Johanna Takkinen Food- and Waterborne Diseases and Zoonoses Programme European Centre for Disease Prevention and Control
6th EURL-AR workshop, Kgs. Lyngby, Denmark, 23 April 2012
AMR monitoring in humans - methods
Data on AMR submitted to the European Surveillance System (TESSy) annually as part of data collection for EFSA-ECDC European Union Summary Report on Zoonoses
AMR data collected for Salmonella, Campylobacter, STEC/VTEC
– S/I/R interpreted data – Methods: disc diffusion, E-test and broth dilution
EU case definition for generic AMR proposed
– Clinical breakpoints (MIC or DD) according to EUCAST
Resistance in human infections for Salmonella spp. in 2010 (Total cases N=99,020)
Antimicrobial (MSs) Number of tested strains
Resistant Range
Ampicillin (19) 25,525 28,0 % 11,6 %- 58,5 %
Cefotaxime (16) 24,251 1,0% 0,1 % - 4,3 %
Chloramphenicol (15) 20,874 6,7% 1,2 % - 21,3 %
Ciprofloxacin (19) 24,927 8,6% 0,0 % - 15,3 %
Gentamicin (17) 23,447 6,7% 0,0 % - 94,1 %
Kanamycin (14) 20,288 1,7% 0.,3 % - 4,5 %
Nalidixic acid (15) 22,117 15,3% 6,6 % - 28,7 %
Streptomycin (16) 21,642 19,8% 7,2 % - 60,5 %
Sulphonamides (14) 18,774 25,4% 7,2 % - 64,7 %
Tetracyclines (15) 21,086 28,4% 7,4 % - 60,2 %
Trimethoprim (17) 23,726 8,3% 2,2 % - 10,6 %
Source: The European Union Summary Report on antimicrobial resistance in zoonotic and indicator bacteria from humans, animals and food in 2010 (publication date 14 March 2012)
Resistance in human infections with Salmonella Enteritidis (N=43,563) and Salmonella Typhimurium (N=21,671)
*Range of reporting countries by antimicrobial: 13-18 Member States
Source: The European Union Summary Report on antimicrobial resistance in zoonotic and indicator bacteria from humans, animals and food in 2010 (publication date 14 March 2012)
Resistance in human infections of Salmonella Enteritidis (N=43,563) and Salmonella Typhimurium (N=21,671)
*Range of reporting countries by antimicrobial: 13-18 Member States
Source: The European Union Summary Report on antimicrobial resistance in zoonotic and indicator bacteria from humans, animals and food in 2010 (publication date 14 March 2012)
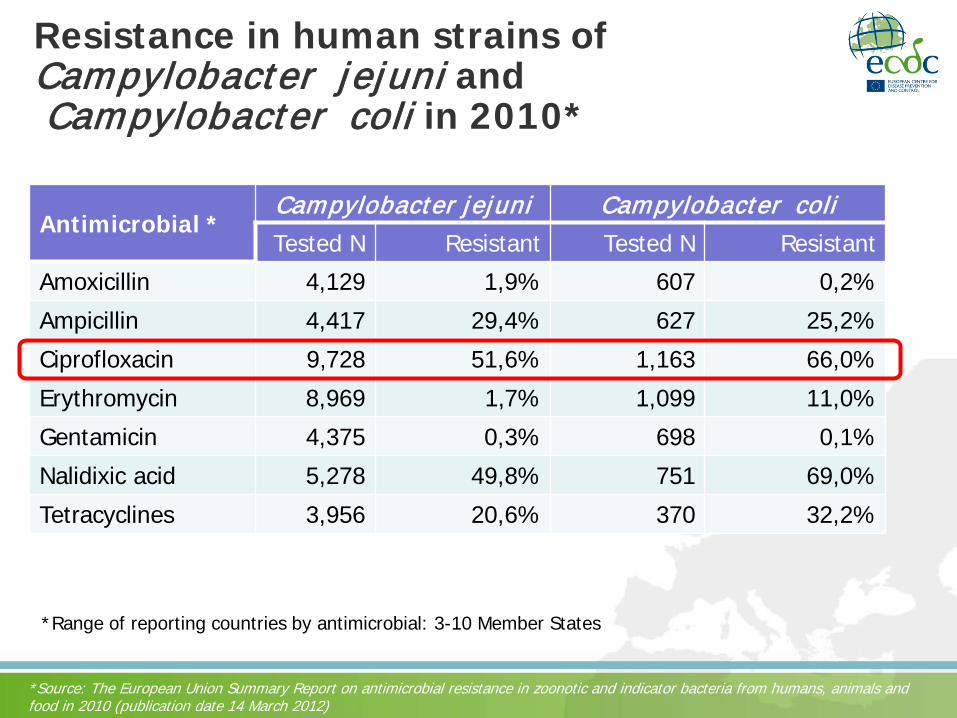
Resistance in human strains of Campylobacter jejuni and Campylobacter coli in 2010*
*Source: The European Union Summary Report on antimicrobial resistance in zoonotic and indicator bacteria from humans, animals and food in 2010 (publication date 14 March 2012)
*Range of reporting countries by antimicrobial: 3-10 Member States
MDR-monitoring of Salmonella spp. - quarterly report example Q1/2010
At least 20 isolates per serotype tested, MDR for ≥ 4 antimicrobials
External quality assurance – Salmonella and Campylobacter AST (Scheme organised by EU Reference Laboratory for AST)
ECDC objective: – To enable comparison between public health and
veterinary laboratories – To identify general problematic areas
10 countries participated – 10 laboratories for Campylobacter – 9 laboratories for Salmonella
Salmonella AST results by antimicrobial, 9 laboratories, 2011
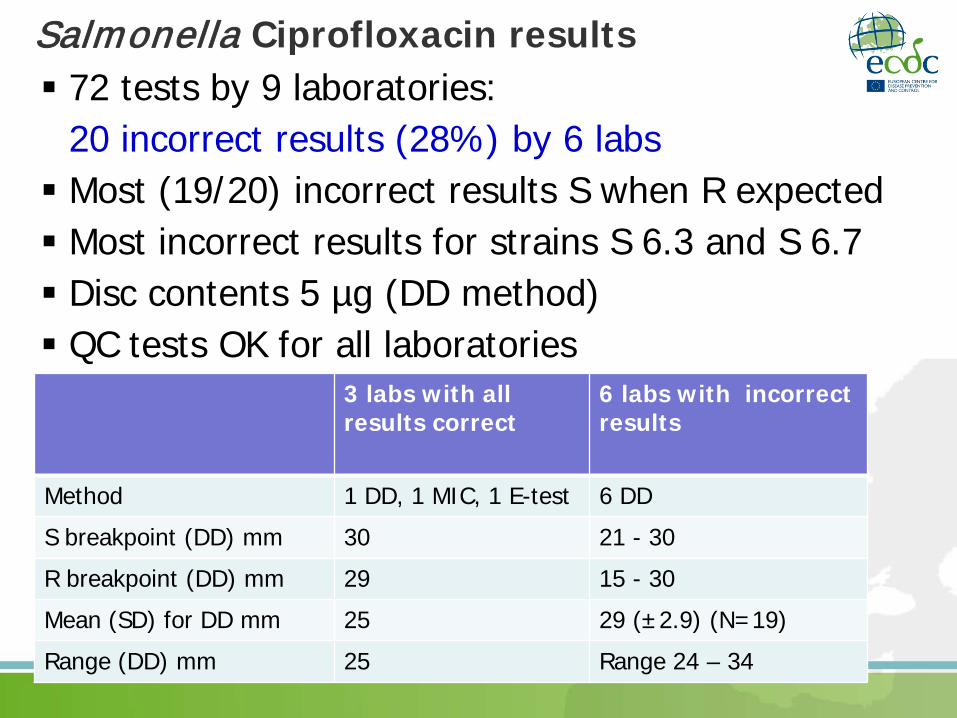
Salmonella Ciprofloxacin results 72 tests by 9 laboratories: 20 incorrect results (28%) by 6 labs Most (19/20) incorrect results S when R expected Most incorrect results for strains S 6.3 and S 6.7 Disc contents 5 µg (DD method) QC tests OK for all laboratories
3 labs with all results correct
6 labs with incorrect results
Method 1 DD, 1 MIC, 1 E-test 6 DD
S breakpoint (DD) mm 30 21 - 30
R breakpoint (DD) mm 29 15 - 30
Mean (SD) for DD mm 25 29 (±2.9) (N=19)
Range (DD) mm 25 Range 24 – 34
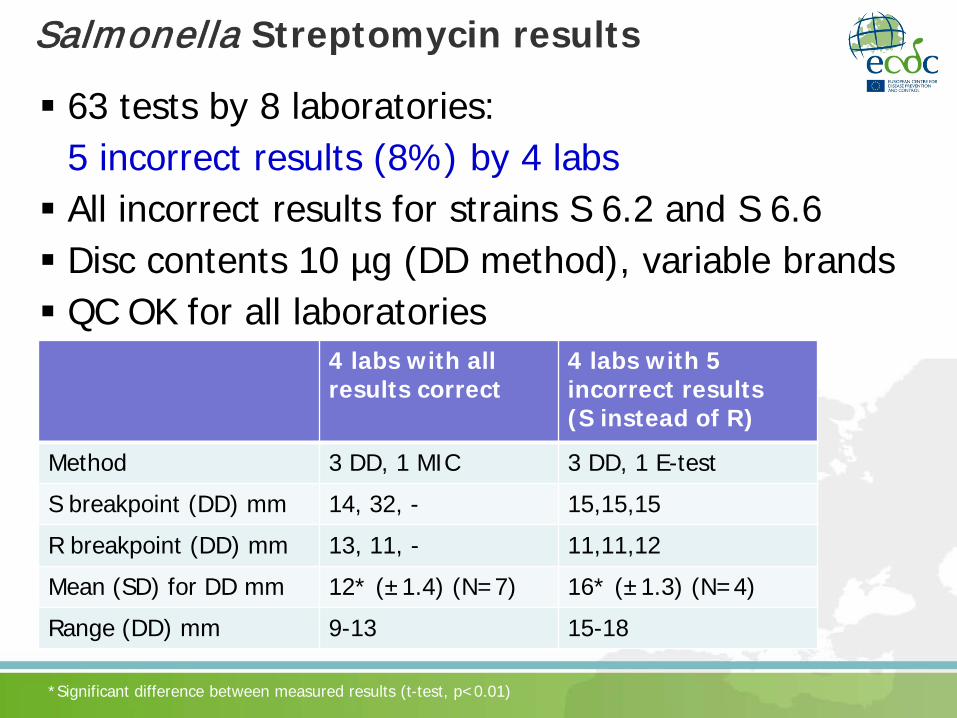
Salmonella Streptomycin results
63 tests by 8 laboratories: 5 incorrect results (8%) by 4 labs All incorrect results for strains S 6.2 and S 6.6 Disc contents 10 µg (DD method), variable brands QC OK for all laboratories
4 labs with all results correct
4 labs with 5 incorrect results (S instead of R)
Method 3 DD, 1 MIC 3 DD, 1 E-test
S breakpoint (DD) mm 14, 32, - 15,15,15
R breakpoint (DD) mm 13, 11, - 11,11,12
Mean (SD) for DD mm 12* (±1.4) (N=7) 16* (±1.3) (N=4)
Range (DD) mm 9-13 15-18
*Significant difference between measured results (t-test, p<0.01)
Campylobacter AST results by antimicrobial, 10 laboratories, 2011
93.5%
95.2%
100.0%
100.0%
100.0%
100.0%
100.0%
90.0% 92.0% 94.0% 96.0% 98.0% 100.0%
Streptomycin, STR (N=31)
Gentamycin, GEN (N=63)
Chloramphenicol, CHL (N=39)
Ciprofloxacin, CIP (N=79)
Nalidixid acid, NAL (N=55)
Erythromycin, ERT (N=79)
Tetracycline, TET (N=62)
1 lab; 2 strains
1 lab; 3 strains
Conclusions EQA results for Campylobacter very good; no general
problem EQA results for Salmonella;
– Ciprofloxacin, standardisation needed for DD method: • High uncertainty • Highly variable interpretation criteria • Relatively wide intermediate zones (3-6 mm)
– Streptomycin, DD method requires further assessment:
• Significant difference between incorrect and correct measurements • Slightly variable interpretation criteria
Next steps: work in progress Aim in 2012:
– Drafting AMR monitoring objectives, panels of antimicrobials to be monitored => into EU protocol for harmonised monitoring of Salmonella and Campylobacter infections in humans
May 2012: Expert consultation on AST methods, break points, joint
needs for analyses of human, animal, and food data
July – December 2012: – Pilot testing of voluntary reporting of quantitative AMR to TESSy – Network’s consultations on draft EU protocol
November-December 2012:
– Discussion with MSs Surveillance focal points; EU protocol
Spring 2013: Joint meeting of FWD Network with EFSA Task Force on Zoonoses data collection on AMR
Thank you!
Acknowledgements Susanne Karlsmose, DTU Rene Hendriksen, DTU Martin Cormican, Ireland ECDC team: Aino-Maija Aikkinen (analysis of EQA data) Angela Lahuerta-Marin Taina Niskanen Therese Westrell Marc Struelens Dominique Monnet Ole Heuer