Standard Test Methods forFlexible Cellular Materials—Slab, Bonded, and MoldedUrethane Foams1
This standard is issued under the fixed designation D 3574; the number immediately following the designation indicates the year oforiginal adoption or, in the case of revision, the year of last revision. A number in parentheses indicates the year of last reapproval. Asuperscript epsilon (´) indicates an editorial change since the last revision or reapproval.
This standard has been approved for use by agencies of the Department of Defense.
1. Scope*
1.1 These test methods apply to slab, bonded, and moldedflexible cellular products known as urethane foams. Urethanefoam may be generally defined as an expanded cellular productproduced by the interaction of active hydrogen compounds,water, and isocyanates.
1.2 This standard does not purport to address all of thesafety concerns, if any, associated with its use. It is theresponsibility of the user of this standard to establish appro-priate safety and health practices and determine the applica-bility of regulatory limitations prior to use.
1.3 The values stated in SI units are to be regarded asstandard.
NOTE 1—There is no known ISO equivalent to this standard, howevercertain test methods in this standard have similar or equivalent ISOstandards and are listed in the scope of the individual test method sections.
2. Referenced Documents
2.1 ASTM Standards: 2
D 412 Test Methods for Vulcanized Rubber and Thermo-plastic Elastomers—Tension
D 624 Test Method for Tear Strength of ConventionalVulcanized Rubber and Thermoplastic Elastomers
D 726 Test Method for Resistance of Nonporous Paper toPassage of Air
D 737 Test Method for Air Permeability of Textile FabricsD 3576 Test Method for Cell Size of Rigid Cellular PlasticsD 3675 Test Method for Surface Flammability of Flexible
Cellular Materials Using a Radiant Heat Energy Source
E 162 Test Method for Surface Flammability of MaterialsUsing a Radiant Heat Energy Source
E 662 Test Method for Specific Optical Density of SmokeGenerated by Solid Materials
E 691 Practice for Conducting an Interlaboratory Study toDetermine the Precision of a Test Method
3. Terminology
3.1 Definitions of Terms Specific to This Standard:3.1.1 bonded foam—a product produced by the adhesion of
small pieces of urethane foam to each other with a suitablebonding agent.
3.1.2 core—the internal portion of a molded part, free ofskin.
3.1.3 cored foam—a flexible cellular material containing amultiplicity of holes (usually, but not necessarily, cylindrical inshape), molded or cut into the material in some pattern,normally perpendicular to the foam rise direction, and extend-ing part or all the way through the piece.
3.1.4 convoluted foam—a flexible cellular material spe-cially cut into sheets with “egg carton”-like dimples. Thedimple peaks and bases can have varied shapes and dimen-sions.
3.1.5 flexible cellular product—a cellular organic polymericmaterial that will not rupture when a specimen 200 by 25 by 25mm is bent around a 25-mm diameter mandrel at a uniform rateof one lap in 5 s at a temperature between 18 and 29°C.
3.1.6 molded foam—a cellular product having the shape ofthe enclosed chamber in which it is produced by foaming.
3.1.7 skin—the smooth surface layer of a molded foamproduct, formed by contact with the mold or surfaces.
3.1.8 slab—a section of foam that is cut from the internalportion of a large bun.
3.1.9 urethane foam—a flexible cellular product producedby the interaction of active hydrogen compounds, water, andisocyanates.
3.1.10 viscoelastic foam—a specially formulated urethanefoam characterized by having slow recovery, low resilience,and high hysteresis loss.
1 These test methods are under the jurisdiction of ASTM Committee D20 onPlastics and are the direct responsibility of Subcommittee D20.22 on CellularMaterials - Plastics and Elastomers.
Current edition approved July 1, 2008. Published September 2008. Originallyapproved in 1977. Last previous edition approved in 2005 as D 3574 – 05.
2 For referenced ASTM standards, visit the ASTM website, www.astm.org, orcontact ASTM Customer Service at [email protected]. For Annual Book of ASTMStandards volume information, refer to the standard’s Document Summary page onthe ASTM website.
1
*A Summary of Changes section appears at the end of this standard.
Copyright by ASTM Int'l (all rights reserved); Mon Dec 1 21:59:24 EST 2008Downloaded/printed by3M Co pursuant to License Agreement. No further reproductions authorized.
3.1.11 cell count—a measurement used to characterize dif-ferent types of foams based on the size of the individual cellsin the foam matrix, typically expressed as either average celldiameter or as the number of cells per linear distance. Formeasuring cell counts, see Test Method D 3576
4. Summary of Test Methods
4.1 Unless specifically stated otherwise between the sup-plier and the purchaser, all tests shall be made in accordancewith the methods specified in Sections 9-124 which include testprocedures for the following:
Tests: SectionsTest A Density Test 9-15Test B1 Indentation Force Deflection Test—Specified
Test C Compression Force Deflection Test 30-36Test D Constant Deflection Compression Set Test 37-44Test E Tensile Test 45-52Test F Tear Resistance Test 53-60Test G Air Flow Test 61-67Test H Resilience (Ball Rebound) Test 68-75Test I1 Static Force Loss Test at Constant Deflection
77-85Test I2 Dynamic Fatigue Test by the Roller Shear at
Constant Force, 86-94Test I3 Dynamic Fatigue Test by Constant Force
Pounding 95-103Test I4 Dynamic Fatigue Test for Carpet Cushion 104-112
Aging Test J Steam Autoclave Aging 113-118Aging Test K Dry Heat Aging 119-124Aging Test L Wet Heat Aging 125-130
Test M Recovery Time 131-136
Appendixes:X1. Suggested Method for Specifying Flexible Urethane FoamsX2. Suggested Method of Construction for a Roller Shear Dynamic Flex Fa-
tigue ApparatusX3. Definitions of Terms Used to Describe the Force-Deflection Curve of
Flexible Urethane FoamX4. Suggested Tests for Determining Combustibility of Flexible Urethane
Foam. (The combustion tests are given for informational purposes onlyand are not part of the standard.)
X5. Suggested Method for Verification of an Inclined Oil ManometerX6. Suggested Method for Measuring Hysteresis Loss of Foams
5. Significance and Use
5.1 The test procedures provide a standard method ofobtaining data for research and development, quality control,acceptance and rejection under specifications, and specialpurposes.
5.2 The data obtained by these test methods are applicableto the material under conditions of the particular test and arenot necessarily the same as obtained in other environments inuse.
6. General Test Conditions
6.1 Tests shall be conducted under known conditions oftemperature and humidity or as specified in the individual testprocedure. The product shall be conditioned undeflected, andundistorted at the temperature and humidity of test for at least12 h before being tested. In cases of dispute, the tests shall bemade at a temperature of 23 6 2°C and in an atmosphere of 506 5 % relative humidity.
6.2 It is recommended for referee purposes that all testsshall be performed 7 days or more after the foam has beenmanufactured.
7. Sampling
7.1 When possible, the completed manufactured productshall be used for the test specified. Representative samples ofthe lot being examined shall be selected at random as required.
7.2 When it is necessary or advisable to obtain specimensfrom the articles, as in those cases where the entire sample isnot required or adaptable for testing, the method of cutting andthe exact position from which specimens are to be taken shallbe specified. The density and the state of cure may vary indifferent parts of the finished product, especially if the article isof complicated shape or of varying thickness, and these factorsaffect the physical properties of the specimens. Also, thedensity is affected by the number of cut surfaces on thespecimen. If a test specimen is die cut, sufficient time should beallowed for complete recovery of the thickness across the fullwidth of the specimen.
7.3 When the finished molded product does not lend itself totesting or to the taking of specimens because of complicatedshape, small size, metal or fabric inserts, adhesion to metal, orother reasons, molded test slabs as agreed upon between thesupplier and the purchaser shall be prepared.
7.4 When differences in test results arise due to the difficultyin obtaining suitable specimens from the finished parts, thesupplier and the purchaser may agree upon an acceptablelocation to take the specimen.
8. Measurement of Test Specimens
8.1 Measure the length and width with a scale or tape. Takecare not to distort the foam.
8.2 Measure thickness up to and including 25 mm using adial-type gauge with a minimum foot area of 650 mm2. Holdthe pressure of the dial foot to a maximum of 800 Pa (see Note2). Thicknesses over 25 mm may be measured with a dialgauge, a sliding caliper gauge, or as specified in 8.1. When asliding caliper gauge is employed, make the gauge setting withthe gauge out of contact with the foam. Pass the specimenthrough the previously set gauge; the proper setting shall be theone when the measuring faces of the gauge contact the surfacesof the specimen without compressing it.
NOTE 2—For soft foams having compression force deflection valuesless than 1.65 kPa, the pressure on the dial foot shall not exceed 200 Pa.
8.3 The scale, tape, or gauge shall be graduated so as topermit measurements within 61 % of the dimensions to bemeasured.
8.4 Unless otherwise specified, results shall be the mean ofthe measurements.
TEST A—DENSITY TEST
9. Scope
9.1 This test method covers determination of the density ofuncored foam by calculation from the mass and volume of thespecimen. The density value thus obtained applies only to the
D 3574 – 08
2Copyright by ASTM Int'l (all rights reserved); Mon Dec 1 21:59:24 EST 2008Downloaded/printed by3M Co pursuant to License Agreement. No further reproductions authorized.
我的胶粘剂网www.wdjnj.com
immediate area from which the specimen has been taken. Itdoes not necessarily relate to the bulk density of the entiremolded pad.
NOTE 3—This standard is equivalent to ISO 845.
10. Test Specimen
10.1 Core Density—A representative specimen of regularshape, circular or square without skins or densification lines,not less than 1000 mm3 in volume, shall be cut from a portionfree of voids and defects and as near as possible to the sectionfrom which the tension and tear specimens were taken.
10.2 Section Density—A representative specimen with skinson the top and bottom surface measuring at least 0.1 m2 in areaby full-part thickness shall be cut from an area free of voidsand defects and as near as possible to the location from whichthe tension and tear specimens were taken. When thesedimensions are not possible, the largest representative portionas agreed upon between the supplier and the purchaser shall beused.
11. Number of Specimens
11.1 One specimen shall be tested, unless otherwise agreedupon by the supplier and the purchaser.
12. Procedure
12.1 Determine the mass of the specimen within 1 %.12.2 Determine the dimensions of the specimen in accor-
dance with Section 8, and calculate the volume.
13. Calculation
13.1 Calculate the density in kilograms per cubic metre asfollows:
Density 5 M/V 3 106 (1)
where:M = mass of specimen, g, andV = volume of specimen, mm3.
14. Report
14.1 Report the following information:14.1.1 Density to the nearest 0.1 kg/m3, and14.1.2 Type of specimen, core or section.
15. Precision and Bias
15.1 See Section 137 for Precision and Bias statements.
TEST B1 —INDENTATION FORCE DEFLECTIONTEST—SPECIFIED DEFLECTION (IFD)
16. Scope
16.1 This will be known as the indentation force deflectiontest and the results as the IFD values. This test consists ofmeasuring the force necessary to produce designated indenta-tions in the foam product, for example, 25 and 65 % deflec-tions. (Appendix X3).
NOTE 4—This standard and ISO 2439 address the same subject matter,but differ in technical content and results cannot be directly comparedbetween the two methods.
17. Apparatus
17.1 An apparatus having a flat circular indentor foot 203mm in diameter connected by means of a swivel joint capableof accommodating the angle of the sample to a force-measuring device and mounted in such a manner that theproduct or specimen can be deflected at a speed of 50 to 500mm/min. The apparatus shall be arranged to support thespecimen on a level horizontal plate which is perforated withapproximately 6.5-mm holes on approximately 20-mm centersto allow for rapid escape of air during the test. Special supportfor contoured molded pads shall be perforated in the samemanner as the flat plate unless agreed upon between thesupplier and the purchaser. Pads longer than the base plate shallbe supported from distortion at the 4.5-N contact force.
18. Test Specimen
18.1 The test specimen shall consist of the entire productsample or a suitable portion of it, except that in no case shallthe specimen have dimensions less than 380 by 380 by 100mm. Specimens less or different than 100 mm in thicknessshall have the thickness noted on the test report.
18.2 The IFD values for molded products are dependent onthe specimen dimensions. Higher values are generally obtainedfor specimens that retain all molded surfaces.
19. Number of Specimens
19.1 One specimen shall be tested, unless otherwise agreedupon by the supplier and the purchaser.
20. Procedure
20.1 Place the test specimen in position on the supportingplate of the apparatus. If the product has one side cored orhoneycombed, this face shall rest on the perforated plate. Thespecimen position shall be such that whenever, practicable theindentation will be made at the center of all articles, exceptwhere another location is agreed upon by the supplier and thepurchaser.
20.2 Preflex the area to be tested by twice lowering theindentor foot to a total deflection of 75 to 80 % of the full-partthickness at a rate of 250 6 25 mm/min. Mark the location ofthe test area with a pen by circumscribing the indentor footwhile under a 4.5-N force. Allow the specimen to rest 6 6 1min after the preflex.
20.3 Bring the indentor foot into contact with the specimenand determine the thickness after applying a contact force of4.5 N (Note 5) to the indentor foot. Indent the specimen at 506 5 mm/min 25 % of this thickness and observe the force innewtons after 60 6 3 s. Without removing the specimen,increase the deflection to 65 % deflection, allowing the force todrift while maintaining the 65 % deflection, and again observethe force in newtons after 60 6 3 s.
NOTE 5—For super-soft foam, foam with a 25 % IFD less than 40 N, areduction of pressure on the indentor foot shall be allowed. Sufficientcontact force to make an accurate initial thickness measurement isrequired.
21. Report
21.1 Report the force in newtons required for 25 and 65 %indentation or other indentations (Note 6). These figures are
D 3574 – 08
3Copyright by ASTM Int'l (all rights reserved); Mon Dec 1 21:59:24 EST 2008Downloaded/printed by3M Co pursuant to License Agreement. No further reproductions authorized.
known as the 25 % and 65 % IFD values, respectively. Reportlength, width, and thickness of the specimen, if non-standard,and the ratio (support factor Appendix X3) of 65 % to 25 %IFD values.
NOTE 6—Indentation deflection tests, other than 25 and 65 %, as well asa 25 % return value (25 % RT), may be specified as agreed upon betweenthe supplier and the purchaser.
22. Precision and Bias
22.1 See Section 137 for Precision and Bias statements.
TEST B2 —INDENTATION RESIDUAL GAGELENGTH TEST—SPECIFIED FORCE (IRGL)
23. Scope
23.1 Cellular foam products have been traditionally checkedfor indentation force deflection by determining the forcerequired to effect a 25 % deflection. In seating, on the otherhand, the interest is in determining how thick the padding isunder the average person. Two measurements are called for tomeet the requirements of this test method. The force deflectionis determined by measuring the thickness of the pad under afixed force of 4.5 N, 110 N, and 220 N, on a 323-cm2 circularindentor foot.
23.2 This determination shall be known as the IndentationResidual Gage Length and the measurements as the IRGLvalues.
NOTE 7—This standard and ISO 2439 address the same subject matter,but differ in technical content; and results cannot be directly comparedbetween the two methods.
24. Apparatus
24.1 An apparatus having a flat circular indentor foot 203mm in diameter, connected with a swivel joint for applyingforces of 4.5 N, 110 N, 220 N and 330 N, shall be mountedover a level horizontal platform that is perforated with approxi-mately 6.5-mm holes on approximately 20-mm centers toallow for rapid escape of air during the test. The distancebetween the indentor foot and the platform shall be variable toindent the specimen at a speed of 50 to 200 mm/min forthickness measurements. The apparatus shall be equipped witha device for measuring the distance between plates.
24.2 Special support for contoured molded pads shall beperforated and agreed upon between the supplier and thepurchaser. Pads longer than the base plate shall be supportedfrom distortion at the 4.5-N contact force.
25. Test Specimen
25.1 When possible the completed manufactured productshall be used. In the case of tapered cushions, the location ofthe area for measurement is to be agreed upon between thesupplier and the purchaser. In the case a finished part is notfeasible for test, 380 by 380-mm specimens of an averagethickness are to be cut from the cushion.
25.2 The IRGL values for molded products are dependenton the specimen dimensions. Different values are generallyobtained for specimens that retain all molded surfaces.
26. Number of Specimens
26.1 One specimen shall be tested, unless otherwise agreedupon by the supplier and the purchaser.
27. Procedure
27.1 Test the whole test specimen or a minimum area of 380by 380 mm. Preflex the specimen twice with a 330 N force at200 6 20 mm/min. Allow to rest 6 6 1 min. Position thespecimen in the test apparatus with any cored or convolutedsurfaces resting against the perforated bottom plate.
27.2 Bring the indentor foot into contact and determine thethickness of the specimen, in mm, with the 4.5-N load on theindentor foot.
27.3 Apply the 110-N force at 50 6 5 mm/min with theindentor foot until the force is carried by the specimen.Determine the thickness, in mm, at 110 N after maintaining theforce for 60 6 3 s.
27.4 Without removing the specimen, apply the 220-N forceat 50 6 5 mm/min with the indentor foot until the force iscarried by the specimen. Determine the thickness, in mm, at220 N after maintaining the force for 60 6 3 s.
28. Report
28.1 Report the specimen thicknesses, in mm, at 4.5 Ninstantaneously and at 110 N and 220 N after 60 6 3 s. Thesefigures are known as the IRGL values, respectively. Report thelength, width, and thickness of the specimen.
29. Precision and Bias
29.1 See Section 137 for Precision and Bias statements.
TEST C—COMPRESSION FORCE DEFLECTIONTEST
30. Scope
30.1 This test consists of measuring the force necessary toproduce a 50 % compression over the entire top area of thefoam specimen.
NOTE 8—This standard and ISO 3386 address the same subject matter,but differ in technical content; and results cannot be directly comparedbetween the two methods.
NOTE 9—Compression deflection tests other than at 50 % may bespecified as agreed upon between the supplier and the purchaser.
31. Apparatus
31.1 An apparatus having a flat compression foot, largerthan the specimen to be tested, connected to a force-measuringdevice and mounted in a manner such that the product orspecimen can be deflected at a speed of 50 to 500 mm/min. Theapparatus shall be arranged to support the specimen on a levelhorizontal plate that is perforated with approximately 6.5-mmholes on approximately 20-mm centers to allow for rapidescape of air during the test.
32. Test Specimens
32.1 The test specimens shall have parallel top and bottomsurfaces and vertical sides. The thickness shall be no greaterthan 75 % of the minimum top dimension. The standard
D 3574 – 08
4Copyright by ASTM Int'l (all rights reserved); Mon Dec 1 21:59:24 EST 2008Downloaded/printed by3M Co pursuant to License Agreement. No further reproductions authorized.
我的胶粘剂网www.wdjnj.com
specimen shall be 50 mm by 50 mm by 25 mm in thickness.Larger specimens are preferable, where possible.
32.2 Specimens shall be a minimum of 2000 mm2 in areaand have a minimum thickness of 20 mm.
32.3 Unless otherwise agreed upon by contractual parties,specimens from molded parts shall be cut from the corematerial at least 10 mm below the molded surface. Note in thereport if the specimens have one or more molded surfacesresulting from insufficient core material or contractual agree-ment.
33. Number of Specimens
33.1 Three specimens per sample shall be tested. The valuereported shall be the mean value of those observed.
34. Procedure
34.1 Preflex the specimen twice, 75 to 80 % of its originalthickness at 250 6 25 mm/min. Then allow the specimen torest for a period of 6 6 1 min.
34.2 Place the specimen centered in the line of the axial loadon the supporting plate of the apparatus. If the product has oneside cored or convoluted, rest this face on the perforated plates.
34.3 Bring the compression foot into contact with thespecimen and determine the thickness after applying a contactload of 140 Pa to the specimen area (Note 2). Compress thespecimen 50 % of this thickness at 50 6 5 mm/min anddetermine the final force, in N, after 60 6 3 s. (See Note 9.)
Compression Force Deflection, kPa 5 [force, in N
3 103#/specimen area, in mm2
35. Report
35.1 Report the thickness after contact force, the 50 %compression deflection value in kilopascals, and the dimen-sions of non-standard specimens. Indicate if the sample wascored or convoluted. Report any molded surfaces that were onthe specimens.
36. Precision and Bias
36.1 See Section 137 for Precision and Bias statements.
TEST D—CONSTANT DEFLECTION COMPRESSIONSET TEST
37. Scope
37.1 This test method consists of deflecting the foamspecimen to a specified deflection, exposing it to specifiedconditions of time and temperature and measuring the changein the thickness of the specimen after a specified recoveryperiod.
NOTE 10—This standard and ISO 1856 address the same subject matter,but differ in technical content and results cannot be directly comparedbetween the two methods.
38. Apparatus
38.1 Compression Device, consisting of two or more flatplates arranged so the plates are held parallel to each other bybolts or clamps and the space between the plates is adjustableto the required deflection thickness by means of spacers.
39. Test Specimens
39.1 The test specimens shall have parallel top and bottomsurfaces and essentially perpendicular sides.
39.2 Specimens shall be 50 by 50 by 25 mm unlessotherwise specified. Specimens less than 25 mm in thicknessshall be plied up, without the use of cement, to a 25-mmthickness.
39.3 Specimens from cored foams shall have a minimumtop surface area of 100 cm2. The thickness shall be no greaterthan 75 % of the minimum top dimension.
39.4 Specimens from uncored molded products 25 mm orless in thickness shall be 50 by 50 mm by full-part thicknessand shall contain the top and bottom skin.
39.5 Specimens greater than 50 mm in thickness shall be cutto 25 mm thickness from the core. (see Note 11)
NOTE 11—Specimens from molded products may be tested with one orboth skins by agreement between the purchaser and the supplier.
NOTE 12—Care should be taken to minimize the exposure of compres-sion set specimens to visible light. Studies have shown that light can havea deleterious effect on compression sets.3 If the specimens are not to betested within 24 hours of being cut from the part or block, they should becovered or be placed in an opaque container or bag.
40. Number of Specimens
40.1 Three specimens per sample shall be tested. The valuereported shall be the mean of those observed.
41. Procedure
41.1 Perform the entire test procedure under the followingconditions: Conduct all measurements, conditioning, and re-covery of the specimen at 23 6 2°C and in an atmosphere of50 6 5 % relative humidity. The oven conditions shall be 70 6
2°C and 6 % maximum relative humidity.
NOTE 13—This condition of relative humidity may be achieved byplacing an oven at 70 6 2°C in an atmosphere maintained at 23 6 2°C and50 6 5 % relative humidity.
41.2 Measure the original thickness of the test specimen inaccordance with the procedure described in Section 8.
41.3 Place the test specimen in the apparatus and deflect itto 50 6 1, 75 6 1, or 90 6 1 % of its thickness, or any otherdeflection agreed upon between the supplier and the purchaser.
41.4 Within 15 min, place the deflected specimen and theapparatus in the mechanically convected air oven for a periodof 22 h, then remove the apparatus.
41.5 Remove the specimen immediately from the apparatusand measure the final thickness in accordance with the proce-dure described in Section 8 after allowing it to recover 30 to 40min at the temperature and humidity conditions specified in41.1.
NOTE 14—Recovery periods greater than 30 to 40 min may be agreedupon by the supplier and the purchaser.
3 Blair, G.R., Dawe, B., McEvoy, J., Pask, R., Rusan de Priamus, M., Wright, C.“The Effect of Visible Light on the Variability of Flexible Foam Compression Sets”Center for the Polyurethanes Industry of the American Chemistry Council 2007Conference Proceedings.
D 3574 – 08
5Copyright by ASTM Int'l (all rights reserved); Mon Dec 1 21:59:24 EST 2008Downloaded/printed by3M Co pursuant to License Agreement. No further reproductions authorized.
42. Calculation
42.1 Calculate the compression set value by one of thefollowing formulas:
NOTE 15—The Ct calculation is preferred and shall be the calculationused when neither Ct nor Cd are specified.
42.1.1 Calculate the constant deflection compression set,expressed as a percentage of the original thickness, as follows:
Ct 5 [~to 2 tf!/to # 3 100 (2)
where:Ct = compression set expressed as a percentage of the
original thickness,to = original thickness of test specimen, andtf = final thickness of test specimen.
42.1.2 Calculate the constant deflection compression set,expressed as a percentage of the original deflection, as follows:
Cd 5 [~to 2 tf!/~to 2 ts!# 3 100 (3)
where:Cd = compression set expressed as a percent of the origi-
nal deflection,to = original thickness of test specimen,ts = thickness of spacer bar used, andtf = final thickness of test specimen.
NOTE 16—Approximate conversion of Ct to Cd can be calculated bymultiplying the 50 % Ct by 2, the 75 % Ct by 1.33, and the 90 % Ct by1.11.
43. Report
43.1 Report compression set as Ct or Cd, and deflectionused. Also report any non-standard recovery periods or samplesizes and whether the sample was cored, uncored and/ormolded.
44. Precision and Bias
44.1 See Section 137 for Precision and Bias statements.
TEST E—TENSILE TEST
45. Scope
45.1 This test method determines the effect of the applica-tion of a tensile force to foam. Measurements are made fortensile stress, tensile strength, and ultimate elongation.
NOTE 17—This standard and ISO 1798 address the same subject matter,but differ in technical content and results cannot be directly comparedbetween the two methods.
46. Apparatus
46.1 Specimens—The specimen for tensile tests shall bestamped out with a die of the shape and dimensions shown inFig. 1, or Die A of Test Methods D 412. The die shall be sharpand free of nicks in order to prevent leaving ragged edges onthe specimen. The D 412 Die is the preferred die and isidentical in dimensions to the ISO 1798 Die.
46.2 Bench Marker—The marker shall have two parallelmarking edges 1 to 3 mm in thickness and spaced 20 or 25 mmapart on centers.
46.3 Measurements—The dimensions of the test specimenshall be determined with a suitable gauge in accordance withSection 8.
46.4 Machine—Tensile tests shall be made on a power-driven machine complying with the following requirements:
46.4.1 The machine shall be equipped with a load cell orforce measuring device that can measure the maximum appliedforce. The test speed shall be 500 6 50 mm/min, and shall beuniform at all times.
46.4.2 The machine may be equipped with a device gradu-ated to 2.5 mm for measuring the elongation. The use ofnon-contact extensometers may similarly be used for determin-ing elongation. Extensometers that clip on to the specimengenerally are unsuitable for flexible foam. For testing dumbbellspecimens, the machine shall have either screw-type flat plategrips or a type of grip that tightens automatically and exerts auniform pressure across the gripping surfaces, increasing as thetension increases to prevent slipping.
47. Test Specimens
47.1 The test specimens shall be cut from flat sheet material12.5 6 1.5 mm thick. The foam rise shall be in the thicknessdirection, unless otherwise agreed upon by customer andsupplier. The top and bottom surfaces shall be parallel and freeof skin. The cut edges shall be perpendicular to the top surfaceand be free of ragged edges. The length of the tabs may beadjusted to fit machine conditions provided that all otherrequirements remain constant.
48. Number of Specimens
48.1 Three specimens per sample shall be tested. The valuereported shall be the mean value of those observed.
49. Procedure
49.1 Set the grip separation at a minimum of 62.5 mm forthe D 3574 Die and at a minimum of 75 mm for the D 412 DieA. Place the dumbbell tabs in the grips of the testing machine,using care to adjust them symmetrically, in order that thetension will be distributed uniformly over the cross section.The test shall be run at a speed of 500 6 50 mm/min, unlessotherwise specified by agreement between customer and sup-plier. Start the machine and note continuously the distancebetween the two bench marks. Record the stress at thecorresponding elongation or if an automatic recording device isused, it will record the data continuously. At rupture, measureor record elongation to the nearest 10 %.
FIG. 1 Die for Stamping Tension Specimens
D 3574 – 08
6Copyright by ASTM Int'l (all rights reserved); Mon Dec 1 21:59:24 EST 2008Downloaded/printed by3M Co pursuant to License Agreement. No further reproductions authorized.
我的胶粘剂网www.wdjnj.com
50. Calculation
50.1 Calculate the tensile strength by dividing the maximumbreaking force by the original cross-sectional area of thespecimen.
50.2 Calculate the stress by dividing the force at a prede-termined elongation by the original cross-sectional area of thespecimen.
50.3 Calculate the ultimate elongation, A, by subtracting theoriginal distance between the bench marks from the totaldistance between the bench marks at the time of rupture andexpressing the difference as a percentage of the originaldistance, as follows, or use the grip separations in a similarcalculation.
A, % 5 [~df 2 do!/do # 3 100 (4)
where:do = original distance between bench marks, anddf = distance between bench marks at the break point.
50.4 The value reported shall be the mean value of allspecimens tested.
51. Report
51.1 Report the following information:51.1.1 Tensile strength in kilopascals,51.1.2 Stress in kilopascals at a predetermined elongation,
and51.1.3 Ultimate elongation, in percent, and whether bench
marks, grip separation or extensometers were used to measureelongation.
51.1.4 Crosshead speed, if other than 500 mm/min.
52. Precision and Bias
52.1 See Section 137 for Precision and Bias statements.
TEST F—TEAR RESISTANCE TEST
53. Scope
53.1 This test method covers determination of the tearpropagation resistance of foam. The block method, as de-scribed, measures the tear resistance under the conditions ofthis particular test.
NOTE 18—This standard and ISO 8067 address the same subject matter,but differ in technical content and results cannot be directly comparedbetween the two methods.
54. Apparatus
54.1 Tear resistance shall be measured on a power-drivenapparatus which will indicate the force at which rupture of thespecimen takes place. An automatic machine may be usedwhich draws the actual curve, or, a style or scale shall be used,which has an indicator that remains at the point of maximumforce after rupture.
55. Test Specimens
55.1 The test specimens shall be a block shape free of skin,voids, and densification lines, as shown in Fig. 2. They may becut on a saw or die cut from sheet material so that the sides areparallel and perpendicular to each other. A nominal 40-mm cutshall be placed in one side as shown in Fig. 2. Dimension A-B
can be reduced to the pad thickness. The thickness shall bedetermined in accordance with Section 8.
56. Number of Specimens
56.1 Three specimens per sample shall be tested. The valuesreported shall be the mean of those tested.
57. Procedure
57.1 Clamp the test specimen in the jaws of the testingmachine, taking care that the jaws grip the specimen properly.Spread the block so that each tab is held in the jaw to pullacross the specimen. The test shall be run at a speed of 500 6
50 mm/min, unless otherwise specified by agreement betweenpurchaser and supplier. Aid the cut in the specimen with a razorblade or knife, so as to keep it in the center of the block (Note19). After the rupture of the specimen, or after at least a 50-mmlength is torn, record the maximum force in newtons and notealso the thickness of the specimen (direction A-B).
NOTE 19—For foams that will not tear by this method, side by side tearstrength comparisons can be made by testing in accordance with TestMethod D 624. It should be noted that the D 624 test is a tear initiatingmeasurement, as opposed to a tear propagating measurement in this blocktear test.
58. Calculation
58.1 Calculate the tear strength from the maximum forceregistered on the testing machine and the average thickness ofthe specimen (direction A-B), as follows:
Tear strength, N/m 5 F/T 3 103 (5)
where:F = force, N, andT = thickness, mm.
59. Report
59.1 Report the following information:59.1.1 Tear strength in newtons per metre,59.1.2 Orientation of specimen, and59.1.3 Crosshead speed, if other than 500 mm/min.
60. Precision and Bias
60.1 See Section 137 for Precision and Bias statements.
TEST G—AIR FLOW TEST
61. Scope
61.1 The air flow test measures the ease with which airpasses through a cellular structure. Air flow values may be used
FIG. 2 Tear Resistance Test Specimens
D 3574 – 08
7Copyright by ASTM Int'l (all rights reserved); Mon Dec 1 21:59:24 EST 2008Downloaded/printed by3M Co pursuant to License Agreement. No further reproductions authorized.
as an indirect measurement of certain cell structure character-istics. The test consists of placing a flexible foam corespecimen in a cavity over a chamber and creating a specifiedconstant air-pressure differential. The rate of flow of airrequired to maintain this pressure differential is the air flowvalue. This test is normally for slab foam products or for thecore materials of molded products. Measurements of air flowthrough molded skins or extremely high air flow products mayrequire alternative methods (Note 21).
NOTE 20—This standard is identical to ISO 7231.NOTE 21—For measuring air flow of products, such as very tight
viscoelastic foams or very high air flow foams, which can have air flowsbeyond the range of this method, very good success has been achievedusing the equipment specified in Test Method D 737. Direct correlationsbetween Test Method D 737 and this method have been established,although some modification of the D 737 equipment may be necessary.4
Test Method D 3574 air flow in cfm times 36 will give an approximatevalue for Test Method D 737 air flow in cfm/ft2. For surface porosity ofmolded foams, see Test Method D 726.
62. Terminology
62.1 Definitions of Terms Specific to This Standard:62.1.1 air flow value—the volume of air per second at
standard temperature and atmospheric pressure required tomaintain a constant pressure differential of 125 Pa across aflexible foam specimen approximately 50 by 50 by 25 mm.
62.1.2 air flow parallel to foam rise—the air flow valueobtained when the air enters and leaves the mounted specimenparallel to foam rise.
63. Apparatus
63.1 A schematic drawing of the apparatus, including thespecimen mounting chamber, manometer, air flowmeters,blowmeters, blower, and voltage control, is shown in Fig. 3.
63.2 Chamber, consisting of a pot approximately 130 mm indiameter and 150 mm high, with provision for mounting thefoam specimen and fittings for the manometer and air exhaust.The specimen mount cavity shall be 50.0 6 0.5 by 50.0 6 0.5by 25.0 6 0.5 mm in size. Four foam support vanes approxi-mately 1 mm thick and 12.5 mm high shall be placed under theopening to prevent the foam from being pulled into the vacuumchamber. The vanes shall be spaced 12.5 mm on center fromeach other and also centered relative to the bottom of the cavityopening. The manometer fitting shall enter a 1-mm holemidway along the side of the chamber. A 25-mm pipe fittingshall be used as the exhaust outlet from the center of the bottomof the chamber.
63.3 Manometer, calibrated from 0 to 250 Pa and having anaccuracy of 62 %, is required. An inclined oil manometer withgraduations of 2 Pa is recommended. A level mounted on themanometer shall be used to ensure that the proper degree ofinclination from the horizontal is maintained. Traps shall beprovided to prevent indicating fluid from being accidentallydrawn into the chamber. Appendix X5. describes a suggestedmethod for the verification of the inclined oil manometer. The
manometer can alternatively be replaced with a 0-250 Pamagnehelic gauge with graduations of 5 Pa.
63.4 Flowmeters and Blower—Low-pressure-drop air flow-meters accurate to 62 % shall be used for air-flow measure-ments. A given flowmeter should not be used for values lessthan 10 % of full scale. Air flowmeters with at least 250-mmscales are recommended. Since the flowmeter calibration istemperature-and pressure-dependent, the use of the apparatusunder ambient conditions can result in erroneous readings. Incases of dispute, the apparatus should be used under standardconditions of 23°C and 100 kPa (1 atm pressure) or else asuitable calibration correction applied. Flowmeters that rangefrom 0 to 0.01 m3 /s will cover a wide range of foam cellstructures, but a lesser range may be used. Actual flow isadjusted by a combination of valve restriction and blowerspeed. The two-way valves shall be mounted on the output sideof the flowmeter to maintain the pressure drop across theflowmeter constant at any given flow level. A vacuum cleanertype unit shall be used for an exhaust blower.
63.5 Leak Test—To check the apparatus for leaks, thespecimen mount cavity shall be sealed with masking tape. Withall valves closed, turn on the exhaust blower to approximately1⁄3 power and observe any movement of the manometer. Themanometer reading, if any, should not exceed 1 Pa after a 30-swaiting period. Next, open the valve very slightly for thelowest range flowmeter reading. The flow should be essentiallyzero, as evidenced by less than 3-mm movement of the airflowmeter float from its static position. For the equipment toperform satisfactorily over its entire range, the requirementsfor both parts of the leak test must be met.
64. Test Specimens
64.1 The test specimens shall be parallel-piped cut to fit themount cavity of the apparatus. A cavity 50 by 50 mm requiresa specimen 51.0 6 0.3 by 51.0 6 0.3 by 25.0 6 0.5 mm in size.A band saw with a movable table and a double-bevel knife-edge blade is recommended for cutting the specimens.
64.2 Three specimens per sample shall be cut parallel to thefoam rise. See 62.1.2. The values reported shall be the mean ofthose observed for each location and orientation.
65. Procedure
65.1 Measure each specimen in accordance with the proce-dure described in Section 8 to verify the specimen size.
65.2 Insert the specimen into the test cavity. Make sure thata good air seal is obtained along all edges. The top of thespecimen should be flush with the top of the test chamber.
65.3 With all valves closed, adjust the voltage control of theapparatus to 30 %.
65.4 Open one flow-control valve slowly until a pressuredifferential of 100 to 150 Pa is obtained. Adjust the voltagecontrol carefully to obtain a pressure differential of 125 6 1 Pa.
65.5 After this pressure differential has been maintained forat least 10 s, read the scale of the flowmeter.
65.6 If this reading is off-scale or less than 10 % of fullscale, close that flow-control valve and open a more appropri-ate one. Repeat this process until the proper manometerreading and air flow is achieved.
4 Gummaraju, R.V., Pask, R.F., Koller, H.J., Wujcik, S.E., and Reimann, K.A.,“Evaluation, Modification and Adaptation of an Airflow Test Method for Polyure-thane Foams,” Journal of Cellular Plastics , May/June 2001.
D 3574 – 08
8Copyright by ASTM Int'l (all rights reserved); Mon Dec 1 21:59:24 EST 2008Downloaded/printed by3M Co pursuant to License Agreement. No further reproductions authorized.
我的胶粘剂网www.wdjnj.com
65.7 The air flow value may be obtained from the flowmeterscale directly, estimated from a calibration chart, or calculatedwith a factor depending on the calibration system.
66. Report
66.1 Report the following information:66.1.1 Mean air flow value in cubic metres per min for each
location and orientation,66.1.2 Dimensions of the specimen, and66.1.3 Dimension of the mount cavity of the apparatus.
67. Precision and Bias
67.1 See Section 137 for Precision and Bias statements.
TEST H—RESILIENCE (BALL REBOUND) TEST
68. Scope
68.1 This test consists of dropping a steel ball on a foamspecimen and noting the height of rebound.
NOTE 22—This standard is identical to ISO 8307.
69. Apparatus
69.1 The ball rebound tester shall consist of a 40 6 4-mminside diameter vertical clear plastic tube, such as acrylic, intowhich a 16.03 6 0.2-mm diameter steel ball is released by amagnet or other device. The steel ball must be released so thatit falls without rotation. Centering of the ball is assured by arecess at the base of the magnet. The height of drop shall be
500 mm. Since it is most convenient to note the position of thetop of the ball on rebound, the top of the ball shall be 516 mmabove the surface of the foam. Thus, “zero” rebound shall be16.3 6 0.2 mm (diameter of ball) above the specimen surface.The scale on the tube shall be scribed directly in percent asfollows. Every 5 %, a complete circle shall be scribed andevery 1 %, a 120° arc shall be scribed. The complete circles arean essential part of the apparatus, since they are used toeliminate parallax error.
70. Test Specimens
70.1 The test specimens shall have parallel top and bottomsurfaces.
70.2 The test specimens shall consist of the entire productsample or a suitable portion of it, except that in no case shallthe thickness be less than 30 mm. The standard specimen sizeshall be 100 mm by 100 mm by 50 mm. For molded products,the top skin shall be removed.
71. Number of Specimens
71.1 Three specimens per sample shall be tested. The threespecimens may be obtained by using separate items or differentlocations on a given item.
72. Procedure
72.1 Center the specimen at the base of the tube and adjustthe height of the tube so that zero rebound is 16 mm above thesurface of the foam specimen.
FIG. 3 Air Flow Apparatus Schematic Diagram
D 3574 – 08
9Copyright by ASTM Int'l (all rights reserved); Mon Dec 1 21:59:24 EST 2008Downloaded/printed by3M Co pursuant to License Agreement. No further reproductions authorized.
72.2 Mount the steel ball on the release mechanism, thendrop it and note the maximum rebound height. If the ballstrikes the tube on the drop or rebound, the value obtained isinvalid. This condition is usually due to the tube not beingvertical or irregularities on the specimen surface. In order tominimize parallax error, the circles on the tube in the regionwhere the percent rebound is read must appear as lines.
72.3 Make an additional two drops on the same specimen inthe same location unless agreed upon by purchaser andsupplier.
73. Calculation
73.1 Calculate the mean of the three rebound values.
74. Report
74.1 Report the mean of the three specimen mean values asthe ball rebound resilience value of the sample in percent.
74.2 Report if measurements were made at different speci-men locations or on different specimens.
75. Precision and Bias
75.1 See Section 137 for Precision and Bias statements.
TEST I—FATIGUE TESTS
76. Scope
76.1 The fatigue tests consist of four methods:76.1.1 Static Force Loss Test at Constant Deflection,76.1.2 Dynamic Fatigue by Roller Shear at Constant Force,76.1.3 Dynamic Fatigue Test by Constant Force Pounding,
and76.1.4 Dynamic Fatigue Test for Carpet Cushion.
TEST I1 —STATIC FORCE LOSS TEST ATCONSTANT
DEFLECTION
77. Scope
77.1 The purpose of this static force loss test is to deter-mine: (1) a loss of IFD, (2) a loss of thickness, and (3)structural breakdown by visual examination.
77.2 This procedure tests the specimen at a 75 % constantdeflection.
NOTE 23—There is no known ISO equivalent to this standard.
78. Apparatus
78.1 The apparatus shall consist of two parallel plates(wood or metal) which can produce a uniform, constantdeflection of the specimen. The plates shall be 500 by 500 mmsquare, and spacer bars or other appropriate means shall beemployed to maintain a constant 75 % deflection throughoutthe test.
79. Test Specimen
79.1 The test specimen shall be 380 by 380 mm by thedesired thickness. One specimen shall be tested.
80. Initial Measurements
80.1 Measure the 25 and 65 % IFD of the test specimen inaccordance with Sections 16 to 22. Measure the originalthickness with 4.5-N contact force after preflexing.
81. Procedure
81.1 Place the specimen between the plates with the spacerbars to provide a 75 % deflection. Clamp the plates and hold at75 % deflection for 22 h at 23 6 2°C and 50 6 5 % relativehumidity.
82. Final Measurements
82.1 Measure the final IFD values 60 6 5 min after thefatigue test is completed in accordance with 80.1 using theoriginal thickness to determine the deflection for the final IFDvalues.
82.2 If the loss in thickness is above 10 %, the IFD lossesshall not be measured and only the thickness loss shall bereported.
82.3 For a measurement of more permanent fatigue, repeat82.1, except allow 24 6 1 h of recovery time rather than 60min.
83. Calculation and Inspection
83.1 Check the specimen for physical breakdown of thecellular structure by visual examination and comparison withunflexed specimens.
83.2 Calculate the percentage loss of thickness as follows:
Ft 5~to 2 tf !
~to !3 100 (6)
where:Ft = loss in thickness, %,to = original specimen thickness, andtf = final specimen thickness.
83.3 Calculate the percentage loss of IFD, as follows:
FL 5~Lo 2 Lf !
~Lo !3 100 (7)
where:FL = loss of indentation force deflection, %,Lo = original indentation force deflection value, andLf = final indentation force deflection value.
84. Report
84.1 Report the following information:84.1.1 Percentage loss of thickness and the percentage loss
of 25 and 65 % IFD if the thickness loss is less than 10 %, and84.1.2 Results of visual examination.84.1.3 Recovery time whether 60 min or 24 h.
85. Precision and Bias
85.1 See Section 137 for Precision and Bias statements.
TEST I2 —DYNAMIC FATIGUE TEST BY THEROLLER
SHEAR AT CONSTANT FORCE
86. Scope
86.1 This procedure fatigues the specimen dynamically at aconstant force, deflecting the material both vertically andlaterally.
D 3574 – 08
10Copyright by ASTM Int'l (all rights reserved); Mon Dec 1 21:59:24 EST 2008Downloaded/printed by3M Co pursuant to License Agreement. No further reproductions authorized.
我的胶粘剂网www.wdjnj.com
86.2 The fatigue test may be conducted by either ProcedureA or Procedure B. Both test procedures are the same and differonly in the number of cycles used. Procedure A shall use 8000cycles (approximately 5 h) and Procedure B shall use 20 000cycles (approximately 12 h). It should be noted that a singlecycle is actually two passes over the foam sample, that is, thereand back.
NOTE 24—There is no known ISO equivalent to this standard.
NOTE 25—The mass of the roller and the number of cycles may bechanged as agreed upon between the supplier and the purchaser.
87. Apparatus (Appendix X2)
87.1 Perforated-Base Platen, approximately 500 by 500 by10 mm with a finished ground-top surface and with perforationof approximately 6.5-mm centers covering the center 360 by360-mm portion.
87.2 Roller, 450-mm minimum length and 76.0 6 1.3mm-diameter made from stainless steel or chrome-plated metalhaving a minimum surface finish of 1 µm. The roller shall bemounted in an offset position (15 6 3°) with suitable means ofadjustment for a specified loading of the test specimen. Theforce imparted by the roller assembly shall not exceed 110 N.
87.3 The test is conducted at a frequency of 0.50 6 0.05 Hz.A cycle is a complete forward and reverse stroke. The length ofthe stroke shall be 300 6 10 mm.
87.4 Any suitable method for holding the test specimensecurely on the roller base platen is acceptable as long as thetest specimen remains stationary during the rolling flex cycles.An acceptable method for retaining the specimen on the baseplaten is described as follows: Four pieces of cotton sheeting orpaper masking tape 50 to 75 mm wide and at least 50 mmlonger than each side of the test specimen shall be required.Bond the cotton strips (with a solvent or water-emulsion-typeof adhesive) or the masking tape along the edges of the basesurface of the test specimen. Allow 25 to 50 mm of each stripto extend beyond the edges of the test specimen so that the testspecimen can be securely clamped to the base platen throughthe use of suitable metal retainer straps.
88. Test Specimen
88.1 A specimen 380 mm long by 300 mm wide by 50 mmthick is used. The thickness of specimens tested should be atleast 25 mm and no greater than 125 mm. Normally full-partthickness is used where the top and bottom surfaces areessentially parallel and fall within the thickness limits. Wherepart thickness exceeds 125 mm or the bottom surface iscontoured so that the surfaces are not essentially parallel, thebottom surface shall be sliced to provide a flat surfaceessentially parallel to the top surfaces (see Section 7).
88.2 The length and width dimensions shall be held to 66.5mm and shall be saw cut or die cut; if die cut, sufficient timemust be allowed for complete edge recovery (usually 2 hminimum).
88.3 One specimen shall be tested, unless otherwise agreedupon by the supplier and the purchaser.
89. Initial Measurements
89.1 Bond the masking tape or suitable hold-down cloth tothe bottom edges of the specimen so the specimen can besecured to the perforated base platen of the fatigue tester.
89.2 Condition the specimen as in Section 6. The test shouldalso be run under the same conditions.
89.3 Determine the IRGL in accordance with Sections23-29.
90. Procedure
90.1 Adjust the roller to obtain a constant force of 130 6 2N on the foam specimen (Note 25). This critical measurementmay be made by fashioning a lightweight fabric sling aroundthe roller at its center and measuring the force downward whileholding the weighing scale vertically over the roller andmaintaining the roller axis in a horizontal plane with the pivotaxis.
90.2 Set the vertical adjustment of the roller or the mountingbase by placing the specimen in position and lowering theroller so it is supported by the specimen. Observe the pivot axisand roller axis relationship and adjust the vertical height so thatthe axes lie in an essentially horizontal plane at the start of thetest.
90.3 Mount the test specimen on the base platen with thelong dimension parallel to the stroke of the dynamic fatiguemachine and secure by means of the tape and metal-retainerstrips. When mounting cored pieces, coring is to be against theplaten. Set the counter to zero, start the machine, and fatiguetest the sample for either 8000 cycles (Procedure A) or 20 000cycles (Procedure B) or another number of cycles specified bythe purchaser.
91. Final Measurements
91.1 Within 60 6 5 min after the fatigue test is completed,measure the final IRGL in accordance with 89.3.
91.2 For a measurement of more permanent fatigue, repeat91.1, except allow 24 6 1 h of recovery rather than 60 min.
92. Calculation and Inspection
92.1 Check the specimen for physical breakdown of cellularstructure by visual examination and comparison with unflexedsimilar specimens.
92.2 Calculate and report the percent loss in thickness asfollows:
Thickness loss, % 5@100~A 2 B!#
~A!(8)
where:A = original thickness under compression forces of 4.5 N,
110 N, and 220 N, andB = final thickness under the same indentation forces.
92.3 If requested by the purchaser, calculate the total lossnumber as follows:
Total loss number 5 sum of % losses at each load (9)
Sample Calculation:Percent thickness loss at 4.5 N = 2.0Percent thickness loss at 110 N = 18.0Percent thickness loss at 220 N = 27.0
D 3574 – 08
11Copyright by ASTM Int'l (all rights reserved); Mon Dec 1 21:59:24 EST 2008Downloaded/printed by3M Co pursuant to License Agreement. No further reproductions authorized.
Total loss number 47.0
93. Report
93.1 Report the following information:93.1.1 Percentage loss of thickness and IRGL values.93.1.2 The number of cycles.93.1.3 Total loss number, if requested.93.1.4 Results of visual examination.93.1.5 Recovery time whether 60 min or 24 h.
94. Precision and Bias
94.1 See Section 137 for Precision and Bias statements.
TEST I3 —DYNAMIC FATIGUE TEST BY CONSTANTFORCE POUNDING
95. Scope
95.1 The purpose of the fatigue test is to determine: (1) theloss of force support at 40 % IFD (indentation force deflec-tion), (2) a loss in thickness, and (3) structural breakdown asassessed by visual inspection. Deflections other than 40 % maybe used as agreed upon between supplier and purchaser.
95.2 This procedure describes tests that evaluate the speci-men by repeatedly deflecting the material by a flat-horizontalindention exerting a vertical force of 750 6 20 N on the testspecimen.
95.3 This fatigue test may be conducted by Procedure A,Procedure B, or Procedure C. Procedures A and B differ onlyin the number of cycles used. Procedure A shall use 8000cycles (approximately 2 h) and Procedure B shall use 80 000cycles (approximately 19 h). Procedure C calls for 12 000cycles at a slower cycling rate (approximately 20 h). See 96.3.
NOTE 26—This standard is equivalent to ISO 3385.
96. Apparatus
96.1 Perforated Base Platen, approximately 500 by 500 by10 mm, with finished ground-top surface and with perforationof approximately 6.5-mm diameter holes on 20-mm centers,over a minimum central area of 350 by 350 mm.
96.2 A flat circular indentor that exerts a force of 750 6 20N on the test specimen at maximum indentation. The indentorshall have an overall diameter of 250 6 1 mm with a 25 6
1-mm radius at the lower edge, to prevent cutting hard foam.96.3 By means of a crank or other suitable mechanism, the
machine shall be capable of oscillating either the platencarrying the test specimen or the indentor support mountingtowards each other in a vertical direction at a frequency of 706 5 cycles per minute. For Procedure C, the frequency shall be10 6 1 cycles per minute.
96.4 The indentor shall be free to be lifted in its mounting toprevent overloading of the test specimen.5
97. Test Specimen
97.1 The test specimen shall be 380 by 380 by 50 mm. Onespecimen shall be tested, unless otherwise agreed upon by thesupplier and the purchaser.
98. Initial Measurement
98.1 The specimen shall be conditioned for at least 12 h andalso fatigued at 23 6 2°C and 50 6 5 % relative humidity.
98.2 Measure the 40 % IFD of the test specimen in accor-dance with Sections 16-22. Measure the original thickness with4.5-N contact force after preflexing.
99. Procedure
99.1 Mount the specimen on the base platen. Set the counterto zero, start the machine, and fatigue the test specimen for8000 cycles (Procedure A), 80 000 cycles (Procedure B), or12 000 cycles (Procedure C). Procedure C shall be used forslow recovery (viscoelastic) foams where the cycle speed isslow enough to allow enough time between cycles for the foamto recover its height.
100. Final Measurement
100.1 Within 60 6 5 min after the fatigue test is completed,repeat 98.2 using the original thickness to determine thedeflection for the final force reading.
100.2 For a measurement of more permanent fatigue repeat100.1, except allow 24 6 1 h of recovery rather than 60 min.
100.3 If the loss in thickness is above 10 %, IFD loss shallnot be measured and only the thickness loss should be reported.
101. Calculation and Inspection
101.1 Check the specimen for physical breakdown of thecellular structure by visual examination and comparison withunflexed specimens.
101.2 Calculate the percent loss of thickness as follows:
Ft 5~to 2 tf !
~to !3 100 (10)
where:Ft = loss in thickness, %,to = original specimen thickness, andtf = final specimen thickness.
101.3 Calculate the percent loss of force deflection, asfollows:
FL 5~Fo 2 Ff !
Fo3 100 (11)
where:FL = loss of 40 % indentation force deflection, %,Fo = original 40 % indentation force deflection value, andFf = final indentation force deflection value.
102. Report
102.1 Report the following information:102.1.1 Percent change in thickness and the percent change
in 40 % IFD if the thickness change is less than 10 %, and102.1.2 Results of visual examination.102.1.3 Recovery time whether 60 min or 24 h.
103. Precision and Bias
103.1 See Section 137 for Precision and Bias statements. Around robin for Procedure C is being planned and the data willbe available by the end of 2008.
5 Detailed drawings are available from ASTM Headquarters. Request AdjunctADJD3574.
D 3574 – 08
12Copyright by ASTM Int'l (all rights reserved); Mon Dec 1 21:59:24 EST 2008Downloaded/printed by3M Co pursuant to License Agreement. No further reproductions authorized.
我的胶粘剂网www.wdjnj.com
TEST I4 —DYNAMIC FATIGUE TEST FOR CARPETCUSHION
104. Scope
104.1 The purpose of this test is to determine: (1) retentionof load bearing (65 % IFD), (2) a loss in thickness, and (3)structural breakdown as addressed by visual inspection.
104.2 This procedure describes tests that evaluate the speci-men by repeatedly deflecting the carpet cushion by a 152 mmdiameter and 152 mm wide rubber covered roller exerting aforce of 266 6 5N on the test specimens.
104.3 This fatigue test may be conducted by either Proce-dure A or Procedure B. The test procedures differ only in thenumber of cycles used. Procedure A shall use 8000 cycles(approximately 5 h) and Procedure B shall use 40 000 cycles(approximately 24h). It should be noted that a single cycle isactually two passes over the foam sample, that is, there andback.
NOTE 27—There is no known ISO equivalent to this standard.
105. Apparatus (Appendix X2)
105.1 The apparatus is identical to that described in Section87 with the following changes; the roller described in 104.2replaces the longer roller and is attached perpendicularly. Thebase platen is replaced or covered with a 19 mm thick plywoodfor mounting the sample. The sample is secured with floortacks or staples. (See Fig. 4 for test apparatus.)
106. Test Specimens
106.1 The specimen is 380 mm long and 230 mm wide and13 mm thick, unless otherwise agreed upon by supplier andpurchaser.
107. Initial Measurements
107.1 Condition the specimens as in Section 6. The testshould be run under the same conditions, if possible. Preflexthe specimens two times 75 % of the nominal thickness. Aftera 6 6 1 min rest, measure the original thickness, to, inaccordance with Section 8 and determine the original 65 %IFD, Fo, in accordance with Sections 16-22 using a 102 mmdiameter flat circular indentor foot.
108. Procedure
108.1 Secure the sample to the plywood base using staplesor tape, making sure that the roller will not roll over the stapledareas. Set the counter for zero, start the machine, and fatiguethe sample for 8,000 or 40,000 cycles.
109. Final Measurements
109.1 Within 60 6 5 min after the fatigue test is completedmeasure the final thickness, tf, in accordance with Section 8and the final 65 % IFD, Ff, in accordance with 107.1 using theoriginal thickness, to, to determine the 65 % IFD deflection.
109.2 For a measurement of more permanent fatigue, repeat109.1, except allow 24 6 1h of recovery rather than 60 min.
110. Calculation and Inspection
110.1 Check the specimen for physical breakdown by visualexamination.
110.2 Calculate and report the percentage loss in thicknessas follows:
13Copyright by ASTM Int'l (all rights reserved); Mon Dec 1 21:59:24 EST 2008Downloaded/printed by3M Co pursuant to License Agreement. No further reproductions authorized.
where:Ft = loss in thickness, %,to = original specimen thickness, andtf = final specimen thickness.
110.3 Calculate the percentage IFD retention as follows:
R 5 100 2~Fo 2 Ff 3 100!
~Fo!(13)
where:R = retain IFD, %,Fo = original IFD force, andFf = final IFD force.
111. Report
111.1 Report the following information:111.1.1 Percentage loss in thickness and percentage reten-
tion of 65 % indentation force deflection, and111.1.2 Recovery time whether 60 min or 24 h.
112. Precision and Bias
112.1 Round robin testing to determine the precision of thismethod is being planned and the data will be available by theend of 2009.
AGING TEST J—STEAM AUTOCLAVE AGING
113. Scope
113.1 This test consists of treating the foam specimen in alow-pressure steam autoclave and observing the effects on theproperties of the foam specimen. Use either of the followingprocedures, J1 or J2 :
113.1.1 Procedure J1, 3 h at 105 6 3°C.113.1.2 Procedure J2, 5 h at 120 6 5°C.
NOTE 28—This standard and ISO 2440 address the same subject matter,but differ in technical content and results cannot be directly comparedbetween the two methods.
114. Apparatus
114.1 Steam Autoclave, or similar vessel, that is thermostati-cally controlled to 62°C and capable of withstanding gaugepressures of up to 140 kPa.
115. Procedure
115.1 Fill the autoclave with fresh-distilled water to a level50 mm above the bottom of the autoclave. Set the thermostatcontrol to the desired test temperature, which is between 105 6
3°C or 120 6 5°C. Allow the autoclave to heat until the waterboils. Place the specimen on edge on a rack in the insidecontainer so that one specimen does not touch another or anymetal except at the supporting surface. Place the containerinside the autoclave and close and tighten the top. Leave thesafety valve open until all the air is out of the autoclave. Thisis apparent when steam begins blowing out of the ports on thesafety valve. Close the valve 2 min after the appearance ofsteam, and take the zero time of the heat at this point.
115.2 After the exposed period, turn off the heat, release thesteam pressure, and remove the specimens without delay. Drythe specimens for 3 h for each 25 mm of thickness at 100 6
5°C in a mechanically convected dry-air oven. Allow them tocome to temperature equilibrium, after removal from the ovenas specified in the test method being evaluated. Otherwise, ifnot specified in the method, condition them for at least 2 h at23 6 2°C and 50 6 5 % relative humidity.
115.3 Test each specimen for the prescribed property inaccordance with the appropriate test method.
NOTE 29—A drying temperature of 70°C may be used where 100°Cadversely affects the final properties upon agreement by purchaser andsupplier.
116. Calculation
116.1 Calculate the present change in physical property asfollows:
Physical property change, % 5~Po 2 Pf!
~Po !3 100 (14)
where:Po = mean property of the unexposed specimen, andPf = mean property of the exposed specimen.
117. Report
117.1 Report the following information:117.1.1 Percent change in physical property,117.1.2 Test procedure J1 or J2.
118. Precision and Bias
118.1 The precision of this method is dependent on thematerial property that is being measured.
AGING TEST K—DRY HEAT AGING
119. Scope
119.1 This test consists of exposing foam specimens in anair-circulating oven and observing the effect on the propertiesof the foam.
NOTE 30—This standard and ISO 2439 address the same subject matter,but differ in technical content and results cannot be directly comparedbetween the two methods.
120. Apparatus
120.1 Air-Circulating Oven, capable of maintaining 140 6
2°C for exposing the specimens. A device for sensing andrecording the temperature of the oven at least every 2 h shall beattached.
121. Procedure
121.1 Expose the specimens for 22 h at 140 6 2°C. Obtainand record the oven temperature near the specimen at leastevery 2 h.
121.2 Remove the specimens from the oven and conditionthem as specified in the test method being evaluated. Other-wise, if not specified in the method, condition them for not lessthan 2 h at 23 6 2°C and 50 6 5 % relative humidity.
122. Calculation
122.1 Calculate the percent change in physical property asfollows:
D 3574 – 08
14Copyright by ASTM Int'l (all rights reserved); Mon Dec 1 21:59:24 EST 2008Downloaded/printed by3M Co pursuant to License Agreement. No further reproductions authorized.
我的胶粘剂网www.wdjnj.com
Physical property change, % 5~~Po 2 Pf!!
~Po !3 100 (15)
where:Po = mean property of the unexposed specimen, andPf = mean property of the exposed specimen.
123. Report
123.1 Report the following information:123.1.1 Percent change in physical property.
124. Precision and Bias
124.1 The precision of this method is dependent on thematerial property that is being measured.
AGING TEST L—WET HEAT AGING
125. Scope
125.1 This test consists of exposing foam specimens in anenvironmental chamber and observing the effect on the prop-erties of the foam.
NOTE 31—There is no known ISO equivalent to this standard.
126. Apparatus
126.1 Environmental Chamber, capable of maintaining 506 2°C and 95 6 5 % RH for exposing the specimens. A devicefor sensing and recording the temperature of the oven at leastevery 2 h shall be attached.
NOTE 32—Other temperature and humidity conditions may be used asagreed upon by the purchaser and the supplier.
127. Procedure
127.1 Place the specimens into the environmental chamberset to the temperature and humidity conditions specified in126.1, making sure they do not touch each other. For wetcompression sets, the specimens shall be clamped into the testfixture before putting them into the chamber. Expose thespecimens for 22 h 6 5 min or as agreed upon by the supplierand purchaser.
127.2 After the exposure period, remove the specimensfrom the chamber and from any fixturing and then conditionthem as specified in the test method being evaluated. Forinstance, with wet compression sets, after removing the speci-mens from the fixtures, allow the specimens to recover at 23 6
2°C and 50 6 5 % relative humidity for 30–40 min. beforemaking the final measurements, as specified in Sec. 41.5.Otherwise, if not specified in the method, condition them fornot less than 2 h at 23 6 2°C and 50 6 5 % relative humidity.
127.3 Perform any measurements and calculations specifiedin the test method being evaluated.
128. Calculation
128.1 Calculate the percent change in physical property asfollows:
Physical property change, % 5@~Po 2 Pf!#
~Po!3 100 (16)
where
Po = mean property of the unexposed specimen, andPf = mean property of the exposed specimen.
129. Report
129.1 Report the following information:129.1.1 Percent change in physical property, and129.1.2 Test method evaluated.
130. Precision and Bias
130.1 The precision of this method is dependent on thematerial property that is being measured.
TEST M—RECOVERY TIME
131. Scope
131.1 This method is used to determine the recovery time ofslow recovery (viscoelastic) foams.
NOTE 33—There is no known ISO equivalent to this standard.
132. Apparatus
132.1 Use the standard IFD apparatus as described in 17.1.
133. Test Specimen
133.1 Use the standard IFD specimen as described in 18.1.One specimen shall be tested, unless otherwise agreed upon bysupplier and purchaser.
134. Procedure
134.1 Place the test specimen on the perforated supportingplate. Bring the indentor foot into contact with the specimenwith a 4.5 N preload to determine the specimen’s initialthickness. Immediately indent the specimen 75 % of its initialthickness at a speed of 1000 6 100 mm/min. After a 60-s dwelltime, return the indentor to a 5 % deflection at 1000 6 100mm/min, starting a stopwatch immediately upon initiating theupward movement of the indentor. Stop the watch as soon asthe foam recovers to a 4.5 N preload on the indentor. If thereis no separation between the foam and the indentor foot duringthe upward movement of the indentor foot, the recovery time isindeterminate by this method.
135. Report
135.1 Report the recovery time in seconds.
136. Precision and Bias
136.1 See Section 137 for Precision and Bias statements.
137. Precision and Bias
137.1 Precision and bias for test methods in this standardare based on round robin studies conducted by the Polyure-thane Foam Association from 1998 to 2006 in accordance withPractice E 691. The Test B2, I1, and I2 data were generated bythe molded foam industry between 2004 and 2007. For eachstudy, three or more materials were carefully selected to coverthe range of properties expected in commercially availableproducts. The number of labs varied from 6 to 10. The sampleswere distributed by one lab, but individual specimens wereprepared at the labs performing the tests. Each laboratory
D 3574 – 08
15Copyright by ASTM Int'l (all rights reserved); Mon Dec 1 21:59:24 EST 2008Downloaded/printed by3M Co pursuant to License Agreement. No further reproductions authorized.
obtained six test results for each material. Precision, charac-terized by repeatability (Sr and r) and reproducibility (SR andR) have been determined as shown in the individual tables.
137.2 Bias—There are no recognized standards by which toestimate bias for these test methods. (Warning—The explana-tion of r and R are only intended to present a meaningful wayof considering the approximate precision of these test methods.The data in the tables should not be applied to acceptance orrejection of materials, as these data apply only to the materialstested in the round robins and are unlikely to be rigorouslyrepresentative of other lots, formulations, conditions, materials,or laboratories. Users of these test methods should apply theprinciples outlined in Practice E 691 to generate data specificto their materials and laboratory.)
NOTE 34—The precision data presented in the tables were obtainedusing the test conditions defined in the test methods. If a materialspecification defines other test conditions, these precision data shall beassumed not to apply.
ASr = within-laboratory standard deviation for the indicated material. It is ob-tained by pooling the within-laboratory standard deviations of the test results fromall of the participating laboratories.
BSR = between-laboratory reproducibility, expressed as standard deviation.Cr = within-laboratory critical interval between two results = 2.8 3 Sr.DR = between-laboratories critical interval between two results = 2.8 3 SR.
D 3574 – 08
16Copyright by ASTM Int'l (all rights reserved); Mon Dec 1 21:59:24 EST 2008Downloaded/printed by3M Co pursuant to License Agreement. No further reproductions authorized.
ASr = within-laboratory standard deviation for the indicated material. It is ob-tained by pooling the within-laboratory standard deviations of the test results fromall of the participating laboratories.
BSR = between-laboratory reproducibility, expressed as standard deviation.Cr = within-laboratory critical interval between two results = 2.8 3 Sr.DR = between-laboratories critical interval between two results = 2.8 3 SR.
D 3574 – 08
17Copyright by ASTM Int'l (all rights reserved); Mon Dec 1 21:59:24 EST 2008Downloaded/printed by3M Co pursuant to License Agreement. No further reproductions authorized.
ASr = within-laboratory standard deviation for the indicated material. It is ob-tained by pooling the within-laboratory standard deviations of the test results fromall of the participating laboratories.
BSR = between-laboratory reproducibility, expressed as standard deviation.Cr = within-laboratory critical interval between two results = 2.8 3 Sr.DR = between-laboratories critical interval between two results = 2.8 3 SR.
TABLE 14 Tensile Test E, Elongation by Crosshead Travel, D 412Die, %
ASr = within-laboratory standard deviation for the indicated material. It is ob-tained by pooling the within-laboratory standard deviations of the test results fromall of the participating laboratories.
BSR = between-laboratory reproducibility, expressed as standard deviation.Cr = within-laboratory critical interval between two results = 2.8 3 Sr.DR = between-laboratories critical interval between two results = 2.8 3 SR.
TABLE 15 Tensile Test E, Elongation by Crosshead Travel,D 3574 Die, %
ASr = within-laboratory standard deviation for the indicated material. It is ob-tained by pooling the within-laboratory standard deviations of the test results fromall of the participating laboratories.
BSR = between-laboratory reproducibility, expressed as standard deviation.Cr = within-laboratory critical interval between two results = 2.8 3 Sr.DR = between-laboratories critical interval between two results = 2.8 3 SR.
TABLE 16 Tensile Test E, Elongation by Benchmarking, D 3574Die, %
ASr = within-laboratory standard deviation for the indicated material. It is ob-tained by pooling the within-laboratory standard deviations of the test results fromall of the participating laboratories.
BSR = between-laboratory reproducibility, expressed as standard deviation.Cr = within-laboratory critical interval between two results = 2.8 3 Sr.DR = between-laboratories critical interval between two results = 2.8 3 SR.
TABLE 20 Static Fatigue Test I1, Thickness Loss, %
ASr = within-laboratory standard deviation for the indicated material. It is ob-tained by pooling the within-laboratory standard deviations of the test results fromall of the participating laboratories.
BSR = between-laboratory reproducibility, expressed as standard deviation.Cr = within-laboratory critical interval between two results = 2.8 3 Sr.DR = between-laboratories critical interval between two results = 2.8 3 SR.
D 3574 – 08
18Copyright by ASTM Int'l (all rights reserved); Mon Dec 1 21:59:24 EST 2008Downloaded/printed by3M Co pursuant to License Agreement. No further reproductions authorized.
ASr = within-laboratory standard deviation for the indicated material. It is ob-tained by pooling the within-laboratory standard deviations of the test results fromall of the participating laboratories.
BSR = between-laboratory reproducibility, expressed as standard deviation.Cr = within-laboratory critical interval between two results = 2.8 3 Sr.DR = between-laboratories critical interval between two results = 2.8 3 SR.
TABLE 23 Roller Shear Fatigue Test I2, 1 h, 4.5 N ThicknessLoss, % (20Kcycles)
ASr = within-laboratory standard deviation for the indicated material. It is ob-tained by pooling the within-laboratory standard deviations of the test results fromall of the participating laboratories.
BSR = between-laboratory reproducibility, expressed as standard deviation.Cr = within-laboratory critical interval between two results = 2.8 3 Sr.DR = between-laboratories critical interval between two results = 2.8 3 SR.
TABLE 24 Roller Shear Fatigue Test I2, 24 h, 4.5 N ThicknessLoss, % (20Kcycles)
ASr = within-laboratory standard deviation for the indicated material. It is ob-tained by pooling the within-laboratory standard deviations of the test results fromall of the participating laboratories.
BSR = between-laboratory reproducibility, expressed as standard deviation.Cr = within-laboratory critical interval between two results = 2.8 3 Sr.DR = between-laboratories critical interval between two results = 2.8 3 SR.
D 3574 – 08
19Copyright by ASTM Int'l (all rights reserved); Mon Dec 1 21:59:24 EST 2008Downloaded/printed by3M Co pursuant to License Agreement. No further reproductions authorized.
TABLE 29 Pounding Fatigue Test I3 1 h Thickness Loss, %(80Kcycles)
ASr = within-laboratory standard deviation for the indicated material. It is ob-tained by pooling the within-laboratory standard deviations of the test results fromall of the participating laboratories.
BSR = between-laboratory reproducibility, expressed as standard deviation.Cr = within-laboratory critical interval between two results = 2.8 3 Sr.DR = between-laboratories critical interval between two results = 2.8 3 SR.
TABLE 30 Pounding Fatigue Test I3 24 h Thickness Loss, %(80Kcycles)
ASr = within-laboratory standard deviation for the indicated material. It is ob-tained by pooling the within-laboratory standard deviations of the test results fromall of the participating laboratories.
BSR = between-laboratory reproducibility, expressed as standard deviation.Cr = within-laboratory critical interval between two results = 2.8 3 Sr.DR = between-laboratories critical interval between two results = 2.8 3 SR.
TABLE 31 Pounding Fatigue Test I3 1 h 40 % IFD Loss, %(80Kcycles)
ASr = within-laboratory standard deviation for the indicated material. It is ob-tained by pooling the within-laboratory standard deviations of the test results fromall of the participating laboratories.
BSR = between-laboratory reproducibility, expressed as standard deviation.Cr = within-laboratory critical interval between two results = 2.8 3 Sr.DR = between-laboratories critical interval between two results = 2.8 3 SR.
TABLE 32 Pounding Fatigue Test I3 24 h 40 % IFD Loss,%(80Kcycles)
ASr = within-laboratory standard deviation for the indicated material. It is ob-tained by pooling the within-laboratory standard deviations of the test results fromall of the participating laboratories.
BSR = between-laboratory reproducibility, expressed as standard deviation.Cr = within-laboratory critical interval between two results = 2.8 3 Sr.DR = between-laboratories critical interval between two results = 2.8 3 SR.
D 3574 – 08
20Copyright by ASTM Int'l (all rights reserved); Mon Dec 1 21:59:24 EST 2008Downloaded/printed by3M Co pursuant to License Agreement. No further reproductions authorized.
我的胶粘剂网www.wdjnj.com
APPENDIXES
(Nonmandatory Information)
X1. SUGGESTED METHOD FOR SPECIFYING FLEXIBLE URETHANE FOAMS
X1.1 For simplification in specifying foams, a line call outsystem may be used. The line call out could be used onengineering drawings for parts. The properties correspond tothe sections of this test method. The call out format shall be asfollows:
ASTM D 3574 Type [Slab, Molded, Bonded or other, as specified]Coring [Cored or Uncored]Urethane Chemistry [Polyether, Polyester, HR, Conventional]A Density [kg/m3] maximum, minimum or rangeB1 IFD [N] [for 25 % and 65 % deflections, 100 mm thick sample] max, min, or rangeB2 IRGL [mm] [at 4.5, 110 and 220 N, 100 mm thick sample] max, min, or rangeC CFD [kPa] [50 % deflection] max, min, or rangeD Compression set [%] [method—Cd or Ct] maxE Tensile [kPa] minF Tear [N/m] minG Air Flow [cfm] minH Ball Rebound [%] minI1 Static Fatigue [percent thickness loss and 25 % and 65 % IFD loss] maxI2 Roller Shear [percent loss of thickness and IRGL values] maxI3 Constant Force Pounding [percent change in thickness and percent change in 40 % IFD] maxI4 Dynamic Fatigue Test for Carpet Cushion [percent loss of thickness and percent retention of 65 % IFD value] maximum value and minimum value, respectivelyJ1 Steam Autoclave [physical properties to be tested as (tests A through I or M as specified, units as above] maximum or minimum values based on test specifiedJ2 Steam Autoclave [physical properties to be tested as (tests A through I or M as specified, units as above] maximum or minimum values based on test specifiedK Dry Heat Aging [physical properties to be tested as (tests A through I or M as specified, units as above] maximum or minimum values based on test specifiedL Wet Heat Aging [physical properties to be tested as (tests A through I or M as specified, units as above] maximum or minimum values based on test specifiedM Recovery Time [seconds] max, min, or rangeX Other tests as specified (Individual tests listed with subscripts)
X1.2 Example:
D 3574 Type [Slab]Coring [Uncored]Urethane Chemistry [Polyether]A Density [15.5 kg/m3] minB1 IFD [13 mm thick specimen 80-140 N ] rangeC CFD [3.0-4.0 kPa at 50 % deflection] rangeD Compression Set [10 % Ct] maximumE Tensile [80 kPa] minF Tear [0.25 kN/m] minJ1 Steam Autoclave [15 % change in CFD] maxK Dry Heat Aging [15 % change in CFD] maxX1 Flammability—MVSS 302 [102 mm/min] maxX2 Odor—SAE J 1351 [3] maxX3 Stain Resistance—ASTM D 925 Test A [no staining]X4 Low Temperature Flexibility—DCX MSAY 349 [no rupturing]
ASr = within-laboratory standard deviation for the indicated material. It is ob-tained by pooling the within-laboratory standard deviations of the test results fromall of the participating laboratories.
BSR = between-laboratory reproducibility, expressed as standard deviation.Cr = within-laboratory critical interval between two results = 2.8 3 Sr.DR = between-laboratories critical interval between two results = 2.8 3 SR.
D 3574 – 08
21Copyright by ASTM Int'l (all rights reserved); Mon Dec 1 21:59:24 EST 2008Downloaded/printed by3M Co pursuant to License Agreement. No further reproductions authorized.
X5 No auxiliary blowing agents may be used to manufacture product
X2. SUGGESTED METHOD OF CONSTRUCTION FOR A ROLLER SHEARDYNAMIC FLEX FATIGUE APPARATUS
X2.1 The following requirements are established to definethe equipment and relationship of parts for a constant-loadroller shear machine. See Fig. X2.1 and Fig. X2.2 for referenceto part numbers.
X2.2 Roller, 1:
X2.2.1 Dimensions—457-mm minimum length, and 76.206 1.27-mm diameter.
X2.2.2 Material—Corrosion and wear-resistant metal, ei-ther (1) chrome-plated material, or (2) stainless steel.
X2.2.3 Surface Finish—Finish surface on roller is to beground and equivalent to at least 0.001 mm.
X2.2.4 The mass of the roller shall not exceed 11.340 kg.
X2.3 Roller Mounting Bracket Assembly 2, 3, 4, 11—Theassembly consists of metal members designed to attach theroller to a pivot point, to provide bearing surfaces for minimumfriction for turning, and to serve as a platform to add requiredmass to the roller.
X2.3.1 Bearings, 2 and 4—The proper bearings are requiredon each end or roller axis (A-A) and also on the pivot axis(B-B). The bearing should be equivalent to the followingexample:Bearing No. 4—Nice No. 1635, DC Ball Bearing 19 by 32 by
NOTE X2.1—Roller axis bearings may be mounted in the bracket withthe axle attached to the roller or, if the roller is a hollow cylinder, thebearing may be press fit into the cylinder end with the bracket furnishingthe axle.
X2.3.2 Pivot Arm, 11—The distance between the pivot axisand the roller axis shall be 203.20 6 6.35 mm.
X2.3.3 Roller Bracket Connector, 3, connects the right andleft bearing brackets across the top of the roller. The connectionmust also provide a flat horizontal surface with means (pin) toattach the weights. The weights must be centered directlyabove the axis of the roller.
X2.3.4 Axis Relationship—The roller axis (A-A) and pivotaxis (B-B) must be parallel and lie in the same horizontal planeparallel to the specimen mounting base.
X2.3.5 Alignment and Clearance—Brackets and axles mustbe aligned so that no binding occurs to obstruct free turning oneither axis. Brackets and other support members (5) must givefree clearance so that specimen is not touched during test otherthan by roller surface.
X2.3.6 Weight, 6—The total vertical force exerted by theassembly plus the roller should not exceed 111 N as measuredat a point directly above or below the roller axis when both
FIG. X2.1 Roller Shear Machine—Top View
D 3574 – 08
22Copyright by ASTM Int'l (all rights reserved); Mon Dec 1 21:59:24 EST 2008Downloaded/printed by3M Co pursuant to License Agreement. No further reproductions authorized.
我的胶粘剂网www.wdjnj.com
roller and pivot axes are in the same horizontal plane (X2.3.4).Additional weights to be added as shown.
X2.3.7 Vertical Adjustment, 7—If the roller is not driven toprovide stroke movement, provision should be made so thatattachment of the pivot axis to the support can be raised orlowered at least 75 mm [3 in.]. This adjustment must be able tobe made in not less than 12.5-mm increments.
X2.4 Specimen Mounting Base, 8:
X2.4.1 Dimensions—500-mm minimum length. 500-mmminimum width, and 9.5-mm minimum thickness.
X2.4.2 Material—Structural-grade carbon steel.X2.4.3 Perforation—6-mm diameter holes on 20-mm cen-
ters, over a minimum area covering 350 mm in length by 350mm in width.
X2.4.4 Surface Finish—Top surface shall be a finish grind.X2.4.5 Hold-Down Plates, 9—Provision to attach metal or
wood hold-down plates for clamping cotton sheeting retainingstrips to base. Four plates are required to cover perimeter ofspecimen size.
X2.4.6 Vertical Adjustment and Level, 10—If mountingbase is not driven to provide stroke movement, provisionshould be made for vertical adjustment of at least 75 mm. This
adjustment must be able to provide vertical movement in notless than 12.5-mm increments and maintain a horizontal levelcondition of the mounting base.
X2.5 Mechanical Requirements:
X2.5.1 Stroke Length—The length of stroke shall be 330 6
12 mm.X2.5.2 Stroke Speed, Stroke Drive—The rate of stroke
speed should produce 0.47 6 0.03 Hz. A cycle is a completeforward and reverse stroke. Either the roller or the mountingbase may be driven to produce stroke travel. In either case, thedrive mechanism must produce travel in a horizontal plane.
X2.5.3 Angular Offset—The axis of the roller should belevel and mounted at a 15 6 3° offset from perpendicular to thedirection of the stroke.
X2.5.4 Mounting Base Location—The length of the mount-ing base should be parallel to the direction of the stroke andcentered under the midpoint of the stroke and the center of theroller. The distance of the base surface from the roller axis(X2.3.4) should be 45 mm when vertical adjustment providesa minimum clearance.
X2.5.5 Cycle Counter—Means to record the number ofcycles should be provided.
X3. DEFINITIONS OF TERMS USED TO DESCRIBE THE FORCE-DEFLECTION CURVEOF FLEXIBLE URETHANE FOAM
X3.1 support factor—the ratio of the 65 % indentationforce deflection to the 25 % indentation force deflectiondetermined after 1 min of rest. Most specifications are based onthe 25 % IFD value of a 100-mm foam. The support factor thusindicates what 65 % IFD value would be acceptable for aparticular application. The 65 % IFD measures the supportregion of the stress-strain curve. Seating foams with lowsupport factors will usually bottom out and give inferiorperformance.
Support factor ~SF! 5 ~65 % IFD/25 % IFD! (X3.1)
Synonyms—Sag factor, hardness ratio, comfort factor. Theseterms should be removed from the vocabulary. Support factoris the term of choice.
X3.2 guide factor—the ratio of the 25 % indentation forcedeflection to the density after a 1-min rest. Most specificationsdo not have a density requirement; therefore the product with
FIG. X2.2 Roller Shear Machine—Side View
D 3574 – 08
23Copyright by ASTM Int'l (all rights reserved); Mon Dec 1 21:59:24 EST 2008Downloaded/printed by3M Co pursuant to License Agreement. No further reproductions authorized.
the highest guide factor has the cost advantage but notnecessarily the performance advantage.
Guide factor ~GF! 5 ~25 % IFD/density! (X3.2)
X3.3 initial hardness factor—the ratio of the 25 % inden-tation force deflection force to the 5 % indentation forcedeflection determined without the 1-min rest. The initialhardness ratio defines the surface feel of a flexible urethanefoam. Supple or soft surface foam will have a high value, whileboardy or stiff surface foams will have a low value (NoteX3.1).
NOTE X3.1—Standard IFD curves can be used to generate the IHF, IM,and MIF data.
X3.4 hardness index—the term used in some specificationsfor the 50 % IFD value. The chair designer will often designfurniture for a maximum 50 % indentation. Bar stools, on theother hand, may be designed for only a 20 % deflection.
X3.5 indentation modulus—the force required to producean indentation of an additional 1 % between the limits of 20 %indentation force deflection and 40 % indentation force deflec-tion, determined without the 1-min rest. The slope of this linedepends upon the resistance of the cells struts to post buckling(Note X3.1).
X3.6 modulus irregularity factor—the intercept producedon the stress axis by extrapolation of the linear portion of thestress-strain curve. The indentation modulus, that is, the slopeof the line, may be substantially constant up to and beyond the40 % indentation level. In this event, the indentation stress-strain curve is linear and passes through the origin Fig. X3.1.
The indentation modulus usually varies at low levels of strainbefore reaching a constant value at above approximately 10 perstrain. The stress-strain curve may exhibit a marked step in thatregion which may result in some discomfort in seating appli-cations, Fig. X3.2 and Fig. X3.3. The MIF value is calculatedfrom the same data necessary to derive the modulus of thefoam as a seating material (Note X3.1).
FIG. X3.1 Indentation Stress-Strain Curve (MIF is Zero)
FIG. X3.2 Indentation Stress-Strain Curve (MIF is positive)
D 3574 – 08
24Copyright by ASTM Int'l (all rights reserved); Mon Dec 1 21:59:24 EST 2008Downloaded/printed by3M Co pursuant to License Agreement. No further reproductions authorized.
我的胶粘剂网www.wdjnj.com
X4. SUGGESTED TESTS FOR DETERMINING COMBUSTIBILITY OF FLEXIBLE URETHANE FOAM
X4.1 This appendix lists for informational purposes onlythe test methods commonly used for determining the combus-tion properties of flexible urethane foams. These tests havebeen found useful in ascertaining the effectiveness of additivesand reactants to modify the combustion characteristics of thesematerials. See 1.3.
X4.2 Some Applicable Codes and Regulations for SpecifiedApplications:
Application RegulationAutomotive DOT MVSS 302Mattress and cushion DOC FF 4-72Mattress and cushion CAL TB 117Mattress and cushion CAL TB 133A
Mattress and cushion CAL AB 603A
Mattress and cushion NFPA 260A
Mattress and cushion NFPA 261A
Mattress and cushion BSI 5852A
Aviation FAA Part 25.853 Par (b) App FAviation FAA Oil Burner TestCarpet cushion ASTM E84Carpet cushion DOC FFI-70 (Pill Test)Miscellaneous ASTM D 3675_______________
A Composite test. Foam, fabric, and other components may have a synergisticeffect on each other.
Various governmental bodies have issued regulations basedon Test Methods E 162 and E 662. The regulations are not thesame for all bodies issuing them. Hence, the regulation of thegovernment having jurisdiction should be consulted.
These standards are used to measure and describe theresponse of materials, products, or assemblies to heat and flameunder controlled conditions, but do not by themselves incor-porate all factors required for fire hazard or fire risk assessmentof the materials, products, or assemblies under actual fireconditions.
X4.2.1 Sources:Government Documents Superintendent of Documents, US Gov-
ernment Printing Office, Washington,DC 20402
California California Bureau of Home Furnishings,3485 Orange Grove Ave., North High-lands, CA 95660
National Fire Protection Association 1 Batterymarch Park, P.O. Box 9101,Quincy, MA 02269
British Standard British Standards Institute, 2 Park Street,London, England W1A 2B5
FIG. X3.3 Indentation Stress-Strain Curve (MIF is negative)
D 3574 – 08
25Copyright by ASTM Int'l (all rights reserved); Mon Dec 1 21:59:24 EST 2008Downloaded/printed by3M Co pursuant to License Agreement. No further reproductions authorized.
X5. SUGGESTED METHOD FOR THE VERIFICATION OF AN INCLINED OIL MANOMETER
X5.1 Adjust the feet to level the manometer. With a heightgauge resting on a level and flat surface, measure the distanceto the top of the glass tube at each major mark. Determine thearea of the tube by direct measurement. The area of thereservoir is calculated by adding a measured amount of fluidwith both ends of the manometer at atmospheric pressure. Thecalculation for the area of the reservoir (A):
A 5 ~v 2 ay!/h (X5.1)
where:v = the volume added,a = the area of the inside of the tube,y = the distance between readings, andh = the change in height.
X5.2 Change in pressure is calculated by:
Pm 2 Pn 5 wy ~sin u 1 a/A! (X5.2)
where:Pm = the low reading,Pn = the high reading,w = the specific gravity of the indicating fluid,y = the distance between readings,u = the angle of the tube to normal,a = the area of the inside of the tube, andA = the area of the reservoir.
X5.3 The error is the difference between the calculated andthe indicated value.
X6. SUGGESTED METHOD FOR MEASURING THE HYSTERESIS LOSS OF FOAMS
X6.1 Hysteresis Loss for the purpose of this method isdefined as the difference between the loading energy and theunloading energy expressed as a percentage of the loadingenergy.
Hysteresis Loss 5 [Loading Energy – Unloading Energy]3 100/[Loading Energy]
where:
1) Energy is defined as the area under the Force/DeflectionCurve.
2) Loading Energy is the energy required to indent orcompress a flexible material to a preset deflection (compressioncycle).
3) Unloading Energy is the Energy recovered when theindentation or compression platen is retacted from the presetdeflection and completely unloaded. (decompression cycle).
Procedure A—IFD Hysteresis Loss
X6.2 Prepare and preflex samples in accordance withASTM D 3574 Test B1. After the 6 6 1 minute waiting period,
indent the sample at a rate of 50 6 5 mm/min by 75 6 5 % ofits original height. Immediately remove the indentation force at50 6 5 mm/min until the platen fully returns. Calculate thehysteresis loss as defined above.
Procedure B—CFD Hysteresis Loss
X6.3 Prepare and preflex samples in accordance withASTM D 3574 Test C. After the 6 6 1 minute waiting period,compress the sample at a rate of 50 6 5 mm/min by 75 6 5 %of its original height. Immediately remove the compressionforce at 50 6 5 mm/min until the platen fully returns. Calculatethe hysteresis loss as defined above.
NOTE X6.1—Different wait times, test speeds, and deflections may beagreed upon by purchaser and supplier.
NOTE X6.2—It is extremely important that the Universal TestingMachine’s (UTM) crosshead reverses direction with minimal hesitation atthe maximum compression point, otherwise false readings will be ob-tained.
NOTE X6.3—In addition to the hysteresis loss number, identify thefoam as core or with skin, indicate which procedure was followed and anyvariances to the procedure, such as those listed in Note X6.1 above.
D 3574 – 08
26Copyright by ASTM Int'l (all rights reserved); Mon Dec 1 21:59:24 EST 2008Downloaded/printed by3M Co pursuant to License Agreement. No further reproductions authorized.
我的胶粘剂网www.wdjnj.com
SUMMARY OF CHANGES
Committee D20 has identified the location of selected changes to this standard since the last issue(D 3574 - 05) that may impact the use of this standard. (July 1, 2008)
(1) Reworded thickness measurement (4.5N) in IRGL test toreflect no 60 second dwell.(2) Specified core material as the default for the CFD test formolded foams.(3) Added Precision and Bias for Static Fatigue, Roller ShearFatigue and Recovery Time tests.(4) Changed designations for Tests J, K, L to “Agings” andclarified conditioning sections.(5) Changed presser foot force requirements for measuring
foam thicknesses from 170 Pa to 800 Pa based on work doneby Woodbridge Foam Corporation in 2006.(6) Changed Air Flow test to only in the foam rise direction.(7) Added stronger language for the usefulness of usingFrazier air flow instead of the D 3574 air flow test, includingthe relationship between the two.(8) Added a reference to D 3576 for cell size measurementsalong with a cell size definition.(9) Updated all of the ISO equivalency statements.
ASTM International takes no position respecting the validity of any patent rights asserted in connection with any item mentionedin this standard. Users of this standard are expressly advised that determination of the validity of any such patent rights, and the riskof infringement of such rights, are entirely their own responsibility.
This standard is subject to revision at any time by the responsible technical committee and must be reviewed every five years andif not revised, either reapproved or withdrawn. Your comments are invited either for revision of this standard or for additional standardsand should be addressed to ASTM International Headquarters. Your comments will receive careful consideration at a meeting of theresponsible technical committee, which you may attend. If you feel that your comments have not received a fair hearing you shouldmake your views known to the ASTM Committee on Standards, at the address shown below.
This standard is copyrighted by ASTM International, 100 Barr Harbor Drive, PO Box C700, West Conshohocken, PA 19428-2959,United States. Individual reprints (single or multiple copies) of this standard may be obtained by contacting ASTM at the aboveaddress or at 610-832-9585 (phone), 610-832-9555 (fax), or [email protected] (e-mail); or through the ASTM website(www.astm.org).
FIG. X6.1 Hysteresis Loss
D 3574 – 08
27Copyright by ASTM Int'l (all rights reserved); Mon Dec 1 21:59:24 EST 2008Downloaded/printed by3M Co pursuant to License Agreement. No further reproductions authorized.

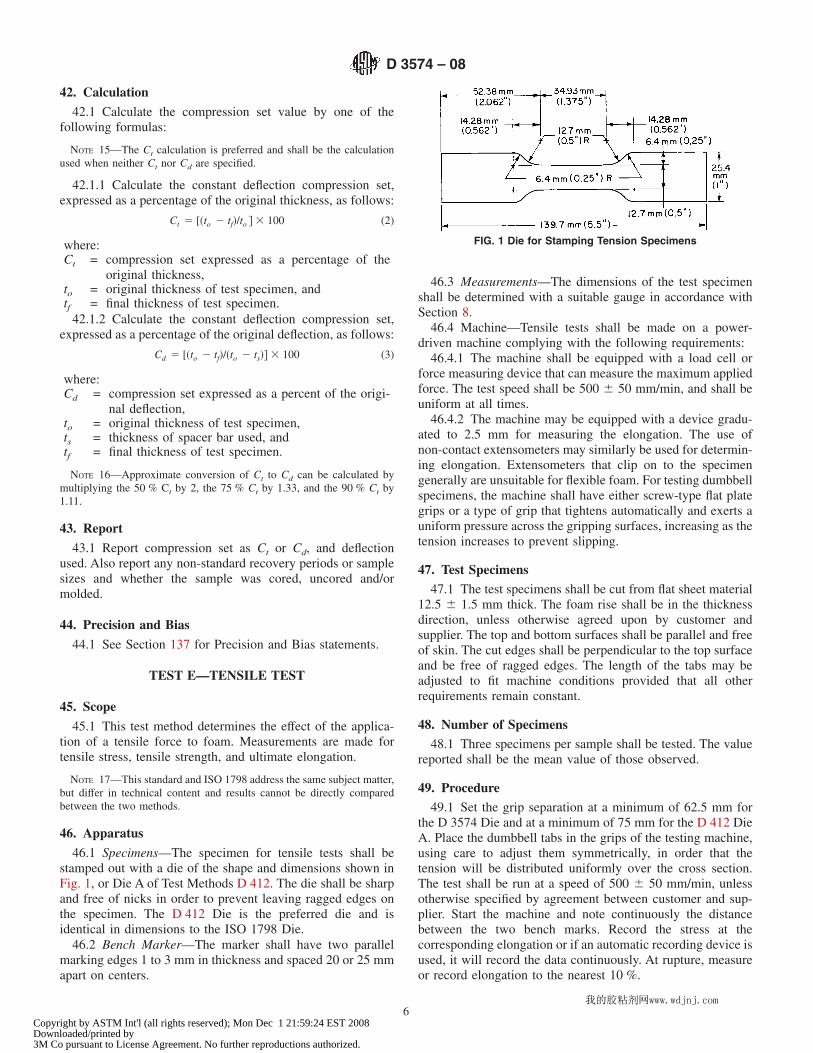

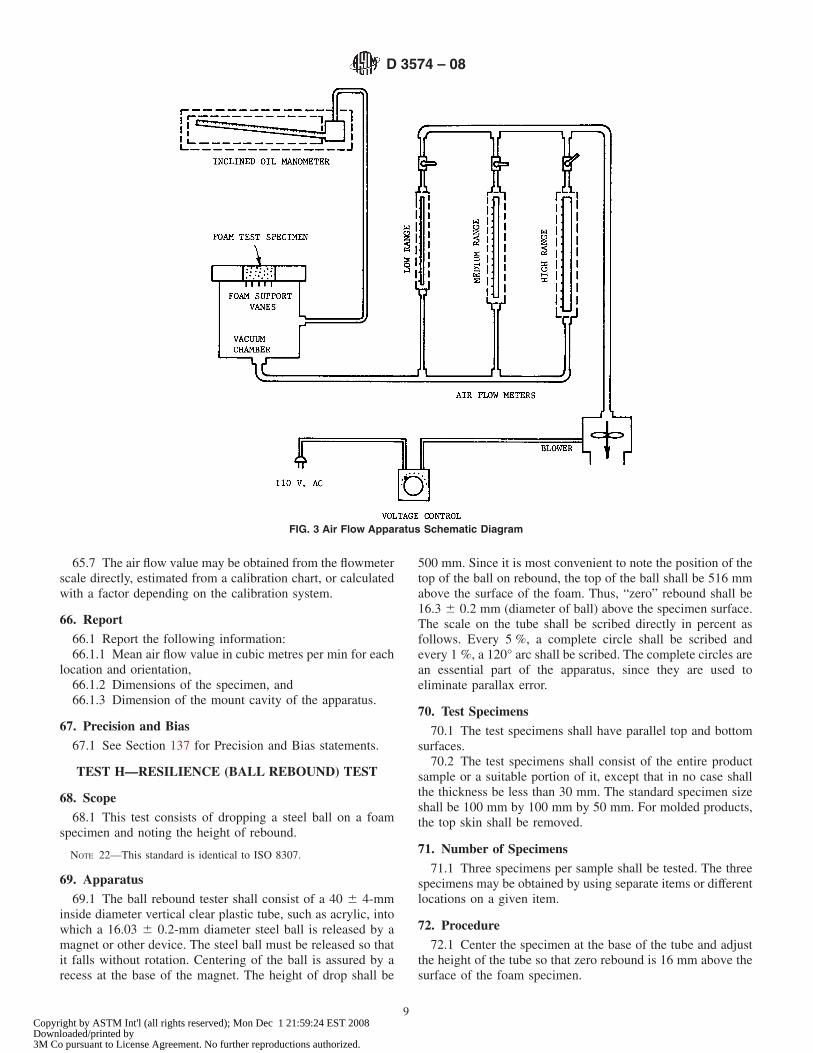
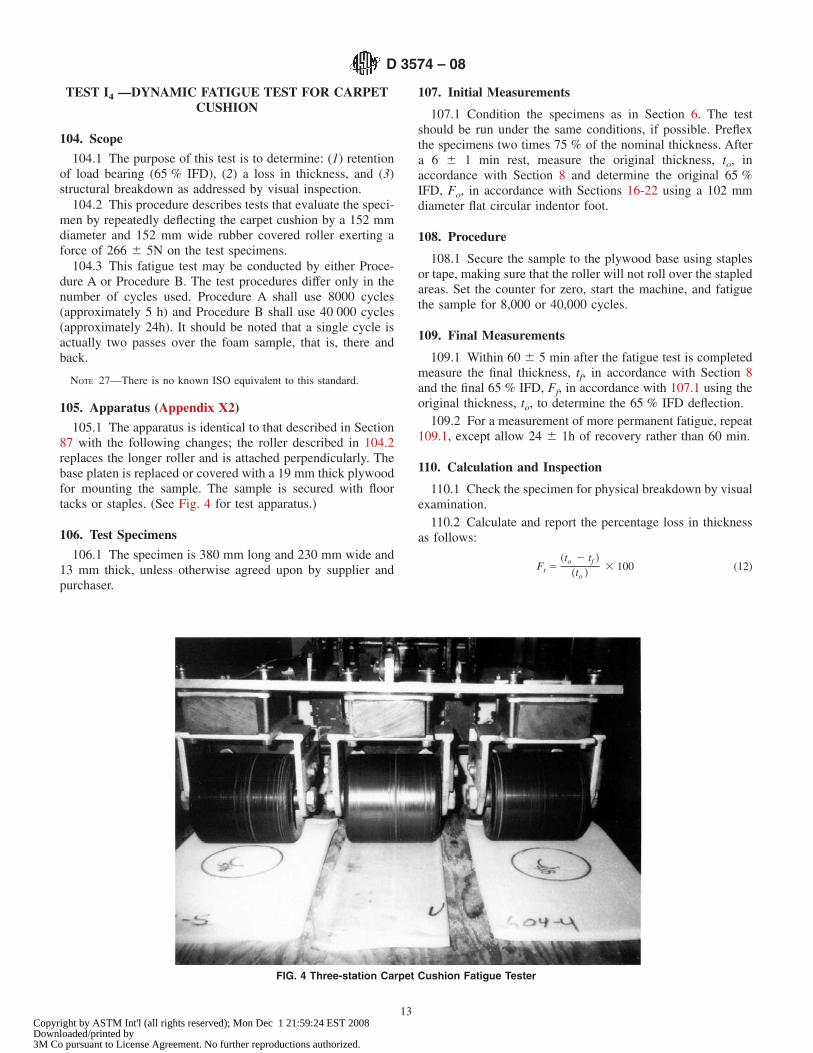
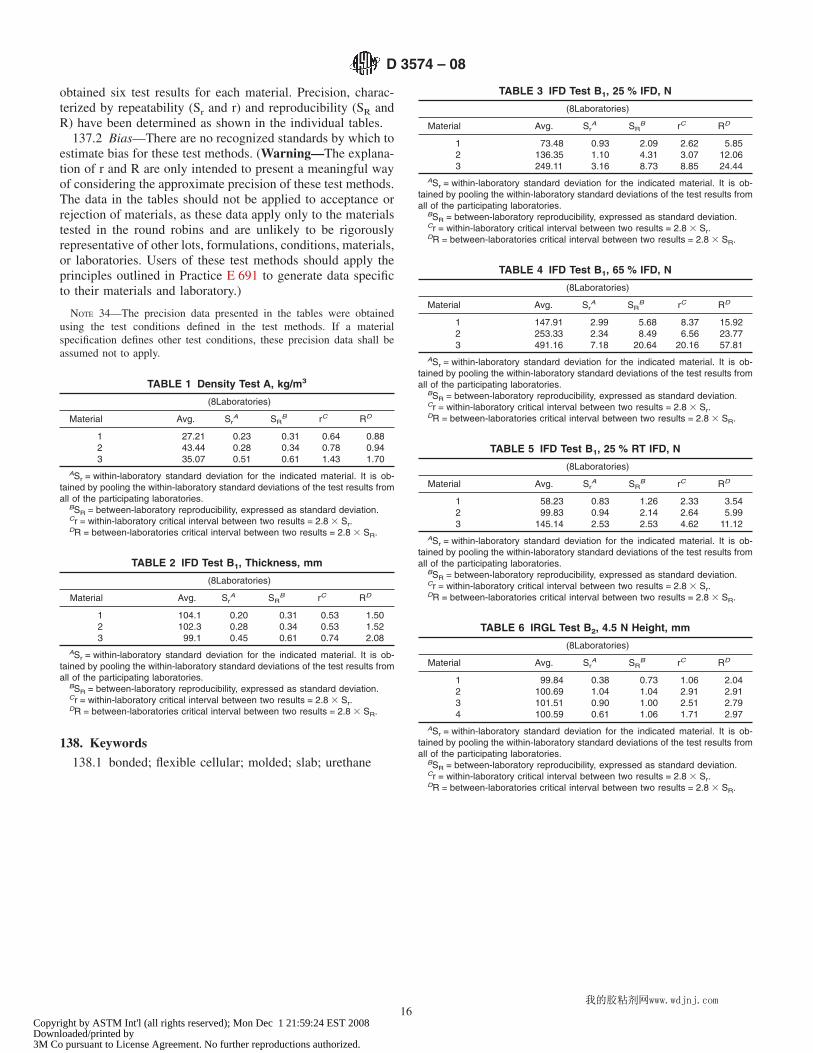
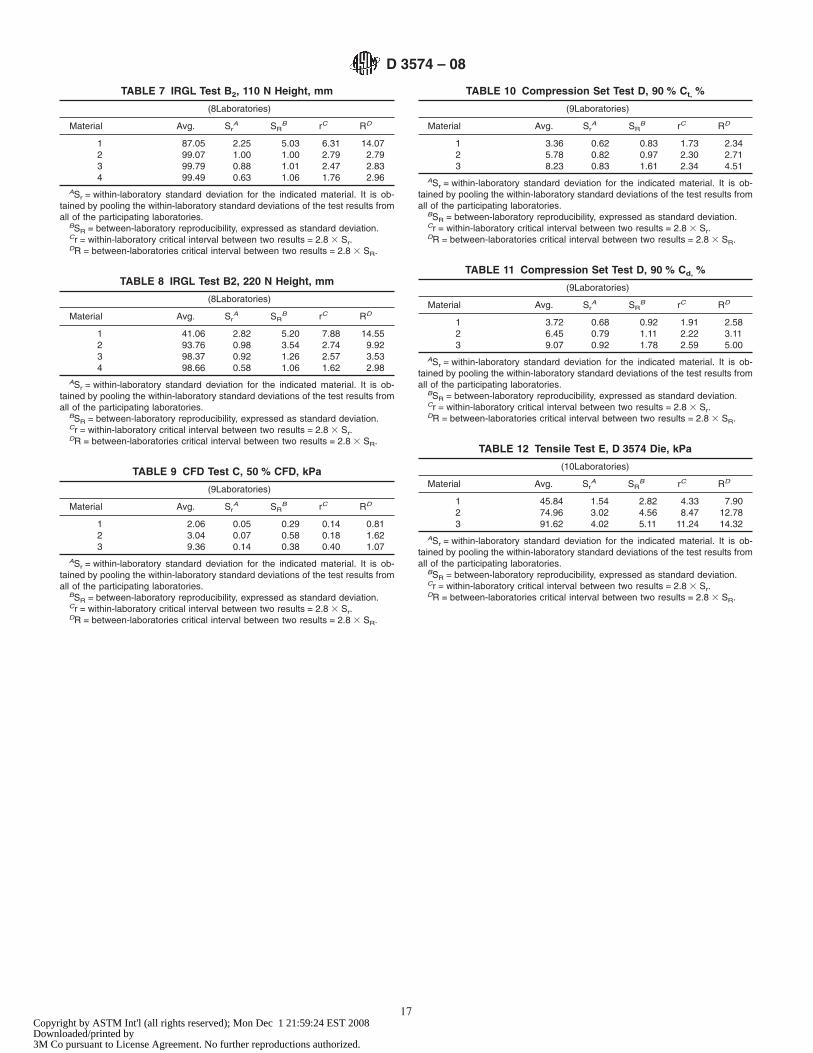
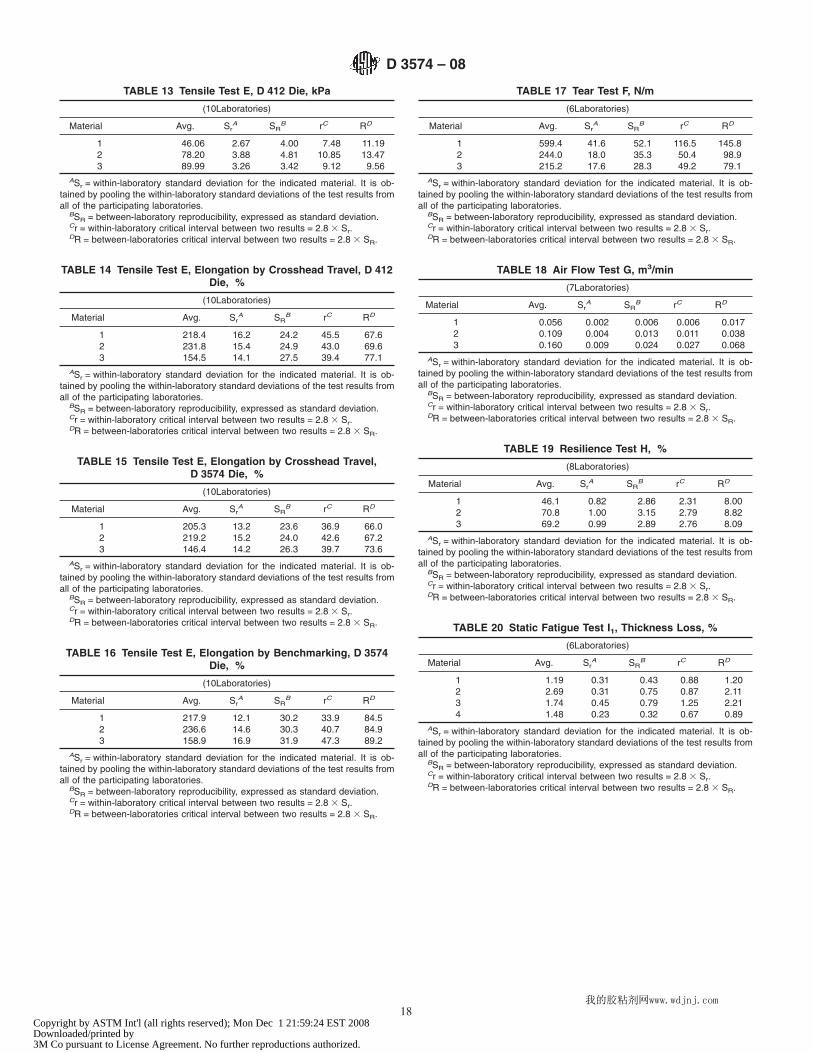
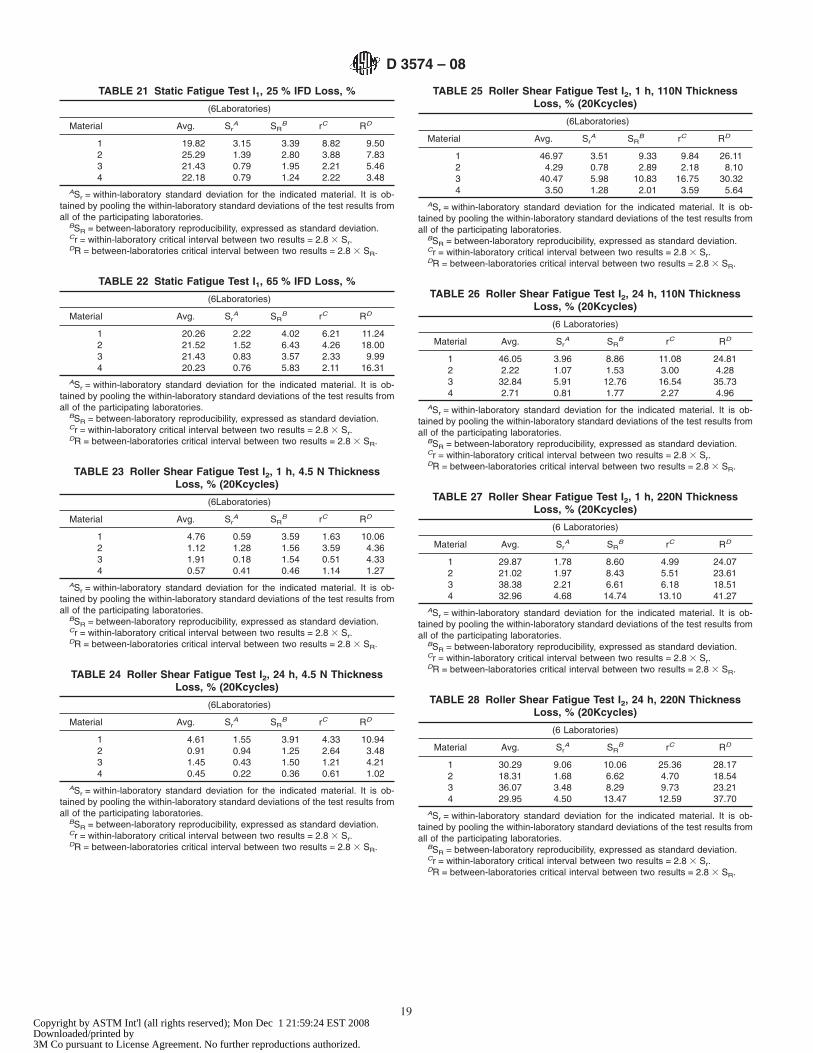
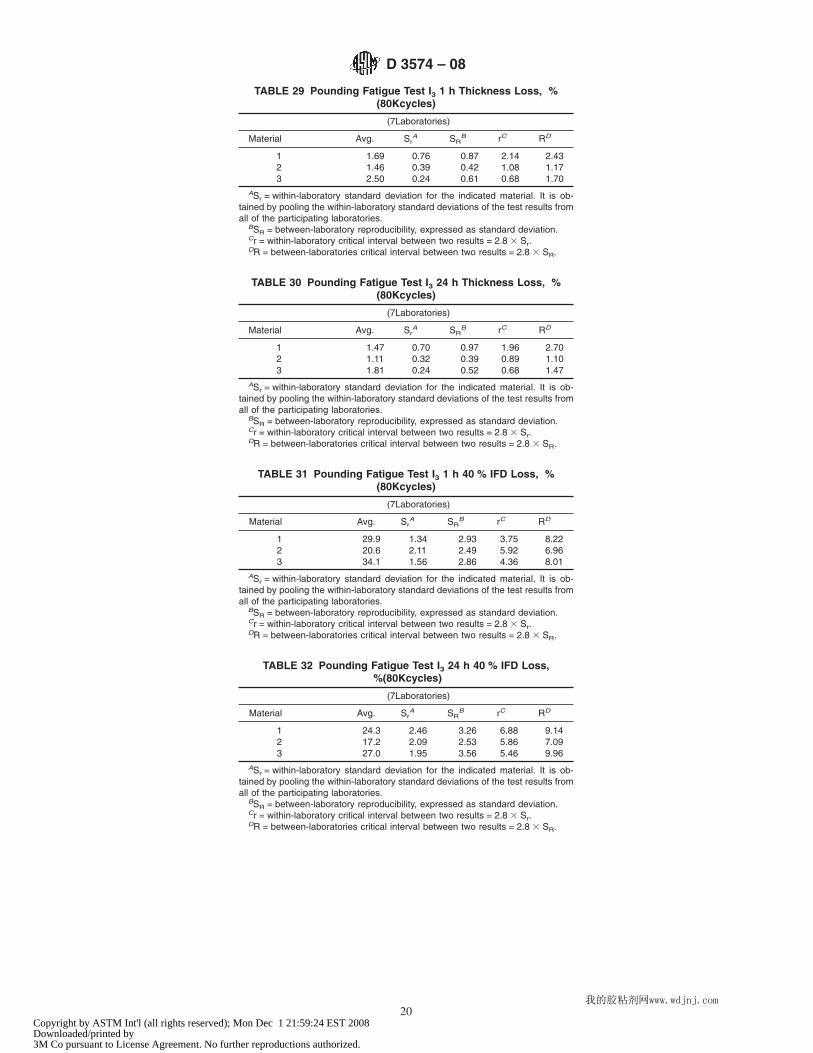
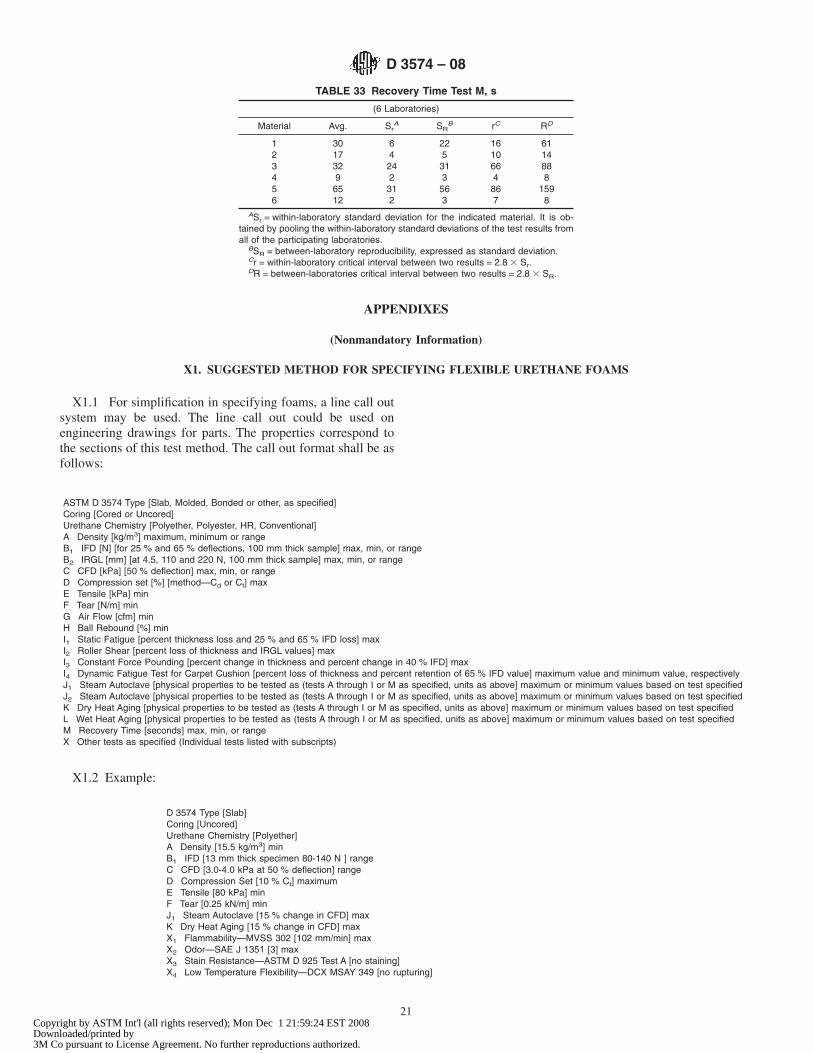
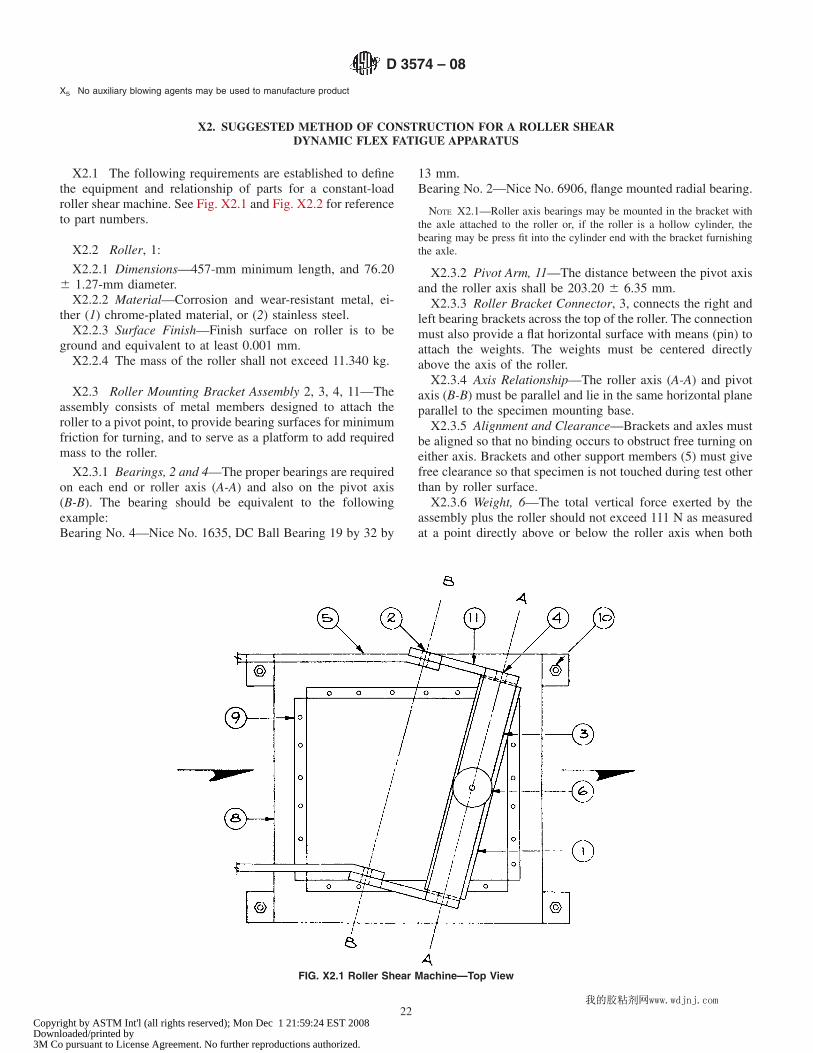
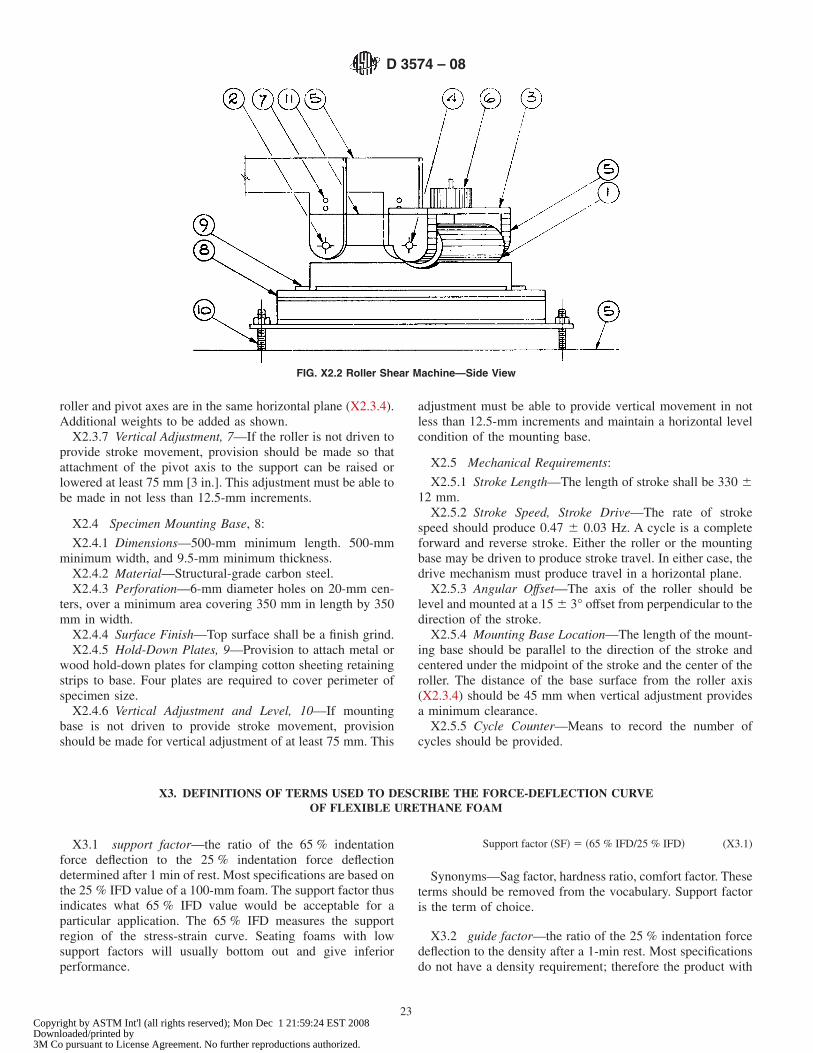
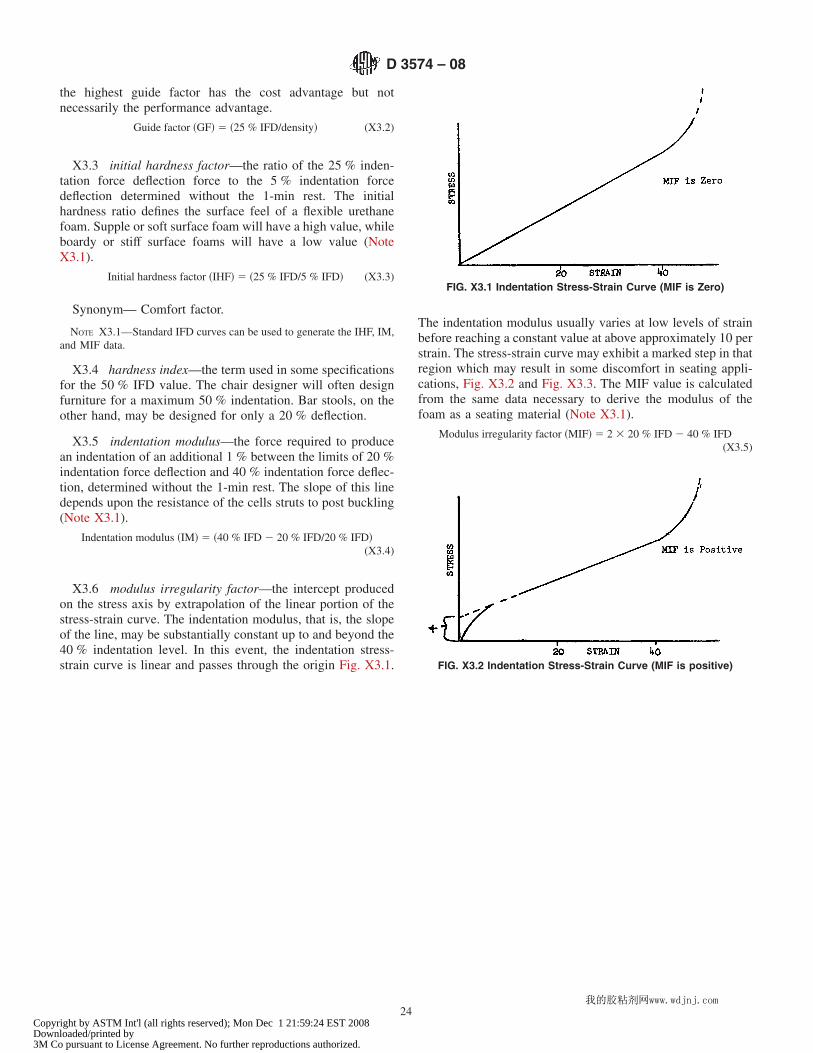
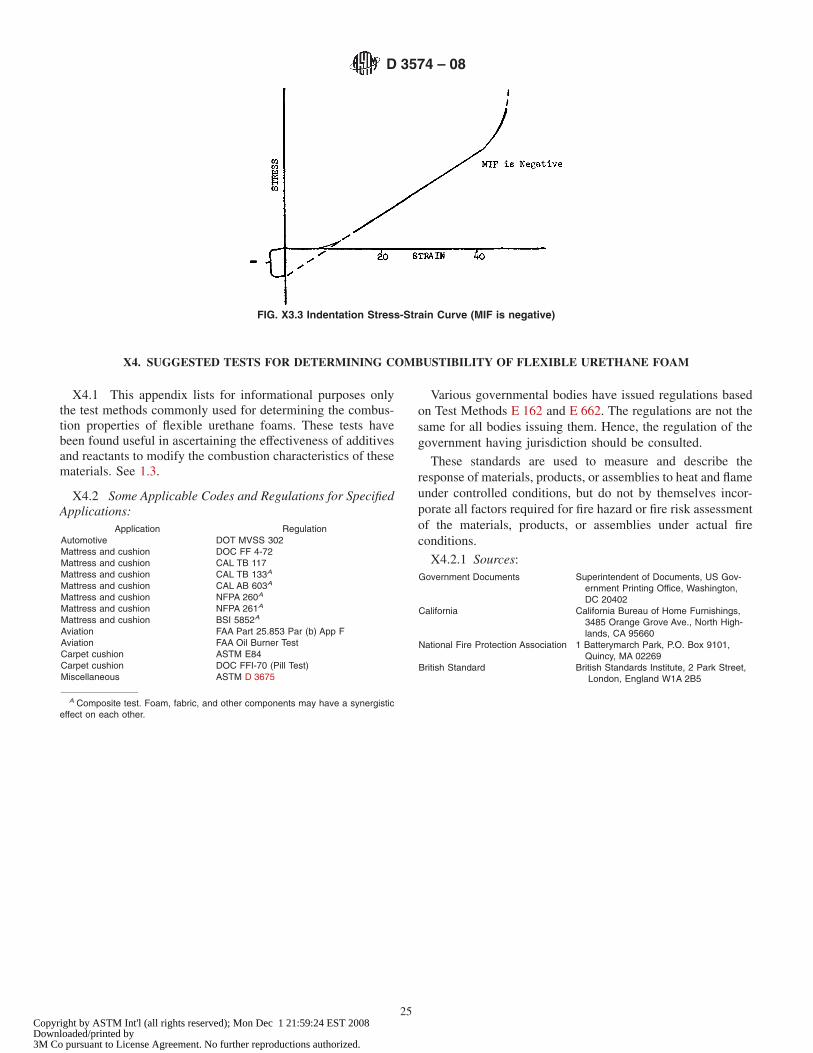
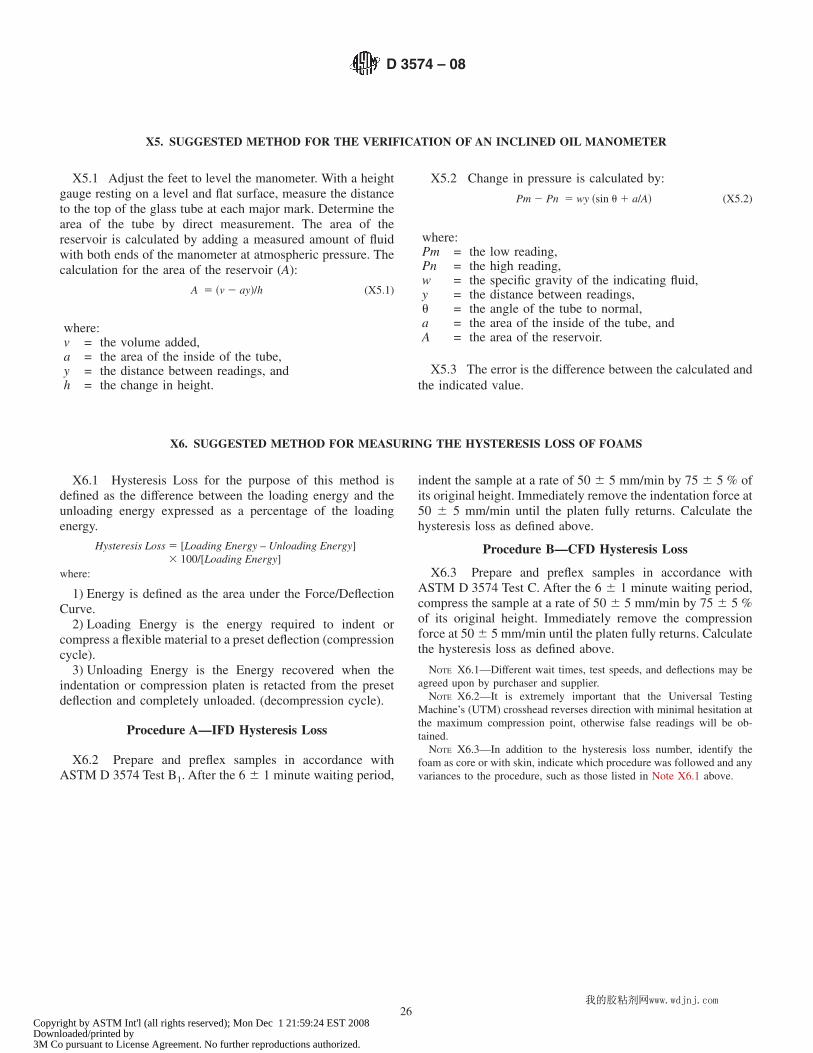
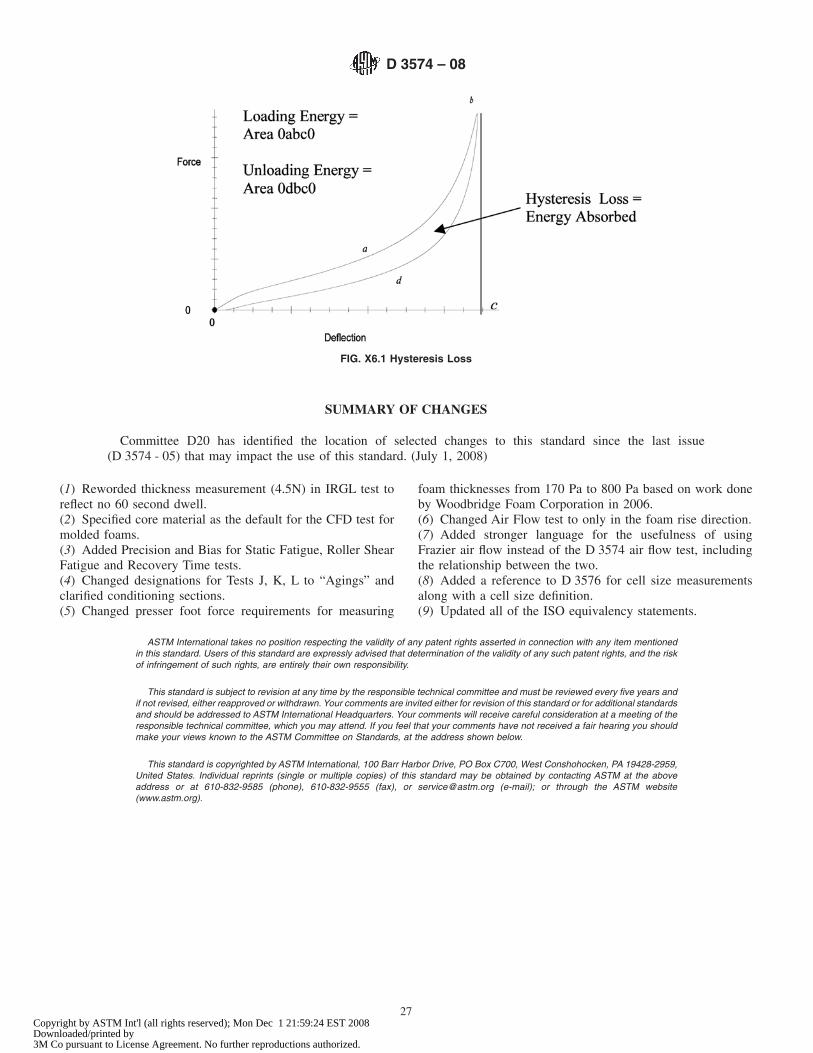

![IS 3574-2 (2000): Organic Pigments for Paints, Part 2 ... · Phthalocyanines [CHD 20: Paints, Varnishes and Related Products] IS 3574 (Part 2) : 2000 *m m2w o-vN+~) Indian Standard](https://static.documents.pub/doc/80x56/5fbf73ac60daae357f187dfb/is-3574-2-2000-organic-pigments-for-paints-part-2-phthalocyanines-chd-20.jpg)


