120
ASTRO Spring Refresher 2014 Management of Central Nervous System Malignancies Christina Tsien, MD University of Michigan Medical Center

ASTRO Spring Refresher 2014 Management of Central Nervous
System Malignancies
Christina Tsien, MD University of Michigan Medical Center

Learning Objectives • Discuss the current clinical practice in the treatment
of brain metastases
• Discuss the current clinical practice in the treatment of the major adult primary CNS tumors
• Understand the prognostic and predictive variables that allow for the appropriate selection of therapeutic choices, tailored for a specific patient

Overview
• Brain Metastases
• GBM
• Anaplastic Gliomas • Low Grade Gliomas
Presented by:

Brain Metastases
• Presentation
• Role of Surgery
• Treatment
Presented by:
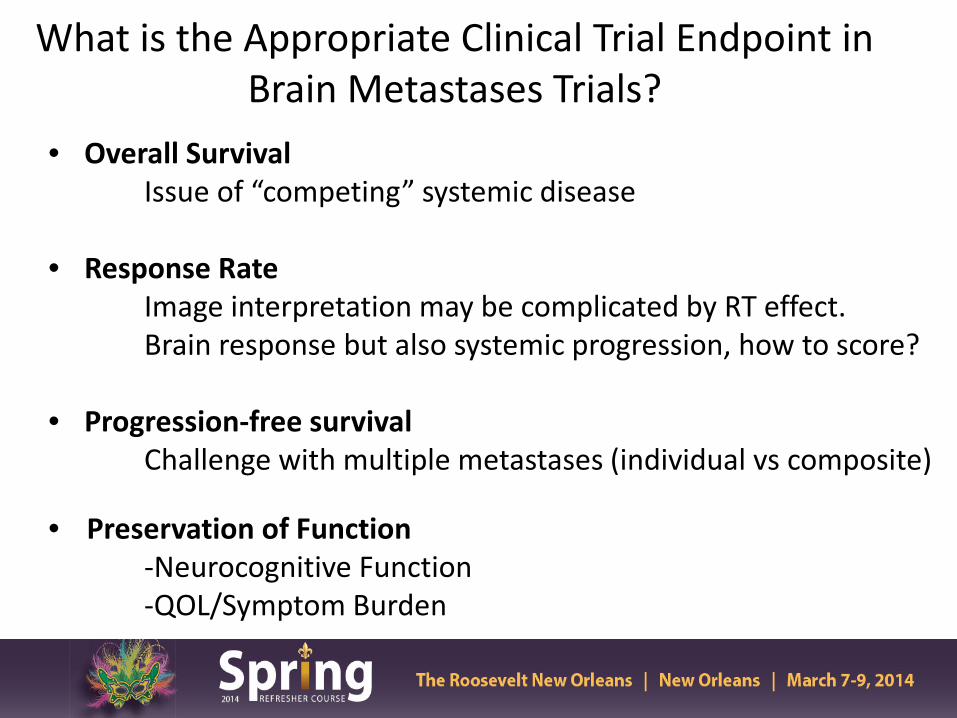
What is the Appropriate Clinical Trial Endpoint in Brain Metastases Trials?
• Overall Survival Issue of “competing” systemic disease
• Response Rate
Image interpretation may be complicated by RT effect. Brain response but also systemic progression, how to score?
• Progression-free survival
Challenge with multiple metastases (individual vs composite)
• Preservation of Function -Neurocognitive Function -QOL/Symptom Burden

Brain Metastases Presentation
Signs – Hemiparesis (59%) – Cognitive problems (58%) – Hemisensory loss (21%) – Papilledema (20%) – Ataxia (19%) – Apraxia (18%)
Symptoms – Headache (49%) – Altered Mental status (32%) – Focal weakness (30%) – Ataxia (21%) – Seizures (18%) – Speech problems (12%)
Posner, 1995

RPA Class: Not all Mets are Created Equal
• Class I – <65, KPS ≥ 70, – Controlled primary – No extracranial mets
• Class II-Rest • Class III-KPS <70
•Gaspar, IJROBP, 47: 1001-6, 2000. •Gaspar, IJROBP, 37: 745-51, 1997.
(7.1)
(2.3)
N = 445 Original 1200
(4.2)

Updated Graded Prognostic Assessment (GPA) by Diagnosis
Sperduto P et al, JCO;30(4):419-25, 2012
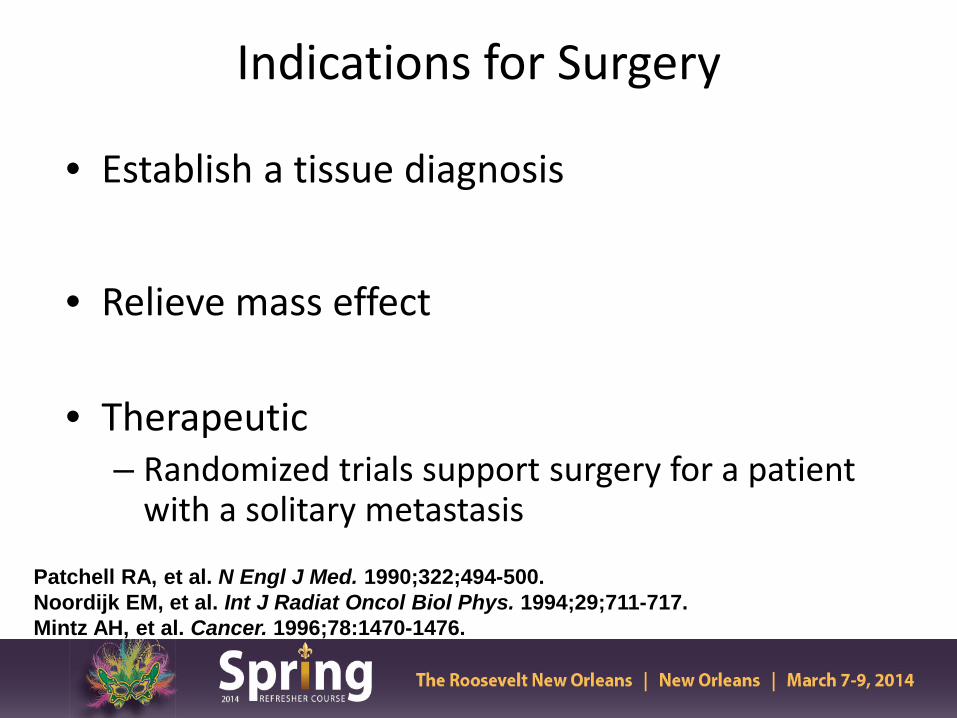
Indications for Surgery
• Establish a tissue diagnosis
• Relieve mass effect
• Therapeutic – Randomized trials support surgery for a patient
with a solitary metastasis
Patchell RA, et al. N Engl J Med. 1990;322;494-500. Noordijk EM, et al. Int J Radiat Oncol Biol Phys. 1994;29;711-717. Mintz AH, et al. Cancer. 1996;78:1470-1476.

Randomized Surgical Trials WBRT with/without Surgical Resection
Trial Year Rx N MS Fl P-value
Patchell 90 S/RT 25 40 38 wks <0.01
RT 23 15 8 wks
Noordijk 94 S/RT 32 43 34 0.04
RT 31 26 21
Mintz 96 S/RT 41 24 ~ ns
RT 43 27 ~
Intergroup 90 S/RT 25 55
Fewer local recurrences and remained functionally independent for longer

WBRT lowers all recurrences and CNS deaths, but has no impact on survival
Phase III Surgery +/-WBRT Failure Patterns and Survival
Recurrence Surgery S + WBRT p
Anywhere in CNS 32/46 (70%) 9/49 (18%) <0.001 Local 21/46 (46%) 5/49 (10%)
CNS Death 17/39 (44%) 6/43 (14%) 0.003
Median Survival 43 weeks 48 weeks 0.39
Patchell et al. JAMA 1998;280:1485-9

Surgery for 2 - 4 Metastases
• Retrospective review of 26 patients with resection of multiple mets consistent with 26 similar patients with resected single mets
• Median survival at 1, 2, and 5 years was similar – Median: 14 months vs 14 months – 1 year: 55 vs 50% – 2 years: 32 vs 30% – 5 years: 11 vs 166%
Bindal, et al. J Neurosurg. 1993;79:210.

Enrollment: 1/96-6/01: 331 pts Arm 1: WBRT + SRS ( 164 pts) Arm 2: WBRT (37.5 Gy) alone ( 167 pts) Stratification: 1. Number of brain metastases (1 vs 2 - 3) 2. Extracranial mets (none vs present)
• < 2 cm 24 Gy • 2.1 – 3.0 cm 18 Gy • 3.1 – 4.0 cm 15 Gy
15 & 24% of 1 & 2-3 brain met pts randomized to RS did not receive it
RTOG 9508: Phase III Trial
RTOG Phase I 9005 Shaw E. Int J Radiat Oncol Biol Phys. 2000;47: 291-298.

Summary RTOG 95-08 WBRT +/- SRS
Andrews DW. Lancet. 2004;363:1665-72
Improved OS with WBRT+ SRS only in solitary brain metastasis

Survival Analyses WBRT & SRS WBR P-value
Overall 6.5 mos 5.7 mos 0.13
Solitary brain met 6.5 mos 4.9 mos 0.04
1-3 mets & Age < 50 9.9 mos 8.3 mos 0.04
1-3 mets & NSCLC 5.9 mos 3.9 mos 0.05
1-3 mets & RPA Class 1 11.6 mos 9.6 mos 0.05
Sperduto, ASTRO 2002
RTOG 9508: Subset Analysis

JRSROG 99-1 Phase III SRS +/- WBRT • 132 patients with 1-4 brain metastases < 3 cm
• WB (3 Gy x 10) + SRS vs. SRS alone
– SRS dose for lesions <2 cm: • 22-25 Gy vs. 15.4-17.5 Gy*
– SRS dose for lesions 2-3 cm:
• 18-20 Gy vs. 12.6-14 Gy*
• MRI every 3 months after treatment
Aoyama et al. JAMA 2006,295:2483-91
*30% dose reduction in RS dose if WBRT used

RESULTS: JROSG 99-1 SRS +/- WBRT
Local Tumor Control
Aoyama et al. JAMA 2006,295:2483-91
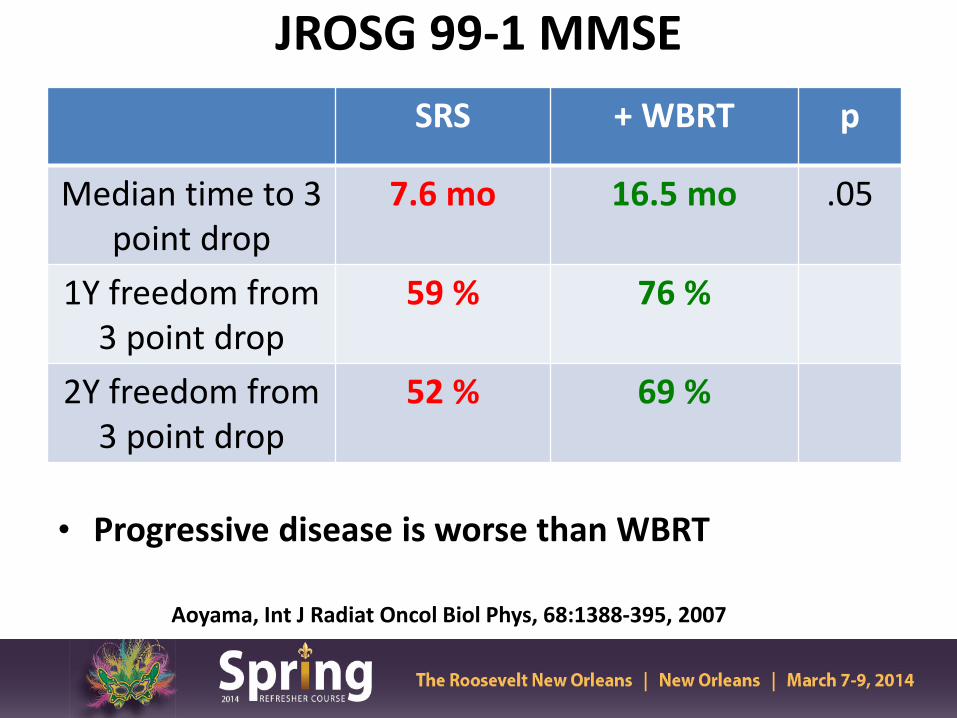
JROSG 99-1 MMSE
• Progressive disease is worse than WBRT
Aoyama, Int J Radiat Oncol Biol Phys, 68:1388-395, 2007
SRS + WBRT p
Median time to 3 point drop
7.6 mo 16.5 mo .05
1Y freedom from 3 point drop
59 % 76 %
2Y freedom from 3 point drop
52 % 69 %

MD Anderson Randomized Trial Schema
RANDOMIZE
SRS alone
(30 pts)
• RPA class I vs. II
• 1 or 2 vs. 3 Brain Mets
• Melanoma / Renal cell carcinoma vs. Other
STRATIFY
SRS + WBRT
(28 pts)
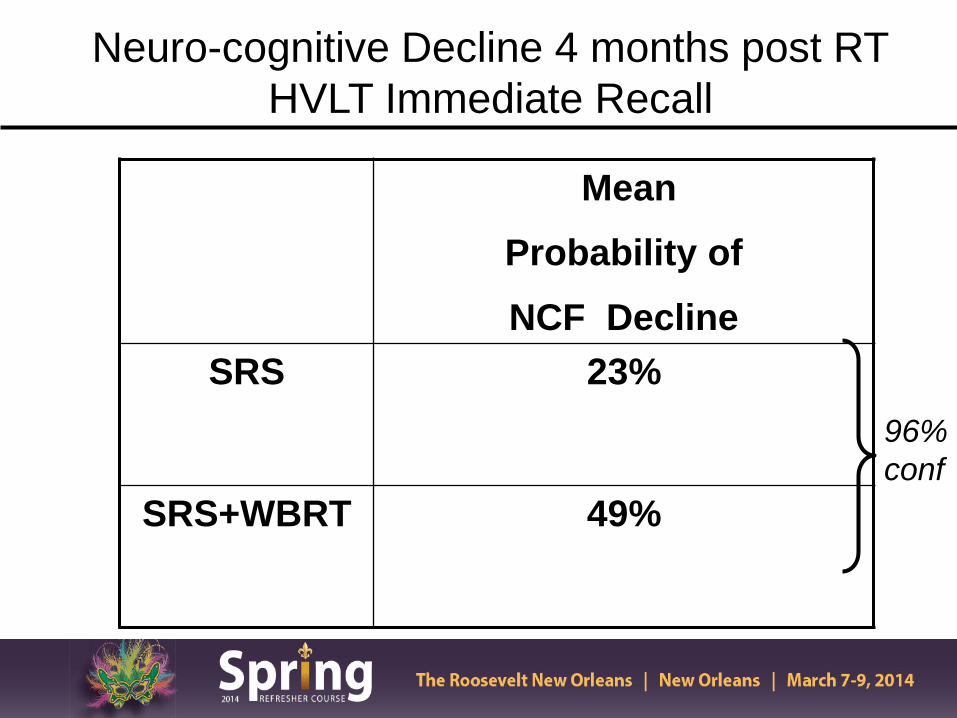
Mean Probability of NCF Decline
SRS 23%
SRS+WBRT 49%
Neuro-cognitive Decline 4 months post RT HVLT Immediate Recall
96% conf

Results: Freedom From Local Progression
Chang et al, Lancet 10(11):1037-44, 2009
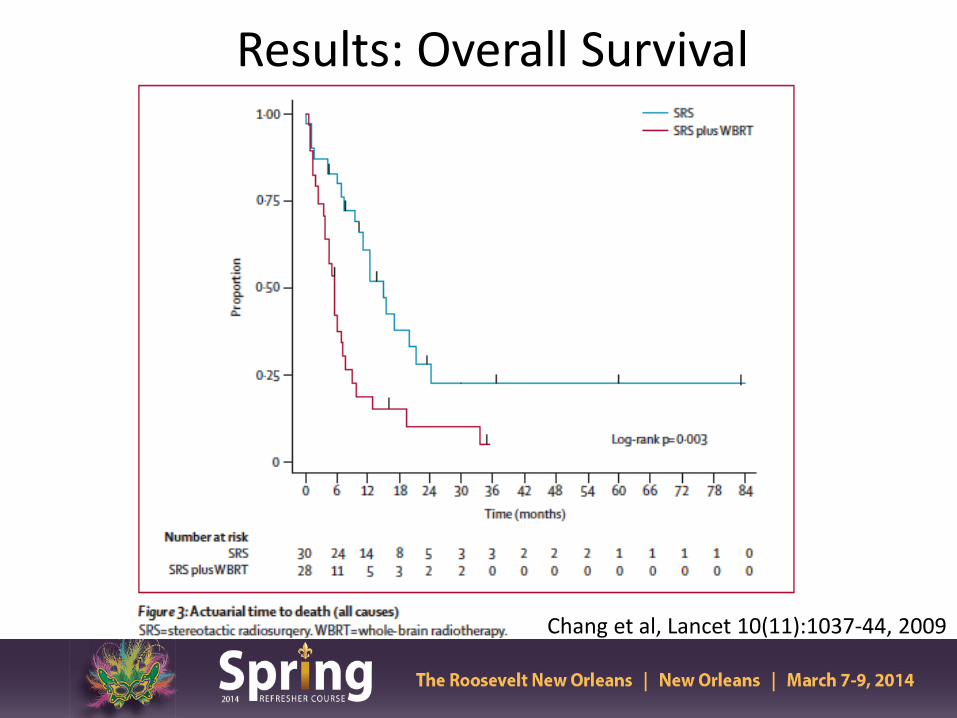
Results: Overall Survival
Chang et al, Lancet 10(11):1037-44, 2009

Summary
• Small study with a single time point assessed
• Impact of disease progression on HVLT was not assessed
• Unexplained survival differences due to imbalanced arms

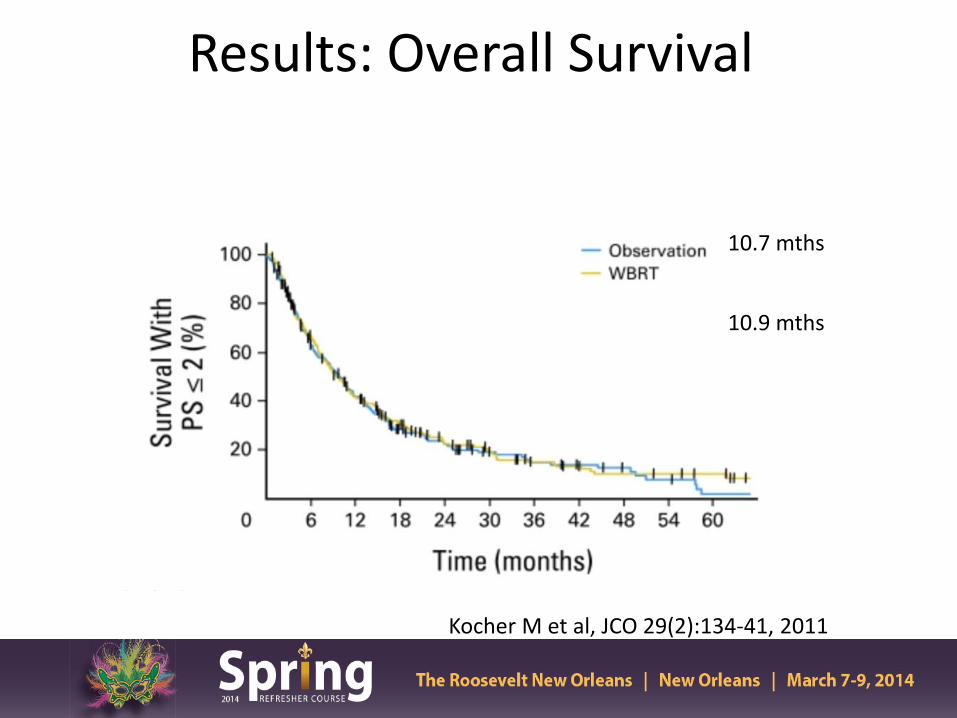
Results: Overall Survival
Kocher M et al, JCO 29(2):134-41, 2011
10.7 mths
10.9 mths

Rate of Intracranial Progression is Higher in Observation arm
Kocher M et al, JCO 29(2):134-41, 2011

Summary: HRQOL Results No difference in Global HRQOL between WBRT or Observation except at 9 mths
Soffietti R et al, JCO 31(1):65-72, 2013

Summary
• No difference in OS or maintenance of performance status between WBRT or Observation (OBS)
• Improved CNS control at both initial and distant sites with the addition of WBRT
• Adjuvant WBRT substantially reduced the risk of local recurrence following resection of a solitary met
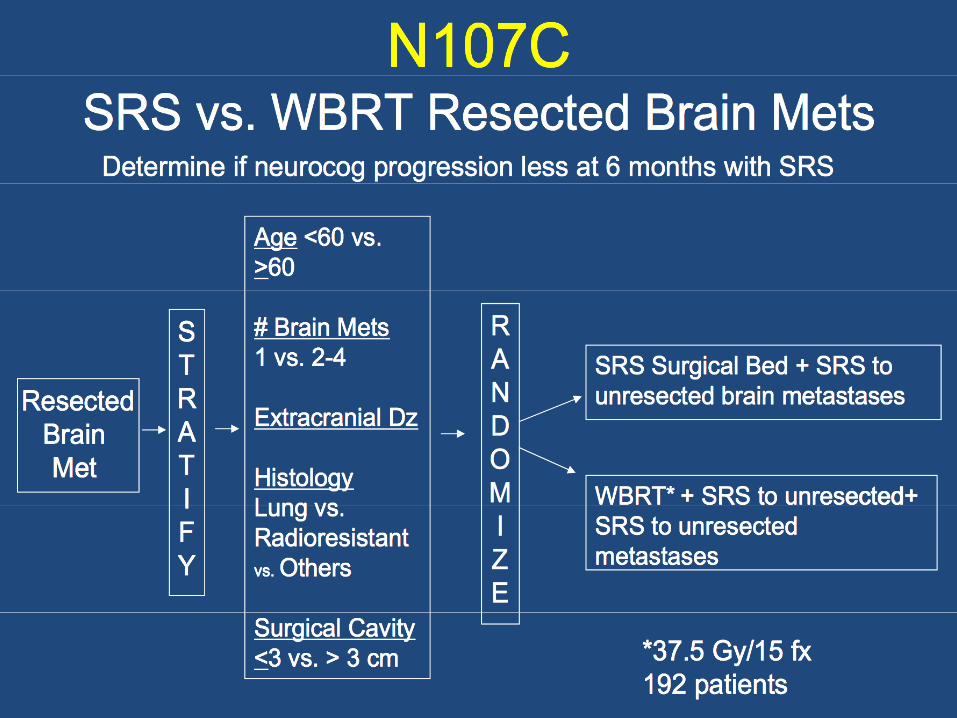

SRS Dosing Post-Resection Cavity
PI: Paul Brown, MD Anderson Cancer Center

Stereotactic Radiosurgery +/- WBRT
• No clear winner or standard of care
• If only focal treatment provided (surgery or SRS) careful imaging follow up is required
• Outcomes may be best with focal treatment in a single lesion
• Clinical trial enrollment is needed to obtain high quality neuro-cognitive data to select therapy

Potential strategies to minimize risk of neuro-cognitive decline with WB RT
Coronal
Axial
Learning & Memory Short Term memory
• Memantine (RTOG 0614) • Hippocampal Sparing
(RTOG 0933)
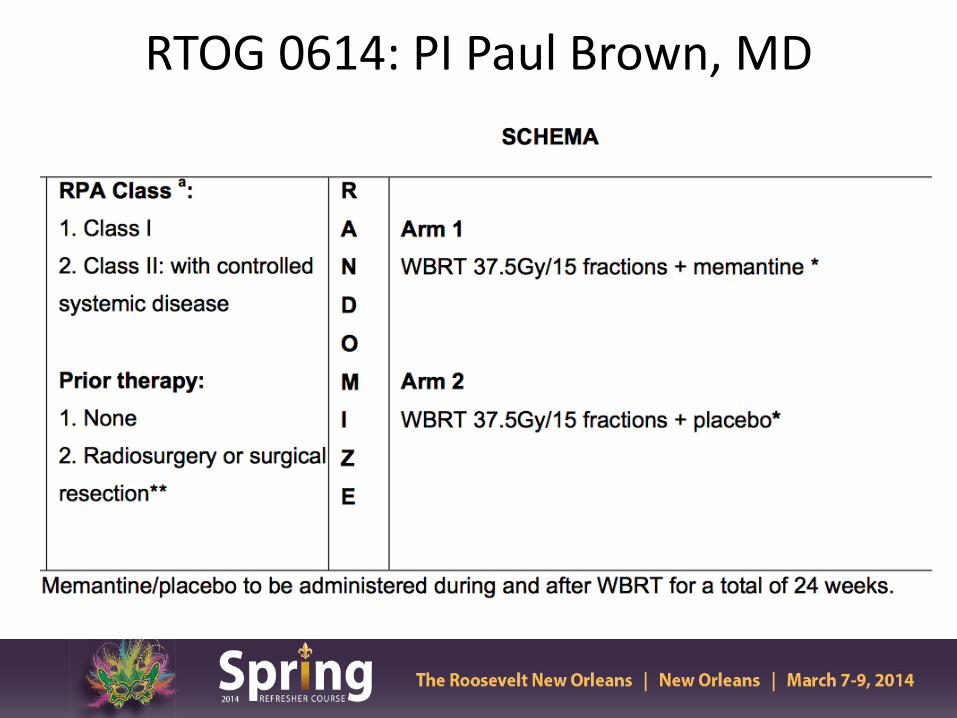
RTOG 0614: PI Paul Brown, MD

Results • Memantine was well tolerated (similar SE to placebo)
• Less decline in HVLT-delayed recall (DR) at 24 wks in
the memantine arm (p=0.059, primary endpoint )
• Not statistically significant with only 149/508 pts analyzable at 24 wks resulting in 35% statistical power
• Memantine appears to delay time to cognitive decline compared to placebo

Results
Brown P et al, Neuro-Oncology 16(3), 2013
Conclusions • No statistically significant difference noted in HVLT-DR
at 24 wks between Memantine vs. placebo
• Overall, memantine is well-tolerated and delayed time to cognitive decline and reduced rates of decline in memory, executive function and processing speed
• Next NRG Trial will compare the role of WBRT and Memantine +/- hippocampal sparing RT in reducing long-term neuro-cognitive effects

Hippocampal Sparing Whole Brain IMRT
Gondi V, Int J Radiat Biol Phys 2010
RTOG 0933 (PI: Minesh/Gondi)
• Phase II study of Hippocampal Sparing WB RT
• Primary endpoint: HLVT-delayed recall at 4 mths -Target sample size: 102 patients -51 analyzable patients to detect mean relative HLVT-delayed recall decline ≤15%

Results/Conclusion • Median overall survival of 6.8 mths
• Conformal avoidance of the hippocampus during
WBRT – Is associated with memory and quality of life preservation
up to 6 months of f/u – Can be safely administered with 4.5% risk of relapse in the
hippocampal avoidance region (3 pts)
• Phase II results are promising but warrant further validation in a phase III trial Gondi V, ASTRO Plenary Session 2013

Advances in Treatment for Malignant Gliomas
• GBM
• Anaplastic oligodendroglioma/oligoastrocytomas
• Low Grade Gliomas

What is the Appropriate Clinical Trial Endpoint in Glioblastoma?
• Overall Survival – the gold standard
• Treatment response (Physician measured) – Radiographic response based on contrast enhanced MRI
• Clinical Improvement (Patient measured)
– Quality of Life – Neurocognitive function – Symptom Burden
Presented by:


Phase III trial of concomitant temozolomide and RT
Stupp et al; NEJM 2005

MGMT Status Correlates with OS Hegi et al, NEJM 2005

Long-term F/U confirms Combined Therapy Improves Survival
Mirimanoff, Lancet Oncology 10(5): 459-66, 2009

Who Benefits Most From Combined Therapy?
• MGMT Methylated Tumors
• RPA Class III/IV
• Age < 60
• Regardless of Type of Resection

Current Standard of Care-GBM
• Maximal safe surgical resection • Partial brain RT 60 Gy with concomitant and
adjuvant temozolomide
• No standard of care therapy at recurrence

Clinical Target Volume
• GTV plus area of microscopic disease
• MR FLAIR imaging (include edema if present) with margin (2.0 cm)
MR FLAIR

Standard Radiation 60 Gy
• PTV1= GTV + edema + 2 cm margin
PTV1= 46 Gy in 23 fx
• PTV2= GTV+ 2.5 cm margin
PTV2= 14 Gy in 7 fx
46 Gy
14 Gy
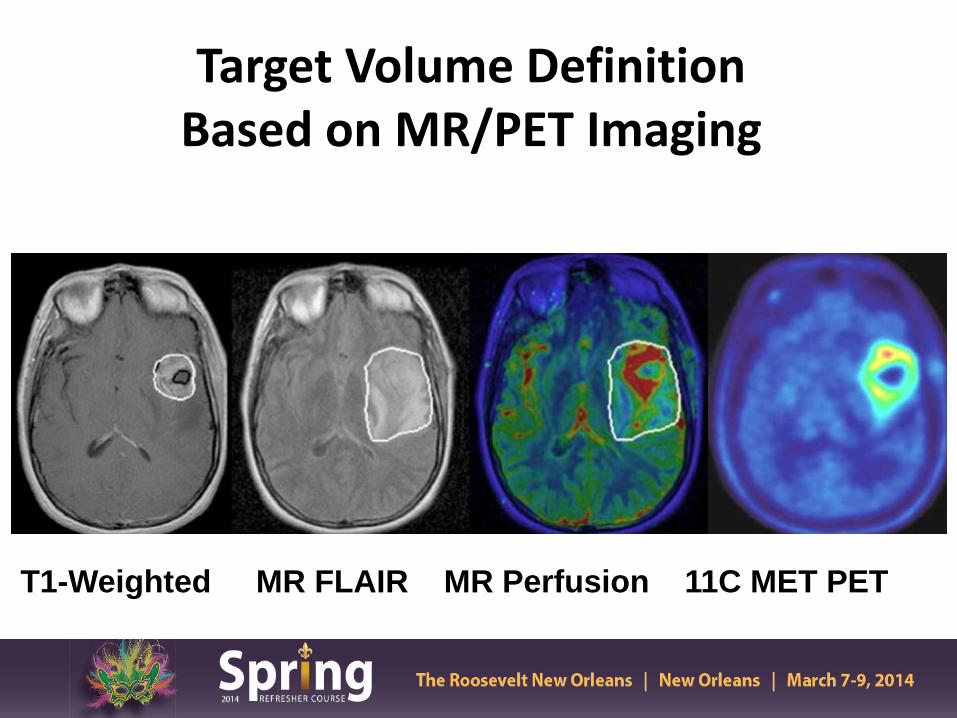
Target Volume Definition Based on MR/PET Imaging
T1-Weighted MR FLAIR MR Perfusion 11C MET PET

NRG Br-1 Trial Schema
Tsien C et al, Clin Cancer Res 18(1):273-9, 2012
Molecular Biomarkers in Glioma
• MGMT Promoter Methylation
• 1p19q
• IDH Mutations
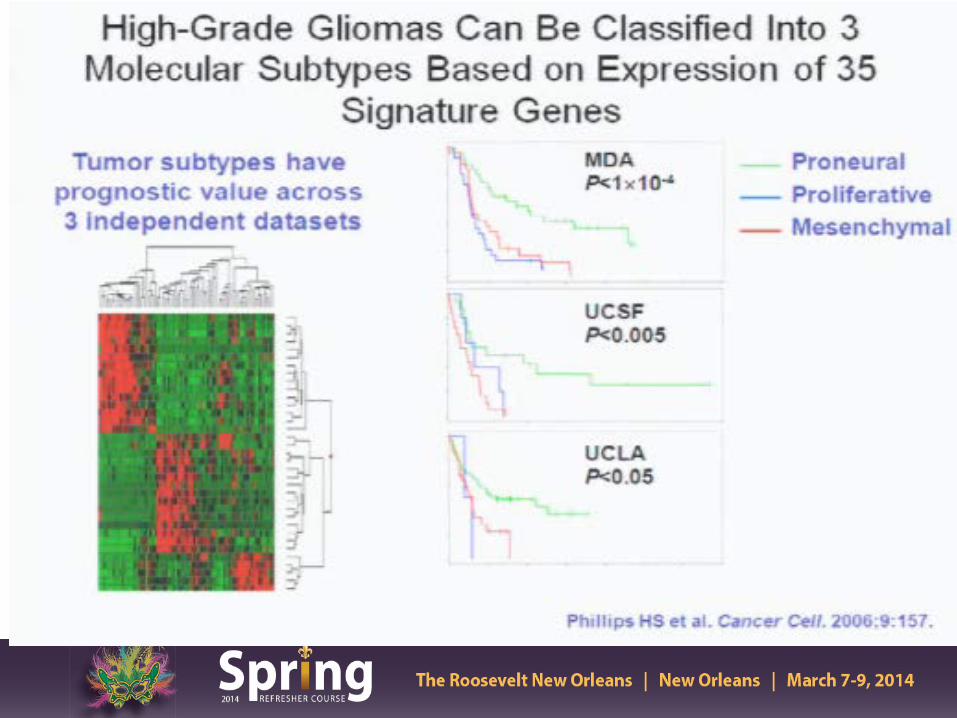
• Genomic subtypes (Proneural etc)

IDH Mutations Associated Pathogenesis of Malignant Gliomas
Smeitink J, NEJM 2010

Low Frequency of IDH Mutations in Primary GBM
Yan et al, NEJM 360:765-73,2009

IDH1 Mutations Associated with Gliomas of Better Prognosis
Yan et al, NEJM 360:765-73,2009

Summary
• Novel molecular biomarkers in glioma require further validation
• Identify subgroup of patients with different outcome and approach to treatment

Promise of Anti-Angiogenic Therapy in GBM
VEGF expression on tumor cells
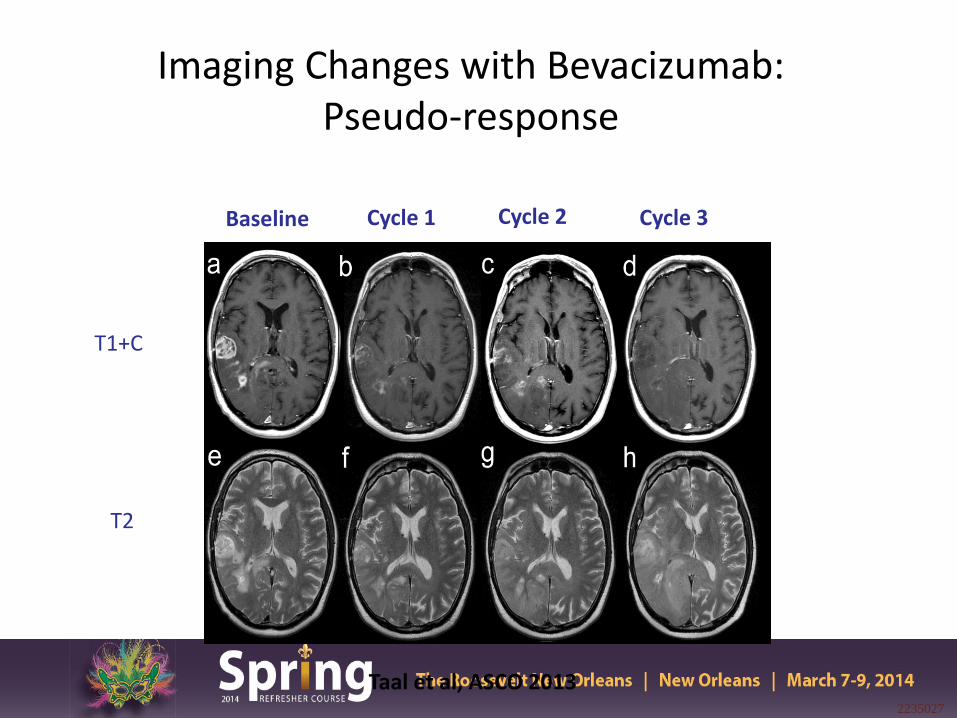
Imaging Changes with Bevacizumab: Pseudo-response
2235027
Baseline Cycle 1 Cycle 2
T1+C
T2
Taal et al, ASCO 2013
Cycle 3

Clinical Problem: Pseudoprogression
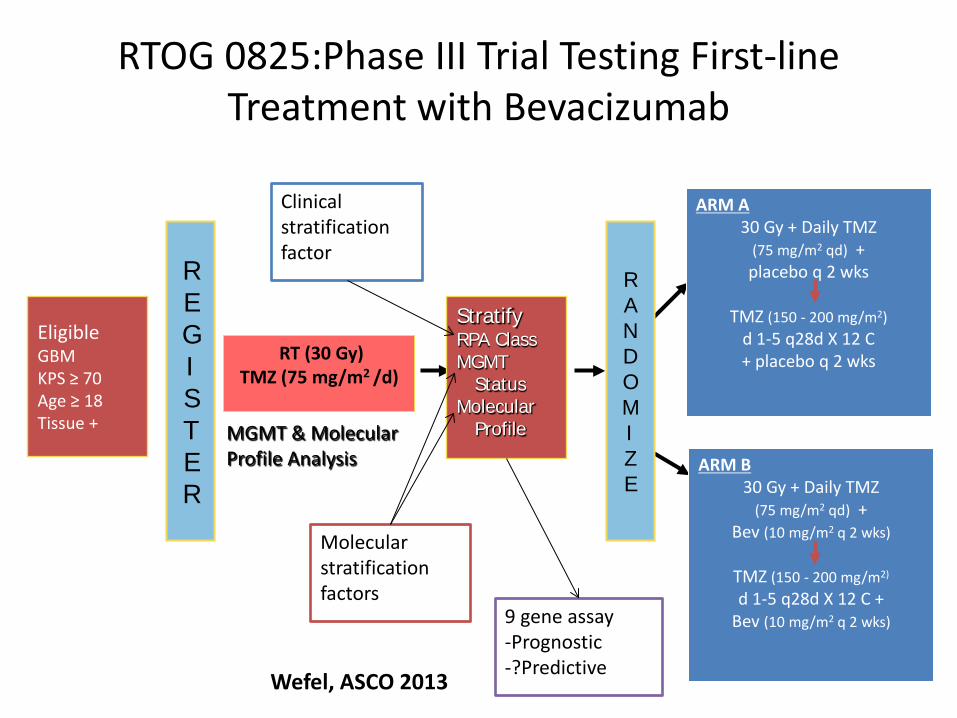
RTOG 0825:Phase III Trial Testing First-line Treatment with Bevacizumab
RT (30 Gy) TMZ (75 mg/m2 /d)
ARM A 30 Gy + Daily TMZ
(75 mg/m2 qd) + placebo q 2 wks
TMZ (150 - 200 mg/m2)
d 1-5 q28d X 12 C + placebo q 2 wks
ARM B 30 Gy + Daily TMZ
(75 mg/m2 qd) + Bev (10 mg/m2 q 2 wks)
TMZ (150 - 200 mg/m2) d 1-5 q28d X 12 C +
Bev (10 mg/m2 q 2 wks)
Eligible GBM KPS ≥ 70 Age ≥ 18 Tissue + MGMT & Molecular
Profile Analysis
R A N D O M I Z E
Stratify RPA Class MGMT
Status Molecular
Profile
R E G I S T E R
Molecular stratification factors
Clinical stratification factor
9 gene assay -Prognostic -?Predictive
Wefel, ASCO 2013

RTOG 0825
• Primary Endpoints: – Overall Survival – Progression Free Survival
• Secondary Endpoints
– Outcomes by Tumor Molecular Profile – Toxicity
• Tertiary Endpoints
– Patient Reported Outcomes: Symptoms and QOL – Neurocognitive Function

RTOG 0825- Did not meet pre-defined criteria for PFS
Gilbert M et al, NEJM 370(8): 699-708, 2014

RTOG 0825: No difference in OS
Gilbert M et al, NEJM 370(8): 699-708, 2014

No OS Benefit for BEV in any Subset
BEV PLACEBO
Gilbert M et al, NEJM 370(8): 699-708, 2014

Results • Over time, an increased symptom burden, a worse quality of life and a decline in neurocognitive function was more frequent in the bevacizumab arm
Wefel, ASCO 2013
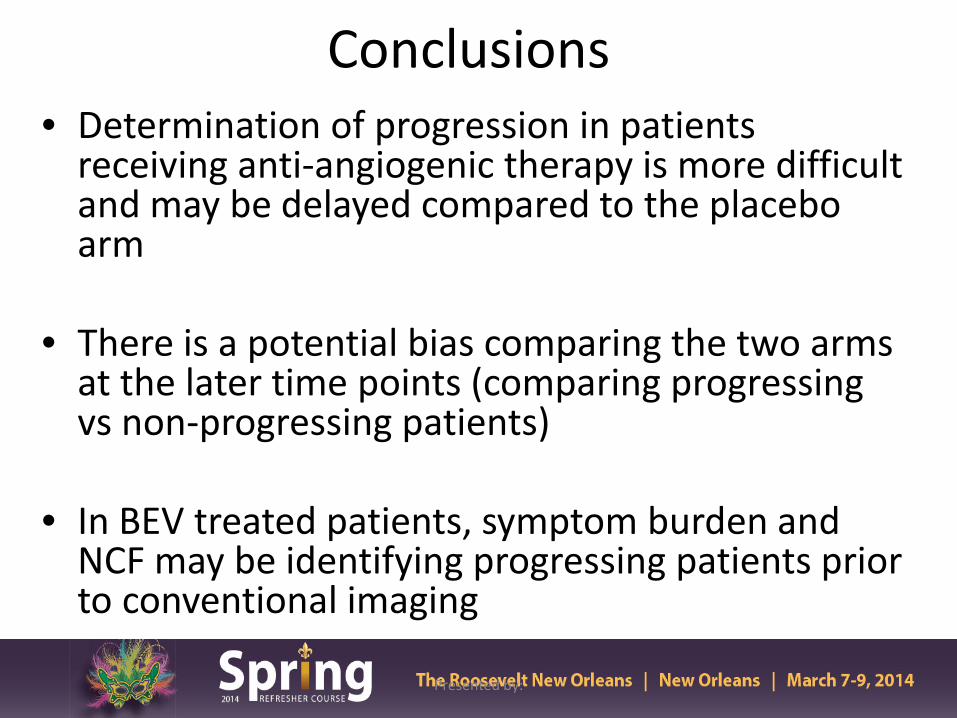
Conclusions • Determination of progression in patients
receiving anti-angiogenic therapy is more difficult and may be delayed compared to the placebo arm
• There is a potential bias comparing the two arms at the later time points (comparing progressing vs non-progressing patients)
• In BEV treated patients, symptom burden and NCF may be identifying progressing patients prior to conventional imaging
Presented by:

AVAglio Study Design
n=463
n=458
Randomization N=921
Stratification • RPA class • Region
Treatment start 4–7 weeks post-surgery
RT 2Gy; 5 days/week
TMZ 75mg/m² qd
Placebo q2w
TMZ 150–200mg/m² qd days 1–5 q28d
Placebo q2w
RT 2Gy; 5 days/week
TMZ 75mg/m² qd
BEV 10mg/kg q2w
TMZ 150–200mg/m² qd days 1–5 q28d
BEV 10mg/kg q2w
BEV 15mg/kg q3w
Placebo q3w
Debulking surgery or biopsy
Concurrent phase 6 weeks
Tx break 4 weeks
Maintenance phase 6 cycles
Monotherapy phase until PD
Wick W, ASCO 2013

AVAGlio Trial: Investigator-Assessed PFS (Co-Primary Endpoint)
Stratified HR: 0.64 (95% CI: 0.55–0.74) p<0.0001 (log-rank test)
10.6 mo
RT/TMZ/Plb (n=463) RT/TMZ/BEV (n=458)
Prob
abili
ty o
f PFS
Months N at risk RT/TMZ/Plb RT/TMZ/BEV
463 458
349 424
247 366
170 278
110 189
77 104
47 71
23 25
8 13
4 2
0 1
0 0
0 0
0.0 0.1 0.2 0.3 0.4 0.5 0.6 0.7 0.8 0.9 1.0
0 3 6 9 12 15 18 21 24 27 30 33 36
6.2 mo
Wick W, ASCO 2013
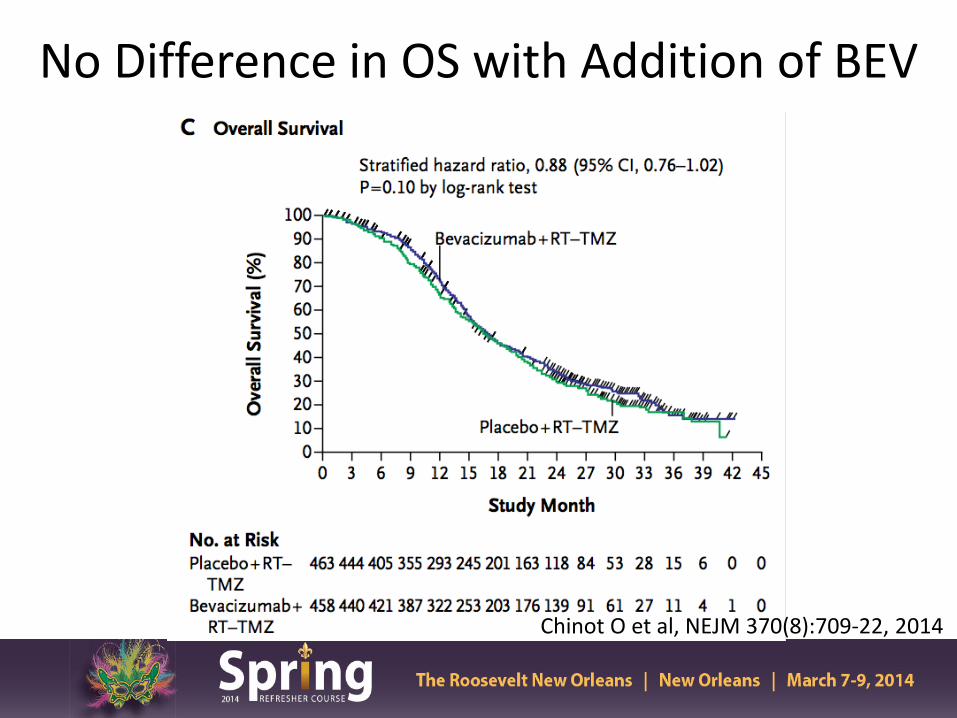
No Difference in OS with Addition of BEV
Chinot O et al, NEJM 370(8):709-22, 2014

“Deterioration Free Survival”: Motor Dysfunction
RT/TMZ/Plb (n=463) RT/TMZ/BEV (n=458)
Stratified HR: 0.67 (95% CI: 0.58–0.78) p<0.0001 (log-rank test)
Prop
ortio
n w
ithou
t de
finiti
ve d
eter
iora
tion
1.0
0.8
0.6
0.4
0.2
0 0 3 6 9 12 15 18 21 24 27 30 33
Months
5.0 mo
8.6 mo
N at risk RT/TMZ/Plb 463 281 184 121 77 54 34 14 5 2 0 0 RT/TMZ/BEV 458 349 279 204 125 63 45 18 8 2 1 0
N at risk RT/TMZ/Plb 463 284 176 111 76 55 34 14 5 2 0 0 0 RT/TMZ/BEV 458 328 271 189 124 61 43 17 8 2 1 0 0
Stratified HR: 0.87 (95% CI: 0.68–1.11) p=0.2747 (log-rank test)
Prop
ortio
n w
ithou
t de
finiti
ve d
eter
iora
tion
0.8
0.6
0.4
0.2
0 0 3 6 9 12 15 18 21 24 27 30 33 36
Months
31.6 mo
1.0
A. Including PD B. Excluding PD
RT/TMZ/Plb Median not reached
Wick W, ASCO 2013

Deterioration-free Survival in KPS Score
Chinot O et al, NEJM 370(8):709-22, 2014

Conclusions
• In the Avaglio trial, the addition of Bevacizumab showed an improvement in PFS but did not show an improvement in OS
• Gr 3 or higher adverse events was more frequent in
the Bevacizumab than placebo arm respectively (67% vs 51%)
• Decreased need for steroid use, baseline HRQOL and KPS were maintained longer in the bevacizumab arm
Presented by:

Summary • There is no overall survival benefit in the upfront
use of Bevacizumab in newly diagnosed GBM
• Further analysis is required to confirm a role for specific patient populations that may benefit from Bevacizumab (molecular profile, unresectable patients, etc)
Presented by:

Howard Fine, ASCO Plenary 2013
Pseudo Progression
• Reported rates in 15-30% of pts treated with combined chemo-RT
• Higher rate in patients with methylated MGMT promoter (Brandes, JCO 2008)
• Critical to recognize due to its influences on treatment choices and therefore possibly prognosis
Pseudo-Progression
• Currently, there are no reliable methods for distinguishing pseudo-progression from disease progression exist.
• Advanced MR imaging can reveal early differences in vascular properties and tumor cellularity. MR perfusion showed significant changes in rCBV were predictive of progressive disease (p<0.01) Tsien, JCO 2010

RANO Response Criteria
Criterion CR PR SD PD
T1-Gd + None ≥ 50% ↓ < 50% ↓ - < 25% ↑ ≥ 25% ↑*
T2/FLAIR Stable or ↓ Stable or ↓ Stable or ↓ ↑*
New Lesion None None None Present*
Steroids None Stable or ↓ Stable or ↓ NA**
Clinical Status Stable or ↑ Stable or ↑ Stable or ↑ ↓*
Requirement for response
All all All Any*
Wen P et al, JCO 2010

Why is the outcome poor for older patients with GBM ?
• Is biology worse than younger patients?
• Is there a higher rate of morbidity and mortality associated with conventional therapy delivered in older patients?
• Are the majority of patients simply not considered for therapy?
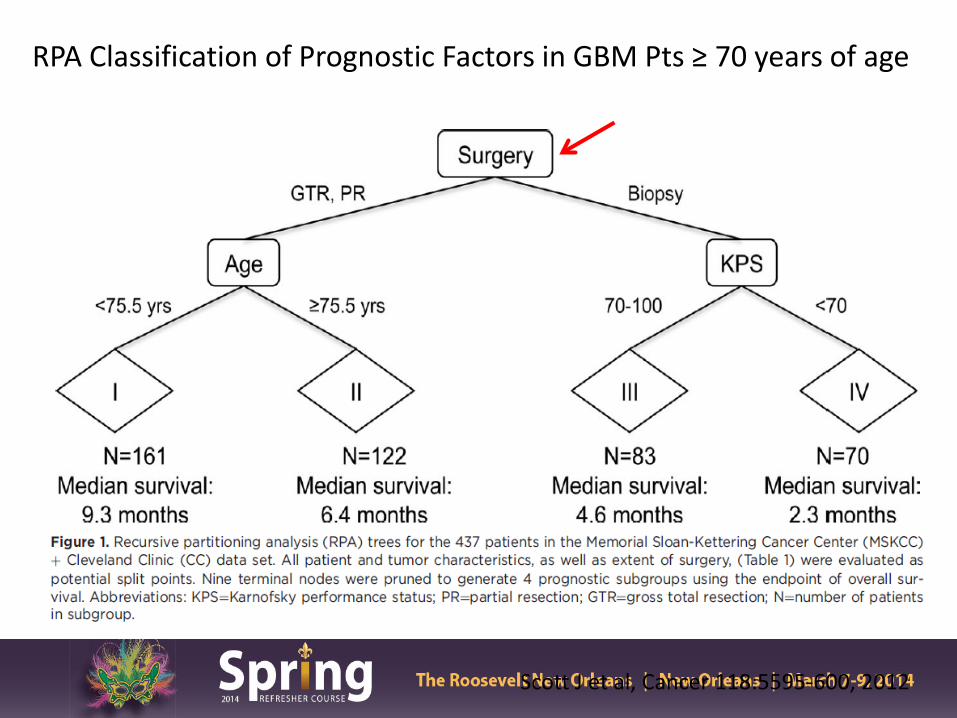
Scott J et al, Cancer 118:5595-600, 2012
RPA Classification of Prognostic Factors in GBM Pts ≥ 70 years of age

RT vs Best Supportive Care
Keime-Guibert et al, NEJM 356:1527-35, 2007 (France) *Trial discontinued early due to planned interim analysis

Hypofractionated vs Standard RT Course
Roa et al, JCO 22:1583-88, 2004, *KPS=70

Nordic Brain Tumor Study Grp
342 GBM pts ≥ 60 yrs of age phase III study A) 60 Gy in 30 fx RT (MS 6 mths) B) 34 Gy in 10 fx RT (7.5 mths) C) TMZ alone (8.3 mths)
Malmstrom A et al, Lancet Oncol 13(9):916-26, 2012
OS > 70 yrs OS for all pts

Health Related QOL analysis for 3 treatment groups
TMZ 60 Gy 34 Gy
Malmstrom A et al, Lancet Oncol 13(9):916-26, 2012

NOA-8 German Study 412 pts ≥ 65 yrs age GBM/AA prospective, randomized phase III multi-institutional study • A) dose dense TMZ alone (MS 8 mths) • B) 54- 60 Gy RT alone (MS 9.6 mths)
Wick W et al, Lancet Oncol 2012; 13: 707–15

OS in relation to MGMT promoter methylation status/treatment received
Wick W et al, Lancet Oncol 2012; 13: 707–15

Combined Chemo-RT
• Phase III EORTC/NCIC trial concurrent and adjuvant TMZ vs RT alone, 30% of patients were between 60-70 yrs of age – 2 yr OS benefit for chemo-RT 22% vs 6% RT arm
(Stupp R et al, Lancet Oncol 10(5):459-66,2009)
• Retrospective data chemo-RT improves median survival in favorable GBM grp in pts 65-70 and ≥ 71 yrs (Barker et al, J Neuro-onc 109:391-397,2012)
• EORTC-NCIC CTG Elderly GBM: Phase III randomized
study 40 Gy in 15 fractions alone or with concurrent and adjuvant TMZ

Summary
• In older GBM patients, combined Chemo-RT (Stupp regimen) has not been compared to a hypo-fractionated RT course with/without chemotherapy in regards to OS, HRQOL, and neuro-cognitive function
• Treatment should be recommended based on molecular predictive biomarkers and clinical factors
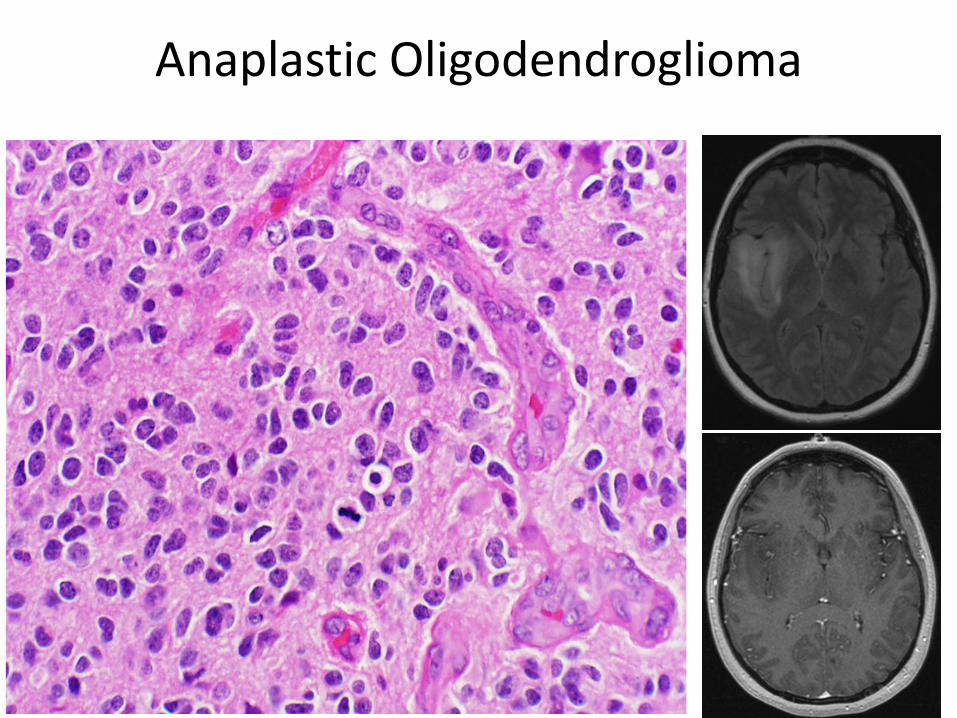
Anaplastic Oligodendroglioma

Molecular classification of anaplastic oligodendroglioma
• 1p/19q co-deletion is a biomarker of oligodendroglioma – Predictive and prognostic – Somatic mutations in CIC gene on 19q and FUBP1 gene
[encoding far-upstream element (FUSE) binding protein] on 1p contribute to AO pathophysiology
• CIC mutations seen in 69% of 1p19q co-deleted tumors in one study
• 1p19q often associated with IDH1 mutation and MGMT promoter methylation – Favorable overall molecular phenotype – 1p19q is the only one validated for
treatment decisions
Presented by:
Bettegowda et al, Science, 2011 Capper et al, Acta Neuropathol, 2011 Van den Bent, Clin Cancer Res, 2011 Mulholland, Int J Cancer, 2012 Yip et al, J Pathol, 2012

Anaplastic Oligodendroglioma

• 1p/19q co-deletion detected in 44% (PCV+RT) and 52% (RT)
Cairncross G. JCO 2013, 31:337
PCV+RT did not significantly increase survival compared to RT in all patients

• Median OS
– 14.7y (PCV+RT) – 7.3y (RT)
• PFS
– 8.4y (PCV+RT) – 2.9y (RT)
Cairncross G. JCO 2013, 31:337
PCV+RT improved survival in 1p/19q deleted patients only

IDH Mutational Status Identifies AO Patients that benefit from PCV Chemotherapy with RT
IDH Mutated and 1P/19Q Co-Deleted IDH Mutated and 1P/19Q Non Co-Deleted
Cairncross J G et al. JCO 2014;32:783-790


van den Bent M. JCO 2013, 31:344
• Improved OS in RT/PCV arm: 42 vs 30 mo (p=0.018)
•Improved PFS in RT/PCV arm: 24 vs 13 mo (p=0.003)
•Only 30% pts in the RT/PCV arm received 6 cycles (median 3 cycles delivered)
RT/PCV improved survival in all pts
van den Bent M. JCO 2013, 31:344

van den Bent M. JCO 2013, 31:344
• 1p/19q co-deletion seen in 25% of pts (n=80) with tissue available for analysis
Median Overall Survival RT/PCV RT
Co-deleted Not reached 112 mo
Non co-deleted 25 mo 21 mo
Median PFS RT/PCV RT
Co-deleted 157 mo 50 mo
Non co-deleted 15 mo 9 mo
Improved OS benefit of RT/PCV appears greater for pts with 1p/19q deletion
van den Bent M. JCO 2013, 31:344

van den Bent M. JCO 2013, 31:344
IDH and MGMT methylation prognostic for improved overall survival

Other approaches for newly diagnosed AO • Retrospective data: 1013 patients diagnosed from
1981-2007 – Before 1990 – RT alone – After 1990 50% chemo – 2005-2007 38% chemo alone in 1p19q co-deleted patients
• TMZ 87% and PCV 2% trend starting in 2000 – Overall TTP outcome:
• RT + chemo: 7.2 years • Chemo alone: 3.9 years
– PCV appeared better than TMZ • RT alone: 2.5 years
• Question 1: Is Stupp/EORTC regimen as good for AO with 1p19q co-del as RT/PCV?
• Question 2: what is the best course for non-deleted AO?
Presented by:
Panageus et al, NeuroOncol 2012 Lassman et al , 2011

Ongoing clinical studies for AOA and AO • Concurrent and/or Adjuvant Temozolomide for 1p19q non-
deleted tumors (CATNON) – 4 treatment arms:
• RT alone • RT concurrent TMZ • RT adjuvant TMZ • Stupp regimen
• CODEL
– For patients with 1p19q co-deletion – Randomized to:
• RT + PCV • RT + concomitant and adjuvant TMZ • TMZ alone (exploratory)

Conclusions

Low Grade Gliomas
• 2,000-3000 cases diagnosed yearly in the US
• Heterogeneous group of neoplasms usually occur in younger patients
• WHO Gr 2 astrocytomas, oligodendroglioma and oligoastroctyomas

Unfavorable Prognostic Factors in LGG
• Age ≥ 40
• Largest diameter ≥ 6 cm
• Tumor crossing midline
• Astrocytoma dominant histology
• Neurologic deficit
Pignatti F JCO 2002, 20:2076

Role of Resection for Low Grade Gliomas
• Provides more accurate diagnosis
• Improves neurological status and quality of life
• Gross total resection extends survival
Presented by:
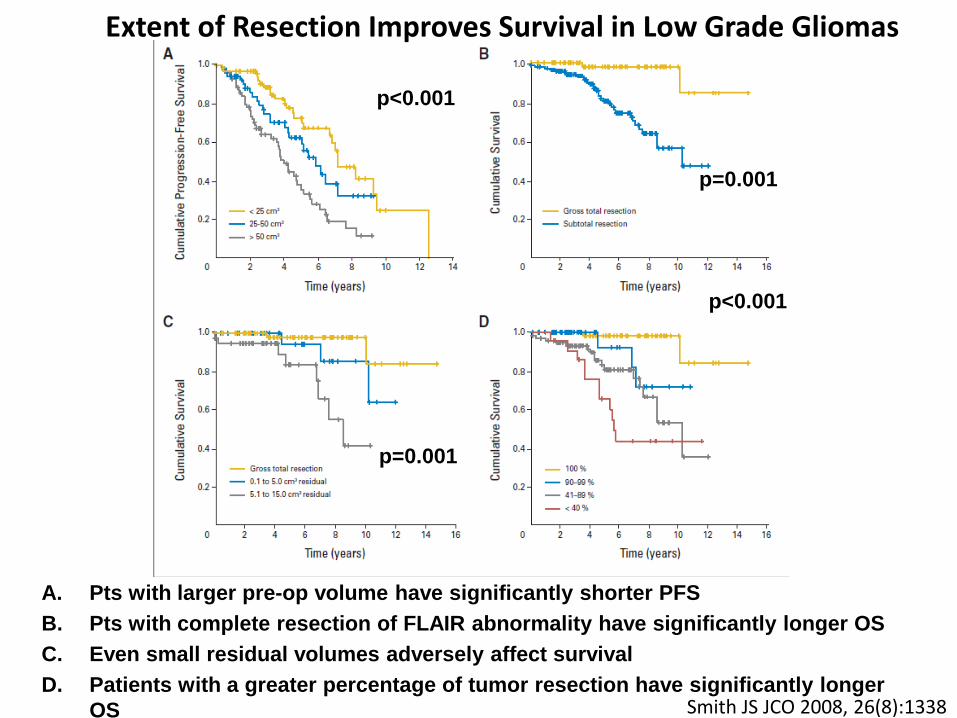
A. Pts with larger pre-op volume have significantly shorter PFS B. Pts with complete resection of FLAIR abnormality have significantly longer OS C. Even small residual volumes adversely affect survival D. Patients with a greater percentage of tumor resection have significantly longer
OS Smith JS JCO 2008, 26(8):1338
p<0.001
p<0.001
p=0.001
p=0.001
Extent of Resection Improves Survival in Low Grade Gliomas

EORTC 22845- “Non-Believer’s Trial”
Karim et al, IJROBP 36: 549, 1996

Wait and see Early RT Median PFS 3.4 years 5.3 years 5yr PFS 35% 55%
van den Bent MJ Lancet 2005, 366:985
Early RT improves PFS
van den Bent MJ Lancet 2005, 366:985
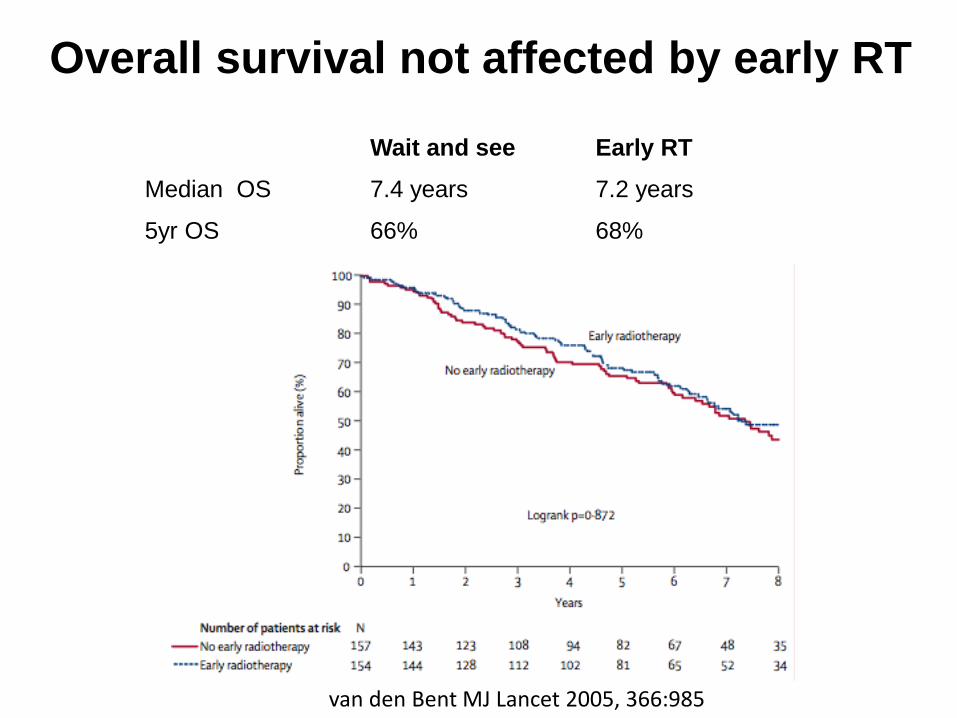
Wait and see Early RT Median OS 7.4 years 7.2 years
5yr OS 66% 68%
van den Bent MJ Lancet 2005, 366:985
Same OS and PFS results when only WHO grade II tumors analyzed
Overall survival not affected by early RT
van den Bent MJ Lancet 2005, 366:985
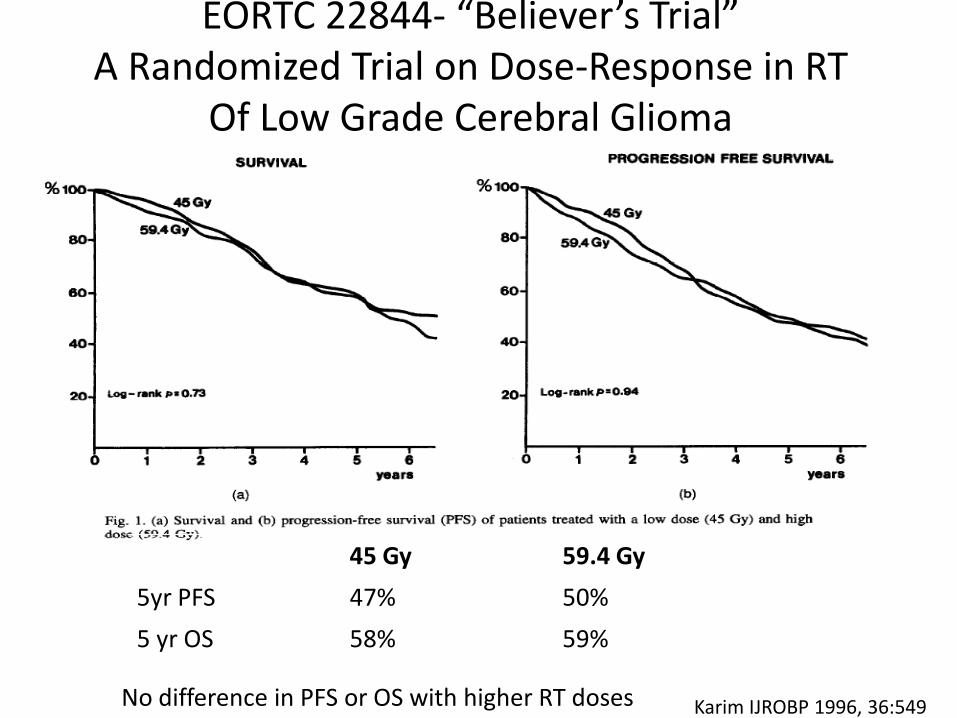
45 Gy 59.4 Gy 5yr PFS 47% 50% 5 yr OS 58% 59%
No difference in PFS or OS with higher RT doses Karim IJROBP 1996, 36:549
EORTC 22844- “Believer’s Trial” A Randomized Trial on Dose-Response in RT
Of Low Grade Cerebral Glioma
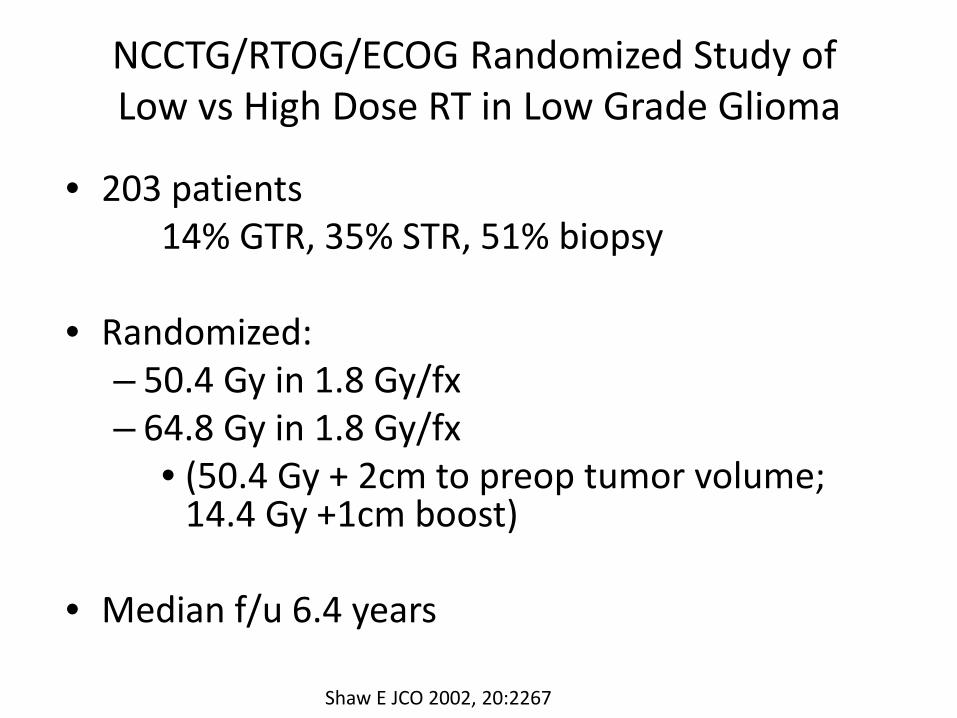
• 203 patients 14% GTR, 35% STR, 51% biopsy
• Randomized:
– 50.4 Gy in 1.8 Gy/fx – 64.8 Gy in 1.8 Gy/fx
• (50.4 Gy + 2cm to preop tumor volume; 14.4 Gy +1cm boost)
• Median f/u 6.4 years
Shaw E JCO 2002, 20:2267
NCCTG/RTOG/ECOG Randomized Study of Low vs High Dose RT in Low Grade Glioma

• 5 yr OS was similar – 72% in the 50.4 Gy arm – 64% in the 64.8 Gy arm (p = 0.48)
Shaw E JCO 2002, 20:2267
No survival benefit with higher RT doses
Shaw E JCO 2002, 20:2267
• 5 yr actuarial incidence of radionecrosis
2% in the 50.4 Gy arm 10% in the 64.8 Gy arm
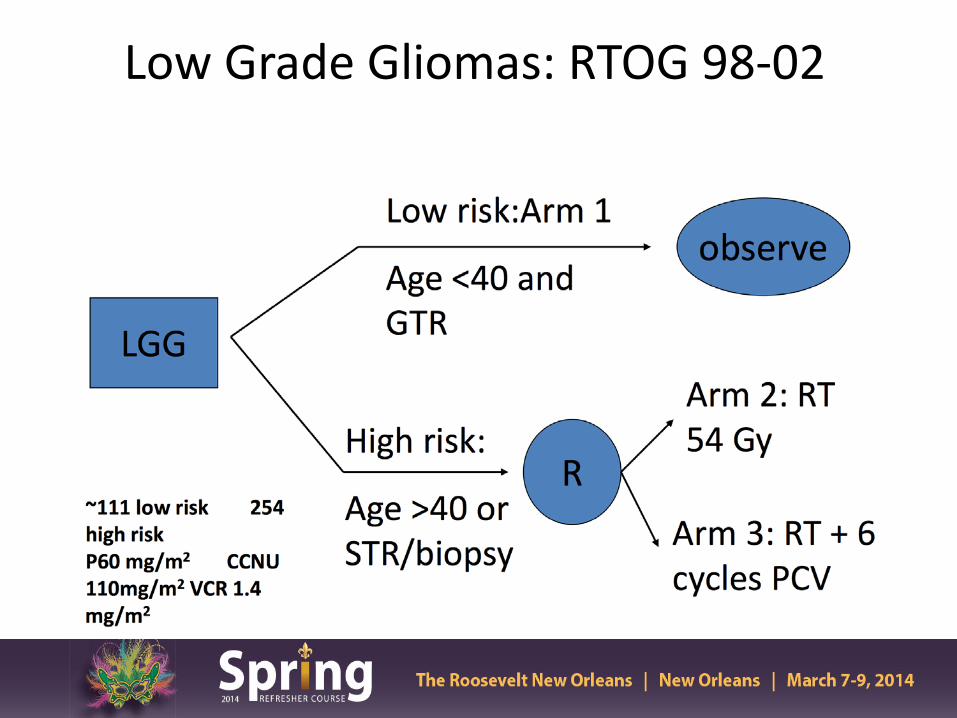
Low Grade Gliomas: RTOG 98-02

93%
66%
48%
50%
• Significantly lower OS in high risk group
• PFS is ~50% at 5 yrs, regardless of GTR estimate or age Shaw EG. J Neurosurgery 2008, 109(5):835-41
OS and PFS in Low and High Risk Low Grade Glioma Pts

PFS p=0.005 OS p=0.13
• PFS but not OS was improved with RT + PCV • Significantly higher incidence of grade 3 and 4 hematologic toxicity
with RT + PCV (66% vs 11%)
• )
Shaw EG. JCO 2012, 25:3065
Improvement in PFS but not overall Survival
RTOG 98-02 NCI Press Release
• With median f/u of 12 yrs, there was a significant improvement in OS for patients receiving RT+ PCV (13.3 yrs) vs RT alone (7.8 yrs)
• New standard of care for treatment of LGG
• Molecular subset analyses is still on-going

ECOG/Intergroup Phase III trial E3F05 of RT ± TMZ

EORTC 22033-26033: Study Schema
EORTC ROG and BTG, NCI-CTG, TROG, MRC-CTU
Stratification: 1p mutation, contrast on MRI, age and PS, institute, contrast enhancement MRI, age: <40 vs ≥ 40 yrs, WHO PS 0 /1 versus 2
Registration
Radiotherapy (standard arm): 50.4 Gy (28 x 1.8 Gy)
conformal techniques
Random Genetic testing
TMZ (experimental arm): 75 mg/m2 daily x 21 days,
q 28 days until progression or for max. 12 cycles
Initial results do not show a difference in PFS in TMZ arm compared to RT 1p deletion was confirmed to be a positive prognostic factor in both groups

Results • Initial results do not show a difference in PFS in
TMZ arm compared to RT but follow-up is short
• 1p deletion was confirmed to be a positive prognostic factor in both groups
• Further molecular analyses are on-going to determine which subgroup may benefit from TMZ alone
Conclusions • Recent press release suggest a new standard
of care for low grade glioma patients requiring radiation treatment; these patients may now be considered for adjuvant chemotherapy (PCV vs TMZ)

EORTC-NCIC 26021
– Postop MRI at 4-5 months confirming subtotal resection – <4 mitoses/10 HPF and MIB labeling index <4% – RS 12-15 Gy to tumor margin – EBRT 54 Gy in 30 fractions to tumor + 1.5-2.0 cm margin – Targeted sample size 478 patients
• Endpoints: Progression-Free Survival Also: Quality of Life, Survival, Incidence of Salvage Surgery,
Incidence of Acute and Long-term Neurotoxicity
Phase III Study of Adjuvant Radiotherapy or RS vs Observation Only in Patients with
Newly Diagnosed, Incompletely Resected, WHO Grade I Non-Orbital Meningioma


