52
Joel Primack University of California, Santa Cruz Astronomy 233 Winter 2009 Physical Cosmology Week 10 Simulations and Semi-Analytic Models
| Date post: | 20-Sep-2018 |
| Category: |
Documents |
| Upload: | nguyenthuan |
| View: | 214 times |
| Download: | 0 times |

Joel PrimackUniversity of California, Santa Cruz
Astronomy 233 Winter 2009
Physical Cosmology
Week 10Simulations and
Semi-Analytic Models

Cosmological Simulation MethodsDissipationless Simulations
Particle-Particle (PP) - Aarseth NbodyN, N=1,...,6Particle Mesh (PM) - see Klypin & Holtzman 1997Adaptive PM (P3M) - Efstathiou et al.Tree - Barnes & Hut 1986, PKDGRAV StadelTreePM - GADGET2, Springel 2005Adaptive Mesh Refinement (AMR) - Klypin (ART)
Hydrodynamical SimulationsFixed grid - Cen & OstrikerSmooth Particle Hydrodynamics (SPH) - GADGET2, Springel 2005 - Gasoline, Wadsley, Stadel, & QuinnAdaptive grid - ART+hydro - Klypin & KravtsovMoving Mesh - AREPO - Springel 2009
Initial ConditionsStandard: Gaussian P(k) realized uniformly, Zel’dovich displacementMultimass - put lower mass particles in a small part of sim volumeConstrained realization - small scale: simulate individual halos (NFW)
- large scale: simulate particular regionReviews
Bertschinger ARAA 1998, Klypin lectures 2002, Bagla 2004, U Washington website

Title: E pur si muove: Galiliean-invariant cosmological hydrodynamical simulations on a moving meshAuthors: Springel, VolkerPublication: eprint arXiv:0901.4107Keywords: Astrophysics - Cosmology and Extra-Galactic AstrophysicsComment: submitted to MNRAS, 66 pages, 50 figures, many of them heavily size-reduced. Full resolution version and videos available at http://www.mpa-garching.mpg.de/~volker/arepo
AbstractHydrodynamic cosmological simulations at present usually employ either the Lagrangian SPH technique, or Eulerian hydrodynamics on a Cartesian mesh with adaptive mesh refinement. Both of these methods have disadvantages that negatively impact their accuracy in certain situations. We here propose a novel scheme which largely eliminates these weaknesses. It is based on a moving unstructured mesh defined by the Voronoi tessellation of a set of discrete points. The mesh is used to solve the hyperbolic conservation laws of ideal hydrodynamics with a finite volume approach, based on a second-order unsplit Godunov scheme with an exact Riemann solver. The mesh-generating points can in principle be moved arbitrarily. If they are chosen to be stationary, the scheme is equivalent to an ordinary Eulerian method with second order accuracy. If they instead move with the velocity of the local flow, one obtains a Lagrangian formulation of hydrodynamics that does not suffer from the mesh distortion limitations inherent in other mesh-based Lagrangian schemes. In this mode, our new method is fully Galilean-invariant, unlike ordinary Eulerian codes, a property that is of significant importance for cosmological simulations. In addition, the new scheme can adjust its spatial resolution automatically and continuously, and hence inherits the principal advantage of SPH for simulations of cosmological structure growth. The high accuracy of Eulerian methods in the treatment of shocks is retained, while the treatment of contact discontinuities improves. We discuss how this approach is implemented in our new parallel code AREPO, both in 2D and 3D. We use a suite of test problems to examine the performance of the new code and argue that it provides an attractive and competitive alternative to current SPH and Eulerian techniques. (abridged)
Latest Code for Hydrodynamical Simulations

AREPOGas Disk Shearing

Navarro, Frenk, White1996 1997
Structure of Dark Matter Halos
NFW formula works for all models
Density
Velocity

2001 MNRAS 321, 559
Dependence of Halo Concentration on Mass and Redshift
Part of James Bullock’s dissertation research with Joel Primack

Concentration falls as mass increases
Concentration falls even faster for subhalos as
mass increases
Concentration rises as density increases

Spread of Halo Concentrations

Evolution of Halo Concentration with Redshift
Concentration falls as redshift increases
Cvir ∝ 1/(1+z)at fixed mass

Merger Trees Based on our ART simulations, Wechsler created the first structural merger trees tracing the merging history of thousands of halos with structural information on their higher-redshift progenitors, including their radial profiles and spins. This led to the discovery that a halo’s merging history can be characterized by a single parameter ac which describes the scale factor at which the halo’s mass accretion slows, and that this parameter correlates very well with the halo concentration, thus showing that the distribution of dark matter halo concentrations reflects mostly the distribution of their mass accretion rates. We found that the radius of the inner part of the halo, where the density profile is roughly 1/r, is established during the early, rapid-accretion phase of halo growth (a result subsequently confirmed and extended by other groups, e.g., Zhao et al. 2003, Reed et al. 2004).
RisaWechsler
2001
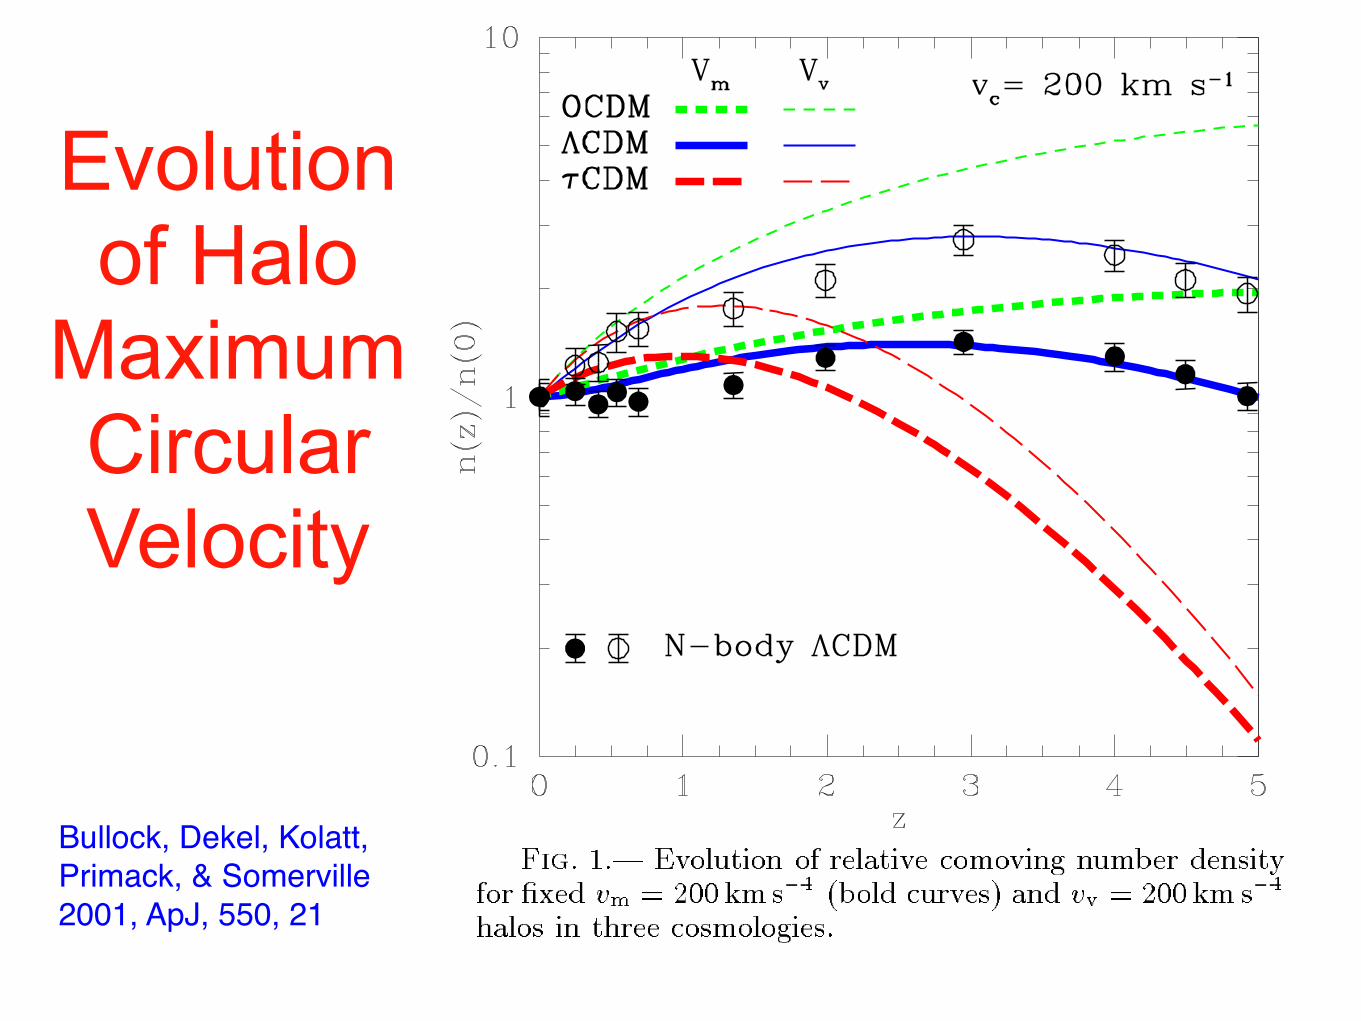
Evolution of Halo
Maximum Circular Velocity
Bullock, Dekel, Kolatt, Primack, & Somerville 2001, ApJ, 550, 21

<s> = short / long axis of dark halos vs. mass and redshift. Dark halos are more elongated the more massive they are and the earlier they form. We found that the halo <s> scales as a power-law in Mhalo/M*. Halo shape is also related to the Wechsler halo formation scale factor ac.
Allgood et al. 2006
Halo Shapes
z=0
z=2
z=1

Halos become more spherical at larger radius and smaller mass. As before, s = short / long axis. These predictions can be tested against cluster X-ray data and galaxy weak lensing data.
[These figures are from Brandon Allgood’s PhD dissertation.]
the radius at which the logarithmic slope of thedensity profile is equal to !2. This scale corre-sponds to rs for the NFW profile and " 0.35rs forthe Moore et al. profile.
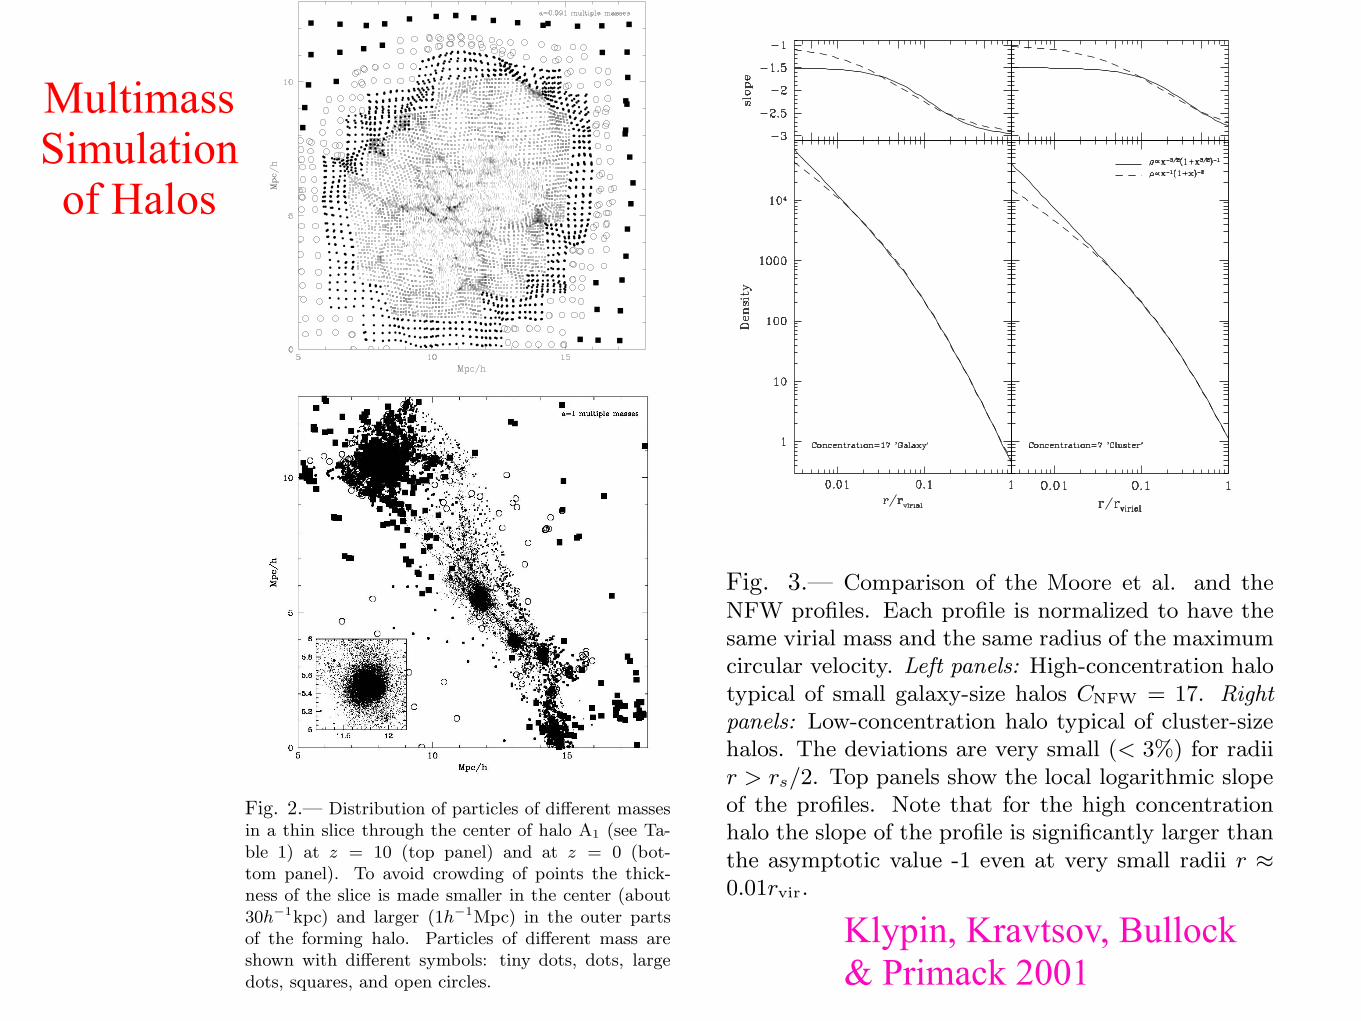
Figure 3 presents the comparison between theanalytic profiles normalized to have the same virialmass and the same radius rmax. We show resultsfor halos of low and high values of concentrationrepresentative of cluster- and low-mass galaxy ha-los, respectively. The bottom panels show the pro-files, while the top panels show the correspondinglogarithmic slope as a function of radius. The fig-ure shows that the two profiles are very similarthroughout the main body of the halos. Only inthe very central region do the di!erences becomesignificant. The di!erence is more apparent in thelogarithmic slope than in the actual density pro-files. Moreover, for galaxy-mass halos the di!er-ence sets in at a rather small radius ! 0.01rvir,which would correspond to scales < 1 kpc for thetypical dark matter dominated dwarf and LSBgalaxies. At the observationally interesting scalesthe di!erences between NFW and Moore et al.profiles are fairly small and the NFW profile pro-vides an accurate description of the halo densitydistribution.
Note also that for galaxy-size (e.g., high-concentration) halos the logarithmic slope of theNFW profile has not yet reached its asymptoticinner value of !1 even at scales as small as0.01rvir. At this distance the logarithmic slopeof the NFW profile is " !1.4 ! 1.5 for halos withmass # 1012h!1M". For cluster-size halos thisslope is " !1.2. This dependence of the slope at agiven fraction of the virial radius on the virial massof the halo is very similar to the results plottedin Figure 3 of Jing & Suto (2000). These authorsinterpreted it as evidence that halo profiles arenot universal. It is obvious, however, that theirresults are consistent with NFW profiles and thedependence of the slope on mass can be simply amanifestation of the well-studied cvir(M) relation.
The NFW and Moore et al. profiles can becompared in a di!erent way. We can approximatethe Moore et al. halo of a given concentration withthe NFW profile. Fractional deviations of the fitsdepend on the halo concentration and on the rangeof radii used for the fits. A low-concentration halohas larger deviations, but even for C = 7 case, thedeviations are less than 15% if we fit the halo at
Fig. 3.— Comparison of the Moore et al. and theNFW profiles. Each profile is normalized to have thesame virial mass and the same radius of the maximumcircular velocity. Left panels: High-concentration halotypical of small galaxy-size halos CNFW = 17. Right
panels: Low-concentration halo typical of cluster-sizehalos. The deviations are very small (< 3%) for radiir > rs/2. Top panels show the local logarithmic slopeof the profiles. Note that for the high concentrationhalo the slope of the profile is significantly larger thanthe asymptotic value -1 even at very small radii r !
0.01rvir.
scales 0.01 < r/rvir < 1. For a high-concentrationhalo with C = 17, the deviations are much smaller:less than 8% for the same range of scales.
To summarize, we find that the di!erences be-tween the NFW and the Moore et al. profiles arevery small ("!/! < 10%) for radii above 1% ofthe virial radius for typical galaxy-size halos withCNFW
># 12. The di!erences are larger for haloswith smaller concentrations. In the case of theNFW profile, the asymptotic value of the centralslope " = !1 is not achieved even at radii as smallas 1%-2% of the virial radius.
3.2. Convergence study
The e!ects of numerical resolution can be stud-ied by resimulating the same objects with higherforce and mass resolution and with a larger num-ber of time steps. In this study we performed
8
Fig. 1.— Example of the construction of mass re-finement in lagrangian space (here for illustration weshow a 2D case). Three central blocks of particleswere marked for highest mass resolution. Each blockproduces 162 particles of the smallest mass. Adjacentblocks correspond to the four times lower resolutionand produce 82 particles each. The procedure is re-peated recursively until we reach the lowest level ofresolution. The region of the highest resolution canhave arbitrary shape.
Figure 2 shows an example of mass refinementfor one of the halos in our simulations. A largefraction of high resolution particles ends up inthe central halo, which does not have any largermass particles (see insert in the bottom panel). Atz = 10, the region occupied by the high resolutionparticles is non-spherical: it is substantially elon-gated in the direction perpendicular to the largefilament clearly seen at z = 0.
After the initial conditions are set, we run thesimulation again allowing the code to performmesh refinement based only on the number of par-ticles with the smallest mass.
2.3. Numerical simulations
We simulated a flat low-density cosmologicalmodel (!CDM) with "0 = 1 ! "! = 0.3, theHubble parameter (in units of 100 kms!1Mpc!1)h = 0.7, and the spectrum normalization !8 = 0.9.We have run two sets of simulations. The first set
Fig. 2.— Distribution of particles of di!erent massesin a thin slice through the center of halo A1 (see Ta-ble 1) at z = 10 (top panel) and at z = 0 (bot-tom panel). To avoid crowding of points the thick-ness of the slice is made smaller in the center (about30h!1kpc) and larger (1h!1Mpc) in the outer partsof the forming halo. Particles of di!erent mass areshown with di!erent symbols: tiny dots, dots, largedots, squares, and open circles.
used 1283 zeroth-level grid in a computational boxof 30h!1Mpc. The second set of simulations used2563 grid in a 25h!1Mpc box and had higher massresolution. In the simulations used in this paper,the threshold for cell refinement (see above) waslow on the zeroth level: nthresh(0) = 2. Thus, ev-
5
Klypin, Kravtsov, Bullock & Primack 2001
MultimassSimulationof Halos

Table 2
Comparison of NFW and Moore et al. profiles
Parameter NFW Moore et al.
Density ! = !s
x(1 + x)2! = !s
x1.5(1 + x)1.5
x = r/rs ! ! x!3 for x " 1 ! ! x!3 for x " 1! ! x!1 for x # 1 ! ! x!1.5 for x # 1!/!s = 1/4 at x = 1 !/!s = 1/2 at x = 1
MassM = 4"!sr3
sf(x) f(x) = ln(1 + x) $ x1 + x f(x) = 2
3 ln(1 + x3/2)
= Mvirf(x)/f(C)Mvir = 4!
3 !cr!0#top!hatr3vir
Concentration CNFW = 1.72CMoore CMoore = CNFW/1.72for halos with the same Mvir and rmax
C = rvir/rs C1/5 % CNFW0.86f(CNFW) + 0.1363
C1/5 = CMoore
[(1 + C3/2Moore)
1/5 $ 1]2/3
error less than 3% for CNFW =5-30 % CMoore
[C3/10Moore $ 1]2/3
C"=!2 = CNFW C"=!2 = 23/2CMoore
% 2.83CMoore
Circular Velocity
v2circ =
GMvir
rvir
C
x
f(x)
f(C)xmax % 2.15 xmax % 1.25
= v2max
xmax
x
f(x)
f(xmax)v2max % 0.216v2
vir
C
f(C)v2max % 0.466v2
vir
C
f(C)
v2vir =
GMvir
rvir!/!s % 1/21.3 at x = 2.15 !/!s % 1/3.35 at x = 1.25
9
Dark Matter Halo Radial Profile
Klypin, Kravtsov, Bullock & Primack 2001

: n ≈ 6
2006, AJ 132, 2701

Logarithmic slope of the density profile as a function of radius for our Aq-A convergence series (using WMAP1 initial conditions). Thick lines show results for r > r(7) conv, thin lines extend the profiles down to the less strict convergence radius r(1) conv. Comparison shows that excellent numerical convergence for the slope is achieved down to a radius intermediate between these two convergence radii. Applied to the highest-resolution Aq-A-1 simulation (1.1×10⁹ particles each of mass 103 M⊙ within Rvir), this implies that the slope is shallower than the asymptotic value of the NFW profile (r−1) in the inner regions.We see no sign of convergence to an asymptotic inner power-law. Instead, the profiles get shallower toward the centre as predicted by the Einasto formula ln(ρ(r)/ρ−2) = (−2/α)[(r/r−2)α − 1] (a straight line in this plot). Arrows indicate the softening length hs of each simulation. Navarro et al. arXiv:0810.1522
The density profile of GHALO2 (1.3×10⁹ particles each of mass 103 M⊙ within R200 = 347 kpc using WMAP3 initial conditions) and its lower resolution realizations as well as the density profile of the Via Lactea 2 simulation (mass 2×10¹² M⊙) in magenta. The convergence radius at each step in resolution is easily seen (indicated by the tick marks). Stadel et al. arXiv:0808.2981
The power law index γ 1 at the smallest resolved radii, but it appears to decline further at smaller radii.
≈
- Density LogSlope
Density LogSlope
NFW
Moore
Einasto
Density

Aquarius: the Billennium simulation
The Aquarius “Billennium”
halo simulation. A dark matter halo with 1
billion particles within the virial
radius.
500
kpc
Volker SpringelMax Planck Institute
for Astrophysics
500 kpc

Aquarius Billennium Simulation
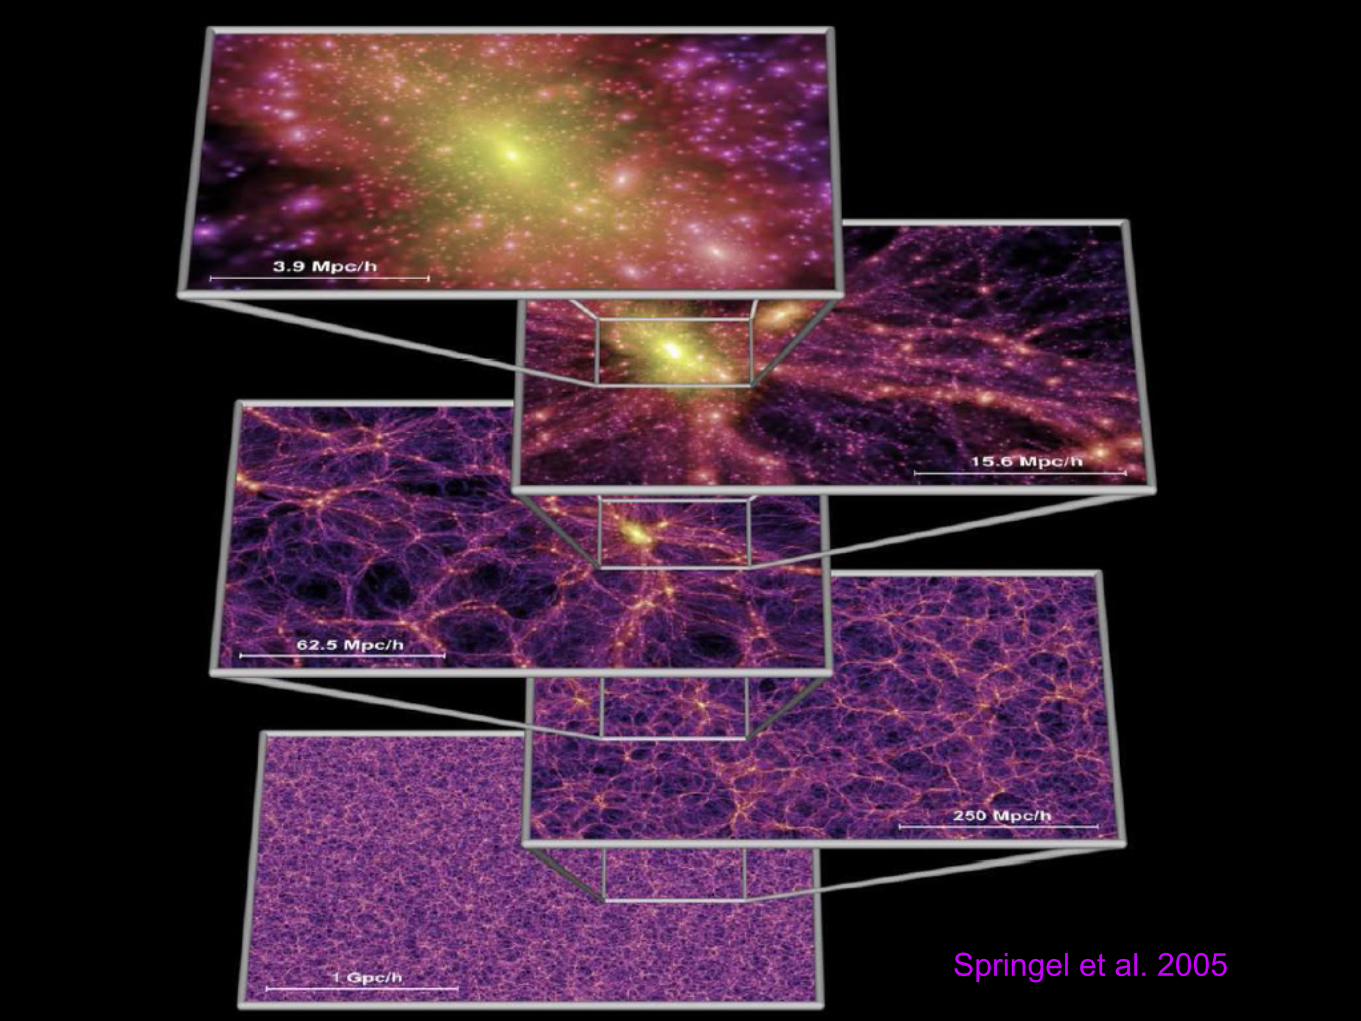
Springel et al. 2005

doubling every ~16.5 months
Particle number in cosmological N-body simulations vs. pub date
Millennium Run

Galaxy 2-point correlation function at the present epoch.Springel et al. 2005
dark matter
simulated galaxies
observed galaxies (2dF)
UNDERSTANDING GALAXY CORRELATIONS

Galaxy type correlated with large scale structure
elliptical
elliptical
bulge+disk
disk
Semi-Analytic Modeling
Kauffmann et al.

Elliptical galaxies in clusters in the local universe
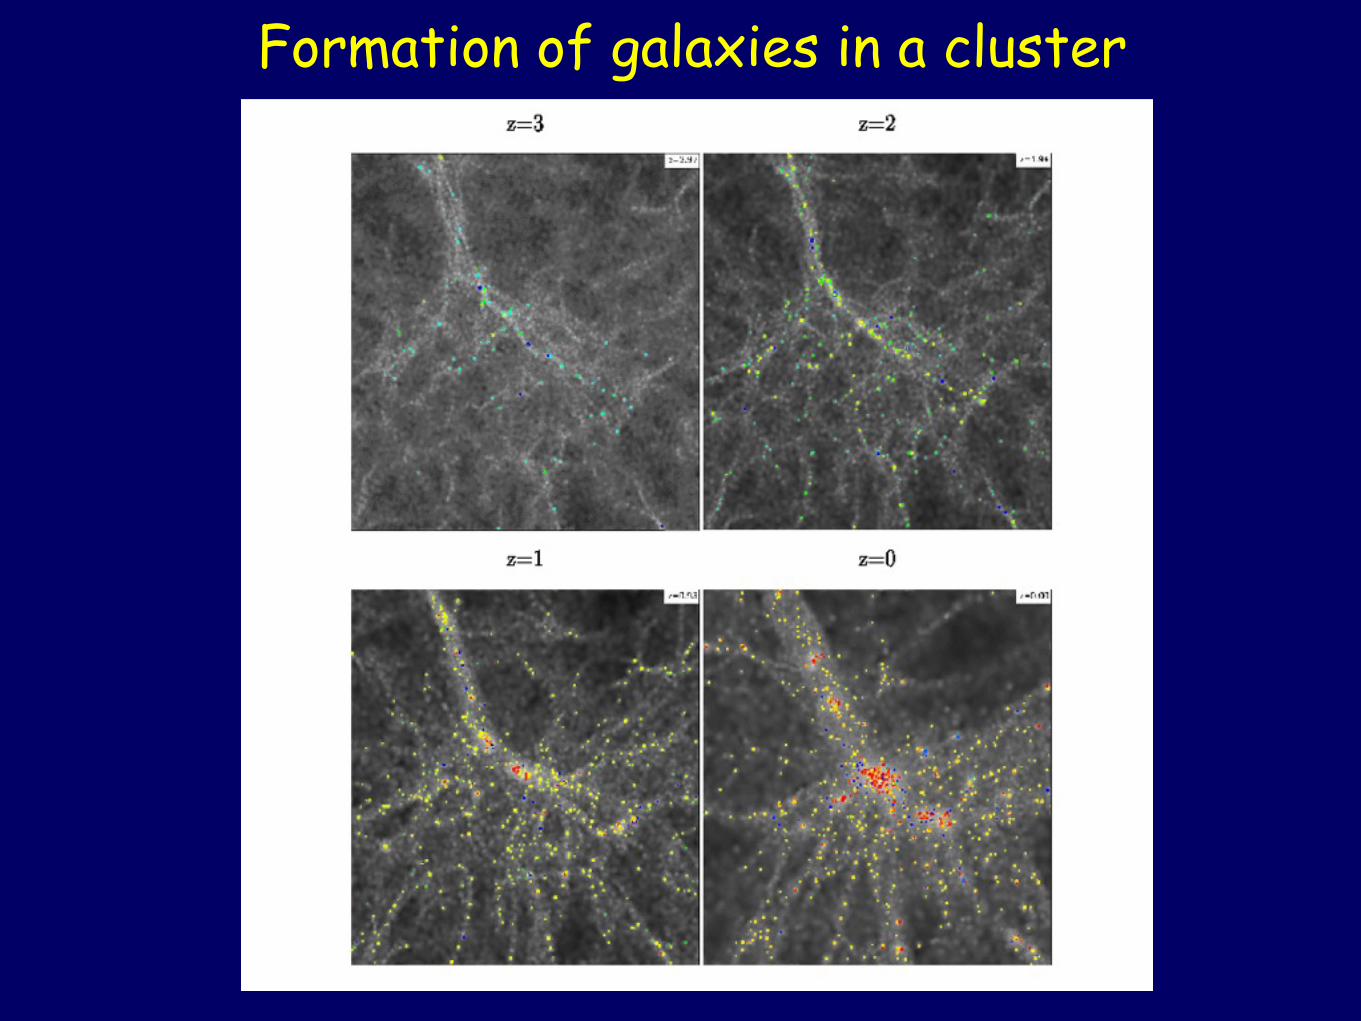
Formation of galaxies in a cluster

2626

Springel et al. 2005

2828Millennium Simulation

Environment of a ‘first quasar candidate’ at high and low redshifts. The two panels on the left show the projected dark matter distribution in a cube of comoving sidelength 10h−1 Mpc, colour-coded according to density and local dark matter velocity dispersion. The panels on the right show the galaxies of the semi-analytic model overlayed on a gray-scale image of the dark matter density. The volume of the sphere representing each galaxy is proportional to its stellar mass, and the chosen colours encode the restframe stellar B−V colour index. While at z = 6.2 (top) all galaxies appear blue due to ongoing star formation, many of the galaxies that have fallen into the rich cluster at z = 0 (bottom) have turned red.
Springel et al. 2005
DM Galaxies
GalaxiesDM

~1012
z=5.7 (t=1.0 Gyr)
z=1.4 (t=4.7 Gyr)
z=0 (t=13.6 Gyr)
Springel et al. 2006 Wechsler et al. 2002
• cosmological parameters are now well constrained by observations
• structure formation in dominant dark matter component accuratelyquantified
• mass accretion history of dark matter halos isrepresented by ‘merger trees’ like the one at left
Present status of ΛCDM“Double Dark” theory:
Semi-Analytic Models of Galaxy Formation
time
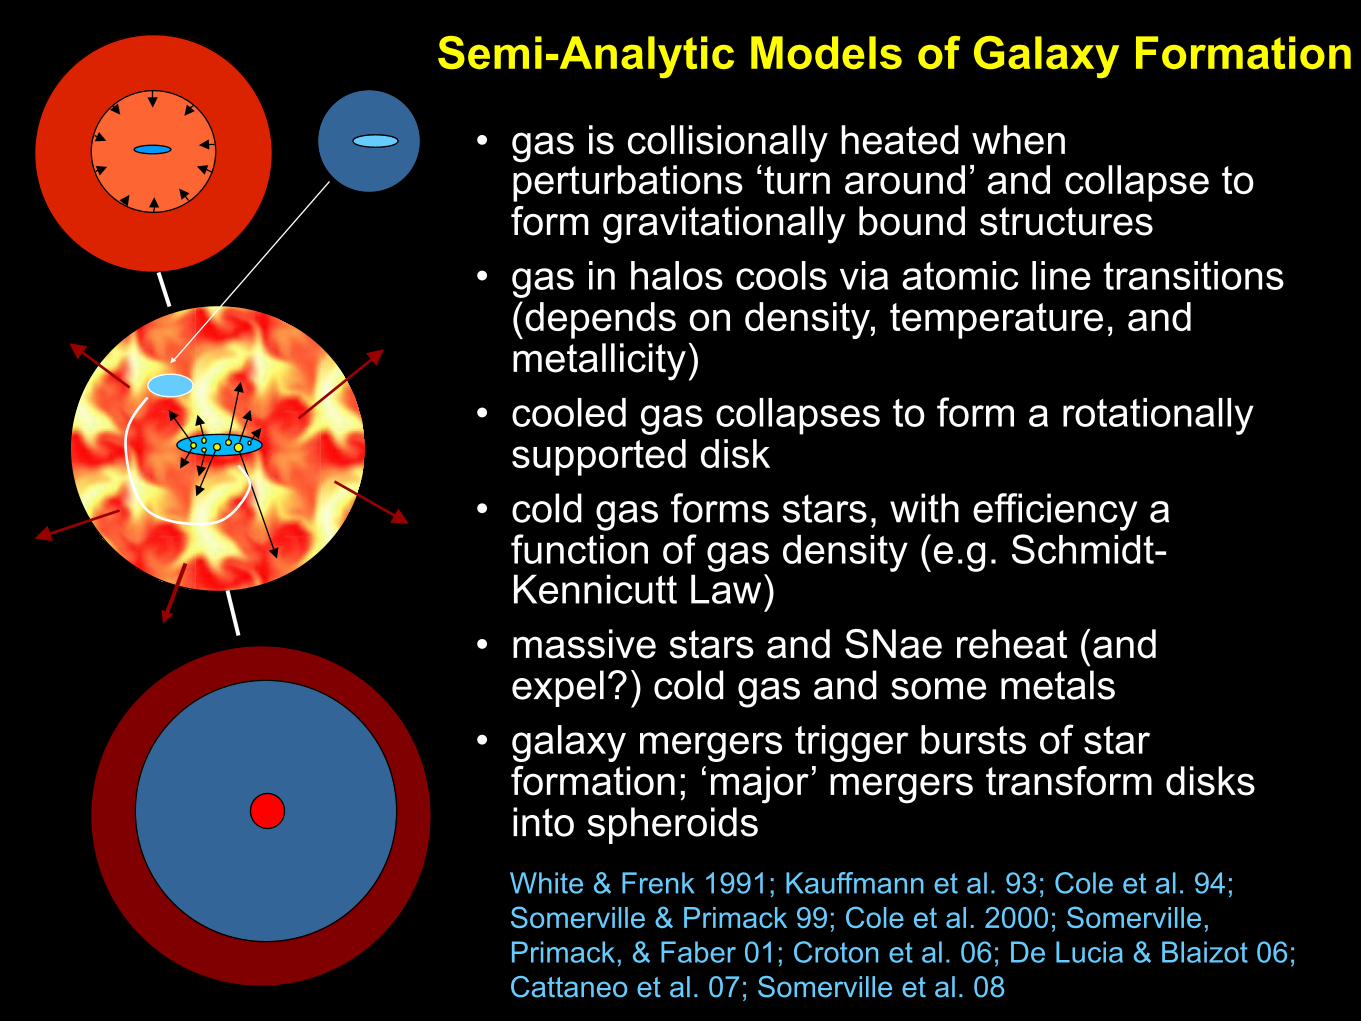
• gas is collisionally heated when perturbations ‘turn around’ and collapse to form gravitationally bound structures
• gas in halos cools via atomic line transitions (depends on density, temperature, and metallicity)
• cooled gas collapses to form a rotationally supported disk
• cold gas forms stars, with efficiency a function of gas density (e.g. Schmidt-Kennicutt Law)
• massive stars and SNae reheat (and expel?) cold gas and some metals
• galaxy mergers trigger bursts of star formation; ‘major’ mergers transform disks into spheroidsWhite & Frenk 1991; Kauffmann et al. 93; Cole et al. 94;Somerville & Primack 99; Cole et al. 2000; Somerville, Primack, & Faber 01; Croton et al. 06; De Lucia & Blaizot 06; Cattaneo et al. 07; Somerville et al. 08
Semi-Analytic Models of Galaxy Formation

Springel et al. 2005

Croton et al. 2006
2 micronGalaxy LuminosityFunction
bJ bandGalaxy LuminosityFunctionAGN
heatingAGN
heating
no he
ating
no h
eatin
g

Color Magnitude Diagram
With AGN heating – brightest galaxies are red, as observed
Without heating – brightest galaxies are blue
Croton et al. 2006
(see also Cattaneo et al. 2006)
Red
Red
Blue
Blue
Faint Bright

Baryons in Dark Matter Halos
• in order to reconcile CDM (sub)halo mass function with galaxy LF or stellar MF, cooling/star formation must be inefficient overall, most efficient at Mhalo ~ 1011 Msun
• baryon/DM ratio must be a strongly non-linear (& non-monotonic) function of halo mass
cosmologies
stars
Somerville & Primack 1999;cf. Benson et al. 2003
DM halos for various
ΛCDM0.3
Cooling
Feedback

Dark halo mass growth vs. time: 4 clusters
Clusters
Groups
Galaxies
Milky Way and M31 halos
GALics DM halos by Cattaneo et al. 2006
<-- time Big Bang -->Sandra Faber

0 2 4 6 8Redshift, z
Log
(Mha
lo/M
)
15
14
13
12
11
10
9
Dark halos of progressively smaller mass
Cattaneo et al. 2006

0 2 4 6 8Redshift, z
Log
(Mha
lo/M
)
15
14
13
12
11
10
9
A schematic model of average halo mass growth

0 2 4 6 8Redshift, z
Log
(Mha
lo/M
)
15
14
13
Star-forming band
12
11
10
9
Key assumption: star-forming band in dark-halo mass

0 2 4 6 8Redshift, z
Log
(Mha
lo/M
)
15
14
13
Star-forming band
12
11
10
9Mthresh
Mcrit
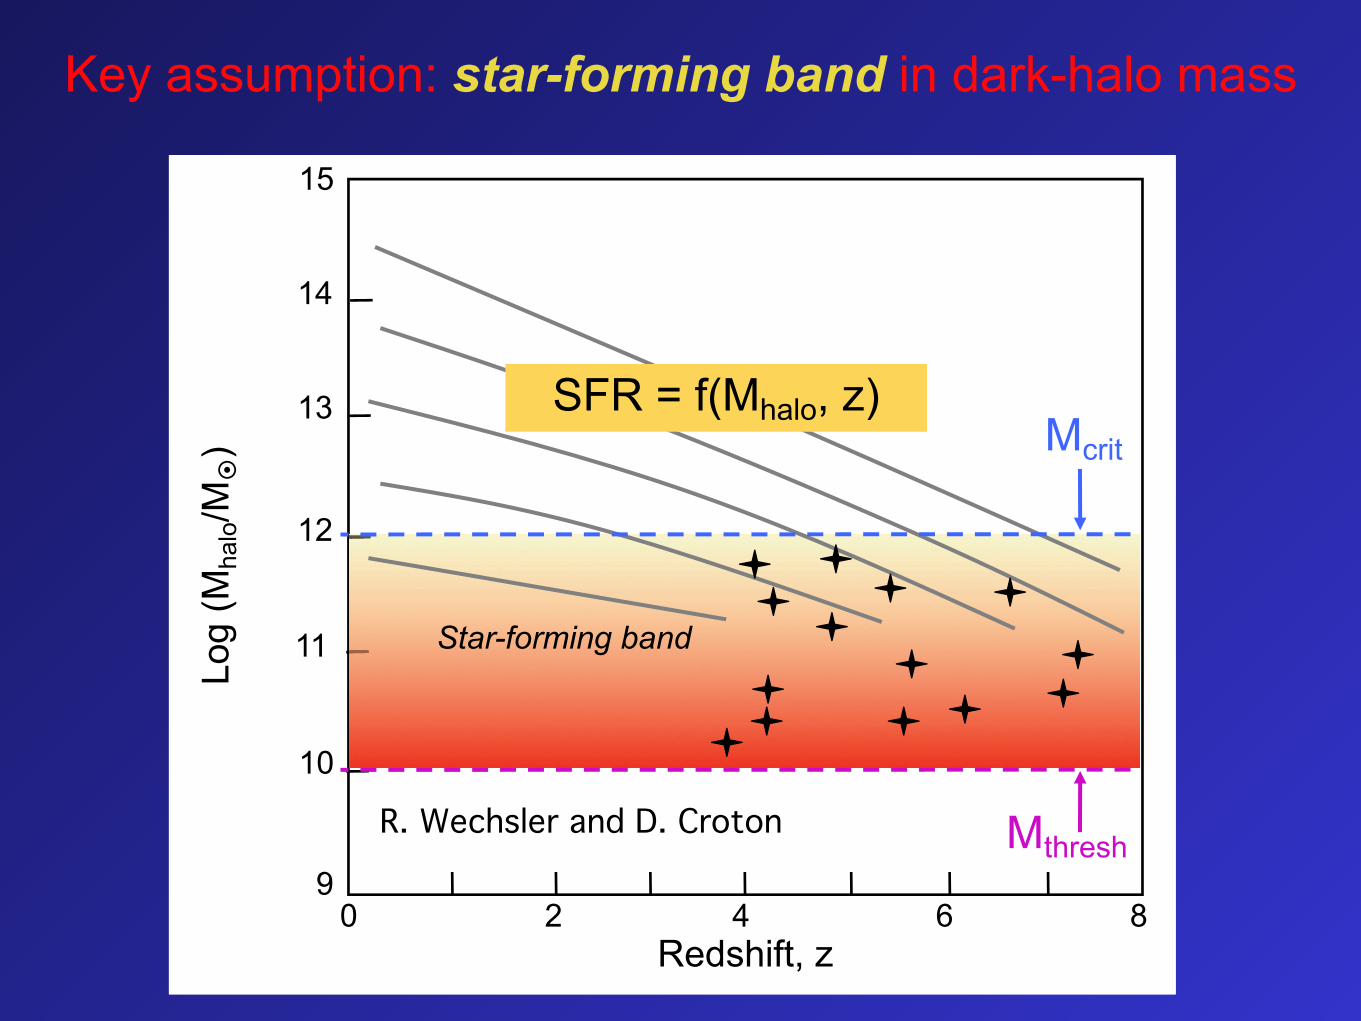
Key assumption: star-forming band in dark-halo mass

Hydro simulations with gas + dark matter switch from cold flows to hot bubbles at Mcrit ~ 1012 M
Blue gas is cooling
Small halo mass = 1011 M
Dekel & Birnboim 2006 Hydrodynamic simulations by Andrei Kravtsov
Large halo mass = 1013 M
Red gas is not cooling
0 2 4 6 8Redshift, z
Log
(Mha
lo/M
)
15
14
13
Star-forming band
12
11
10
9
SFR = f(Mhalo, z)
Mthresh
Mcrit
R. Wechsler and D. Croton
Key assumption: star-forming band in dark-halo mass

<--- time
Mha
lo --
->Implications and Predictions
of the Model1) Each halo has a unique dark-matter growth path and associated stellar mass growth path.
3) A mass sequence comes from the fact that different halo masses enter the star-forming band at different times. A galaxy’s position is determined by its entry redshift into the band. More massive galaxies enter earlier. Thus:
zentry <--> Mhalo <--> Mstar
2) Stellar mass follows halo mass until Mhalo crosses Mcrit.
SAMs: Mstar < 0.05 Mhalo
Sandra Faber
<--- time
Mha
lo --
->
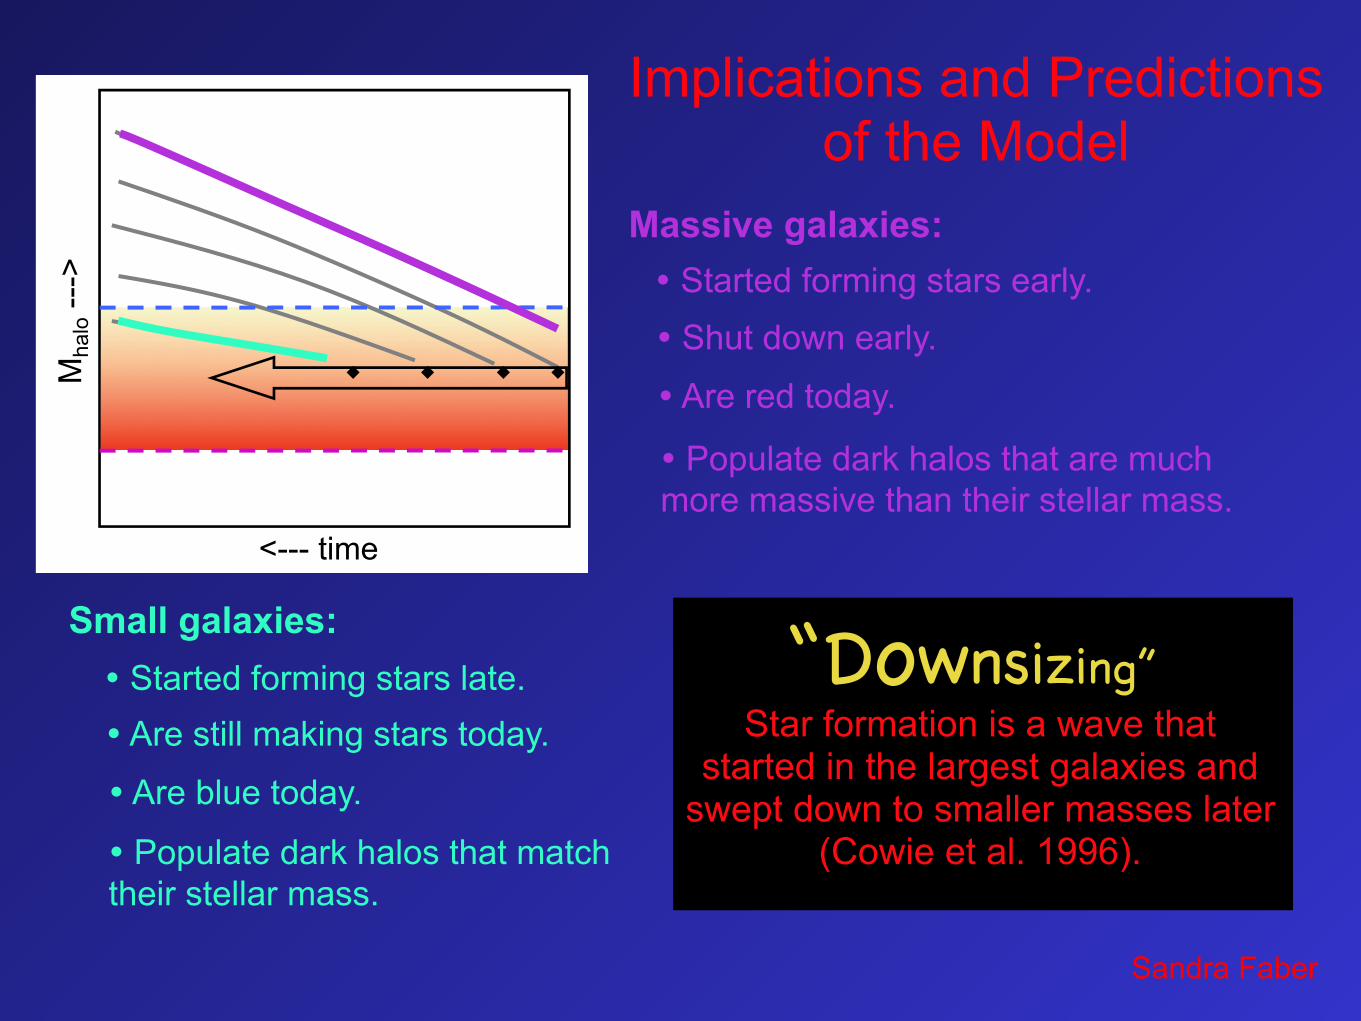
Implications and Predictions of the Model
Started forming stars late. Are still making stars today.
Are blue today.
Populate dark halos that match their stellar mass.
Small galaxies:
Started forming stars early. Shut down early.
Are red today.
Populate dark halos that are much more massive than their stellar mass.
Massive galaxies:
Star formation is a wave that started in the largest galaxies and
swept down to smaller masses later (Cowie et al. 1996).
“Downsizing”
Sandra Faber

Theories for the upper halo star-formation boundary
<--- time
Mha
lo --
->
Gas in halos above the critical halo mass Mcrit ~ 1012 M cannot cool (Ostriker & Rees 1978, Blumenthal et al. 1984, Dekel & Birnboim 2007).
Hotter
Diffuse
1Mcrit
Mcrit is the halo mass at the UPPER edge of the star-formation band, roughly
1012 MW.
Mha
lo --
>
<--- time
Mha
lo --
->
Mcrit
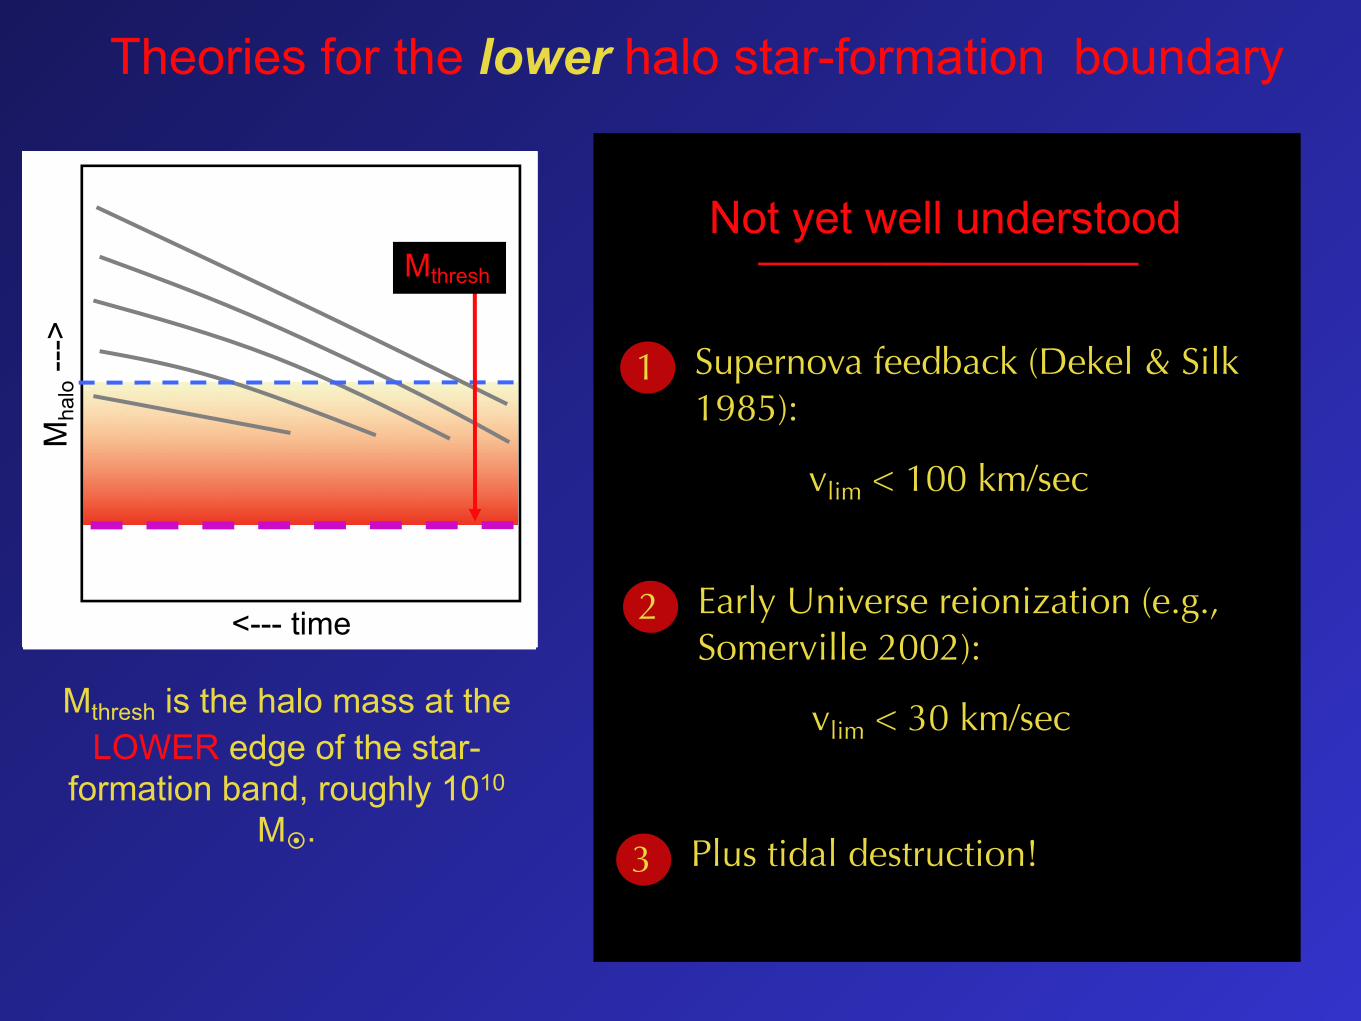
Theories for the lower halo star-formation boundary
<--- time
Mha
lo --
->
Mcrit
Mthresh is the halo mass at the LOWER edge of the star-
formation band, roughly 1010 M.
Mha
lo --
>
<--- time
Mha
lo --
->
Supernova feedback (Dekel & Silk 1985):
vlim < 100 km/sec
1
Not yet well understood
Early Universe reionization (e.g., Somerville 2002):
vlim < 30 km/sec
2
Plus tidal destruction!3
Mthresh

0 2 4 6 8Redshift, z
Log
(Mha
lo/M
)
15
14
13
12
11
10
9
Star-forming band
More realistic model of halo-cooling boundary
Mcrit

0 2 4 6 8Redshift, z
Log
(Mha
lo/M
)
15
14
13
12
11
10
9
Star-forming band
More realistic model of halo-cooling boundary
?
Dekel & Birnboim 2006
Submm galaxies?

8 9 11
Red sequence
Blue cloud
8 9 1110 121198
Flow through the color-mass diagram for “satellite” galaxies
Quenching band
Sandra Faber
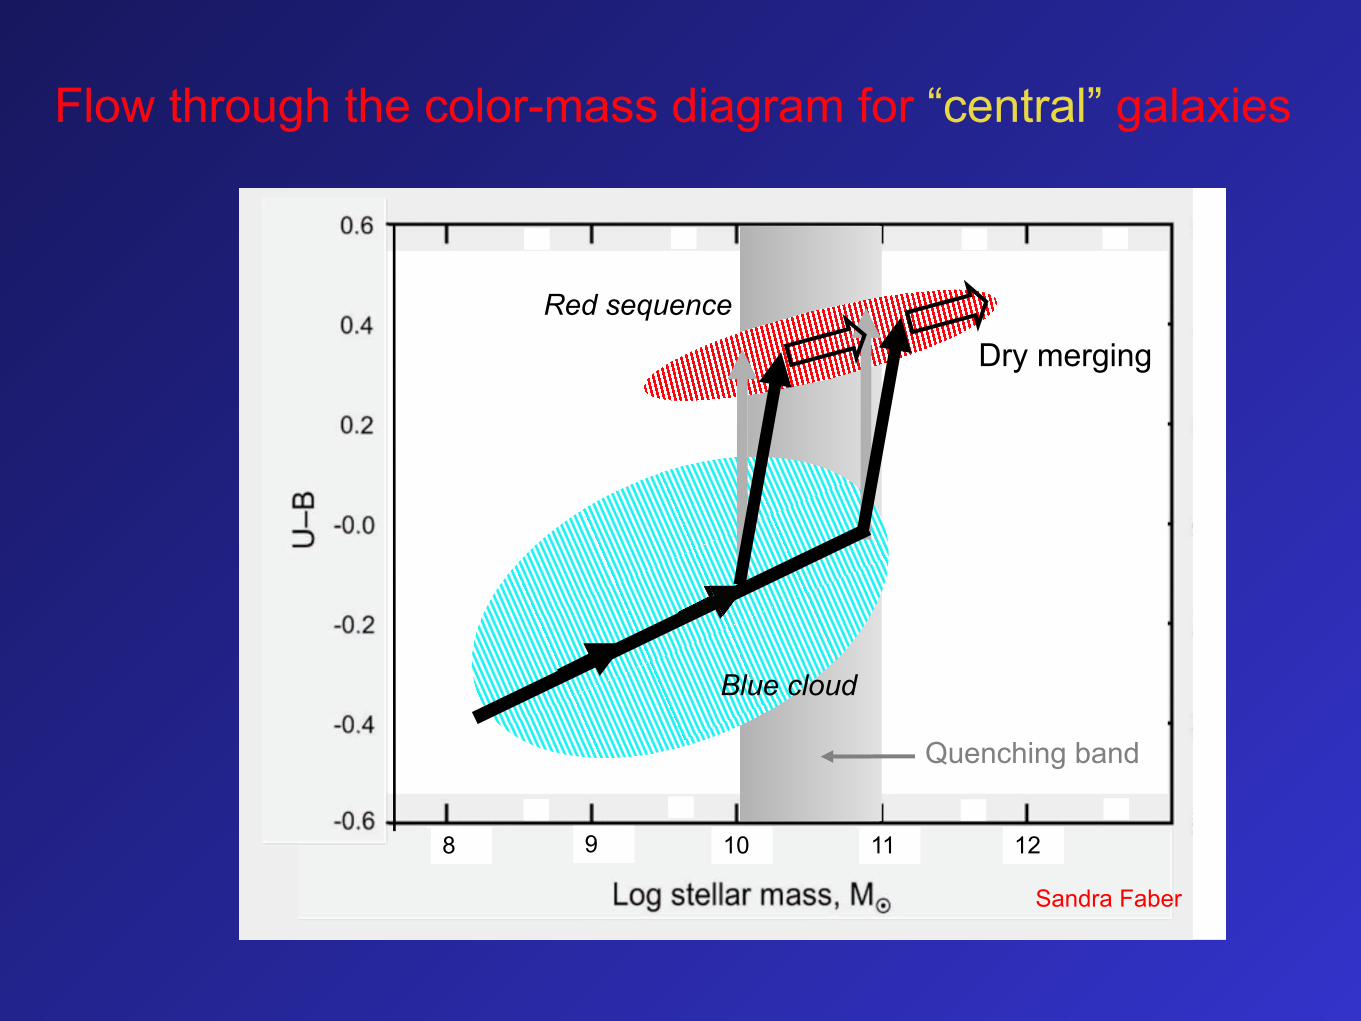
8 9 11
Red sequence
Blue cloud
8 9 1110 121198
Flow through the color-mass diagram for “central” galaxies
Quenching band
Dry merging
Sandra Faber

Flow through the CM diagram versus environment
Satellites
Dry mergers
Hogg et al. 2003: Sloan Survey
Centrals
Sandra Faber

1. History of Observational Cosmology 2. General Relativity 3. Distances, Horizons 4. Boltzmann Equation: Neutrino Decoupling 5. Big Bang Nucleosynthesis, Recombination 6. Dark Matter Formation and Detection 7. Cosmic Microwave Background 8. Cosmic Inflation 9. After Inflation: Baryogenesis10. Cosmic Web11. Simulations and Semi-Analytic Models
Astronomy 233: Physical Cosmology
Winter Quarter 2009 Joel Primack


