Astron. Astrophys. 344, 421–432 (1999) ASTRONOMY AND ASTROPHYSICS Effects of interaction on the properties of spiral galaxies II. Isolated galaxies: The zero point ? I. M ´ arquez 1 and M. Moles 2,3,?? 1 Instituto de Astrof´ ısica de Andaluc´ ıa (C.S.I.C.), Apdo. 3004, E-18080 Granada, Spain 2 Instituto de Matem´ aticas y F´ ısica Fundamental (C.S.I.C.), C/Serrano 123, E-28006 Madrid, Spain 3 Observatorio Astron´ omico Nacional, Madrid, Spain Received 9 November 1998 / Accepted 18 January 1999 Abstract. We analyse the properties of a sample of 22 bright isolated spiral galaxies on the basis of Johnson B,V,I images and optical rotation curves. The fraction of early morphological types in our sample of isolated galaxies (or in other samples of non-interacting spiral galaxies) appears to be smaller than in samples including interacting systems. The overall morpholog- ical aspect is regular and symmetric, but all the galaxies present non-axisymmetric components in the form of bars or rings. We find that the color indices become bluer towards the outer parts and that their central values are well correlated with the total col- ors. The properties of the bulges span a larger range than those of the disks, that thus are more alike between them. None of the galaxies shows a truncated, type II disk profile. It is found that the relation between surface brightness and size for the bulges, the Kormendy relation, is tighter when only isolated galaxies are considered. We find a similar relation for the disk parameters with an unprecedented low scatter. A Principal Component Analysis of the measured parame- ters shows that 2 eigenvectors suffice to explain more than 95 % of the total variance. These are, as found for other samples including spiral galaxies in different environmental situations, a scale parameter given by the mass or, equivalently, the lu- minosity or the size; and a form parameter given by the bulge to disk luminosity ratio, B/D, or, equivalently, by the gradient of the solid-body rotation region of the rotation curve, the G- parameter. We report here a tight correlation between G and B/D for our sample of isolated spirals that could be used as a new distance indicator. Send offprint requests to: I. M´ arquez ([email protected]) ? Based on data obtained at the 1.5m telescope of the Estaci´ on de Observaci´ on de Calar Alto, Instituto Geogr´ afico Nacional, which is jointly operated by the Instituto Geogr´ afico Nacional and the Con- sejo Superior de Investigaciones Cient´ ıficas through the Instituto de Astrof´ ısica de Andaluc´ ıa ?? Visiting Astronomer, German-Spanish Astronomical Center, Calar Alto, operated by the Max-Planck-Institut f ¨ ur Astronomie jointly with the Spanish National Commission for Astronomy Key words: galaxies: fundamental parameters – galaxies: in- teractions – galaxies: kinematics and dynamics – galaxies: pho- tometry – galaxies: spiral – galaxies: structure 1. Introduction It is generally admitted that gravitational interaction can modify the properties of galaxies in rich environments. Its effects are often invoked to explain different observed properties, from the distribution of morphological types in clusters of galaxies to the peculiarities sometimes seen in particular galaxies. Those effects, on the other hand, can be very diverse in nature and have very different time scales to manifest, so it is not straightforward to ascertain whether such or such peculiarity is actually the fact of the interaction. In other words, the absence of peculiarities in a given system cannot be given as a sign of isolation, whereas the presence of unusual features cannot be unambiguously given as a proof of gravitational interaction (see Moles et al. 1994, for the pair NGC 450/UGC 807). It is clear that the characterization of the specific effects of the gravitational interaction needs to be preceded by the exhaus- tive analysis of the properties of galaxies that could be consid- ered as isolated. The average values and the ranges they present in size, luminosity, bulge to disk ratio, etc, do constitute the start- ing point to which refer similar properties of spirals in richer environments, from isolated pairs and small groups to clusters. Only such a comparative analysis could eventually lead to the identification of the specific effects of the gravitational interac- tion. This interaction is expected to produce changes in some morphological aspects, the kinematics, and the stellar content of the involved galaxies. Thus, it is necessary to start with the study of those same properties for a well defined sample of isolated galaxies. Important studies of samples of spiral galaxies do exist, but these, even if sometimes defined as containing normal or non- peculiar galaxies, include galaxies belonging to interacting sys- tems. The first important contribution to the study of galactic kinematics was made by Rubin and collaborators (Rubin et al. 1991, and references therein). A total of about 60 galaxies, se-
Effects of interaction on the properties of spiral galaxies
II. Isolated galaxies: The zero point?
I. M arquez1 and M. Moles2,3,??
1 Instituto de Astrofısica de Andalucıa (C.S.I.C.), Apdo. 3004, E-18080 Granada, Spain2 Instituto de Matematicas y Fısica Fundamental (C.S.I.C.), C/Serrano 123, E-28006 Madrid, Spain3 Observatorio Astronomico Nacional, Madrid, Spain
Received 9 November 1998 / Accepted 18 January 1999
Abstract. We analyse the properties of a sample of 22 brightisolated spiral galaxies on the basis of Johnson B,V,I imagesand optical rotation curves. The fraction of early morphologicaltypes in our sample of isolated galaxies (or in other samplesof non-interacting spiral galaxies) appears to be smaller than insamples including interacting systems. The overall morpholog-ical aspect is regular and symmetric, but all the galaxies presentnon-axisymmetric components in the form of bars or rings. Wefind that the color indices become bluer towards the outer partsand that their central values are well correlated with the total col-ors. The properties of the bulges span a larger range than thoseof the disks, that thus are more alike between them. None of thegalaxies shows a truncated, type II disk profile. It is found thatthe relation between surface brightness and size for the bulges,the Kormendy relation, is tighter when only isolated galaxies areconsidered. We find a similar relation for the disk parameterswith an unprecedented low scatter.
A Principal Component Analysis of the measured parame-ters shows that 2eigenvectorssuffice to explain more than 95% of the total variance. These are, as found for other samplesincluding spiral galaxies in different environmental situations,a scale parameter given by the mass or, equivalently, the lu-minosity or the size; and a form parameter given by the bulgeto disk luminosity ratio, B/D, or, equivalently, by the gradientof the solid-body rotation region of the rotation curve, the G-parameter. We report here a tight correlation between G andB/D for our sample of isolated spirals that could be used as anew distance indicator.
Send offprint requests to: I. Marquez ([email protected])? Based on data obtained at the 1.5m telescope of the Estacion de
Observacion de Calar Alto, Instituto Geografico Nacional, which isjointly operated by the Instituto Geografico Nacional and the Con-sejo Superior de Investigaciones Cientıficas through the Instituto deAstrofısica de Andalucıa?? Visiting Astronomer, German-Spanish Astronomical Center, Calar
Alto, operated by the Max-Planck-Institut fur Astronomie jointly withthe Spanish National Commission for Astronomy
It is generally admitted that gravitational interaction can modifythe properties of galaxies in rich environments. Its effects areoften invoked to explain different observed properties, from thedistribution of morphological types in clusters of galaxies tothe peculiarities sometimes seen in particular galaxies. Thoseeffects, on the other hand, can be very diverse in nature and havevery different time scales to manifest, so it is not straightforwardto ascertain whether such or such peculiarity is actually the factof the interaction. In other words, the absence of peculiarities ina given system cannot be given as a sign of isolation, whereasthe presence of unusual features cannot be unambiguously givenas a proof of gravitational interaction (see Moles et al. 1994, forthe pair NGC 450/UGC 807).
It is clear that the characterization of the specific effects ofthe gravitational interaction needs to be preceded by the exhaus-tive analysis of the properties of galaxies that could be consid-ered as isolated. The average values and the ranges they presentin size, luminosity, bulge to disk ratio, etc, do constitute the start-ing point to which refer similar properties of spirals in richerenvironments, from isolated pairs and small groups to clusters.Only such a comparative analysis could eventually lead to theidentification of the specific effects of the gravitational interac-tion. This interaction is expected to produce changes in somemorphological aspects, the kinematics, and the stellar content ofthe involved galaxies. Thus, it is necessary to start with the studyof those same properties for a well defined sample of isolatedgalaxies.
Important studies of samples of spiral galaxies do exist, butthese, even if sometimes defined as containing normal or non-peculiar galaxies, include galaxies belonging to interacting sys-tems. The first important contribution to the study of galactickinematics was made by Rubin and collaborators (Rubin et al.1991, and references therein). A total of about 60 galaxies, se-
422 I. Marquez & M. Moles: Effects of interaction on the properties of spiral galaxies. III
lected to cover a wide range in size, mass, and luminosity wereobserved. There was no aim to build up a complete sample, andmost of the objects are non isolated. Moreover, the ulterior pho-tometric analysis (Kent 1988, and references therein) has beendone only for some of them, so complete data are only availablefor a relatively small number of field spirals. Further studieshave considerably increased the number of objects, but none ofthem took into account the information on the environmentalstatus of the galaxies, and were focused either on the photomet-ric properties (de Jong & van der Kruit 1994; de Jong 1996a,b, c; see Table 1 from Hereaudeau & Simien 1996; Peletier &Balcells 1997; more recently, Baggett et al. 1998 for one pho-tometric band data) or to spectroscopic and imaging surveysof field galaxies for which the existing information is long slitspectra together with just one broad band (Mathewson et al.1992; Courteau 1996).
It is not a simple question to define what an isolated galaxyis. We only try here to establish operational criteria to identifyisolated systems. The perturbations that a galaxy can suffer de-pend, apart the properties of the galaxy itself, on the mass, size,distance and relative velocity of the perturbing agent. Thus, theinfluence of very far away big galaxies will be negligible, butsmall galaxies can produce secular alterations on the dynamicsof the primary system provided they are close enough (Athanas-soula 1984; Sundelius et al. 1987; Byrd & Howard 1992). Andthey can manifest themselves on very different time scales. Herewe define an isolated galaxy as that for which the possible pastperturbations by neighboring galaxies, if any, have been com-pletely erased by now. Accepting that typical time scales for thedecay of the perturbation effects are not longer than a few times109 years, a criterion for isolation can be given. As discussedin Marquez & Moles (1996; hereafter paper I), we consider agalaxy isolated when it has no neighbours in a volume definedby a radius of 0.5 Mpc in projected distance and a redshift dif-ference of 500 km s−1. To be conservative, we also discardedall those galaxies which appear on the POSS prints with closeneighbours for which there is no redshift information (see be-low).
The present work, the second of three, is devoted to the studyof the properties of a sample of isolated spiral galaxies. The caseof spirals in isolated pairs will be presented in Paper III, whereasthe description of both samples, the details of the observations,data reduction and methods of analysis were given in Paper I.We have both, CCD multi-color (Johnson B, V and I bands)photometry and major axis long slit spectra information, for15 isolated spiral galaxies. For some of those galaxies we alsopresent minor axis long slit spectra and/or Hα CCD photome-try. We also present long slit spectra for 4 more galaxies. Theproperties we have measured are compared with those of otheranalyses to find whether they are different. This contribution isorganized as follows: The sample is briefly described in Sect. 2.In Sect. 3 we comment the morphological aspects. In Sect. 4 weanalyse the set of parameters obtained from the whole data andin Sect. 5, the relationships among them. The conclusions arepresented in Sect. 6.
2. The sample of isolated galaxies
In configuring our sample of isolated spiral galaxies, the firststep was to select all the spirals brighter thanmB = 13 magwith δ > 0 in the CfA catalogue (Huchra et al. 1983). For prac-tical reasons only galaxies with diameters smaller than 4′ wereretained. To minimize inclination corrections for both photo-metric and kinematical data, we only considered objects withinclinations between 32◦ and 73◦(i.e., cataloguedb/a in therange 0.8< b/a < 0.3). The sample selected in that way ismagnitude and size limited.
After that we defined a criterion for isolation. We first ex-cluded all the galaxies that are in the catalogues by Karachent-sev (1972), Turner (1976) or Soares (1989), that is to say,well characterized members of isolated pairs or small groups.Then, a galaxy was consideredisolatedwhen the nearest neigh-bor found in the CfA catalogue was outside the volume de-fined by a projected distance of 0.5 Mpc (we adopt here H0= 75 km s−1 Mpc−1) and a redshift difference of 500 km s−1.To eliminate the possibility of having small companions fainterthan the limit of the CfA catalogue, that could be still very ef-ficient in producing dynamical or morphological perturbationsin the main galaxy (see quoted references and Marquez et al.1996), we also excluded galaxies with optical companions inthe Palomar Sky Survey Prints. The final sample contains 22galaxies defined as isolated (see Table 1 in Paper I). It is foundthat all of them havecz < 6000 km s−1.
3. The morphology of the isolated galaxies
The RC3 catalogue (de Vaucouleurs et al. 1991) contains de-tailed morphological information for many of the 22 galaxiesin our sample. There is information on the subtype for all thegalaxies, with the exception of NGC 6155, classified just as spi-ral. There is catalogue information on the presence or not of abar for 16 galaxies, and we were able to add that information forother 5 galaxies (UGC 3511, UGC 3804, NGC 3835, NGC 6155and NGC 6395, see notes on individual galaxies in Paper I1),so the bar information does exist for all the 22 galaxies but one,namely NGC 4525, classified as Scd. The morphological infor-mation is completed with details on the presence of rings for 17galaxies in the sample.
Looking at that information, the following picture emerges.First, only 5 out of the 21 galaxies with type information areearlier than Sc. This could be just an artifact due to the limitedsize of our sample, but we note that de Jong & van der Kruit(1994) find also a type distribution that peaks at Sc for theirsample of 86 non-interacting, non-peculiar spirals.
Among the 21 galaxies with information on the presence of abar, 8 are non barred (SA), 3 are barred (SB) and 10 are weaklybarred (type SAB coded as SX in the RC3). The fraction ofbarred systems among the isolated galaxies amounts to 62%. Inspite of the small size of our sample, we notice that this fractionis very similar to that found for a large population of spirals,
1 Published only in electronic form and available on the server ofthe Editions de Physique: http://www.ed-phys.fr
I. Marquez & M. Moles: Effects of interaction on the properties of spiral galaxies. III 423
without consideration of their environmental status (Moles etal. 1995).
Another interesting aspect is that all the non-barred (SA)galaxies in the sample are ringed spirals. Therefore, all the 21galaxies with bar or ring information do show the presence offeatures indicative of the presence of non-axisymmetric com-ponents of the potential. Indeed, this kind of structures is easilyexplained as due to perturbations of the gravitational potentialby companions (Simkim et al. 1980; Arsenault 1989; Elmegreenet al. 1990; Combes & Elmegreen 1993). But the selection crite-ria we have adopted to define the sample of isolated spirals wasdesigned to select objects that wouldn’t have experienced grav-itational interaction in the last 109 years at least. The presenceof those components in all of them should imply longer timescales for those features, unless the possibility of spontaneousformation of such structures along the galactic life is accepted.
The global aspect of those galaxies is however quite regular.For the 17 galaxies for which we could gather CCD broad bandimages, our analysis shows that all their disks are quite symmet-ric at their outskirts. We have calculated the decentering degreeas the displacement of the center of the most external, recordedisophote with respect to the luminosity center, normalized tothe last measured radius. The values we measured are alwayssmaller than 5%, except for NGC 6155, for which we found10%. The average decentering amounts to 2.4± 2.7%. Con-cerning the spiral arm structure, it can be generally described asregular and symmetric in shape, although sometimes it is moreintense in one of the hemispheres. Essentially all kind of struc-turing are encountered in our isolated spirals but, we cannotextract statistically significant results on their arm structure dueto the limited number of systems we have in the sample.
4. The photometric and kinematical properties
In Paper I we give the whole set of parameters measured forthe sample of isolated galaxies, together with the descriptionsof how they have been obtained. In Table 1 we show the medianvalues together with the dispersion and the range of variationfor the different measured parameters. Indeed, given the size ofthe sample it is not possible to give the values for each mor-phological subtype. Moreover, as we have discussed, most ofthe galaxies are late types, with 11 of them classified as Sc. Wenote that this aspect should act as a caution when trying to docomparative studies.
4.1. The photometric properties
4.1.1. Luminosity and color indices
The distances used to evaluate the luminosity were derived fromthe measured redshift corrected for galactocentric motion (asindicated in the RC2 catalogue, de Vaucouleurs et al., 1976),with H0 = 75 km s−1 Mpc−1. The correction for the Virgocentricinflow for our galaxies is in general small (always less than 15%)and, as discussed in Paper I, not sensitive to the detailed modelused. We therefore decided not to correct for the inflow. Themagnitudes and color indices given in Table 2 are corrected
Table 1.Average properties of the 22 isolated spirals in the sample.
t 5±1.4 −MDB 19.98±0.53
−M0B 20.35±0.54 −MD
I 21.70±0.68−M0
V 20.74±0.60 −MBB 17.80±0.80
−M0I 21.88±0.85 −MB
I 20.44±0.93(B − V )T 0.48±0.09 (B − I)D 1.75±0.24(B − I)T 1.67±0.25 (B − I)B 2.52±0.59< µ > 21.57±0.28 (B − V )c 0.89±0.10Re
B 4.3±1.4 (B − I)c 2.21±0.29Re
V 3.5±1.2 −P(BV ) 0.047±0.019Re
I 3.2±1.0 −P(BI) 0.077±.033D 35±12 G 157±103i 53±10 Rmax (Kpc) 4.00±1.28a 24.4±9.6 V i
max 179±35b 12.7±6.7 RM (Kpc) 8.0±2.6µe
B,D 22.61±0.44 V iM 183±35
ReB,D 5.1±1.5 Mass(RM ) 7.5±3.9
µeB,B 20.10±2.25 Mass(R25) 10.3±6.1
ReB,B 0.22±0.65 Vsist 2569±859
µeI,D 20.40±0.54 M/LB 4.1±1.4
ReI,D 3.6±1.1 ∆(1) 7.6± 7.1
µeI,B 17.96±2.35 log(L(2)
Hα) 41.2±0.5Re
I,B 0.73±1.020.5 × DB
25 10.01±2.850.5 × DI
25 12.93±3.52
M are absolute magnitudes. All the R (effective radius) together witha andb (major and minor axes) are in Kpc. D are distances in Mpc(H0=75 km s−1Mpc−1). i = acos (b/a), in degrees.µ2
i,j are surfacebrightness parameters in mag/(”)2, andRe
i,j the effective radii in Kpc,from the photometric decomposition, wherei is the filter andj is thecomponent (D=disk, B=bulge).O and P are the origin and slopeof the linear regime of the color gradients (see text). G is in unitsof km s−1Kpc−1. M/LB is in solar units. Velocities are in km s−1. Massin 1010M� units(1) See text for the definition of∆ = ∆V/∆R (◦)(2) Luminosity in 1041 erg s−1 units.
for galactic and internal extinction as explained in Paper I (seeTable 7 in Paper I).
The range of the B luminosity of the galaxies we have mea-sured is−18.58 ≤ MB ≤ −22.19, with a median value of−20.35 (see Table 1). Therefore, there are no faint spirals in oursample, a fact that has to be taken into account when makingcomparative analysis (see below). The effective radii in Table 1have been calculated from the growing curves in the differentbands. The mean surface brightness values were evaluated forthe area enclosed by the 25 mag/(”)2 isophote (taken from theRC3), i. e.,< µ >= −2.5log(I/r2
25), wherer25 is the radiusof that isophote.
For the total color indices the ranges we find are0.35 ≤(B −V ) ≤ 0.85 and1.2 ≤ (B − I) ≤ 2.4. These are similar towhat is found for other samples of spiral galaxies, independentlyof their interaction status (Roberts & Haynes 1994; de Jong1996c).
To characterize the populations of the disks we have con-sidered the color indices and their gradients along the disk. To
424 I. Marquez & M. Moles: Effects of interaction on the properties of spiral galaxies. III
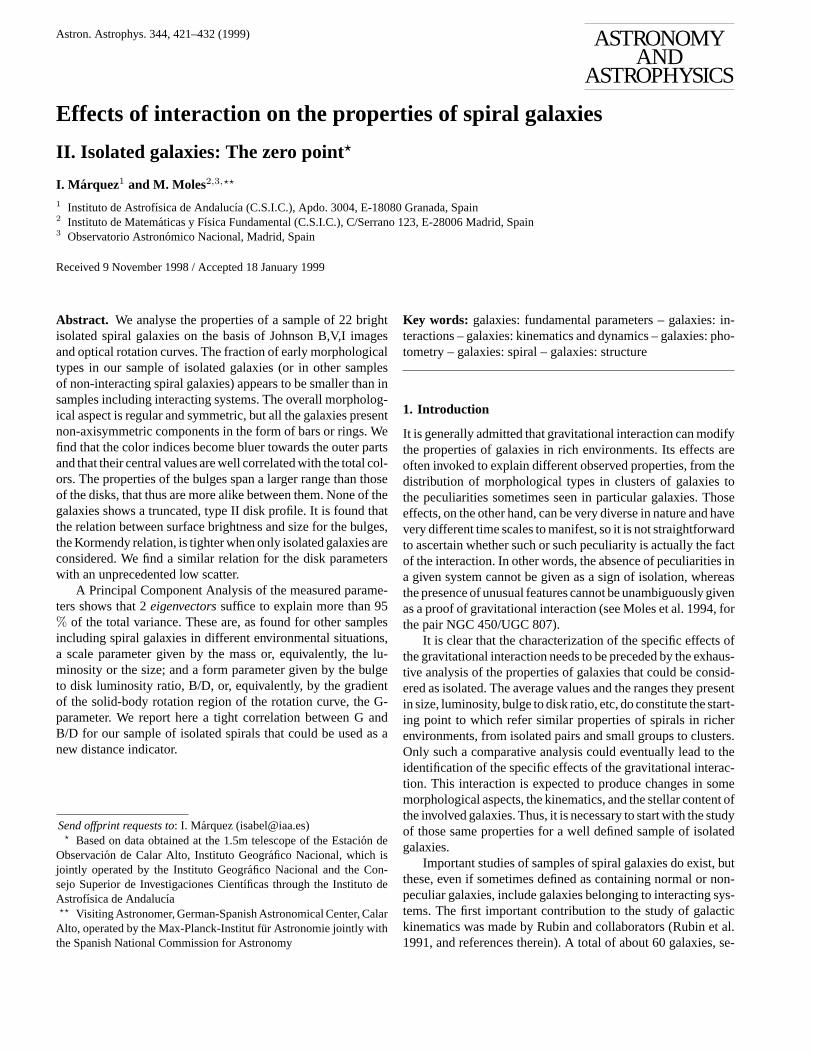
Fig. 1. The central colors, and the slope P of the color gradient (inmagnitudes per kpc) as a function of the total galactic colors.
quantify the color gradients we have fitted a linear function of theform CI(r) = CI(c) + Pr, where CI(c) is the (extrapolated) centralcolor index under consideration, and r the radial distance in kpc.We find that P is negative for all the galaxies in the sample, i.e.,their color indices become bluer towards the external parts. Asshown in Fig. 1, the central color indices correlate with the cor-responding total colors: they are redder for redder galaxies. Thecorrelation is better traced by(B − I), with correlation coeffi-cient r = 0.774 and probability P = 0.9969. Another interestingaspect is that the central colors seem to span a wider range thatouter colors, specially in (B-I). We find0.67 ≤ (B−V )c ≤ 1.01and1.75 ≤ (B − I)c ≤ 2.61 for the central colors, whereasfor the colors measured at the last recorded isophote, RB , wehave0.50 ≤ (B − V ) ≤ 0.78 and1.52 ≤ (B − I) ≤ 2.17(UGC 3511 was excluded for this calculation since the colorswe measured are abnormally red for a Scd spiral, see Paper I).
The emerging picture from the above considerations is thatredder galaxies have redder central colors. The fact that therange of color indices at the outer regions is smaller than at thecenter would mean that the disks of different galaxies tend tobe more alike that their bulges.
4.1.2. The properties of the bulges and disks
It is a well known fact that the output of the photometric de-composition of the light distribution in the image of a galaxydepends on the method used and on the form of the profilesadopted for the components (Knapen & van der Kruit 1991). Tomake explicit our choices we have used 1-D light profiles, withan exponential law for the disk (Freeman 1970) and the r1/4 lawfor the bulge (de Vaucouleurs 1948), respectively:
log(IiD) = log(Ii
Do) − 0.7290(r/riD − 1)
and
log(IiB) = log(Ii
Bo) − 3.3307((r/riB)1/4 − 1).
where i stands for the photometric band under consideration.The isophotal profiles have been derived by plotting the
isophotal levelsversustheir equivalent radii, calculated from thearea inside each observed isophote. Disk and bulge parametershave been obtained from the surface brightness profiles, follow-ing Boroson (1981) and using the marking the disk method.
The main results are given in Table 1, and presented in thedifferent panels of Figs. 2 and 3. (NGC 718 data appears as adiscrepant point in all the relations involving its B-magnitude.We suspect that the abnormally red colors we have measuredare not correct and the galaxy should be observed again beforebeing included in the discussion. This is the reason to omit itin the following.) No trend is found between the disk and bulgeparameters and the morphological type. In particular, for the Scsin our sample it is clear that their disk and bulge properties spana big range. Indeed, the size of our sample is too small to drawconclusions. But the trend we find for the isolated galaxies ismuch alike to that shown by larger samples of non-interactinggalaxies. We have to insist, before starting comparisons betweendifferent sets of data, on the differences that can be induced bythe use of different methodologies. Thus, it has been arguedthat exponential rather than r1/4 fits would be more appropriatefor the bulges of late spirals (Andreadakis & Sanders 1994; deJong 1996a; Courteau, de Jong & Broeils 1996, Seigar & James1998). The resulting bulges are then fainter than when a r1/4
law is fitted. Moreover, the use of 1-D bulge profiles (our case)produce bulges with fainter central surface brightness and largereffective radii than 2-D fits.
With all this in mind, we can compare our results with theB-band data presented by de Jong (1996b) for a sample of non-perturbed, non-peculiar spiral galaxies, a sample that, as wealready argued, can be taken as not too dissimilar to ours exceptin the luminosity range. In the same Fig. 2 we also present deJong’s data. It is clear that there is a large overlap between bothsets of results.
The slight differences that can be appreciated after a moredetailed look, can be explained in terms of the differences inmethodology and the already quoted bias towards luminousgalaxies in our sample. Thus, the mean value of the central disksurface brightness that we find isµ0
B = 20.9± 0.6, rather onthe bright end of the values determined by Bosma & Freeman(1993) and by Giovanelli et al. (1994), and higher than the valuegiven by de Jong. The same is found for the derived disk lumi-nosities. This is certainly due to the absence of galaxies fainterthan MB = −18 in our sample since, as pointed out by de Jong(1996b) and Courteau (1996), the average value of the centralsurface brightness of the disks (Freeman 1970) depends on theluminosity range considered. Similar considerations apply tothe bulge parameters we have derived.
We find that the scale length values for the disks depends onthe photometric band (see Table 1), in the sense that it becomes
I. Marquez & M. Moles: Effects of interaction on the properties of spiral galaxies. III 425
1 10
24
22
20a
0.01 0.1 126
24
22
20
18
16b
26 24 22 2026
24
22
20
18
16c
1 100.01
0.1
1 d
-16 -18 -20 -22-10
-12
-14
-16
-18
-20e
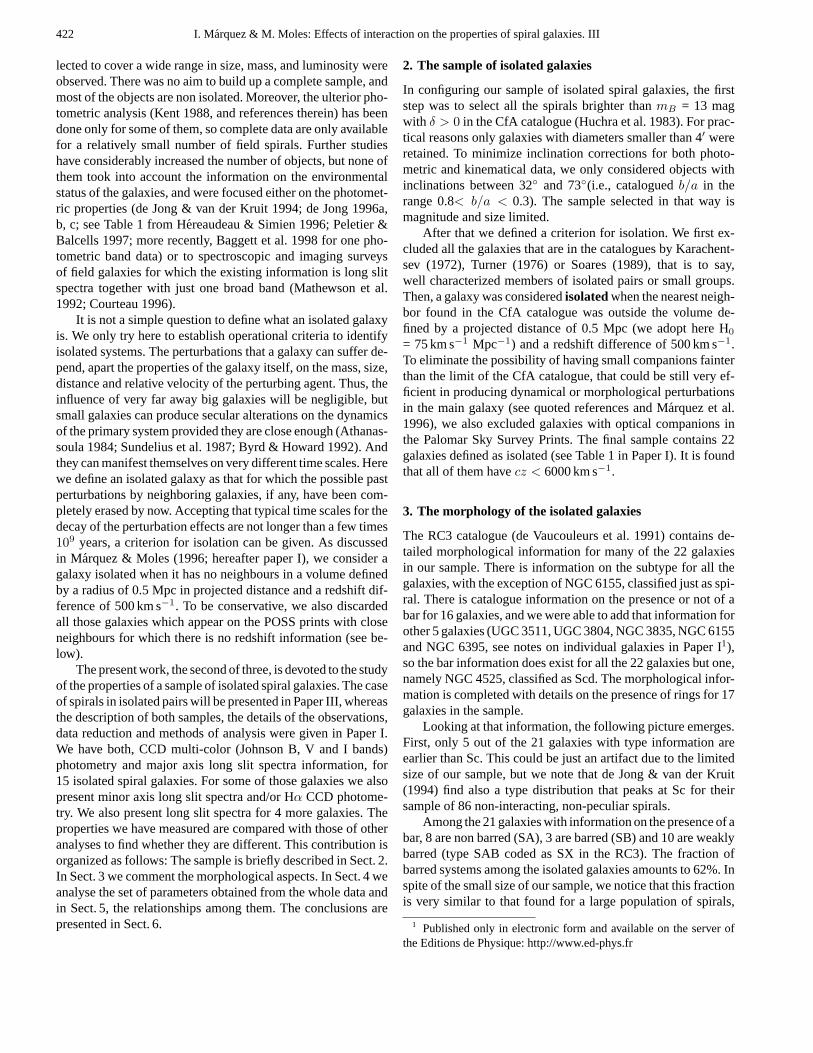
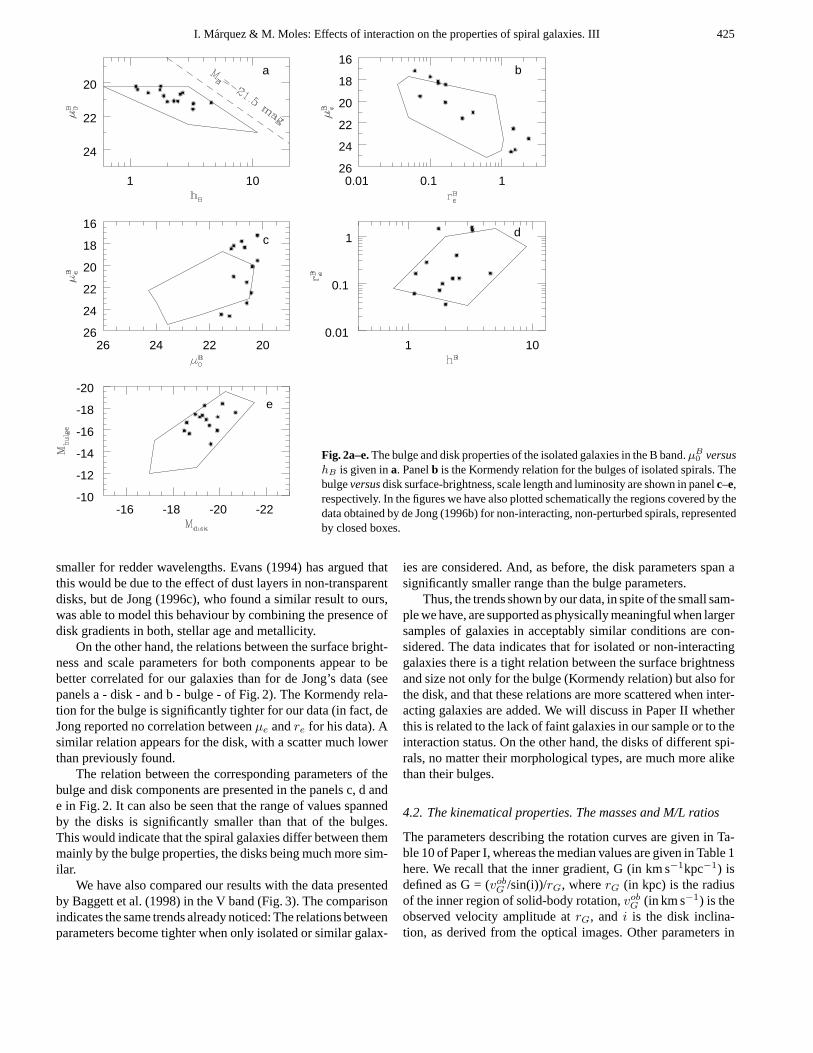
Fig. 2a–e.The bulge and disk properties of the isolated galaxies in the B band.µB0 versus
hB is given ina. Panelb is the Kormendy relation for the bulges of isolated spirals. Thebulgeversusdisk surface-brightness, scale length and luminosity are shown in panelc–e,respectively. In the figures we have also plotted schematically the regions covered by thedata obtained by de Jong (1996b) for non-interacting, non-perturbed spirals, representedby closed boxes.
smaller for redder wavelengths. Evans (1994) has argued thatthis would be due to the effect of dust layers in non-transparentdisks, but de Jong (1996c), who found a similar result to ours,was able to model this behaviour by combining the presence ofdisk gradients in both, stellar age and metallicity.
On the other hand, the relations between the surface bright-ness and scale parameters for both components appear to bebetter correlated for our galaxies than for de Jong’s data (seepanels a - disk - and b - bulge - of Fig. 2). The Kormendy rela-tion for the bulge is significantly tighter for our data (in fact, deJong reported no correlation betweenµe andre for his data). Asimilar relation appears for the disk, with a scatter much lowerthan previously found.
The relation between the corresponding parameters of thebulge and disk components are presented in the panels c, d ande in Fig. 2. It can also be seen that the range of values spannedby the disks is significantly smaller than that of the bulges.This would indicate that the spiral galaxies differ between themmainly by the bulge properties, the disks being much more sim-ilar.
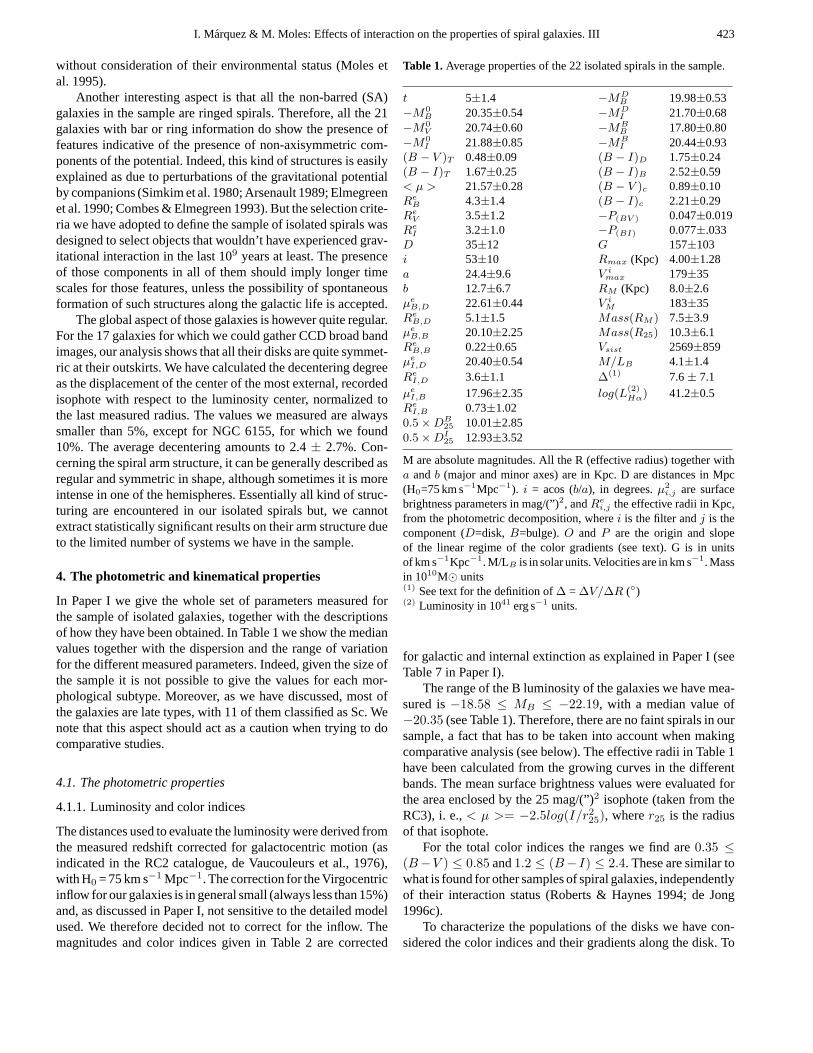
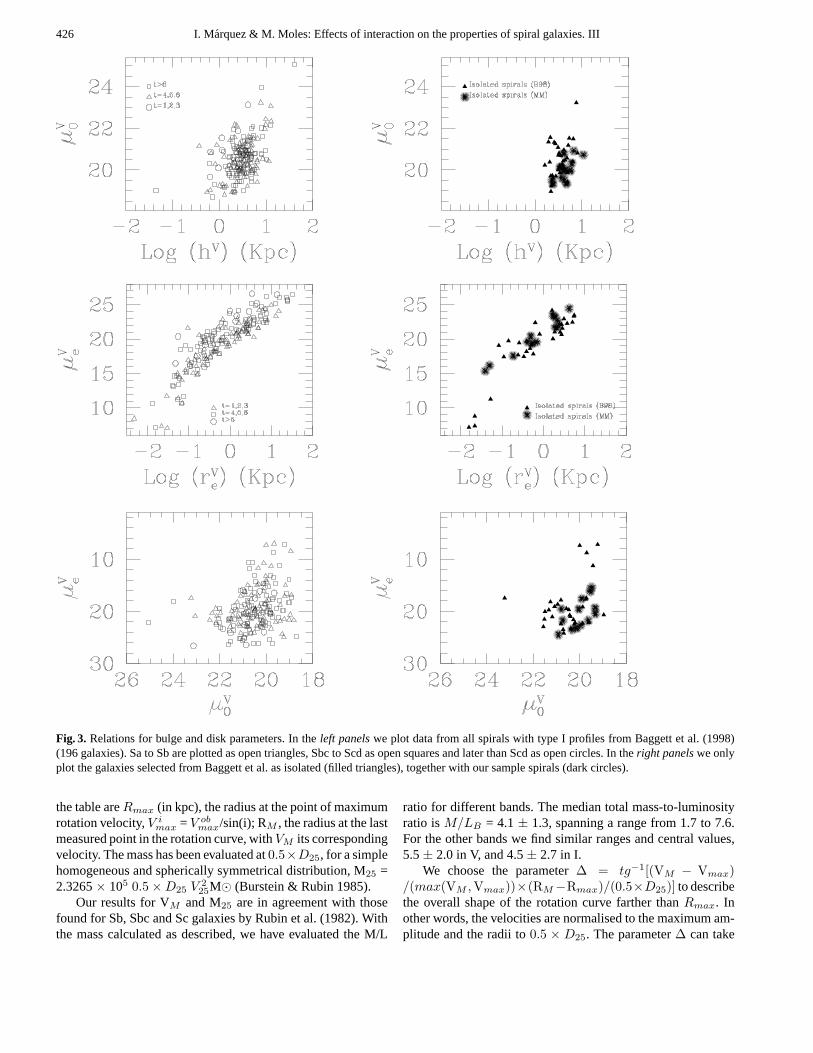
We have also compared our results with the data presentedby Baggett et al. (1998) in the V band (Fig. 3). The comparisonindicates the same trends already noticed: The relations betweenparameters become tighter when only isolated or similar galax-
ies are considered. And, as before, the disk parameters span asignificantly smaller range than the bulge parameters.
Thus, the trends shown by our data, in spite of the small sam-ple we have, are supported as physically meaningful when largersamples of galaxies in acceptably similar conditions are con-sidered. The data indicates that for isolated or non-interactinggalaxies there is a tight relation between the surface brightnessand size not only for the bulge (Kormendy relation) but also forthe disk, and that these relations are more scattered when inter-acting galaxies are added. We will discuss in Paper II whetherthis is related to the lack of faint galaxies in our sample or to theinteraction status. On the other hand, the disks of different spi-rals, no matter their morphological types, are much more alikethan their bulges.
4.2. The kinematical properties. The masses and M/L ratios
The parameters describing the rotation curves are given in Ta-ble 10 of Paper I, whereas the median values are given in Table 1here. We recall that the inner gradient, G (in km s−1kpc−1) isdefined as G = (vob
G /sin(i))/rG, whererG (in kpc) is the radiusof the inner region of solid-body rotation,vob
G (in km s−1) is theobserved velocity amplitude atrG, and i is the disk inclina-tion, as derived from the optical images. Other parameters in
426 I. Marquez & M. Moles: Effects of interaction on the properties of spiral galaxies. III
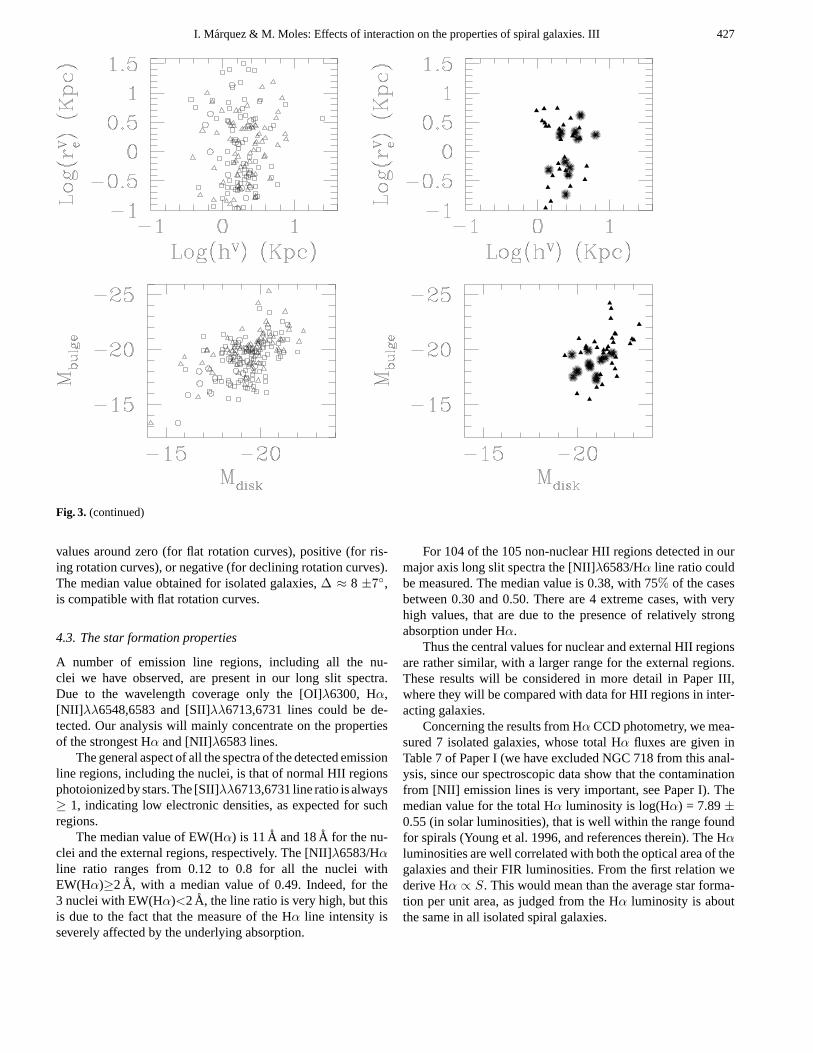
Fig. 3. Relations for bulge and disk parameters. In theleft panelswe plot data from all spirals with type I profiles from Baggett et al. (1998)(196 galaxies). Sa to Sb are plotted as open triangles, Sbc to Scd as open squares and later than Scd as open circles. In theright panelswe onlyplot the galaxies selected from Baggett et al. as isolated (filled triangles), together with our sample spirals (dark circles).
the table areRmax (in kpc), the radius at the point of maximumrotation velocity,V i
max = V obmax/sin(i); RM , the radius at the last
measured point in the rotation curve, withVM its correspondingvelocity. The mass has been evaluated at0.5×D25, for a simplehomogeneous and spherically symmetrical distribution, M25 =2.3265× 10⁵ 0.5 × D25 V 2
25M� (Burstein & Rubin 1985).Our results for VM and M25 are in agreement with those
found for Sb, Sbc and Sc galaxies by Rubin et al. (1982). Withthe mass calculated as described, we have evaluated the M/L
ratio for different bands. The median total mass-to-luminosityratio isM/LB = 4.1± 1.3, spanning a range from 1.7 to 7.6.For the other bands we find similar ranges and central values,5.5± 2.0 in V, and 4.5± 2.7 in I.
We choose the parameter∆ = tg−1[(VM − Vmax)/(max(VM ,Vmax))×(RM −Rmax)/(0.5×D25)] to describethe overall shape of the rotation curve farther thanRmax. Inother words, the velocities are normalised to the maximum am-plitude and the radii to0.5 × D25. The parameter∆ can take
I. Marquez & M. Moles: Effects of interaction on the properties of spiral galaxies. III 427
Fig. 3. (continued)
values around zero (for flat rotation curves), positive (for ris-ing rotation curves), or negative (for declining rotation curves).The median value obtained for isolated galaxies,∆ ≈ 8 ±7◦,is compatible with flat rotation curves.
4.3. The star formation properties
A number of emission line regions, including all the nu-clei we have observed, are present in our long slit spectra.Due to the wavelength coverage only the [OI]λ6300, Hα,[NII] λλ6548,6583 and [SII]λλ6713,6731 lines could be de-tected. Our analysis will mainly concentrate on the propertiesof the strongest Hα and [NII]λ6583 lines.
The general aspect of all the spectra of the detected emissionline regions, including the nuclei, is that of normal HII regionsphotoionized by stars. The [SII]λλ6713,6731 line ratio is always≥ 1, indicating low electronic densities, as expected for suchregions.
The median value of EW(Hα) is 11A and 18A for the nu-clei and the external regions, respectively. The [NII]λ6583/Hαline ratio ranges from 0.12 to 0.8 for all the nuclei withEW(Hα)≥2A, with a median value of 0.49. Indeed, for the3 nuclei with EW(Hα)<2A, the line ratio is very high, but thisis due to the fact that the measure of the Hα line intensity isseverely affected by the underlying absorption.
For 104 of the 105 non-nuclear HII regions detected in ourmajor axis long slit spectra the [NII]λ6583/Hα line ratio couldbe measured. The median value is 0.38, with 75% of the casesbetween 0.30 and 0.50. There are 4 extreme cases, with veryhigh values, that are due to the presence of relatively strongabsorption under Hα.
Thus the central values for nuclear and external HII regionsare rather similar, with a larger range for the external regions.These results will be considered in more detail in Paper III,where they will be compared with data for HII regions in inter-acting galaxies.
Concerning the results from Hα CCD photometry, we mea-sured 7 isolated galaxies, whose total Hα fluxes are given inTable 7 of Paper I (we have excluded NGC 718 from this anal-ysis, since our spectroscopic data show that the contaminationfrom [NII] emission lines is very important, see Paper I). Themedian value for the total Hα luminosity is log(Hα) = 7.89±0.55 (in solar luminosities), that is well within the range foundfor spirals (Young et al. 1996, and references therein). The Hαluminosities are well correlated with both the optical area of thegalaxies and their FIR luminosities. From the first relation wederive Hα ∝ S. This would mean than the average star forma-tion per unit area, as judged from the Hα luminosity is aboutthe same in all isolated spiral galaxies.
428 I. Marquez & M. Moles: Effects of interaction on the properties of spiral galaxies. III
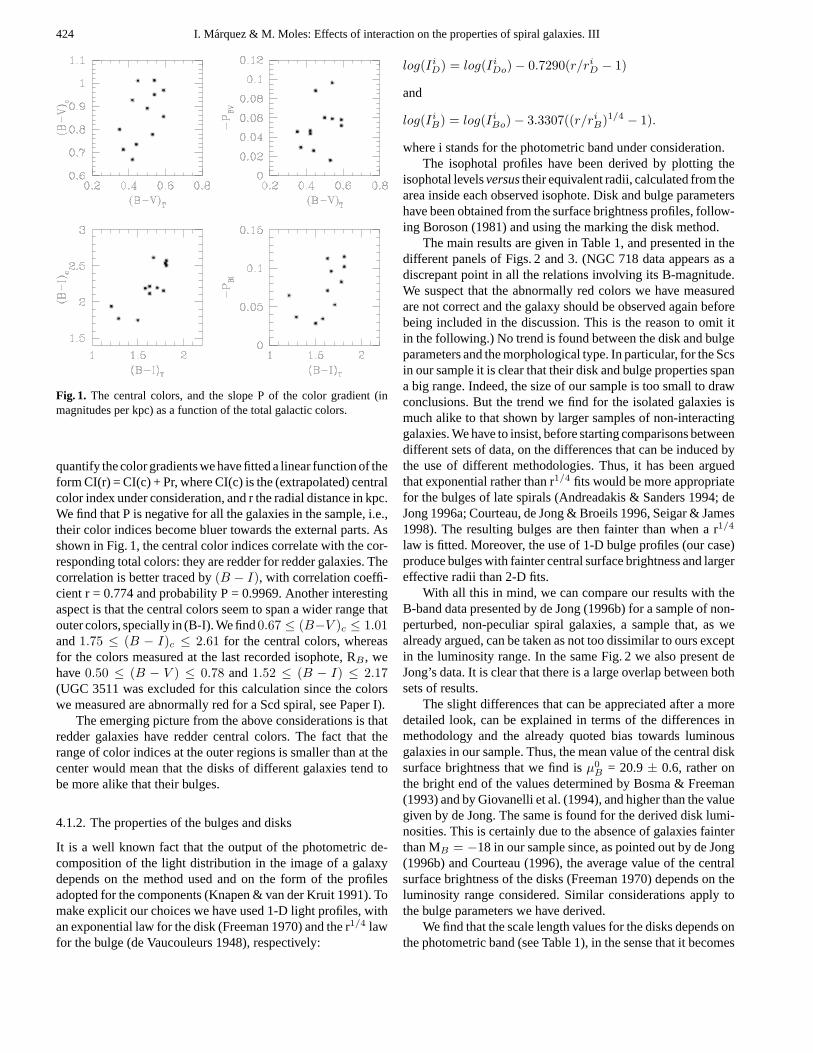
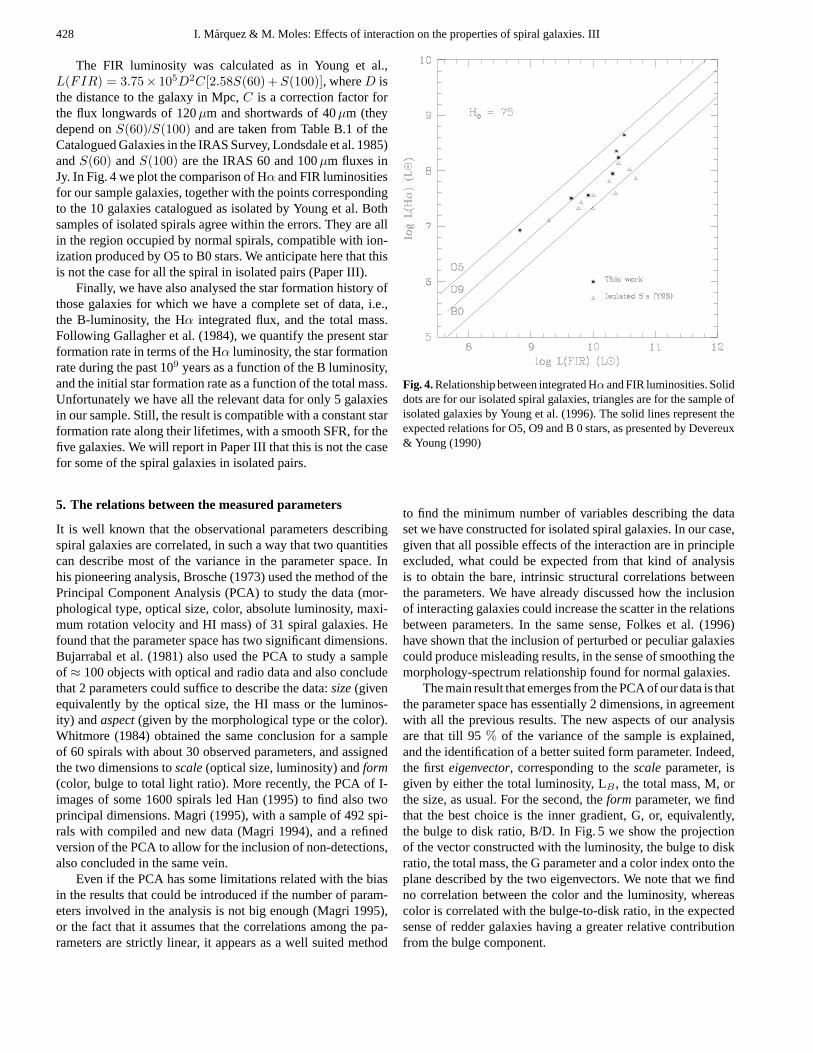
The FIR luminosity was calculated as in Young et al.,L(FIR) = 3.75 × 10⁵D2C[2.58S(60) + S(100)], whereD isthe distance to the galaxy in Mpc,C is a correction factor forthe flux longwards of 120µm and shortwards of 40µm (theydepend onS(60)/S(100) and are taken from Table B.1 of theCatalogued Galaxies in the IRAS Survey, Londsdale et al. 1985)andS(60) andS(100) are the IRAS 60 and 100µm fluxes inJy. In Fig. 4 we plot the comparison of Hα and FIR luminositiesfor our sample galaxies, together with the points correspondingto the 10 galaxies catalogued as isolated by Young et al. Bothsamples of isolated spirals agree within the errors. They are allin the region occupied by normal spirals, compatible with ion-ization produced by O5 to B0 stars. We anticipate here that thisis not the case for all the spiral in isolated pairs (Paper III).
Finally, we have also analysed the star formation history ofthose galaxies for which we have a complete set of data, i.e.,the B-luminosity, the Hα integrated flux, and the total mass.Following Gallagher et al. (1984), we quantify the present starformation rate in terms of the Hα luminosity, the star formationrate during the past 109 years as a function of the B luminosity,and the initial star formation rate as a function of the total mass.Unfortunately we have all the relevant data for only 5 galaxiesin our sample. Still, the result is compatible with a constant starformation rate along their lifetimes, with a smooth SFR, for thefive galaxies. We will report in Paper III that this is not the casefor some of the spiral galaxies in isolated pairs.
5. The relations between the measured parameters
It is well known that the observational parameters describingspiral galaxies are correlated, in such a way that two quantitiescan describe most of the variance in the parameter space. Inhis pioneering analysis, Brosche (1973) used the method of thePrincipal Component Analysis (PCA) to study the data (mor-phological type, optical size, color, absolute luminosity, maxi-mum rotation velocity and HI mass) of 31 spiral galaxies. Hefound that the parameter space has two significant dimensions.Bujarrabal et al. (1981) also used the PCA to study a sampleof ≈ 100 objects with optical and radio data and also concludethat 2 parameters could suffice to describe the data:size(givenequivalently by the optical size, the HI mass or the luminos-ity) andaspect(given by the morphological type or the color).Whitmore (1984) obtained the same conclusion for a sampleof 60 spirals with about 30 observed parameters, and assignedthe two dimensions toscale(optical size, luminosity) andform(color, bulge to total light ratio). More recently, the PCA of I-images of some 1600 spirals led Han (1995) to find also twoprincipal dimensions. Magri (1995), with a sample of 492 spi-rals with compiled and new data (Magri 1994), and a refinedversion of the PCA to allow for the inclusion of non-detections,also concluded in the same vein.
Even if the PCA has some limitations related with the biasin the results that could be introduced if the number of param-eters involved in the analysis is not big enough (Magri 1995),or the fact that it assumes that the correlations among the pa-rameters are strictly linear, it appears as a well suited method
Fig. 4.Relationship between integrated Hα and FIR luminosities. Soliddots are for our isolated spiral galaxies, triangles are for the sample ofisolated galaxies by Young et al. (1996). The solid lines represent theexpected relations for O5, O9 and B 0 stars, as presented by Devereux& Young (1990)
to find the minimum number of variables describing the dataset we have constructed for isolated spiral galaxies. In our case,given that all possible effects of the interaction are in principleexcluded, what could be expected from that kind of analysisis to obtain the bare, intrinsic structural correlations betweenthe parameters. We have already discussed how the inclusionof interacting galaxies could increase the scatter in the relationsbetween parameters. In the same sense, Folkes et al. (1996)have shown that the inclusion of perturbed or peculiar galaxiescould produce misleading results, in the sense of smoothing themorphology-spectrum relationship found for normal galaxies.
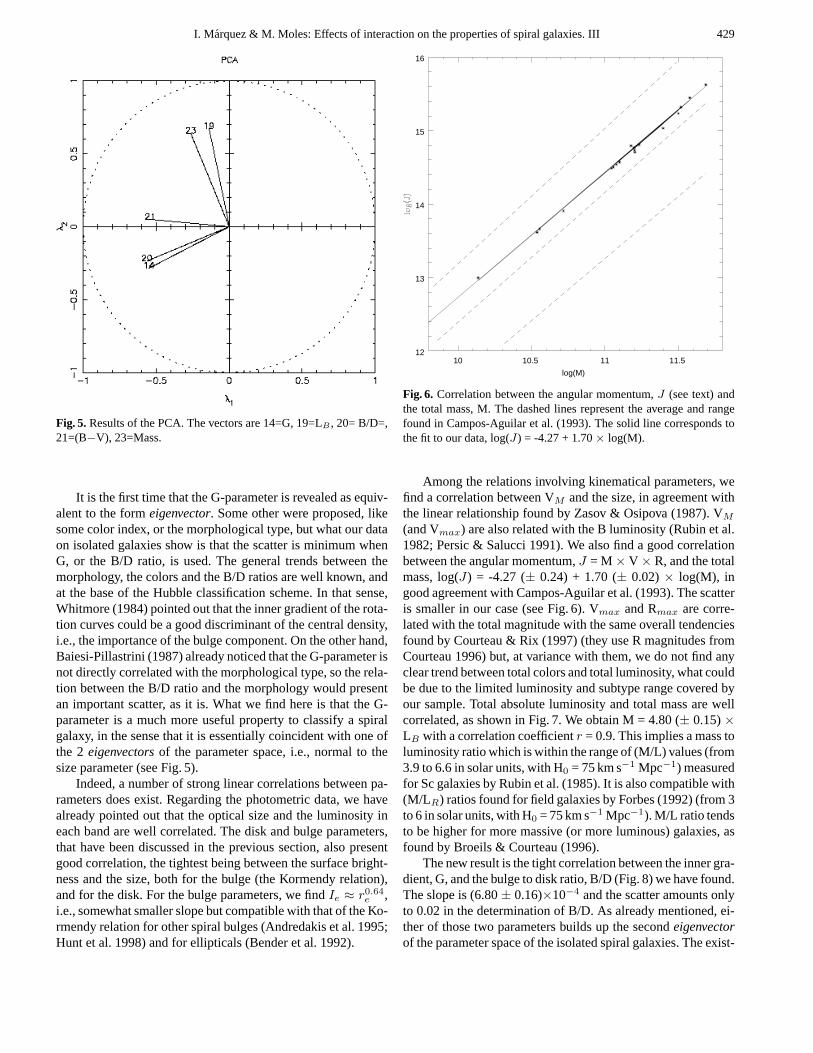
The main result that emerges from the PCA of our data is thatthe parameter space has essentially 2 dimensions, in agreementwith all the previous results. The new aspects of our analysisare that till 95% of the variance of the sample is explained,and the identification of a better suited form parameter. Indeed,the firsteigenvector, corresponding to thescaleparameter, isgiven by either the total luminosity, LB , the total mass, M, orthe size, as usual. For the second, theform parameter, we findthat the best choice is the inner gradient, G, or, equivalently,the bulge to disk ratio, B/D. In Fig. 5 we show the projectionof the vector constructed with the luminosity, the bulge to diskratio, the total mass, the G parameter and a color index onto theplane described by the two eigenvectors. We note that we findno correlation between the color and the luminosity, whereascolor is correlated with the bulge-to-disk ratio, in the expectedsense of redder galaxies having a greater relative contributionfrom the bulge component.
I. Marquez & M. Moles: Effects of interaction on the properties of spiral galaxies. III 429
Fig. 5. Results of the PCA. The vectors are 14=G, 19=LB , 20= B/D=,21=(B−V), 23=Mass.
It is the first time that the G-parameter is revealed as equiv-alent to the formeigenvector. Some other were proposed, likesome color index, or the morphological type, but what our dataon isolated galaxies show is that the scatter is minimum whenG, or the B/D ratio, is used. The general trends between themorphology, the colors and the B/D ratios are well known, andat the base of the Hubble classification scheme. In that sense,Whitmore (1984) pointed out that the inner gradient of the rota-tion curves could be a good discriminant of the central density,i.e., the importance of the bulge component. On the other hand,Baiesi-Pillastrini (1987) already noticed that the G-parameter isnot directly correlated with the morphological type, so the rela-tion between the B/D ratio and the morphology would presentan important scatter, as it is. What we find here is that the G-parameter is a much more useful property to classify a spiralgalaxy, in the sense that it is essentially coincident with one ofthe 2 eigenvectorsof the parameter space, i.e., normal to thesize parameter (see Fig. 5).
Indeed, a number of strong linear correlations between pa-rameters does exist. Regarding the photometric data, we havealready pointed out that the optical size and the luminosity ineach band are well correlated. The disk and bulge parameters,that have been discussed in the previous section, also presentgood correlation, the tightest being between the surface bright-ness and the size, both for the bulge (the Kormendy relation),and for the disk. For the bulge parameters, we findIe ≈ r0.64
e ,i.e., somewhat smaller slope but compatible with that of the Ko-rmendy relation for other spiral bulges (Andredakis et al. 1995;Hunt et al. 1998) and for ellipticals (Bender et al. 1992).
10 10.5 11 11.512
13
14
15
16
log(M)
Fig. 6. Correlation between the angular momentum,J (see text) andthe total mass, M. The dashed lines represent the average and rangefound in Campos-Aguilar et al. (1993). The solid line corresponds tothe fit to our data, log(J) = -4.27 + 1.70× log(M).
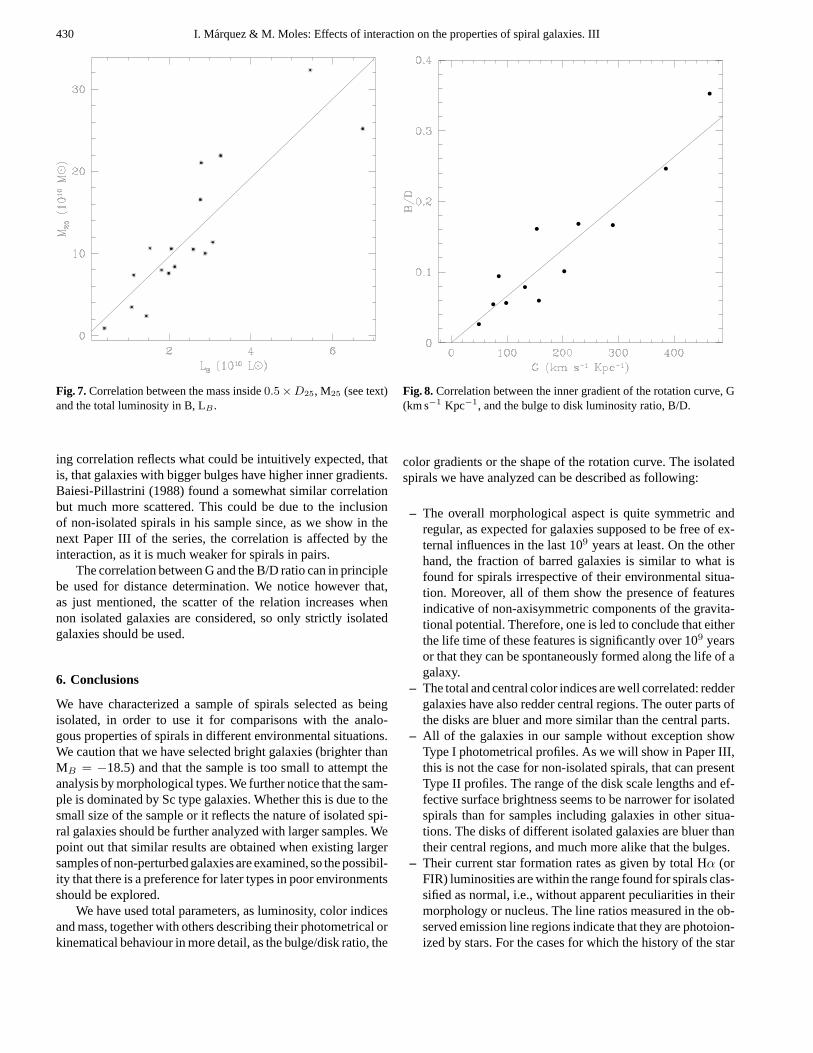
Among the relations involving kinematical parameters, wefind a correlation between VM and the size, in agreement withthe linear relationship found by Zasov & Osipova (1987). VM
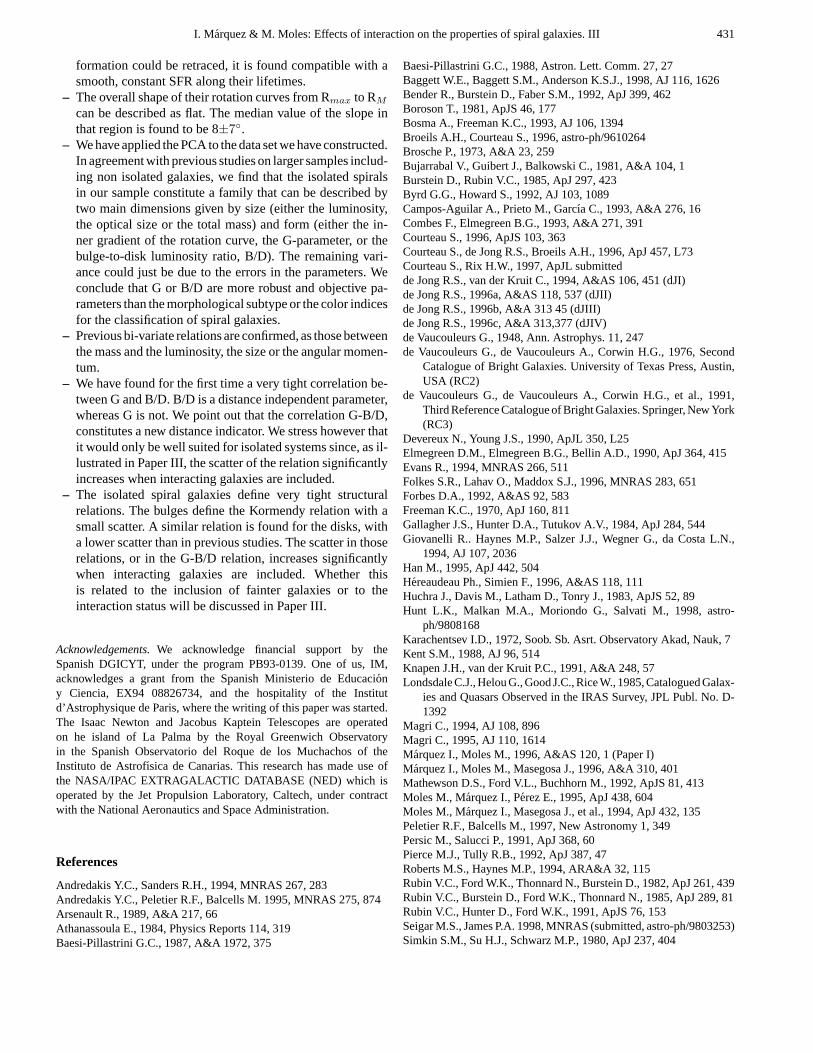
(and Vmax) are also related with the B luminosity (Rubin et al.1982; Persic & Salucci 1991). We also find a good correlationbetween the angular momentum,J = M × V × R, and the totalmass, log(J) = -4.27 (± 0.24) + 1.70 (± 0.02) × log(M), ingood agreement with Campos-Aguilar et al. (1993). The scatteris smaller in our case (see Fig. 6). Vmax and Rmax are corre-lated with the total magnitude with the same overall tendenciesfound by Courteau & Rix (1997) (they use R magnitudes fromCourteau 1996) but, at variance with them, we do not find anyclear trend between total colors and total luminosity, what couldbe due to the limited luminosity and subtype range covered byour sample. Total absolute luminosity and total mass are wellcorrelated, as shown in Fig. 7. We obtain M = 4.80 (± 0.15)×LB with a correlation coefficientr = 0.9. This implies a mass toluminosity ratio which is within the range of (M/L) values (from3.9 to 6.6 in solar units, with H0 = 75 km s−1 Mpc−1) measuredfor Sc galaxies by Rubin et al. (1985). It is also compatible with(M/LR) ratios found for field galaxies by Forbes (1992) (from 3to 6 in solar units, with H0 = 75 km s−1 Mpc−1). M/L ratio tendsto be higher for more massive (or more luminous) galaxies, asfound by Broeils & Courteau (1996).
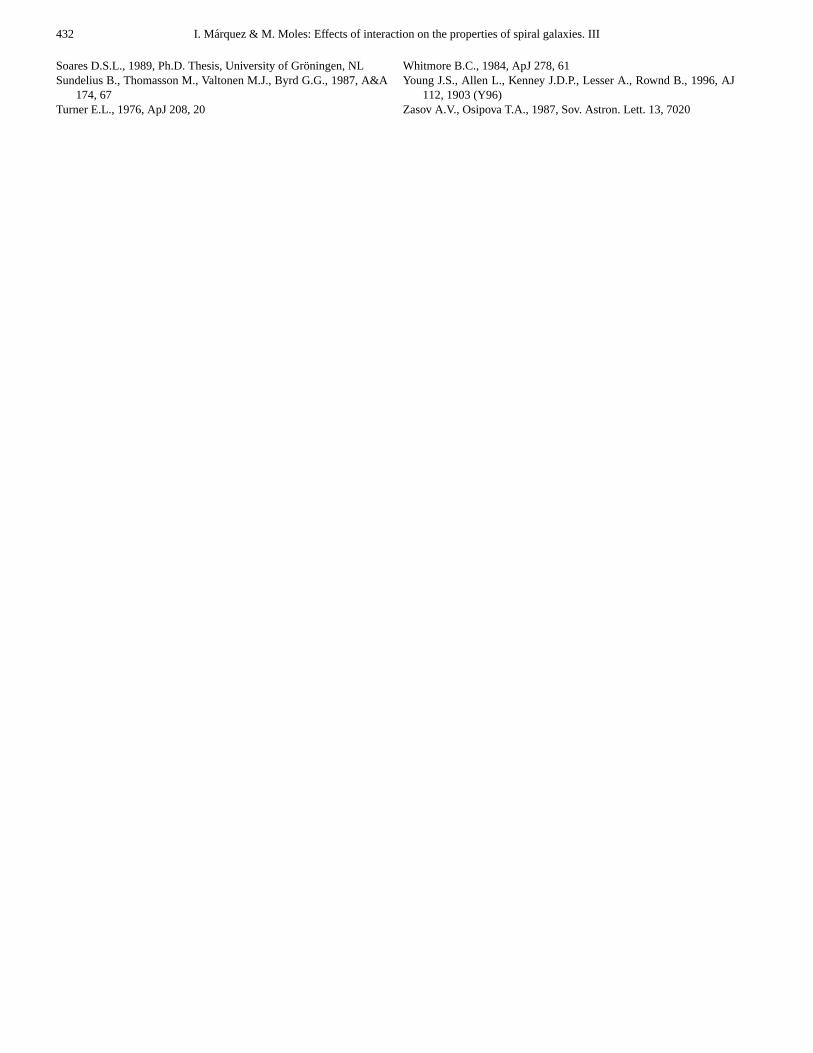
The new result is the tight correlation between the inner gra-dient, G, and the bulge to disk ratio, B/D (Fig. 8) we have found.The slope is (6.80± 0.16)×10−4 and the scatter amounts onlyto 0.02 in the determination of B/D. As already mentioned, ei-ther of those two parameters builds up the secondeigenvectorof the parameter space of the isolated spiral galaxies. The exist-
430 I. Marquez & M. Moles: Effects of interaction on the properties of spiral galaxies. III
Fig. 7.Correlation between the mass inside0.5 × D25, M25 (see text)and the total luminosity in B, LB .
ing correlation reflects what could be intuitively expected, thatis, that galaxies with bigger bulges have higher inner gradients.Baiesi-Pillastrini (1988) found a somewhat similar correlationbut much more scattered. This could be due to the inclusionof non-isolated spirals in his sample since, as we show in thenext Paper III of the series, the correlation is affected by theinteraction, as it is much weaker for spirals in pairs.
The correlation between G and the B/D ratio can in principlebe used for distance determination. We notice however that,as just mentioned, the scatter of the relation increases whennon isolated galaxies are considered, so only strictly isolatedgalaxies should be used.
6. Conclusions
We have characterized a sample of spirals selected as beingisolated, in order to use it for comparisons with the analo-gous properties of spirals in different environmental situations.We caution that we have selected bright galaxies (brighter thanMB = −18.5) and that the sample is too small to attempt theanalysis by morphological types. We further notice that the sam-ple is dominated by Sc type galaxies. Whether this is due to thesmall size of the sample or it reflects the nature of isolated spi-ral galaxies should be further analyzed with larger samples. Wepoint out that similar results are obtained when existing largersamples of non-perturbed galaxies are examined, so the possibil-ity that there is a preference for later types in poor environmentsshould be explored.
We have used total parameters, as luminosity, color indicesand mass, together with others describing their photometrical orkinematical behaviour in more detail, as the bulge/disk ratio, the
Fig. 8. Correlation between the inner gradient of the rotation curve, G(km s−1 Kpc−1, and the bulge to disk luminosity ratio, B/D.
color gradients or the shape of the rotation curve. The isolatedspirals we have analyzed can be described as following:
– The overall morphological aspect is quite symmetric andregular, as expected for galaxies supposed to be free of ex-ternal influences in the last 109 years at least. On the otherhand, the fraction of barred galaxies is similar to what isfound for spirals irrespective of their environmental situa-tion. Moreover, all of them show the presence of featuresindicative of non-axisymmetric components of the gravita-tional potential. Therefore, one is led to conclude that eitherthe life time of these features is significantly over 109 yearsor that they can be spontaneously formed along the life of agalaxy.
– The total and central color indices are well correlated: reddergalaxies have also redder central regions. The outer parts ofthe disks are bluer and more similar than the central parts.
– All of the galaxies in our sample without exception showType I photometrical profiles. As we will show in Paper III,this is not the case for non-isolated spirals, that can presentType II profiles. The range of the disk scale lengths and ef-fective surface brightness seems to be narrower for isolatedspirals than for samples including galaxies in other situa-tions. The disks of different isolated galaxies are bluer thantheir central regions, and much more alike that the bulges.
– Their current star formation rates as given by total Hα (orFIR) luminosities are within the range found for spirals clas-sified as normal, i.e., without apparent peculiarities in theirmorphology or nucleus. The line ratios measured in the ob-served emission line regions indicate that they are photoion-ized by stars. For the cases for which the history of the star
I. Marquez & M. Moles: Effects of interaction on the properties of spiral galaxies. III 431
formation could be retraced, it is found compatible with asmooth, constant SFR along their lifetimes.
– The overall shape of their rotation curves from Rmax to RM
can be described as flat. The median value of the slope inthat region is found to be 8±7◦.
– We have applied the PCA to the data set we have constructed.In agreement with previous studies on larger samples includ-ing non isolated galaxies, we find that the isolated spiralsin our sample constitute a family that can be described bytwo main dimensions given by size (either the luminosity,the optical size or the total mass) and form (either the in-ner gradient of the rotation curve, the G-parameter, or thebulge-to-disk luminosity ratio, B/D). The remaining vari-ance could just be due to the errors in the parameters. Weconclude that G or B/D are more robust and objective pa-rameters than the morphological subtype or the color indicesfor the classification of spiral galaxies.
– Previous bi-variate relations are confirmed, as those betweenthe mass and the luminosity, the size or the angular momen-tum.
– We have found for the first time a very tight correlation be-tween G and B/D. B/D is a distance independent parameter,whereas G is not. We point out that the correlation G-B/D,constitutes a new distance indicator. We stress however thatit would only be well suited for isolated systems since, as il-lustrated in Paper III, the scatter of the relation significantlyincreases when interacting galaxies are included.
– The isolated spiral galaxies define very tight structuralrelations. The bulges define the Kormendy relation with asmall scatter. A similar relation is found for the disks, witha lower scatter than in previous studies. The scatter in thoserelations, or in the G-B/D relation, increases significantlywhen interacting galaxies are included. Whether thisis related to the inclusion of fainter galaxies or to theinteraction status will be discussed in Paper III.
Acknowledgements.We acknowledge financial support by theSpanish DGICYT, under the program PB93-0139. One of us, IM,acknowledges a grant from the Spanish Ministerio de Educaciony Ciencia, EX94 08826734, and the hospitality of the Institutd’Astrophysique de Paris, where the writing of this paper was started.The Isaac Newton and Jacobus Kaptein Telescopes are operatedon he island of La Palma by the Royal Greenwich Observatoryin the Spanish Observatorio del Roque de los Muchachos of theInstituto de Astrofısica de Canarias. This research has made use ofthe NASA/IPAC EXTRAGALACTIC DATABASE (NED) which isoperated by the Jet Propulsion Laboratory, Caltech, under contractwith the National Aeronautics and Space Administration.