Page 1
ASVCP QALS TEa Hematology Version 1.0 (final approved) December 2017
Page 1 of 34
ASVCP Guidelines: Allowable Total Error
Hematology
Version 1.0 (December 2017)
Mary B. Nabity1, Kendal E. Harr2, Melinda S. Camus3, Bente Flatland4, Linda M. Vap5
1Department of Veterinary Pathobiology, Texas A&M University, College Station, TX; 2Urika,
LLC, Mukilteo, WA; 3Department of Pathology, University of Georgia, Athens, GA; 4Department of Biomedical and Diagnostic Sciences, College of Veterinary Medicine, University
of Tennessee, Knoxville, TN; 5Department of Microbiology, Immunology, and Pathology,
Colorado State University, Fort Collins, CO.
Developed by the American Society for Veterinary Clinical Pathology (ASVCP) Quality
Assurance and Laboratory Standards (QALS) Committee
If citing this document, the following format is suggested: American Society for Veterinary
Clinical Pathology (ASVCP). ASVCP Guidelines: Allowable Total Error Hematology, Version
1. 2017. Available at http://asvcp.org/pubs/qas/index.cfm Accessed January 9, 2018.
Page 2
ASVCP QALS TEa Hematology Version 1.0 (final approved) December 2017
Page 2 of 34
TABLE of CONTENTS
1 Introduction .................................................................................................................................. 3
2 Scope ............................................................................................................................................ 3
3 Abbreviations and definitions ...................................................................................................... 3
4 Allowable total error (TEa) .......................................................................................................... 8
4.1 Introduction to TEa .............................................................................................................................................. 8
4.2 Special considerations when generating hematology TEa.................................................................................. 9 4.2.1 Quality control material (QCM) ................................................................................................................... 9 4.2.2 WBC differential .......................................................................................................................................... 9 4.2.3 Platelets ..................................................................................................................................................... 10 4.2.4 Reticulocytes.............................................................................................................................................. 10
4.3 Instrument performance evaluation using TEa ................................................................................................. 11 4.3.1 Quality Control Material (QCM) ................................................................................................................ 11 4.3.2 Assessing Imprecision ................................................................................................................................ 13 4.3.3 Assessing Bias ............................................................................................................................................ 13 4.3.4 Instrument performance evaluation steps................................................................................................ 14 4.3.5 When TEobs is greater than TEa................................................................................................................ 15
5 TEa recommendations ............................................................................................................... 16
6 TEa vs. biological variation-based quality specifications .......................................................... 16
7 References .................................................................................................................................. 17
8 Web resources ............................................................................................................................ 21
9 Methods validation subcommittee advisors ............................................................................... 21
10 Contributing Laboratories ........................................................................................................ 22
11 Acknowledgments.................................................................................................................... 22
12 Tables ....................................................................................................................................... 23
13 Appendices ............................................................................................................................... 27
13.1 Appendix A. Derivation of hematology TEa recommendations ...................................................................... 27 13.1.1 Selection of measurands ......................................................................................................................... 27 13.1.2 Clinician input .......................................................................................................................................... 27 13.1.3 TEa based on assessment of instrument performance ........................................................................... 29 13.1.4 Determination of recommended TEa. ..................................................................................................... 30
13.2 Appendix B. External quality assurance/proficiency testing programs.......................................................... 33
13.3 Appendix C. Allowable total error worksheet ................................................................................................. 34
Page 3
ASVCP QALS TEa Hematology Version 1.0 (final approved) December 2017
Page 3 of 34
1 Introduction
Analytical quality requirements (a.k.a. quality specifications) are pre-determined
benchmarks used to judge analytical performance of laboratory instruments or methods.1
Quality requirements may vary by type of laboratory, measurand concentration (e.g., low vs.
high) and species tested. Quality requirements can be derived from several sources, including
governmental regulatory requirements, expert opinion, biological variation data, and current
instrument performance. Regardless of source, it is essential that quality requirements be
clinically relevant for medically important measurand concentrations and be realistic for
available laboratory technology.2
Allowable total error (TEa) defines a quantitative goal combining imprecision (random
error) and inaccuracy (systematic error, or bias) to determine acceptable variation in a single
measurement procedure without interfering with the clinical interpretation of patient data.
2 Scope
Objectives of this guideline are to provide TEa recommendations for hematology
measurands routinely assayed in veterinary practice and to provide an overview of how these
recommendations were derived. A worksheet for determining whether instrument performance
meets these recommendations is also included. Similar to biochemistry testing, TEa
recommendations for hematology testing in veterinary medicine are needed to facilitate
instrument performance evaluation, method comparison, and quality control validation. Intended
audiences include, but are not limited to, reference laboratories, in-clinic laboratories, and animal
health diagnostic companies supplying hematology instruments to the veterinary market. TEa is
proposed here for those measurands in common clinical use and likely to be evaluated with
routine quality control procedures. Furthermore, the TEa recommendations were based on
clinician input regarding dogs, cats, and horses, along with data generated from quality control
material (QCM) and dog specimens using automated methods. This guideline is thus not all-
inclusive but presents TEa recommendations considered to be suitable for the current instruments
and methods commonly used for veterinary hematology measurands. While blood from non-
mammalian species was not tested, the recommendations could serve as a baseline for
laboratories evaluating blood from non-mammalian animals.
3 Abbreviations and definitions
Accuracy – Closeness of agreement between the results of a measurement and the true
concentration of the measurand. Accuracy is the opposite of inaccuracy or bias.3
ASVCP –American Society for Veterinary Clinical Pathology
Bias (a.k.a. inaccuracy) – Total systematic error, which includes constant and proportional bias.
Bias is the difference between the test instrument’s measured result and the true value (e.g., as
measured by a reference method or as defined by a known standard). The term bias in difference
Page 4
ASVCP QALS TEa Hematology Version 1.0 (final approved) December 2017
Page 4 of 34
plot analysis (expressed in measurand units) equals the difference between the values of the two
methods being compared or the average of all the differences between the paired sample values.
Bias may also be expressed as a percentage according to the formula:
𝐵𝑖𝑎𝑠% = 𝑀𝑒𝑎𝑛𝑡𝑎𝑟𝑔𝑒𝑡 − 𝑀𝑒𝑎𝑛𝑚𝑒𝑎𝑠𝑢𝑟𝑒𝑑
𝑀𝑒𝑎𝑛𝑡𝑎𝑟𝑔𝑒𝑡 × 100
Bias, constant – When the degree of systematic error remains the same over the range of
measurand concentrations (i.e., results of one method are consistently above or below another
method and roughly by the same amount, regardless of measurand concentration).3
Bias, proportional – When the magnitude of systematic error changes as the measurand
concentration changes.3
Biological variation – Expected physiologic fluctuations of a measurand, which can include
variation within an individual or between individuals.4
CLIA –Clinical Laboratory Improvement Amendments.
CV (coefficient of variation) – A measure of imprecision (random error), biologic variation, or
other variability in a population; mathematically, CV is standard deviation (SD) divided by the
mean and expressed as a percentage.3
Comparability Testing – A quality assurance procedure in which measurement results from two
or more instruments or methods are compared to each other for purposes of analytical
performance assessment. Comparability testing can be a component of formal EQA/PT programs
or can be carried out independently within a laboratory or network of laboratories.5 Total
allowable error is one tool that is used in comparability testing and aids in assessment of whether
results from different instruments can be used interchangeably without causing clinical error.3
Decision Threshold – Clinical or medical decision limit (i.e., numerical value) at which
important clinical decisions regarding testing or treatment are made for a particular measurand.
External Quality Assessment (external quality assurance (EQA) or proficiency testing
(PT)) – Interlaboratory comparisons and other performance evaluations that determine total
testing performance and may extend throughout all phases of the testing cycle, including
interpretation of results. These include peer interlaboratory comparisons in which multiple
laboratories measure the same specimen using the same test methods, and in some cases the
same reagents and controls, as well as comparison with known values of reference materials.6
Page 5
ASVCP QALS TEa Hematology Version 1.0 (final approved) December 2017
Page 5 of 34
EQA/PT specimen, testing item, test material, or check specimen panel - A specimen
containing measurands of undisclosed concentrations or compositions sent to a participating
laboratory to assess the laboratory’s testing competency.6
Imprecision (random error or random variation) – Lack of agreement between independent,
repeated results obtained from the same specimen under specified conditions.7 It is represented
by the standard deviation (in units of the test) or coefficient of variation (in units of percent).3
Instrument performance study – A study performed to characterize an instrument’s analytical
performance capability, represented by bias (inaccuracy) and imprecision (random error). Data
from an instrument performance study can be used to calculate observed total error (TEobs).3
Mean – Average of values measured, Mean = (x1 + x2 + …. + xn)/n
Measurand - A particular quantity subject to measurement under specified conditions (e.g. the
enzymatic activity of alkaline phosphatase at 37°C).6
Peer group – Used for comparison of quality requirements and defined by the same instrument
and/or method as that used by the participating laboratory or testing site.
Precision – Closeness of agreement between independent, repeated results obtained from the
same specimen under specific conditions. These may be derived in the same day (repeatability
study) or on different days (within laboratory precision).7 Note: The definition of precision has
become more complex in recent years and is frequently being modified. Readers are referred to
other sources for further definition.8
Proficiency testing (PT) – One measure of laboratory competence derived by means of an
interlaboratory comparison; implied in this definition is that participating laboratories are using
the same test methods, reagents and controls. PT is often used synonymously with EQA but may
specifically refer to testing performed in compliance with state or federal regulations.9
Reference Interval – An interval that contains all the possible values between and including an
upper and lower limit. Reference limits are defined such that the reference interval contains a
specified proportion of values from a well-defined, typically clinically healthy reference
population. Reference interval is preferred over the term reference range.10
Repeatability – Precision of analysis when repeated using the same operator, measurement
procedure, equipment, time, and laboratory.7
Page 6
ASVCP QALS TEa Hematology Version 1.0 (final approved) December 2017
Page 6 of 34
Repeat patient testing (RPT) – Repeat testing of individual patient specimens under specified
conditions that is used as a statistical quality control method. RPT exploits the fact that
specimen deterioration under defined conditions (fixed time interval, storage conditions, etc.)
causes an expected degree of variation in results; any variation in results exceeding this threshold
may indicate a problem with the test system.11,12
QA (quality assurance or assessment) – Laboratory procedures that monitor and improve
laboratory performance and seek to minimize pre‐analytical, analytical, and post‐analytical
error. QA includes many nonstatistical procedures (e.g. personnel training, use of standard
operating procedures, etc.)13
QALS (Quality Assurance and Laboratory Standards Committee of the ASVCP) – The
ASVCP committee charged with encouraging and promoting the establishment of standards for
the performance of laboratory procedures on animal specimens.
QC (quality control) – Procedures that monitor analytical performance of instruments and
detect analytical error.13
QCM (quality control material) – A test material intended by its manufacturer to be used for
QC of laboratory testing. Measurement of QCM monitors the entire test system (operator,
reagents, and instrument analytical function). QCM may be used to carry out an instrument
performance study or to monitor routine analytical performance. “Assayed QCM” is QCM that
has been measured by the manufacturer, which then provides target means, ranges, standard
deviation and CV for that QCM for specific instruments or methods.13
Quality Goal Index – A numerical index that reflects whether imprecision, bias, or both are
contributing to an observed analytical error. QGI may be calculated according to the formula14
𝑄𝐺𝐼 = %𝐵𝑖𝑎𝑠
𝐶𝑉
Quality Requirement (quality specification) – A benchmark to which the analytical
performance of a laboratory instrument is compared. Also see allowable total error (TEa).3
Standard Deviation (SD) – A measure of variability or diversity associated with random error
or imprecision. SD demonstrates the variation or dispersion from the mean (average or other
expected value) during repeated measures. A small SD indicates that data points tend to be very
close to the mean, whereas a large SD indicates that data points are spread over a wide range of
values. SD is the square root of a dataset’s variance.3
Page 7
ASVCP QALS TEa Hematology Version 1.0 (final approved) December 2017
Page 7 of 34
TE (total error, total analytical error) – The sum of random error (imprecision) and systematic
error (bias or inaccuracy). This term may also incorporate other sources of error (e.g., pre‐
analytical variation, biologic variation, and other factors) that contribute to the variation seen in
patient results. TE may be expressed in measurand units or as a percentage.3
TEa (allowable or desirable total error) – A quality requirement that sets a limit for combined
imprecision (random error) and bias (inaccuracy, or systematic error) that are tolerable in a
single measurement or single test result to ensure clinical usefulness.3 Recommendations for
hematology TEa are found in section 5.
TEobs (observed or calculated total error) – The sum of measured random error (imprecision)
and systematic error (bias/inaccuracy) that can be calculated from instrument performance data
according to the formula as defined in this guideline
TEobs = 2CV + bias(%) or 2SD + bias (measurand units)
TEobs must be calculated for each measurand, is unique to an individual instrument/method,
and may vary with measurand concentration or activity. Absolute values for bias should be used
in these formulae. The constant 2 is rounded from the bi-directional Z score of 1.96 (standard
normal deviate).15
Value (of a quantity) – Magnitude of a particular quantity generally expressed as a unit of
measurement, which may be multiplied by a number (e.g. 3.5 X 10³ cells/μL, 5 U/L).11 It can be
used synonymously with result.16
Variable – A quantity of interest, whose value or magnitude fluctuates or changes (e.g.
creatinine).17
Z score – A unitless number that is a coefficient indicating the number of standard deviations
from the mean. The z score (a.k.a. standard score, z value) is arbitrary in TEa and dependent
upon the stringency desired for the test. The ASVCP consensus-approved TEa guidelines and
CLIA documentation assign the z score of 2 for calculation of TEa in laboratory medicine.18
Page 8
ASVCP QALS TEa Hematology Version 1.0 (final approved) December 2017
Page 8 of 34
4 Allowable total error (TEa)
4.1 Introduction to TEa
The concept of total error was first introduced in 1974.18,19 Analytical imprecision
(random error) and bias (systematic error) were combined into a single measure representing the
uncertainty of a test result. The ideal situation is to have a highly accurate and precise
measurement, i.e. low bias and low coefficient of variation (CV) or standard deviation (SD),
respectively.
A commonly used quality requirement derived from the total error concept is allowable
total error (TEa), which is derived from the amount of allowable variation around medically
important measurand concentrations or decision thresholds. This quality requirement has been
found to be cost-effective in human medicine because stringency of quality control (QC) is
specified by the accuracy and precision needed to make clinical decisions rather than the highest
accuracy and precision possible. TEa expresses the largest amount of error (combined
imprecision and bias) that is tolerable for a given laboratory measurement (i.e., the maximum
allowable error that does not interfere with medical interpretation of the patient’s test result). As
with TEa for veterinary biochemistry testing, TEa for hematology measurands (Table 1 and
Table 2) was established by the Quality Assurance and Laboratory Standards (QALS) committee
based on a combination of clinical decision-making thresholds and current reference laboratory
instrument performance, as detailed in Appendix A. TEa can be used when assessing instrument
performance.
There are currently several manuscripts that report the use of TEa in veterinary laboratory
medicine, as well as a review article outlining the use of TEa for in-clinic instrument
performance evaluation.20-26 Additionally, the American Society for Veterinary Clinical
Pathology (ASVCP) published TEa recommendations for biochemistry testing in veterinary
medicine.3 TEa can be used to aid instrument selection if manufacturer’s claims for instrument
performance are available or if several instruments are being evaluated. TEa can also be
compared to an instrument’s calculated or observed total error (TEobs) to help determine whether
that instrument’s analytical performance is acceptable. If analytical performance is deemed
acceptable, TEa can further be used during quality control (QC) validation of that instrument.
Finally, TEa can be used to guide comparison of test results across laboratories and clinics using
the same or different analytical methods. For example, TEa can be used to help interpret results
from external quality assurance or proficiency testing (EQA/PT) programs or to help interpret
results of comparability testing, where a reference laboratory is used to check in-clinic or other
laboratory results.27 Additional information about TEa can be found in CLSI- C54-A.28 Factors
impacting TEa include species, measurand concentration, clinical use of patient results, and type
of laboratory. In other words, TEa for the same measurand may vary considering these factors,
with examples listed below:
Species Dogs, cats, horses, birds, etc.
Page 9
ASVCP QALS TEa Hematology Version 1.0 (final approved) December 2017
Page 9 of 34
Measurand concentration High, within reference interval, and low measurand
concentrations
Clinical use of patient
results
Different medical decision thresholds
Laboratory Reference laboratories, veterinary practices, toxicology
laboratories, and other industry laboratories, all of which
may serve different species and patient populations and
may use different analytical methods.
While the above factors are all recognized to influence TEa, the recommendations proposed in
this guideline were largely based on clinician recommendations for dogs, cats, and horses as well
as instrument performance based on quality control material (QCM) and dog specimens.
4.2 Special considerations when generating hematology TEa
Below are considerations specific to hematology TEa
4.2.1 Quality control material (QCM)
The QCM standardly used for hematology instruments are optimized for the
analysis of human specimens. Companion animal, species-specific, commercially
available QCM is not known to exist, and TEobs may vary for different measurands in
the various species. In particular, it would be expected that TEobs using human QCM
would be lower than that based on species-specific material, as seen in a recent study.25
Additionally, not every CBC measurand has a target value provided by the manufacturer
(e.g., MCHC). Therefore, use of whole blood from a species of interest is required for
complete evaluation of a hematology instrument. A new concept, repeat patient testing
(RPT), may overcome some of the disadvantages of commercial quality control
materials, but has not yet been investigated thoroughly for use in veterinary
laboratories.12,29 Use of patient specimens for quality control provides a matrix of
veterinary origin, and specimens can be manipulated to produce results that fall at or
close to decision thresholds and provide a less expensive option compared with
commercially available QCM (see section 4.3.1.1).
4.2.2 WBC differential
The WBC differential may be generated using automated techniques, manual
techniques, or a combination of the two. Making TEa recommendations for WBC
differential counting is challenging due to differences in analytical performance of
reference laboratory and in-clinic instruments and the inherent high imprecision of
manual differential counting (in cases where automated differential counts are inaccurate
due to morphologic alterations and a manual count is reported).25 The WBC differential
(whether automated or manual) is likely to demonstrate higher TEobs than other
Page 10
ASVCP QALS TEa Hematology Version 1.0 (final approved) December 2017
Page 10 of 34
hematology measurands, particularly for enumeration of eosinophils and monocytes.25
TEa recommendations for neutrophils and lymphocytes (Table 2) should be achievable
by point of care hematology analyzers, although Cook et al found performance of several
analyzers to be highly variable.30 For any instrument (reference laboratory or in-clinic
laboratory), before an automated differential is accepted for any patient, review of a good
quality blood smear is recommended to verify automated findings.31 If discrepancies are
noted, or any abnormalities in WBC morphology known to interfere with or limit
automated WBC enumeration are observed, clarity of the automated differential
cytogram as well as the quality of the film preparation should be assessed. If the
automated differential is deemed possibly inaccurate, a manual differential should be
performed and reported, realizing that manual differentials are associated with high
imprecision based on the number of leukocytes standardly counted in veterinary
laboratories.32 In general, TEa recommendations given here are intended for automated
testing; however, these recommendations can also be applied to manual WBC
enumeration by laboratories routinely using manual counts. If TEobs exceeds TEa,
misdiagnosis could result. Maintenance, troubleshooting and manual blood smear review
should all be routinely performed.
4.2.3 Platelets
Blood specimens from cats are known to clot quickly, and their platelets are
frequently clumped upon evaluation of a blood smear. Therefore, TEobs in cats can be
much more variable than in other species, and high TEobs for feline platelets was found
due to imprecision in one study.25 Therefore, TEa for platelets presented in this guideline
focus on dogs and horses. Platelet concentrations <50,000/µL in any species are often
associated with a higher degree of error than the recommended TEa of 20%, even when
TEobs is based only on imprecision (2*CV). Imprecision is particularly high when counts
are extremely low (e.g., <10,000/µL). However, at these extremely low concentrations,
high error means that small changes are not biologically significant despite the fact that
clinical decisions are often made based on such changes. For example, a 50% TEobs for
10,000/µL platelets means that the patient result can range from 5,000/µL to 15,000/µL.
4.2.4 Reticulocytes
Automated reticulocyte counts in cats are problematic due to the presence of both
punctate and aggregate reticulocytes, and higher CV is observed for reticulocytes in cats
than in dogs.26 Reticulocyte counts in horses are rarely clinically relevant and may be
subject to increased error, given the higher degree of error associated with reticulocyte
counts <60,000/µL (see Appendix). While some data support a relatively close
correlation between manual and automated reticulocyte counts, precision of manual
reticulocyte counts is thought to have higher error.33,34 Therefore, reticulocyte
recommendations in this document focus on reticulocyte numbers generated by
Page 11
ASVCP QALS TEa Hematology Version 1.0 (final approved) December 2017
Page 11 of 34
automated methods in dogs. However, in general, improvements in instrument
performance as well as better-defined decision thresholds are needed for reticulocyte
interpretation.
4.3 Instrument performance evaluation using TEa
Detailed instrument performance evaluation and validation procedures are commonly
used in reference laboratories, where determination of bias and CV should be carried out within
recommended ASVCP guidelines and at the discretion of the quality control specialist. Periodic
assessment of TEobs for EQA/PT should be performed on a quarterly basis.13
Indications for evaluating instrument analytical performance include:
1. A new instrument is being considered for purchase
2. During instrument performance verification (when a new instrument is evaluated to
ensure that it performs according to manufacturer’s claims) or evaluation
3. Exploring unacceptable EQA/PT results
4. Fulfilling periodic TEobs assessments
For purposes of calculating the total error of a measurand using a particular method or
instrument (TEobs), Westgard originally used TE = bias(%) + 1.65CV.35 This formula is the
basis for the TEobs calculation used in this document, which is currently the most widely
accepted formula:36
𝑻𝑬𝒐𝒃𝒔 = 𝒂𝒃𝒔𝒐𝒍𝒖𝒕𝒆 𝒃𝒊𝒂𝒔% + 𝟐𝑪𝑽
If units of the measurand are used, then the equation used to calculate an instrument’s total error
(TEobs) changes to:
𝑻𝑬𝒐𝒃𝒔 = 𝒂𝒃𝒔𝒐𝒍𝒖𝒕𝒆 𝒃𝒊𝒂𝒔 (𝒊𝒏 𝒎𝒆𝒂𝒔𝒖𝒓𝒂𝒏𝒅 𝒖𝒏𝒊𝒕𝒔) + 𝟐𝑺𝑫
where SD is standard deviation.
Absolute values for bias should be used in these formulae (i.e., negative values should not be
used).15
Calculation of an instrument’s TEobs (for purposes of comparing to TEa) can be based
on routine daily QC data and/or periodic EQA/PT data, both of which are recommended to
ensure ongoing production of reliable laboratory results. The frequency of quality assurance (QA)
monitoring can be determined by the QC specialist based on the number of samples analyzed per
day, known inherent drift of the analytical method, perception of previous problems noted in the
laboratory, cost of reagents, and other factors.3
4.3.1 Quality Control Material (QCM)
Analysis of QCM is done to regularly assess instrument performance and can also
be conveniently used for calculating TEobs. Commercially available, stable, assayed
QCM is most commonly used and may be purchased from a number of companies (See
Appendix B). The choice of QCM depends on laboratory preference regarding
commutability across instruments/methods, the number, type and concentration of
Page 12
ASVCP QALS TEa Hematology Version 1.0 (final approved) December 2017
Page 12 of 34
measurands present within the materials, shelf-life/stability, cost, etc. In addition, both in-
clinic QC and EQA/PT require different types (concentrations, species, cell sizes, etc.) of
QCM, dependent upon the instrument, reference intervals, expected changes due to
disease, and species evaluated at the facility. Hematologic QCM must be selected based
on the methodology of the instrument; QCM for impedance-based and flow cytometric-
based instruments are not interchangeable. QCM from different lots may not have the
exact same measurand concentrations, which must be factored into the control limits used
to decide if QC data are in-control or out-of-control.37 Ideally, a minimum of two levels
(measurand concentrations) of assayed QCM should be used to determine instrument
performance.22 The concentration of measurand in the QCM should be at or near those of
decision thresholds and/or reference limits. If only one concentration of QCM is used, then
ideally it should be consistent with reference values for the species.
All commercially available QCM and calibration materials have a lot number and
expiration date based on proper storage of unopened vials. QCM should be labeled with
the date it is opened and the expiration date based on opening. All QCM should be
promptly discarded upon reaching either of its expiration dates (i.e., expired QCM
should never be used). Hematologic QCM may degrade more quickly upon opening
than QCM for biochemical testing, and it may show signs of degradation near the end of
(although prior to) its expected shelf life.
Manufacturer’s recommendations regarding storage and handling should be
followed and included in the laboratory’s Standard Operating Procedures.38 QCM that
are transported or stored under inappropriate conditions may lead to errors. For
example, using compromised QCM can trigger unnecessary troubleshooting and/or
calibration. Furthermore, if compromised calibration materials are used to calibrate an
instrument, it will lead to systematic error. Therefore, conditions known to alter the
stability of the QCM (temperature, light, humidity, length of storage, etc.) must be
monitored to ensure its stability. If it is suspected that the stability of the QCM is
compromised, it should be discarded and replaced. Shipment of hematology QCM and
whole blood between laboratories frequently results in disparate measurements due to
transport conditions and degradation over time. Even under appropriate conditions of
transport and storage, measurand results may vary over the lifetime of the QCM while
remaining within the expected intervals. Therefore, when comparability assessment
between laboratories is desired, assayed QCM should be analyzed at approximately the
same time (i.e., within 6 hours), on the instruments to be compared. This may require
splitting and shipping of QCM in aliquots instead of analyzing the QCM on different
days at different facilities. Timing and arrival should be planned so that weekends and
holidays are avoided. In contrast, QCM for chemistry and endocrinology can usually be
aliquoted and frozen for some time.
Page 13
ASVCP QALS TEa Hematology Version 1.0 (final approved) December 2017
Page 13 of 34
4.3.1.1 Use of patient specimens
Because of the instability of cells in anticoagulated blood, commercially
available, assayed QCM typically contains either synthetic components or
stabilized cells that might not behave in exactly the same manner as patient
specimens. However, because it is more stable than patient specimens, assayed
QCM is preferred to assess reagent or instrument drift. While assayed,
commercially available, hematology QCM may include bovine, porcine, equine
and other species’ cells, a companion animal-specific assayed hematology QCM
currently does not exist. While commercially available QCM is adequate to
assess the instrument, it may not be adequate to assess species-specific differences
in observed error. Therefore, use of patient whole blood specimens is still
important in species-specific assessment of total error in veterinary medicine. For
this purpose, whole blood may be used to generate species-specific, same-day
precision using a minimum of 5 replicates.13 Whole blood should not be
maintained for quality assessment for more than 24 hours, as specimens can
denature and result in erroneous values.39
Patient specimens can also be manipulated by diluting or concentrating the
sample to obtain hematology measurand concentrations below, within, and above
their reference interval.40 These samples can then be used to determine TEobs at
clinically relevant concentrations, with bias determined by comparing with a
reference laboratory. While this may provide a less expensive option than QCM
for instrument performance evaluations and comparative testing at important
decision thresholds, it requires a defined protocol with trained personnel. It can
also be time-consuming.
4.3.2 Assessing Imprecision
The conditions under which any precision study is conducted should be
documented in writing (e.g., date, operator, instrument, and specimen information). A
minimum evaluation, performed using two measurand concentrations, may be obtained
from measuring a stable QCM five times within the same day or over 5 days. If using
patient samples or sample pools, measurements should be performed within the same
day. These data are then used to calculate mean, SD, and CV.22 For guidance concerning
more sophisticated precision evaluation (e.g., for user verification of manufacturer’s
precision claims), readers are referred to other resources.7 Precision evaluation should be
performed at measurand concentrations of medical interest, especially if decision
thresholds are known.
4.3.3 Assessing Bias
Assessment of bias is relative. In clinical pathology laboratories, best practice
dictates that target means for calculation of bias be based on data from a true reference
Page 14
ASVCP QALS TEa Hematology Version 1.0 (final approved) December 2017
Page 14 of 34
method (“definitive” method). However, comparison with reference methods of analysis
may be expensive; therefore, other comparative standards are typically used, including
target means established by the manufacturer for QCM, results from comparative testing
with laboratories with known expertise in analysis of the measurand being evaluated, or
peer group means in external quality assurance programs.3 While a full discussion of the
advantages and limitations of different ways to determine bias are beyond the scope of
this guideline, two commonly used and recommended methods to determine bias in the
clinical setting are summarized below. Whether one or both methods are chosen for bias
determination by a particular laboratory will depend on many factors, including the
intended goals of the laboratory for determining bias. Readers are referred to other
resources for additional discussion.23
1. Comparison with target values provided by manufacturers of assayed QCM. Assayed
QCM may be repeatedly measured for at least 5 days to determine mean, bias, SD
and coefficient of variation. In this situation, the mean of the results should be
compared to the manufacturer’s mean to determine bias as detailed in section 4.3.4.
These data can then be used to calculate TEobs of a given measurand. The assayed
QCM should be specific for the equipment and methods being evaluated; the
instrument manufacturer should be consulted if there is any doubt regarding QCM
suitability. This method is recommended for in-clinic analyzers, as there are currently
few EQA/PT programs with peer groups that are large enough to provide adequate
statistics for veterinary in-clinic instruments.
2. Comparison with peer group means through EQA/PT program participation. The
difference between the participating laboratory’s result and the peer group mean is
used to represent bias. For additional detail concerning EQA/PT program selection
and participation, readers are referred to the ASVCP’s guideline on this topic.27
4.3.4 Instrument performance evaluation steps
Determination of TEobs is described below. Additionally, a worksheet is provided
in Appendix C to help guide users through the process of determining TEobs. All steps
should be carried out by appropriately trained personnel who are knowledgeable
regarding the analyzer’s operation and the facility’s quality assessment program.
Calculations can easily be done using commercially available software programs.
Calculations should be performed for each measurand and each QCM concentration. At
least two different measurand concentrations (e.g., normal and high, or high and low) of
QCM should be evaluated.
1. Measure each QCM daily at least five times.22 Five repetitions in one day is
possible but does not incorporate potential interday variation that mimics
conditions when assessing samples from hospitalized patients over time. If
Page 15
ASVCP QALS TEa Hematology Version 1.0 (final approved) December 2017
Page 15 of 34
QCM is stable according to the manufacturer for at least 5 days, interday
assessment is recommended. Using these data, for each QCM and each
measurand, calculate
a. Mean (average)
b. Standard deviation (SD)
c. Coefficient of variation (CV):
𝑪𝑽 (%) =𝑺𝑫
𝑴𝒆𝒂𝒏 × 𝟏𝟎𝟎
The mean, SD, and CV derived from these QC data are referred to as the
‘measured,’ ‘calculated,’ or ‘observed’ mean, SD, and CV.
2. Calculate the analyzer’s measured bias using the measured mean and the
QCM manufacturer’s reported mean (i.e., target mean) for the assayed control
material (using the same instrument and/or method as that used by the
analyzer) according to the formula:
𝑩𝒊𝒂𝒔% = 𝑴𝒆𝒂𝒏𝒕𝒂𝒓𝒈𝒆𝒕 − 𝑴𝒆𝒂𝒏𝒎𝒆𝒂𝒔𝒖𝒓𝒆𝒅
𝑴𝒆𝒂𝒏𝒕𝒂𝒓𝒈𝒆𝒕 × 𝟏𝟎𝟎
QCM manufacturer’s reported means are commonly found in the QCM package
insert, categorized according to the instrument and method producing the assayed
values. Measured bias may be a positive or a negative number, depending upon
whether the analyzer’s results are lower or higher than the manufacturer’s
reported mean. If bias is a negative number (e.g., 5.0%), then the absolute
number (5.0%) should be used in step 3, below.
3. Calculate the analyzer’s TEobs, using measured CV and measured bias,
according to the formula:
𝑻𝑬𝒐𝒃𝒔 = 𝒂𝒃𝒔𝒐𝒍𝒖𝒕𝒆 𝒃𝒊𝒂𝒔% + 𝟐𝑪𝑽
4. Compare measured TEobs to recommended TEa found in Table 1. If TEobs ≤
TEa, then the quality requirement is met and the instrument is considered
suitable for measurement of that measurand. If TEobs > TEa, then several
options exist.
4.3.5 When TEobs is greater than TEa
If calculated TEobs is greater than that which is considered acceptable (TEa),
attempts should be made to identify and correct causes of imprecision (high CV) and/or
Page 16
ASVCP QALS TEa Hematology Version 1.0 (final approved) December 2017
Page 16 of 34
inaccuracy (high bias).24 Use of special calculations, such as the Quality Goal Index may
be helpful in determining if the poor performance is due to imprecision, inaccuracy, or a
combination of both.14 If unacceptably large imprecision is suspected, then a more
rigorous precision study should be performed, including verification of manufacturer
performance claims, if this has not already been done.7 If unacceptably large bias is
suspected, then the means by which bias was determined should be re-visited to
determine if the targets are optimal. Instrument performance re-evaluation using a more
appropriate target for bias determination (i.e., a different representation of true measurand
concentration) could be considered.
If these sources of error cannot be corrected or if problems occur repeatedly, the
manufacturer of the instrument and/or a board-certified clinical pathologist with expertise
in QA should be called upon for further assessment. Further assessment may include
attempts to improve performance capability by analyzer adjustments, operator training,
reagent replacement with a new reagent or a product from a different manufacturer, or,
potentially, analyzer replacement.24
Alternatively, the initial quality requirement may be relaxed. This approach is
acceptable only if diagnostic judgment deems that additional analytical error can be
tolerated. Furthermore, this option should only be used upon consultation with a board-
certified veterinary clinical pathologist or other QC specialist. Relaxation of the TEa for a
particular measurand requires education of ALL clinicians using analyzer results that this
measurand is associated with larger error than is recommended. Use of a TEa higher than
that recommended in this document should be justified and documented in a laboratory
handbook.
5 TEa recommendations
Table 1 and Table 2 summarize TEa recommendations for hematologic measurands.
These recommendations were partially based on instrument performance using QCM (see
Appendix A for the control ranges evaluated). Each instrument’s manufacturer guidelines should
be consulted to determine the range of values supported by the instrument. Most instruments
cannot accurately quantify extreme values. It is worth noting that use of quality requirements for
hematology testing focuses on automated data, and manual review of blood smears is necessary
to verify automated findings.
6 TEa vs. biological variation-based quality specifications
Study of biological variation (BV) is growing in veterinary clinical pathology, and online
datasets are available.41 Data from BV studies may be used to establish quality specifications for
imprecision, bias, and total error.42 For some measurands, BV-based quality requirements may
be more stringent than what is achievable using current state-of-the-art instrumentation.3 For
such measurands, less stringent quality specifications (such as allowable total error based on
decision thresholds) may be more realistic.
Page 17
ASVCP QALS TEa Hematology Version 1.0 (final approved) December 2017
Page 17 of 34
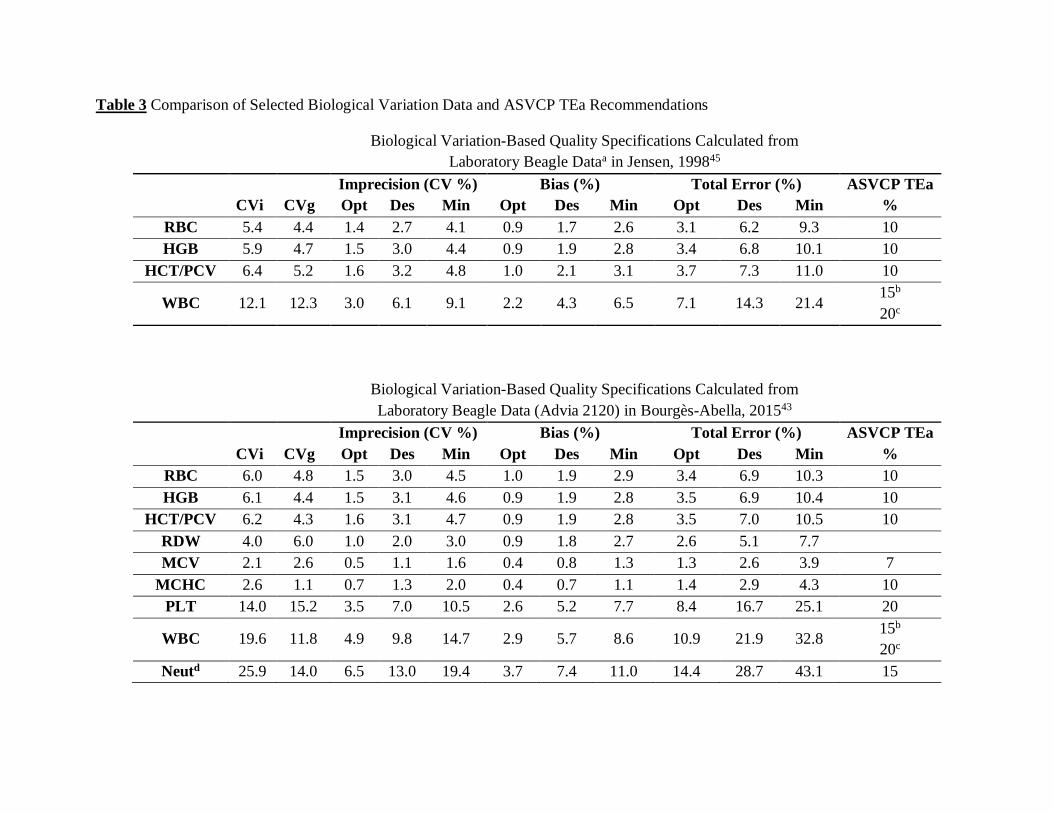
Biological variation of hematology measurands has been studied in dogs; example quality
specifications calculated from selected data are presented in Table 3. Based on instrument
performance data gathered by the authors (Appendix A), current veterinary reference laboratory
state-of-the-art instrumentation can typically meet “minimum” BV-based TE. In fact, it can often
meet “desirable” TE for most hematology measurands. The ability to meet “desirable” and
“optimum” BV-based TE varied by measurand and institution. Unsurprisingly, “optimum” TE
(the most stringent BV-based quality requirement) was met least often and is currently not
recommended for routine assessment of hematology instrument performance. Overall, TEa
values recommended in this guideline are comparable to published minimum TE based on
biological variation data (Table 3), and either type of quality requirement can be used to evaluate
hematology instrument performance.43-45
7 References
1. Sandberg S, Fraser CG, Horvath AR, et al. Defining analytical performance specifications:
consensus statement from the 1st strategic conference of the European Federation of Clinical
Chemistry and Laboratory Medicine. Clin Chem Lab Med. 2015; 53(6): 833-835.
2. Kjelgaard-Hansen M, Jensen AL. Subjectivity in defining quality specifications for quality
control and test validation [letter]. Vet Clin Pathol. 2010; 39: 134–135.
3. Harr KE, Flatland B, Nabity M, Freeman KP. ASVCP guidelines: allowable total error
guidelines for biochemistry. Vet Clin Pathol. 2013; 42: 424-436.
4. Freeman KP, Baral RM, Dhand NK, Saxmose Nielsen S, Jensen AL. Recommendations for
designing and conducting veterinary clinical pathology biologic variation studies. Vet Clin
Pathol. 2017; 46(2): 211-220.
5. Clinical and Laboratory Standards Institute (CLSI). User verification of performance for
precision and trueness; approved guideline. 2nd ed. (EP31-A-1R). Wayne, PA: AALA; 2005.
6. Clinical and Laboratory Standards Institute (CLSI). Using proficiency testing to improve the
clinical laboratory; approved guideline, 2nd
ed. (GP27-A2). Wayne, PA: AALA; 2008.
7. Clinical and Laboratory Standards Institute (CLSI). Evaluation of precision performance of
quantitative measurement methods; approved guideline, 2nd
ed. (EP15-A2). Wayne, PA:
AALA; 2006.
8. Clinical and Laboratory Standards Institute (CLSI). User verification of precision and
estimation of bias; approved guideline. 3rd ed. (EP15-A3). Wayne, PA: AALA; 2014.
9. OIE-World Organisation for Animal Health: Manual of Diagnostic Tests and Vaccines for
Terrestrial Animals. 2014. Available at:
http://www.oie.int/fileadmin/Home/eng/Health_standards/tahm/0.04_GLOSSARY.pdf.
Accessed October 25, 2016.
10. Friedrichs KR, Harr KE, Freeman KP, et al. ASVCP reference interval guidelines:
determination of de novo reference intervals in veterinary species and other related
topics. Vet Clin Pathol. 2012; 41(4): 441-453.
Page 18
ASVCP QALS TEa Hematology Version 1.0 (final approved) December 2017
Page 18 of 34
11. Westgard QC: Glossary of ISO Terms. 2009. Available at:
http://www.westgard.com/isoglossary.htm. Accessed September 7, 2017.
12. Flatland B, Freeman KP. Repeat patient testing (RPT) shows promise as a quality control
method for hematology testing. Annual meeting of the ACVP/ASVCP. New Orleans, LA,
December 3-7, 2016.
13. Flatland B, Freeman KP, Vap LM, Harr KE. ASVCP Guidelines: quality assurance for
point-of-care testing in veterinary medicine. Vet Clin Pathol. 2013; 42(4): 405-423.
14. Parry DM. Quality Goal Index. 2009. Available at www.westgard.com/guest34.htm.
Accessed November 4, 2016.
15. Fraser CG. Biological Variation: From Principles to Practice. Washington, DC: American
Association for Clinical Chemistry (AACC) Press; 2001: 29-66.
16. Braun JP. Communicating with precision in veterinary clinical pathology: definitions, units,
and nomenclature. Vet Clin Path. 2009; 38(4): 416-417.
17. Westgard QC: WQC Glossary. 2009. Available at: http://www.westgard.com/glossary.htm.
Accessed September 7, 2017.
18. Westgard JO, Carey RN, Wold S. Criteria for judging precision and accuracy in method
development and evaluation. Clin Chem. 1974; 20(7): 825‐33.
19. Whitehead TP. Quality Control in Clinical Chemistry. New York: Wiley, Inc.; 1977.
20. Freeman KP, Gruenwaldt J. Quality control validation in veterinary laboratories. Vet Clin
Pathol. 1999; 28: 150-155.
21. Farr AJ, Freeman KP. Quality control validation, application of sigma metrics, and
performance comparison between two biochemistry analyzers in a commercial veterinary
laboratory. J Vet Diagn Invest. 2008; 20: 536-544.
22. Rishniw M, Pion PD, Maher T. The quality of veterinary in-clinic and reference laboratory
biochemical testing. Vet Clin Pathol. 2012; 41: 92-109.
23. Flatland B, Friedrichs KR, Klenner S. Differentiating between analytical and diagnostic
performance evaluation with a focus on the method comparison study and identification of
bias. Vet Clin Pathol. 2014; 43: 475-486.
24. Lester S, Harr KE, Rishniw M, Pion P. Current quality assurance concepts and
considerations for quality control of in-clinic biochemistry testing. J Am Vet Med Assoc.
2013; 242: 182-192.
25. Cook AM, Mortiz A, Freeman KP, Bauer N. Quality requirements for veterinary
hematology analyzers in small animals—a survey about veterinary experts’ requirements and
objective evaluation of analyzer performance based on a meta-analysis of method validation
studies: bench top hematology analyzer. Vet Clin Pathol. 2016; 45(3): 466-476.
26. Bauer N, Nakagawa J, Dunker C, Failing K, Moritz A. Evaluation of the automated
hematology analyzer Sysmex XT-2000iv compared to the ADVIA2120 for its use in
dogs, cats, and horses. Part II: Accuracy of leukocyte differential and reticulocyte count
impact of anticoagulant and sample aging. J Vet Diagn Invest. 2012; 24(1): 74-89.
Page 19
ASVCP QALS TEa Hematology Version 1.0 (final approved) December 2017
Page 19 of 34
27. Camus MS, Flatland B, Freeman KP and Cruz Cardona, JA. ASVCP quality assurance
guidelines: external quality assessment and comparative testing for reference and in-clinic
laboratories. Vet Clin Pathol. 2015; 44: 477–492.
28. Clinical and Laboratory Standards Institute (CLSI). Verification of comparability of patient
results within one health care system; approved guideline. (C54-A). Wayne, PA: AALA;
2008.
29. Westgard JO. Implementing repeat patient test controls. In: Westgard JO, ed. Basic QC
Practices Training in Statistical Quality Control for Medical Laboratories, 4th ed. Madison,
WI: Westgard QC; 2016: 233-244.
30. Cook AM, Mortiz A, Freeman KP, Bauer N. Objective evaluation of analyzer performance
based on a retrospective meta-analysis of instrument validation studies: point-of-care
hematology analyzers. Vet Clin Pathol. 2017. 46(2): 248-261.
31. Vap LM, Harr KE, Arnold JE, et al. ASVCP quality assurance guidelines: control of
preanalytical and analytical factors for hematology for mammalian and nonmammalian
species, hemostasis, and crossmatching in veterinary laboratories. Vet Clin Pathol. 2012;
41(1): 8-17.
32. Kjelgaard-Hansen M, Jensen AL. Is the inherent imprecision of manual leukocyte differential
counts acceptable for quantitative purposes? [letter]. Vet Clin Pathol. 2006; 35: 268-270.
33. Lilliehöök I, Tvedten H. Validation of the Sysmex XT‐2000iV hematology system for dogs,
cats, and horses. I. Erythrocytes, platelets, and total leukocyte counts. Vet Clin Pathol.
2009; 38(2): 163-174.
34. Tvedten H, Moritz A. Reticulocyte and Heinz body staining and enumeration. In: Weiss
DJ, Wardrop KJ, eds. Schalm’s Veterinary Hematology. 6th ed. Ames, IA: Blackwell
Publishing Ltd; 2010: 1067-1073.
35. Bayat H. Westgard Web: QC-dependent risk reduction. 2015. Available at:
www.westgard.com/qc-risk-reduction.htm. Accessed September 7, 2017.
36. Clinical Laboratory Improvement Amendments (CLIA): Proficiency testing criteria for
acceptable analytical performance. Fed Reg. 1992; 57(40): 7002-7186.
37. Quam E. Selecting the right control materials. In: Westgard JO. Basic QC Practices
Training in Statistical Quality Control for Medical Laboratories, 4th ed. Madison, WI:
Westgard QC; 2016: 103-111.
38. Bellamy JEC, Olexson DW. Quality Assurance Handbook for Veterinary Laboratories.
Ames, Iowa: Iowa University Press; 2000: 26.
39. Furlanello T, Tasca S, Caldin M, et al. Artifactual changes in canine blood following
storage, detected using the ADVIA 120 hematology analyzer. Vet Clin Pathol. 2006; 35(1):
42-46.
40. Rishniw M, Pion P. Evaluation of performance of veterinary in-clinic hematology analyzers.
Vet Clin Pathol. 2016; 45(4): 604-614.
41. VetBiologicalVariation: Database tables. 2015. Available at:
http://vetbiologicalvariation.org. Accessed September 7, 2017.
Page 20
ASVCP QALS TEa Hematology Version 1.0 (final approved) December 2017
Page 20 of 34
42. Oosterhuis WP. Gross overestimation of total allowable error based on biological variation.
Clin Chem. 2011; 57: 1334-1336.
43. Bourgès-Abella NH, Gury TD, Geffré A, et al. Reference intervals, intraindividual and
interindividual variability, and reference change values for hematologic variables in
laboratory beagles. J Am Assoc Lab Anim Sci. 2015; 54: 17-24.
44. Wiinberg B, Jensen AL, Kjelgaard-Hansen M, et al. Study on biological variation of
haemostatic parameters in clinically healthy dogs. Vet J. 2007; 174: 62-68.
45. Jensen AL, Iversen L, Petersen TK. Study on biological variability of haematological
components in dogs. Comp Haematol Int. 1998; 8: 202-204.
46. Lilliehöök I, Tvedten HW. Errors in basophil enumeration with 3 veterinary hematology
systems and observations on occurrence of basophils in dogs. Vet Clin Pathol. 2011; 40(4):
450-458.
47. Jensen AL, Kjelgaard-Hansen M. Method comparison in the clinical laboratory. Vet Clin
Pathol. 2006; 35: 276-286.
Page 21
ASVCP QALS TEa Hematology Version 1.0 (final approved) December 2017
Page 21 of 34
8 Web resources
Glossary of QA terms, Westgard QC glossary:
http://www.westgard.com/glossary.htm
CLIA website:
https://www.cms.gov/Regulations-and-Guidance/Legislation/CLIA/index.html
Summary of CLIA recommendations:
https://www.westgard.com/clia.htm
American Society for Veterinary Clinical Pathology guideline documents:
http://www.asvcp.org/pubs/index.cfm
Biological variation:
http://vetbiologicalvariation.org
9 Methods validation subcommittee advisors
Benjamin Brainard, VMD, DACVAA, DACVECC
Department of Small Animal Medicine and Surgery
University of Georgia
College of Veterinary Medicine
Athens, GA
Marco Duz, Med Vet, MVM, MRCVS
Weipers Centre Equine Hospital
School of Veterinary Medicine
College of Medical, Veterinary and Life Sciences
University of Glasgow
Scotland, United Kingdom
Amy K. LeBlanc, DVM, DACVIM (Oncology)
Director, Comparative Oncology Program
Center for Cancer Research
National Cancer Institute
Karen McCormick, DVM, DACVIM (Equine)
Clinical Assistant Professor
Department of Large Animal Clinical Sciences
College of Veterinary Medicine
University of Tennessee
Page 22
ASVCP QALS TEa Hematology Version 1.0 (final approved) December 2017
Page 22 of 34
Dianne Mawby, DVM, MVSc, DACVIM (Small Animal Internal Medicine)
Clinical Associate Professor
Department of Small Animal Clinical Sciences
College of Veterinary Medicine
University of Tennessee
L. Nicki Wise, DVM, MS, DACVIM (Large Animal Internal Medicine)
Department of Large Animal Medicine and Surgery
St. George’s University
USDA ARS ADRU
St. George's, Grenada, West Indies
Amelia Woolums, DVM, MVSc, PhD, DACVM, DACVIM (Large Animal Internal Medicine)
Professor
Department of Pathobiology and Population Medicine
College of Veterinary Medicine
Mississippi State University
Starkville, MS
10 Contributing Laboratories
• Department of Biomedical and Diagnostic Sciences, University of Tennessee, Knoxville, TN
• Department of Comparative Medicine, Animal Diagnostic Laboratory, Stanford University,
Stanford, CA
• Department of Microbiology, Immunology and Pathology, Colorado State University, Ft.
Collins, CO
• Department of Pathology, University of Georgia, Athens, GA
• Department of Veterinary Pathobiology, Texas A&M University, College Station, TX
• Department of Veterinary Pathobiology, University of Missouri, Columbia, MO
• Urika, LLC, Mukilteo, WA owned by Dr. Harr
11 Acknowledgments
The authors thank Drs. Roberta Moorhead and Marlyn Whitney for their contribution of
hematology data.
The authors also thank members of the ASVCP Executive Board and the following individuals
for their thorough review of the manuscript: Ms. Jill Arnold and Drs. Erica Behling-Kelly, Jean-
Pierre Braun, Jennifer Cook, Glenn Frank, Kathy Freeman, Kristen Friedrichs, Luca Giori,
Emma Hooijberg, Kate Irvine, Unity Jeffery, Ernst Leidinger, Tracy Stokol, and Harold Tvedten.
Page 23
ASVCP QALS TEa Hematology Version 1.0 (final approved) December 2017
Page 23 of 34
12 Tables
Table 1. Allowable total error (TEa) for automated hematologic measurands, applicable for all
concentrations (low/normal/high).a See Appendix A for derivation of TEa values.
CLIA = Clinical Laboratory Improvement Amendments; HCT = hematocrit; HGB =
hemoglobin; MCHC = mean cell hemoglobin concentration; MCV = mean cell volume; PCV =
packed cell volume (spun HCT); RBC = red blood cells; TEa = total allowable error; WBC =
white blood cells
aExtreme values not supported by most instruments bClinical Laboratory Improvement Amendments (CLIA) is the accepted performance standard in
human medicine in the United States and is therefore included here for comparison.36
cThis recommendation is only applicable to canine absolute reticulocyte counts. Feline
reticulocytes may be associated with higher error using automated methods. dReticulocytes <60,000/µL can be associated with high TEobs and are not considered clinically
relevant. (See Appendix) eInstruments were typically able to achieve an error (2*CV) <15% in patient samples with WBC
counts as low as 1000 cells/µL. fInstruments were typically able to achieve an error (2*CV) <20% in patient samples with
platelet concentrations >50,000/µL. Concentrations below this number were frequently
associated with a higher degree of imprecision (up to 50-75%).
*In-clinic TEa for WBC count and platelets was based on recently published data.30,40
Measurand TEa bCLIA Value
RBC 10% 6%
Hgb 10% 7%
Hct/PCV 10% 6%
MCV 7% ---
MCHC 10% ---
Reticulocytesc 20%d ---
WBC
(Reference laboratory)
15%e 15%
WBC
(*In-Clinic laboratory)
20% ---
Platelets
(Reference laboratory)
20%f 25%
Platelets
(*In-Clinic laboratory)
25% ---
Page 24
ASVCP QALS TEa Hematology Version 1.0 (final approved) December 2017
Page 24 of 34
Table 2. Allowable Total Error (TEa) for Differential Cell Counts. TEobs for differential cell
counts should be based on absolute numbers and may be generated using automated techniques,
manual techniques, or a combination thereof (see Section 4.2.2). See Appendix A for derivation
of TEa values and example calculations.
Measurand Low value Within RI High value CLIA Value
Neutrophils 15% 15% 15% +/-3SD
Lymphocytes 15% 15% 15% +/-3SD
Monocytes NCR *60% 50% +/-3SD
Eosinophils *90% 50% 50% +/-3SD
Basophils Rec Not
Possible
Rec Not
Possible
Rec Not
Possible
+/-3SD
CLIA = Clinical Laboratory Improvement Amendments; NCR = not clinically relevant; Rec =
recommendation; RI = reference interval
*Recommendation based on study by Cook, et al.25
Page 25
Table 3 Comparison of Selected Biological Variation Data and ASVCP TEa Recommendations
Biological Variation-Based Quality Specifications Calculated from
Laboratory Beagle Dataa in Jensen, 199845
Imprecision (CV %) Bias (%) Total Error (%) ASVCP TEa
CVi CVg Opt Des Min Opt Des Min Opt Des Min %
RBC 5.4 4.4 1.4 2.7 4.1 0.9 1.7 2.6 3.1 6.2 9.3 10
HGB 5.9 4.7 1.5 3.0 4.4 0.9 1.9 2.8 3.4 6.8 10.1 10
HCT/PCV 6.4 5.2 1.6 3.2 4.8 1.0 2.1 3.1 3.7 7.3 11.0 10
WBC 12.1 12.3 3.0 6.1 9.1 2.2 4.3 6.5 7.1 14.3 21.4
15b
20c
Biological Variation-Based Quality Specifications Calculated from
Laboratory Beagle Data (Advia 2120) in Bourgès-Abella, 201543
Imprecision (CV %) Bias (%) Total Error (%) ASVCP TEa
CVi CVg Opt Des Min Opt Des Min Opt Des Min %
RBC 6.0 4.8 1.5 3.0 4.5 1.0 1.9 2.9 3.4 6.9 10.3 10
HGB 6.1 4.4 1.5 3.1 4.6 0.9 1.9 2.8 3.5 6.9 10.4 10
HCT/PCV 6.2 4.3 1.6 3.1 4.7 0.9 1.9 2.8 3.5 7.0 10.5 10
RDW 4.0 6.0 1.0 2.0 3.0 0.9 1.8 2.7 2.6 5.1 7.7
MCV 2.1 2.6 0.5 1.1 1.6 0.4 0.8 1.3 1.3 2.6 3.9 7
MCHC 2.6 1.1 0.7 1.3 2.0 0.4 0.7 1.1 1.4 2.9 4.3 10
PLT 14.0 15.2 3.5 7.0 10.5 2.6 5.2 7.7 8.4 16.7 25.1 20
WBC 19.6 11.8 4.9 9.8 14.7 2.9 5.7 8.6 10.9 21.9 32.8
15b
20c
Neutd 25.9 14.0 6.5 13.0 19.4 3.7 7.4 11.0 14.4 28.7 43.1 15
Page 26
ASVCP QALS TEa Hematology Version 1.0 (final approved) December 2017
Page 26 of 34
ASVCP = American Society for Veterinary Clinical Pathology; CVg = interindividual biological variation; CVi = intraindividual
biological variation; Des = desirable; HCT = hematocrit; HGB = hemoglobin; MCHC = mean cell hemoglobin concentration; MCV =
mean cell volume; Min = minimum; Neut = neutrophils; Opt = optimum; PCV = packed cell volume (spun HCT); PLT = platelets;
RBC = red blood cells; RDW = red blood cell distribution width; TEa = allowable total error; WBC = white blood cells;
aRBC, WBC, and HGB were determined using a model S560 Coulter Counter; HCT was additionally measured manually using a
Haemofuge (a microhematocrit centrifuge). BV-based quality specifications given in these tables were calculated using published
biological variation data (as cited) and formulae for optimum, desirable, and minimum thresholds from Fraser, 2001.15 bReference laboratories cIn-clinic laboratories using point-of-care instrumentation. dApplies to automated absolute neutrophil concentrations.
Page 27
13 Appendices
13.1 Appendix A. Derivation of hematology TEa recommendations
13.1.1 Selection of measurands
TEa recommendations were made for those hematology measurands in common
clinical use and likely to be followed as part of routine quality control procedures.
Recommendations were largely based on clinician input for dogs, cats, and horses, and
using data generated from QCM and dog specimens. The committee did not make
recommendations for mean corpuscular hemoglobin (MCH), red cell distribution width
(RDW), or platelet distribution width (PDW), as these were not considered important for
this purpose. Recommendations for WBC differential counting (excepting basophils)
were made considering automated absolute counts, not differential percentages, since
interpretation of patient data and decision thresholds are based on absolute counts.
Basophil enumeration was omitted from consideration altogether, as scientific study has
documented that commonly used reference laboratory instruments do not enumerate
canine and feline basophils accurately.46 Additionally, the recommendations for the WBC
differential were derived from instrument data. Many laboratories standardly perform
manual differential cell counts for all patients, and manual differentials should be
performed when a review of the smear does not align with the automated differential or if
WBC abnormalities are present (e.g. toxic change). However, it is recognized that manual
differentials are associated with high imprecision based on the standard 100 to 200-cell
differentials commonly performed in veterinary laboratories.47 Recommendations for
reticulocytes were also made considering the absolute count (not percentage), and
reticulocytes were only evaluated for purposes of this document using either assayed
QCM or canine patient specimens. Because of the difficulty in accurately distinguishing
punctate from aggregate reticulocytes in cats using automated methods, specimens from
cats were not used.
13.1.2 Clinician input
A total of seven board-certified internists were surveyed (see subcommittee
advisors) to determine their expectations of analytical quality required for confident
management of their patients (dogs, cats, and horses) using standard diagnostic
paradigms. Opinions from all clinicians were surveyed for all measurands. Clinicians
were asked to provide the maximum uncertainty they could tolerate clinically for each
measurand at low and high concentrations. This assessment was based on values they
would deem concerning vs. critical considering the reference intervals for their
laboratory. Our goal was to reach a clinical consensus for tolerable analytical error that
would result in the fewest mistakes in clinical interpretation. In addition, published
hematologic quality requirements were considered from 41 veterinarians representing a
Page 28
ASVCP QALS TEa Hematology Version 1.0 (final approved) December 2017
Page 28 of 34
variety of specialties based on maximal allowable deviation from a given result that
would not affect their clinical decision.25 In our experience, the range of clinician
expectations was initially quite broad and included small errors that were often
unattainable with current instrumentation. However, a consensus was eventually reached
that was ultimately more aligned with instrument performance. Cook, et al, observed a
much wider decision threshold range, possibly because input was provided without
discussion between clinicians and clinical pathologists.25
As an example of the discussions, consider desired total error for neutrophil
enumeration (Example 1, below). Clinicians, particularly oncologists, often base
treatment decisions on a low neutrophil concentration of 2000 cells/µL. Clinicians were
asked how much error they could tolerate in making clinical decisions for a patient
having a “true” concentration of 2000 neutrophils/µL, and a maximum acceptable range
of error around this true value was identified as 1800 to 2200 /µL, or 200 /µL.
Expressed as a percentage, this degree of error is 10%. While this small degree of error
is not attainable with current instrumentation, it provides a goal for manufacturers.
Example 1. Calculation of desired TEa for a moderately decreased absolute neutrophil
count
Many reference intervals for neutrophils have a lower limit around 3,000
neutrophils/µL. However, as stated above, clinicians often base treatment
recommendations and further diagnostic investigation on the decision threshold of <2,000
neutrophils/µL, with an acceptable range of values at this concentration being 1,800-
2,200 neutrophils/µL. Therefore, determination of the desired TEa was based on a
decision threshold of 2,000 neutrophils/µL using two different calculations as follows:
TEa based on the lower limit of the reference interval
=[(lower limit of reference interval – decision threshold) / decision threshold] x 100
=[(3,000-2,000)/2,000] x 100
=50%
TEa based on acceptable uncertainty around the decision limit
=[(lower limit of acceptable range – decision threshold) / decision threshold] x 100
=[(1,800-2,000)/2,000] x 100
=10%
This example demonstrates different clinical recommendations for acceptable
error in neutrophil count based on either use of the lower limit of the reference interval or
the lower limit of the acceptable range around the decision threshold. Widely disparate
desired TEa were obtained, but given the importance of the clinical decisions being made
at such low neutrophil counts, we considered 10% as the desired TEa, which is based on
Page 29
ASVCP QALS TEa Hematology Version 1.0 (final approved) December 2017
Page 29 of 34
clinically important values unrelated to a reference interval. This clinician input was
considered in combination with instrument performance to determine the recommended
TEa (see below).
Example 2. Calculation of desired TEa for a moderately decreased platelet count
Many reference intervals for canine platelet counts have a lower limit around
200,000/µL. However, many surgeons have a minimal threshold of 100,000/µL for
performing a major surgical procedure. Clinicians identified an acceptable range of
values at this concentration to be +/- 15,000 platelets (85,000-115,000 platelets/µL).
Therefore, determination of the desired TEa was based on a decision threshold of
100,000 platelets/µL, as follows:
TEa based on acceptable uncertainty around the decision limit
=[(lower limit of acceptable range – decision threshold) / decision threshold] x 100
=[(85,000 - 100,000) / 100,000] x 100
=15%
Therefore, the desired TEa for a moderately low platelet concentration was
calculated as 15%.
13.1.3 TEa based on assessment of instrument performance
Performance of reference laboratory hematology instruments was performed
using College of American Pathologists (CAP) EQA/PT data as well as historical QC
data from each institution. Four institutions participated in the same CAP proficiency
testing event (September 2012) and additionally measured selected CAP test material
(one or more materials chosen from the 5 different test specimens provided for the testing
event) 5 times under repeatability conditions. Repeatability data were used to calculate
CV; difference from peer group mean was used to calculate %bias. TEobs was calculated
according to the formula TEobs = %bias + 2CV. TEobs values varied by measurand
concentration; in general, higher TEobs values were observed at lower measurand
concentrations.
Additionally, historical daily measurements of QCM over 15-40 days were used
to calculate CV, %bias, and TEobs at the institutions above plus additional institutions
recruited by the committee. Percent bias was calculated using expected means reported
by the QCM manufacturer. TEobs was calculated as above. TEobs values varied by
measurand concentration; in general, higher TEobs values were observed at lower
measurand concentrations. The range of TEobs based on both CAP proficiency testing
and historical control data are summarized in Table A1a below.
Page 30
ASVCP QALS TEa Hematology Version 1.0 (final approved) December 2017
Page 30 of 34
13.1.4 Determination of recommended TEa.
TEa recommendations were based on collective consideration of clinician desired
total error, instrument performance, and CLIA guidelines. Final recommendations are the
consensus opinion of committee members based on the above factors. While the
analytical performance of many of the measurands was well within clinicians’
expectations for quality requirement, some could not be achieved based on analytical
performance of current, commonly used instruments, particularly at extremes of values.
For instance, in the clinician’s desired TEa calculation for neutrophils presented above,
the desirable TEa was 10%. However, reference laboratory instrumentation could not
reliably meet this desired TEa, and our recommended TEa is therefore ≤15%. Both
decision thresholds and instrument performance are expected to evolve over time, as
disease diagnosis is refined and technology evolves. Consequently, these
recommendations will be reviewed and revised every ten years.
Page 31
ASVCP QALS TEa Hematology Version 1.0 (final approved) December 2017
Page 31 of 34
Table A1a. Derivation of TEa recommendations including comparison of total allowable error
(TEa) with total observed error (TEobs), clinician error limit, and Clinical Laboratory
Improvement Amendments (CLIA) for hematology measurands.
CLIA = Clinical Laboratory Improvement Amendments; HCT = hematocrit; HGB =
hemoglobin; MCHC = mean cell hemoglobin concentration; MCV = mean cell volume; PCV =
packed cell volume (spun HCT); RBC = red blood cells; TEa = total allowable error; TEobs =
total observed error; WBC = white blood cells
aTEobs is based on reference laboratory data (7 different instruments from 3 different
manufacturers). The range provided is a summary of all control levels used, including both
historical QCM controls as well as prospective CAP QCM testing, as described in the text. bClinician error limit refers to the acceptable error that clinicians are willing to tolerate in a
measurement that will not impact diagnostic or therapeutic decision making. cThe large TEobs for reticulocytes was observed for QCM that had low numbers of reticulocytes
(See Table A1b). dReference laboratory instruments eIn-clinic instruments. Data based on two in-clinic instruments.
Measurand TEa TEobsa Clinician Error
Limitb
CLIA
Value
RBC 10% 1-8% 10-20% 6%
Hgb 10% 2-7% 10-15% 7%
Hct/PCV 10% 1-8% 5-10% 6%
MCV 7% 1-3% 5-15% ---
MCHC 10% 2-3% 5-15% ---
Reticulocytes 20% 10-
56%c 10-15%
---
Platelets 20%d
25%e
5-15%d
6-41%e 15-20%
25%
WBC 15%d
20%e
1-13%d
6-16%e
10-15%
15%
Neutrophils 15% 7-11% 10-15% +/-3SD
Lymphocytes 15% 8-14% 10-15% +/-3SD
Monocytes 60% (within RI)
50% (above RI) 14-37% 3-200%25
+/-3SD
Eosinophils 90% (below RI)
50% (within/above RI) 16-38% 5-200% 25 +/-3SD
Page 32
ASVCP QALS TEa Hematology Version 1.0 (final approved) December 2017
Page 32 of 34
Table A1b. Levels/concentrations of historical QCM used by the institutions that provided data
for this study and the interval of TEobs for each using reference laboratory instrumentation.
Low Mid High
Value TEobs Value TEobs Value TEobs
RBC (x 109/µL) 2.3-2.9 2-6% 4.2-4.5 1-5% 5.2-5.4 1-8%
Hgb (g/dL) 5.4-7.5 2-7% 11.6-12.3 1-4% 16.1-17.1 1-6%
Hct/PCV (%) 16-23 2-6% 33-37 2-5% 46-49 1-8%
MCV (fL) 70-79 2-3% 78-88 1-3% 89-94 1-3%
MCHC (g/dL) 32.6-32.8 2-5% 32.7-34.1 2% 33.2-34.9 2-3%
Reticulocyte % 0.7-1.4 17-56% 1.8-4.6 8-16% 5-8.7 6-18%
*Reticulocyte (x 103/µL) 30-50 17-56% 80-200 12-17% 110-220 10-19%
Platelets (x 103/µL) 60-80 7-15% 215-230 4-10% 450-550 5-14%
WBC (x 103/µL) 3-4 3-13% 7.1-7.2 1-10% 16-18 3-12%
HCT = hematocrit; HGB = hemoglobin; MCHC = mean cell hemoglobin concentration; MCV =
mean cell volume; PCV = packed cell volume (spun HCT); RBC = red blood cells; TEobs = total
observed error; WBC = white blood cells
*Note that a recommendation for TEa for low reticulocyte concentrations was not deemed
clinically relevant.
Page 33
ASVCP QALS TEa Hematology Version 1.0 (final approved) December 2017
Page 33 of 34
13.2 Appendix B. External quality assurance/proficiency testing programs
Vendors and manufacturers are listed alphabetically. This list is for informational purposes only
and does not constitute a legal contract or endorsement between ASVCP and any person or entity
unless otherwise specified. The ASVCP does not endorse any particular vendor or manufacturer.
CLIA
https://www.cms.gov/Regulations-and-
Guidance/Legislation/CLIA/Proficiency_Testing_Providers.html
College of American Pathologists
http://www.cap.org/apps/cap.portal?_nfpb=true&_pageLabel=accreditation
Insight Interlaboratory Quality Assessment Program from Sysmex
https://www.sysmex.com/us/en/Pages/Registration.aspx
Urika, LLC Quality Assurance Division
www.urikapathology.com
Veterinary Laboratory Association Quality Assurance Program
http://www.vlaqap.org/
Page 34
ASVCP QALS TEa Hematology Version 1.0 (final approved) December 2017
Page 34 of 34
13.3 Appendix C. Allowable total error worksheet
1. Calculate analyzer precision by performing a minimum of n=5 repetitions. (More
repetitions are preferred.) Repetitions should be performed identically to standard
analysis of patient specimens, using the same personnel, instrument, reagents, etc.
Calculate mean, standard deviation, and coefficient of variation (CV%) using any
standard software program (e.g., Excel):
𝑪𝑽 (%) = 𝑺𝒕𝒂𝒏𝒅𝒂𝒓𝒅 𝒅𝒆𝒗𝒊𝒂𝒕𝒊𝒐𝒏
𝑴𝒆𝒂𝒏 × 𝟏𝟎𝟎
2. Calculate analyzer bias from known standard/control material (Meantarget) or deviation
from population mean and measured mean from Step #1 (Meanmeasured) using equation:
𝑩𝒊𝒂𝒔(%) = 𝑴𝒆𝒂𝒏𝒕𝒂𝒓𝒈𝒆𝒕 − 𝑴𝒆𝒂𝒏𝒎𝒆𝒂𝒔𝒖𝒓𝒆𝒅
𝑴𝒆𝒂𝒏𝒕𝒂𝒓𝒈𝒆𝒕 × 𝟏𝟎𝟎
3. Calculate Total Error (TEobs) using the following formula. Use the absolute bias result
(i.e., positive number only).
𝑻𝑬𝒐𝒃𝒔 = 𝒂𝒃𝒔𝒐𝒍𝒖𝒕𝒆 𝒃𝒊𝒂𝒔% + 𝟐𝑪𝑽
4. Compare TEobs calculated in the laboratory with TEa found in the ASVCP Guidelines for
TEa.
a. If TEobs ≤ TEa
i. The quality assessment passes and no further action is needed
b. If TEobs > TEa
i. Report results to Quality Assurance Personnel/Committee.
ii. Investigate pre-analytical and procedural factors (e.g., specimen quality,
instrument SOP, operator proficiency, bias determination) that may have
impacted performance and correct as needed. Reassess instrument
performance following correction.
iii. If no pre-analytical or procedural factors are identified that can be
addressed and corrected, management should report findings to the
manufacturer of the instrument so that any needed maintenance, repairs, or
replacement may be evaluated and implemented.
iv. Clinicians should be notified in writing of potentially clinically impactful
error.
5. All Total Error assessments should be catalogued in a written and/or digital archive
accessible to personnel who may operate the instrument or interpret the results.13