ASYMMETRIC LEARNING IN REPEATED CONTRACTING:AN EMPIRICAL STUDY
Alma Cohen
Working Paper 13752http://www.nber.org/papers/w13752
NATIONAL BUREAU OF ECONOMIC RESEARCH1050 Massachusetts Avenue
Cambridge, MA 02138January 2008
I gratefully acknowledge the helpful suggestions of Lucian Bebchuk, Rajeev Dehejia, Liran Einav,Aviv Nevo, Manuel Trajtenberg, Miguel Villas-Boas, and seminar participants at the University ofCalifornia at Berkeley and the Hebrew University. I also wish to thank the IDI Company for the dataand Shai Fogel, its past CEO, for very helpful discussions about the company and its market. An early,preliminary version of this paper was circulated as "Profits and Market Power in Repeat Contracting:Evidence from the Insurance Market." The views expressed herein are those of the author(s) and donot necessarily reflect the views of the National Bureau of Economic Research.
NBER working papers are circulated for discussion and comment purposes. They have not been peer-reviewed or been subject to the review by the NBER Board of Directors that accompanies officialNBER publications.
Asymmetric Learning in Repeated Contracting: An Empirical StudyAlma CohenNBER Working Paper No. 13752January 2008JEL No. D40,D80,D82,D83,G22,L10
ABSTRACT
This paper studies a unique panel dataset of transactions with repeat customers of an insurer operatingin a market in which insurers are not required by law or contract to share information about their customers'records. I use this dataset to test the asymmetric learning hypothesis that sellers obtain over time privateinformation that some of their repeat customers have low risk, and that this learning enables sellersto make higher profits in transactions with these repeat customers. Consistent with this hypothesis,I find that the insurer in my dataset makes higher profits in transactions with repeat customers andthat these profits are driven by transactions with repeat customers with good past claims history withthe insurer; that these higher profits result from repeat customers with good claim history receivinga reduction in premiums that is lower than the reduction in expected costs associated with such customers;and that policyholders with bad claim history are more likely to flee their record by switching to otherinsurers.
Alma CohenThe Eitan Berglas School of EconomicsTel Aviv UniversityRamat-Aviv, Tel-AvivISRAELand [email protected]
1. Introduction
Ever since the seminal work of Akerlof (1970) and Rothschild and Stiglitz (1976),
economic theorists have paid much attention to the operation of markets characterized by
informational asymmetries. One type of informational asymmetry that has received
substantial attention from economic theorists arises from asymmetric learning
accompanying repeated contracting between two parties. In such a case, a seller (buyer)
might learn about a repeat buyer (seller) information that other potential sellers (buyers)
do not have. When such asymmetric learning occurs, parties may ex post obtain market
power and thus make higher profits from repeated contracting. This paper uses a unique
panel date to investigate asymmetric learning in repeated contracting.
Theoretical multi-period models focusing on asymmetric learning in repeated
contracting have been developed for a wide range of markets. For example, in a series of
influential articles in labor economics, researchers developed models in which current
employers are better informed about the ability of their employees than future potential
employers (see e.g., Waldman (1984), Greenwald (1986), Milgrom and Oster (1987),
Ricart i Costa (1988), and Laing (1994)). In these models, the stream of job switchers is
disproportionately composed of less able workers, wages to switchers are set accordingly,
and current employers have some market power over workers who are known to them
(but not to other potential employers) to be of high quality.
Another line of asymmetric learning models focuses on credit market (see, e.g.,
Sharpe (1990), Rajan (1992), Dell’Ariccia, Friedman, and Marquez (1999), Marquez
(2002), and von-Thadden (2004)). In these models, banks over time acquire information
1
2
about repeat borrowers that other banks do not have. This learning enables banks to
obtain market power with respect to borrowers whose high quality is known to the bank
but not by rival banks. Similarly, asymmetric learning models have been developed for
(2000), and de Garidel-Thoron (2005)). In these models, the realization of policy risks
enables insurers to learn over time information about their repeat customers that
competing insurers do not have. This learning about repeat customers enables insurers to
gain an information-based competitive advantage over rival insurers.
While the theoretical literature on asymmetric learning is large, substantial empirical
testing of asymmetric learning did not develop in parallel. Empirical work on markets
with informational asymmetries has focused on adverse selection resulting from
informational asymmetries between buyers and sellers,1 and relatively little work has
been done on asymmetric learning in the presence of repeated contracting. The limited
testing of asymmetric learning models has been at least partly due to the unavailability of
data that would enable researchers to observe prices, profits, costs, and perceived quality
in repeated contracting situations. For example, to test directly the hypothesized existence
of asymmetric learning in labor markets – that is, to test whether an employer is able to
make higher profits on current employees whose high quality is known to the employer
but not to other potential employers – an econometrician would need to observe all the
information that the employer obtains about any given employees as well as the profit
that the employer makes on the given employees.
1 See, e.g., Gensove (1993), Puelz and Snow (1994), Cohen (2003), and Finkelstein and Poterba (2004). For surveys of empirical work in this area, see Chiappori (2000) and Cohen and Siegelman (2007).
3
Given the demanding data requirements for direct testing, some empirical work has
used creative indirect tests. In an influential article that provides evidence of learning
from repeated contracting in the labor market, Gibbons and Katz (1991) take advantage
of information about the reasons for employees’ departure. The study uses the fact that
some employees lose their job due to plant closings – exogenous shocks that are
unrelated to employer learning about employee quality, and thus do not lead new
employers to draw a negative inference from the employees having been laid off. It finds
that workers who are hired after being laid off by another employer receive higher wages
when they were laid off due to plant closing than when they were laid off by a firm that
had discretion whom to lay off.2 In addition, empirical work on the subject has shown
that having a long-term relationship with a bank has a positive effect on the availability
of credit (Petersen and Rajan (1994)).
In the insurance market, D’Arcy and Doherty (1990) show that, consistent with
asymmetric learning, insurers contractually bind their agents from selling private
information about customer records to rival insurers and that entry into the insurance
market is costly. They also document that the profits for cohorts of policyholders decline
with company experience. The compared cohorts of policyholders could well have
differed in aspects other than the policyholder’s experience with the company, and the
authors did not have the data necessary for controlling for differences in policyholder
characteristics other than company experience.3
2 Doiron (1995) and Grund (1998) apply the approach of Gibbons and Katz (1991) to labor market data from Canada and Germany respectively. 3 Insurance markets have also been the subject of empirical work investigating types of learning other than the asymmetric learning on which I focus in this paper. Studying long-term insurance markets, Hendel and Lizarri (2003) provide evidence that their structure is influenced by expectations that, over time, there will be symmetric learning in which all market participants
4
This paper uses a unique panel dataset of repeated contracting in the insurance
market to investigate sellers’ learning about their repeat customers and their resulting
ability to make profits on customers they identify as being of high quality. The dataset
has several features that make it especially well-fitting for studying the subject. To begin,
the dataset includes all the information that the insurer has about each policyholder,
including information relevant to assessing the policyholder’s “quality” (risk). The
dataset also includes full information about the realization of risk of each policy, and thus
enables the researcher to observe the profit made by the insurer on each repeat customer
and its relation to what the insurer knows about the customer. In addition, the dataset
contains information about each policyholder’s decision whether to stay with the insurer
after the policy period. Finally, a notable feature of the Israeli insurance market is the
lack of systems, which could prevent asymmetric learning, for sharing information
among insurers.
My analysis yields several findings that are consistent with asymmetric learning. To
begin, I find that the insurer makes higher profits on repeat customers and, more
importantly, that these higher profits are driven by profits made on customers with good
records with the insurer. Furthermore, the longer the period over which the customer has
a good record, the higher the profits made by the insurer. Under the asymmetric learning
model, a good claim record with the insurer, and not merely experience with the insurer,
is necessary for the seller’s ability to make higher profits. The insurer does not have any
information-based market power with respect to repeat customers with poor records. If
learn the realization of uncertainty concerning a policyholder’s health. In addition, Crawford and Shum (2005) and Israel (2005a, 2005b) study learning by customers, who are generally price-takers in insurance markets, about the service quality of their insurer.
5
such customers were to switch to a rival insurer, the rival would not view their quality
less favorably than the current insurer. In contrast, if a repeat customer with a good claim
record with the insurer were to switch to a rival, the rival might be uncertain about the
customer’s quality. This state of affairs provides the insurer with some information-based
market power over such customers.
Second, consistent with the asymmetric learning model, I find that a seller’s higher
profits on repeat customers with good claim records are due to their not receiving from
the insurer a reduction in premium that fully reflects the customers’ lower risk. While
these repeat customers with good records are charged lower premia by the insurer, the
reduction in premium is lower in magnitude than the reduction in costs (insurance
payments) associated with such repeat customers. This pattern is stronger when the
insurer has more private information about the repeat customers’ low risk – that is, when
the period over which the customers did not have claims with the insurer is long.
Finally, consistent with asymmetric learning and the insurer’s possession of private
information about repeat customers’ risk type, I find that customers with poor claim
records tend to leave the insurer, and customers with good records tend to stay for
another period. Customers with a bad claim history have an incentive to flee their record
and pool themselves with customers leaving their insurer because of exogenous shocks.
The results of the paper highlight the practical significance whether systems of
sharing of information among insurers exist. As stressed earlier, the Israeli market for
which I have data lacks any such system. The desirability of information-pooling systems
has been much debated in Europe, where the European Commission ruled that some
systems of information sharing were anticompetitive (de Garidel (2005)). In the U.S.,
6
some information about occurring accidents is maintained in state records, and it has long
been observed (see, e.g., D'Arcy and Doherty (1990)) that the publicly available
information is highly incomplete and that a new insurer would not be able to get from it
the complete claim history of other insurers' customers. By showing that asymmetric
learning does in fact arise in the absence of information pooling among insurers, the
analysis suggests that pooling systems can have a practically significant effect. It would
be worthwhile for future work to complement the findings of this paper by conducting a
similar study in a market with complete or partial pooling of information among
insurers.4
The remainder of the analysis is organized as follows. Section 2 provides a
theoretical framework and describes the hypotheses that will be tested. Section 3
describes the data and provides summary statistics. Section 4 presents my empirical
analysis of the data. Section 5 concludes.
2 Theoretical Framework
In developing theoretical predictions for testing, it is important to note some
important institutional features of the Israeli automobile insurance market in which the
insurer whose data I study operates. As in many other insurance markets, the Israeli
4 That information sharing systems are practically important does not, of course, imply that their effect is positive or negative. Challenging prior work suggesting that asymmetric learning is welfare-reducing (Crocker and Snow (1986)), de Garidel (2005) recently developed a theoretical model showing that asymmetric learning could have welfare-increasing effects. The evidence in the current paper does not resolve the debate whether asymmetric learning and lack of information pooling systems are welfare-increasing or decreasing, but rather shows that the debate is of practical significance.
7
automobile insurance market is characterized by lack of legally mandated or privately
developed arrangements for sharing information among insurers.5 Also, as is the case in
other markets, the events for which claims are submitted often do not appear in public
records, and new insurers thus cannot learn much about new customers just from
inspecting public records (Insurance Research Council (1991)). Although policyholders
switching to a new insurer are asked to indicate their past claim history on the forms they
fill, policyholders might fail to report their true past claim history when they self-report,
and it is generally believed in the industry that there is significant under-reporting by new
customers.
Another noteworthy feature of the Israeli insurance market is that, as is the case in
many insurance markets, insurers use only one-period policies. Furthermore, these one-
period policies involve no commitments for subsequent periods on the part of either the
customer or the insurer (Kunreuther and Pauly (1985)).6
To develop predictions concerning transactions with repeat customers in this market,
let us consider a two-period model of repeated contracting in an insurance market. (The
analysis can easily be extended to more than two periods.) The simple model discussed
below is largely based on adapting to the insurance setting the classic models of
Greenwald (1986), which models employers’ learning over time about their employees,
5 Systems of information pooling existed in Belgium and France and were ruled to be anticompetitive by the European Commission. See de Garidel-Thoron (2005) for a welfare analysis of the desirability of such systems. 6 There is a line of work that models the optimal design of policies that commit customers and insurers to a multi-period contract (e.g., Dionne and Lasserre (1985), Cooper and Hayes (1987)) or that involve a one-sided commitment of the insurer to offer the policyholder certain terms in subsequent periods (Dionne and Doherty (1994), de Garidel-Thoron (2005)). Although such policies are observed in certain countries (see, e.g., Dionne and Vanasse (1992)), they are not used in the automobile insurance market in Israel.
8
and Sharpe (1990), which models banks’ scholarship over time about their repeat
borrowers.
Consider the following timeline. Suppose that, at 1T = , a large number of risk-
averse individuals enter the insurance market. At this time, all individuals appear
identical to all insurers. Each individual chooses an insurer and purchases from the
insurer a one-period policy against a certain type of loss during Period 1. After the
realization of the Period 1 risk, each individual purchases at 2T = another one-period
policy purchasing coverage for the second period against this type of loss; at this time the
individual must choose whether to purchase a policy for Period 2 from the individual’s
first-period insurer or from a new insurer.
At 1T = , when individuals first enter the market, insurers know that each
policyholder belongs to one of two types ( ),t L H= whose probabilities of a loss in any
given period are Lp and Hp respectively, with 0 1L Hp p< < < . The loss in the event of
an accident is L for both types. The fraction of H types in the population is α .
All insurers are assumed to be risk-neutral and to maximize the present value of their
expected profits over the two periods; without loss of generality, we will assume that the
discount factor is 1. The only contracts that insurers offer are single-period policies with
a given deductible 0d > . Under these policies, in the event of a loss, the insurer would
pay the policyholder an amount of C L R= − . Given that firms offer only one type of
insurance coverage, and individuals thus will not be able to use private information to
sort themselves among alternative levels of coverage offered, it does not matter for our
purposes what information individuals entering the market have about their risk type.
9
During the first period, both the policyholder and the first period insurer observe the
policy’s realization of risks in the first period (Kunreuther and Pauly (1985), Watt and
Vazquez (1997)). This learning enables the first-period insurer to update its prior belief
about the likelihood that the policyholder is of type H . The realization of risks during the
first period is not observable by other insurers to which the individual might elect to
switch in Period 2, and insurers are not required by law or contract to share information.
The assumption that other insurers cannot observe the experience of a new customer with
the customer’s prior insurer is similar to the assumptions made in the literature that new
employers cannot observe the quality of work done under prior employers or that new
banks cannot observe the information obtained by prior banks.
At the end of the first period, when policyholders switch to a new insurer and are
asked about their past claim history, they might choose to misreport. Specifically, for any
given individual, there is a positive probability 0 1h< < that the individual will be
willing, in the event that the individual switches and had an accident in the first period, to
“hide” the accident and not report it. This assumption is consistent with the working
premise of insurance professionals that self-reporting is often substantially incomplete or
inaccurate (Insurance Research Council (1991)).7 Given that the first-period information
is assumed to be unobservable by a new insurer, reporting of past claims might arise only
due to internal norms and ethics, and it is assumed that this will happen with probability
7 One might wonder why new insurers do not ask new customers for statements from their prior insurer verifying their self-reports about past claim history. Alternatively, new customers with a good record might voluntarily elect to submit such statements. In the Israeli insurance market, however, insurers do not seek or use such statements.
10
( )1 h− .8 The fact that self-reporting individuals might under-report past claims is taken
into account by new insurers.
In the beginning of Period 2, each individual might experience with probability
0 1s< < a random shock that will lead the individual to leave the current insurer. Thus,
similar to Greenwald (1986), we assume that individuals might with some probability
wish to change their contracting partner for reasons that have nothing to do with contract
price. The fact that some policyholders switch for “random” reasons – such as, say, a
change in workplace or location – is what makes it impossible for new insurers to infer
that switching necessarily reflects a poor past record. Consistent with this assumption, my
dataset shows that some individuals with an excellent record do switch. If the individual
does not experience a shock, it is assumed that the individual will switch if and only if the
price offered by a rival insurer is lower than the price offered by the current insurer.
In the first period, the probability of an accident that an insurer attaches to any
new policyholder is: ( )1H Lp p pα α= + − . The expected cost of a first-period policy to
the insurer, in turn, is: ( )1C p L d= − .
At the end of the first period, the first-period insurer will use Bayesian updating
based on the first-period realization of risks to revise its estimate of the policyholder’s
type. Let us denote by Aα the probability of the policyholder being of type H conditional
on the policyholder having an accident in the first period, and by NAα the probability that
a policyholder is of type H given that the policyholder did not have a first-period
accident. Bayesian updating provides:
8 Cohen (2005), which focuses on new customers, finds evidence of substantial under-reporting by new customers.
11
( )1H
AH L
pp p
ααα α
=+ −
( )( ) ( )( )
11 1 1
HNA
H L
pp pα
αα α
−=
− + − −
Given this updating, the expected second-period cost that the first-period insurer will
ascribe to the policyholder conditional on an accident in Period 1 is thus:
( )( )( )2 1A A H A LC p p L dα α= + − −
And the expected second-period cost conditional on no accidents in the first
period will be:
( )( )( )2 1NA NA H NA LC p p L dα α= + − −
In this setup, it can be shown that the unique equilibrium has the following
characteristics. To begin, individuals will switch if and only if they had a “switching”
shock or had an accident and are prepared not to report it to the new insurer. The reason
is that policyholders not subject to such a shock will be able to gain from such a switch if
and only if they had an accident and are prepared not to report it. (If they were to switch
and report an accident, the new insurer will charge them the same price as their current
insurer, and thus they will not gain from the switch.)
In the unique equilibrium, new insurers will charge switchers who self-report to them
no past accidents a price of: 2 2 2 2,S RNA NA S RNA AC C C C− −< < , that is defined by:
( )( )
( )( ) ( )( )
( )( ) ( )2 2 21 1
1 1 1 1S RNA A NA
p s s h p sC C C
p s s h p s p s s h p s−
+ − −= +
+ − + − + − + − ;
Given the switching decisions of individuals, the price charged by new insurers to
customers who report zero past claims reflects the fact that the pool of such customers
12
includes some customers who had a claim and are not reporting it and some customers
who did not have a claim and are switching due to a shock. The above price reflects the
average cost in the pool of switchers who report zero past claims.
As to first-period insurers, these insurers will charge their remaining customers
2S RNAC − if they did not have an accident in the first period and 2
AC if they had an accident
in the first period. Given that new insurers charge switchers who report no past claims a
price of 2S RNAC − , there is no reason for current insurers to charge their remaining
customers who had no past claims less than this price. As to customers who had an
accident, current insurers will charge them an amount of 2AC , which is their cost, and
which is what they would be able to obtain if they were to go into the market and
reported their past claim.
Finally, in the unique equilibrium, insurers will charge new customers at 1T = a price
that is below the break-even price for the first period defined by:
( )( )( )1 1 2 2 1 1S RNA NAP C C C s p−= − − − −
For any given new customer attracted at 1T = , the insurer can anticipate making an
expected profit from this customer in the second period. With probability ( ) ( )1 1p s− − ,
the policyholder will not have an accident and will not have a shock leading to departure,
and in such a case the insurer will be able to make expected profit of 2 2S RNA NAC C− − . Thus,
competition for new customers at 1T = will drive the price to P1.
The above analysis yields three testable predictions:
Hypothesis H1: Profits on repeat customers will be higher than on new customers
with the effect driven by profits on repeat customers with a good past record.
13
Customers with a good claim record know that, if they were to switch to a new
insurer, they would be pooled with some customers with bad records. Therefore, they
would not be able to obtain from a new insurer a price that fully reflects their low risk
which is known to their current insurer. Thus, the current insurer will not have to offer
them a price fully reflecting this low risk to keep them.
Hypothesis H2: Relative to repeat customers with bad past claim records, repeat
customers with a good past claim record will be charged lower premia and generate lower
costs, with the reduction in premium associated with customers with good claim records
being lower in magnitude than the reduction in cost associated with such customers.
In the asymmetric learning model, the profits made on repeat customers with
good records are not driven by charging them higher prices than new customers. Rather,
they are driven by the low risk and thus low costs of these customers.
Hypothesis H3: Customers with good records will disproportionately remain with
the insurer for another period.
In the asymmetric learning model, customers with a bad record, but not ones with
a good record, will have an incentive to flee to new insurers to pool themselves with
customers with a good record that leave due to an exogenous shock.
3 Data and Summary Statistics
The paper is based on data that I received from an insurer that operates in the market
for automobile insurance in Israel. The data consists of a panel of about 120 thousand
individuals who purchased policies from the insurer during the period 1994-2000. During
this period, the insurer held between 5% and 10% of the Israeli insurance markets. A
14
subset of the data consisting of information about new customers in their first year was
used in Cohen (2005) to study adverse selection among such customers, as well as by
Cohen and Einav (2007) to study risk preferences among these customers. This paper
takes advantage of the fact that the dataset also includes information about customers that
are repeat customers to study the insurer’s learning about, and its transactions with,
repeat customers.
Overall, the dataset contains about 267 thousand observations (policies). For each
observation (policy), the dataset contains information about the policyholder’s
demographic characteristics (such as age, gender, education, family status, place of birth,
and immigration year), the policyholder’s car characteristics (such as model year, value
of the car, size of engine, commercial vehicle or not, main vehicle or not), policyholder’s
driving characteristics (such as years since getting driving license, number of claims in
past three years, young driver or not, etc.).
The dataset also contain information about the terms of the policy. In the Israeli
insurance market, policies are fairly standardized in terms of their structure. Two types of
deductibles are used, referred to as a regular deductible and a low deductible. I focus on
the subset of individuals who chose regular deductible when joining the insurer, which
consist of 80% of the policies. Customers generally remain with the same type of
deductible when they renew their policies, and these individuals have thus generally
remained with a regular deductible throughout their dealings with the insurer. Because
the regular deductible is the highest deductible used in the Israeli insurance market, the
individuals in the subset of the data on which I focus could not signal being of a low-risk
type to a rival insurer by choosing a higher deductible.
15
In addition, the dataset contains information about the realization of risks covered by
the policy – that is, the number of claims submitted by the policyholder, the amount of
damages reported, and the amount paid (or expected to be paid) to the insured by the
insurer. The dataset also contains information about the period during which the policy
was open, which enables calculation of the earned premium in the event that a policy was
open for less than the full policy period.9 Throughout the paper, I report monetary values
in current (nominal) New Israeli Shekels (NIS) to avoid creating artificial variation in the
data.10
I exclude the last year because I do not have the full realization of the policies for that
year, and am thus left with 6 years of operation, 1994-1999. After excluding the last year
and retaining only policies with regular deductible levels, the dataset used for this study
contains about 218 thousand policies purchased by about 102 thousand policyholders.
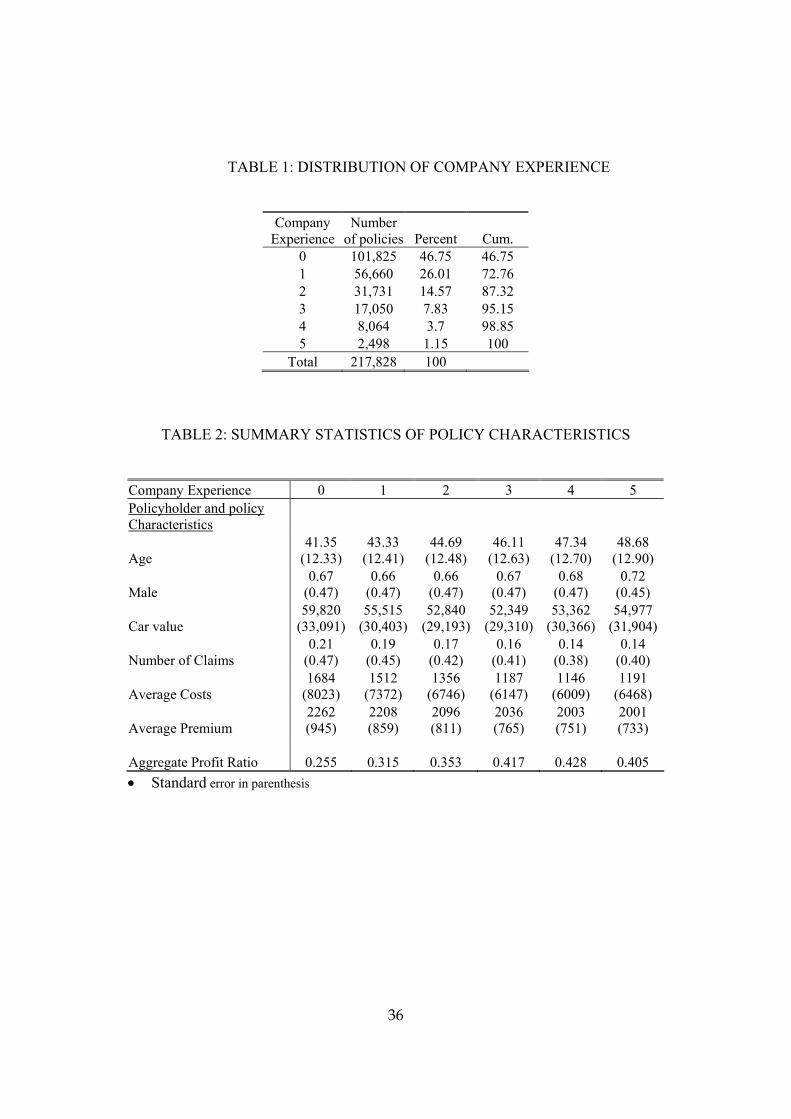
Table 1 displays summary statistics about the distribution of company experience
among policyholders. Among the policies in the dataset, 46.7% were sold to new
customers with no prior experience at the company, 26% were sold to policyholders who
already had one year of experience with the company, 14.6% were policies sold to
9 Insurer's earned premium is equal to the quoted annual premium weighted by the exposed time of the policy. Policyholders who cancel a policy before it expires have to pay only for the period during which the policy was exposed and get a refund if necessary. 10 The following facts may be useful for interpretation and comparison with other papers in the literature. The exchange rate between NIS and U.S. dollars monotonically increased from 3.01 in 1995 to 4.14 in 1999 (on average, it was 3.52). Annual inflation was about eight percent on average, and cumulative inflation over the observation period was 48 percent. I will account for these effects, as well as other general trends, by using year dummy variables throughout the analysis.
16
policyholders who had two years of experience with the company, and 12.7% were
policies sold to policyholders who had been with the company for three or more years.
Table 2 provides summary statistics about policyholder characteristics for different
levels of company experience. As expected, the Table indicates that policyholders with
more years of company experience have a somewhat higher average age. The pools of
policyholders with different levels of company experience do not exhibit substantial
differences in terms of gender composition or mean car value.
As Table 2 indicates, however, there are substantial differences among the pools of
policyholders with different levels of company experience in terms of claim frequency,
premia, and costs. Claim frequency is substantially lower among pools of policyholders
with more company experience, with the frequency declining from 21% among
policyholders with no company experience to 14% among policyholders. As expected,
the average cost (insurance payment) per policy is lower for pools of policyholders with
more company experience, declining from over 1,650 NIS for policyholders with no
company experience to below 1,200 NIS for policyholders with three or more years of
company experience.
Table 2 also indicates that average premium is also lower for pools of policyholders
with more company experience. The average premium declines from 2,262 NIS for
policyholders with no company experience to 2,208 NIS for policyholders with one year
of company experience, to 2,036 NIS for policyholders with three years of company
experience, and to 2,001-2,003 NIS for policyholders with four-five years of company
experience. Note that, as we move from pools with no company experience to ones with
17
more company experience, the decrease in average premium accompanying the move is
smaller in magnitude than the accompanying decrease in average costs.
Given the above observations, it is unsurprising that Table 2 also indicates that the
profitability of policyholder pools is higher for pools with more company experience. In
the insurance market, the profitability of pools of policies is generally assessed by the
loss ratio – the percentage of the aggregate premia earned by the insurer that is paid out
as insurance payments to policyholders submitting claims. The profit ratio, which is equal
to one minus the loss ratio, is thus correspondingly the percentage of aggregate earned
premia that is retained by the insurer after making all insurance payments to
policyholders submitting claims. In my dataset, the profit ratio is 25% for the pool of
policyholders with no company experience, 31% for the pool of policyholders with one
year of company experience, 35% for the pool of policyholders with two years of
company experience, and over 40% for all the pool of policyholders with three or more
years of company experience.
4. Empirical Analysis
I now turn to the empirical analysis of the dataset. I first examine the relation of
profit and the insurer’s possession of information (not shared by other insurers) about a
policyholder’s low risk (section 4.1). To understand the obtained results, I then look
beyond profits at the two elements determining these profits – premia charged and costs
incurred – and study the relation of each of these elements and the insurer’s possession of
such information (section 4.2). Finally, I look at the relation of customers’ switching
18
decisions and the insurer’s possession of information about a customer’s low risk (section
4.3). Throughout, I conduct the analysis both at the level of individual policies level and
at the aggregate level of policy pools. I use the aggregate, grouped approach both as a
robustness check and because the insurance industry commonly assesses pools of policies
by examining their aggregate performance.
4.1. Profits and the Insurer’s Learning
I first test whether the insurer makes higher profits on policies sold to policyholders
who are known to the insurer – but not to the same extent to other insurers – to be of low
risk. For the insurer to have such information about a policyholder, the insurer needs both
to have a company record about the policyholder and for the record to be one with good
claim history. Below I therefore test (i) whether the insurer makes higher profits on
repeat customers, (ii) whether these higher profits are driven by transactions with
customers with a good company record, and (iii) whether these profits are highest when
the policyholder has had a good company record with the insurer for a relatively long
period of time.
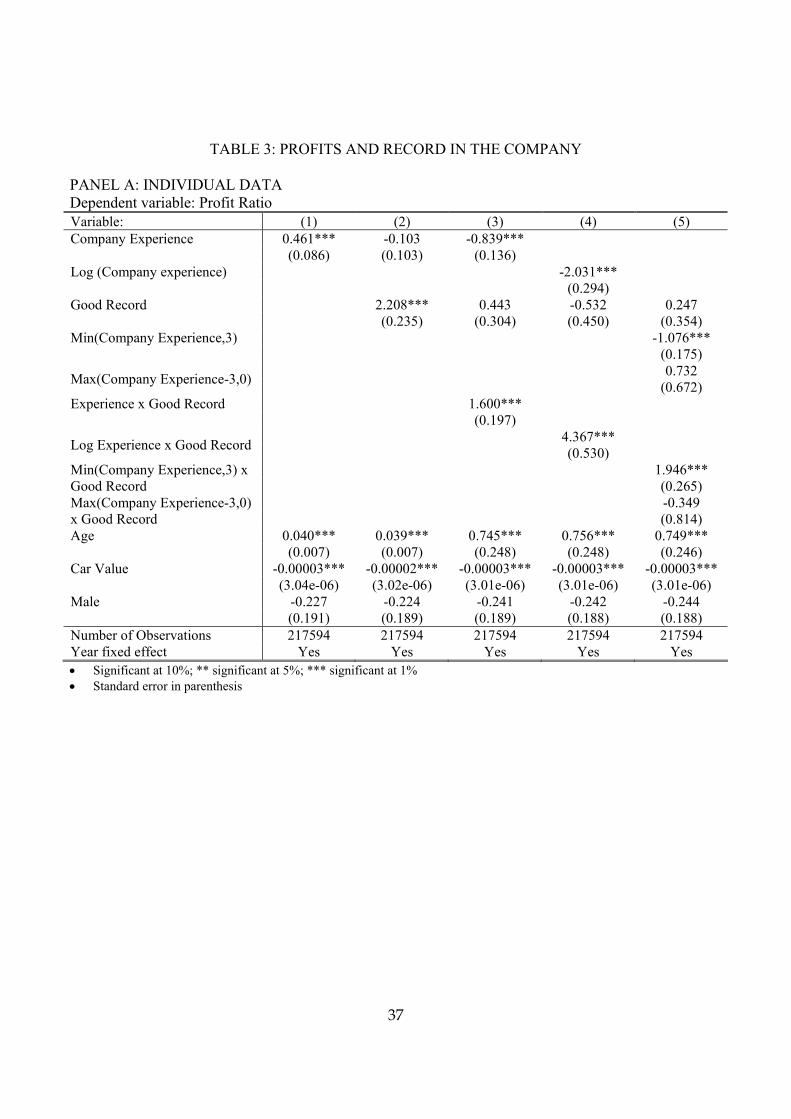
4.1.1. Individual Data
Table 3, panel A presents the results of a Tobit regression of the profitability of
individual policies. Throughout, the dependent variable is the profit ratio, which is
defined as the ratio of the insurer’s profit from selling the policy to the earned premium.
The insurer’s profit form selling the policy is equal to the earned premium minus the cost
of insurance payments if any. I use Tobit regressions because the dependent variable is
19
censored from above at 1 (85% of the policies were not involved in a claim and have a
profit ratio equal to this upper bound of 1).
In all the regressions, in addition to the variables that are my chief interest, I use as
controls the policyholder’s age, the value of the policyholder’s car, and a dummy variable
indicating whether the policyholder is a male. I also control for year fixed effects.11
Company experience is of course necessary for learning. In the first regression,
displayed in column 1 of Table 3, the dependent variable of interest is company
experience defined as the number of years of company experience that the policyholder
has. The coefficient of experience is positive and significant (at 99% level).
Of course, the ability of sellers to make higher profits on repeat customers could
result from non-informational switching costs that enable the seller to charge high prices
to customers for whom a switch would be costly.12 Unlike in a model with non-
informational switching costs, however, under the asymmetric learning model, what
matters for the insurer’s ability to make higher profits is not merely company experience
but a company experience that provides the seller with positive information that the
customer has low risk. It is only with respect to such customers that the insurer could
have information-based market power. In contrast, the insurer cannot have an
information-based market power over repeat customers who have a poor record with the
11 Asymmetric learning theory does not predict that profits for the same customers will increase with company experience. Rather, in this model, profits are higher on repeat customers because high-risk, bad-claims-record customers tend to depart, and repeat customers thus disproportionately come from the subset of beginning customers who have low risks. For this reason, I do not test for asymmetric learning model using regressions with individual policyholder fixed effects, as such regressions focus on over-time variation in profit ratios for the same individuals. 12 The literature on switching costs is large. See, e.g., Dahlby and West (1986), Nilssen (1992), Klemperer (1995), Shy (2002), and Stango (2002).
20
insurer and thus have little to lose in terms of their perceived risk type if they switch to a
rival insurer.
Therefore, in a regression displayed in the second column of Table 3, I add a
dummy variable indicating whether the policyholder has a good company record. With
the addition of this variable, company experience is no longer statistically significant.
Having a good company record is positive and significant (at 99% level).
The extent to which not having past claims is indicative of being of low risk
depends, of course, on the length of period during which the policyholder did not have a
claim. That is, the asymmetric learning model predicts that the extent to which a good
company record matters should depend on company experience. I therefore add, in a
regression displayed in the third column of Table 3, an interaction term of the good
company record dummy and company experience. The interaction term is positive and
significant (at the 99% level). In this regression, neither good company record by itself,
nor company experience by itself, are positive and significant (good company record is
not significant, and company experience is significant and negative).
A specification that uses company experience implicitly assumes that each extra
year of good record is equally useful in terms of providing the insurer with information
about the customer’s risk. For robustness check, I replace company experience with its
log in a regression displayed in the fourth column of Table 3. The results remain
essentially the same.
In the fifth and final column of Table 3, I use a piecewise specification that allows
for company experience to make a different contribution up to the three years of company
experience and from this point on. In particular, I replace company experience with two
21
variables: one that is equal to the maximum between 3 and the policyholder’s company
experience; and one that is equal to the minimum between 0 and the excess of the
policyholder’s company experience over 3. The regression also includes the interaction
terms of good company record with the two new variables.
The interaction terms of good record and extra experience up to 3 years is positive
and significant (at 99% level). The interaction term of good record and extra experience
beyond three years is insignificant. These results indicate that, after a customer has three
years of no claims history with the insurer, the customer’s low risk is sufficiently well
established that another year or two of no claims do not matter much.
4.1.2. Grouped data
The second approach that I use is based on grouped data. I divide all the policies in
the dataset into sub-groups in two ways. The first partition divides the dataset according
to the customer’s years of company experience, whether the customer had a good
company record, and the calendar year to generate sub-groups of policies that have the
same number of years of company experience, the same value for the good company
record variable, and the same calendar year. This division results in 38 groups.
I run on these 38 groups an OLS regression in which the dependent variable is the
group’s profit ratio. In the grouped data, profit ratio is defined as the ratio of the
aggregate profit generated by the group to the aggregate earned premium produced by
this pool of policies. The aggregate profit generated by the group is equal to the aggregate
earned premium from the pool of policies minus the aggregate insurance payment
resulting from the pool of policies.
22
Table 3, panel B displays the results of a regression that corresponds in nature to the
regression in the second column in panel A of Table 3. The independent variable of
interest is a dummy variable indicating whether the group is made of policyholders with a
good company record and the number of years of company experience that the
policyholders in the pool have. As controls, I use the average policyholder age, the
average car value, and the proportion of males for each pool of policies. I weight the
regression by the number of observations in each pool.
The results indicate that the company makes higher profits on pools of policies
purchased by policyholders with a good company record with the insurer. The coefficient
of good company record is positive and significant at the 99% level. Controlling for other
characteristics of the pool of policies, a pool of policies with a good claims record has a
profit ratio higher by 0.058 (5.8%). To put this effect in context, we could compare it to
the mean profit ratio in the pools of policies which is 0.317 (31.7%). Thus, having
policyholders with good claims record has a positive effect on the profit ratio with a
magnitude that is almost one-fifth of the mean level of the profit ratio among the pools of
policies.
Because the first partition results in only 38 groups, I proceed to a finer partition of
the dataset into a larger number of groups of policies. In this second partition into groups,
in addition to dividing the dataset as before according to (i) the customer’s years of
company experience, (ii) whether the customer had a good company record, and (iii) the
calendar year, I also divide the dataset according to (iv) the customer’s age group
(dividing the customers into four different age groups), (v) the customer’s gender, and
(vi) the car value group of the customer (dividing the customers into four car value
23
groups). This second method of division results in 1154 groups of policies, with each
group including policies that are identical to each other along each of the six dimensions
(i)-(vi).
I run on the 1154 groups three OLS regressions with the group’s profit ratio as the
dependent variable. As to the explanatory variables, I use specifications similar to those
used for the individual policy data in columns (3)-(5) of panel A of Table 3. The results
are displayed in columns (2)-(4) of panel B of Table 3. The regressions yield similar
results to the ones obtained in the corresponding columns of Table 3, panel A.
Thus, overall, both the regressions based on individual data and the regressions
based on grouped data produce results consistent with the asymmetric learning model.
The insurer makes larger profits on repeat customers with good past records, but not on
repeat customers without such record, and the magnitude of the profits made on
customers with a good past record increases with the length of period through which the
customers have obtained this record. Thus, the insurer’s profit is associated with the
insurer’s having private information about a customer’s low risk.
4.2. Premia, Costs, and the Insurer’s Learning
We have thus far seen that, consistent with the asymmetric learning theory, the
insurer makes, controlling for company experience, higher profits on customers who
have a good record with the insurer and for whom the insurer thus has private
information indicating a low risk. I now turn to look beyond these high profits at the two
elements defining profits – the premia (prices) charged to customers, and the costs
(insurance payments) generated by customers – and to study the relation of each of these
24
elements and the insurer’s possession of private information about customers’ low risk.
The prediction of the asymmetric learning model, which I examine below, is that the
profits made on repeat customers with a good past company record is driven not by
charging these customers higher prices but by the lower costs generated by such
customers. As before, I conduct the testing twice, once using individual policy data and
once using grouped data.
4.2.1 Individual Data
Table 4, panel A, column (1) provides the results of an OLS regression on all
individual policy in which the dependent variable is the customer’s premium. The
independent variable of interest is a dummy variable indicating whether the customer has
a good claim history record with the insurer, as well as an interaction term interacting
company experience with the good past record dummy. I control for the customer’s
company experience, the customer’s age, the customer’s gender, and the value of the
customer’s car, as well as for year fixed effects.
The results indicate that the coefficient of good company record is negative and
significant (at the 1% confidence level). Furthermore, the coefficient of the interaction
term is negative and significant (at the 1% confidence level). Thus, the effects of good
record is larger when the good record was obtained over a longer period – that is, the
more substantial the insurer’s private information about the customer’s low risk.
If repeat customers with good claim history are not charged higher premia by the
insurer, the higher profits generated by transacting with such customers can come only
from the lower costs (insurance payments) generated by such customers. I therefore next
25
run two regressions on all individual policies – one in which the dependent variable is the
cost to the insurer of the policy, and one in which the dependent variable is the number of
claims generated by the policy. In the cost regression, I use a Tobit regression because
the dependent variable is censored from below by 0 (recall that the 85% of the policies
were not involved in a claim). In the number of claims regression, I use a negative
binomial regression.
As before, the independent variables of interest are a dummy variable indicating
whether the customer has a good claim history record with the insurer and a variable
interacting company experience with the good past record dummy. I continue to control
for the customer’s company experience, the customer’s age, the customer’s gender, and
the value of the customer’s car, as well as for year fixed effects.
The results are displayed in columns (2) and (3) of panel A of Table 4. The
coefficient of good claim record is negative and significant (at the 1% confidence level)
in both the cost regression and the number of claims regression. Furthermore, the
coefficient of the interaction term of good claim history and company experience is
negative and significant (at the 1% confidence level) in both regressions. Thus, costs are
lower when the insurer has private information based on past claim history suggesting
low risk, and the magnitude of this association is larger when the insurer’s private
information is substantial and based on a sufficiently long period.
It is instructive to compare the sizes of the coefficients of interest in the premim
regression and the cost regression. While the coefficient of having a good claim record is
negative in both the premium and cost regressions, the size of this coefficient is more
than 10 times larger in the latter regression than in the former regression. Similarly, while
26
the coefficient of the interaction of good claim record and company experience is
negative in both regressions, the size of this coefficient is also more than 10 times larger
in the latter regression than in the former regression.
The above pattern explains the source of higher profits documented with respect to
repeat customers with good claim history (see Table 3, panel A). Consistent with the
asymmetric learning model, these customers receive from the insurer a lower reduction in
premium charged than would be necessary to reflect fully the lower costs that these
customers are expected to generate based on the insurer’s private information of their
good claim record.
4.2.2 Grouped Data
I now turn to examine the relation between premia and costs and the insurer’s
possession of private information about customers’ low risks using grouped data. I use
for this purpose the partition into 1154 groups of policies with identical covariates along
six dimensions that I used in the preceding section.
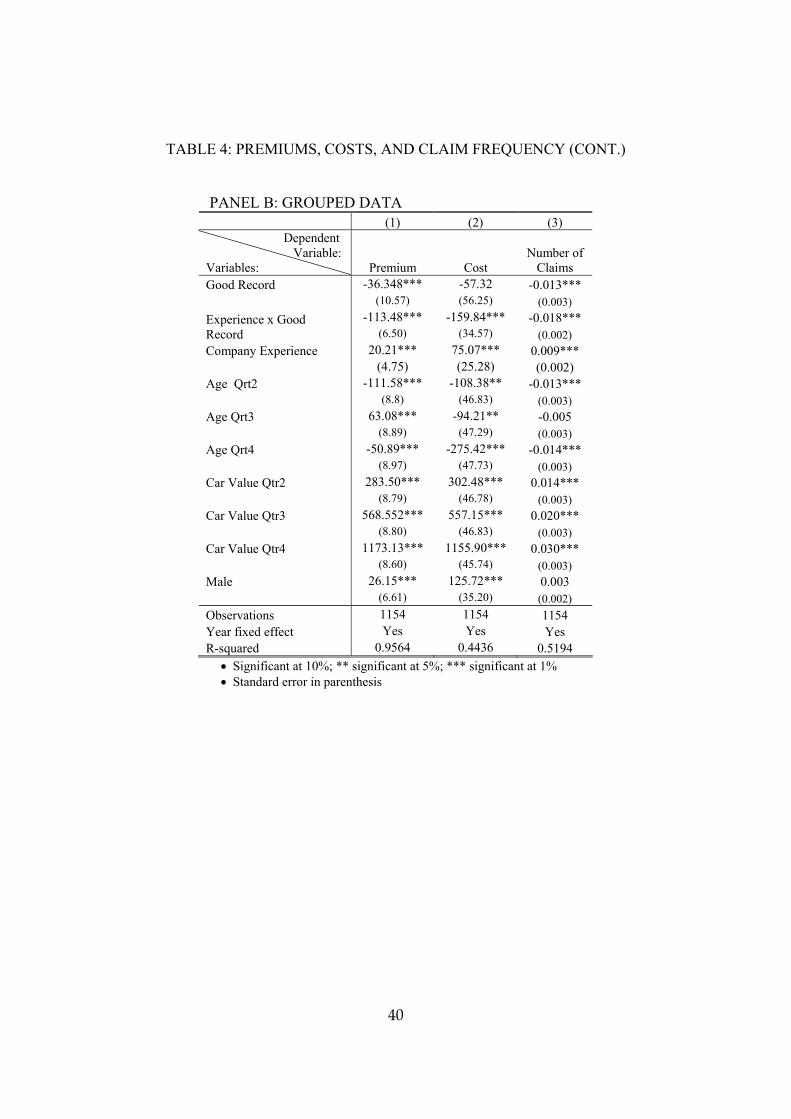
Table 4, panel B, columns (1)-(3) provides the results of three regressions that are
similar in nature to the regressions of columns (1)-(3) of Table 4, panel A. The dependent
variables in the regressions are, respectively, the average premium per policy, the average
cost per policy, and the average number of claims per policy for each group of policies.
Each of the three regressions has two independent variables of interest for any given
group of policies: (i) a dummy indicating whether the policyholders in the pool have a
good past claims record at the company, and (ii) an interaction variable interacting the
good past claim history dummy with the level of company experience of the
27
policyholders in the group. In each of the three regressions, I control for the level of
company experience of the policyholders in the group; the age group of the policyholders
in the pool; the car value group of the policyholders in the pool; the gender of the
policyholders in the pool; and the year in which the policies in the pool were issued.
Consistent with the findings in panel A, the coefficient of the interaction term of
company experience and having a good past claims record is negative and significant (at
the 1% confidence level) in each of the three regressions. Thus, pools of policies with a
good claim record are associated with lower average premium per policy, lower average
costs per policy, and lower number of claims per policy to an extent that increase with the
length of the period during which the good claim record was obtained. Furthermore, the
size of the negative coefficient of the interaction variable is higher in the average cost per
policy regressions than in the average premium per policy regression.
Overall, the results using grouped data are consistent with those obtained earlier
using individual data. The existence of private information indicating low risk in the
hands of the insurer is associated with lower costs and with a reduction in premium that is
lower in magnitude than the cost reduction and thus creates the potential for profits.
4.3 Switching Decisions and the Insurer’s Learning
Finally, I turn to examining a third prediction of the asymmetric learning model.
Under the asymmetric learning model, the lower risks generated by repeat customers,
which I documented in the preceding section, are due to policyholders’ switching
decisions. In the asymmetric learning model, the lower risks posed by repeat customers,
and the lower costs (insurance payments) generated by such customers, result from the
28
disproportionate tendency of customers with good past records, who are likely to pose
lower risks, to remain with the insurer, as well as the disproportionate tendency of
customers without good past records, who are likely to pose higher risks, to flee from
their bad records by switching to another insurer. I now turn to testing whether this is the
case.
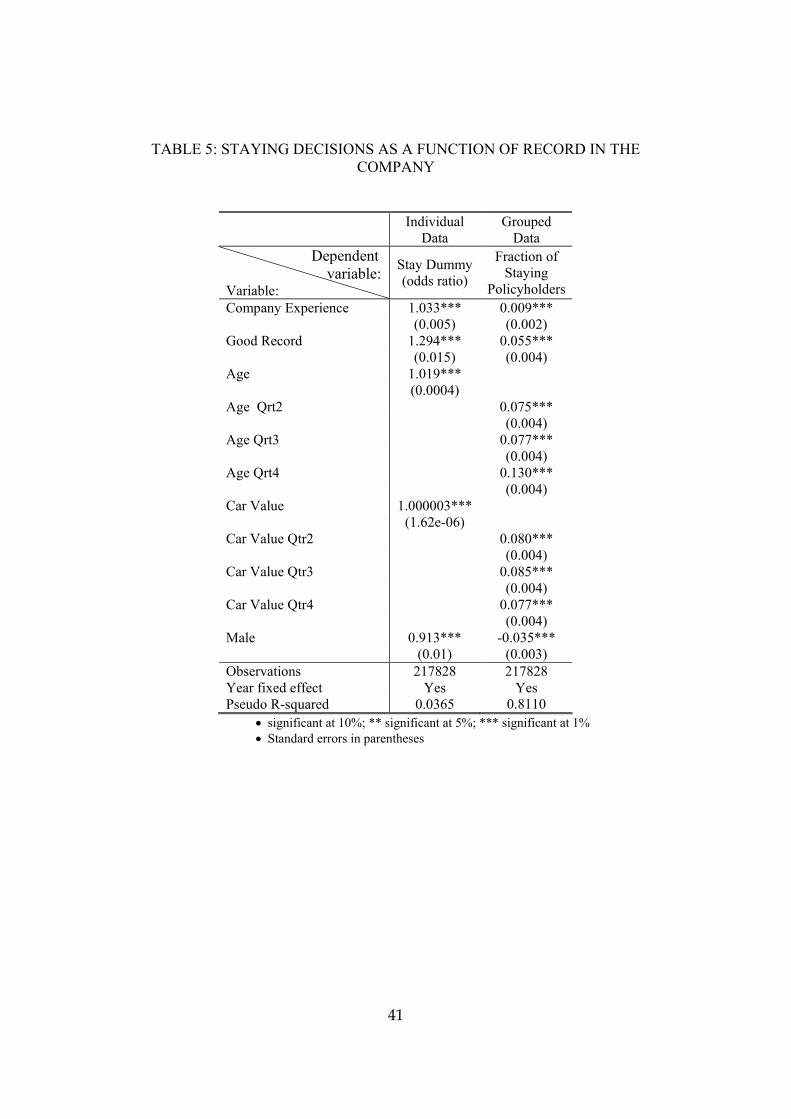
Table 5, column (1) displays the results of a logit regression on the set of all
individual policies in which the dependent variable is a dummy indicating whether the
policyholder elected to stay with the insurer for another period at the end of the policy
period. The dependent variable of interest is whether the policyholder has a good
company record. I use as controls the policyholder’s company experience, the
policyholder’s age, the value of the policyholder’s car, and a dummy variable indicating
whether the policyholder is a male.
Column (2) of Table 5 displays the results of an OLS regression based on
aggregate, grouped data. I use again the partition of the policies into 1154 policy groups
used earlier. I run an OLS regression in which the dependent variable is the fraction of
the policyholders in the pool who elected to stay with the insurer for another year at the
end of the policy period. The dependent variable of interest is whether the policyholders
in the group of policies had a good past claims record with the insurer. As controls, I use
the age group of the policyholders in the pool, the car value group of the policyholders in
the pool, the gender of the policyholders in the pool, the level of company experience of
the policyholders in the pool, as well as the year in which the policies in the pool were
issued.
29
Both regressions produce results that are consistent with the asymmetric learning
model. In both regressions, the coefficient of a good company record is positive and
significant at the 99% level. In the individual policies regression, the coefficient is 1.294,
which implies that the probability of remaining with the insurer for another period is 1.29
times higher if the policyholder has a good past record with the insurer. In the grouped
data regression, the coefficient is 0.06, which implies that another 6% of the
policyholders in a pool will remain with the insurer for another period if the
policyholders in the pool have a good claims record. Thus, remaining with the insurer for
another period has an economically meaningful association with the insurer’s possession
of private information indicating that the customer is of a low risk.
5 Conclusion
This paper has used a unique and rich panel dataset obtained from an insurance
company to test empirically the existence of asymmetric learning in markets with
repeated contracting. Consistent with the predictions of asymmetric learning theory, I
find that the insurer makes higher profits on policies sold to its repeat customers and that
these profits are driven by profits on repeat customers who had a good company record
with the insurer; that these profits are generated not by charging higher premia but rather
by the lower costs (and number of claims) generated by policyholders with a good
company record and the insurer’s not providing these policyholders with a discount fully
reflecting their low risk; and that the high quality of the pool of repeat customers’
30
policies is produced by the greater tendency of customers with bad records to leave the
insurer. The study thus provides evidence that is consistent with the theoretical literature
on asymmetric learning in markets with repeated contracting.
31
References
Akerlof, George. A. (1970), “The Market for 'Lemons': Qualitative Uncertainty and the
Market Mechanism,” Quarterly Journal of Economics, Vol. 84, pp. 488-500. Chiappori, Pierre-Andre (2000), “Econometric Models of Insurance under Asymmetric
Information,” Handbook of Insurance (G. Dionne, ed.). Cohen, Alma (2005), “Asymmetric Information and Learning: Evidence from the
Automobile Insurance Market,” Review of Statistics and Economics, Vol. 87, Issue 2, pp:197-207.
Cohen, Alma and Liran Einav (2007), “Estimating Risk Preferences from Deductible
Choice,” American Economic Review, Vol. 97, pp. 745-788. Cohen, Alma and Peter Siegelman (2007), “Adverse Selection in Insurance Markets,”
Working Paper. Cooper, R., and B. Hayes. (1987), “Multi-period Insurance Contracts, ”International
Journal of Industrial Organization, Vol.5, pp. 211-231. Crawford, Gregory and Matthew Shum (2005), “Uncertainty and Learning in
Pharmaceutical Demand,” Econometrica, 73, 1137-73. D’Arcy, Stephen, P., and Neil, A. Doherty (1990), “Adverse Selection, Private
Information, and Lowballing in Insurance Markets,” Journal of Business, Vol. 63, pp. 145-164.
Dahlby, Bev, and Douglas, S. West (1986), “Price Dispersion in an Automobile
Insurance Market,” Journal of Political Economy, Vol. 94, pp. 418-438. Dell’Ariccia, Giovanni, Ezra Friedman, and Robert Maquez (1999), “Adverse Selection
as a Barrier to Entry in the Banking Industry, ”The Rand Journal of Economics, Vol. 30, pp. 515-534.
de Garidel-Thoron, Thomas (2005), “Welfare-Improving Asymmetric Information in
Dynamic Insurance Markets,” Journal of Political Economy, Vol. 113, pp. 121-150. Dionne, Georges, and Neil A. Doherty (1994), “Adverse Selection, Commitment and
Renegotiation: Extension to and Evidence from Insurance Market,” Journal of Political Economy, Vol. 102, pp..210-235.
32
Dionne, Georges, and Pierre Lasserre (1985),“ Adverse Selection, Repeated Insurance Contracts and Announcement Strategy,” Review of Economic Studies, Vol. 52, pp. 719-723.
Dionne, Georges, and Charles Vanasse (1992), “Automobile Insurance Ratemaking in the
Presence of Asymmetrical Information,” Journal of Applied Econometrics, Vol. 7, pp. 149-165.
Doiron, Denise (1995), “Lay-offs as Signals: The Canadian experience,” The Canadian Journal of Economics, 28, 899-913.
Finkelstein, Amy, and James Poterba (2004), “Adverse Selection in Insurance Markets: Policyholder Evidence from the U.K. Annuity Market,” Journal of Political Economy 112, 183-208, with James Poterba.
Genesove, David (1993),” Adverse Selection in the Wholesale Used Car Market,” Journal of Political Economy, Vol. 101, pp. 644-665.
Gibbons, Robert. and Lawrence Katz (1991), “Layoffs and Lemons,” Journal of Labor
Economics, Vol. 9, pp. 351-380. Greenwald, Bruce (1986), “Adverse selection in the Labor Market,” The Review of
Economic Studies, Vol. 53, pp. 325-347. Grund, Christian (1998), “Stigma Effects of Layoffs? Evidence from German Micro-
Data,” Economics Letters, 64, 241-247. Hendel, Igal and Alessandro Lizzeri (2003), “The Role of Commitment in Dynamic
Contracts: Evidence from Life Insurance,” Quarterly Journal of Economics, 299-327. Insurance Research Council (1991), Adequacy of Motor Vehicle Records in Evaluating
Driver Performance. Israel, Mark (2005a), “Tenure Dependence in Consumer-Firm Relationships: An
Empirical Analysis of Consumer Departures from Automobile Insurance Firms, RAND Journal of Economics, 36, 165-192.
Israel, Mark (2005b), “Services as Experience Goods: An Empirical Examination of
Consumer Learning in Automobile Insurance,” American Economic Review, 2005 Klemperer, Paul (1995), “Competition when Consumers have Switching Costs” an
Overview with applications to Industrial organization, Macroeconomics, and International Trade,” Review of Economic Studies, Vol. 62, pp. 515-539.
33
Kunreuther, Howard and Mark V. Pauly (1985), “Markets equilibrium with Private Knowledge: An Example,” Journal of Public Economics, Vol. 26, pp. 269-288.
Laing, D. (1994), “Involuntary Layoffs in a Model with Asymmetric Information
Concerning Worker Ability,” Review of Economic Studies, Vol. 61, pp. 375-392. Ma, Ching-to Albert, and Andrew M. Weiss (1993), “A Signaling Theory of
Unemployment,” European Economic Review, Vol. 37, pp. 135-157. Milgrom, Paul and Oster, Sharon (1987), “Job Discrimination, Market Forces, and the
Invisibility Hypothesis,” Quarterly Journal of Economics, Vol. 102, pp. 453-376. Marquez, Robert (2002), “Competition, Adverse selection, and Information Dispersion in
the Banking Industry, Review of Financial Studies, Vol. 15, pp. 901-926. Nilssen, Tore (1992), “Two Kinds of Consumer Switching Costs,” The Rand Journal of
Economics, Vol. 23, pp. 579-589. Nilssen, Tore (2000), “Consumer Lock-in with Asymmetric Information, International
Journal of Industrial Organization, Vol. 18, pp. 641-666. Petersen, A. Mitchell, and Rajan, Raghuram (1994), “The Benefit of Lender
Relationships: Evidence from Small Business Data,” Journal of Finance, Vol. 49, pp. 3-37.
Prendergast, Canice (1992), “The Insurance Effect of Groups,” International Economic
Review, 33, 567-81. Puelz, Robert, and Arthur Snow (1994), “Evidence on Adverse Selection: Equilibrium
Signaling and Cross-Subsidization in the Insurance Market,” Journal of Political Economy, Vol. 102, pp. 236-257.
Rajan, Raghuram (1992), “Insiders and Outsiders: The Choice between Informed and
Arm’s length debt,” Journal of Finance, Vol. 47, pp. 1367-1400. Ricart i Costa, J. (1988), “Managerial Performance and Task Assignment,”
Econometrica, Vol. 56, pp. 449-466. Rothschild, Michael and Joseph E. Stiglitz (1976), “Equilibrium in Competitive
Insurance Markets: An Essay on the Economics of Imperfect Information.” Quarterly Journal of Economics Vol. 90, pp. 629-649.
34
Sharpe, Steven (1990), “Asymmetric Information, Bank Lending and Implicit Contracts: A Stylized Model of Customer relationships, Journal of Finance, Vol. 45, pp. 1069-1087.
Shy, Oz (2002), “A Quick-and-Easy Method for Estimating Switching Costs,”
International Journal of Industrial Organization, Vol. 20, pp. 71-87. Stango, Victor (2002), “Pricing with Consumer Switching Costs: Evidence from the
Credit Card Market,” The Journal of Industrial Economics, Vol. 30 pp. 475-492. Waldman, Michael (1984), “Job Assignment, Signaling, and Efficiency,” Rand Journal
of Economics, Vol. 15, pp. 255-267. Watt, Richard and Francisco Vazquez (1997), “Full Insurance, Bayesian Updated
Premiums, and Adverse Selection,” Geneva Papers on Risk and Insurance Theory, Vol. 22, pp. 135-150.
Von-Thadden, Ernst-Ludwig (2004), “Asymmetric information, bank lending and
implicit contracts: A stylized model of customer relationships,” Finance Research Letters, 1, 11-23.
35
Appendix: Variable definitions Academic Degree A dummy variable that is equal to 1 if the insured have an
academic degree and 0 otherwise. Male A dummy variable that is equal to 1 if the insured is a male
and 0 otherwise. Relative Car Value The car value divided by the mean value of the cars at that
year. CC Weight The volume of the engine in cubic centimeters (cc). This is a
measure of size and power. Main Vehicle A dummy variable that is equal to 1 if the car is not the main
car in the household. Use of the car A dummy variable that is equal to 1 if the policyholder uses
the car for business. Experience Number of years the policyholder stayed with the company. Experience for Customers with No Company Claims
Equal to experience if the policyholder had no claims during his years with the company and 0 otherwise.
Experience for Customers with Company Claims
Equal to experience if the policyholder had claims during his years with the company and 0 otherwise.
No Company Claim A dummy variable that is equal to 1 if the policyholder had no claims during his years within the company and 0 otherwise.
TABLE 2: SUMMARY STATISTICS OF POLICY CHARACTERISTICS
Company Experience 0 1 2 3 4 5 Policyholder and policy Characteristics
Age 41.35
(12.33) 43.33
(12.41) 44.69
(12.48) 46.11
(12.63) 47.34
(12.70) 48.68
(12.90)
Male 0.67
(0.47) 0.66
(0.47) 0.66
(0.47) 0.67
(0.47) 0.68
(0.47) 0.72
(0.45)
Car value 59,820
(33,091)55,515
(30,403)52,840
(29,193) 52,349
(29,310)53,362
(30,366) 54,977
(31,904)
Number of Claims 0.21
(0.47) 0.19
(0.45) 0.17
(0.42) 0.16
(0.41) 0.14
(0.38) 0.14
(0.40)
Average Costs 1684
(8023) 1512
(7372) 1356
(6746) 1187
(6147) 1146
(6009) 1191
(6468)
Average Premium 2262 (945)
2208 (859)
2096 (811)
2036 (765)
2003 (751)
2001 (733)
Aggregate Profit Ratio 0.255 0.315 0.353 0.417 0.428 0.405 • Standard error in parenthesis
37
TABLE 3: PROFITS AND RECORD IN THE COMPANY
PANEL A: INDIVIDUAL DATA Dependent variable: Profit Ratio Variable: (1) (2) (3) (4) (5) Company Experience 0.461*** -0.103 -0.839*** (0.086) (0.103) (0.136) Log (Company experience) -2.031*** (0.294) Good Record 2.208*** 0.443 -0.532 0.247 (0.235) (0.304) (0.450) (0.354) Min(Company Experience,3) -1.076*** (0.175)
0.732 Max(Company Experience-3,0) (0.672) Experience х Good Record 1.600*** (0.197)
4.367*** Log Experience х Good Record (0.530) 1.946*** Min(Company Experience,3) х
Good Record (0.265) -0.349 Max(Company Experience-3,0)
х Good Record (0.814) Age 0.040*** 0.039*** 0.745*** 0.756*** 0.749*** (0.007) (0.007) (0.248) (0.248) (0.246) Car Value -0.00003*** -0.00002*** -0.00003*** -0.00003*** -0.00003*** (3.04e-06) (3.02e-06) (3.01e-06) (3.01e-06) (3.01e-06) Male -0.227 -0.224 -0.241 -0.242 -0.244 (0.191) (0.189) (0.189) (0.188) (0.188) Number of Observations 217594 217594 217594 217594 217594 Year fixed effect Yes Yes Yes Yes Yes • Significant at 10%; ** significant at 5%; *** significant at 1% • Standard error in parenthesis
38
TABLE 3: PROFIT, EXPERIENCE, AND RECORD IN THE COMPANY (Cont.) PANEL B: GROUPED DATA Dependent variable: Profit Ratio
Variable: (1) (2) (3) (4) Company Experience -0.037 -0.028*** (0.044) (0.01) Good Record 0.007 0.004 -0.013 0.004 (0.032) (0.023) (0.034) (0.027) Log Company Experience -0.064*** (0.023) Min(Company Experience,3) -0.032** (0.013) Max(Company Experience-3,0) -0.001 (0.055) Experience х Good Record 0.058*** 0.042*** (0.017) (0.014)
0.107*** Log Experience х Good Record (0.038) 0.046** Min(Company Experience,3) х
Good Record (0.019) 0.017 Max(Company Experience-3,0) х
Good Record (0.063) Mean Age 0.03 (0.032) Mean Car Value 0 (0) Male -0.961** (0.439) Age Qrt2 0.014 0.014 0.014 (0.019) (0.019) (0.019) Age Qrt3 0.058*** 0.05*** 0.06*** (0.02) (0.02) (0.02) Age Qrt4 0.107*** 0.107*** 0.107*** (0.02) (0.02) (0.02) Car Value Qtr2 -0.061*** -0.061*** -0.061*** (0.019) (0.019) (0.019) Car Value Qtr3 -0.089*** -0.089*** -0.089*** (0.019) (0.019) (0.019) Car Value Qtr4 -0.151*** -0.151*** -0.151*** (0.019) (0.019) (0.019) Male -0.050*** -0.050*** -0.050*** (0.015) (0.015 (0.015) Observations 38 1154 1154 1154 Year fixed effect Yes Yes Yes Yes R-squared 0.92 0.2621 0.2626 0.2610
• Significant at 10%; ** significant at 5%; *** significant at 1% • Standard error in parenthesis
Good Record -36.348*** -57.32 -0.013*** (10.57) (56.25) (0.003)
-113.48*** -159.84*** -0.018*** Experience х Good Record (6.50) (34.57) (0.002) Company Experience 20.21*** 75.07*** 0.009*** (4.75) (25.28) (0.002) Age Qrt2 -111.58*** -108.38** -0.013*** (8.8) (46.83) (0.003) Age Qrt3 63.08*** -94.21** -0.005 (8.89) (47.29) (0.003) Age Qrt4 -50.89*** -275.42*** -0.014*** (8.97) (47.73) (0.003) Car Value Qtr2 283.50*** 302.48*** 0.014*** (8.79) (46.78) (0.003) Car Value Qtr3 568.552*** 557.15*** 0.020*** (8.80) (46.83) (0.003) Car Value Qtr4 1173.13*** 1155.90*** 0.030*** (8.60) (45.74) (0.003) Male 26.15*** 125.72*** 0.003 (6.61) (35.20) (0.002) Observations 1154 1154 1154 Year fixed effect Yes Yes Yes R-squared 0.9564 0.4436 0.5194
• Significant at 10%; ** significant at 5%; *** significant at 1% • Standard error in parenthesis
41
TABLE 5: STAYING DECISIONS AS A FUNCTION OF RECORD IN THE COMPANY
Individual
Data Grouped
Data Dependent variable: Variable:
Stay Dummy (odds ratio)
Fraction of Staying
Policyholders Company Experience 1.033*** 0.009*** (0.005) (0.002) Good Record 1.294*** 0.055*** (0.015) (0.004) Age 1.019*** (0.0004) Age Qrt2 0.075*** (0.004) Age Qrt3 0.077*** (0.004) Age Qrt4 0.130*** (0.004) Car Value 1.000003*** (1.62e-06) Car Value Qtr2 0.080*** (0.004) Car Value Qtr3 0.085*** (0.004) Car Value Qtr4 0.077*** (0.004) Male 0.913*** -0.035*** (0.01) (0.003) Observations 217828 217828 Year fixed effect Yes Yes Pseudo R-squared 0.0365 0.8110
• significant at 10%; ** significant at 5%; *** significant at 1% • Standard errors in parentheses