Asynchronous Orthogonal Sample Design Scheme for Two- Dimensional Correlation Spectroscopy (2D-COS) and Its Application in Probing Intermolecular Interactions from Overlapping Infrared (IR) Bands XIAOPEI LI, QINGHUA PAN, JING CHEN, SHAOXUAN LIU, ANQI HE, CUIGE LIU, YONGJU WEI,* KUN HUANG, LIMIN YANG, JUAN FENG, YING ZHAO, YIZHUANG XU,* YUKIHIRO OZAKI, ISAO NODA, and JINGUANG WU College of Chemistry and Material Science, Hebei Normal University, Shijiazhuang, 050016, P.R. China (X.L., C.L., Y.W.); Beijing National Laboratory for Molecular Sciences, State Key Laboratory for Rare Earth Materials Chemistry and Applications, College of Chemistry and Molecular Engineering, Peking University, Beijing 100871, P.R. China (X.L., J.C., S.L., A.H., Y.X., J.W.); Institute of Process Engineering, Chinese Academy of Sciences, 100190, P.R. China (K.H.); State Key Laboratory of Nuclear Physics and Technology, Institute of Heavy Ion Physics, School of Physics, Peking University, Beijing 100871, P.R. China (L.Y.); School of Life Science and Technology, University of Electronic Science and Technology of China, Chengdu, 610054, P.R. China (J.F.); Institute of Chemistry, Chinese Academy of Sciences, 100190, P.R. China (Y.Z.); Department of Chemistry, School of Science and Technology, Kwansei-Gakuin University, Sanda 669-1337, Japan (Y.O.); and The Procter & Gamble Company, West Chester, Ohio 45069 (I.N.) This paper introduces a new approach to analysis of spectra called asynchronous orthogonal sample design (AOSD). Specifically designed concentration series are selected according to mathematical analysis of orthogonal vectors. Based on the AOSD approach, the interfering portion of the spectra arising strictly from the concentration effect can be completely removed from the asynchronous spectra. Thus, two-dimen- sional (2D) asynchronous spectra can be used as an effective tool to characterize intermolecular interactions that lead to apparent deviations from the Beer–Lambert law, even if the characteristic peaks of two compounds are substantially overlapped. A model solution with two solutes is used to investigate the behavior of the 2D asynchronous spectra under different extents of overlap of the characteristic peaks. Simulation results demonstrate that the resulting spectral patterns can reflect subtle spectral variations in bandwidths, peak positions, and absorptivities brought about by intermolecular interaction, which are barely visualized in the conventional one-dimensional (1D) spectra. Intermolecular interactions between butanone and dimethyl formamide (DMF) in CCl 4 solutions were investigated using the proposed AOSD approach to prove the applicability of the AOSD method in real chemical systems. Index Headings: Two-dimensional correlation spectroscopy; 2D-COS; Intermolecular interaction; Asynchronous orthogonal sample design; AOSD; Orthogonality. INTRODUCTION Intermolecular interactions have been the focus of extensive research as they play an important role in many chemical, physical, and biological processes, 1–5 such as assembly of supra-molecular architectures, molecular recognition, and molecular catalysis. 6–10 Various intermolecular interactions, such as dipole–dipole interaction, albeit quite strong, can induce only subtle spectral changes, which are often buried within complex spectral profiles. Therefore, determining how to evaluate such interactions effectively is still a baffling question. Two-dimensional (2D) spectroscopy, first proposed by Noda in the 1980s, 11 has been further developed 12–20 and has gained considerable popularity in various application fields, including biomolecules, 21–25 polymers, 26–28 food and agricultural prod- ucts, 29–31 intermolecular interaction, 32,33 inorganic materi- als, 34,35 and many other chemical systems. 36–39 Defined by two independent spectral axes, the 2D correlation spectrum is generated by applying correlation analysis to the dynamic fluctuations of spectral signals caused by external perturba- tions, e.g., electrical, thermal, magnetic, chemical, acoustic, or mechanical stimulations. One notable feature of 2D correlation spectroscopy (2D-COS) is that the cross-peaks can potentially be used to characterize intermolecular interactions, so the advent of 2D-COS brings about a new avenue for the investigation of intermolecular interactions. Although cross-peaks of the 2D correlation spectra can be used to identify intermolecular interactions, interfering cross- peaks due to other sources of correlation sometimes prevent obtaining a reliable conclusion. We proposed a method called the ‘‘orthogonal sample design (OSD) scheme’’ to solve this problem. 40 As a result, deviations from the Beer–Lambert law caused by intermolecular interaction between two solutes in the same solution can be clearly visualized by the development of specific cross-peaks in the corresponding 2D synchronous spectra. The OSD approach has proved effective in character- izing intermolecular interactions in a variety of chemical systems. Moreover, the spectral patterns of the cross-peaks generated by the OSD approach can even reveal subtle variations of peak position, bandwidth, and absorption of the characteristic peaks caused by intermolecular interactions. 41 However, the OSD approach still suffers from the following problem: interfering parts of the 2D synchronous spectra cannot be completely removed when the characteristic peaks of the solutes are substantially overlapped. Recently, we developed a double orthogonal sample design (DOSD) method that can remove interfering cross-peaks from both synchronous and asynchronous spectra simultaneously. 42 Thus, intermolecular interactions can be characterized by the cross-peaks in both synchronous and asynchronous spectra. Based on the above results, and by taking advantage of the mathematical properties of the Hilbert–Noda transformation Received 7 February 2011; accepted 2 May 2011. * Authors to whom correspondence should be sent. E-mail: [email protected]. cn, [email protected]. DOI: 10.1366/11-06250 Volume 65, Number 8, 2011 APPLIED SPECTROSCOPY 901 0003-7028/11/6508-0901$2.00/0 Ó 2011 Society for Applied Spectroscopy
Transcript
Asynchronous Orthogonal Sample Design Scheme for Two-Dimensional Correlation Spectroscopy (2D-COS) and ItsApplication in Probing Intermolecular Interactions fromOverlapping Infrared (IR) Bands
XIAOPEI LI, QINGHUA PAN, JING CHEN, SHAOXUAN LIU, ANQI HE, CUIGE LIU,YONGJU WEI,* KUN HUANG, LIMIN YANG, JUAN FENG, YING ZHAO, YIZHUANG XU,*YUKIHIRO OZAKI, ISAO NODA, and JINGUANG WUCollege of Chemistry and Material Science, Hebei Normal University, Shijiazhuang, 050016, P.R. China (X.L., C.L., Y.W.); Beijing NationalLaboratory for Molecular Sciences, State Key Laboratory for Rare Earth Materials Chemistry and Applications, College of Chemistry and
Molecular Engineering, Peking University, Beijing 100871, P.R. China (X.L., J.C., S.L., A.H., Y.X., J.W.); Institute of Process Engineering,
Chinese Academy of Sciences, 100190, P.R. China (K.H.); State Key Laboratory of Nuclear Physics and Technology, Institute of Heavy Ion
Physics, School of Physics, Peking University, Beijing 100871, P.R. China (L.Y.); School of Life Science and Technology, University of ElectronicScience and Technology of China, Chengdu, 610054, P.R. China (J.F.); Institute of Chemistry, Chinese Academy of Sciences, 100190, P.R. China
(Y.Z.); Department of Chemistry, School of Science and Technology, Kwansei-Gakuin University, Sanda 669-1337, Japan (Y.O.); and The
Procter & Gamble Company, West Chester, Ohio 45069 (I.N.)
This paper introduces a new approach to analysis of spectra called
asynchronous orthogonal sample design (AOSD). Specifically designed
concentration series are selected according to mathematical analysis of
orthogonal vectors. Based on the AOSD approach, the interfering portion
of the spectra arising strictly from the concentration effect can be
completely removed from the asynchronous spectra. Thus, two-dimen-
sional (2D) asynchronous spectra can be used as an effective tool to
characterize intermolecular interactions that lead to apparent deviations
from the Beer–Lambert law, even if the characteristic peaks of two
compounds are substantially overlapped. A model solution with two
solutes is used to investigate the behavior of the 2D asynchronous spectra
under different extents of overlap of the characteristic peaks. Simulation
results demonstrate that the resulting spectral patterns can reflect subtle
spectral variations in bandwidths, peak positions, and absorptivities
brought about by intermolecular interaction, which are barely visualized
in the conventional one-dimensional (1D) spectra. Intermolecular
interactions between butanone and dimethyl formamide (DMF) in CCl4solutions were investigated using the proposed AOSD approach to prove
the applicability of the AOSD method in real chemical systems.
Index Headings: Two-dimensional correlation spectroscopy; 2D-COS;
Intermolecular interactions have been the focus of extensiveresearch as they play an important role in many chemical,physical, and biological processes,1–5 such as assembly ofsupra-molecular architectures, molecular recognition, andmolecular catalysis.6–10 Various intermolecular interactions,such as dipole–dipole interaction, albeit quite strong, caninduce only subtle spectral changes, which are often buriedwithin complex spectral profiles. Therefore, determining howto evaluate such interactions effectively is still a bafflingquestion.
Two-dimensional (2D) spectroscopy, first proposed by Noda
in the 1980s,11 has been further developed12–20 and has gainedconsiderable popularity in various application fields, includingbiomolecules,21–25 polymers,26–28 food and agricultural prod-ucts,29–31 intermolecular interaction,32,33 inorganic materi-als,34,35 and many other chemical systems.36–39 Defined bytwo independent spectral axes, the 2D correlation spectrum isgenerated by applying correlation analysis to the dynamicfluctuations of spectral signals caused by external perturba-tions, e.g., electrical, thermal, magnetic, chemical, acoustic, ormechanical stimulations. One notable feature of 2D correlationspectroscopy (2D-COS) is that the cross-peaks can potentiallybe used to characterize intermolecular interactions, so theadvent of 2D-COS brings about a new avenue for theinvestigation of intermolecular interactions.
Although cross-peaks of the 2D correlation spectra can beused to identify intermolecular interactions, interfering cross-peaks due to other sources of correlation sometimes preventobtaining a reliable conclusion. We proposed a method calledthe ‘‘orthogonal sample design (OSD) scheme’’ to solve thisproblem.40 As a result, deviations from the Beer–Lambert lawcaused by intermolecular interaction between two solutes in thesame solution can be clearly visualized by the development ofspecific cross-peaks in the corresponding 2D synchronousspectra. The OSD approach has proved effective in character-izing intermolecular interactions in a variety of chemicalsystems. Moreover, the spectral patterns of the cross-peaksgenerated by the OSD approach can even reveal subtlevariations of peak position, bandwidth, and absorption of thecharacteristic peaks caused by intermolecular interactions.41
However, the OSD approach still suffers from the followingproblem: interfering parts of the 2D synchronous spectracannot be completely removed when the characteristic peaks ofthe solutes are substantially overlapped.
Recently, we developed a double orthogonal sample design(DOSD) method that can remove interfering cross-peaks fromboth synchronous and asynchronous spectra simultaneously.42
Thus, intermolecular interactions can be characterized by thecross-peaks in both synchronous and asynchronous spectra.
Based on the above results, and by taking advantage of themathematical properties of the Hilbert–Noda transformation
Volume 65, Number 8, 2011 APPLIED SPECTROSCOPY 9010003-7028/11/6508-0901$2.00/0
� 2011 Society for Applied Spectroscopy
matrix, we propose a new approach called asynchronousorthogonal sample design (AOSD) in this paper. The 2Dasynchronous spectra generated by the AOSD approach can beused to characterize the apparent deviation from the Beer–Lambert law arising from intermolecular interactions, whichcan be still valid even if the characteristic peaks aresubstantially overlapped.
THEORY
The chemical system considered here is a solution with twosolutes, P and Q, whose characteristic peaks are at spectralcoordinates x and y. The spectral function of P and Q are fP(m)and fQ(m), respectively, where m is the spectral variable. Forsimplicity, we assume that the solvent has no contribution inthe spectral region studied here. Variable concentrations areused as the external perturbation to construct the 2D correlationspectra, and the initial concentrations of P and Q in a series of
solutions (i ¼1, 2, . . ., n) are denoted as
~CP ¼ C1ðinitÞP ;C
2ðinitÞP ; . . . C
nðinitÞP
n oð1aÞ
~CQ ¼ C1ðinitÞQ ;C
2ðinitÞQ ; . . . C
nðinitÞQ
n oð1bÞ
Under intermolecular interactions between P and Q, part of Pmay convert into U, whose spectral function is fU(m), and partof Q may convert into V, whose spectral function is fV(m). Thisconversion could be specified in terms of the followingequilibrium relationship, and the strength of the intermolecularinteraction can be characterized by the equilibrium constant K.
Pþ QffK
Uþ V ð2Þ
For the ith solution, the concentrations of equilibrium of P,Q, U, and V are C
iðeqÞP , C
iðeqÞQ , C
iðeqÞU , and C
iðeqÞV . The path length
of each solution is set as 1 for convenience. Therefore, thespectral function of the ith solution should be:
AiðmÞ ¼ CiðeqÞP fPðmÞ þ C
iðeqÞQ fQðmÞ þ C
iðeqÞU fUðmÞ þ C
iðeqÞV fVðmÞ
ð3Þ
Since
CiðeqÞP ¼ C
iðinitÞP � C
iðeqÞU ð4aÞ
CiðeqÞQ ¼ C
iðinitÞQ � C
iðeqÞV ð4bÞ
then Eq. 3 can also be expressed as
AiðmÞ ¼ ðCiðinitÞP � C
iðeqÞU ÞfPðmÞ þ ðCiðinitÞ
Q � CiðeqÞV ÞfQðmÞ
þ CiðeqÞU fUðmÞ þ C
iðeqÞV fVðmÞ ð5Þ
or
AiðmÞ ¼ CiðinitÞP fPðmÞ þ C
iðinitÞQ fQðmÞ þ C
iðeqÞU ½ fUðmÞ � fPðmÞ�
þ CiðeqÞV ½ fVðmÞ � fQðmÞ� ð6Þ
After removing the average value over all solution samples at
FIG. 1. 1D spectra of the first solution in Table III of the model system whenXP is set to be 280: (a) mixture of P, Q, U, and V when only bandwidthvariations are allowed due to intermolecular interaction (WU ¼ 18, WV ¼ 22);(b) no intermolecular interaction between P and Q achieved by setting theequilibrium constant K to zero.
FIG. 2. 2D asynchronous spectrum when XP is set to be 280: (a) only bandwidth variations are allowed to change due to intermolecular interaction (WU¼ 18, WV¼22); (b) there is no intermolecular interaction between P and Q.
902 Volume 65, Number 8, 2011
each wavelength, dynamic intensity can be obtained as Eq. 7:
AiðmÞ ¼ C
iPfPðmÞ þ C
iQ fQðmÞ
þ CiU½ fUðmÞ � fPðmÞ�þC
iV½ fVðmÞ � fQðmÞ� ð7Þ
where CP, CQ, CU, and CV are the dynamic concentrations of P,Q, U, and V.
CiP ¼ C
iðinitÞP � C
initðavÞP ð8aÞ
CiU ¼ C
iðinitÞU � C
initðavÞU ð8bÞ
CiQ ¼ C
iðinitÞQ � C
initðavÞQ ð8cÞ
CiV ¼ C
iðinitÞV � C
initðavÞV ð8dÞ
The corresponding synchronous and asynchronous spectrumcan be calculated according to Eqs. 9 and 10:13
Uðx; yÞ ¼ 1
n� 1~A
T
ðxÞ~AðyÞ ð9Þ
Wðx; yÞ ¼ 1
n� 1~A
T
ðxÞN~AðyÞ ð10Þ
where ‘‘T’’ stands for transposition, n is the number of solutionsused to construct the 2D asynchronous spectrum, and N is the
Hilbert–Noda transformation matrix, given by Eq. 11:
Njk ¼0 if: j ¼ k1=pðk � jÞ otherwise
�ð11Þ
First we discuss a chemical system in which the character-istic peaks of P at x and Q at y do not overlap. That is to say,the characteristic peaks of Q and V have no contribution to thecharacteristic peaks of P and U at x and vice versa. Therefore,A
iðxÞ and AiðyÞ can be simplified as Eqs. 12a and 12b.
AiðxÞ ¼ C
iPfPðxÞ þ C
iU½ fUðxÞ � fPðxÞ� ð12aÞ
AiðyÞ ¼ C
iQ fQðyÞ þ C
iV½ fVðxÞ � fQðxÞ� ð12bÞ
Because there are two items in Eqs. 12a and 12b, aftercombining Eqs. 12a and 12b with Eq. 9, the 2D asynchronouscorrelation spectrum contains four terms.
Uðx; yÞ ¼X4
i¼1
Siðx; yÞ ð13Þ
where the expressions of S1, S2, S3, and S4 are given in theAppendix.
When there is no intermolecular interaction between P and Q
to cause the conversion reaction (Eq. 2), ~CU, ~CV, ~CU, and ~CV
are all expected to become zero. Thus, S2, S3, and S4 becomezero. Because we desire cross-peaks in the 2D synchronousspectra to be strictly associated with intermolecular interaction,
FIG. 3. 1D spectrum of the first solution in Table III of the model system: idxovp is set to be (a) 7, (b) 4, (c) 2, and (d) 1.
APPLIED SPECTROSCOPY 903
U(x,y) should be zero when no intermolecular interaction
occurs between P and Q. Thus, S1 should also be zero. S1(x,y)
can be removed if special concentration series of P and Q are
adopted, and the resulting dynamic concentration vectors of P
and Q are orthogonal to each other:
~CP � ~CQ ¼ 0 ð14Þ
which is the basic idea of the orthogonal sample design (OSD)
scheme described in our previous paper.21
When the characteristic peaks of P at x and Q at y are
partially overlapped, the contributions of P, Q, U, and V
coexist at both x and y in each spectrum. Therefore, AiðxÞ and
AiðyÞ should be expressed as Eqs.15a and 15b:
AiðxÞ ¼ C
iPfPðxÞ þ C
iQ fQðxÞ þ C
iU½ fUðxÞ � fPðxÞ�
þ CiV½ fVðxÞ � fQðxÞ� ð15aÞ
AiðyÞ ¼ C
iPfPðyÞ þ C
iQ fVðyÞ þ C
iU½ fUðyÞ � fPðyÞ�
þ CiV½ fVðyÞ � fQðyÞ� ð15bÞ
Because there are four items in Eqs. 15a and 15b, aftercombining Eqs. 15a and 15b with Eq. 9, the intensities of thecross-peak at (x,y) in the corresponding synchronous spectrumcontain sixteen terms and can be expressed as in Eq. 16:
Uðx; yÞ ¼X16
i¼1
Wiðx; yÞ ð16Þ
The expressions of W1 through W16 are given in theAppendix. The assumed condition of no intermolecularinteractions affecting the population of P and Q makes CU
and CV zero, and thus W5 through W16 all take the value ofzero. Because the desired U(x,y) should be zero when nointermolecular interaction occurs between P and Q, thesummation of W1(x,y), W2(x,y), W3(x,y), and W4(x,y) should
FIG. 4. 2D asynchronous spectra of the model system obtained as a consequence of peak position variations when idxovp is set to be 7.
904 Volume 65, Number 8, 2011
also be zero. W3 and W4 can be removed by using the OSDapproach. However, W1(x,y) and W2(x,y) are quadratic termsand can be zero only when the dynamic concentrations of P andQ in every solution are zero, which goes against our desiredexperimental design. Thus, interfering parts cannot becompletely removed by using the original OSD approachwhen the characteristic peaks of P and Q are partiallyoverlapped. Mathematically speaking, it is possible to find aspecial concentration series to make the summation of W1(x,y),W2(x,y), W3(x,y), and W4(x,y) zero; however, this can berealized only if fP(m) and fQ(m) are known in advance, which isnot feasible in many cases.
Based on the above analysis, it is not feasible to use the 2Dsynchronous spectra to detect intermolecular interactions in astraightforward manner when the characteristic peaks of P andQ are partially overlapped. However, the above issue can bereadily resolved if we use the cross-peaks from the 2Dasynchronous spectrum to probe the intermolecular interaction.The intensity of the cross-peaks in 2D asynchronous spectra
can be calculated if we combine Eq. 10 with Eqs. 15a and 15btogether. Because there are four items in Eqs. 15a and 15b, thecorresponding asynchronous spectrum [W(x,y)] contains six-teen terms and can be expressed as in Eq. 17.
Wðx; yÞ ¼X16
i¼1
Riðx; yÞ ð17Þ
The expressions of R1 to R16 are given in the Appendix.R1(x,y), R2(x,y), R3(x,y), and R4(x,y) are interference parts andhave to be removed. However, removal of the four interferenceterms is much easier in the 2D asynchronous spectra.
The Hilbert–Noda transformation matrix possesses thefollowing two basic properties as shown in Eqs. 18 and 19:
~ATN~A ¼ 0 ð18Þ
~ATN~B ¼ �~BT
N~A ð19Þ
FIG. 5. 2D asynchronous spectra of the model system obtained as a consequence of peak position variations when idxovp is set to be 4.
APPLIED SPECTROSCOPY 905
where A and B are any n-dimensional vectors.Based on Eq. 18, R1(x,y) and R2(x,y) are zero and can be
naturally removed.
R1ðx; yÞ ¼ f1ðxÞf1ðyÞ~CT
PN~CP ¼ 0 ð20aÞ
R2ðx; yÞ ¼ f2ðxÞf2ðyÞ~CT
QN~CQ ¼ 0 ð20bÞ
Based on Eq. 19, R3(x,y) and R4(x,y) are opposite and can becompletely removed when
~CT
PN~CQ ¼ �~CT
QN~CP ¼ 0 ð21Þ
According to Eqs. 8a and 8b, another requirement for selectingsuitable CP and CQ is
Xm
i¼1
CiP ¼ 0 ð22aÞ
Xm
i¼1
CiQ ¼ 0 ð22bÞ
Having removed R1, R2, R3, and R4, the intensity of the
cross-peak in the asynchronous spectrum is a function of CU
and CV, the dynamic concentration of the components of the
intermolecular interaction products. Therefore, the cross-peak
does reflect intermolecular interactions.
Based upon the above analysis, the interference portion in
the 2D asynchronous spectra can be completely removed by
selecting suitable concentration series of P and Q that satisfy
Eqs. 21, 22a, and 22b. We call this new approach the
It is not difficult to find suitable dynamic concentration
series of P and Q that satisfy Eqs. 21 and 22. For example, we
can select the concentration series P and Q as in Eq. 23:
mCiðinitÞP þ nC
iðinitÞQ ¼ H ð23Þ
FIG. 6. 2D asynchronous spectra of the model system obtained as a consequence of peak position variations when idxovp is set to be 2.
906 Volume 65, Number 8, 2011
where m, n, and H are constants and are set arbitrarily.
Equation 23 can also be expressed by Eq. 24:
CiðinitÞQ ¼ H=n� mC
iðinitÞP =n ð24Þ
In this case, the dynamic concentration series of Q are:
~CQ ¼ �m=nC1P;�m=nC2
P; . . . ;�m=nCiP
n oð25Þ
Therefore,
~CT
PN~CQ ¼ ~CT
PNð�m=n~CPÞ¼ �m=n~CT
PN~CP ¼ 0 ð26Þ
The AOSD provides new possibilities to study intermolec-
ular interactions in many chemical systems, where the
characteristic peaks are overlapped. In the following part, we
first use simulation to study the basic property of 2D
asynchronous spectra generated by the AOSD approach. We
then apply this approach to study dipole–dipole interactions
between butanone and DMF.
EXPERIMENTAL
Materials. Butanone, dimethyl formamide (DMF), and
carbon tetrachloride were analytical reagent grade and
purchased from Beijing Chemical Company.
Instrument. Fourier transform infrared (FT-IR) spectra were
collected on a Thermo-Fischer Nicolet iN10 MX spectrometer
using a BaF2 cell with a fixed spacing (100 lm). All the spectra
were recorded at a resolution of 4 cm�1 and 32 scans were co-
added.
Programming. In the studies of the model system, the 1D
spectra, which are used as input files to construct 2D
asynchronous spectra, were generated by a program written
FIG. 7. 2D asynchronous spectra of the model system obtained as a consequence of peak position variations when idxovp is set to be 1.
APPLIED SPECTROSCOPY 907
in our lab using Turbo C 2.0. The 2D asynchronous spectra inthe simulation study and the real chemical system were allcalculated based on the algorithm by Noda using the softwareof MATLAB.
RESULTS AND DISCUSSION
Simulated Chemical System. A solution containing twosolutes P and Q was studied as a model system. Whenintermolecular interactions between P and Q occur in thesolution, we assume that part of P and Q convert into a new setof chemical species U and V, respectively, which can beexpressed by Eq. 2. Here the equilibrium constant K isarbitrarily set as 0.01.
Each trace of the simulated 1D spectrum is thus thesummation of the peak function of each chemical species,which is represented by a Gaussian function, as shown in Eq.27:
GiðmÞ ¼X
j
ejLCije�ln2
ðm�xj Þ2
w2j ð27Þ
where i corresponds to the index of the solution and j is theindex of the chemical species, m is the spectral variable, and ej,xj, and wj are the molar absorptivity, peak position, andbandwidth (half width at half-height, HWHH) of thecharacteristic band of the jth chemical species, respectively.The path length L is set as 1 for convenience in this paper, andCi
j is the equilibrium concentration of the jth chemical speciesfor the ith solution, which can be calculated according to theequilibrium constant.
Validity of the Asynchronous Orthogonal Sample DesignApproach. Herein we use the model system described above toverify the validity of the AOSD approach. All the spectralfeatures of the characteristic bands of P and Q are listed inTable I. The concentration series shown in Table II was used to
FIG. 8. 2D asynchronous spectra of the model system obtained as a consequence of variations of bandwidth when idxovp is set to be 7.
908 Volume 65, Number 8, 2011
construct the 2D synchronous spectra, which meet the
requirements of the OSD approach. We assume that there is
no intermolecular interaction between P and Q by setting the
equilibrium constant K as zero. When the characteristic peaks
of P and Q are not overlapped (XP is set to be 200), the
intensity of the cross-peak at (200, 350) is zero, and when the
characteristic peaks of P and Q are partially overlapped (XP is
set to be 280), the intensity at (280, 350) is 2.8085 3 10�4,
which is comparable with that caused by intermolecular
interactions. Thus, the 2D synchronous spectra based on the
OSD approach are not reliable to judge whether intermolecular
interaction occurs or not when the characteristic peaks ofsolutes are partially overlapped. However, the intensity at (280,350) in the 2D asynchronous spectrum is zero when theconcentration series is set as given in Table III, which meets therequirement of the AOSD approach. The above resultsdemonstrate that the AOSD approach can remove interferingparts from the asynchronous spectra successfully.
Furthermore, the 2D asynchronous correlation spectra canalso reflect subtle changes that are hardly observable in the 1D
FIG. 9. 2D asynchronous spectra of the model system obtained as a consequence of variations of bandwidth when idxovp is set to be 4.
TABLE I. Spectral variables of species P and Q in the model system.
Spectral variable Peak position (cm�1) Bandwidth (cm�1) Absorptivity
P XP 20 1.0Q 350 20 1.0
TABLE II. Initial concentrations of the chemical species P and Q in themodel system, which meet the requirement of the OSD approach.
Index of the solutions CP (mL/mL) CQ (mL/mL)
1 5.00 4.002 4.00 5.003 5.00 6.004 6.00 5.00
APPLIED SPECTROSCOPY 909
spectra directly. For example, when the bandwidths of P and Qare changed due to intermolecular interaction, only a smallfraction of P converts into U, and the characteristic peak of U iscompletely buried in the corresponding peak of P. Thus, theresultant spectrum of the mixture of P and U (Fig. 1a) looksalmost the same as the spectra of pure P (Fig. 1b). Similarproblems occur between Q and V. However, the cross-peaks inthe 2D asynchronous spectra generated by using the AOSDapproach manage to identify the existence of U and V caused
by the intermolecular interactions (Figs. 2a and 2b). That is tosay, the AOSD approach provides a good opportunity to studysubtle spectral variation caused by intermolecular interactionswhen the characteristic peaks of P and Q are partiallyoverlapped.
Basic Spectral Patterns in the Asynchronous Spectra.Here we examine the behaviors of the cross peaks in the 2Dasynchronous spectra generated by using the AOSD approachunder different extents of overlap of the characteristic peaks ofP and Q. We define a parameter (idxovp) to characterize theextent of band overlapping as shown in Eq. 28:
idxovp ¼XQ � XP
ðWQ þWPÞ=2ð28Þ
As idxovp is set as different values (idxovp ¼ 7, 4, 2, or 1), thecorresponding 1D spectra of the first solution in Table III areillustrated in Figs. 3a, 3b, 3c, and 3d. When idxovp is 7, there isalmost no band overlapping. When idxovp is set to be 4, slight
FIG. 10. 2D asynchronous spectra of the model system obtained as a consequence of variations of bandwidth when idxovp is set to be 2.
TABLE III. Initial concentrations of the chemical species P and Q in themodel system, which meet the requirement of the AOSD approach.
Index of the solutions CP (mL/mL) CQ (mL/mL)
1 2.40 3.002 1.60 2.203 0.80 1.404 0.00 0.60
910 Volume 65, Number 8, 2011
band overlapping occurs between the characteristic peaks of P
and Q. If idxovp is 2, severe band overlapping between the two
peaks can be observed. When idxovp reaches 1, the two peaks
merge into one peak.
Spectral variations in characteristic peaks caused by
intermolecular interaction can be manifested as changes in
bandwidth, peak position, and absorptivity. First, we assume
only peak positions change due to intermolecular interaction,
and all the spectral variables for P, Q, U, and V are summarized
in Table IV. When idxovp is set as different values (idxovp¼ 7,
4, 2, or 1), the corresponding asynchronous correlation spectra
are summarized in Figs. 4, 5, 6, and 7. Second, we examine the
behaviors of the cross-peaks in the 2D asynchronous spectra
when only the bandwidths are changeable. The spectral
variables for P, Q, U, and V are summarized in Table V.
Figures 8, 9, 10, and 11 are the 2D asynchronous spectra
FIG. 11. 2D asynchronous spectra of the model system obtained as a consequence of variations of bandwidth when idxovp is set to be 1.
TABLE IV. Spectral variables of the chemical species P, Q, U, and V inthe model system where the peak positions of U and V are variable.a
Spectral variable Peak position (cm�1) Bandwidth (cm�1) Absorptivity
P XP 20 1.0Q 350 20 1.0U XU 20 1.0V XV 20 1.0
a DXP¼ XU� XP, DXQ¼ XV� XQ.
TABLE V. Spectral variables of the chemical species P, Q, U, and V inthe model system where the bandwidths of U and V are varied.a
Spectral variable Peak position (cm�1) Bandwidth (cm�1) Absorptivity
P XP 20 1.0Q 350 20 1.0U UP WU 1.0V 350 WV 1.0
a DWP ¼WP � WU, DWQ ¼WQ� WV.
APPLIED SPECTROSCOPY 911
corresponding to different values of idxovp (idxovp¼ 7, 4, 2, or
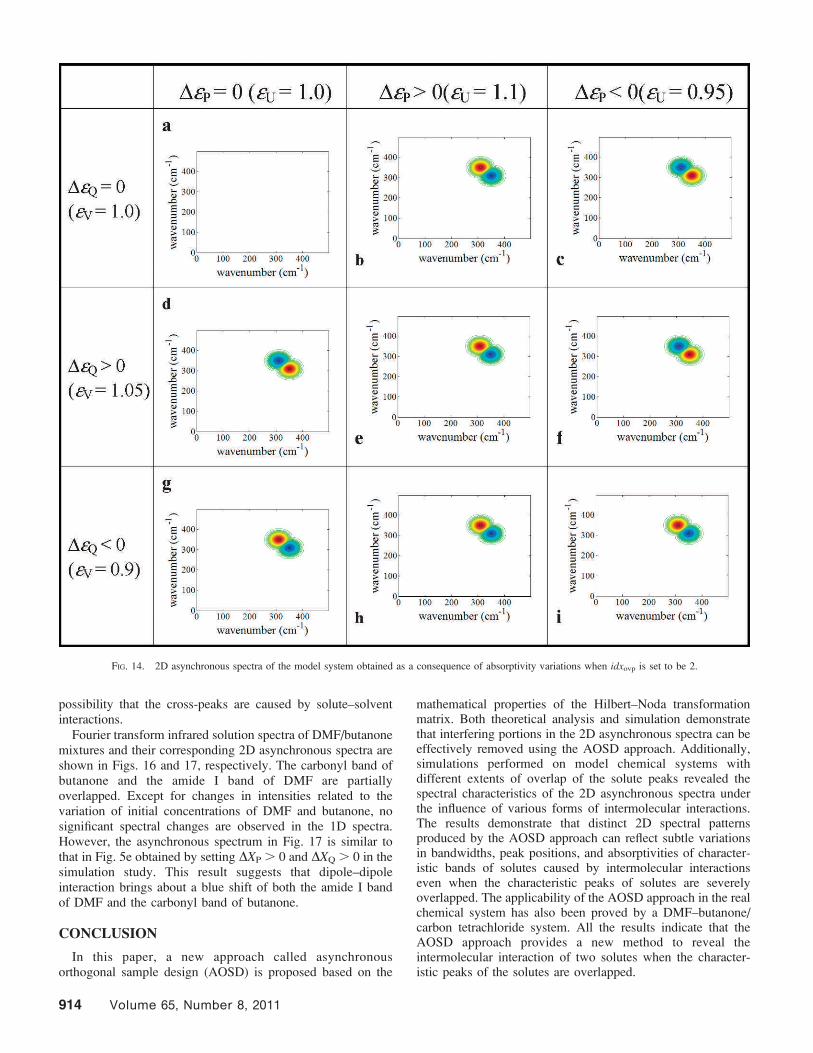
1). Additionally, only the absorptivities of U and V are allowed
to be changed and the spectral variables for P, Q, U, and V are
summarized in Table VI. The 2D asynchronous spectra
calculated for different values of idxovp (idxovp ¼ 7, 4, 2, or
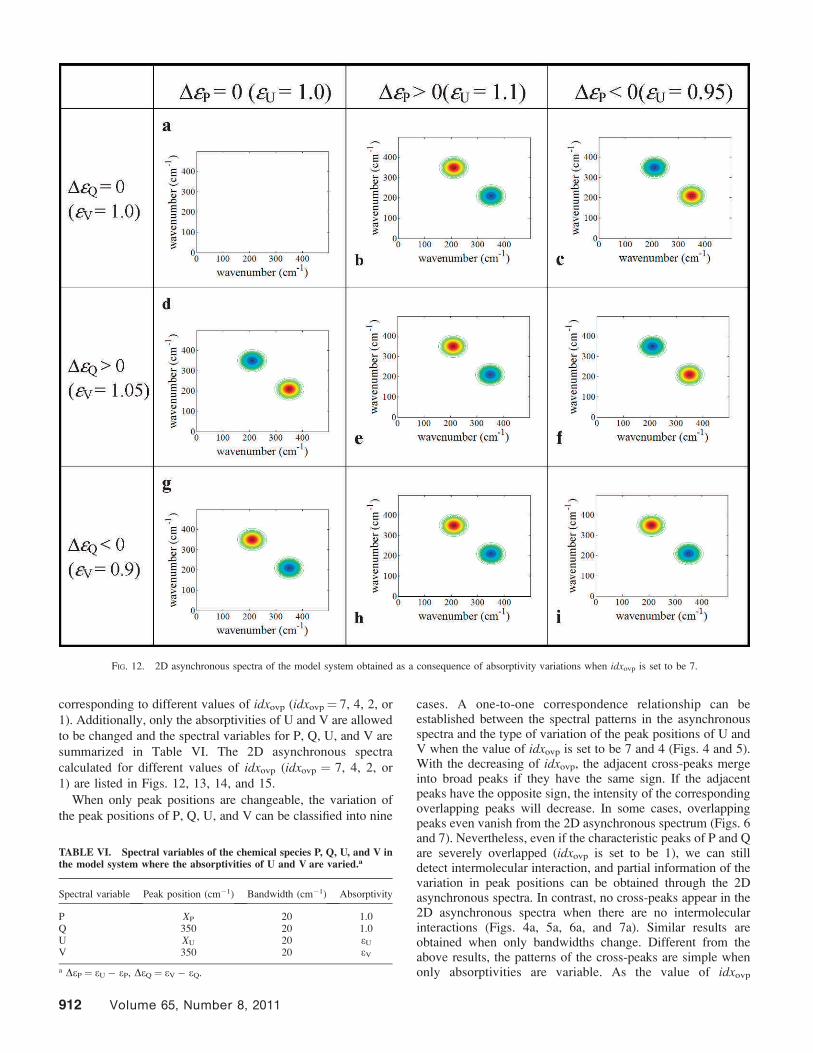
1) are listed in Figs. 12, 13, 14, and 15.
When only peak positions are changeable, the variation of
the peak positions of P, Q, U, and V can be classified into nine
cases. A one-to-one correspondence relationship can beestablished between the spectral patterns in the asynchronousspectra and the type of variation of the peak positions of U andV when the value of idxovp is set to be 7 and 4 (Figs. 4 and 5).With the decreasing of idxovp, the adjacent cross-peaks mergeinto broad peaks if they have the same sign. If the adjacentpeaks have the opposite sign, the intensity of the correspondingoverlapping peaks will decrease. In some cases, overlappingpeaks even vanish from the 2D asynchronous spectrum (Figs. 6and 7). Nevertheless, even if the characteristic peaks of P and Qare severely overlapped (idxovp is set to be 1), we can stilldetect intermolecular interaction, and partial information of thevariation in peak positions can be obtained through the 2Dasynchronous spectra. In contrast, no cross-peaks appear in the2D asynchronous spectra when there are no intermolecularinteractions (Figs. 4a, 5a, 6a, and 7a). Similar results areobtained when only bandwidths change. Different from theabove results, the patterns of the cross-peaks are simple whenonly absorptivities are variable. As the value of idxovp
FIG. 12. 2D asynchronous spectra of the model system obtained as a consequence of absorptivity variations when idxovp is set to be 7.
TABLE VI. Spectral variables of the chemical species P, Q, U, and V inthe model system where the absorptivities of U and V are varied.a
Spectral variable Peak position (cm�1) Bandwidth (cm�1) Absorptivity
P XP 20 1.0Q 350 20 1.0U XU 20 eU
V 350 20 eV
a DeP ¼ eU � eP, DeQ ¼ eV � eQ.
912 Volume 65, Number 8, 2011
decreases, the adjacent peaks are just gradually approaching.However, the asynchronous correlation spectra caused by thechanges of absorptivity can also reflect intermolecularinteraction when the characteristic peaks are completelyoverlapped.
Application of the AOSD Method in a Real ChemicalSystem. We select butanone/DMF/carbon tetrachloride to testwhether the AOSD method is applicable for real chemicalsystems. Since butanone possesses a carbonyl group and DMFpossesses an amide group, dipole–dipole interactions areexpected to exist between the carbonyl group and amide group.
Dimethyl formamide and butanone can be characterizedusing the amide I band at 1686 cm�1 and the carbonyl band at1721 cm�1 in the FT-IR spectra, respectively. The selectedconcentration series of DMF and butanone are listed in TableVII, which satisfy Eq. 29:
CiðinitÞBUT � 4C
iðinitÞDMF ¼ 0:6 ð29Þ
First, we must consider that the interaction between solventand solute may also lead to interfering cross-peaks in the 2Dasynchronous spectra. Therefore, suitable concentration rangeswithin which the absorptions of the solutes satisfy the Beer–Lambert law are determined. Good linearity is observedbetween absorbance and concentrations when either DMF orbutanone alone is dissolved in carbon tetrachloride (see theSupplemental Material, available online), thereby excluding the
FIG. 13. 2D asynchronous spectra of the model system obtained as a consequence of absorptivity variations when idxovp is set to be 4.
TABLE VII. Four solutions in which the initial concentrations of DMFand butanone satisfy the required condition for the AOSD scheme.
Index of the solutions CDMF (mL/100 mL) CBUT (mL/100 mL)
1 0.60 3.002 0.40 2.203 0.20 1.404 0.00 0.60
APPLIED SPECTROSCOPY 913
possibility that the cross-peaks are caused by solute–solventinteractions.
Fourier transform infrared solution spectra of DMF/butanonemixtures and their corresponding 2D asynchronous spectra areshown in Figs. 16 and 17, respectively. The carbonyl band ofbutanone and the amide I band of DMF are partiallyoverlapped. Except for changes in intensities related to thevariation of initial concentrations of DMF and butanone, nosignificant spectral changes are observed in the 1D spectra.However, the asynchronous spectrum in Fig. 17 is similar tothat in Fig. 5e obtained by setting DXP . 0 and DXQ . 0 in thesimulation study. This result suggests that dipole–dipoleinteraction brings about a blue shift of both the amide I bandof DMF and the carbonyl band of butanone.
CONCLUSION
In this paper, a new approach called asynchronousorthogonal sample design (AOSD) is proposed based on the
mathematical properties of the Hilbert–Noda transformationmatrix. Both theoretical analysis and simulation demonstratethat interfering portions in the 2D asynchronous spectra can beeffectively removed using the AOSD approach. Additionally,simulations performed on model chemical systems withdifferent extents of overlap of the solute peaks revealed thespectral characteristics of the 2D asynchronous spectra underthe influence of various forms of intermolecular interactions.The results demonstrate that distinct 2D spectral patternsproduced by the AOSD approach can reflect subtle variationsin bandwidths, peak positions, and absorptivities of character-istic bands of solutes caused by intermolecular interactionseven when the characteristic peaks of solutes are severelyoverlapped. The applicability of the AOSD approach in the realchemical system has also been proved by a DMF–butanone/carbon tetrachloride system. All the results indicate that theAOSD approach provides a new method to reveal theintermolecular interaction of two solutes when the character-istic peaks of the solutes are overlapped.
FIG. 14. 2D asynchronous spectra of the model system obtained as a consequence of absorptivity variations when idxovp is set to be 2.
914 Volume 65, Number 8, 2011
FIG. 15. 2D asynchronous spectra of the model system obtained as a consequence of absorptivity variations when idxovp is set to be 1.
FIG. 17. 2D FT-IR asynchronous spectrum of the butanone–DMF/carbontetrachloride solutions.
FIG. 16. 1D FT-IR spectra of the butanone–DMF/carbon tetrachloridesolutions.
APPLIED SPECTROSCOPY 915
ACKNOWLEDGMENTS
Financial support from the National Natural Science Foundation of China(Grant No. 50673005, 50973003, 51074150, 50404004, 21001009, 20973034,20975029), National High-tech R&D Program of China (863 Program) ofMOST (No. 2010AA03A406), and Program of Advanced Technology Institute,Peking University, are gratefully acknowledged.
SUPPLEMENTAL MATERIAL
All supplemental material mentioned in the text is availablein the online version of the journal at http://www.s-a-s.org.
1. K. Sahu, D. Roy, S. K. Mondal, R. Karmakar, and K. Bhattacharyya,Chem. Phys. Lett. 404, 341 (2005).
2. M. Nakash and M. Goldvaser, J. Am. Chem. Soc. 126, 3436 (2004).3. L. F. Chi, S. Jacobi, B. Anczykowski, M. Overs, H. J. Schafer, and H.
Fuchs, Adv. Mater. 12, 25 (2000).4. W. Qian and S. Krimm, J. Phys. Chem. A 101, 5825 (1997).5. D. F. Hansen, M. A. S. Hass, H. M. Christensen, J. Ulstrup, and J. J. Led,
J. Am. Chem. Soc. 125, 6858 (2003).6. S. Dey, A. Adhikari, U. Mandal, S. Ghosh, and K. J. Bhattacharyya, J.
Phys. Chem. B 112, 5020 (2008).7. U. Mandal, A. Adhikari, S. Dey, S. Ghosh, and K. Bhattacharyya, J. Phys.
Chem. B 111, 5896 (2007).8. C. Tschierske, Angew. Chem. Int. Ed. 39, 2454 (2000).9. M. Langner and K. Kubica, Chem. Phys. Lipids 101, 3 (1999).
10. A. Bernardi, D. Arosio, D. Potenza, I. Sanchez-Medina, S. Mari, F. J.Canada, and J. Jimenez-Barbero, Chem. Eur. J. 10, 4395 (2004).
11. I. Noda, J. Am. Chem. Soc. 111, 8116 (1989).12. I. Noda, Appl. Spectrosc. 47, 1329 (1993).13. I. Noda, Appl. Spectrosc. 54, 994 (2000).14. S. Sasic, A. Muszynski, and Y. Ozaki, J. Phys. Chem. A 104, 6380 (2000).15. M. Thomas and H. Kandori, Vib. Spectrosc. 24, 225 (2000).16. Y. Q. Wu, J. H. Jiang, and Y. Ozaki, J. Phys. Chem. A 106, 2422 (2002).17. Y. Q. Wu, I. Noda, F. Meersman, and Y. Ozaki, J. Mol. Struct. 799, 121
(2006).18. I. Noda, J. Mol. Struct. 799, 34 (2006).19. Y. Q. Wu and I. Noda, Appl. Spectrosc. 60, 605 (2006).20. S. Morita, H. Shinzawa, I. Noda, and Y. Ozaki, Appl. Spectrosc. 60, 399
(2006).21. A. Ausili, A. Scire, E. Damiani, G. Zolese, E. Bertoli, and F. Tanfani,
Biochemistry 44, 15997 (2005).22. G. F. Wang, Y. Gao, and M. L. Geng, J. Phys. Chem. B 110, 8506 (2006).23. T. Lefevre, K. Arseneault, and M. Pezolet, Biopolymers 73, 705 (2004).24. L. X. Wang, Y. Q. Wu, and F. Meersman, Vib. Spectrosc. 42, 201 (2006).25. Y. B. Yan, J. Zhang, H. W. He, and H. M. Zhou, Biophys. J. 90, 2525
(2006).26. J. Yu and P. Y. Wu, Polymer 48, 3477 (2007).27. B. Zimmermann and G. Baranovic, Vib. Spectrosc. 41, 126 (2006).28. A. Padermshoke, H. Sato, Y. Katsumoto, S. Ekgasit, I. Noda, and Y.
Ozaki, Polymer 45, 7159 (2004).29. B. Muik, B. Lendl, A. M. Diaz, M. Valcarcel, and M. J. A. Canada, Anal.
Chim. Acta 593, 54 (2007).30. S. Q. Sun, C. W. Li, J. P. Wei, Q. Zhou, and I. Noda, J. Mol. Struct. 799,
72 (2006).31. R. Siuda, G. Balcerowska, and C. Sadowski, Food Addit. Contam. 23,
1201 (2006).32. J. Qi, K. Huang, X. X. Gao, H. Z. Li, S. X. Liu, Y. Zhao, Y. Z. Xu, J. G.
Wu, and I. Noda, J. Mol. Struct. 883, 116 (2008).33. L. Szyc, J. Guo, M. Yang, J. Dreyer, P. M. Tolstoy, E. T. J. Nibbering, B.
Czarnik-Matusewicz, T. Elsaesser, and H.-H. Limbach, J. Phys. Chem. A114, 7749 (2010).
34. H. Dathe, P. Haider, A. Jentys, and J. A. Lercher, J. Phys. Chem. B 110,26024 (2006).
35. J. Y. Huang and W. T. Shih, J. Phys. Condens. 18, 7593 (2006).36. E. Pechkova, P. Innocenzi, L. Malfatti, T. Kidchob, L. Gaspa, and C.
Nicolini, Langmuir 23, 1147 (2007).37. C. Matranga, L. Chen, M. Smith, E. Bittner, J. K. Johnson, and B.
Bockrath, J. Phys. Chem. B 107, 12930 (2003).38. Y. M. Jung, Y. Park, S. Sarker, J.-J. Lee, U. Dembereldorj, and S.-W. Joo,
Solar Energy Mater. Sol. Cells 95, 326 (2011).39. M. X. Han, Q. Zhou, Q. H. Li, and S. Q. Sun, Spectrosc. Spectral Anal. 29,
1851 (2009).40. J. Qi, H. Z. Li, K. Huang, H. H. Chen, S. X. Liu, L. M. Yang, Y. Zhao, C.
F. Zhang, W. H. Li, J. G. Wu, D. F. Xu, Y. Z. Xu, and I. Noda, Appl.Spectrosc. 61, 1359 (2007).
41. J. Chen, C. F. Zhang, H. Z. Li, Y. H. Liu, W. H. Li, Y. Z. Xu, J. G. Wu,and I. Noda, J. Mol. Struct. 883, 129 (2008).
42. C. F. Zhang, K. Huang, H. Z. Li, J. Chen, S. X. Liu, Y. Zhao, D. J. Wang,Y. Z. Xu, J. G. Wu, I. Noda, and Y. Ozaki, J. Phys. Chem. A 113, 12142(2009).
APPENDIX
1. The synchronous spectrum at (x,y) when the characteristicpeaks of P at x and Q at y do not overlap. After combining Eqs.12a and 12b with Eq. 9 in the main text, we obtain
S1ðx; yÞ ¼ fPðxÞfQðyÞ~CT
P~CQ ðA1Þ
S2ðx; yÞ ¼ fPðxÞ½ fVðyÞ � fQðyÞ�~CT
P~CV ðA2Þ
S3ðx; yÞ ¼ fQðxÞ½ fUðyÞ � fPðyÞ�~CT
U~CQ ðA3Þ
S4ðx; yÞ ¼ ½ fUðxÞ � fPðxÞ�½ fVðyÞ � fQðyÞ�~CT
U~CV ðA4Þ
2. The synchronous spectrum at (x,y) when the characteristicpeaks of P at x and Q at y are partially overlapped. Thesynchronous spectrum at (x,y) is obtained by combining Eqs.15a and 15b with Eq. 9 in the main text of the manuscript.
Uðx; yÞ ¼X16
i¼1
Wiðx; yÞ ðA5Þ
where
W1ðx; yÞ ¼ fPðxÞfPðyÞ~CT
P~CP ðA6Þ
W2ðx; yÞ ¼ fQðxÞfQðyÞ~CT
Q~C ðA7Þ
W3ðx; yÞ ¼ fPðxÞfQðyÞ~CT
P~CQ ðA8Þ
W4ðx; yÞ ¼ fQðxÞfPðyÞ~CT
Q~CP ðA9Þ
W5ðx; yÞ ¼ fPðxÞ½ fUðyÞ � fPðyÞ�~CT
P~CU ðA10Þ
W6ðx; yÞ ¼ fPðxÞ½ fVðyÞ � fQðyÞ�~CT
P~CV ðA11Þ
W7ðx; yÞ ¼ fQðxÞ½ fUðyÞ � fPðyÞ�~CT
Q~CU ðA12Þ
W8ðx; yÞ ¼ fQðxÞ½ fVðyÞ � fQðyÞ�~CT
Q~CV ðA13Þ
W9ðx; yÞ ¼ ½ fUðxÞ � fPðxÞ� fPðyÞ~CT
U~CP ðA14Þ
W10ðx; yÞ ¼ ½ fUðxÞ � fPðxÞ� fQðyÞ~CT
U~CQ ðA15Þ
W11ðx; yÞ ¼ ½ fVðxÞ � fQðxÞ� fPðyÞ~CT
V~CP ðA16Þ
916 Volume 65, Number 8, 2011
W12ðx; yÞ ¼ ½ fVðxÞ � fQðxÞ� fQðyÞ~CT
V~CQ ðA17Þ
W13ðx; yÞ ¼ ½ fUðxÞ � fPðxÞ�½ fUðyÞ � fPðyÞ�~CT
U~CU ðA18Þ
W14ðx; yÞ ¼ ½ fVðxÞ � fQðxÞ�½ fVðyÞ � fQðyÞ�~CT
V~CV ðA19Þ
W15ðx; yÞ ¼ ½ fVðxÞ � fQðxÞ�½ fUðyÞ � fPðyÞ�~CT
V~CU ðA20Þ
W16ðx; yÞ ¼ ½ fUðxÞ � fPðxÞ�½ fVðyÞ � fQðyÞ�~CT
U~CV ðA21Þ
3. The asynchronous spectrum at (x,y) when the character-istic peaks of P at x and Q at y are partially overlapped. Theasynchronous spectrum can be calculated if we combine Eqs.10, 15a, and 15b in the main text of the manuscript.