Page 1
Page
March 2005
http://www.atdforum.org/ March 2011
‗We view with disquiet the overdependence of the economy of
our continent…
(Lagos Plan of Action: OAU, 1980)
HIGHLIGHTS :
Problems facing Local Manufacturers
in the Nigerian Agro-Allied Machine
Fabrication Industry
From Science and Technology to
Innovation for Development
Exploring the Constraints of Rural En-
terprise Development and
Poverty Reduction in Ghana
A resurgence in acquisition of indus-
trial technology in Africa?
Analysis of global trends in technol-
ogy transfer.
An E-mentoring platform for
entrepreneur-driven development in
Africa
ISSN: 1817-2008
Abbreviation: Afr. Technol. Dev. Forum j
SCIENCE; INNOVATION; TECHNOLOGY; TRADE; DEVELOPMENT
Afr ican Technolog y Development For um
A T D F J O U R N A L V O L U M E 7 , I S S U E 3 / 4 2 0 1 0
New Industrial Policy
Page 2
Page 2
ATDF JOURNAL Volume 7, Issue 3/4 2010
Problems facing Local Manufacturers in the Ni-
gerian Agro-Allied Machine Fabrication Industry
Omobowale Mobolaji O.
From Science and Technology to Innovation for
Development
Prof. Dr. Luc Soete
Exploring the Constraints of Rural Enterprise De-
velopment and
Poverty Reduction in Ghana
Ampadu Ameyaw Richard
A resurgence in acquisition of industrial technol-
ogy in Africa?
Analysis of global trends in technology transfer.
Victor Konde
Overall Customer Satisfaction in Ghana‘s Mobile
Telecommunication Networks: Implications for
Management and Policy
Simon Gyasi Nimako; Foresight Kofi Azumah; Francis Donkor; Adu-Brobbey Veronica
An E-mentoring platform for entrepreneur-
driven development in Africa
ATDF
INS ID E T H I S IS SUE
3
9
15
22
35
50
Page 3
Page 3
ATDF JOURNAL Volume 7, Issue 3/4 2010
Abstract
This study investigates the challenges and opportunities
of the local industries involved in the fabrication of agro-
related machinery in Nigeria. With the aid of personal
interviews, on-spot assessment/visual inspection, a num-
ber of problems confronting these local industries were
recorded. These include erratic power supply, cost of raw
materials, level of automation, noise pollution, occupa-
tional hazards, instability in government policies, market-
ability and a general bias for machines fabricated locally.
The government is currently making efforts at reviving the
economy, yet the priorities set in addressing the prob-
lems of the local economy may not be aligned with the
actual priority problems that local companies face in their
daily business. The paper makes suggestions on how the
government could better address the primary concerns of
the industry in areas like power supply, raw material proc-
essing and sensitization of the Nigeria populace towards
appreciating and procuring locally made machines.
Keywords: Agro-Allied Industries, Agro-Allied Machinery,
Policy Instability, Development, Raw Materials
1. Introduction
Most agricultural produce that is sold in formal markets
requires post-harvest processing operations. The market
for processing machines therefore is of significant eco-
nomic importance and offers great opportunities for local
companies which specialize in fabricating agro-allied ma-
chinery (both ―pre‖ and ―post‖ harvest machines) and
their existence and operations is pivotal to the overall
success of the country as a would-be industrialized na-
tion. Machines fabricated by such companies include the
cassava press, cassava grater, cassava chipper, maize
sheller, plate mill, honey press, cassava sifter, hammer
mill, multi-purpose grain thresher, de-stoners, dryers,
planters, feed mill mixers, graders etc. Food processing is
an integral part of agriculture as most farm produce must
undergo one form of conversion or the other either for
storage or breaking down into smaller, workable units as
a food source or raw material.
Just as Nigeria is known for its yet largely unrealized po-
tential for agricultural development and the positive wel-
fare effects it would create for poor rural producers and
urban consumers, an important condition for its future
success is the creation of a suitable institutional environ-
ment that allow local industries to operate professionally
and thus boost the returns of the food and agro-allied
sector; ensuring more export earnings for the country.
It is pertinent to note that as the world is increasingly
becoming a global village, there is a lot of competition
from industrialized countries to use developing coun-
tries like Nigeria as a dumping ground for obsolete
products (1,2,3). This negatively impacts local produc-
ers because most times, they cannot compete with
these cheap give-aways. Hence, this study seeks to
find feasible solutions that policy makers can adopt in
support of the local producers of agro-allied machinery
in this current environment.
The objectives of this study are:
(i) To highlight the problems facing indigenous in-
dustries fabricating agro-allied equipment in
Nigeria with a view to national development
and,
(ii) To suggest possible solutions that can effec-
tively tackle these problems.
2. literature review
Until Nigeria attained independence in 1960, agricul-
ture was the most important sector of the economy as
it accounted for more than one-half of Gross Domestic
Product and for more than three-quarters of export
earnings (4,5). This shows how important this sector
of the Nigerian economy was until it was neglected
after the oil boom.
Political and institutional instability was another factor
that affected the management and performance of
Nigerian agricultural research institutes who were
meant to be develop new and innovative ways of solv-
ing agro-related problems and pass the knowledge on
to industries for adoption (6). The decline of agricul-
ture in Nigeria also led to a general neglect of local
agro-industries by investors and policy makers. The
problem in public policy was the lack of long-term con-
sistency and predictability. Successive government
abandoned previous policy strategies and instead
came up with completely new ones. Examples of previ-
ous agricultural policy strategies include policy initia-
tives related to Operation Feed the Nation of 1976,
the Green Revolution of 1980, Directorate of Food,
Roads and Rural Infrastructures in 1986, withdrawal
of fertilizer subsidies in Mid 1990‘s and restoration of
Problems facing Local Manufacturers in the Nige-
rian Agro-Allied Machine Fabrication Industry
Omobowale Mobolaji O.
Department of Agricultural and Environmental Engineering,
Faculty of Technology, University of Ibadan, Nigeria.
e-mail: [email protected]
Page 4
Page 4
fertilizer subsidies at 25% between 1999 and 2000 (6).
Others include the Cassava Initiative in 2002 and the
Seven Point Agenda of 2007.
With Nigeria‘s return to democracy in 1999, the Federal
Government identified import dependence, reliance on
a single commodity (crude oil), a weak industrial base,
low level of agricultural production and a weak private
sector as the major weaknesses of the Nigerian econ-
omy (7). As a result, the government made the develop-
ment of the agricultural sector the highest priority both
for poverty reduction and improvement of the economy.
Also, new technology, improved seedlings, better stor-
age facilities and access to funds at reduced lending
rates were to be made readily available. It was also re-
ported that the government would move the country
away from being an export dependent country as all
necessary incentives and encouragement will be given
for the development of the agro-allied industries as con-
tained under the Small and Medium-scale Enterprises
(SME) act (7,8).
Foreign investors were not left out of the developmental
strategies as the Federal Government of Nigeria invited
foreign companies to come and help tackle the prob-
lems facing different sectors of the economy. For in-
stance, the Federal Government encouraged certain
Ukranian firms to boost their investment in Nigeria‘s
steel sector (9). Nigeria is a country rich in iron ore, the
principal element in the making of steel products which
in turn is a major raw material in the agro-allied machin-
ery fabrication industry. Similar invitations had also
been given to Russia and China.
As part of the efforts to encourage local production in
the primary sector of Nigeria, the government also im-
posed a ban on a number of foreign goods which can be
sourced in Nigeria e.g. poultry products, leather prod-
ucts, textiles, etc. Moreover, the Nigeria‘s National Co-
coa Development Committee recommended a total ban
on the importation of cocoa products into the country as
part of measures to protect the local cocoa growing and
processing industry (10). All these measures had vary-
ing impacts on local SME industries. The question how-
ever is, has the current efforts by the Nigerian federal
government alleviated or compounded problem being
faced by the agro-allied machine fabrication sub-sector
of the Nigerian economy? In order to ascertain their cur-
rent situation, a study was conducted on agro-allied ma-
chinery fabrication industries in Ibadan, the largest city
in Nigeria and a major agricultural hub and trade route
in western Africa.
3 Methodology
In carrying out this study, the following methods were
used to get information from the target industry:
3.1 On Spot Assessment and Inspection
Visits were paid to the factory premises of selected com-
panies for an ―on the spot‖ assessment. Various divi-
sions of the workshops were examined to inspect ma-
chines being produced in their cutting/fabrication, join-
ing and finishing sections. In doing this, the physical
conditions of the factory site and workshop were in-
spected including the working environment of the arti-
sans and technicians employed at the factories. The
problems that workers were having in each sub-division
were also noted.
3.2 Personal Interviews
Interviews were conducted with people from all cadres
and sections of the companies. This included the chair-
men/managing directors, administrative director/
accountant, factory foremen, heads of joining and finish-
ing subdivision, fabrication sub-divisional heads, indus-
trial training apprentices, etc. These were able to shed
light on areas of enquiry.
4. Results and discussion
The findings reveal that even though there has been
some level of improvement in some areas of operation
in the industry, there still exist myriads of problems con-
fronting these small and medium scale enterprises. For
example, the ban on importation of poultry products
(e.g. turkey, chicken and eggs) has gone a long way to
help improve the operating environment for the agro-
allied processing machine fabrication industry. According
to respondents, the local producers of poultry products
had to increase their production to meet the local de-
mands, since consumers can no longer buy imported
frozen turkey and chicken like before. With this need for
increased production came a corresponding increase
in demand for the fabrication of "Feed-mill mixers", a
processing machine used in the production of animal
feed and which can be easily produced locally by techni-
cians in the agro-allied machinery fabrication industry.
As encouraging as this may be, findings revealed that
the agro-allied machinery fabrication industry is still
facing tough times due to the high costs of construction
materials, unreliable power supply, lack of marketing
skills, inadequate labour safety, neglect of waste dis-
posal, low level of technology and indigenous product
bias.
These problems are discussed in more detail in the follow-
ing section.
4.1 Cost of Construction Materials:
The materials of construction being used in this indus-
try ranges from angle iron bars, iron rods, steel plates,
stainless steel plates, pulleys, vee-belts, bolts and nuts,
electrodes, bearings, square pipes, flat bars etc. Be-
cause these are the main raw materials, their costs
greatly influence the overall price of the fabricated ma-
chine. Table 1 shows current prices of some of these
mostly imported raw materials. The prices quoted
change in accordance with the exchange rates at the in-
ternational market but generally they are all increasing.
ATDF JOURNAL Volume 7, Issue 3/4 2010
Page 5
Page 5
ATDF JOURNAL Volume 7, Issue 3/4 2010
4 .2 Power Supply
These industries cannot exist without electricity. As a
matter of fact, their very existence is based on elec-
tricity supply since basically; all their operations in
machine fabrication require one form of electrical
energy or the other. These include lathe machine
operations; welding, grinding, power saw cutting, nib-
bler cutting, drilling, milling machine operations, etc. As
is the case in Nigeria generally, power supply has been
very erratic. This slows down production and most
times, set targets are not met. As at the time of this
study, some of the factories visited complained of
having been without power supply for over 3 days
while some others had been on generators for weeks.
Operating a fabricating factory like these on power
supply from generating sets is costlier compared to
power supply derivable from the National Grid (NEPA).
This also adds to the overall cost of production and
ultimately the selling price of these machines as cost
of maintaining and fuelling the generator also comes
into consideration. This corroborates findings re-
ported by other researchers on the on SMEs‘ and
industrialization in Nigeria (11,12,13,14,15,16,17).
4.3 Restricted Market Base
Respondents made it known that most of the requests
for machines come as a result of development pro-
grammes sponsored by big organizations like the United
Nations Industrial Development Organization (UNIDO),
International Institute of Tropical Agriculture (IITA)
Ibadan, Federal and State Government projects after
which there comes a fall in demand. Other sources are
large scale farms with considerable hectares of land
which are very few in Nigeria. This shows how restricted
the market for these industries are since about 70% of
agriculture in Nigeria is still on small scale or subsistence
S/N Raw Material 2008 Price in Naira 2010 Price
(in Naira)
Equivalent Price in U.S. Dollars @
N150/Dollar
1 Gauge 20 black steel plate 3,500 4,800 32
2 Gauge 18 black steel plate 4,200 5,000 33.3
3 Gauge 16 black steel plate 5,800 6,500 43.3
4 Gauge 14 black steel plate 9,000 7,500 50
5 Gauge 20 stainless steel plate 25,000 32,000 213.3
6 Gauge 18 stainless steel plate 31,500 37,500 250
7 Gauge 16 stainless steel plate 34,500 40,500 270
8 Gauge 14 stainless steel plate 38,500
45,500
303.3
9 Gauge 20 galvanized steel plate 12,500 15,000 100
10 Gauge 18 galvanized steel plate 13,000 18,500 123.3
11 Gauge 16 galvanized steel plate 19,500 22,500 150
12 Gauge 14 galvanized steel plate 27,500
30,500 203.3
13 Stainless steel Electrode (1 pack) 9,500 (150 pieces in a
pack)
12,000 (150 pieces in a
pack)
80
14 Ordinary Electrode (1 pack) 1,150 (150 pieces in a
pack)
1,600 (150 pieces in a pack) 10.7
Table 1: Prices of Some Raw Materials in the Nigerian Agro-Allied Industry (July 2010)
Page 6
Page 6
levels. Moreover, many large scale companies which are
into agri-business (cocoa processing, milk and milk prod-
ucts, fruit juice etc.) import most of their equipment from
developed countries where quite a number of them have
their roots. Moreover, because of the cost of produc-
tion, the final cost of these machines is sometimes
beyond the reach of individuals who may wish to acquire
one. This affects marketability in the local and to some
extent, the international arena knowing fully well that
there are competitors mostly from Asian countries.
4.4 Waste Disposal
It was observed that waste disposal is a major problem
even though workers at the factory did not mention this.
Dumps for scrap metal, metal chips, used chrome cut-
tings etc. litter the factory premises. Dumps are located
just outside the workshop where it is exposed to the
forces of nature (air, water, rain etc). Since these materi-
als are non-biodegradable, they constitute a nuisance to
the environment. Had it been that these can be recycled
or given back in exchange for money, the problems dis-
posal would have been reduced.
4.5 Noise
Findings from this study also revealed that the techni-
cians and artisans complained about noise levels they
were exposed to during some of their operations. Noise
arise from the various jobs being done by factory
workers or usage of heavy equipment at the same
time e.g. generator, grinding, chiselling, hammering,
beating to shape, shaft threading etc. Noise levels depend
on how many of these operations are carried out at the
same time.
It was observed that different people respond differently
to noise levels and even though, there was no scientific
equipment readily available during the study for measur-
ing the various decibels of sound the workers were ex-
posed to, it was quite clear that the working environment
will be a much better had it been that something could be
done to check the effect of noise pollution on the workers.
4.6 Safety
Loss of lives or maiming was reported to be a frequent
occurrence. The most common safety problems are the
dangers of electrocution, paint fumes at the spraying
section, flying metal chips and fatal accidents while work-
ing at the lathe machine. A technician at one of the fac-
tories visited was actually maimed by the lathe machine
as he was working on it shortly before this study was con-
ducted and he was certified unfit to work on the lathe
machine again. In another factory, finishing work was
being done on a set of cassava pressing machines at
the painting section and the artisan working on it had to
use cotton wool to cover his nostrils to minimize the vol-
ume of paint fumes being inhaled by him because of the
serious respiratory/health problems that could arise from
it. Most places visited had no first-aid-kit in place. Through-
out the period of the study, it was observed that there was
no government agency that inspects or ensures occupa-
tional safety and health standards for workers.
4.7 Level of Technology/Automation
Automation can be said to be at a discourag-
ing low level in fabricating industries in Nigeria. Thus,
the progress of work is slow as human factors greatly
come into play in these situations. This also affects
the finishing aspect of production as errors based
on human judgements are sometimes very con-
spicuous.
4.8 Indigenous Product Bias
Some respondents complained that while mar-
keting their machines, they often meet with a general
indigenous product bias among the Nigerian populace
as people prefer to go for imported machines rather
than patronize the locally fabricated ones. This is
because it is generally assumed that any Nigerian
made product is fake or sub-standard and this
creates an atmosphere of discouragement for the
local producers. Also, this bias also results in an un-
even competition in the market between the locally
fabricated ones and the imported machines even
though the locally fabricated ones could also be effi-
cient in operation.
4.9 Policy Instability
All respondents re-iterated the fact that sudden policy
changes seriously hinder the growth of their industry.
For instance, the management of some factories vis-
ited made it known that during the Cassava Initiative in
2002, most of the machines demanded for then were
cassava related (e.g. graters, chippers, presses etc).
This clearly reflected the government policy on cas-
sava and cassava products exportation then. How-
ever, that was no longer the case as the intense public-
ity of the initiative then has since given way to other
policy issues when another administration came into
power (18,19,20).
5.0 Conclusion and recommendations
From the facts gathered from this study, it is clear that
the local agro-allied machinery fabrication industry
in Nigeria has quite a number of problems confront-
ing them. There is need to see this sector of the Nige-
rian economy as an upcoming and viable sub-sector
of the SMEs‘ in Nigeria. As such, any problem con-
fronting the sector should be seen as a problem con-
fronting the nation as a whole. Should Nigeria develop
in her indigenous technology to an appreciable level in
terms of what is available in the international world,
the country which is so blessed with both human and
national resources can rise up and stand in a formi-
dable position not only as an industrial giant in Africa,
but also as a force to reckon with in the global market.
As a result of indigenous technological development
and breakthroughs attributed to good operational envi-
ronment created through favourable policies, a nation
like India with an economy worse than Nigeria before
can now boast of having a say in the technological
world. This can also be the case in Nigeria should
ATDF JOURNAL Volume 7, Issue 3/4 2010
Page 7
Page 7
ATDF JOURNAL Volume 7, Issue 3/4 2010
proper focus and attention be given to this sector of the Ni-
gerian economy.
In 1987, radio-active wastes were brought from Italy and
dumped in a town known as Koko in the old Bendel state of
Nigeria. This resulted in loss of lives even though the situa-
tion was arrested on time. Likewise, dumping of foreign
goods and technology on Nigeria should be seen as being
dangerous just like that of the Koko wastes saga as long as
there are competent hands within the country to help in the
area of technological development.
5.2 Recommendations
While the Federal Government of Nigeria might be com-
mended for efforts aimed at resuscitating the ailing indus-
try, the following recommendations if implemented will en-
hance the performance of agro- allied machinery fabrica-
tion industries in Nigeria:
(i) Local producers should be encouraged and as-
sisted as regards the cost of raw materials for their
industries. If this is done the cost of production will
be less and marketability will increase. Since the
primary raw material used in producing these sec-
ondary raw materials are available in Nigeria, the
government should find a way of reviving the rele-
vant sectors of the economy involved in turning
these primary raw materials into their secon-
dary forms (e.g. iron ore into steel products).
These include the Osogbo Machine Tools and Ajao-
kuta Steel Rolling Mills.
(ii) A more conducive environment should be created
for the local industries by enacting policies that will
ban the importation of products or machines that
may stifle or choke the local fabricating industries as
was done in the case of poultry products for example.
(iii) Electricity supply should be improved till it becomes
not just more regular but stable.
(iv) Petroleum products should be made available in
abundance at all times as there will always be
need for it in terms of power generation as
well as transportation of raw materials and finished
products. Since Nigeria is rich in crude oil, efforts
should be made at reviving and building more refiner-
ies in the country.
(v) The Nigerian populace should be sensitized to be
more positively disposed to Nigerian products as this
will help in its development as this will eventually
help the local industries to grow.
(vi) Safety measures should be ensured and enforced
at local industries to minimize the industrial haz-
ards occurring in the industry. Monitoring agencies
should be created to effect in a way similar to what is
obtainable in some other countries e.g. the Occupa-
tional Safety and Health Administration (OSHA) in the
United States of America.
(vii) Ear-muffs and gas masks should be provided
where and when necessary by employers of
labour at the industries to reduce the effects of
noise pollution and health problems respec-
tively.
(viii) Increased effort should be made at improving
waste disposal methods in the industries.
This is because of the non-biodegradable na-
ture of the raw materials (mostly metals) be-
ing utilized by the sector. Relevant profession-
als should be contacted for the possibility of
recycling. Laws should also be formulated to
enforce compliance by industries to environ-
mental rules.
(ix) Instability of government policies is an important
issue which should be properly addressed as it
is vital to the survival of this sector of the econ-
omy. A very recent example is the issue of the
Cassava Initiative of the immediate past ad-
ministration but which is no longer the being
projected as before because another agenda
has come up to replace it.
References
1. Basel Action Network, BAN (2005): High Tech
Toxic Trash Exported to Africa; http://
www.minesandcommunities.org/article.php?
a=1816, Date Accessed: 20/06/2010.
2. Wanjiku R. (2007): Is Africa a Dump for Electronic
Waste?; http://beckyit.blogspot.com/2007/06/is-
africa-dump-for-electronic-waste.html, Date Ac-
cessed: 23/05/2010.
3. Ratemo J. (2010): Is Kenya a technology dumping
ground?; http://www.ictcradle.com; Date Ac-
cessed: 12/05/2010.
4. Linda, V.B. (2001): 'Economy', Africa South of
the Sahara, 30th Edition (London: Europe Publi-
cations) pp 876-904.
5. Wikipedia (2010b): ―Agriculture in Nigeria‖; http://
en.wikipedia.org/wiki/Agriculture_in_Nigeria; Date
accessed: August 2010.
6. Idachaba F.S. (2000): "Topical Issues in Nigerian
Agriculture: Desirable and Workable Agricultural
Policies for Nigeria in the First Decade of the 21st
Century" (Dept of Agric Economics), University of
Ibadan, Nigeria.
7. National Orientation and Public Affairs
(1999): "Nigerian Economic Policy (1999-
2003)"- Federal Ministry of Information and
National Orientation, Abuja.
8. A.O. Adelaja (2000): The Importance of Small
and Medium Scale Industries in a Developing/
Underdeveloped Economy: Nigeria as a Case
Page 8
Page 8
Study; Proceedings of 6th Africa-USA International
Conference on Manufacturing Technology.
9. Yakubu, L. (2005): "Obasanjo woos Ukranian
Investors to Nigeria's Steel Mining Sector"- Busi-
ness Guardian newspaper report, 27th January,
2005 (pp 17).
10. Louis, I. (2005): "Ban on importation of Cocoa
products"- Punch newspaper report, 25 January,
2005 (pp 19).
11. Anyanwu C.M. (2004): ―Productivity in the Nige-
rian Manufacturing Industry‖, Publication of the
Central Bank of Nigeria; http://www.cenbank.org/
OUT/PUBLICATIONS/OCCASIONALPAPERS/
RD/2000/ABE-00-7.PDF, Date Accessed: July
2010.
12. Oviemuno A.O. (2006): ―Impact of Energy on the
Manufacturing Sector In Nigeria‖, http://
searchwarp.com/swa70577.htm, Date Accessed,
July 2010.
13. Ekanem W. (2008): ―Manufacturing Under
Stress‖; the CBS Interactive Business Network,
http://findarticles.com/p/articles/mi_qa5327/
is_346/ai_n31029545; Date Accessed: July
2010.
14. Chiakwelu E. (2010); ―Nigeria‘s economy: Infla-
tion and other Economic Indicators‖; http://
www.groundreport.com/Business/Nigeria-s-
e c o n o m y - I n f l a t i o n - a n d - o t h e r - e c o n o m i c -
ind_6/2925464; Date accessed: July 2010.
15. Durojaiye R. (2010); ―Manufacturers‘ Nightmare
in Nigeria‖; Daily Independent Newspaper Online
P u b l i c a t i o n ; h t t p : / /
w w w . i n d e p e n d e n t n g o n l i n e . c o m /
DailyIndependent/Article; Date Accessed: July
2010.
16. Maritz J. (2010): ―Private Firm tackling Nigeria‘s
Power Problem Head-on‖;
http://www.howwemadeitinafrica.com/private-
firm-tackling-nigerias-power-problems-head-
on/742/; Date Accessed: June 2010.
17. Udah, E.B. (2010): Industrial Development, Elec-
tricity Crisis and Economic Performance in Nige-
ria; European Journal of Economics, Finance and
Administrative Sciences, ISSN 1450-2275, Issue
18, pp. 105-121.
18. Alao R.O. (2010): ―Productivity in the Nigerian
Manufacturing Sub-Sector: An Error Correction
Model (ECM)‖, European Journal of Economics,
Finance and Administrative Sciences, ISSN 1450-
2887, Issue 20; http://www.eurojournals.com
19. Onakuse S. (2007): Policies, Programmes and Sus-
tainable Development in Nigeria-A Critique; Afri-
cana Journal, Vol 1 No. 1, pp 41-45.
20. Hassan T.A. (2009): National Cassava Initiative:
Gone with the wind?; Daily Trust Newspaper online
Edition, http://news.dailytrust.com/index.php?
option, Date Accessed: 14/05/2010.
ATDF JOURNAL Volume 7, Issue 3/4 2010
Page 9
Page 9
ATDF JOURNAL Volume 7, Issue 3/4 2010
Abstract
Science and Technology (S&T) for development is often
associated with radical technological change that offers
new opportunities for human development. In affluent,
highly developed countries, the use of material saving and
energy efficient technologies promises to gradually elimi-
nate unsustainable consumption patterns; while in develop-
ing countries, S&T are expected to eradicate world poverty,
diseases and underdevelopment. Despite the many warn-
ings raised by development and S&T economists that sus-
tainable technological change depends on corresponding
institutional change, there has been a tendency to take the
economic sustainability of new technologies for granted.
Humanity, waiting so to say, for such ―technology manna‖
and technology transfer from North to South to become
implemented.
In this paper, I will not enter the global sustainability policy
challenges, which have been discussed at greater length
elsewhere (see Kemp, Soete and Weehuizen, 2005 and
2011), but focus on the shift from S&T to Innovation for
Development, which has occurred over the last ten to
twenty years. This shift fully recognizes the ―endogenous‖
nature of innovation as opposed to the old, neo-classical
exogenous view of technological change and technology
transfer, as it was popular in the 70‘s and 80‘s.
1. Introduction
Many S&T scholars that contributed to endogenous growth
literature found that the process of innovation is actually
much more complex and challenging in a developing coun-
try context. Aghion and Howitt (2005) have questioned the
sustainability of S&T even in the high income country con-
text and argued that the future innovation policy challenge
will need to address the double meaning of ―non-
sustainability‖ resulting from technological ―progress‖. Next
to the ecological unsustainability of particular technological
―progress‖ trajectories such as fossil fuel energy depend-
ency, there is also the unsustainability of the ―creative de-
struction‖ process within environments that give increas-
ingly premiums to insiders, to security and risk aversiveness
in favour of maintain rather than creating income and
wealth. It is in this sense that as argued below, a high in-
come environment is increasingly ―inappropriate‖ for inno-
vation that goes beyond incremental improvements.
In an emerging, developing country context, by contrast, it
has been argued by a number of development economists
such as Martin Bell (1985), Carl Dahlman and Larry
Westphal (1983) Sanyaya Lall (1992), Howard Pack
(1981), that industrial science and technology poli-
cies appear first and foremost more directed towards
―backing winners‖. The central innovation policy
question in these countries is how to further broaden
an emerging national technological expertise in the
direction of international competitiveness and spe-
cialisation. Such S&T policy broadening will have to
involve a strong recognition on the part of policy mak-
ers of the importance of engineering and design
skills, of accumulating ―experience‖ rather than just
Research and Development (R&D) investments and
of enabling innovative entrepreneurship based on a
multitude of talent and creativity across the board
driven by the need to find solutions for the manifold
problems of development. In short, the natural envi-
ronment for innovation is likely to flourish in develop-
ing countries.. It is also in this environment that inno-
vation takes on its full meaning: not just limited to
technological innovation but including social and or-
ganisational innovation. As Lina Sonne (2011) has
argued: ―the need for increased ability to innovate
should not be confused with the fixation on new state
-of-the-art technology (Juma and Yee-Cheong, 2005).
Instead a paradigm shift is needed away from these,
often labour saving, innovative activities on the inter-
national innovation frontier, to mature or platform
technologies. These less complex technologies are
more useful for smaller scale and local solutions
needed in terms of technology upgrading in develop-
ing countries (Juma and Yee-Cheong, 2005). Whilst
frontier technologies are considered ‗exciting‘ or
‗sexy‘ it is the smaller and simpler innovation process
which provides solutions that are more easily adapted
to fit with the needs of countries where labour is gen-
erally abundant and cheap‖ .
2. Technology and the emergence of formalized in-
dustrial research activities
The strong focus on S&T, and industrial Research and
Development (R&D) in particular, as the central factor
behind economic development is actually of relatively
recent origin. Up to the late 50‘s, R&D was barely
recognised by growth economists despite the recogni-
tion that ―something‖ (a residual, a measure of our
ignorance) was behind most of the economic growth
in the 20th Century and the post-war period in particu-
lar. But, of course, long before the 20th Century, ex-
perimental development work on new or improved
products and processes was carried out in many in-
dustries, mostly in ordinary workshops. As Chris Free-
From Science and Technology to Innovation for
Development
Prof. Dr. Luc Soete
UNU-MERIT, University of Maastricht, The Netherlands
Page 10
Page 10
man and myself noted in the Economics of Industrial
Innovation: “The early classical economists were well
aware of the critical role of technology in economic
progress even though they used a different terminol-
ogy. Adam Smith (1776) observed that improvements
in machinery came both from the manufacturers of
machines and from "philosophers or men of specialisa-
tion, whose trade is not to do anything but to observe
everything". But although he had already noted the
importance of "natural philosophers" (the expression
"scientist" only came into use in the nineteenth cen-
tury), in his day the advance of technology was largely
due to the inventiveness of people working directly in
the production process or immediately associated with
it: "... a great part of the machines made use of in
those manufactures in which labour is most subdi-
vided, were originally the inventions of common work-
men" (Smith, 1776, p. 8). Technical progress was rapid
but the techniques were such that experience and me-
chanical ingenuity enabled many improvements to be
made as a result of direct observation and small-scale
experiment. Most of the patents in this period were
taken out by "mechanics" or "engineers", who did their
own "development" work alongside production or pri-
vately. This type of inventive work still continues to-day
and it is essential to remember that is hard to capture
it in official R&D statistics.” (Freeman and Soete,
1997).
What became distinctive about modern, industrial R&D
in the late 19th and early 20th Century was its scale, its
scientific content and the extent of its professional spe-
cialisation. Suddenly a much greater part of technologi-
cal progress appeared attributable to research and
development work performed in specialised laborato-
ries or pilot plants by full-time qualified staff. It was
also this sort of work which got officially recorded in
R&D statistics; if only because it was totally impractica-
ble to measure the part-time and amateur inventive
work typical of the nineteenth century. Thus, typical for
most developed industrial societies of the 20th Century,
there were now high-technology intensive industries,
having as major sectoral characteristic the heavy, own,
sector-internal R&D investments and low-technology
intensive, more craft techniques based industries, with
very little own R&D efforts. And while in many policy
debate, industrial dynamism became as a result some-
what naively associated with just the dominance in a
country‘s industrial structure of the presence of high-
technology intensive sectors, the more sophisticated
sectoral studies on the particular features of inter-
sectoral technology flows, from Pavitt (1984) to
Malerba (2004), brought back to the forefront many of
the unmeasured, indirect sources of technical progress
in the analysis. Unfortunately, many of those insights
have not been translated in attempts at broadening the
policy relevant concept of R&D.
3. From industrial R&D to innovation: a paradigm shift?
As increasingly acknowledged by innovation studies
scholars ranging from economists such as Paul David
and Dominique Foray to S&T studies scholars such as
Mike Gibbons and Helga Novotny, a major shift in
one‘s understanding of the relationships between re-
search, innovation and socio-economic development
occurred over the last twenty years. It is interesting to
note that both the more economically embedded inno-
vation research community as well as the more STS
embedded research community converge on this is-
sue: in each case the perception of the nature of the
innovation process appears to have changed signifi-
cantly.
Thus for innovation economist such as David and
Foray innovation capability is today seen less in terms
of the ability to discover radically new technological
principles, but much more in terms of the ability to
exploit effects produced by new combinations – one is
reminded of Schumpeter‘s already old notion of ―neue
Kombinationen‖ – and use of pieces from the existing
stock of knowledge (David and Foray, 2002). This al-
ternative view, also closely associated with the emer-
gence of numerous knowledge ―service‖ innovations,
implies in other words a more routine use of an exist-
ing technological base allowing for innovation without
the need for particular leaps in science and technol-
ogy, sometimes also referred to as ―innovation without
research‖. This shift in the nature of the innovation
process implies actually a more complex structure of
knowledge production activities, involving a much
greater diversity of organizations having as explicit
goal the production of knowledge. The previous indus-
trial system was based on a relatively simple dichot-
omy between knowledge generation and deliberate
learning in R&D laboratories on the one hand, and
production and consumption activities on the other
hand where the motivation for acting was not to ac-
quire new knowledge but rather to produce or use ef-
fective outputs. As David and Foray have argued: ―the
collapse (or partial collapse) of this dichotomy has led
to a proliferation of new places having as an explicit
goal the production and use of new knowledge‖. These
places are no longer readily observable from national
R&D statistics, yet they appear essential to sustain
innovative activities, locally and even globally.
In short, most of our notions of traditional R&D-based
technological progress are still dominant in many in-
dustrial sectors ranging from chemicals and pharma-
ceuticals to motor vehicles, semiconductors and elec-
tronic consumer goods. These sectors are character-
ized by the S&T system‘s ability to organise technologi-
cal improvements along clearly agreed-upon criteria
and ability to evaluate the progress continuously
(Freeman and Soete, 2009). At the same time, a cru-
cial part of the engineering research consisted, as
Richard Nelson put it, ―of the ability to hold in place‖
meaning to replicate and subsequently upscale experi-
ments previously carried out in the research laboratory
environment. As a result it involved first and foremost
a cumulative process of technological progress: a con-
tinuous learning from natural and deliberate experi-
ments. Many of the detailed historical descriptions by
Vernan Ruttan, Nathan Rosenberg and Giovanni Dosi
of the emergence of the agricultural, chemical, electri-
ATDF JOURNAL Volume 7, Issue 3/4 2010
Page 11
Page 11
ATDF JOURNAL Volume 7, Issue 3/4 2010
cal and electronic engineering research fields provide
ample illustrations of such continuous learning processes.
The process of learning is very different in the alternative
mode of technological progress described above. Since
there is no procedure-related protocol in place yet, the
development process is more based on flexibility and con-
fronted with many intrinsic difficulties in replication.
Learning from previous experiences or from other sectors
is more difficult or can even be misleading. Evaluation is
also difficult because of changing external circumstances
over time, among sectors, across locations. It will often be
impossible to separate out specific context variables from
real causes and effects. In view of the frequent lack of
availability of ―hard‖ data that can be scientifically ana-
lysed and interpreted, technological ―progress‖ will be
much more based on trial and error . As a result, techno-
logical change is less predictable, more uncertain and
ultimately more closely associated with entrepreneurial
risk taking. Attempts at reducing such risks might involve,
as Von Hippel (2004) has argued, a much greater impor-
tance given to users, already in the research process it-
self.
4. Implications for development
The new mode of technological progress brings to the
forefront the importance of endogenous innovation proc-
esses in developing country situations. In the old indus-
trial S&T model, the focus within a context of develop-
ment was quite naturally on technology transfer and imita-
tion: imitation to some extent as the opposite of innova-
tion. In the new model, innovation is anything but imita-
tion. Every innovation appears now to be unique with re-
spect to its application. Re-use and re-combinations of
sometimes routine, sometimes novel pieces of knowledge
are likely to be of particular importance, but their success-
ful application might ultimately well involve engineering
expertise, design capabilities even research.
a) Innovation from the “tip” to the “bottom” of the income
pyramid
A feature of the old industrial R&D and the underlying
model of technological progress which has not received
much attention in the development literature is the focus
of industrial R&D on continuous quality improvements of
existing and new consumer goods, enlarging at the same
time continuously the demand for such quality improved
or new consumer goods. The mass consumption growth
model which emerged over the post-war period in the US,
Europe and Japan appeared to generate its own infinite
demand for more material consumer goods: a continuous
growth path of rising income with increasing consumer
goods‘ production and consumption (Pasinetti, 1981). As
if consumer goods - contrary to food - would remain totally
unaffected by Engel‘s law of decreasing marginal utilityA-
gain I do not elaborate here on the challenges this growth
model raises for achieving a pattern of sustainable devel-
opment at the global level.
The continuously rising industrial R&D efforts in high
income countries appeared in other words to match
perfectly the continuously rising incomes of the citizens
of those countries leading to a continuous enlargement
of their consumption basket with new, better designed
or better performing products. The actual initial de-
mand for such quality improvements often arose from
extreme professional use circumstances, but thanks to
the advertising campaigns in the media portraying
popular symbolic figures in sports and entertainment
presenting the new products to emphasize the prestige
image of such professional use – the average, non-
professional consumer could easily become convinced
of the personal need of such new goods even though
those additional quality characteristics might ultimately
add only marginally to individual utility. In a certain way
the highest income groups in society, the ―tip‖ of the
income pyramid, acted often as first, try-out group in
society, contributing happily to the innovation monop-
oly rents of the innovating firm. So a continuous circle
of research was set in motion centring on the search
for new qualitative features to be added to existing
goods.
This ―professional-use driven‖ innovation circle has
been the main source for extracting innovation rents
out of consumer goods – ranging from consumer elec-
tronics, sport goods, shoe wear, household equipment,
computers, mobile telephony, medical diagnostics,
sleeping comfort, and so on – often with an extended
physical life time. However, the worldwide risks of this
relatively straightforward professional-use driven inno-
vation strategy for the existing global multinational cor-
porations have increased significantly, not in the least
because of globalization. While the size of the world
market appears at first sight gigantic for new innova-
tive goods and often without any doubt sufficient to
recoup investments relatively quickly, the huge re-
search, development, and global marketing costs, cou-
pled with ever-increasing numbers of competing inter-
national players means that the length of time that a
company can enjoy its innovation rents is diminishing
very rapidly. Hence, despite the growing high income
classes in large emerging BRIC economies, the new
generation of goods being sold to these newly affluent
people will not generate sufficient earnings to fund
both the costs of mass production and the develop-
ment of the next technology generation of the respec-
tive good. Having developed technologically incredibly
sophisticated new goods, many firms are encountering
major global sales problems in view of a much con-
tracted product life cycle with increased competition
and rapidly over-saturated markets.
b) Innovation at the bottom of the income pyramid: a
new form of “appropriate innovation”?
The need for a shift in research on innovation in private
businesses has been popularized by the late CK The
Page 12
Page 12
Prahalad in his famous book: The Fortune at the Bot-
tom of the Pyramid (2004) with the provocative subtitle
―Eradicating Poverty Through Profits.‖ One of the best-
known Prahalad examples of a Bottom of the Pyramid
(BoP) innovation is the multiple-fuel stove innovation
developed for the rural poor, in which cow dung and
biomass (sticks and grass) can be used as cooking
fuels. Traditionally these fuels are used in an extremely
inefficient way and are dangerous to use due to the
smoke inhaled from indoor fires. With the so-called
―combination stove‖ that costs less than $20, the user
can now switch relatively easily from biomass to natu-
ral gas, according to his/her needs. ―If it succeeds in
India…‖ Prahalad notes, ―…it will be rolled out across
multiple geographies, with potentially immense im-
pacts on the people‘s quality of life throughout the de-
veloping world.‖ Drawing on this example, Prahalad
observes that ―the process of designing these break-
through innovations started with the identification of
the following four conditions:… 1. The innovation must
result in a product or service of world-class quality. 2.
The innovation must achieve a significant price reduc-
tion — at least 90 percent lower than a comparable
product or service in the West. 3. The innovation must
be scalable: It must be able to be produced, marketed,
and used in many locales and circumstances. 4. The
innovation must be affordable at the bottom of the eco-
nomic pyramid, reaching people with the lowest levels
of income in any given society.‖ (CK Prahalad, The Inno-
vation Sandbox). Since the book of Prahalad, there has
been a flood of similar examples of BoP innovations
being primarily introduced by foreign, large multina-
tional corporations from developed countries in devel-
oping countries, sometimes in poor rural villages,
sometimes in urban slums.
At first sight these BoP examples seem to contradict
Lall‘s earlier observations about the limited effective-
ness of technology transfer through FDI. As Lall noted,
back in 1992: ―With few exceptions, the developing
country affiliate receives the result of innovation, not
the innovative process itself: it is not efficient for the
enterprise concerned to invest in the skill and linkage
creation in a new location.‖ (Lall, 1992, p.179). This is
where BoP innovation takes on, in my view, a totally
new meaning.
First of all the likely and most successful location of the
innovative process activities, the BoP learning lab, will
have to be close to BoP users contexts. Given the cru-
cial role of users in the innovation process as argued
above, this will imply that BoP laboratories will have to
be embedded in users‘ environments and not be part
of the traditional high- tech R&D centres and enclaves
whether in the developed or developing country. In this
sense the notion of ―grassroots innovation‖ developed
by Anil Gupta (1997) can be considered as the endoge-
nous, intrinsic version of Prahalad‘s external, top down
version of BoP innovation. To be successful though,
such version will have to pay particular attention to all
the elements and features emphasized by Lall back in
the early 90‘s: the local context, the vertical linkages,
the avoidance of innovation ―truncation‖ (Lall, 1980,
1992) by which refers to the isolation of the innovation
process from the host country‘s technological and pro-
duction infrastructure. All this brings now to the fore-
front the need for a local business model that also fully
embodies local behavioural responses to innovation.
Hence, the increasingly recognized need in BoP inno-
vation for strategic alliances between large MNCs and
local NGOs (e.g Hybrid Value Chains).
Second, in line with the shift in research paradigm de-
scribed in the first sections of this paper, the innova-
tion process itself is now also likely to be reversed,
starting with the design phase which will be confronted
most directly with any attempt at finding functional
solutions to some of the particular BoP users‘ frame-
work conditions. This will involve not just the need to
bring the product on the market at a substantially
lower price than existing goods, as Prahalad empha-
sized, but also, and must also be more in line with San-
jaya Lall‘s observations. He refers to the need of a ro-
bust and dependable adaptation to potentially poor
and shaky local infrastructure facilities with respect to
energy delivery systems, water access, transport infra-
structure, digital access, etc. Autonomy is the key word
here. It is no surprise that the most rapidly spreading
technology in developing countries has been mobile
communication with currently more than 3 billion users
worldwide. Autonomy from high quality energy, water,
broadband network availability is undoubtedly one of
the most pervasive drivers for innovation in a develop-
ing country context. Another one might well be ―cradle
to cradle‖ sustainable innovation (Braungart and
McDonough 2002). The lack of high quality logistic
infrastructure facilities in rural development settings
might well imply that once goods are sold, the repair
and/or central recollection of obsolete goods or their
parts will be expensive. By contrast local re-use along
the principles of cradle-to-cradle might well be a new
form of sustainable grassroots innovation. It is in this
sense that one might talk about ―appropriate innova-
tion‖ and that there seems to be some analytical simi-
larity with the old notion of ―appropriate technology‖.
Third, the feedback from BoP users and from design
developers upstream towards more applied research
assistance, even fundamental research in some of the
core research labs of Western firms might well become
one of the most interesting examples of reverse trans-
fer of technology (from the South to the North), re-
invigorating and motivating the research community in
the highly developed world increasingly ―in search of
relevance.‖ Not surprisingly, the main focus within the
developed world at the moment is on BoP innovations
in the health area, a sector where applied medical re-
search is increasingly dominated by access to new
technologically sophisticated equipment and much
less by more down to earth research questions about,
and the list is non-exhaustive: anti-biotic resistance,
infectious diseases or resistant tuberculosis. Not sur-
prisingly, health is the sector most in need for what
could be called a bottom of the pyramid research re-
prioritization (Crisp, 2010).
ATDF JOURNAL Volume 7, Issue 3/4 2010
Page 13
Page 13
ATDF JOURNAL Volume 7, Issue 3/4 2010
5. Conclusions
The dramatic acceleration of the globalization of science
and technology (S&T) over the last ten to fifteen years
largely helps explain the transformation of the process
of innovation described in this paper. For most countries
in the world, the contribution of domestic S&T to the
global stock of knowledge is today relatively small; the
contribution to domestic productivity growth is equally
small. It is instead the increasing speed of diffusion of
technological change and with it global access to codi-
fied knowledge that explains the largest part of world
wide productivity growth over the last ten years.. The
role of information and communication technologies has
been instrumental here, as has been that of more capi-
tal and organisation- embedded forms of technology
transfer.
While there remains a huge world-wide concentration of
research investments in a relatively small number of
rich countries/regions, it is important to realize that
such activities, whether privately or publicly funded are
increasingly becoming global in focus. The shifts in
global demand underlying the process of globalisation
taking place today, increasingly affect the allocation of
private resources to the sort of research, knowledge
creation and diffusion, and innovation being carried out
in research laboratories, wherever located. From this
perspective it is important to realize that the new, much
more global, international business community is be-
coming concerned, also from its internal research strat-
egy perspective, with the sustainability of its long term
growth based on the demand of high income groups
rising in absolute terms at a much slower rate than
lower income groups.
Up to a point this trend is similar to what happened in
the US at the beginning of the 20th Century period - also
a period of rapid growth and rising income inequality -
when Henry Ford introduced the Ford Model T. His
―putting America on wheels‖ strategy centred on assem-
bly line production and on paying workers wages so as
to create a lasting market for the car. How to create a
similar global mass market for consumer goods in the
context of the 21st Century represents of course a much
more complex, global challenge, but the similarity and
the timing of such business concerns is striking. It is in a
certain sense the ultimate paradox of inequality: the
business community itself is becoming concerned over
too much inequality limiting its own long future output
growth potential.
It is in this sense that the vision of innovation for devel-
opment outlined here, appears maybe novel, yet also
very familiar: familiar to the many development econo-
mists dealing with technology accumulation and learn-
ing who will undoubtedly recognize many of his views
and visions in some of the concepts and notions dis-
cussed here on how to develop successful innovation-
for-development strategies.
References
1. Aghion and Howitt (2006), ‗Appropriate Growth
Policy: A unifying Framework‘, Journal of the Euro-
pean Economic Association, 4(2-3), pp. 269-314.
2. Bell, M. (1984), 'Learning' and the Accumulation of
Industrial Technological Capacity in Developing
Countries. In: Fransman, M. and King, K. eds. Tech-
nological Capability in the Third World, New York:
St. Martin's Press, pp. 187-209.
3. Braungart, M. and W. McDonough, William (2002).
Cradle to Cradle: Remaking the Way We Make
Things, North Point Press.
4. Crisp, N. (2010), Turning the World Upside Down:
The search for global health in the 21stCentury,
Hodder Education Group, London, 240 p.
5. Dahlman, C. and Westphal, L. (1983), ‗The Transfer
of Technology‘, Finance and Development, 20 (4),
pp. 6-9.
6. David, P. and D. Foray (2002), ‗An introduction to
economy of the knowledge society‘, International
Social Science Journal, 54(171), pp. 9-23.
7. Dosi, G. (2005) Statistical Regularities in the Evolu-
tion of Industries. A Guide through some Evidence
and Challenges for the Theory. LEM Papers Series
8. Evenson, R. (1981) ‗Benefits and Obstacles to Ap-
propriate Agricultural Technology‘,
9. Annals of the American Academy of Political and
Social Science, 458, pp. 54-67
10. Freeman, C. and Soete, L. (1997), The Economics
of Industrial Innovation, 3rd edition, MIT Press.
11. Freeman, C. and Soete, L. (2006), ‗Changing STI
Climate: A Sky without horizons‘, Blue Sky II Forum,
September 25-27th 2006, Ottawa, Canada.
12. Freeman, C. and Soete, L. (2009) ‗Developing sci-
ence, technology and innovation indicators: What
we can learn from the past‘, Research Policy, 38,
583-589.
13. Ghosh, R. and L. Soete (2006), Information and
Intellectual property: the global challenges, Indus-
trial and Corporate Change, 15(6), pp. 919-935.
14. Gupta, A. (1997) ‗The Honey Bee Network: Linking
Knowledge-Rich Grassroots Innovations‘, Develop-
Page 14
Page 14
ment, 40 (4), pp. 36-40.
15. Kemp, R. Soete, L. and Weehuizen, R. (2005),
‗Towards an effective eco-innovation policy in a
globalised setting‘, In: Wijen, F., Zoeteman, K. and
Pieters, J. (Eds.), AHandbook of Globalisation and
Environmental Policy. National Government Inter-
ventions in a Global Arena, Cheltenham: Edward
Elgar Publishing, pp. 155-178
16. Lall, S. (1978), ―Transnationals, Domestic Enter-
prises and Industrial Structure in Host LDCs‖, Ox-
ford Economic Papers, 30(2), pp.217-48.
17. Lall, S. (1980), ―Vertical Inter-Firm Linkages in
LDCs‖, Oxford Bulletin of Economics and Statistics,
pp.203-28.
18. Lall, S. (1992),‖Technological Capabilities and In-
dustrialization‖, World Development, 20(2), pp.165
-86.
19. Lall, S. (1994), ―The East-Asian Miracle‖, World
Development, 22(4), pp. 645-54.
20. Malerba, F. (Ed.) (2004), Sectoral Systems of Inno-
vation, Cambridge University Press, Cambridge MA.
21. Mokyr, J. (2009), The Enlightened Economy. Britain
and the Industrial Revolution 1700-1850, The New
Penguin Economic History of Britain, vol. 3: Indus-
trial Revolution, Penguin Books Ltd, 352 p.
22. Mowery, D. (1983), "Industrial Research and Firm
Size, Survival and Growth in American Manufactur-
ing, 1921-46: An Assessment," Journal of Eco-
nomic History, 1983.Nowotny, H., Scott, P. and
Gibbons, M. (2006), ‗Re-thinking Science: Mode 2
in Societal Context‘, In: Carayannis, E. and Camp-
bell, D., (eds), Knowledge Creation, Diffusion, and
Use in Innovation Networks and Knowledge Clus-
ters: A Comparative Systems Approach across the
United States, Europe, and Asia. London: Green-
wood Press, pp. 39-51.
23. Pack, H. (1981), ‗Fostering the Capital-Goods Sec-
tor in LDCs‘, World Development, 9(3), pp. 227-
250.
24. Pasinetti, L. (1981), Structural Change and Eco-
nomic Growth: A theoretical essay on the dynamics
of the wealth of nations, Cambridge: Cambridge
University Press
25. Pavitt, K. (1984), 'Patterns of technical change: to-
wards a taxonomy and a theory', Research Policy, 13
(6), pp. 343-73.
26. Perez, C. and L. Soete (1988), , Catching up in tech-
nology: entry barriers and windows of opportunity, in
G. Dosi, C. freeman, R. Nelson, G. Silverberg and L.
Soete (eds.), Technical Change and Economic Theory,
Pinter, London.
27. Prahalad, C.K. (2004), The Fortune at the Bottom of
the Pyramid. Eradicating Poverty Through Profits.
Wharton School Publishing.
28. Prahalad, C.K. (2006) ‗The Innovation Sandbox‘,
Strategy + Business, 44.
29. Ramani, S. (2008), Breaking the Guardian knot in
sanitation - Development of new technology & busi-
ness models to create a market for toilets for India‘s
poorest, UNU-MERIT Working Paper 2008-12.
30. Rosenberg, N. (1993) ‗Qualitative Aspects of Techno-
logical Change: Some Historical Perspectives‘, In: Lab-
ini.. B., Roncaglia, A., and Salvati, M. (eds.), Market
and institutions in economic development: Essays in
honour of Paolo Sylos Labini. New York: St. Martin's
Press, pp. 139-154.
31. Ruttan, V. (2002) ‗Productivity Growth in World Agri-
culture: Sources and Constraints‘,
32. Journal of Economic Perspectives, 16 (4), pp. 161-
184.
33. Sen, A (1960) Choice of Techniques, Oxford: Basil
Blackwell
34. Soete, L. (2009a) Malthus' Revenge, UNU-MERIT
Working Paper 2009-030
35. Soete, L. (2009b) ‗International research partnerships
on the move‘, In: Molenaar, H., Box, L., and Engel-
hard, R. (eds), Knowledge on the Move. Emerging
Agendas for Development-oriented Research, Leiden:
International Development Publications, pp. 33-48
36. Sönne, L. (2011), Innovation in Finance to Finance
Innovation. Supporting Pro-Poor entrepreneur-based
innovation, PhD thesis, Maastricht University, 240 p.
37. Stiglitz, J. (2006), Making Globalisation Work, New
York: WW Norton
38. Von Hippel, E. (2004), Democratizing Innovation, MIT
Press
39. Weehuizen, R. (2008), Innovation for the bottom of
the pyramid, March, UNU-MERIT, mimeo.
ATDF JOURNAL Volume 7, Issue 3/4 2010
Page 15
Page 15
ATDF JOURNAL Volume 7, Issue 3/4 2010
Abstract
The objective of our study is to identify the most relevant
factors limiting the poverty reduction and growth poten-
tials of rural micro and small scale enterprises (MSE) in
the Northern region of Ghana. For that purpose, we profile
the main characteristics of MSEs by means of literature
review, focus group discussions (FGD), and personal inter-
views of key informants. The insight gained from this
qualitative research is supported by quantitative data col-
lected by means of a structured questionnaire designed
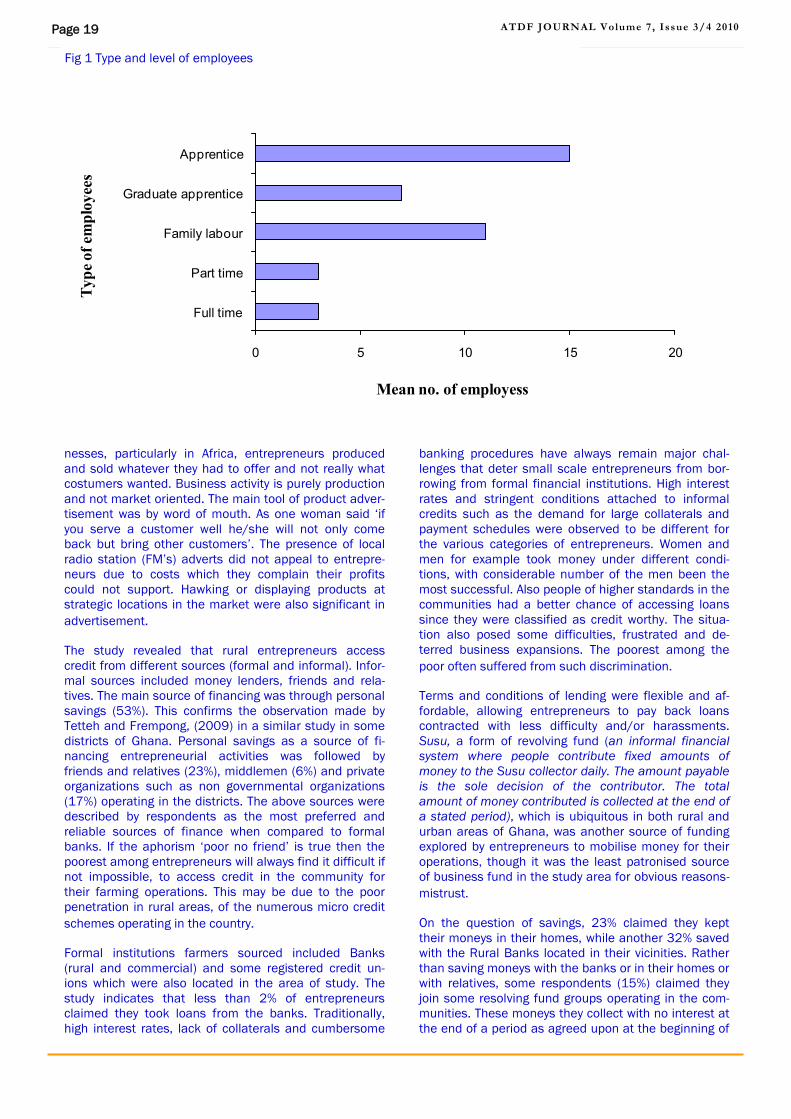
for the local actors in the MSE sector.
The study covered six districts in the northern region. Gen-
erally, the study indicates that several constraints related
to vocational training, management and lack of access to
larger distribution networks and technology hamper the
path of rural enterprise development and poverty reduc-
tion in rural Northern Ghana.
Policy makers, development planners and business devel-
opment organisations play a major role in helping the re-
gion to overcome these obstacles by designing the appro-
priate incentive packages, training and financial support
for rural small-scale enterprises development.
Key words: Rural small businesses, Enterprise develop-
ment, Poverty reduction Northern Ghana
1 Introduction
Promotion and development of rural Micro Small Enter-
prise‘s (MSE‘s) as drivers for improved welfare and liveli-
hoods of people is not a new concept in Ghana (GPRS II,
2005). Small business enterprises (defined as independ-
ent enterprises, which control relatively small share of the
market and usually managed and operated by an individ-
ual or family) have always contributed to economic devel-
opment of many nations including advanced economies.
Rural MSE‘s ensure that, local economic growth through
support for local employment creation and income gen-
eration, poverty reduction and wealth creation are attain-
able. The import of this is crucial in a developing nation
like Ghana where over 60% of the population reside, oper-
ate and eke out a living from such small businesses. It is
estimated that about 69% of the country‘s population
are employed in the MSE sector and majority of these
are located in rural areas (GSS, 2002). Thus the sector
provides employment for a considerable number of
people in rural areas. However, despite this recognition
and its significance for local and national economic
development, research has not investigated systemati-
cally, the real strengths and weaknesses of these rural
enterprises, at least in Northern Ghana where poverty
is very high (GSS, 2007).
Unlike urban enterprises, rural small businesses are
usually diverse and socio-culturally embedded. They
mostly employ locally available resources to produce
their products, without having to spend so much on
production. These characteristics give rural enterprises
relative edge over their urban counterparts. These fea-
tures of rural enterprises may help protect such busi-
nesses located in rural areas against any unforeseen
social unrest, disintegration, and economic downturn.
It will also help restrict over reliance of rural enter-
prises on expensive raw materials imported from both
urban centres and other countries. Since the opportuni-
ties and constraints facing these businesses differ
from larger and/or more urban enterprises, govern-
ment‘s support to rural enterprises should, as a matter
of necessity not overlook the contexts within which ru-
ral enterprises operate.
Provisions of an enabling policy environment that en-
sure that gains from such enterprises do not fritter
away, is essential. The study was designed to profile
the characteristics of rural business enterprises (both
existing and potential) as a way of exposing their
strengths and weaknesses and how these are and can
be addressed effectively. The implications for practice
and policy as well as some recommendation of how to
give a fillip to the sector were also discussed.
1.2 Poverty and rural enterprises development
In Ghana, poverty is primarily rural, with the northern
regions recording the highest incidence of poverty in
the country (GSS, 2007). Low agriculture productivity,
undeveloped markets and lack of gainful wage employ-
ment opportunities as well as restrictive access of the
less endowed to productive resources have been iden-
Exploring the Constraints of Rural Enterprise De-
velopment and Poverty Reduction in Ghana
Ampadu Ameyaw Richard
Science & Technology Policy Research Institute (STEPRI)
P.O. Box CT 519, Accra, Ghana: Tel 233-21-779401:
Email: [email protected]
Page 16
Page 16
tified as the major causes of poverty in the three North-
ern regions of Ghana (GPRS II, 2005). In the quest to
find answers to the myriad of challenges facing the rural
poor, government has taken steps to ensure that the
rural person, particularly its entrepreneurs are ade-
quately empowered. Empowering these entrepreneurs
gives them the right to acquire the capabilities that en-
sure their right or freedom to choose the life they wish
to have (Sen, 1999).
Studies have shown that rural small-scale enterprises
(businesses) stand a better chance of benefiting from
the readily available local raw material deposits
(Ravinder, 2007) in the regions and communities. The
World Bank, (WB, 2004), has indicated that harnessing
the human agency, market support institutions and
‗crude‘ entrepreneurial skills of rural entrepreneurs
should be major intervention strategies to fast track the
rural enterprise development agenda in developing
countries. Rural development is therefore linked to en-
trepreneurship, which among others may take the form
of diversifying from mainstream agriculture production
to non-agriculture enterprises such as agro-processing,
blacksmithing, local restaurant or catering, carpentry,
pottery and/or the discovery of new products or service
markets within and outside the local communities.
The challenge for government however, is how to en-
courage local capacity building, particularly in rural ar-
eas where most of these businesses are located (GSS,
2000).
1.3 The resurgence of small scale enterprises in Ghana
Until the 1970‘s, governments pursued policies which,
in principal aimed at encouraging large scale business
enterprise development (Asante et. al 2002). It was
presumed at the time, that successes of large scale
urban businesses could transform rural economies
through a spill over effect of urban industrial revolution.
Economic, industrial and employment policies therefore
focused heavily on the corporate sector and state led
imports (Frempong, 2003). In the 1970‘s there was a
shift in focus in favour of small scale private sector de-
velopment (Buame, 1996). Some policy initiatives em-
barked on by government to resuscitate the numerous
but poorly functioning small scale enterprises for in-
come generation, poverty reduction and sustainable
development included, the provision of roads, electricity
and telephony infrastructure for domestic and commer-
cial uses, good drinking water and sanitation facilities,
markets, human resource development facilities as well
as strengthening financial institutions and empower-
ment training programmes in the communities.
The latest of these policy initiatives is the introduction
of structural adjustment programme (SAP) and its mar-
ket liberalization policies in the 1980‘s and 1990‘s.
These have had major impetus on local industries de-
velopment. In spite of these programmes, poverty still
continues to loom in the countryside. The question that
remains in the public is whether existing and emerging
small scale enterprises in the private sector have the
ATDF JOURNAL Volume 7, Issue 3/4 2010
needed capacities, regarding the creation of employ-
ment and generation of income to ensure Ghana‘s eco-
nomic growth and poverty reduction (GoG, 2002).
1.4 The challenge of building local enterprise capacities
Building successful local entrepreneurial capacities for
accelerated poverty reduction and economic growth is
crucial. Though government is making some efforts, to
resuscitate the SME sector in Ghana, these are not
without challenges. Lack of localised efforts to build
capacities has been adduced to two main factor; firstly,
lack of adequate access to infrastructure such as mar-
kets, business service provision and financial institu-
tions that have the capacity to sustain programmes of
entrepreneurial development and, secondly, lack of
adequate business competences and acumen including
the management of funds, records, human and other
material resources which are crucial for the sustainabil-
ity and growth of businesses. Other issues that limit the
potential of building successful enterprises is the re-
moteness of rural communities which often disadvan-
tages them in terms of access to business capital, ser-
vices and clientele markets.
Road networks are either non-existent or poorly devel-
oped if not invisible in rural areas. Though some efforts
have been made to address this deficiency, more is
expected of the government. Rural enterprises fall in
different categories, crafters, farmers, fishermen, trad-
ers, artisans, youth, middle aged, full time and part
time to mention a few. Each of these groupings has
different skills, motivations, opportunities and con-
straints. These must be identified and streamlined in a
holistic manner. Market opportunities are crucial but
underdeveloped in Ghana.
Storey (1994; 1999) suggested three key areas for de-
veloping successful small businesses or enterprises.
These include the qualities of the entrepreneur, charac-
teristics of the firm and strategies adopted by the entre-
preneur to raise output and grow the business. Al-
though some efforts are been made by the existing
small business development institutions such as Na-
tional Board for Small Scale Institutions (NBSSI), Rural
Enterprises Project (REP) and GRATIS foundation, some
areas of business development that need serious gov-
ernment attention are the development of efficient and
effective financial delivery systems, infrastructure sup-
port facilities, entrepreneurial education and training at
all levels, adherence to effective marketing strategies
and reliable business networking. An important first
step to developing such capacities and the concern of
this paper is to profile the characteristics of rural micro
and small scale enterprises (SME) in the northern re-
gions, with the view of identifying the factors that may
limit rural enterprises potential for poverty reduction
and economic development of rural areas.
2 Methodology
The study started with a period of two weeks question-
naire pre-testing in some rural communities in the
Page 17
Page 17
Greater Accra Region. The survey was carried out and
completed in 2008, between the months of March and
July. While the region was purposively chosen based
on the higher rate of poverty, presence of various non-
governmental (NGO‘s) and governmental (GO‘s) and
the visible presence of but yet untapped abundant
natural and human resources, the six districts were
chosen randomly from the list of district from the re-
gional administrations sources. The study employed
three data collection instruments, participatory focus
group discussion (FGD), key informant interviews and
questionnaire administration. These three were cho-
sen for the purposes of triangulation. These are sure
to provide reliable data and therefore conclusion
which might be drawn from the study (Creswell, 2003).
The latter was included mainly to capture information
about business characteristics, asset distribution and
quantitative relationships between business resources
and their poverty positions of entrepreneurs. Funda-
mentally, the use of the two methods was aimed at
getting profound insights into challenges of rural
MSE‘s in Ghana both in quantitative and qualitative
terms.
The main source of secondary data was collected from
the some officials in the Ministries, Departments and
Agencies (MDA‘s) in the districts and regional officers
through key informant interviews employing structured
questionnaires. Data collected included information on
population, vegetation, climate and other socio-
economic conditions of the area.
The questionnaire survey contained both open and
close-ended questions. It was used to elicit informa-
tion on existing and potential businesses in the region,
cost of production as well as pertinent problems en-
countered by entrepreneurs in their day to day busi-
ness activities. The study surveyed six villages and
within each, the simple random technique was used to
sample entrepreneurs. Though the original language of
the questionnaire was English, the questionnaire was
administered in the dialects of the people for effective
understanding and also to ensure that the right kind of
information for the study was gathered. Information
was collected from 950 small scale entrepreneurs,
most of whom were women. This gives us an esti-
mated response rate of about 82%.
One participatory FGD each was held in every district
selected for the study. The people were grouped based
on the type of enterprises which was considered as
their primary occupation. The FGD also sought to col-
lect qualitative data from real life experiences of entre-
preneurs. Questions mainly focused on the nature and
availability of raw materials, level of technology use,
innovations, infrastructure development as well as
business financing, training and marketing issues.
Though the study was not designed on strict gender
lines, the investigator separated man and women dur-
ing the FGD due to the sensitive nature of gender in
the area of study. Others included the major binding
constraints that hinder the development of businesses
in the districts. The key people that were interviewed
involved some opinion leaders (6); assemblymen (6),
local and regional officers of business support agencies
(4), NGO‘s (4) and politicians in the districts (2). These
were selected based on their positions in their respec-
tive organization or case communities.
3.1 Results of Study and Discussions
3.2 Characteristics of Entrepreneurs
Though the services sector had more females than men,
the study survey revealed that male entrepreneurs domi-
nated most of the enterprises surveyed; about three-
quarters of the sampled entrepreneurs were male. Ma-
jority (72.0%) of respondents were married. The average
number of children per parent was 3. Levels of formal
classroom education were quite low; about 16.2% of
respondents had received education up to high school
(secondary, technical, vocational) level. In corroborating
Baah-Nuako‘s work in Accra, Ghana (Baah-Nuako 1991),
the study confirmed that the majority of self-employed
managers in Ghana have less of formal education. De-
spite the few years of formal education, a considerable
number (79.4%) of them however, managed to go
through apprenticeship training, a typical way of acquir-
ing skills in trade in Ghana. A significant majority
(73.7%) of entrepreneurs were within the youthful age of
20 and 35 years old. About a third (34.4%) of entrepre-
neurs had twenty or more years of working experience.
3 Business Enterprises and their Resources
To explore the characteristics of small scale businesses
in the districts, several questions were related to motiva-
tions, business categories, ownership, enterprise man-
agement capacity and networks. The entrepreneurs
were asked to state their motivation for starting a busi-
ness. The quest of becoming independent or owning a
business was cited by a large proportion (78%) of entre-
preneurs. Other reasons include the desire to turn past
experiences or hobbies into income generating activities
for financial gains, self managing entrepreneurs, inde-
pendence, and seizing the opportunity to supply what in
their estimation would be needed by the society. Other
reason was the fact that they needed to do something
that will support their incomes from small scale farming.
Majority (86.2%) of respondents identify themselves as
sole proprietors; businesses were small, started and
managed by owners. About 12.6% were in partnership
while only 1.1% owned limited liability companies. The
trend was not different from national statistics. Nation-
ally, sole proprietorship tops the list of registered compa-
nies, followed by limited liability companies and partner-
ship (personal interview).
Though the Registrar Generals Department (RGD) is the
main body recognised by the country‘s law, to register
companies, the study revealed that only few businesses
(6.2%), registered with RGD. The absence of RGD offices
in the regions may have contributed to the low registra-
tion of businesses with the main body in charge of busi-
ness registration. Though most entrepreneurs saw the
need for such business networks and the benefits they
could derive from it, the study revealed that business
networks were uncommon among entrepreneurs. Only
ATDF JOURNAL Volume 7, Issue 3/4 2010
Page 18
Page 18
3.5% of entrepreneurs had contacts outside the region.
While none of the entrepreneurs had a foreign contact,
14.5% of entrepreneurs belonged to networks within the
area (town and/or village) where the businesses are set
up. What comes close to business network was local asso-
ciation membership. Only about 5.8% were found to be
active members of such associations. The few and simple
network could explain why most rural entrepreneurs are
poor (Granovetter, 1973).
Majority (62.5%) of enterprises were found in the services
sector. The few (10.0%) who were into agro processing,
mainly groundnut oil and shea butter extraction, pito (a
local beer) brewing and kulikuli (a local groundnut cake)
preparations were mainly above 60 years old. The youth
were mainly engaged in the services sector as tailors,
dressmakers and caterers. The middle aged entrepre-
neurs however, were found to have spread themselves
among all sectors of the rural economy. Could the domi-
nance of the youth in the services sector be attributed to a
positive response of people to government‘s policy of en-
couraging self-employment or a mere move away from
traditional rural enterprises, predominantly oil extraction?
These questions are addressed in forthcoming chapters.
The number of entrepreneurs in the trading sector, ‗buying
and selling‘ as its commonly called in Ghana, was also
found to be high. Though a risk taking venture, the busi-
ness of ‗buying and selling‘ was said to be much more
rewarding and hence the involvement of many people
(both men and women). Non traditional income generation
activities such as Bee keeping, Rabbit and Grasscutter (a
micro ruminant) farming were emerging in the districts. A
total of 24.5% of entrepreneurs in the rural localities sur-
veyed were involved in the rearing of the micro ruminants
and bee keeping. Surprisingly, despite the availability of
abundant raw materials for traditional arts and crafts,
those into wood carving, basket weaving and clay pottery
were marginally (5.7%) represented.
3.4 Assets of Business Enterprises
The study revealed that though both locally made and im-
ported equipment were used by entrepreneurs, about half
of respondents claimed they used locally made equip-
ments and machines in their operations. More than 80.0%
of these respondents owned the capital equipment such
as lathe and sowing machines, used in their operations.
The rest rented such machines from other people within
the villages or district. Arrangement for capital equipment
use was easy. Arrangements ranged from hiring, leasing,
and free holding. The use of locally made machines and
equipment was common; the two-thirds of entrepreneurs
who usually use locally made capital equipment and/or
tools, did so because of the ease of access to spare parts.
Although most of these tools and equipment were mainly
produced by the local people in the communities, some
others are imported from the urban centres. The latter are
mainly imported from other countries. Spare parts for im-
ported machines and equipment are also available but,
expensive according to the respondents. The respondents
clearly indicated their preferences for the imported parts,
tools and equipment except for the prices which compels
them to go in for the locally produced items which
according to them are often of an inferior quality.
Market information and intelligence were shared
through the various identified business networks.
Access to market information heavily depended on
social relations among people and the membership of
business and social associations. This was mainly
evident among the tailors and dressmakers associa-
tions. It was indicated that leaders or friends and rela-
tives who returned from the ‗big towns‘ always
brought some information which was made available,
first hand to members of association. However, non
association members could only access such busi-
ness information from their relatives or friends who
belonged to the association.
The study revealed that although entrepreneurs em-
ployed all forms of labour, the distribution of labour
type varied greatly. Whiles some worked for wages
others earned nothing for their labour. A significant
number of respondents employed on the average a
total number of family labour (11), graduate appren-
tices (7) and apprentices (15), who were mostly not
on salary or any wage. On the average, both full time
employees (those receiving wages) and part time
workers (usually called work and pay staff, as it is
known in the services sector) recorded 3 employees
each per business entity. Majority of these people are
either relatives or friends or their children.
This corroborates Van Dijk (1997) assertion that
though relations, particularly ethnicity could limit the
success of businesses, it offers relatives access to
jobs in the construction companies in Accra, Ghana.
Unlike urban entrepreneurs, most rural entrepreneurs
employ their relatives and friends or their children in
their businesses.
3.5 Marketing, Management and Financing Arrange-
ments
Two issues of importance to the success and survival
of any business entity, particularly small scale busi-
nesses are access to markets and/or costs of credit.
Though entrepreneurs had ready market for their
products, the difficulty of getting prompt payments for
goods supplied and/or services offered restricts the
desire to increase production capacities. The study
indicated that products were sold in and outside the
districts though a large proportion of clients resided in
the villages where the products were produced and a
considerable number of entrepreneurs (89.7%) sold
their products in the main market or by the roadside.
About 2.3% of the entrepreneurs used Commission
agents and Wholesalers to distribute their products.
Participation in trade shows or cooperate marketing
arrangements among entrepreneurs was conspicu-
ously uncommon; individual business entities em-
ployed different marketing strategies to distribute
products but none ever used marketing research in
their production decisions. As typical of such busi-
ATDF JOURNAL Volume 7, Issue 3/4 2010
Page 19
Page 19
nesses, particularly in Africa, entrepreneurs produced
and sold whatever they had to offer and not really what
costumers wanted. Business activity is purely production
and not market oriented. The main tool of product adver-
tisement was by word of mouth. As one woman said ‗if
you serve a customer well he/she will not only come
back but bring other customers‘. The presence of local
radio station (FM‘s) adverts did not appeal to entrepre-
neurs due to costs which they complain their profits
could not support. Hawking or displaying products at
strategic locations in the market were also significant in
advertisement.
The study revealed that rural entrepreneurs access
credit from different sources (formal and informal). Infor-
mal sources included money lenders, friends and rela-
tives. The main source of financing was through personal
savings (53%). This confirms the observation made by
Tetteh and Frempong, (2009) in a similar study in some
districts of Ghana. Personal savings as a source of fi-
nancing entrepreneurial activities was followed by
friends and relatives (23%), middlemen (6%) and private
organizations such as non governmental organizations
(17%) operating in the districts. The above sources were
described by respondents as the most preferred and
reliable sources of finance when compared to formal
banks. If the aphorism ‗poor no friend‘ is true then the
poorest among entrepreneurs will always find it difficult if
not impossible, to access credit in the community for
their farming operations. This may be due to the poor
penetration in rural areas, of the numerous micro credit
schemes operating in the country.
Formal institutions farmers sourced included Banks
(rural and commercial) and some registered credit un-
ions which were also located in the area of study. The
study indicates that less than 2% of entrepreneurs
claimed they took loans from the banks. Traditionally,
high interest rates, lack of collaterals and cumbersome
banking procedures have always remain major chal-
lenges that deter small scale entrepreneurs from bor-
rowing from formal financial institutions. High interest
rates and stringent conditions attached to informal
credits such as the demand for large collaterals and
payment schedules were observed to be different for
the various categories of entrepreneurs. Women and
men for example took money under different condi-
tions, with considerable number of the men been the
most successful. Also people of higher standards in the
communities had a better chance of accessing loans
since they were classified as credit worthy. The situa-
tion also posed some difficulties, frustrated and de-
terred business expansions. The poorest among the
poor often suffered from such discrimination.
Terms and conditions of lending were flexible and af-
fordable, allowing entrepreneurs to pay back loans
contracted with less difficulty and/or harassments.
Susu, a form of revolving fund (an informal financial
system where people contribute fixed amounts of
money to the Susu collector daily. The amount payable
is the sole decision of the contributor. The total
amount of money contributed is collected at the end of
a stated period), which is ubiquitous in both rural and
urban areas of Ghana, was another source of funding
explored by entrepreneurs to mobilise money for their
operations, though it was the least patronised source
of business fund in the study area for obvious reasons-
mistrust.
On the question of savings, 23% claimed they kept
their moneys in their homes, while another 32% saved
with the Rural Banks located in their vicinities. Rather
than saving moneys with the banks or in their homes or
with relatives, some respondents (15%) claimed they
join some resolving fund groups operating in the com-
munities. These moneys they collect with no interest at
the end of a period as agreed upon at the beginning of
ATDF JOURNAL Volume 7, Issue 3/4 2010
0 5 10 15 20
Full time
Part time
Family labour
Graduate apprentice
Apprentice
Mean no. of employess
Ty
pe
of
emp
loy
ees
Fig 1 Type and level of employees
Page 20
Page 20
the contribution period. Others (18%) also have joined
the Susu collectors (both formal and informal) in the
communities. Lack of basic understanding of the op-
erations of formal banks, less than enough profit and
mistrust in Bank officials contributed to the poor atti-
tude of formal institutional savings in the communi-
ties. As one woman puts it, ‗I do not save with the
Bank because I do not trust the banks. I am my own
bank. They use our monies to enrich themselves by
buying and driving big cars‘.
4. Conclusion
It was realised that the majority of rural small busi-
nesses were indeed small in terms of size, owned by
individuals as sole proprietors and used mainly man-
ual labour, employed less than ten non waged employ-
ees and operated below capacity due to low level of
technological improvements. Enterprises used less
advanced technologies and innovations and lacked
adequate capital for expansion. Effective manage-
ment, regarding planning, sourcing and organizing
human, financial and marketing resources for higher
profits was inadequate. In such circumstances the
rural entrepreneur had no other choice than to make
do with what was available.
It has been recognised that when public and formal
institutions fail to deliver efficiently, informal institu-
tions thrive. The characteristic underdeveloped labour,
output and financial markets in the study area was
therefore not a surprise. Although informal sector insti-
tutions and arrangements are said to be inefficient
and could disadvantage entrepreneurs and therefore
businesses, most entrepreneurs in the area, still relied
on them for access, production and exchanges. Enter-
prises employed mostly family labour and apprentices
which were nearly free in terms of wages. Although the
investigator did not look at the significance of social
capital in this study, the use of such labour force, trust
and loyalty, besides financial inadequacies, might
have been factored into decisions to use family labour
and apprentices. Governments should endeavour to
take proactive steps to launch and integrate studies
on social relations and employment since they place
major roles in development in developing countries.
Informal market support institutions such as credit
and output markets must be strengthened since most
entrepreneurs preferred that to the formal Banks and
other formal arrangements for access to resources.
The credit policy and business support systems in the
country still need to be scaled up, giving some better
concessions to small scale operator. Market support
institutions must also be improved. The districts
should consider building more and better markets. A
considerable proportion of entrepreneurs used mainly
locally made tools and equipments, manufactured in
the districts or country. An expanded local manufactur-
ing environment will open the area for enhanced eco-
nomic breakthrough.
5. Implications for policy and practice
Recognizing the importance of the micro and small enter-
prises (MSE) sector in Government‘s development poli-
cies, the timing of this research is considered appropriate
and highly relevant. The relevance of this report is in rela-
tion to its coincidence with President J.A Kuffour‘s decla-
ration of ‗Golden age of business‘ for Ghana. The signifi-
cant implications of the study to practise and policy lie in
its capacity to provide a platform for local entrepreneurs
and government to discuss and re-strategize their plans
and programmes.
The study observed a marked difference between the
characteristics of rural small businesses and small busi-
nesses in urban areas. To bridge the gap and ensure that
rural enterprises gain from government policy support
requires a re-look at the situation. It was evident that the
majority of entrepreneurs have not participated in any
government programme designed to support their activi-
ties. Any such programme aimed at ensuring equitable
distribution of resources and outputs as well as provision
of efficient service delivery at all levels should be a prior-
ity. To design such a programme, requires identifying and
understanding the characteristics of rural enterprises and
the context within which these enterprises operate. Un-
derstanding the constraints and opportunities of enter-
prises would help in designing pragmatic strategies
aimed at transforming rural businesses.
The study shows that more and more entrepreneurs are
yet to get receive training in the act of doing business in a
more technological and scientific way. Some major con-
straints of the activities of rural enterprises observed
were scarcity of financing, and low levels of entrepreneur-
ship development and management training for a large
section of the participants. Most rural entrepreneurs have
no or little formal training in technical aspects of their
operations. Formal training in small business organiza-
tion, operation, marketing and management acumen was
missing. These factors limit the development and growth
of SMEs in rural communities. Traditionally, it is assumed
that small business management requires more aptitude
for practical activities than formal classroom education.
However the study indicated that some amount of formal
training or education on some aspects of the business
environment is relevant.
Technological advancement and quality controls have
become crucial part of modern day business practices.
However, the absence and or lack of proper utilization of
technological innovations were conspicuous among most
rural entrepreneurs. Adoption of most current appropriate
technology was also found to be absent. Except the use of
some old equipment and gadgets in use technologies in
use were mainly traditional. These often lead to drudgery
but produces low output. The quest to develop and
strengthen the synergies between science and technology
on one hand and development of small scale businesses
on the other hand should be carefully re-assessed and
improved. It is therefore commendable that a suitable
programme should be put in place provide on the job
training for existing and emerging entrepreneurs.
ATDF JOURNAL Volume 7, Issue 3/4 2010
Page 21
Page 21
ATDF JOURNAL Volume 7, Issue 3/4 2010
Access to finance, markets and other business services
such as extension entrepreneurial training was poor and
clearly should be strongly supported by government
through the creation of a more conducive business and
policy environments. Establishment of business capital
funds, concessionary loans and provision of adequate
technical services training to small business in rural ar-
eas will go a long way to help reduce poverty and ensure
rural development. Such policies must take into consid-
eration the nature of existing and potential businesses,
their contexts of operations and delivery systems in the
area. Improving the financial markets, access to informa-
tion, business advisory and other input delivery services
could change the business environment. Government
must therefore make it a priority to ensure quality con-
trol production.
While entrepreneurs accept the need for formal training
on the technicalities of their operations, most of them
are cash trapped. The government through the District
Assemblies (DA) should be encouraged by law to sponsor
and/or subsidize the training of local entrepreneurs. This
will encourage self employment and small business
growth, particularly in rural communities where re-
sources for agro industrial production abound. Participa-
tion in local and international trade fairs and/or training
at recognised STI training institutes must also be consid-
ered crucial. Such trainings must be tailored to meet the
needs of these entrepreneurs, taking into consideration
the needs of consumers of their good and services in the
face of scientific and technological trends in the globalis-
ing world.
In the wake of a clarion call for the use of science and
technology innovations (STIs) as tools for economic de-
velopment, it is recommended that government‘s STI
policies should be more focused on micro and small en-
terprises development especially in rural communities
where people can easily take advantage of the abun-
dance of local resources to develop themselves. Devel-
oping vibrant small businesses for accelerated economic
Richard Ampadu Ameyaw is a Research Scientist at the
Science and Technology Policy Research Institute
(STEPRI) of the Council for Scientific and Industrial Re-
search (CSIR), Ghana. Richard Ampadu Ameyaw has a
Bachelors Degree in Agriculture (Agricultural Economics
Option) and holds a Masters Degree in Agricultural Eco-
nomics, both obtained from the Kwame Nkrumah Univer-
sity of Science and Technology, Kumasi, Ghana. The cur-
rent interests of the author include issues related to
socio-economic, agricultural development and environ-
mental management in the context of poverty reduction.
Reference
1. GPRS II (2005). Growth and Poverty Reduction Strat-
egy 2006-2009, Government of Ghana. Accra,
Ghana,
2. GSS (2002) Ghana Statistical Service 2000 Popula-
tion and Housing Census. Summary report of final
results‘. Ghana Statistical Office, Accra
3. GSS, (2007) Ghana Statistical Service; Pattern and
Trends of Poverty in Ghana: 1991-2006, Accra,
Ghana,
4. Sen, A (1999) Development as Freedom. Alfred A.
Knopf (ed), New York.
5. Ravinder, R., (2007) Rural Enterprise Development: A
Catalyst For the Eritrean Economy, Asmara, Eritrea,
June 14, 2007 http://www.worldpress.org/
Africa/2825.cfm WB (2004) World Bank,
6. Asante. Y, Nixon, F. Tsikata, GK. (2002) Industrial Sec-
tor and Economic Development. In: Economic Reforms
in Ghana. The Miracle and the Mirage, eds. Aryeetey,
E, Harrigan, J. Nissanke, M. (Africa World Press, Tren-
ton, USA,
7. Frempong, GK (2003), Institutional Framework for En-
trepreneurial Development within the Small scale En-
terprises of Ghana In African Entrepreneurship and
Private Sector Development. Pg139-164. eds. Karl
Wohlmuth, Achim Gutowski, Tobias Knedlik, Mareike
Meyn Sunita Pitamber African Development Perspec-
tives year book 2002/03;
8. Buame, S.K (1996) ‗Entrepreneurship: A contextual
perspective: Discourses and praxis of entrepreneurial
activities within the institutional context of Ghana‘,
University of Lund, Sweden,.
9. GOG, Government of Ghana: Ghana Poverty Reduction
Strategy 2002-2004; Agenda for Growth and Prosper-
ity, Accra, Ghana, 2002.
10.Storey D (1994) Understanding The Small Business
Sector, Routledge,
11. Storey, D.J. (.1999) Six steps to heaven: evaluating
the impact of public policies to support small business
in developed economies, in: D.L. Sexton and H. Land-
ström (eds.), Handbook of Entrepreneurship (176-
194). Oxford: Blackwell,
12.Creswell, J.T. (2003) Research Design: Qualitative,
Quantitative and Mixed Methods Approaches. Second
Edition, Sage publication, London, New Delhi.
13.Baah-Nuako,Tutu, Osei, B. A., K. Sowa, N.K. (1993)
Impact of structural adjustment on small scale enter-
prises in Ghana, In Small enterprises and changing
policies: structural adjustment, financing policy and
assistance programme in Africa Helmsing A.H.J and
Kolstee T (eds) IT publication,
14.Granovetter, M (1973) ―The strength of weak ties‖,
American Journal of Sociology 78: pp1360-80,
15.Van Dijk, M. P. (1992) ―Small Enterprise Associations
and Networks: Evidence from Accra.‖ Enterprise Clus-
ters and Networks in Developing Countries. London:
Frank Cass, p.142,
16. Tetteh, E.K and Frempong, G.K. (2008) Developing the
Rural Economy of Ghana through Micro and Small En-
terprises (MSEs). Issues and Option. African Technol-
ogy Development Forum (ATDF), Vol. 5, Issue 3/4.
Page 22
Page 22
Abstract
Economic Development in Africa has made signifi-
cant strides over the past 20 years. Most African
countries carried out economic reforms that eventu-
ally contributed to positive and impressive growth in
real gross domestic product (GDP), attracted an in-
creasing amount of investment and enabled them to
benefit more from favourable trade terms. To what
extent do the economic growth rates also reflect a
better and more sustainable integration of the Afri-
can continent into the global knowledge economy?
We examine this question by looking at trends in the
use, trade and transfer of technology between Afri-
can countries and the rest of the world. In this con-
text we use royalties and licensing fees, capital
goods imports and trade in business, professional
and technical (BPT) services as indicators reflect the
quality and quantity of technology transfer and
global economic integration.
We find that Africa is performing better than ex-
pected in the acquisition of industrial technology-
related proxies. It is found that, between 1990 and
2008, Africa and Asia enjoyed high growth rates in
royalties and licensing fees payments. However, the
numbers also show that Africa still lags behind in
exports of capital goods and imports of services.
We recommend four easy steps that African coun-
tries can use to promote a type of technology trans-
fer that would particularly benefit the local private
sector.
Introduction
Technology transfer plays a critical role in innova-
tion, industrial development and competitiveness in
the global market place. It is for this reason that
technology transfer has been a subject of significant
interest and international debate.
It was agreed, during the negotiations of the Interna-
tional Code of Conduct for Transfer of Technology, to
define technology transfer as the "transfer of sys-
tematic knowledge for the manufacture of a prod-
uct, for the application of a process or for the ren-
dering of a service and does not extend to the trans-
A resurgence in acquisition of industrial
technology in Africa?
Analysis of global trends in technology transfer.
Victor Konde
(Email: [email protected] )
ATDF JOURNAL Volume 7, Issue 3/4 2010
actions involving the mere sale or mere lease of
goods" (UNCTAD, 1985; Patel, et al 2001). This
definition views technology transfer as a transfer of
a system that includes hardware, software, proce-
dures and skills, among others, as a package,
rather than as a "product transfer", such as the
sale of a computer or tractor, and as a transaction
between the supplier and user of the technology.
There are several channels through which technol-
ogy may be transferred. The transfer of technologi-
cal products may take place in the import or export
of machinery/equipment embodying the technol-
ogy of interest. The transfer of a production proc-
ess for the manufacture of a product or delivery of
a service is expected to take place through trade in
knowledge assets and services (e.g. licensing, fran-
chising and outsourcing), FDI (e.g. investments in
new projects and joint-ventures) and turnkey pro-
jects. The extent to which these activities represent
actual transfer of technology may depend on the
level of learning, skills development and absorptive
capacity of the recipient and the technology con-
tent of the project.
In terms of modes, technology may be transferred
intra-firm (internalized) or inter-firm (externalized).
Intra-firm technology transfers refer to transfers
between affiliated firms or subsidiaries. Inter-firm
transfers occur when technology is licensed to un-
affiliated parties. Though firms may not be affili-
ated, they may have a common origin, collaborated
in the past and have common advisers. Transfer of
technology between such firms may not qualify as
intra-firm legally. For example, transfer of technol-
ogy to an independently owned contractor to en-
able the contract to supply services is inter-firm
transfer legally speaking but does not seem to dif-
fer, in practice, from transfer of technology to an
affiliate to supply goods and services.
Irrespective of the mode, the process of technology
transfer starts in practice with identification of the
need and possible sources of technologies (in case
of the buyer) or potential users of the technology
(in case of the seller). Depending on the various
reasons mentioned earlier, an agreement is
reached and the transfer conditions set, then the
Page 23
Page 23
have been used to measure technology transfer
(see Kelly 1998 for a detailed discussion). The
most common ones include royalties, licensing
fees and imports of capital goods. In general, the
proxies track the payments that are associated
with technology transfer and not the technology
itself. For example the transfer of intellectual prop-
erty rights and provision of technical services occa-
sion payments in the form of royalties and licens-
ing fees. Some of these assets, such as trade-
marks, do not directly represent technology trans-
fer. However, they may signal the existence of
growing confidence and trust in domestic industrial
processing and other activities that often indicates
an increasing use of better production and service
delivery techniques. It is important to stress that
the technological sophistication or knowledge con-
tent of capital goods or intellectual property asset
may vary widely even within the same class of ma-
chines (e.g., in complexities, sophistication, per-
formance and applications) and, as a result, their
validity to serve as conduits for technology transfer
(Navaretti et al., 2003).
Services are another proxy for technology transfer.
Services that play a key role in technology transfer
include architecture, engineering, consulting, in-
stallation, research, management, operational
leasing, financial and analytical testing services,
among others. In particular, trade in R&D services
is now seen as a key proxy of technology transfer.
In many of these cases, the parent or contracting
firm may provide requisite information, technolo-
gies and support to meet the specific requirements
of their next generation of products or services.
Depending on the needs, a firm may choose to use
one or more of these approaches to achieve spe-
cific goals in managing the high cost of R&D effec-
technology is transferred. In terms of individual
market transactions, a technology transfer may be
considered completed once the sale is finalized
and the technology is put into operation by the
user. From a development perspective, however,
effective transfer of technology entails the out-
come that the user is able to operate, maintain,
upgrade and build on the acquired technology to
spur further innovation.
Technology transfer may range from a single pur-
chase to complex negotiations that involve several
commitments lasting for months or even years. For
example, in August 1992, Tanzania appointed a
committee of experts to come up with specifica-
tions for a radar system that would meet the coun-
try's requirements. The experts recommended a
joint radar system for military and civilian use. In
September 1997, Tanzania and BAe Systems (then
SPS) agreed on the list of components to be in-
cluded in the radar system. The Sales Agreement
price included equipment maintenance contract,
training, spare parts and wages for expatriates. In
2002, BAe Systems was issued with a license by
the United Kingdom (UK) to supply the radar to
Tanzania. This case demonstrates some of the key
steps and components of technology transfer.
Indeed, technology transfer should not be seen as
a one-time process but rather as a continuous
process to acquire and absorb advanced technolo-
gies to remain competitive. For example, the devel-
opment of the automotive industry in the Republic
of Korea took several key stages. The country
started with the assembly of foreign models with
about 20% local content in the early 1960s. Within
two decades, the country achieved mass produc-
tion. A key component of this success is Korea‘s
continuous acquisition of technology and learning
to operate and further im-
prove the acquired knowledge
(Pacudan, 1998). Korea re-
mains a net importer of tech-
nology despite its incredible
achievements. Korea is not an
exception. Japan, the second
major technology-exporting
country after the United
States, only became a net-
technology exporter in 2003,
according to a study by the
Bank of Japan (Yamaguchi,
2004; Nitta, 2005).
1. Tracking and defining prox-
ies for measuring technology
transfer
There are several proxies that
ATDF JOURNAL Volume 7, Issue 3/4 2010
0
30
60
90
120
150
0.0
1.5
3.0
4.5
6.0
7.5
9.0
10.5
12.0
13.5
15.0
1990 1992 1994 1996 1998 2000 2002 2004 2006 2008
Bill
ion
s (U
S$ -
OE
CD
)
Bill
ion
s (U
S$)
Source: World development indicators, 2008
Figure 1. Payments: Royalties and licensing fees
Sub-Saharan Africa
Latin America & Caribbean
East Asia & Pacific
High income: OECD
Page 24
Page 24
of the Organization of Economic Cooperation and
Development (OECD) accounted for about $128
billion (or 81%) of the global royalty and licensing
fee payments and $158 billion (i.e. 98%) of the
global receipts.
In terms of royalty and licensing fee payments,
East Asia and the Pacific and SSA registered
higher than the world average. It was observed
that royalty and licensing fee payments in-
creased 57 times for East Asia and the Pacific,
10 times for SSA, 6 times for the OECD and 5
times for LAC between 1990 and 2008. In terms
of royalty receipts, East Asia and the Pacific reg-
istered the fastest growth followed by LAC, OECD
and SSA as shown in figure 1. LAC has regis-
tered the fastest growth in the last four years
(2005 to 2008) - with royalty and licensing fee
receipts more than doubled.
At national level, trends in royalty and licensing
fee payments and receipts differ widely among
African countries. South Africa remains the main
consumer of knowledge assets in Africa with its
payments reaching $1.68 billion in 2008. In-
deed, South Africa‘s payments dwarf those of
other main African countries such as Egypt‘s
$241 million and Nigeria‘s $174 million in 2007
(see Table 1 for details of royalty and licensing
fee payments of selected African countries). Of
these, the fastest growth in payments of royalties
and licensing fees between 1990 and 2007 has
been witnessed in Cameroon, Senegal, South
Africa, Swaziland and Tunisia.
For example, payments of royalties and licensing
tively.
2. Trends in technology transfer in Africa
This chapter looks at the trends in global flows of
technology at regional level, largely comparing Africa
to other developing regions using the proxies ex-
plained earlier. It then provides a similar compari-
son, where data is available, among African coun-
tries and national examples where data is absent.
The analysis largely covers the period 1990 to
2008. This time period is deliberately selected bear-
ing in mind that most economies started to liberalize
and privatize in the 1990s. It was also in the 1990s
that WTO Agreement and with it the TRIPS Agree-
ment were adopted. Therefore, it presents an inter-
esting period to capture the effect of many of these
changes in the structure of economies and govern-
ance of technology.
2.1. Trends in royalty and licensing fees payment
and receipts.
There has been a significant and steady increase in
the trade in knowledge assets over the last few dec-
ades. Globally, royalty and licensing fee receipts
were estimated to have increased from $24.2 billion
in 1990 to $158 billion in 2008 while royalty and
licensing fees payments were estimated to have
increased from $27.3 billion to about $161 billion
over the same period. In general, royalties and li-
censing fees payments and receipts have increased
nearly 6-fold between 1990 and 2008 globally. As
show in Figures 1 and 2, the 30 member countries
ATDF JOURNAL Volume 7, Issue 3/4 2010
0
20
40
60
80
100
120
140
160
0.0
0.2
0.4
0.6
0.8
1.0
1.2
1.4
1.6
1990
1992
1994
1996
1998
2000
2002
2004
2006
2008
Bil
lio
ns
US
$ (
OE
CD
)
Bil
lio
ns
(US
$)
Source: World Development Indicators, 2009
Figure 2. Receipts: Royalties and licensing fees
Sub-Saharan Africa
Latin America & Caribbean
East Asia & Pacific
High income: OECD
Page 25
Page 25
Kenya, Morocco and Namibia. For instance,
Kenya‘s payments for knowledge assets have fallen
sharply from about $102 million in 1993 to about
$23 million in 2007. Similarly, Morocco‘s royalty
and licensing fee payments grew up to $201 million
in 1999 but has since fallen to an annual average
of about $ 36 million since 2000. Similar fall is
seen in the payments of Egypt - from over $400 mil-
lion in 2000 to an annual average of about $170
million since 2003, and in the payment of Cote
d‘Ivoire - from about $25 million in 1998 to about
$9 million in 2006.
In terms of magnitude or absolute value of receipts,
Angola, on average, occupies the first place fol-
lowed by Egypt, South Africa, Kenya and Tunisia as
shown in Table 1. Angola recorded its highest level
of receipts of $1.3 billion in 2006, giving rise to an
annual average of $275 million between 2000 and
2007. It also accounts for the peak in Sub-Saharan
Africa‘s receipts for 2006 in Figure 2. On this basis,
Angola‘s receipts went up 25 times, followed by Bot-
fees have increased 13 times for Swaziland, 12
times for South Africa, 9 times for Tunisia and 2.3
times for Senegal between 1990 and 2007. In
terms of real value, Tunisia‘s royalties and licensing
fees payments have increased from $1.13 million
to about $10 million between 1990 and 2007
while those of Swaziland have increased from $9.3
million to $121 million over the same period. Simi-
larly, payments by South Africa increased from
about $132 million in 1990 to about $1.6 billion in
2007 while Senegal‘s payments increased from
about $330 thousand to about $780 thousand
over the same period. As a proportion of the world,
South Africa‘s payments have grown from about
0.3% in 2000 to about 1.1% in 2007 and the
global share of Swaziland had grown from about
0.04% to 0.07% over the same time.
However, there are other African countries whose
royalty and licensing fee payments have fallen be-
tween 1990 and 2007. Countries that have seen
their payments fall include Cote d‘Ivoire, Egypt,
ATDF JOURNAL Volume 7, Issue 3/4 2010
Payments Receipts
1990-99 2000-07 1990-99 2000-2007
South Africa 195.0 809.8 52.0 37.2
Egypt 288.5 223.5 49.8 95.0
Swaziland 20.5 76.4 0.2 0.1
Kenya 48.4 44.0 12.9 16.8
Morocco 111.9 36.4 4.3 13.8
Madagascar 6.8 13.4 1.2 1.0
Cote d'Ivoire 13.1 12.9 0.3 3.3
Botswana 6.6 9.6 0.1 1.5
Tunisia 2.0 7.3 3.7 15.6
Senegal 1.3 5.0 0.9 0.1
Cameroon 1.1 3.6 1.7 0.5
Namibia 3.2 2.9 2.8 1.8
Niger 0.7 0.5 NA NA
Cape Verde 0.1 0.2 0.1 0.2
Angola NA NA 10.7 274.7
Lesotho NA NA 32.2 15.3
Table 1. Average annual royalty and licensing fee payments and receipts for selected countries in Africa (in US$ million)
Source: World Development Indicator, 2009
NA= Not Available
Page 26
Page 26
swana whose receipts went up 22 times between
1990 and 2007. South Africa, Lesotho, Madagascar
and Cameroon are among countries that have seen
their royalty and licensing fee receipts fall while
Egypt, Cote d‘Ivoire and Kenya are among countries
that have witnessed a general growth in their re-
ceipts. The countries whose royalty and licensing
fee receipts have increased are not exactly exporters
of knowledge-intensive products or generators of
technologies but rather charge royalties and licens-
ing fees related to other activities such as explora-
tions, mineral and mining rights and others related
to travel and tourism, etc.
2.2 Trends in capital goods imports
In general, the import of capital goods has grown
rapidly over the last two decades. Such imports
have increased by 7.8-fold for LAC, 7.5-fold for Asia,
4.7-fold for North America, 3.9-fold for Europe and
3.7-fold for Africa between 1990 and 2006. How-
ever, Europe, North America and Asia are the largest
importers of capital goods. Imports of capital goods
by European countries increased from about $74
billion in 1990 to about $289 billion in 2006. As
such Africa‘s imports of capital goods grew much
slower than that of the other regions included in this
paper (see Figure 3) but accelerated much faster in
the last five years.
It was noted that Africa is the only region that
spends more than 10 times on imports of capital
goods than it earns in exports of similar goods. This
perhaps indicates that Africa is not a major producer
of capital goods as its exports of capital goods re-
mained largely unchanged. On the other hand, Asia
has joined Europe as a net exporter of capital
goods and LAC‘s exports of capital goods have
grown at the same speed as that of Asia (a 3-fold
increase).
A closer look at Africa reveals that imports of capi-
tal goods have grown rapidly since 2001. Imports
of such goods did not change much between
1995 and 2001 but has almost tripled in value
between 2001 and 2006. Therefore, while Africa
remains a small importer of capital goods in abso-
lute value, it has registered the fastest growth in
the import of capital goods between 2001 and
2006 than any other regions.
In terms of rate of growth in imports of capital
goods, Madagascar registered the fastest growth
in imports of capital goods between 2000 and
2008 in Africa. Madagascar‘s imports of capital
goods increased eight times within that period.
Another four African countries – Zambia, Niger,
Nigeria and Rwanda - saw their imports of capital
goods increased more than seven times between
2000 and 2008. In general, about 60% of the Afri-
can countries (19 out of the 32) considered here
saw their imports of capital goods more than triple
over this period (See Table 2).
There are also a number of general observations.
The best performing countries in terms of imports
of capital goods are smaller economies – except
Nigeria. Secondly, while the mining and petroleum
producers and exporters performed well, the top
importers include countries outside this category
ATDF JOURNAL Volume 7, Issue 3/4 2010
0
50
100
150
200
250
300
1990
1992
1994
1996
1998
2000
2002
2004
2006
US
$ b
illi
on
sFigure 3. Imports of selected capital goods
America
Europe
Africa
LAC
Asia
Source: UNCTAD Handbook of Statistics, 2009
Page 27
Page 27
such as Ethiopia, Malawi, Rwanda, and Uganda.
Some of the countries that have not witnessed a
fast growth in the imports include Botswana, Mauri-
tius and Swaziland.
To determine the extent to which countries are in-
vesting in capital goods, we assess such imports as
a proportion of total merchandise imports. As shown
in figure 4, about 10 out of the 32 countries spent
more than 17% of their total merchandise import bill
on capital goods. Zimbabwe, Egypt, Ethiopia, Zam-
bia and Nigeria are the top five countries and they
each spent almost a fifth or more of their total
merchandise imports bill on capital goods in
2008. Only Benin and Swaziland out of the 31
countries whose data was available spent less
than 5% of their total merchandise imports on
capital goods in 2008.
2.3 Intra- and Interfirm Trends in trade of BPT
services
Most of the data on trade in services is not suffi-
ATDF JOURNAL Volume 7, Issue 3/4 2010
Table 2. Imports of capital good (BEC 41) of selected African countries
2000 2001 2002 2003 2004 2005 2006 2007 2008
South Africa 5089 4749 5010 6350 8500 10000 14088 14088 15322
Nigeria 851 1096 1815 2676 - - 5235 5463 6280
Egypt 1771 1385 1166 896 1090 - - - 6201
Algeria 1432 1678 2144 2643 3489 3583 3540 4381 -
Morocco 1739 1401 1462 1841 2365 2668 2908 3793 -
Tunisia 1177 1293 1176 1315 1499 1494 1621 1976 2534
Kenya 414 439 336 364 580 580 777 1067 1473
Ethiopia 194 235 236 395 447 690 777 1097 1097
Sudan 225 257 334 384 640 1388 1687 1184 891
Uganda 122 139 128 174 237 347 357 533 737
Zambia 94 152 162 248 304 347 598 788 713
Madagascar 85 91 45 114 189 206 174 327 699
Senegal 168 168 88 201 260 391 391 424 629
Côte d'Ivoire 219 224 317 377 425 716 391 496 575
Botswana 347 249 432 575 370 341 318 489 571
Namibia 203 203 161 164 298 317 345 543 546
Zimbabwe - 164 326 - 282 134 228 522 -
Mauritius 242 196 243 277 331 574 593 468 465
Mozambique 80 135 198 247 282 317 281 391
Malawi 75 61 62 89 99 124 115 124 357
Mali 78 129 79 110 100 119 163 216 337
Gabon 181 162 150 123 136 217 289
Rwanda 31 31 29 23 57 71 97 230
Guinea 29 35 35 90 56 94 173 183
Niger 17 17 40 56 63 57 100 97 124
Swaziland 109 81 92 199 130 126 123 95
Mauritania 34 43 23 26 819 670 66 134 87
Cape Verde 26 26 32 27 32 41 60 79 83
Seychelles 33 43 39 52 64
Benin 34 49 40 57 66 46 48
Gambia 10 6 7 10 21 21 23 26 18
Source: Comtrade database, 2009
Page 28
Page 28
ciently disaggregated to identify technology trans-
fer-related service payments and receipts. Here we
use the United States - the top exporter and im-
porter of such business, professional and Technical
(BPT) services - as a proxy of trends in global trade
in BPT services. Geographical proximity, trade rela-
tions, language barriers, diplomatic relations and
historical ties are likely to influence access to and
trade in BPS among countries in different regions.
Despite this limitation, United States has the data
disaggregated sufficiently to at least portray some
general trends in trade of BPT services.
According to the United States Bureau of Economic
Analysis (USBEA), the trade in BPT services between
the United States and the rest of the world has
grown, at varying speeds, as shown in Table 3a. In
general, payments by the United States for business
and professional services grew faster than receipts.
Intra-firm payments increased much faster than in-
ter-firm receipts. While this raises some doubt that
firms may be overstating payments to cover external
profits, it is perhaps important to note that inter-firm
payments also grew faster than inter-firm receipts.
Africa posted a 5-fold increase in receipts and 51-
fold rise in payments to the United States between
ATDF JOURNAL Volume 7, Issue 3/4 2010
0 5 10 15 20 25
Swaziland Benin Niger
Côte d'Ivoire Seychelles
Gambia Mozambique
Senegal Tunisia Malawi
Mali Cape Verde Mauritania
Kenya Mauritius Morocco
Sudan Madagascar
Uganda Rwanda Guinea
Namibia South Africa
Botswana Algeria Gabon Nigeria Zambia
Ethiopia Egypt
Zimbabwe
Figure 4. Capital goods imports (BEC 41) as percentage of merchandise imports
% merchandise export
Source: Comtrade database, 2009
Table 3a Trends in the US international trade in business, professional and technical services (in US$ millions)
Receipts Payments
2001 2008 2001 2008
Intra-firm 30,744 55,484 20,966 50,603
Inter-firm 28,169 58,041 9,452 25,681
Total 58,913 113,525 30,418 76,284
Page 29
Page 29
1990 and 2005. As shown in table 3b, it was ob-
served that receipts by the United States from unaf-
filiated firms for business and professional services
between 1990 and 2005 increased by about 7.7-
fold in Europe, 6.5-fold in Asia, 5.6–fold in Africa
and 4.3- fold in LAC. However, growth in payments by
United States firms to unaffiliated firms for BPT
services grew fastest in Africa (51-fold) followed by
Asia (14.2-fold), LAC (9.5-fold), and Europe (8.7-
fold) over the same period. As a result, Africa‘s
share of United State‘s imports of BPT services
has more than doubled – form 0.5% in 1990 to
ATDF JOURNAL Volume 7, Issue 3/4 2010
Table 3b The US international inter-firm trade in business and professional services by region (in US$ millions)
Receipts Payments
1990 2000 2005 1990 2000 2005
Europe 2,182 10,153 16,805 687 3,481 5,979
Africa 230 1,008 1,289 11 155 562
Asia 979 3,382 6,365 147 963 2,087
LAC 1,314 3,690 5,640 126 574 1,208
Table 3c As a percentage of the US receipts and payments
Receipts Payments
1990 2000 2005 1990 2000 2005
Europe 28 40 42 33 38 13
Africa 3.0 4.0 3.2 0.5 1.7 1.2
Asia 13 13 16 7 11 4
LAC 17 15 14 6 6 3
Source: US Bureau of Economic Analysis
NB: Data for trade in services between affiliated firms is available only from 2001 and receipts refer to exports of
such services by the US and payments refer to imports (i.e. US firms paid for the services).
0% 20% 40% 60% 80% 100%
Unaffiliated
Affiliated
Europe
LAC
Africa
Asia and Pacific
Source: US Bureau of Economic Analysis Table 7a, 2009
Figure 5. Difference in composition of import of BPS from the United States in 2008
'Computer and data processing services
'Database and other information services
'Management, consulting, and public
relations services
Research, development, and testing services
Operational leasing
Advertising
'Construction, architectural, and
engineering, services1
Industrial engineering
Installation, maintenance, and repair of
equipment
Legal Services
'Other2
Page 30
Page 30
about 1.2% 2005 (see Table 3c).
There is also a major difference in the nature of
BPT services that are traded between affiliates and
their parent firms, between unaffiliated firms, and
between the United States and developing regions.
As shown in figure 5, more than 40% of intra-firms
payment to the United States was for management,
consulting and public relations type of services and
about 25% was for research, development and test-
ing services in 2008. However, these two groups of
BPT services made up less than 9% of inter-firm
payments in 2008. Similarly, installation, mainte-
nance and repair of equipment and legal services
made up about 26% of the payments by unaffiliated
firms to the United States while the same group of
services constituted only about 4 % of payments by
affiliated firms.
Similar differences are also observed at the re-
gional level. Inter-firm trade in BPTs accounts for
over 60% of Asia‘s payments but less than 40% of
that of Africa. Similarly, about 33% of Asia‘s and
22% of Africa‘s payments for BPT services to the
United States are for management, consulting and
public relations services and construction, architec-
tural and engineering services, respectively. These
two categories of services collectively account for
only about 22% of LAC‘s and about 30% of Asia and
the Pacific‘s payments for BPT services to the
United States. It seems intra-firm trade dominates
Africa‘s payments for BPT services. The much
higher share of intra-firm trade in Africa might be
an indicator for little incentives for foreign investors
to collaborate with the local private sector
While the rest of Africa is collectively a net importer
of BPT services from the United States, South Africa
has been a net exporter of such services in 2006,
2007 and 2008. Other developing countries that
are net exporters of BPT services in the period re-
viewed include Brazil, India, Israel, Malaysia, Philip-
pines and Thailand. Of these, India was the largest
net exporter of BPT services to the United States –
rising from $3.5 billion in 2006 to $6.8 billion in
2008.
Table 3b The United States' international inter-firm
trade in business and professional services by re-
gion (in US$ millions)Source: US Bureau of Eco-
nomic Analysis
NB: Data for trade in services between affiliated
firms is available only from 2001 and receipts refer
to exports of such services by the US and payments
refer to imports (i.e. US firms paid for the services).
Overall, Africa is performing better in proxies that
are closely related to trade and investment such as
trade in capital goods and royalties and licensing
fees than those that represent emerging knowledge
such as the research, development and testing ser-
vices.
Four easy and effective steps to promote technology
transfer
There are several ways in which Africa can promote
and facilitate technology transfer. These include
providing information on new and emerging tech-
nologies, supporting training and attachments, of-
fering targeted tax incentives for technology acquisi-
tion, establishing R&D and technology sourcing
units in advanced economies, developing interna-
tional cooperation and partnerships, encouraging
trade and foreign direct investment (FDI), among
many others. In this section, we place emphasis on
a few viable ways that could be implemented rela-
tively easily and quickly by African countries and
likely to stimulate innovation and technology trans-
fer.
Enhancing university-industry-government partner-
ships
One way of promoting the acquisition, adaptation,
upgrading and diffusion of new and emerging tech-
nologies as well as birth and growth of firms is to
improve the relationships between knowledge and
skill producers (academia), knowledge users and
product/service providers (industry) and regula-
tors/policy makers (government), commonly re-
ferred to as the "Triple Helix" of University-Industry-
Government (Leydesdorff and Etzkowitz, 2001). The
three parties represent the key players of any na-
tional or regional innovation system. In brief, the
triple helix model does not impose boundary restric-
tions in relations, interactions and location of inno-
vations and entrepreneurship or the roles of the
players. The triple helix is a ―spiral model that cap-
tures multiple reciprocal relationships at different
points of knowledge capitalisation‖ (Leydesdorff
and Etzkowitz, 2001).
In order for academia to play this role, the universi-
ties have to expand their roles from being trainers
and producers of skilled elites to owners of the
knowledge and founders of firms. This gives rise to
what has been termed the "entrepreneurial univer-
sity" (Clark, 1998) whose key characteristics in-
clude:
Independent, strong and efficient managerial
system,
Interdepartmental cooperation and increased
collaboration with the outside,
Broadened resource base,
Transformation of faculty to accept entrepre-
ATDF JOURNAL Volume 7, Issue 3/4 2010
Page 31
Page 31
neurial attitudes and, Shared entrepreneu-
rial culture throughout the university.
These characteristics are seen as key in enabling
universities to function as centres for knowledge
creation, technology transfer, centres for develop-
ment of firms and agents for economic and social
development (creating jobs and wealth). The uni-
versity, in this case, enables research teams to
operate as 'quasi-firms'(Etzkowitz, 2003).
Although these relations are not well character-
ised in developing countries, there is a growing
volume of evidence that they play an important
role. Several countries have already considered
ways of encouraging such partnerships. For in-
stance, South Africa's Innovation Hub
(http://www.theinnovationhub.com/) is strategi-
cally located between two of the country's premier
scientific and industrial research institutions: the
University of Pretoria and the Council for Scientific
and Industrial Research (CSIR).
Similarly, Egypt's Mubarak City for Scientific Re-
search and Technology Applications
(http://www.mucsat.sci.eg/citypages/home.aspx)
is located in an industrial area housing about
40% of the Egyptian industry. The locations are
deliberately designed to encourage collaboration
with industry.
3.2 Technology transfer through government
contracts
Governments are among the major consumers of
products and services. They often source prod-
ucts and services in the domestic economy and
internationally. Many African governments de-
pend on foreign firms to acquire technologically
sophisticated equipment. Governments can use
such contracts to encourage local firms to source
foreign technologies by floating technologically
challenging contracts to local firms. Similarly, gov-
ernments could ensure that international contrac-
tors work with local firms in implementing con-
tracts to encourage technology transfer.
Another example is the Airbus-Aeroflot deal involv-
ing the purchase of twenty-two A350 Airbus
planes by the state-owned Russian airline in
March 2007. This deal includes the participation
of Russian firms in the production of the planes. A
number of components for the production of Air-
bus planes are to be manufactured by Russian
plants and the Engineering Centre Airbus in Rus-
sia (ECAR), one of Airbus' design and engineering
centres. This deal follows the three partnership
agreements proposed in 2006 by Airbus
(engineering and manufacturing of parts, conver-
sion of passenger planes to cargo planes and par-
ticipation in design and manufacture of new-
generation Airbus planes), with Russian firms and
government, estimated to be worth about $25 bil-
lion.
In a nutshell, all these arrangements could be tai-
lored to serve as conduits for the transfer of tech-
nology from one country to another. In Africa, Tu-
nisia used the contract for global sourcing of mo-
tor vehicles to develop its automobile components
industry. Firms that agreed to supply automobiles
were encouraged to source some components
from local firms. Despite its limited market size –
a small population – the country managed to at-
tract interest from car assemblers. Backed with
incentives and technical support to local manufac-
turers of automobile parts, the country has devel-
oped an industry that supplies parts to car assem-
blers in Europe.
3.3 Industrial technology alliances
Industrial technology alliances, as defined by the
US National Science Foundation (NSF), are
"industrial technology linkages with the aim of co-
developing new products or capabilities through
R&D collaboration" (NSF, 2006). There are at least
four factors that promote the development of tech-
nology alliances:
the multidisciplinary nature of R&D activi-
ties;
the complexity of R&D;
the uncertainty of commercial success of
R&D products; and the high cost of R&D ac-
tivities (Suarez-Villa, 2004).
Firms may seek alliances to spread the cost, risks
and uncertainty, especially in knowledge intensive
fields such as biotechnology where there are re-
strictive and lengthy regulatory regimes (Ernst &
Young, 2005). Some of these partnerships may
strategically position a firm to gain access to pub-
lic and private resources of its partner(s), avoid
regulatory and registration hurdles in foreign coun-
tries and access lucrative contracts and markets.
In the life science industries, such as biotechnol-
ogy and biopharmaceuticals, and the information
and communication technology sector, firms may
engage in partnership to invest in a new firm.
These arrangements are crucial in enabling coun-
tries lagging behind to quickly gain access to
knowledge, learn and run a business without
needing to reinvent the ―wheel‖. The risks of de-
veloping, producing, distributing and marketing
new products is drastically reduced in industrial
ATDF JOURNAL Volume 7, Issue 3/4 2010
Page 32
Page 32
tics, among others. Such joint centres may have facili-
tated Korean firms, such as Samsung, to enter into
technology partnerships and establish R&D centres in
Russia. Such collaboration also helps familiarize indi-
viduals in private and public institutions with the cul-
ture of partner countries and promote understanding.
Conclusion
The term technology transfer as used in this paper in-
cludes various processes associated with acquisition,
learning or mastering of technology. Technology trans-
fer is not only vital for developing countries but also
developed countries. Indeed, most of the technology
transfer related transactions and deals occur between
developed countries. As such technology transfer is not
and should not be seen as a one-off activity but rather
a continuous process. The development of new and
improved products, processes and organizational ar-
rangements (i.e. the process of innovation) is likely to
depend on access to knowledge generated by others.
Perhaps one of the most surprising conclusions is that
Africa is performing relatively well in a number of areas
in terms of technology transfer, unlike in a previous
study (UNCTAD, 2003) where its performance was still
considered to be poor. This may signal a technological
resurgence at least at the industrial level. In general,
Africa performed relatively well in the import of foreign
technologies embodied in machines and some ser-
vices. Africa‘s 10-fold increase (about 900%) in royalty
and licensing fee payments between 1990 and 2008
is above the world average and the second highest
among the regions compared in this paper. More im-
portantly, a number of African countries recorded
higher growth in this area than the African average:
Cameroon (2,100%), Niger (4,300%) Senegal
(2,300%), South Africa (1,100%) over the same period.
We also note that Africa recorded the fastest growth in
imports of capital goods between 2001 and 2006. A
number of African countries including Guinea, Mada-
gascar, Niger, Nigeria, Rwanda, Uganda and Zambia
recorded an increase of more than twice the African
average. Similarly, Africa‘s imports of business, profes-
sional and technical services from the United States
rose at a slower rate than that of Europe and Asia
while Africa‘s exports of the same services to the
United States increased faster (51-fold) than any other
region.
At a global level, we can make three general observa-
tions. First, cross-border payments for technology are
growing fast but are still concentrated among devel-
oped countries and involve only a handful of develop-
ing countries. This is not entirely surprising as technol-
ogy transfer is needed to generate and improve pro-
ductivity and efficiency (Nelson and Phelps, 1966).
Second, regions that have benefited from increased
global flows of technology have also registered remark-
able development, such as Asia. This is expected as
effective technology transfer is fundamental to the
processes of learning and catching-up (Perez and
Soete, 1988). Third, all developing regions import more
what may be termed mature technologies (e.g. ma-
alliances such as joint ventures because even the least
developed country may easily obtain exclusive access to
its market especially where the government has a stake
in the firm. Key to these arrangements is the government
playing a facilitating role in technology transfer through
industrial alliances and partnerships by completing sci-
ence and technology agreements.
3.4 International science and technology cooperation
agreements
International science and technology cooperation agree-
ments (ISTCAs) as well as multilateral environmental
agreements (MEAs) often contain clauses that promote
technology transfer. Whereas South-South ISTCAs have
contributed significantly to genuine technology transfer,
North-South MEAs have so far failed to do so. Promotion
within ISTCAs may take the form of cooperation in R&D
through joint research projects in the field of common
interest, strengthening the R&D capacity of the least de-
veloped party, exchange of scientists and researchers
and fostering relations between research centres, among
others.
Countries enter into collaborative R&D activities to pool
financial resources for large or expensive projects, tap
expertise and natural resources located in other coun-
tries, participate in global projects and promote political,
cultural, scientific and industrial relations. In addition,
international collaboration could keep national policy
makers informed about key international S&T policy deci-
sions of other governments, promote international repu-
tation, facilitate FDI and identify markets for technology
products and services.
For instance, Brazil and China agreed (in 1989) to de-
velop two remote sensing satellites through the China-
Brazil Earth Resources Satellite (CBERS) Programme
(Sausen, 2001). The Programme pools the human and
financial resources of both countries to establish a re-
mote sensing system that is competitive and compatible
with international needs. To boost industrial develop-
ment, a clause was included that obligated the Chinese
to reinvest the equivalent of the money received from
Brazil to purchase Brazilian products. The inclusion of
such clauses stimulates industrial involvement and in-
vestment in R&D.
In the CBERS Programme, China bore 70 percent of the
cost while Brazil covered 30 percent. Brazil is responsible
for the development of the high-resolution cameras while
China is responsible for the application platform. Re-
cently, Brazil and China have agreed to swap fuel tech-
nologies and develop a joint venture for the construction
of aircraft turbofan jets for low-cost and low-maintenance
aircrafts. Such agreements benefit industries that de-
velop, source and supply the technology such as aircraft
manufacturers and suppliers of aircraft components.
Some ISTCAs explicitly mention the involvement of private
firms. For example, the ISTCA between the Republic of
Korea and Russia of 1990 led to the establishment of
joint research centres in Russia for collaboration in vari-
ous areas such as aerospace, materials, energy, and op-
ATDF JOURNAL Volume 7, Issue 3/4 2010
Page 33
Page 33
fer. This is important as many of the areas addressed
do not fall within the mandate of the ministries or
agencies of science and technology only. Cooperation
of other key ministries will be crucial to the success of
any program as highlighted by the case of Rwanda.
While recognizing the efforts underway to assess and
collect information on science, technology and innova-
tion indicators, it may be important to include or de-
velop reliable mechanisms to continuously collect and
maintain data related to knowledge acquisition and
generation. As demonstrated in this paper, data is
missing even in relatively more advanced African coun-
tries. Organizations such as UNECA and AU and its
NEPAD Agency should commit resources to collect
such information to support informed policy making.
Reference
Clark, B. R. (1998) Creating entrepreneurial universi-
ties; organisational pathways of transformation. Per-
gamon (3-8)
Ernst & Young (2005) Beyond Borders: Global Bio-
technology Report 2005
Finch, S. (2005) Royalty rates: Current issues and
trends, Medius Associates (www.medius-
associates.com )
Etzkowitz, H. (2003) ―Research groups as ‗quasi-
firms': The invention of the entrepreneurial univer-
sity", Research Policy, 32.
Kelly, W. (1998) "Are international R&D spillovers
trade related? Analysis of spillovers among randomly
matched trade partners." CERP Working paper No.
2815.
Leydesdorff, L. and Etzkowitz, H. (2001) The Trans-
formation Of University-industry-government Rela-
tions. Electronic Journal of Sociology 5(4)
Navaretti, G.B., Schiff, M. and Soloaga, I. (2003) "The
knowledge-content of machines: North-South trade
and technology diffusion", Flowenla Discussion Paper
2 2 . h t t p : / / w w w . m i g r a t i o n -
research.org/EastWest/dokumente/Flowenla22.pdf
Nelson, R. R., and Phelps, E. (1966) Investment in
humans, technological diffusion, and economic
growth, American Economic Review, 56, 69-75
Nitta, H. (2005) Trends in Japan's international bal-
ance of payments in 2004, JETRO Special reports.
Pacudan, R., (1998), Transport, Energy and the Envi-
ronment in Singapore: An Institutional Perspective.
Cities, 14, 165-168.
Patel, S.J., Roffe, P. and Yusuf, A. (Ed.) (2001)
chines) than knowledge related technology proxies (e.g.
BPT services).
Significant attention has focused on the ability of a
country to acquire, absorb, master and exploit foreign
technologies to become innovators (Trivigno, 2006; Vin-
nova 2005). While these trends may signal an increase
in industrial upgrading, African countries may wish to
invest in generating the scientific and technological
base necessary to identify, acquire, operate, maintain
and modify appropriate foreign technologies to meet
their unique development ambitions (Nelson and
Phelps, 1966).
Based on this understanding, we recommend a few sim-
ple measures that countries could implement to pro-
mote technology transfer and innovation and increase
absorptive capacity:
Governments may wish to promote industry-academia-
government (triple helix) partnerships to identify, ac-
quire, adapt, upgrade and diffuse new and emerging
technologies as well as incubate and nurture start-ups.
Each of these players bring unique advantages that
could reduce costs and risks associated with technology
transfer.
Government contracts should be used to facilitate tech-
nology transfer through requirements that encourage
joint ventures and projects between domestic and for-
eign firms, and between domestic industries and R&D
centres.
Industrial alliances between domestic and foreign firms,
especially those in which the government participates,
invests or acts as guarantor could serve as a driver for
technology transfer, learning and innovation.
International science and technology cooperation agree-
ments (ISTCAs) between African countries and leading
or emerging technology exporters could be developed
with a focus on joint research projects, exchange of ex-
pertise and knowledge, pooling of resources and ex-
change of good practices.
All these measures are not mutually exclusive and thus
can be mixed, recombined and refined to come up with
innovative organizational arrangements to fit national
realities. Furthermore, incentives for technology devel-
opment, transfer and diffusion could also be built into
these models. Other measures such as incubators, sci-
ence parks, and industrial districts could be tailored to
promote these models and vice-versa. The main objec-
tives behind each of these recommendations are to en-
courage private sector involvement in innovation, lever-
age limited human, mobilize financial and institutional
resources through partnerships and cooperation, and
encourage learning through exchange of best practices.
To achieve these goals, countries need to engage their
STI and non-STI development agents and agencies (e.g,
those responsible for promoting investment, small and
medium-sized firms, trade and industry and diplomacy)
to take on board the need to facilitate technology trans-
ATDF JOURNAL Volume 7, Issue 3/4 2010
Page 34
Page 34
region. Thus the data for 2008 is total trade in busi-
ness and professional services while that for 1986
and 1996 are only for unaffiliated firms (inter-firm).
For this reason, the 2008 is only used to determine
the main importers and exporters of these services
from and to the United States but cannot be com-
pared to that of 1986 or 1996 to highlight a trend.
"International technology transfer: the Origins and After-
math of the United Nations negotiations on a Draft
Code of Conduct", Kluwer Law International
Perez, C. and Soete, L. (1988). ―Catching Up in Technol-
ogy: Entry Barriers and Windows of Opportunity,‖ in
Dosi, G. et al. eds., Technical Change and Economic
Theory, Pinter Publishers, London, UK
Sausen, M. T. (2001). The China-Brazil Earth Resources
Satellite (CBERS), ISPRS Society 6, pp. 27-28.
Suarez-Villa, L (2004) Collaboration in biotechnology;
how inter-firm relations strengthen research efforts in
the USA, Int. J. Technology Management, Vol 27, pp
452-464.
Trivigno, V (2006) The transition from copying to innova-
tion: lessons from the Swiss experiences, Asian regional
Conference on IP, Innovation and Health (23-24 August
2006) in Singapore
.
UNCTAD (1985) Draft International Code of Conduct on
the Transfer of Technology, The United Nations Confer-
ence on an International Code of Conduct on Transfer
of technology, United Nations: Geneva and New York
UNCTAD (2003) Africa‘s technology gap: case study of
Kenya, Ghana, Tanzania and Uganda, UNCTAD/ITE/
IPC/Misc.13 (United Nations: New York and Geneva)
Vinnova (2005) Innovation policies in South Korea and
Taiwan, Swedish Agency for Innovation Systems, Swe-
den
Yamaguchi, E (2004) Recent Characteristics of Royalties
and License Fees in Japan‘s Balance of Payments, Bank
of Japan Working Paper Series No.04-E-5
However, it is important to keep in mind that it is a legal
definition with a bias towards commercial contracts.
This definition does not recognize general education
and mobility of workers as technology transfer.
A type of project that is constructed by a developer and
sold or turned over to a buyer in a ready to use condi-
tion.
Royalty and license fees are payments and receipts be-
tween residents and nonresidents for the authorized
use of intangible, nonproduced, nonfinancial assets and
proprietary rights (such as patents, copyrights, trade-
marks, industrial processes, and franchises) and for the
use, through licensing agreements, of produced origi-
nals of prototypes (such as films and manuscripts)
Capital goods refer to the sum of handling, electrical
and non-electrical machinery, telecommunication equip-
ment and metal work machinery or tools (SITC groups
723, 736, 744, 764, 771, 778 and 874).
Until 2006, only data between unaffiliated firms was
disaggregated by country and thus by region. Since
2006, both inter-firm and intra-firm trade in business
and professional services is disaggregated by country or
ATDF JOURNAL Volume 7, Issue 3/4 2010
Page 35
Page 35
1.0 INTRODUCTION
1.1 Problem Discussion
Organisations are increasingly being customer-
centric and are embracing customer-driven initia-
tives that seek to understand, attract, retain and
build intimate long term relationship with profit-
able customers (Kotler, 2006; Gro¨nroos, C
1994; Narver and Slater, 1990). Modern organi-
sations are much interested not just in acquiring
new customers, but more importantly, retaining
existing customers. This is perhaps because it
costs more to attract new customers than to re-
tain existing ones. It is believed that the average
business spends six (6) times more to attract new
customers than to retain old customers. Again it
is more profitable retaining an old customer who
is more likely to re-purchase or re-use a com-
pany‘s products/services and recommend them
to others.
Customer satisfaction (CS) is central to the cus-
tomer-centric paradigm shift, and has gained
much attention from scholars and practitioners as
it has become one of the cardinal means for
achieving quality improvement programmes, and
one of the crucial foci of strategic marketing man-
agement in business organisations that have
long-term perspective for growth.
The state of customer satisfaction with service
quality delivered in Ghana‘s Mobile Telecommuni-
cation Networks (MTNs) is not clear as there is
scanty documentation on the issue. According to
Abstract
This paper, which was a part of a larger study, seeks
to empirically assess and analyse overall customer
satisfaction (CS) with service quality delivered by
mobile telecommunication networks (MTNs) in
Ghana. It involves a cross-sectional survey that
used a structured questionnaire personally adminis-
tered to one thousand (1000) individual subscribers
selected from four mobile telecom networks in
2008. The findings indicate that irrespective of mo-
bile telecom network in Ghana, CS is low; neither
equal to nor better than desire and expectation of
the customers. The National Communication Au-
thority (NCA), the regulator and policy makers are
empirically informed of the general customer dissat-
isfaction with mobile telecom service in Ghana and
should ensure that MTNs in Ghana improve upon
their service quality. Overall CS ratings among cus-
tomers of MTNs in Ghana significantly differ and
that relatively, customers of Companies B, C, and D
rated their satisfaction with service quality higher
than those of Company A. The management of Com-
pany A would need to develop strategies toward to
deal with their customer dissatisfaction. Further re-
search should evaluate customer satisfaction with
specific services across MTNs in Ghana. The paper
contributes to the body of knowledge in the area CS
in the Ghana‘s mobile telecom networks and pro-
vides important managerial implications.
Key words: Customer satisfaction, service quality,
SERVQUAL models, mobile telecommunication net-
works, customer expectation and desire, disconfir-
mation models.
ATDF JOURNAL Volume 7, Issue 3/4 2010
Overall Customer Satisfaction in Ghana’s Mobile
Telecommunication Networks: Implications for
Management and Policy
Simon Gyasi Nimako
Department of Management Education, University of Education, Winneba, Ghana (UEW)
(Email: [email protected] ; [email protected] ,
Foresight Kofi Azumah
Researcher on business and marketing
Email: [email protected]
Francis Donkor
Department of Technology Education, University of Education, Winneba, Ghana
Email: [email protected] ; [email protected]
Adu-Brobbey Veronica
Department of Management Education, University of Education, Winneba, Ghana (UEW)
Page 36
Page 36
tific measure and perspective for describing and evalu-
ating the overall customer satisfaction with the ser-
vices they deliver. To policy makers like government
agencies such as the Ministry of Communications and
the National Communications Authority, the finding
and results of this study will provide invaluable insights
and a more reliable guide to monitoring the impact of
the operations of Ghana‘s MTNs and measuring their
respective policy goals and objectives.
To stakeholders like investors, shareholders, employ-
ees, pressure groups, consumer associations, among
others, the study will provide invaluable information
that will allow them to provide useful suggestions to
the improvement in service delivery of their respective
mobile network operators in Ghana.
2.0 LITERATURE REVIEW
2.1 Brief Historical Overview of Ghana‘s Telecom
Industry
Until 1994, Ghana‘s telecommunication industry was
monopolised by the incumbent-government corpora-
tion, Ghana Post, Telephone and Telegraph (PTT). Be-
tween 1994 and 2000, Ghana moved from a govern-
ment controlled PTT to a competitive telecom environ-
ment that allowed strong internet and mobile telecom
network providers to operate. This was as a result of
the deregulation of Ghana‘s telecommunications sec-
tor in 1994 under the Accelerated Development Pro-
gram (ADP) 1994-2000 (Addy-Nayo, 2001) when the
Government announced a five-year comprehensive
restructuring of the industry. The main policy objectives
of the program were formulated with the assistance of
the World Bank, consultants and other stakeholders,
and aimed at:
Achieve a density between 1.5 and 2.5 lines
per 100 people;
Improve public access in rural and urban areas,
through the provision of payphone facilities
(public and private);
Expand the coverage of mobile services;
Promote Ghanaian ownership and control of
telecommunications companies; and
Retain an overall public regulatory control of
the sector through the creation of a single
agency: the National Communications Authority
(NCA) (Addy-Nayo, 2001, p.7).
The ADP adopted the following strategies to achieve
the above-stated policy objectives:
The authorisation of two national network op-
erators: Ghana Telecom and a new independ-
ent operator;
Support of new financing: arrangements which
promote investment in new telecommunica-
tions infrastructure throughout the country; and
a discussion paper on telecom developments and investments in Ghana (Frempong & Henten, February
2004, p.3), the authors noted that ―the goals set by gov-
ernment have only partly been met – especially with re-
spect to the development in rural areas – and the quality
of service is still low and has even deteriorated on some
indicators. There is, therefore, a widespread dissatisfac-
tion with the general telecom development in Ghana
among users as well as policy decision makers and ad-
ministrators.‖ In recent times, there has been more cus-
tomer complaint about poor service quality which has
been reported by the National Communications Authority
(NCA) (BIZ Community.com, October 19, 2007).
Since the past decade, the industry has witnessed a tre-
mendous increase in subscriber growth rate for all the
mobile telecom operators (ITU, 2008). Though mobile
subscribers have increased in Ghana MTNs, it does not
provide justification that customers are satisfied with the
service quality delivered by mobile telecom networks in
Ghana. No study so far, to the best of the researchers‘
knowledge has been conducted to examine the CS in
Ghana‘s MTNs. So there is the need to empirically assess
and analyse the phenomenon for managerial implica-
tions.
1.2 Statement of the problem and Purpose of the
study
In view of the above, the main problem that is addressed
in this paper which was part of a larger study is: Are cus-
tomers satisfied with the service quality delivered by Mo-
bile Telecom Networks (MTNs) in Ghana? The focus of
this paper, therefore, is to assess and analyse overall
customer satisfaction with service delivery in MTNs within
Ghana.
1.3 Research questions
This sub-study was guided by the following specific re-
search questions:
How can overall customer satisfaction (CS) with
service quality be described in Ghana‘s MTNs with
and without respect to customers‘ mobile telecom
network?
Do the ratings of customer satisfaction among
MTNs in Ghana differ?
Do the ratings of male and female customers re-
garding their satisfaction with service delivery of
MTNs in Ghana‘s differ?
1.4 Significance of the study
The study is immensely significant in diverse ways to
business/marketing practitioners, policy makers and
stakeholders. To the management of Ghana‘s mobile
telecom networks, the findings and results that will be
reported in this study will provide a more reliable scien-
ATDF JOURNAL Volume 7, Issue 3/4 2010
Page 37
Page 37
masi and Obuasi, with ongoing developments in other
regional capitals. The company operated as areeba
and in 2006 it was taken over by Mobile Telecommuni-
cation Network Group (MTN) and now its name is MTN
Ghana; it has expanded greatly its network coverage
countrywide (www.mtn.com.gh).
2.1.4 Kasapa Telecom Limited
Kasapa Telecom Limited - a subsidiary of Hutchison
Whampoa Group –was established in 1998. Hutchison
acquired 80% of Celltel Limited in 1998. and in 2003,
changed the brand to Kasapa and the company name
to Kasapa Telecom Limited. In January 2005, Kasapa
became a wholly-owned subsidiary of Hutchison Tele-
com. Kasapa means ‗good talk‘ in Twi, the most widely-
spoken local language in Ghana (Ghana business in-
dex, 2008).
2.2 Concept of Customer Satisfaction
Customer satisfaction (CS) is a term that has received
considerable attention and interest among scholars
and practitioners perhaps because of its importance
as a key element of business strategy, and goal for all
business activities especially in today‘s competitive
market (Anderson, Fornell, and Lehmann, 1994;
Gro¨nroos, 1984; Lovelock & Wirtz, 2007). The con-
cept has been variously defined by many authors.
‗‗Satisfaction is a person‘s feeling of pleasure or disap-
pointment resulting from comparing a product‘s per-
formance (outcome) in relation to his or her expecta-
tion‘‘ (Kotler & Keller, 2006 p. 144). Satisfaction is a
‗‗psychological concept that involves the feeling of well-
being and pleasure that results from obtaining what
one hopes for and expects from an appealing product
and/or service‘‘ (WTO, 1985). CS is ―as an attitude-
like judgement following a purchase act or a series of
consumer product interactions‖ Youjae Yi (1990 cited
in Lovelock & Wirtz 2007). CS is ‗‗a consumer‘s post-
purchase evaluation and affective response to the
overall product or service experience‘‘ (Oliver, 1992).
‗‗Satisfaction is merely the result of things not going
wrong; satisfying the needs and desires of consum-
ers.‘‘(Besterfield 1994); CS is ‗‗an experience-based
assessment made by the customer of how far his own
expectations about the individual characteristics or the
overall functionality of the services obtained from the
provider have been fulfilled‘‘ (Bruhn, 2003).
Admittedly, satisfaction is more complex to define to
accurately fit every context and measure. In the words
of Oliver (1997), ―everyone knows what [satisfaction]
is until asked to give a definition. Then it seems, no-
body knows‖. From marketing perspectives, customer
satisfaction has multi-dimensionality. The object of
customer satisfaction may be varied and can be re-
lated to different dimensions of multiple experiences
with product/service provider (Surenshchandar et al.
2002 cited in Satari, 2007). While most definitions
Privatisation of Ghana Telecom through the sale
of a strategic stake to an international operating
company combined with measures to broaden
share ownership in Ghana (Addy-Nayo, 2001,
p.7).
As of the time of the study (2008) there were four cellu-
lar (mobile) phone networks in Ghana, namely: Millicom
Ghana Ltd, Onetouch GSM Services – Ghana, MTN
Ghana – Scancom Ghana Ltd and Kasapa Telecom Lim-
ited.
2.1 Millicom Ghana Ltd
Millicom Ghana Limited, operators of Tigo cellular phone
network, is a subsidiary of Millicom International Cellular
S.A. (―MIC‖) UK/Luxembourg, a leading global operator
of cellular telephony services with several investments
across the world. The company started its operations in
Ghana in 1991 and was the first cellular network opera-
tor in the country. Millicom Ghana uses the ETAC Sys-
tem, and it had over 22 000 subscribers in 1998 with a
market share of above 70 per cent of the mobile mar-
ket. The company expanded and in 2002 Millicom
Ghana introduced its GSM service under the brand
name MOBITEL/Buzz GSM. Buzz GSM with its trendy
lifestyle image offered very exciting services to its nu-
merous clientele. Mobitel has, over the years, been able
to maintain a fast rate of subscriber and revenue growth
and a very high quality of service, acclaimed by most
users as being second to none. In 2006, Tigo was
launched in Ghana to replace the old national brand
MOBITEL with a new international brand. Currently Tigo
network coverage reaches all the ten regions in Ghana
and it is fast expanding to rural areas
(www.tigo.com.gh).
2.1.2 One touch GSM Services - Ghana
Onetouch is the cellular arm of Ghana Telecom. It
started its operations in 2000 providing nation-wide
cellular services. Ghana Telecom (GT) is the incumbent
provider of telecommunication services in Ghana. As
part of the ADP (1994-2000) reform program, Ghana
Telecom was incorporated on June 16, 1995 as a suc-
cessor to the telecommunications division of Ghana
Posts and Telecommunications Corporation (GPTC). On
20th February 1997, Ghana Telecom was officially pri-
vatized to Telecom Malaysia Berhard with full manage-
ment control. Subsequently the government handed
operations of the company to Telenor Management Part-
ner (TMP) till 2007. On July 3, 2008, the Government of
Ghana announced the sale of 70% share to Vodafone
for the purpose of making the company more profitable
(www.ghanatelecom.com.gh).
2.1.3 MTN Ghana – Scancom Ghana Ltd
Scancom Ghana Ltd started operating in October 1996
using GSM 900 technology as Spacefone, with 15 sites
and equipment from Ericsson. Initially, the network pro-
vided new services and coverage in Greater Accra, Ku-
ATDF JOURNAL Volume 7, Issue 3/4 2010
Page 38
Page 38
ries that postulate that people are driven by the desire
to satisfy their needs (Maslow, 1954) or that their be-
haviour is directed at the achievement of relevant
goals (Vroom, 1964). In this way satisfaction is per-
ceived as a goal to be achieved and can be described
as consumer fulfilment response (Rust & Oliver, 1994).
In the context of mobile telecom services in Ghana, we
believe that customers, through the promotional activi-
ties of the MTNs in Ghana, have developed certain
expectations and set of desired services of the various
service providers. These are important in determining
their satisfaction of the services received/used. There-
fore our conceptual framework treats satisfaction as a
process not just an outcome that customers strive to
achieve.
Another controversial issue in customer satisfaction
literature is whether satisfaction is cognitive or affec-
tive. Although most scholars, notably proponents of
disconfirmation theories, view satisfaction as a proc-
ess, but the nature of satisfaction process remains
unclear. While some authors maintain that satisfaction
is a cognitive assessment involving a comparison of
product/service offerings from a provider against ex-
pectations, other scholars opine that the feeling of sat-
isfaction represent an emotional or affective state of
mind that is formed through the process of service
delivery where customers encounter service experi-
ences that affect their emotions. More recent re-
searches have found that satisfaction is both cognitive
and affective (Edvardsson et al., 2005; Gro¨nroos,
2001; Martin, et al., 2008; Oliver, 1993a; Wong,
2004). This view holds that customers do not only con-
sume an offering for which they cognitively evaluate,
but their involvement in the service production and
delivery process allows them to emotionally evaluate
the service quality. They argue that ―. . . satisfaction is
naturally tied to cognitive judgments and to affective
reactions elicited in consumption‖ (Mano & Oliver,
1993, p. 451). In this study, customer satisfaction is
conceptualises as cognitive and affective.
An equally debatable element in clarifying customer
satisfaction concept is whether it is subjective or objec-
tive in nature. Pizam A. & Ellis T. (1999) noted that ―a
minority of researchers perceive the satisfaction proc-
ess to be subjective in expectations but objective in the
perceptions of the product attributes, or outcome.‖ In
this light, Klaus (1985, p. 21) defines satisfaction as
―the customer's subjective evaluation of a consump-
tion experience, based on some relationship between
the customer's perceptions and objective attributes of
the product''. Expectation and perceived performance
are constructs that are in themselves subject to exter-
nal influences to some extent (Maister, 1985). Others
point out that both what is perceived (outcome) and
what is expected are subjective and psychological phe-
nomena - not reality.
The importance of the subjective nature of the process
cannot be overlooked. The reason is that both expecta-
relate customer satisfaction to quality of a product or
service offering (Kotler & Keller, 2006; www.theacsu.org),
satisfaction can as well be related to other non-quality
dimensions (Singh 1991; Garland and Westbrook. 1989).
It may be related to an on-going business relationship or
with price-performance, satisfaction with the time or ser-
vice delivery or the service experience, service context
and satisfaction with entire reputation and outlook of an
organisation. Even with the product or service quality
there can be several dimensions (Gro¨nroos, 2000,
2001; Bo Edvardsson 2005), such as what product of-
fers, product or service reliability, timeliness, friendliness
of the service providers, and the like. Therefore depend-
ing on the purpose one wants to achieve, one can relate
satisfaction to any object of interest. In this study cus-
tomer satisfaction is defined in relation to only dimen-
sions connected to the service quality delivered by MTNs.
Satisfaction can be related to attribute-specific and over-
all performance. It is attribute-specific where it relates to
a specific product or service (Cronin & Taylor, 1992). For
example, with mobile telecommunication, satisfaction
can be related to a specific attribute such as: Multimedia
Messaging Service, Mobile TV or Mobile Internet Service
or satisfaction with the voice quality, picture quality,
speed, and the like. On the other hand, customer satis-
faction can be related to the overall performance of a
product/service or the overall performance of an organi-
sation‘s products/services (Cronin & Taylor, 1992). The
present study relates customer satisfaction to the overall
performance of services delivered by mobile telecom net-
works in Ghana in order to generalise the findings for
managerial implications.
As to whether customer satisfaction is an outcome or a
process, many early definitions conceptualised satisfac-
tion as a process which is currently the dominant view
held by most scholars (Oliver, 1980; Parasuraman et al.,
1988). The process perspective presupposes that cus-
tomer satisfaction is a feeling of satisfaction that results
from the process of comparing perceived performance
and one or more predictive standards, such as expecta-
tions or desires (Khalifa & Liu, 2002).
This perspective is grounded in the expectancy disconfir-
mation theory proposed by Richard Oliver (Oliver, 1980).
The customer is satisfied if the performance of prod-
uct/service is equal to his/her expectations (positive dis-
confirmation) and he/she is dissatisfied if the prod-
uct/service performance is perceived to be below his/her
expectation (negative disconfirmation). If expectation
exceeds perceived performance, the customer is highly
satisfied. By taking satisfaction as a process these defini-
tions do not focus on satisfaction itself but things that
cause satisfaction, the antecedents to satisfaction, which
occur primarily during the service delivery process (Vavra,
1997).
More recent studies view satisfaction as an outcome or
end result during the process of the consumption of a
service; it is viewed as a post-purchase experience
(Vavra, 1997). This view has its roots in motivation theo-
ATDF JOURNAL Volume 7, Issue 3/4 2010
Page 39
Page 39
and female customers.
3.0 OPERATIONALISATION
3.1 Measurement of Customer Satisfaction
Oh and Parks (1997) identified nine methods for meas-
uring CS, which are: expectancy disconfirmation, assimi-
lation or cognitive dissonance, contrast, assimilation-
contrast, equity, attribution, comparison-level, general-
ized negativity and value-precept. Pizam & Ellis (1999,
p.327) in their work comment that ―while most of these
are based on cognitive psychology, recently numerous
researches have attempted to apply CS theories devel-
oped by behaviourist in several areas. Out of the many
theories the most widely used is the disconfirmation
theories and customer satisfaction index.‖
To ensure the consistency of the results, three models of
measuring CS were selected: One satisfaction index,
specifically the Minnesota Customer Satisfaction Index
(MnCSI), satisfaction measure, and disconfirmation
measures. Each model is justified and operationalised.
3.1.1 MnCSI
Of the many satisfaction indices such as The Swedish
Customer Satisfaction Barometer, The American Cus-
tomer Satisfaction Index, The European Customer Satis-
faction Index, The Minnesota Customer Satisfaction In-
dex (MnCSI) was chosen because it is very stable using
three questions that ask about the same idea--total sat-
isfaction; it is also easy to apply, and it is relatively flexi-
ble and suitable for any reasonable number of re-
sponses deemed appropriate by a researcher. Interest-
ingly the model of MnCSI succinctly captures the tenet
variables of disconfirmation models: desire and expecta-
tion disconfirmations. This index was modified since
customers were given five (5) responses to the three
questions to reflect the value or weights of the five-likert
scale that were used as shown below:
The following procedure for calculating the MnCSI with
respective to and irrespective of mobile telecom network
is outlined in Appendix C.
3.1.2 Disconfirmation Models (DMs)
tions and perceptions are psychological phenomena
and are susceptible to external influences and manipu-
lation. To say that customers‘ evaluation of a product or
service is objective implies that the evaluation is not
biased in any way. This is not realistic because it is a
common knowledge that customers are different and
the way they perceive a service like MMS, SMS, and
Voice mail of a mobile network may vary considerably.
However, we believe that each customer can be objec-
tive in their own subjective, cognitive and affective
states. Therefore in this study, customer satisfaction in
itself is defined as a subjective evaluation, but its meas-
urement is approached objectively; thus, customers are
supposed to be objective - expressing whatever subjec-
tive response they have about a product objectively
without bias (subjective objectivity).
Satisfaction may be viewed as Transactional or Cumula-
tive: On the one hand from a transactional-specific per-
spective, CS is based on a one time, specific post-
purchase evaluative judgement of a service encounter
(Hunt, 1977; Oliver, 1977, 1980, 1993 cited in Yonggui
Wang & Hing-Po Lo 2002). On the other hand, in the
cumulative CS perspective, CS is conceptualised as an
overall customer evaluation of a product or service
based on purchase and consumption experiences over
a time period (Fornell, 1992; Johnson and Fornell 1991;
Anderson et al., 1994a, b; cited in Yonggui Wang &
Hing-Po Lo 2002).
In terms of the diagnostic and predictive value of cus-
tomer satisfaction measurement, cumulative satisfac-
tion is more useful and reliable than transaction-specific
in that it is based on series of purchase and consump-
tion occasions rather than just one occasion of transac-
tion. Customer satisfaction, in this study, is measured
from the last twelve months. Therefore, the conceptual
framework of this study treats CS as cumulative. Conse-
quently, the operational definition of CS in this study is,
“The process of customer overall subjective evaluation
of the product/service quality against his/her expecta-
tion or desires over a time period.”
2.3 Research Hypothesis
This sub-study was guided by this hypothesise:
H1: Overall Customer Satisfaction differs among
MTNs in Ghana.
H2: Overall satisfaction ratings differ between male
ATDF JOURNAL Volume 7, Issue 3/4 2010
Source: DEED (Minnesota)
http://www.deed.state.mn.us/customersurvey/csi.htm
MnCSI (modified)
Page 40
Page 40
To what extent have your mobile network ser-
vices met your expectations?
3.1.3 Satisfaction Model
The third measure used was the satisfaction model,
which measures CS using scales such as from very
satisfied to very dissatisfied (Danaher and Haddrell,
1996). Thus, participants responded to this question
item:
Overall, tell how satisfied you are with the service deliv-
ery of your network.
3.2 Conceptualisation
A conceptual model (Figure 3.2) that provides the over-
all framework for this paper is displayed below, show-
ing the four measures used in measuring CS.
4.0 METHODOLOGY
4.1 Research Design, Population and Sampling
The study employed a cross-sectional survey which
was appropriate for seeking the opinion of the target
population about a phenomenon, with a researcher-
designed questionnaire for data collection to answer
the research questions (Cooper and Schindler, 2006).
The target population comprised 7.6 million mobile
telecom individual subscribers as of December 2007
(ITU, 2007) from four mobile telecom networks in
Ghana; namely: Scancom Ghana Limited operators of
MTN, Millicom Ghana Limited operators of Tigo, Ghana
Telecom operators of Onetouch, and Kasapa telecom.
The study sample consisted of 1000 customers drawn
from three selected cities in three zonal divisions in
Ghana, namely: Tamale for the Northern Zone, Kumasi
for the Middle Zone and Accra for Southern Zone. For
confidentiality, each of the four companies used in this
study is represented by a letter (A, B, C and D).
Oliver (1980) was the first to propose and developed the
expectancy disconfirmation theory. DMs are models that
suggest that customer satisfaction/dissatisfaction is the
disparity that exist between the performance of a prod-
uct/service and some cognitive or emotional standards of
the consumer, such as desire and expectation of custom-
ers. If perceived performance exceeds or falls short of
expectation or desire, there is positive disconfirmation or
negative disconfirmation and the customer is satisfied or
dissatisfied respectively. Desire disconfirmations (DD)
and Expectation Disconfirmation (ED) are both empirically
validated to significantly explain customer satisfaction
(Khalifa and Liu, 2002). DMs have been tested and con-
firmed in several studies (Oliver & DeSarbo, 1988; Satari,
2007). Devlin, Dong and Brown (1993) and Rust & Oliver
(1994) have recommended the use of disconfirmation
scales instead of the others for three reasons: it highly
correlates with customer retention, it simply captures in
one disconfirmation-based single question, Parasuraman
et al.‘s (1988) two-stage SERVQUAL measurement, finally
it is better because a customer rating service quality
highly, for example as good or excellent, may not perceive
it as ‗better than expected‘.‖ The results of Danaher and
Haddrell (1996), who empirically compared several
scales simultaneously on the same respondents, confirm
the conclusion of Devlin et al. (1993) and Rust & Oliver
(1994) that the disconfirmation scale is a preferred
method in measuring customer satisfaction. They further
agree, in particular, with Devlin et al. (1993) that a five-
point disconfirmation scale would be an improvement
over the three-point scale if high predictive validity is es-
sential, but its use could pose challenges in telephone
surveys where respondents might have to be continually
reminded of five rather than three scale points. Since
personal contact was to be used and high predictive va-
lidity was a major concern, we appropriately adopted five-
point disconfirmation scales: from much better expected
or desired to much worse than expected or desired. Thus,
respondents responded to these question items:
How well did the services you received from your
network compare with the ideal/desired set of
services?
ATDF JOURNAL Volume 7, Issue 3/4 2010
Customer
Satisfaction
MnCSI
Expectation Disconfirmation Measure
Desire Disconfirmation measure
Overall Satisfaction measure
Fig. 3.2 A conceptual model for measuring CS
Page 41
Page 41
administered to respondents in three major cities in
three zones in the country, namely: the northern
Ghana zone – Tamale, Middle zone - Kumasi, and
Southern Ghana - Accra.
4.3 Response Rate
Out of the one thousand questionnaires that were ad-
ministered, nine hundred and thirty-seven (937) consti-
tuting 93.7% response rate were collected. Out of this,
there were 601 customers of Company A, 140 custom-
ers of Company B, 40 of Company C and 156 custom-
ers of Company D. These numbers were adequate
since a minimum sample of 30 is considered a large
sample size for statistical analysis (Cooper and
Schindler 2006, Saunders et al 2007).
4.4 Hypothesis Testing Tools
First, a One-Way ANOVA technique was used to test
Hypothesis 1 was adopted to find out whether CS dif-
fers among the customers of the four mobile telecom
networks in Ghana. Second, Scheffe‘s statistic (and
post hoc test) which assumes unequal sample size,
equal variances for complex comparisons of means
was used. Third the Means Plots were used to ascer-
tain the structure of difference of means.
A One Sample t-test was used to test hypothesis 2 to
ascertain whether there is any statistically significance
difference in the mean satisfaction ratings of male and
female respondents.
.
4.5 Item Reliability
All the question items for satisfaction and disconfirma-
tion scales yielded a Cronbach alpha reliability of
0.793 as in Table 4.5.
From the Table 4.5, the mean of OS measure was 3.24
A sample size of one thousand (1000) respondents was
selected based on researchers‘ judgment because of cost
and time constraints. In selecting the sample of one thou-
sand (1000) respondents, a proportionate stratified ran-
dom sampling was used. This technique was chosen be-
cause the population consisted of sub-groups of four mo-
bile networks in Ghana. First, each of the four (4) mobile
telecom networks within the target population was identi-
fied as a stratum. Secondly, the total sample was divided
for each stratum according to the percentage of each
stratum of mobile network in the entire industry guided by
the available statistics of 2007 subscribers from each
network (ITU, 2007) as shown in Table 1. Finally, a sim-
ple random method was used to select respondents for
each of the mobile networks. Conscious effort was made
to select only literate subscribers as respondents be-
cause of the use of self-administered questionnaire as
the data collection instrument.
4.2 Data Collection Procedures
A self-administered, structured questionnaire (Appendix
A) was used to collect data from respondents as recom-
mended for a large survey (Saunders et al 2000; Cooper
and Schindler 2006; Malhotra N. K. & Birks D. F. 2007).
The questions sought respondents‘ feelings about overall
customer satisfactions. The questionnaire had five (5)
items related to respondents‘ identification data, and
three (3) related to CS.
The questionnaire was pre-tested to a sample of twenty
(20) subscribers selected by simple random method. This
small size was guided by the suggestion by Fink (2003b
in Saunders et al 2007) that the minimum of ten (10)
members for pre-testing is adequate. Each of them was
told the purpose of the questionnaire and assured of ano-
nymity and confidentiality of responses before they were
given the questionnaire to respond to. Finally, after ad-
justments were made to get more effective instruments,
the questionnaire was administered to the target popula-
tion through personal contact by researchers. Again, re-
spondents were first informed of the purpose, assured of
anonymity and confidentiality of responses. They were
then given the questionnaire to fill; we left it to them, af-
ter which they submitted the questionnaire to us. This
was between the periods of 10th June 2008 and 12th
July 2008. In order to get a more representative sample
of the entire target population, the questionnaire was
ATDF JOURNAL Volume 7, Issue 3/4 2010
Stratum of Mobile
Network
Estimated Per-
centage of Total
subscribers
Expected Sample
Size for Strata
Company A 60.5 605
Company B 19.5 195
Company C 4.0 40
Company D 16.0 160
TOTAL 100 1000
Table 4.1 Stratified Random Sampling by Mobile Network
Source: Fieldwork
Item Statistics Reliability Statistics
Mean Std. Devia-
tion
Cronbach's
Alpha
N of
Items
DD 2.7150 .89688
0.793 3
ED 2.8431 .91750
OS
3.2433 1.05638
Table 4.5 Reliability Statistics and Item Statistics
(n=937)
Page 42
Page 42
virtually no monthly income indicating that most of
them earned considerably lower incomes. All respon-
dents were educated with 75% of them having tertiary
level of education, while 25% had Senior High School
(SHS) and post-SHS education levels of education.
5.2 Results of Minnesota Customer Satisfaction
Index (MnCSI)
5.2.1 With respective to and Irrespective of Mobile
Network
The formulae and description for the MnCSI (Appendix
B) were used to arrive at a satisfaction index for each
and all mobile networks together. The results are pre-
sented in Table 5.2.1.
Table 5.2.1 indicates that the calculated MnCSI for
Companies A, B, C, and D were 44.3, 56.6, 58.1 and
53.7 respectively. The MnCSI indicated a fair index for
Companies B, C, and D and a low index for Company A.
The index for the entire sampled population irrespec-
tive of mobile network is 48.3 which is low.
5.3 Results of disconfirmation measures and over-
all customer satisfaction measure
Customers were asked to rate their satisfaction with
service quality of service providers (MTNs) using desire
disconfirmation (DD), expectation Disconfirmation (ED)
measures and overall customer satisfaction (OCS)
measures. The ED measure had a five-point likert
scale: ―much worse than expected‖, ―worse than ex-
pected‖, ―equal to expectation‖, better than expected
and ―much better than expected‖. The scale for DD
measure was also five-point likert scale from ―much
worse than desired‖ to ―much better than desired‖.
OCS measure used a five-point likert scale: ―very dis-
satisfied‖, ―dissatisfied‖, ―neutral‖, ―satisfied‖, and
―very satisfied‖.
5.3.1 Descriptive statistics: Irrespective of mobile
telecom network
The Table 5.3.1a shows a descriptive statistics of the
while DD and ED were 2.71 and 2.84 respectively. The
Standard deviations were DD (.89), ED (.91) and OS
(1.05). 0.793 was a high composite Cronbach‘ alpha reli-
ability score for the three items: ED, DD, and OS.
5.0 ANALYSIS OF RESULTS
5.1 Respondents‘ Characteristics
The characteristics of the respondents are presented in
Table 1. In terms of gender, 55% of the respondents
were males and 45% were females. 50% of the respon-
dents were within the ages of 20-39 years and 13% were
between 40 and 49 years, implying that majority of them
were in the economically active population. Occupation-
wise, most of them (63%) were students, 24% were pub-
lic servants, 4% were business persons, while 9% belong
to other professions. In terms of income, 98% of respon-
dents earned monthly income below GH¢300 of which
31% earned between GH¢100 to ¢200 while 30% earned
ATDF JOURNAL Volume 7, Issue 3/4 2010
Frequency
%
Std Dev
Gender Male 520 55.5
female 417
45.5
Occupation Civil/Public 222 23.7
Student 592 63.2
Business
Person 35 3.7
Other 88 9.4
Age <20 16 1.7
20-29 470 50.2
30-39 316 33.7
26 0.78583
40-49 121 12.9
≥50 14 1.5
Income
<100 93 9.9
101-200 277 29.6
201-300 195 20.8 201 1.40833
>300 79 8.4
Non-income
Earner 293 31.3
Education
Level SHS 74 7.9
Post SHS 162 17.3
Tertiary 701 74.8
Table 5.1 Descriptives of Respondents‘ Characteristics
(n=937) Source: Fieldwork
Mobile Network MnCSI Interpretation
Company A 44.3 Low
Company B 56.6 Fair
Company C 58.1 Fair
Company D 53.7 Fair
Irrespective of
Mobile Network
48.3 Low
Table 5.2.1 Summary of MnCSI for total sample and
within groups
Page 43
Page 43
very dissatisfied.
5.3.2. Descriptive Statistics: With respect to mobile
telecom network
Details of frequencies with respect to mobile network
are shown in Appendix D. The mean satisfaction ratings
using different satisfaction measures for each company
are presented in Tables 5.3.2a
Figure 5.3.2a indicates the mean satisfaction rating of
customers for Company A using the three measures.
Mean overall satisfaction was 3.04 while the mean ex-
pectation and desire disconfirmations were 2.69 and
2.58 respectively. For Company B, the mean satisfaction
rating by customers using OS measure indicates that
overall mean satisfaction is 3.66 which is a little lower
than 4 for satisfied. The mean rating using expectation
and desire disconfirmation measures yielded scores of
3.2 and 2.94 respectively, indicating that satisfaction is
equal to expectation but less than desire of customers.
For Company C, the mean satisfaction ratings by cus-
tomers using OS measure indicate that overall mean
satisfaction was 3.58, indicating that satisfaction is con-
siderably low close to 4, while expectation and desire
disconfirmation measures yielded mean scores of 3.3
and 3.1 respectively, indicating that satisfaction of ser-
vice quality is equal to expectation and desire of the re-
spondents.
For Company D, the mean satisfaction rating by custom-
ers using the OS measure indicates that overall mean
satisfaction is 3.54, which is little below 4 indicating that
satisfaction is low or somewhat satisfied. The mean rat-
three measures: ED, DD and OCS.
Table 5.3.1a indicates that the mean rating of customer
satisfaction using DD measure is 2.7150 with standard
deviation of .89688 while using ED measure, the mean is
2.8431 with standard deviation of 0.91750. These mean
were below the three (3) – equal to expectation or desire.
Using OS measure, the mean rating was 3.2433 with
standard deviation of 1.05638, being the highest. Statis-
tically, the mean of 3.2433 is a low value, thus a little
above neutral (3). Therefore, satisfaction can be de-
scribed as very low.
A summary of the results of customer satisfaction rating
irrespective of mobile network is presented in Figure
5.3.1b below.
It indicates that using DD measure, while 47% of the
respondents rated their satisfaction as equal to expecta-
tion, 7.6% and 31.5% representing 39.1% rated their
satisfaction as much worse than expected and worse
than expected respectively, and 13.9 (9.6% and 4.3%) of
respondents rated their satisfaction as better and much
better than expected. Then using ED while 45.5% of the
respondents rated their satisfaction as equal to desired,
5% and 30.4% representing 35.4% rated their satisfac-
tion as much worse than desired and worse than desired
respectively, and 19.1 (13.4% and 5.7%) of respondents
rated their satisfaction as better and much better than
desired. Finally, using OS measure, 50.6% indicated that
overall they were satisfied or very satisfied while 49.4%
maintained that they were either neutral, dissatisfied or
ATDF JOURNAL Volume 7, Issue 3/4 2010
Mean Std. Dev. Variance
Statistic Std. Error Statistic Statistic
DD 2.7150 .02930 .89688 .804
ED
2.8431 .02997 .91750 .842
OCS
3.2433 .03451 1.05638 1.116
Table 5.3.1a Descriptive Statistics of Satisfaction Measures
Percentage of Ratings
Measure Much Worse than ex-
pected /Very Dissatis-
fied
Worse than ex-
pected / Dissatis-
fied
Equal to expec-
tation/ neutral
Better than ex-
pected or Satisfied
much better/Very
satisfied
ED 5% 30.4% 45.5% 13.4% 5.7%
DD 7.% 31.5% 47% 9.6% 4.3%
OS 7.2% 18.6% 23.6% 44.1% 6.5%
Figure 5.3.1b Satisfaction Ratings Irrespective of Network
measure Mean ratings
Company OS meas-
ure
ED meas-
ure
DD measure
A 2.04 2.69 2.58
B 3.66 3.2 2.94
C 3.58 3.3 3.1
D 3.54 2.98 2.92
Figure 5.3.2a: Mean Satisfaction Rating for Companies A,
B, C, D
Page 44
Page 44
Levene statistic, which is very robust, indicated a ρ-
value (0.172>0.05) confirming the equality of means.
The ANOVA test at 0.05 showed the following summary
in Table 5.4.4a
Table 5.4a indicates that the p-value (0.00<0.05) pro-
viding strong support for rejecting the null hypothesis
that the means are equal. Therefore, we can safely
conclude with 95% confidence level that overall satis-
faction or dissatisfaction differ among MTNs in Ghana.
We explored to learn more about the structure and pair
-wise multiple comparisons of the differences. That
was done by first using the mean plot (Figure 5.4b) to
help identify the structure of the difference.
The result in Figure 5.4b indicates that relatively cus-
tomers of Companies B, C, and D rated their satisfac-
tion with service quality higher than those of Company
A. This is confirmed by a further post hoc test using
Scheffe‘s T2 (Table 5.4b).
Table 5.4b indicates a pair-wise comparison of satis-
faction/dissatisfaction among customers of the four
mobile networks in Ghana. It reveals that the p-values
(0.000, 0.019, and 0.000) are all less than the signifi-
cant level (0.05). This implies that the satisfaction or
dissatisfaction of customers of Company A is signifi-
cantly different from all the other companies.
5.5 Satisfaction among Male and Female Gender
Though the results showed a fairly balanced gender
distribution, 55% males and 45% females, a One-
Sample T-Test (Table 5.5) was used to test whether the
means of satisfaction ratings among female and male
gender are equal. The results reveal that customer
satisfaction significantly differs among male and fe-
male customers in Ghana‘s MTNs. The mean plots
(Figure 5.5) further reveal that the male customers
rated their satisfaction higher than their female coun-
terparts implying that significantly more male custom-
ers are more satisfied than female customers regard-
ing the service delivery of MTNs in Ghana.
Figure 5.5 indicates that the males rated their satisfac-
tion higher than the female customers in Ghana‘s
MTNs.
ing using ED and DD measures yielded scores of 2.98
and 2.92 respectively, indicating that satisfaction is
somewhat equal to expectation and desire of customers.
5.4 Hypothesis 1: Comparing satisfaction among
mobile networks
Hypothesis 1 tests whether the customer satisfaction/
dissatisfaction differs among network companies:
H1: Overall customer satisfaction (OCS) differs
among MTNs in Ghana.
A One-Way ANOVA was used to test the equality of the
group‘s mean using Scheffe‘s statistic which assumes
unequal sample size and equal variances for complex
comparisons. Before performing a One-Way ANOVA test
it was important, first, to ensure that the assumption of
equality of groups‘ variances was established. The
ATDF JOURNAL Volume 7, Issue 3/4 2010
CS Meas-
ures
Expectation Disconfirmation (ED) Desire Disconfirmation (DD) Overall Satisfaction Measure
Company
No.
p-value
No.
p-value
No.
p-value
A B C D
601 140 40 156
2.6938 3.2000 3.3000 2.9808
0.00*
601 140 40 156
2.5824 2.9429 3.1000 2.9231
0.000*
601 140 40 156
3.0466 3.6571 3.5750 3.5449
0.000*
Table 5.4a ANOVA test for Overall Satisfaction among Mobile Networks
* significant at 0.05, N=937
Figure 5.4b Mean Plot of Mean Difference for OCS
Page 45
Page 45
ATDF JOURNAL Volume 7, Issue 3/4 2010
Scheffe’s Multiple Comparison
(I) Network (J) Network Mean Difference (I-J) Std. Error Sig.
95% Confidence Interval
Lower Bound Upper Bound
A B -.61055*
.09612 .000 -.8797 -.3414
C -.52841*
.16724 .019 -.9968 -.0600
D -.49828*
.09203 .000 -.7560 -.2405
B A
.61055* .09612 .000 .3414 .8797
C .08214 .18362 .978 -.4321 .5964
D .11227 .11923 .829 -.2217 .4462
C A .52841*
.16724 .019 .0600 .9968
B -.08214 .18362 .978 -.5964 .4321
D .03013 .18152 .999 -.4782 .5385
D A .49828*
.09203 .000 .2405 .7560
B -.11227 .11923 .829 -.4462 .2217
C -.03013 .18152 .999 -.5385 .4782
Table 5.4b Comparison of Mean Difference in Satisfaction among Networks
* The mean difference is significant at 0.05
GENDER
N
Mean
Std. Deviation
Std. Error
Mean
T-test for Equality of
Means
Sig. (2-tailed) (p-value)
t df
OVERALL
CUSTOMER
SATISFACTION
Male 520 3.3058 .98972 .04340 2.024 935
0.043*
Female 417 3.1655 1.13042 .05536 2.024 935
Table 5.5 Chi-square test and ANOVA test – Gender*Overall customer satisfaction
* The mean difference is significant at 0.05
Page 46
Page 46
required mean of 3. Third, overall satisfaction measure
(Table 5.3.1b) showed that 51.2% of customers indi-
cated that they were satisfied or very satisfied, while
25.8% of respondents indicated that they were not
satisfied or very dissatisfied, with a mean rating of
3.24 which is considerably low.
6.1.2 With respect to mobile network
First of all, the MnCSI (Table 5.2.1) indicates an index
of 44.3, 56.6, 58.1 and 53.7 for Companies A, B, C,
and D respectively. This implies that CS with service
quality is considerably low for Company A, but is fair for
Companies B, C, and D. Again, using disconfirmation
and overall satisfaction measures for each network,
Figure 5.2.3a, b, c and d showed means just around
the required mean of 3.
6.2. Research Question two:
Does customer satisfaction differ among the MTNs in
Ghana?
The comparison of mean satisfaction ratings among
6.0 Discussion and implications
The findings are discussed to address the research ques-
tions for this study.
6.1 Research Question One:
How can customer satisfaction (CS) with the service qual-
ity be described in mobile telecom networks within
Ghana with and without respect to mobile network?
6.1.1 Irrespective of mobile network company
First, the MnCSI (Table 5.2.1) indicated an index of 48.3
which could be described as low because it is below the
satisfactory index of 50. This result indicates that gener-
ally CS in Ghana‘s mobile telecom market is considerably
low.
Second, using desire and expectation disconfirmation
measures (Table 5.3.1b) show that 13.9% and 19.1% of
respondents rated their satisfaction better than their de-
sire and expectation respectively, with mean rating of
2.72 and 2.84 respectively, which were a little below the
ATDF JOURNAL Volume 7, Issue 3/4 2010
Figure 5.5 Means Plots for Satisfaction among Gender
Page 47
Page 47
ity and make serious efforts to develop effective strate-
gies to improve the situation. Their customers are typi-
cally dissatisfied with their service quality; therefore it
is recommended that the management should keep
improving upon the network quality as well as other
dimensions of service quality until customers‘ are sat-
isfied.
The management of Companies B, C and D must un-
derstand that generally their customer satisfaction is
only equal to and not better than expected, and that
they ought to work towards exceeding customer expec-
tation and desired service quality.
Since satisfaction differs among male and female cus-
tomers, it implies that that gender is an empirically
valid variable that can be used as basis for market
segmentation. It is therefore, recommended that ser-
vice providers could segment and target male and fe-
male customers with different service offerings and
marketing strategies. For this to be effective the type
of service offering should be well considered; it should
be an offering type that has the likelihood to appeal to
female and male customers differently. In this regard,
mobile network operators could use diverse ap-
proaches such as marketing intelligence to find out
services that most likely appeal to the each gender
group, and tailor marketing strategies to deliver them
to each gender segment and target group.
7. Conclusion
7.1 Summary of Findings and Conclusions
This paper sought to assess and analyse customer
satisfaction with service quality delivered by Ghana‘s
Mobile Telecom Networks with respect to and irrespec-
tive of mobile telecom network using four measures:
MnCSI, desire and expectation disconfirmation meas-
ures, and overall satisfaction measures. Out of the one
thousand sample population, nine hundred and thirty-
seven (937) responded to the questionnaire adminis-
tered.
The study found that irrespective of mobile telecom
network in Ghana, all the four tools or measures
pointed that CS is low and not equal to or better than
desired or expectation, so the customers are not satis-
fied with service quality delivered by MTNs in Ghana.
With respect to mobile networks, the customers are
not satisfied with the service delivery of Mobile Net-
work A. Customer satisfaction for service quality of
Company B is better than expected and at least equal
to desire of customers. For Mobile Network C, cus-
tomer satisfaction is at least equal to expectation and
desire of the customers. Finally for Mobile Network D,
customer satisfaction is at least equal to the desire
and expectation of the customers.
Overall customer satisfaction significantly differs
among Mobile Telecom Networks in Ghana. Signifi-
cantly, customers of Company B, C and D rated their
satisfaction higher than those of Company A. Finally,
MTNs from the ANOVA F-test (Table 5.4.4a) showed ρ-
value 0.000<0.05. This provides support for rejecting
the null hypothesis that the means are equal across
mobile telecom networks in Ghana. It can, therefore, be
concluded with 95% confidence that CS is not equal
among the mobile networks in Ghana. The mean plot
(Table 5.4.4b) further revealed that significantly most
customers of Company B, C and D rated their satisfac-
tion with service quality higher than Company A.
6.3. Research Question three:
Do the ratings of male and female customers regarding
their satisfaction with service delivered by MTNs in
Ghana differ?
The study confirms that satisfaction differs among male
and female customers. A further post hoc analysis using
the mean plots (Table 5.5 and figure 5.5) indicate that
significantly male customers are more satisfied than
female customers. More information is needed to com-
prehend this empirical finding. However it has strongly
been revealed that there is a statistically significance
difference in satisfaction of male and female customers
of MTNs in Ghana.
6.4 Implications of the Findings
6.4.1 To Industry Regulators and Policy Makers
It has been found in this study that generally customer
satisfaction with service quality is low or less than ex-
pected and desired in the Ghana MTNs. This imply that
policy makers and industry regulators such as the Minis-
try of Communication and National Communication Au-
thority in Ghana, need to be awakened to this empirical
fact and take pragmatic steps to ensure that mobile
telecom network operators in Ghana improve their effi-
ciency and effectiveness in the provision of telecommu-
nication services that meet and exceed customer need,
desire and expectation.
It is recommended that industry regulators such as Na-
tional Communication Authority (NCA) should make it
part and parcel of their monitoring activities to establish
and implement an independent periodic survey to as-
sess customer satisfaction of the service quality deliv-
ered by MTNs in Ghana. Such surveys should not only
seek the overall satisfaction of customers but also satis-
faction in the various service quality dimensions. The
results of such satisfaction surveys should be published
with the companies named for the public to take knowl-
edge of the respective performance of MTNs, which has
the potency of triggering change in the quality of service
delivered by the lowly rated companies. Such surveys
also give the NCA and other industry regulators that sci-
entific basis for any sanctions, queries and addressing
poor service quality issues in the industry.
6.4.2 To Management of the MTNs.
Specifically, the findings of this study imply that the
management of Company A must seriously take knowl-
edge of customer dissatisfaction with their service qual-
ATDF JOURNAL Volume 7, Issue 3/4 2010
Page 48
Page 48
11. Frempong Godfred and Anders Henten (2004)
―Telecom Developments and Investments in
Ghana‖. WDR Dialong Theme 2003, Discussion
Paper, WDR 0305.
12. Garland, B.C. and Westbrook, R.A. (1989) ―An ex-
ploration of client satisfaction in a non-profit
context‖, Journal of Academy of Marketing Sci-
ence, 17, pp. 297-303.
13. Gro¨nroos, C.A. (1984) ―Service model and its mar-
keting implications‖, European Journal of Market-
ing, 18 (4), pp. 36-44.
14. Gro¨nroos, C. (1994) ―From Marketing Mix to Re-
lationship Marketing. Towards a Paradigm
Shift Marketing‖. ASIA- Australia Marketing Journal
2(1), 9 – 30
15. Gro¨nroos, C. (1990) ―Service Management: A
Management Focus for Service Competition‖. Inter-
national Journal of Service Industry Management,
1(1), pp 6-14 Gro¨nroos, C.(2000) Service Man-
agement and Marketing, Lexington Books, Lexing-
ton, MA
Gro¨nroos, C. (2001) ―The Perceived Quality Con-
cept: a mistake?‖ Managing Service Quality 11(3),
pp. 150-152
16. ICT Statistics Newslog (2008) available at
(http://www.itu.int/ITU-
D/ict/newslog/Ghana+Topped+The+Seven+Millio
nmark.aspx) retrieved on 6th March, 2008.
17. Khalifa M. & V. Liu (2002) ―Satisfaction with Inter-
net-Based Services: The role of role of Ex-
pectations and Desires‖. Journal of Electronic
Commerce, 7(2), pp 31-35
18. Klaus, P. G. (1985) Quality phenomenon: the con-
ceptual understanding of quality in face-to-face
service encounters”, in Czepiel, J.A., Solomon,M.R.
and Surprenant, C.F. (Eds), The Service Encounter,
Lexington Books, Lexington, MA.
19. Kotler P. & Keller K. (2006) Marketing Manage-
ment, 12th Edition, Pearson Education Inc,
New Jersey.
Lovelock C. & Wirtz J. (2007) Services Marketing:
People, Technology, Strategy (6th Ed.), Pearson
Prentice Hall, New Jersey
Maister, D.H. (1985) The psychology of waiting
lines”, in Czepiel, J.A., Solomon, M.R. and
Surprenant, C.F. (Eds), The Service Encounter,
Lexington Books/DC Heath, London.
20. Mano, H. and Oliver, R.L. (1993) ―Assessing the
dimensionality and structure of the consumption
experience: evaluation, feeling, and satisfaction‖,
Journal of Consumer Research, 20, December,
pp. 451-66.
21. Mano, H. and Oliver, R.L. (1993) ―Assessing the
dimensionality and structure of the consump-
tion experience: evaluation, feeling, and satisfac-
tion‖, Journal of Consumer Research, 20, pp.
the male respondents or customers are significantly more
satisfied with their service providers than the female cus-
tomers.
It is recommended that future research should examine
customer satisfaction with specific service areas deliv-
ered across mobile telecom networks.
References
1. Addy-Nayo, C. (2001) 3G mobile policy: The case of
Ghana.ITU: Geneva, retrieved from www.itu.int/
osg/spu/ni/3G/casestudies/ghana/ghanafinal.doc
on 10th August 2008
2. Anderson, E. W., Fornell, C. and Lehmann, D. R.
(1994) ―Customer Satisfaction, Market Share
and Profitability: Findings from Sweden,‖ Journal
of Marketing, 58(3), 5366.
3. Besterfield, D.H. (1994) ―Quality Control, Prentice-
Hall, Englewood Cliffs, NJ Claes-Robert Ju-
lander and Magnus Söderlund Ragnar (2003) Effects
of Switching Barriers on Satisfaction, Repurchase
Intentions and Attitudinal Loyalty”. SSE/EFI Working
Paper Series in Business Administration. No.
2003:1.
4. Cronin, J.J. Jr and Taylor, S.A. (1992) ―Measuring ser-
vice quality: a re-examination and extension‖,
Journal of Marketing, 56, pp. 55-68.
5. Delvin, Susan J., Dong, H. K., and Brown, M. (1993).
―Selecting A Scale for Measuring Quality.‖ Mar-
keting Research: A magazine of Management and
Applications, 5(3): 12-17
6. Danaher P. J.& Vanessa Haddrell V. (1996) ―A com-
parison of question scales used for measuring
customer satisfaction‖, International Journal of Ser-
vice Industry Management, 7 (4), pp. 4-26. MCB Uni-
versity Press
7. Donald R. Cooper and Pamela S. Schindler., (2006)
Business Research Methods (9th ed.), empirical in-
vestigation‖, Journal of Service Research, 1 (2), pp.
108-28.
8. Edvardsson (2005) ―GURU‘S VIEW, Service quality:
beyond cognitive assessment Service Sweden Man-
aging Service Quality‖, 15 (2), pp. 127-131
9. Edvardsson et al. (2005) ―Services portrait in service
research: a critical review‖. International Journal of
Service Industry Management 16(1), pp 107-121
available at www.emeraldinsight.com/
researchregister Fornell,
C., et al. (1996) ―The American customer satisfaction
index: nature,purpose, and findings‖, Journal of
Marketing, 60, pp. 7-18.
10. Frempong G and Henten A.,(2004) ―Telecom devel-
opments and investments in Ghana‖. Discussion Pa-
per W D R 0 3 0 5, W D R Dialogue Theme 2003
ATDF JOURNAL Volume 7, Issue 3/4 2010
Page 49
Page 49
encounters‖, Managing Service Quality, 14 (5), pp.
365-76.
36. WTO (1985) Identification and Evaluation of those
Components of Tourism Services which have a
Bearing on Tourist Satisfaction and which can be
Regulated, and State Measures to Ensure Ade-
quate Quality of Tourism Services, World Tourism
Organization, Madrid
37. www.BIZZcommunity.com: news retrieved on Octo-
ber 9, 2008. www.theacsu.org
451-66.
22. Maslow A. (1954) Motivation and Personality.
Harper and Row: New York, pp 80-106
23. Malhotra N. K. and Birks D. F. (2007) Marketing
Research, An applied Approach (3rd Ed.) Pren-
tice Hall, Inc.
24. Narver, J.C. and Slater, S.F. (1990) ―The effect of a
market orientation on business profitability‖,
Journal of Marketing, 54, pp. 20-35.
25. Oliver R. L., & DeSarbo, W. S. (1988) ―Response
Determinants in Satisfaction Judgements‖. The
Journal of Consumer Research, 14(4), p.495-507
26. Oliver, R. L. (1980) ―A cognitive model of the antece-
dents and consequence of Customer Satisfaction‖.
Journal of Marketing Research, 17, pp 460-469
Oliver, R.L. (1993a) ―Cognitive, affective, and attrib-
ute bases of the satisfaction response‖, Jour-
nal of Consumer Research, 20, pp. 418-30.
27. Parasuraman, A., Zeithaml, V.A., Berry (1988)
―SERVQUAL: a multiple item scale for measuring
customer perceptions of service quality‖, Journal of
Retailing, 64, pp.12-40.
28. Pizam A.& Taylor E. (1999) ―Customers Satisfaction
and its Measurement in Hospitality Enterprises‖.
International Journal of Contemporary Hospitality
Management 11(7), pp 326-339
29. Rust, R.T. and Oliver, R.L. (1994) ―Service quality:
insights and managerial implications from the fron-
tier‖, in Rust, R. and Oliver, R. (Eds), Service Quality:
New Directions in Theory and Practice, Sage Publi-
cations, Thousand Oaks, CA, pp. 1-20.
30. Satari, S. (2007) ―Application of Disconfirmation
Theory on Customer Satisfaction Determination
Model – Case of Prepaid Mobiles in Iran‖, Master’s
Thesis, LTU, Sweden.
31. Saunders, M. N. K. (2000) Research Methods for
Business Students, 2nd Edition, Financial
Times/Printice Hall
32. Singh, J. (1991) ―Understanding the structure of
consumers‘ satisfaction evaluations of service deliv-
ery‖, Journal of Academy of Marketing Science, 19,
pp.223-44.
33. Vavra, T.G. (1997) Improving Your Measurement of
Customer Satisfaction: A Guide to Creating, Con-
ducting, Analyzing, and Reporting Customer Satis-
faction Measurement Programs, ASQ Quality Press.
34. Wang Y. & Hing-Po Lo. (2002) Service quality, cus-
tomer satisfaction and behaviour intentions:
Evidence from China’s telecom Industry. Info 4, 6
pp. 50-60.MCB UP Ltd
35. Wong, A. (2004) ―The role of emotions in service
ATDF JOURNAL Volume 7, Issue 3/4 2010
Page 50
Page 50
reached a stage where they would like to meet the Afri-
can entrepreneur in person and look at his business on
the ground.
The Rotary club and other professional associations
will be invited to use their network to recruit new men-
tors; Google and SAP are contributing to the platform
by providing the online tools that assist local entrepre-
neurs with financial planning and other office tools.
Credit Suisse is considering the launching of an invest-
ment fund dedicated to growth-oriented entrepreneurs
in developing countries designed to support business
partnerships between experienced mentors and inno-
vative local entrepreneurs.
The platform will be available as a mobile application
and support online communication via skype, sms and
e-mail.
Its matchmaking function helps to reduce search costs
by finding optimal matching based on the different
profiles entered by those who have registered.
From June to December 2010, we have developed and
tested the website design, the format of the mentoring,
entrepreneurship and business profiles as well as a
new matchmaking algorithm in collaboration with the
ETH department of computer science, the UNCTAD
Enterprise Development Branch, Swisscontact (Swiss
expert corps), interested mentors and local partners in
Ethiopia, Zambia and Kenya.
So far we have offered interested participants a test-
platform to provide valuable input and suggest further
improvements (http://test-match.atdforum.org). You
can login with username and password ‗EntrepA‘ to
have access to an Entrepreneurship/Business Profile
and username and password ‗MentorA‘ to have access
to a Mentoring Profile. The Matchmaking function then
presents the mentors that best match a particular en-
trepreneur and his/her business idea/product/service.
Rationale of the project
Most aid initiatives that support entrepreneurs in the
informal sectors in African countries are designed to
support low-budget existing business activities (e.g.
microfinance, vocational training in traditional jobs,
etc). But such investments are too small to allow an
innovative entrepreneur to develop and commercialize
a new product or service that would enable him or her
to make increasing returns and eventually enter the
formal sector where one has to cope with complex and
expensive standards and regulations. Yet, experience
in Asia and parts of Latin America prove that govern-
ment policies that focus on supporting the transition
from low-growth informal to high-growth formal busi-
ness help create endogenous and inclusive develop-
ment through a growing entrepreneurial middle-class.
Project Description
E-mentoring is widely recognized as a tool to promote
economic development and social empowerment. As a
result, numerous public and private initiatives have
emerged over the past decade to mobilize e-mentoring
for a particular social and economic purpose mainly fo-
cused in particular areas of competence within developed
countries (see http://www.atdforum.org/spip.php?
rubrique37). Yet, few of them are related to poverty re-
duction through the assistance and support of local en-
trepreneurship.
There is increasing evidence that the main obstacles to
sustainable, home-grown and inclusive economic growth
in Least Developed Countries (LDCs), is the lack of tacit
knowledge of and investment in innovative and entrepre-
neurial local people. E-mentoring is very promising be-
cause there are highly competent people of all ages and
increasingly elderly people who would like to impart their
knowledge, network and experience gained over a life
time and become active as investors and mentors of
promising and innovative Small and Medium Enterprises
(SMEs) in developing countries.
On the other side, there is a growing young and educated
population in developing countries who is seeking an op-
portunity to use its creativity to start businesses that pro-
vide solutions to the many unmet needs in poor coun-
tries. What stands between them and their aspirations is
the lack of experience (tacit knowledge, or ‗deep craft'), a
supportive network and access to funding.
We believe that our Match-making Platform has the po-
tential to bring together the critical players from all devel-
oping countries given the support by the UNCTAD EM-
PRETEC Centres (Entrepreneurship Training Centers) and
numerous Mentoring organizations in Europe and the
United StatesATDF was co-founded by the applicant.
Since 2003, ATDF runs a free peer-reviewed online jour-
nal on science, technology and entrepreneurship for de-
velopment, provides online entrepreneurship assistance
and has set up an entrepreneurship hub in Zambia with
annual investment awards.
ATDF has launched its plans matchmaking platform on
January 21, 2011 at the UNCTAD multi-expert meeting on
enterprise development in Geneva
(http://match.atdforum.org) and the response from the
participating stakeholders has been very positive. The
event was sponsored by the Swiss Secretariat for Eco-
nomic Affairs (SECO)
In the course of 2011, ATDFs partners will undertake spe-
cific activities. For example, mentoring organizations will
be offering the e-platform to their volunteer expert corps
and provide financial support for mentors who have
ATDF JOURNAL Volume 7, Issue 3/4 2010
An E-mentoring platform for entrepreneur-driven
development in Africa
African Technology Development Forum
Page 51
Page 51
their own people and prefer to support foreigners in-
stead or people from their own kin. This subliminal
discrimination may further aggravate the economic
situation of the local people and undermine their self-
confidence.
In order to overcome the institutional and mental ob-
stacles we encountered in Zambia and at the same
time expand our ideas to other African countries, we
decided to create the above-mentioned e-mentoring
platform. The platform can to some extent help create
an e-entrepreneurial infrastructure that partially com-
pensates for the absence of a local infrastructure. E-
mentors may not just help local entrepreneurs to solve
a particular problem, comply with regulation, help
them get investment for their business idea or even
become a business-partner, but they may also help
increase local self-confidence and curiosity about new
business opportunities. After all, electronic communi-
cation helps to focus on the real problem and forget
about cultural, economic and other personal differ-
ences. As such, it tends to make prejudice and hierar-
chic thinking irrelevant.
The goal of our initiative is to first encourage African
entrepreneurs register with the platform via UN EM-
PRETEC Centres. These centres could also help them
register properly and clearly define what kind of prob-
lem they would like to solve and what they expect from
a mentor.
Further References
1. Chesbourgh, H. & Kardon, A. (2006) Beyond high
tech: early adopters of open innovation in other in-
dustries. R&D Management 36,(3): 229-236.
2. Colomo-Palacios, R., Gómez-Berbís, J. M. G., García-
Crespo, Á. & Mencke, M. (2009) SeMatching: Using
Semantics to Perform Pair Matching in Mentoring
Processes. M.D. Lytras et al. (Eds.): WSKS 2009,
LNAI 5736, pp. 137–146. Heidelberg : Springer.
3. Von Hippel, E. (2006) Democratizing Innovation. MIT
Press, Cambridge MA.
4. Baumol, W. J., Litan, R. E. & Schramm, C. J. (2007)
Good Capitalism, Bad Capitalism. Yale University
Press, New Haven.
5. Arthur, B. (2009) The Nature of Technology. Free
Press, New York.
6. Bateman, M. (2010) Why Doesn‘t Microfinance
Work? London: Zed Books.
7. Aerni, P. (2006) The Principal-Agent Problem in In-
ternational Development Assistance and its Impact
on Local Entrepreneurship in Africa: Time for New
Approaches. ATDF Journal 3(2): 27-33.
8. Philipp Aerni and Dominik Rüegger, ‗Making Use of
E-mentoring to support Innovative Entrepreneurs in
Africa‘. Forthcoming in the book by Thomas Cottier
and Mira Buri ‗Trade in the Digital Age‘. Cambridge
UK, Cambridge University Press.
Many African governments tend to rely too much on for-
eign aid in the generation of revenues even though it is
well understood that investment in growth-oriented entre-
preneurship and institutions that support it would have a
more sustained impact on development. Unfortunately,
foreign aid agencies influence priority setting in national
policies through implicit or explicit conditionality that are
often unrelated to the promotion of entrepreneurship. In
fact, many of the ongoing programs seem to discourage
growth-oriented entrepreneurs. Development organiza-
tions are primarily accountable to donors and taxpayers
back home and therefore reluctant to invest in educated
but poor people that aim at making profits. Even though
there are many venture capital firms in Africa and there is
also support from the International Finance Corporation
(IFC) for private sector development, these investments
are mainly focused on helping established companies
(with revenues between U$S 100‘000 and US$ 1 million)
rather than risky start-up firms. This also explains why ef-
forts by African universities to foster links to the local pri-
vate sector have been disappointing so far.
In view of the fact that growth-oriented start-up entrepre-
neurs in Africa tend to be ignored by large investors, micro-
finance institutions, development organizations as well as
their own governments, was the main reason to set up the
‗African Technology Development Forum‘ (ATDF) in 2003
together with two African colleagues, Victor Konde from
Zambia and Constantine Bartel from Sudan. Our free-peer
reviewed online journal called ATDF Journal was set up to
address topics and ideas that are hardly addressed in so-
cial science research that increasingly needs to comply
with official priorities set by the large public and private
foundations in order to get funding (embedded science).
Each ATDF Journal issue is dedicated to a particular topic
(e.g. health, energy, biotechnology, ICT, IPRs, etc) and con-
tributions consist of empirical research produced in Africa
as well as well-known experts in the respective field. As
such, ATDF encourages research, problem identification
and unconventional solutions put forward by African re-
searchers and leading academic scholars from different
fields.
Even though ATDF has run the quarterly journal for the
past seven years on a voluntary basis, it has managed to
attract contributions from leading scholars and profession-
als. The ATDF website is recognized as a resource-tool for
growth-oriented African entrepreneurs with its business
centre (http://www.atdforum.org/spip.php?rubrique2) and
knowledge essentials that are updated on a regular basis
(http://www.atdforum.org/spip.php?rubrique3).
ATDF has been learning by doing. For example, ATDF has
sponsored start-up entrepreneurs in Zambia thanks to the
support of Dr. Ernst Thomke in 2007. In course of entre-
preneurship coaching we realized that there are several
obstacles that make it hard for the local entrepreneurs to
grow and generate profits that would allow to further in-
vest in the improvement of the business: the complex and
expensive formal regulations, the high transaction costs in
creating a local business and client network, the absence
of a dependable entrepreneurial infrastructure (business
support services), and, finally, lack of access to knowledge
and credit. The situation is not made easier for local entre-
preneurs by the fact that African leaders tend to distrust
ATDF JOURNAL Volume 7, Issue 3/4 2010