152
1 MIG Investor Day 22 May 2009 London 1

11
MIG Investor Day
22 May 2009London
1

22
Section 1Marfin Investment GroupGroup overviewFinancial highlights
MIG CompaniesVivartiaAtticaHygeiaSingularLogicOlympicMarfin Popular BankMIG Private EquityIntra-group synergies
Contents
2

33Group overview
Leading companies across key sectors
Food & Dairy
Healthcare
Transportation
IT & TelecomsFinancial Institutions
Private Equity
ATHEX listed with a market capitalisation of c.€2.5bn
Net Asset Value stands at a total of €4.075bn
Portfolio of leading companies in mainly defensivesectors across the SEE region
Diversified group with global presence
37% sales outside GreecePresence in 40 countriesMore than 22 business segments
Total workforce in excess of 50 thousand employees and associates
MIG Group Operating Performance
2008 Consolidated Revenues: €1,773m2008 EBITDA: €326.8m2008 Net Profit: €112.6m
MIG Parent:
€1,078m cash87% of investment portfolio in quoted instrumentsConstructive dividend proposed for 2009 of €0.20 per share
Highlights
3

44
4
U.S.A.
Egypt
ATLANTIC OCEAN
Malta
Guernsey
Cyprus
Mexico
SaudiArabia
Vivartia Hygeia MPB Singular HiltonKorasidisRKB Sunce FAI Attica
Nigeria
Australia
A group with a global footprint
NORTH SEA
MEDITERRANEAN SEA
PolandGermany
Italy
Turkey
Ukraine
Romania
Bulgaria
Russia
Montenegro
Croatia BLACK SEA
Estonia
Serbia
Albania
Greece
4

55
MIG continuously enhances its sectoral and geographical diversification
A diversified group
Portfolio companies by sector
Production sector: Dairy & Beverages, Bakery & confections andFrozen Foods activities.Real Estate sector: investment property activities in Serbia andGreece.Service Sector: Food services, Transportation, Hotel & Leisure,Healthcare, Financial Inst, IT & TelBreakdown as per Group’s Gross Asset Value
Group sales by geography
Group Sales include only fully consolidated companies:Vivartia, Attica, Hilton and RKB (during 2008 RKB portfolioassets were under refurbishment, therefore no material incomehas been generated)
Rest of the world 11%
€ 3,348.8m € 1,773.0m
5

66A diversified group (cont’d)
MIG’s current portfolio consists of leading companies in their sectors across SEE
Portfolio companies by industry (a),(b)
(a) MIG’s gross asset value, amounted to €3,348.8m
(b) MIG portfolio is classified in 5 core businesses & private equity
(c) Vivartia breakdown in 4 business lines according to averageEBITDA of years 2009 to 2013 (as per the latest business plan)
Private equity by industry (d),(e)
€ 3,348.8m € 386.2m
(d) Breakdown as per Group’s Gross Asset Value
(e) The Private equity Sector includes : MIG Leisure, RKB Serbia,MIG Leisure & Real Estate Croatia, MIG Real Estate &Anakon/Theros
Entertainment 15%
6

7MIG group structure
Main controlling interest in subsidiaries & associates
Sector Cons. Method Current stake
Vivartia Food and Dairy Full 90.3%
Attica Transportation Full 86.8%
Hilton Private Equity: Hospitality Full 75.1%
MIG Real Estate Private Equity: Real Estate Equity 50.0%
JSC Robne Kuce Beograd Private Equity: Real Estate Full 66.7%
Sunce Bluesun Private Equity: Hospitality Equity 49.9%
Singular Logic IT & Telecom Equity 31.2%
FAI Flight Ambulance Private Equity: Flight Ambulance Equity 49.9%
Minority Interests - Non consolidated companies
MPB Financial Institutions None 9.7%
Hygeia Healthcare None 33.3%
7

88
Section 1Financial highlights
Section 2
8

99Key financials - Profit & Loss
20082007
pro forma2007
reported
Sales 1,773 1,444 604
EBITDA 327 191 34
Profit after tax from continuing operations 184 182 69
Profits after tax from discontinued operations 0 268 268
Net profit for the period 184 450 337
Net profit after minorities from continuing operations 113 126 62
Basic EPS from continuing operations (in €) 0.15 - 0.16
Group income statement (€m)
20082007
reported
Operating income 173 394
Net operating income 116 348
Net profit for the period 77 278
Basic EPS (in €) 0.10 0.70
Group income statement (after minorities)Contribution by unit (€m)
20082007
pro forma
Net income from Holding & consolidation adjustments 76 43
Net income from Operational units (production & services sectors) 57 69
Net income from Real estate units 87
Gains (losses) from revaluation of investment portfolio (107) 14
Net profit after minorities from continuing operations 113 126
Consolidated sales presented a robust increase of 23% vs pro forma sales of 2007
Consolidated EBITDA posted a substantial uplift of 71% compared to pro forma respective figures of 2007, whereas EBITDA margin soared by 520 bps from 13.2% in 2007 pro forma to 18.4% in 2008
Basic EPS stood at €0.15 at a consolidated basis compared to €0.16 in 2007 as reported
Company income statement (€m)
2007 company’s net profit includes €242m extraordinary income from the disposal of banking assets
9

1010Key financials – Balance sheet
2008 2007
Goodwill 1,383 1,086
Fixed & intangible assets 2,660 2,345
Investment & trading portfolio 1,328 3,718
Other assets 741 973
Cash & Cash Equivalents 1,509 1,508
Total Assets 7,621 9,631
Long term debt 1,509 1,013
Short term debt 755 2,358
Other liabilities 832 758
Shareholder’s funds 4,155 4,945
Minority interests 369 556
Total Equity & Liabilities 7,621 9,631
Group balance sheet (€m)
Net debt 755 1,864
Net debt / equity 17% 34%
Net debt / total assets 10% 19%
Equity / total assets 59% 57%
2008 2007
Total investments (Gross Asset Value) 3,349 5,916
Other assets 229 170
Cash & Cash Equivalents 1,078 1,189
Total Assets 4,656 7,275
Long term debt 0 0
Short term debt 516 2,148
Other liabilities 66 186
Shareholder’s funds 4,074 4,941
Total Equity & Liabilities 4,656 7,275
Company balance sheet (€m)
Net debt/(cash) (563) 960
Net debt / equity (14%) 19%
Net debt / total Investments (17%) 16%
Equity / total investments 122% 84%
The €2bn decrease in total assets relates to thedisposal of the stake in OTE
Debt has been reduced by €1,633m to €516m due to the reimbursement of loans for the financing of the investment in OTE.A highly liquid balance sheet with Net Cash of €563m
10

1111Strong liquidity at group level
Net debt evolution at group level
Cash breakdown Debt breakdown
Amidst adverse market conditions, MIG has significantly reduced its net debt position at a group level while all portfolio companies maintain healthy balance sheet structures and strong cash positions
€1,509m
€2,264m
11

1212Net asset value
NAV composition 31 December 2008
€ 4,074m
Portfolio companies
82%
Net Cash14%
Working capital
4%
NAV bridge between Dec-07 & Dec-08
Strong Balance Sheet: Cash rich and healthy net debt levels
The company has maintained a very strong cash position of €1,078m and a healthy net cash that accounts for 14% of the NAV
As of 31 Dec 2008 the NAV per share stands at €5.45 compared to €6.59 the year before
(1,885)
(691)
12

1313
Section 1MIG companies
Marfin Investment Group
13

1414
Section 1
Vivartia
Section 3
14

1515Vivartia
The largest food company in the SEE region, operating under four divisions:
Dairy, Bakery, Food Services & Frozen Foods
Date of Investment: July 2007MIG Ownership: 90.3%Vivartia is the largest food company in South-East Europe, with #1 market positions in each of its core business lines, and #1 or #2 market shares in key products under each division, selling 3,5 billion units of product every yearDairy & Beverages: #1 Milk in Greece, Cyprus and Bulgaria; #1 Yoghurt in Cyprus; #2 Yoghurt in Greece and Bulgaria; #1 Fresh Juice in GreeceBakery: #1 Pastry in Greece, Bulgaria, Romania, Poland and Hungary; #1 Biscotti, #1 Bagel Chip, #1 Melba Toast and #2 Pita Chip in the USAFoodservice & Entertainment: #1 QSR, #1 Branded Coffee Shops and #1 Catering in GreeceFrozen Foods: #1 Frozen Vegetable and #1 Frozen Pastry in GreeceVivartia distributes to over 35 countries worldwide, and has joint ventures with leading players in several key growth markets outside of Greece, including PepsiCo in Mexico, Leventis Group (Coca Cola) in Nigeria, Almarai in Saudi Arabia and the Berzi Family in Egypt Vivartia is headquartered in Athens, operates 35 factories worldwide (30 fully-owned and 5 through joint venture agreements), with over 450,000m2 of owned buildings and over 1,300,000m2 of owned land
Company profile
Financial highlights (€m)
Net profit +21%28.1EBITDA +21%126.6Sales +28%1,118.7
Total equityNet Debt 390.5 +85%
2007 2008 Growth
1,437.2153.5
34.2692.4 683.4 -1%
722.0
15

1616Vivartia – At a glance
Strategic & operational highlights of the yearKey Events of 2008
Completion of the operational and legal merger of the two subsidiaries in Cyprus (Charalambides Dairies & Christis Dairies)Acquisition of Nonni’s (US) in April 2008 (Bakery Division)Acquisition of Everest & Olympic Catering completed in June 2008 (Food Services & Entertainment Division)UMC (Bulgarian subsidiary) was fully consolidated in 2008 (partial consolidation as of July 1st , 2007) – Dairy Division
Year 2008 PerformanceGroup sales increased by 28.5% over last year. The increase was driven by healthy organic growth of 7.2%, first time partial consolidation of Nonni’s, Everest and Olympic Catering, and first-time full year consolidation of the subsidiary in Cyprus, Christis DairiesThe third and fourth quarters of 2008 presented significant improvement in profitability versus the corresponding quarters of 2007, and the first two quarters of 2008EBITDA increased by 21.2% over last year mainly enhanced by the increase of Bakery & Entertainment divisions EBITDA and consolidation of the recent acquisitions The Group’s EBITDA margin decreased by 64 bps to 10.7% amidst an unprecedented rise in commodity prices in 2008 and a significant slowdown in the second half of 2008 in the US and CEEDespite the adverse environment, FY2008 results were less than 2% below the 5-year business plan targets in terms of revenues and less than 1% below in terms of EBITDA while net earnings were 93% higher than those projected
Recent DevelopmentsOn 26 March 2009, Vivartia announced the reorganization of the Company into four subsidiaries through the separation of divisions. This separation will enhance the management of activities by division due to the increased volume of operations and significant international expansion while, on the other hand, it provides each new company with greater flexibility in formulating its strategy and pursuing strategic initiatives and co-operations
16

1717Vivartia – Key financials & guidance
Recent actual financials and five-year guidance
€m2007
Actual
2008(5 yr
Guidance)2008
Actual2009
Guidance2010
Guidance2011
Guidance2012
Guidance2013
GuidanceCAGR’08-’13
Sales 1,119 1,458 1,437 1,731 1,909 2,136 2,403 2,672 13%
EBITDA 127 155 154 186 208 256 303 332 17%
EAT 28 27 34 46 58 91 119 139 32%
EPS 0.13 0.08 0.15 0.26 0.40 0.85 1.16 1.36 55%
17
Despite the adverse environment, FY2008 results were less than 2% below the 5-year business plan targets in terms of revenues and less than 1% below in terms of EBITDA while net earnings were 93% higher than those projected

1818Vivartia – Current economic climate
Vivartia is well-prepared for any conditions arising from the current economic climate
It is our expectation that on an average basis, volumes will lag 2008 levels by around 5% - 7%
However, we do not expect any material adverse effects on profitability due to the following circumstances:
Extraordinary increases in the prices of raw materials in late 2007 & 2008 forced us to correspondingly increase consumer prices in 2008; in 2009 we are taking advantage of these adjusted consumer prices and the dramatically lower raw material pricesTimely and prudent internal cost cutting initiatives
18
1919
U.S.A.Egypt
Mexico SaudiArabia
Nigeria
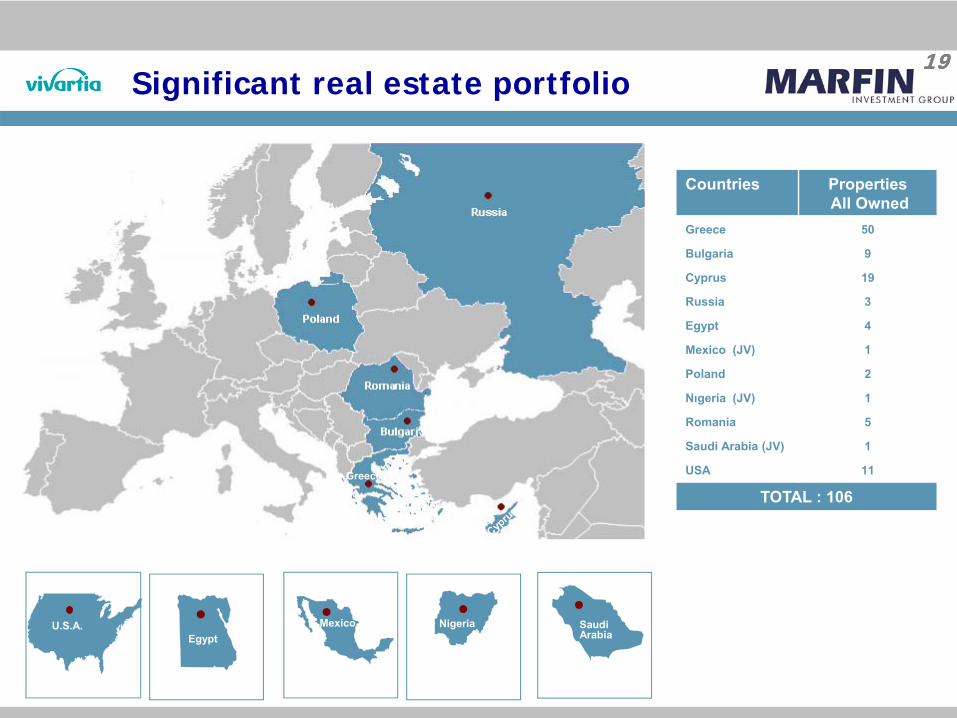
Countries PropertiesAll Owned
Greece 50
Bulgaria 9
Cyprus 19
Russia 3
Egypt 4
Mexico (JV) 1
Poland 2
Νιgeria (JV) 1
Romania 5
Saudi Arabia (JV) 1
USA 11
TOTAL : 106
Significant real estate portfolio
GreeceGreeceGreeceGreece
19

2020Production sites excluding Bakery & Confectionary
Bulgaria Cyprus
Imathias
Thessaloniki
Larissas
ViotiasAttikis
Factory locations Ownership Production activity Food & Beverages Division
Food Services & Entertainment
Frozen Foods
20

2121Dairy - Introduction
The Dairy Division has a market-leadership strategy which is based on:
Strong umbrella & individual brandsEffective commercial distributionEfficient industrial setup
Strong umbrella brand: the Delta brand, with its daily exposure to a large number of consumers through milk consumption, is an umbrella brand complemented by successful sub-brands to create a product portfolio with both high-volume commodity products and high margin value-added productsExtensive distribution network: the division has a very strong position in the trade due to its leadership position in many product lines. It has the largest chilled distribution network in Greece, with daily visits to most of the stores which sell dairy productsCompetitive R&D and industrial operations: the division has a strong R&D department to support product innovation and manufacturing operations that follow the strictest quality standards and are conveniently located close to the end-market
Competitive advantages and strategy Dairy & Beverages strategy
Market Leadership
Competitive R&D / Industrial Operations
21

2222Dairy – Main product categories
The main product categories are milk, fresh dairy products, chilled fresh juices and cheeses
In Milk, a wide range of products is offered, covering all types of white (fresh, HP, UHT, evapore) and chocolate milk
In Fresh Dairy Products, Vivartia offers not only white and flavored yogurts, but also products catering to specific consumer needs (i.e. functional and children’s yoghurts)
In Beverages/Chilled Juices, Vivartia offers a diverse range of flavors
In Cheeses, Vivartia offers branded and non-branded feta, halloumi, and cream cheeses
The Dairy business includes 4 main categories
• Fresh milk• HP• UHT• Chocolate
flavored• Condensed• Children’s
milk
Dairy & Beverages products
Milk
Fresh dairy products Beverages
Milk
Beverages
Fresh Dairy Products• White yogurt• Fruits &
cereals yogurt• Children’s
yogurt• Functional• Desserts
• Chilled juices
Cheeses• Cheese (feta,
halloumi, cream)
Cheeses
22

2323Dairy – Leading market positions
Vivartia enjoys leading market shares across all its dairy product-lines
Country Category Market shares(rank)
Greece White milk 26.7% (#1)
Greece Choco milk 55.6% (#1)
Greece Yogurt 19.2% (#2)
Greece Chilled Juices 60.2% (#1)
Cyprus White milk 62.3% (#1)
Cyprus Choco milk 81.8% (#1)
Cyprus Yoghurt 33.0% (#1)
Bulgaria Yoghurt 10.5% (#2)
Bulgaria Choco milk 82.0% (#1)
Bulgaria White milk 46.7% (#1)
Dairy & Beverages brands and sub-brands
Greece
BulgariaCyprus
23
Source: Nielsen

2424Dairy – Production network
Vivartia has an extensive production network of 8 Dairy factories across SEE
The Dairy division has operations in Greece (Delta)Cyprus (Vivartia Cyprus) and Bulgaria (United Milk Company)
The production footprint network is located close to densely populated areas, which ensures low cost and timely service of the market
Location Ownership Production activity
Ag Stefanos, Greece Owned Yogurt
Tavros, Greece Owned Milk & Juices
Sindos, Greece Owned Milk
Imathia Platy, Greece Owned Evapore
Ellasona, Greece Owned Feta cheese
Eurofeed, Greece Owned Animal feed
Limassol, Cyprus Owned All Dairy products
Plovdiv, Bulgaria Owned All Dairy products
Map of production plants
Ag.Stefanos(Athens)
Delta, fresh, HP & chocolate milk
Eurofeed, animal feed
Delta, yoghurt , desserts
Delta, fresh & chocolate milk, chilled juices
Sindos
Delta,condensed milk
Tavros(Athens)
Imathia
Vigla
UMC, fresh, UHT, flavored milk,
yoghurt, cheeseGreece
Bulgaria
Cyprus
LimasolChristis, fresh & UHT milk yoghurt , cheese
Delta,feta cheese
Plovdiv
24

2525Bakery – Introduction
Competitive advantages & strategy
Bakery’s market leadership strategy is based on Uniqueness of productsSize of operations Continued successful geographical expansion
Uniqueness of products: Unique long shelf life croissant products in a continuously expanding portfolio, supported by unparalleled brand equity in most of the countries of presence
Size of operations: 35 production lines all over the world, providing unique advantage to retailers
Continued successful geographical expansion:after the initial successful expansion into Central/Eastern Europe, Bakery expanded into broader geographies, such as the US, Nigeria and Saudi Arabia through acquisitions and joint ventures
Bakery & Confectionary strategy
Size of operations
Uniqueness of products
Continued successful geographical expansion
#1
25

2626Bakery – Main product categories
The Soft Dough products portfolio consists of: Croissants (single & mini)Cakes (Swiss rolls, cake bars, madalenas), and Other niche products (strudel, mini strudel, tsoureki & treccina)
The Savory products portfolio includes:Bake rolls, and Pita bakes (based on Arabic pita)
From the recent acquisition of Nonni’s, these product categories are further enriched with biscotti and other specialty baked goods
The Bakery business includes 2 main product categories
Bakery products
Soft dough products Savory products
Nonni’s sweet and savory products
26

2727Bakery – Leading market positions
Vivartia enjoys #1 market shares across all its bakery product-lines
Country Category Market shares(rank)
Greece Pastry 80.0% (#1)
Romania Croissant 77.1% (#1)
Romania Bread snacks 70.8% (#1)
Bulgaria Croissant 88.1% (#1)
Bulgaria Bake rolls 91.7% (#1)
Poland Croissant 94.7% (#1)
Russia Croissant 78.5% (#1)
Egypt Cakes 81.0% (#1)
USA Biscotti 68.0% (#1)
Bakery & Confectionary brands
27
Source: Nielsen

2828Bakery – Production network
Vivartia has an extensive production network of 17 Bakery factories across SEE
The Bakery divsion has 17 manufacturing plants in Greece and abroad (Bulgaria, Romania, Poland, Russia, Egypt, USA, Mexico, Nigeria, Saudi Arabia)12 of the 17 plants are company owned while the other 5 are joint ventures in Egypt, Saudi Arabia, Mexico & Nigeria
Production & DistributionBulgaria EgyptGreeceMexico (*)Nigeria(*) (**)Poland RomaniaRussiaSaudi Arabia (*) (**)U.S.A.
DistributionCzech Republic (***)Germany Hungary (***)ItalySlovakia (***)Ukraine (***)
ExportsAlbania (***)AustraliaAustria Belarus (***)Bosnia (***)CanadaCroatia (***)FYROM (***)KazakhstanLebanon (***)Malta (***)Moldova (***)Serbia (***)Montenegro (***)Slovenia (***)
(*) Joint Ventures / Companies with Vivartia minority stakes (**) Start-ups, 1st quarter 2009(***) Countries with advertising support and high brand awareness
Vivartia factories
Owned plants
Joint ventures plants
Joint ventures
• The plants in Egypt (Cairo) and Saudi Arabia (Jeddah) produce croissants and cakes
• The plants in Mexico (Mexico City) and Nigeria (Abuja) produce croissants
Owned plants
• The manufacturing plant in Greece is located in Lamia and makes croissants, bake rolls, pita bakes, rusks, tsoureki, potato chips and extruded snacks
• The plant in Bulgaria is located in Sofia and produces croissants and bake rolls
• The plant in Romania is located in Bucharest and produces croissants, cakes, Swiss rolls and Creamlineproducts
• The plant in Poland is located in Tomasov (100km from Warsaw) and produces exclusively croissants
• The plant in Russia is located in St. Petersburg Producing croissants, cakes, Swiss rolls, mini rolls, magdalena and flan cakes
• There are 6 plants in the US. Biscotti products are made in Tulsa (OK) and Ferndale (NY), bagel chips in Bronx (NY) and South Dayton (NJ) and crackers are made in Knoxville (TN) and Willingboro (NJ)
28

2929Product categories – Bakery & Confectionary
* Production to start by the end of the first quarter 2009
USA facilities: - Owned: Ferndale NY, Willingboro NJ, Knoxville TN - Leased: Bronx NY, Dayton NJ, Tulsa OK
1. CroissantsSingleMini
2. Cakes
COUNTRIES GREECE BULGARIA ROMANIA POLAND RUSSIA USA (6 facilities) MEXICO(JV) EGYPT (JV) NIGERIA (JV)* SAUDI ARABIA (JV)*
BAKERY & CONFECTIONARY DIVISION
PRODUCT CATEGORIES PRODUCED PER COUNTRY
CA
TEGO
RIES
1. CroissantsSingleMiniStrudelSingleSingle chocolate enrobed
2. Bake RollsBake RollsMini Bake Rolls
3. Pita Bakes
4. Rusks
5. Tsoureki
6. Potato Chips
7. Extruded Snacks
1. CroissantsSingleMiniStrudel
2. Bake RollsBake Rolls
1. CroissantsSingleMiniSingle chocolateTreccinaMini Strudel
2. CakesCake Bars
3. Swiss Rolls
4. Cream LineHazelnut PralineWaffers
1. CroissantsSingleMini
1. CroissantsSingleMiniMini Strudel
2. CakesCake Bars
3. Swiss RollsChocolate enrobed Swiss Rolls
4. Mini RollsChocolate enrobed Mini Rolls
5. Magdalena
6. Flan Cakes
1. Biscotti
2. Bagel Chips
3. Crackers
4. Bread Crumbs
1. CroissantsMini
1. CroissantsSingleMini
2. Cakes
1. CroissantsSingle
29

3030Food Services & Entertainment – Introduction
Competitive advantages & strategy
Goody’s has built its success both in casual restaurants and coffee shops through employment of a fully integrated approach that allows a strict quality control and flexibility in the design of the menu
This has trained the Greek consumers to value and be extremely loyal to a consistent and higher standard than the one offered by the international chains
The recent acquisition of Everest has reinforced the leadership position and the overall potential of the division, as it has added to the Group both a leading brand in snack bars, as well as other successful concepts (La Pasteria) that have potential for further growth
Food and Entertainment strategy
(2001)
Integrated approach, quality control and flexibility in menu design
Has set a high standard for “casual dining” in the Greek market
Good and healthy foodSuperior service
(2008)
Leader in snack bars and the “on the go” market
30

3131Food Services & Entertainment – Main brands
The FS&E division has brands that satisfy a wide range of consumer dining needs
Goody’s, for fast casual dining both for lunch and dinner both on premises and recently available through delivery Flocafé, for good quality coffee and gourmet dishes in a nice ambiance from mid-morning on, for on-premises consumption Everest, for quick snacks and coffee on the go, throughout the day, for consumption both on and off premises
La Pasteria, for casual Italian diningFS&E is also active in the B2B food service through four subsidiaries:
Hellenic Catering supplies the Goody’s & Flocafe outlets and the HoReCa channel Select is a producer of bakery goods available to Goody’s, Flocafé and the HoReCa channelGreenfood produces the salads sold at the Group’s retail stores, and also sold to the organised tradeOlympic Catering offers products to the airlines for their in-flight catering and operates canteens in the airports
The FS&E business includes 8 brands FS&E service categories
31

3232Food Services & Ent – Leading market positions
Goody’s, Flocafé, and Everest are strong, recognised market leaders
Food service market
Coffee service market
Stores & System sales
2008
Goody’s # of stores 181
Flocafe # of stores 84
Everest # of stores 226
La Pasteria # of stores 21
Papagalino # of stores 19
Kuzina # of stores 2
TOTAL 533
€m 2008
Goody’s System Sales 220
Flocafe System Sales 60
Everest System Sales 125
La Pasteria System Sales 20
Other System Sales 8
TOTAL 433
32
Total Vivartia market share22.3%
Total Vivartia market share16.5%
11.1%
5.4%
5.6%
11.4%
66.5%
Flocafe Everest Starbucks Other Branded Unbranded Café
16.3%
6.0%
1.5%
5.5%
70.7%
Goody'S Everest Mc Donalds Other Branded Unbranded

3333Frozen Foods – Introduction
Competitive advantages & strategy
The Frozen Foods division has a strong competitive advantage as a result of effective brand management as well as a high quality product offering that have yielded a leadership market position that is difficult for new entrants to compete against
The division also holds a leadership position in the fragmented frozen dough market
Market leadership and scale have resulted in a cost competitive advantage
Frozen Food strategy
High brand equityStrong commercial
push in a fragmented market
Market leadership and scale
Cost advantage
Competitive advantage
Vegetables Dough
33

3434Frozen Foods – Main product categories
Basic frozen vegetables, and frozen meals sold under the Barba Stathis brand; holds a 65% market share
Frozen dough products, sold under Chrysi Zymi to retail stores (25% market share), and Elliniki Zymiproducts sold to the HoReCa channel
Fresh salads, sold under the Barba Stathis brand
The Frozen Foods business includes of 4 main product categories
Frozen Foods products
Dough products
Frozen vegetables Frozen meals
Fresh salads
34

3535Frozen Foods – Production network
Vivartia has an extensive production network of 4 Frozen Foods factories across SEE
Location Ownership Production activity
Sindos, Greece Owned Frozen vegetables
Sindos, Greece Owned Frozen dough
Plovdiv, Bulgaria Owned Frozen vegetables
Larissa, Greece Owned Marmalades
Frozen Foods factories
Sindos• Barba Stathis,
frozen vegetables• Arabatzis,
frozen doughLarissa
• Viomar,marmalades
Greece
Bulgaria
Plovdiv
• Barba Stathis,frozen vegetables
35

3636
Section 1
Attica Group
Section 4
36

3737Transportation sector - Attica
No 1 passenger ferry operator in the Eastern Mediterranean
Date of Investment : October 2007 MIG Ownership : 86.8%No 1 passenger ferry operator in the Eastern Mediterranean, owner of 100% of Superfast Ferries (the leading ferry operator in the Adriatic sea) and 100% of Blue Star (the leading ferry operator in Aegean sea)The Group’s vessels (13 in total) operate in domestic and international waters, offering connections between Greece and Italy in the Adriatic Sea (5 vessels), and between mainland Greece, the Cycladic and Dodecanese islands, and Crete (8 vessels). The Piraeus - Crete route started on 12th
March 2009The current market value of the fleet, net of all debt obligations stands at €442.1m while the average age of vessels is 11 years (7.2 year excluding the 3 older vessels of the group)
Youngest fleet in the domestic market
Attica Volumes for year 2008:
During the year the company carried 4m passengers, 275k freight units and 583k private vehicles
Company profile
Financial highlights (€m)
Fuel cost adjustment (a) n/m-EBITDA -31%69.6Sales +3%316.3
EBITDA (like-for-like) (b)
Reported net profit 61.7 -64%
2007 2008 Growth325.9
47.728.6
69.6 76.3 +10%22.3
Recurring net profit 21.7 -42%12.6Recurring net profit (like-for-like) (b) 21.7 +90%41.2Total equity 506.1 -1%502.8Net Debt 250.9 +10%276.4(a) Assuming fuel costs at the 2007 levels(b) Adding the fuel cost adjustment
37

3838Attica Group
Through its subsidiaries Superfast Ferries and Blue Star Ferries, Attica Group owns and operates modern and fast cruise-class and car-passenger ferriesAttica provides year-round transportation services to passengers, private vehicles and freight in the Adriatic Sea as well as in the Greek domestic market
38

3939Group corporate structure
As a result of a Mandatory Public Offer completed on 2nd January 2008, MIG and its subsidiaries own 86.8% of Attica GroupFollowing a triple merger completed in December 2008, Superfast Ferries and Blue Star Ferries are 100% owned by Attica Holdings S.A.As a result of the merger by absorption, Blue Star Maritime S.A. was delisted from the Athens Exchange in December 2008
100% owned 100% owned
Listed on the Athens Exchange Market capitalisation: €325m
39

4040Leading operator in the domestic market
Market shares 2008(a)
Passengers Freight units Private vehicles
(a) The market shares are derived from statistical data of the Greek Port Authorities
40

4141The fleet
Superfast Ferries 5 ships, all built after 20014 operate between Greece – Italy1 operates in the Piraeus – Heraklion, Crete route since 12th March, 2009
The newly built Superfast I, acquired in October 2008, operates in the Patras – Igoumenitsa - Bari routeSuperfast II will be delivered Autumn 2009 and will operate in the same route as Superfast I
Blue Star Ferries8 ships, of which 5 built after 20007 operate in the Greek Islands 1 operates between Greece – ItalyA successful turnaround story of an acquired and rebranded competitor
41

4242
* This figure was limited to 804 by the Greek law
Fleet specifications
Vessel Built Rebuilt Length overall (meters)
Speed (knots)
Passengers Berths / Air seats
Private vehicles
Freight units / Lane meters
Superfast I 2008 - 199.14 24.0 950* 374 / 118 100 140 / 2,505
Superfast V 2001 - 203.9 28.3 1,595 842 / 90 90 110 / 1,920
Superfast VI 2001 - 203.9 28.3 1,595 842 / 90 90 110 / 1,920
Superfast XI 2002 - 199.9 29.1 1,639 710 / 46 90 110 / 1,915
Superfast XII 2002 - 199.9 29.1 1,639 710 / 46 90 110 / 1,915
Blue Star Paros 2002 - 124.2 24.4 1,475 104 / 378 48 21 / 360
Blue Star Naxos 2002 - 124.2 24.4 1,473 104 / 378 48 21 / 360
Blue Star 1 2000 - 176.1 28.0 1,802 458 / 179 100 100 / 1,718
Blue Star 2 2000 - 176.1 28.0 1,890 430 / 349 100 100 / 1,718
Blue Star Ithaki 2000 - 123.8 24.1 1,313 22/275 126 21 / 360
Diagoras 1990 2001 141.5 21.0 1,468 424 / 236 75 50 / 625
Blue Horizon 1987 1999 187.1 22.5 1,510 582 / 119 67 110 / 1,850
Superferry II 1974 1992 121.7 19.5 1,530 70 / 330 130 24(12m)+ 4(10m) / 346
Superfast Ferries: Average fleet age 6 years - Blue Star Ferries: Average fleet age 15 years
The most modern fleet in the domestic market42

4343The routes
Greece - Italy
Superfast I (since October 08)
Superfast V
Superfast VI
Superfast XI
Blue Horizon
Scotland-Belgium
Blue Star 1 (discontinued Sept 08)
Cyclades
Blue Star Ithaki
Blue Star Paros
Blue Star Naxos
Superferry II
Dodecanese
Blue Star 2
Diagoras
Blue Star 1 (since October 08)
Crete
Superfast XII (since March 09)
International routes Greek Island routes
43

4444Recent corporate activity
Strategic & operational highlights of the year
In February of 2008, Attica’s shares were converted from bearer to nominalFour RoRo vessels were sold at a profit of €9.7m, resulting in a cash surplus of €24m for the 1st quarter 2008Triple merger of Attica Group with Superfast Ferries Maritime and Blue Star Maritime (now delisted) completedAcquisition of two new RoPax vessels (Superfast I and Superfast II), for €156m in June 2008, deliveries in October 2008 and Autumn 2009Discontinuation of the North Sea route, with rerouting of Blue Star 1 to the Piraeus-Dodekanese route from September 2008Financing arranged for Superfast I (€48m at 135bp spread, 40% equity) – September 2008Delivery of Superfast I and deployment in the Bari route – October 2008Decision to reroute Superfast XII to Piraeus-Heraklion route – December 2008; service commenced on 12th March 2009
44
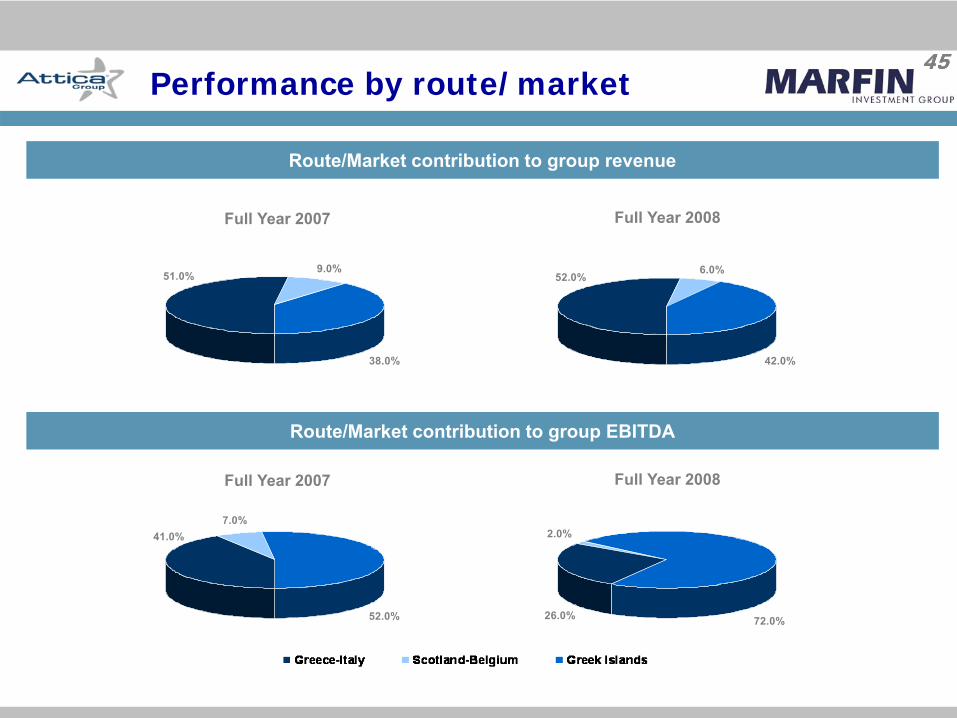
4545Performance by route/market
Route/Market contribution to group revenue
Route/Market contribution to group EBITDA
38.0%
9.0%51.0%
Full Year 2007 Full Year 2008
42.0%
6.0%52.0%
52.0%
7.0%41.0%
72.0%
2.0%
26.0%
Full Year 2007 Full Year 2008
45

4646Revenue/Cost breakdown
Attica Group revenue breakdown per traffic segment – FY 2007
Attica Group revenue breakdown per traffic segment – FY 2008
51.0%14.0%
35.0%
International Routes
22.0%8.0%
70.0%
Greek Islands Routes
36.0%
13.0%51.0%
71.0%
7.0%
22.0%
International Routes Greek Islands Routes
46

4747Revenue/Cost breakdown (cont’d)
Attica Group cost structure, as a share of operating expenses
Attica Group cost structure, as a share of revenue
12.0%
6.0%2.0%
12.0%
8.0%
24.0%
48.0%
Full Year 2007 Full Year 2008
9.0%
6.0%2.0%
10.0%
7.0%
18.0%
50.0%
7.0%
3.0%
1.0%8.0%
6.0%
14.0%
31.0%
6.0%
3.0%
1.0%8.0%
5.0%
14.0%
30.0%
47

4848Market: Greece – Italy
Full year 2008 traffic data
Passengers: 717,09333.2% Market Share - Rank: 1st
FY07: 727,742 passengers33.6% market share, rank: 1st
Freight units: 148,93030.2% Market Share - Rank: 1st
FY07: 141,339 freight units 30.9% market share, rank: 1st
Private vehicles: 137,310 27.2% Market Share - Rank: 2nd
FY07: 141,404 private vehicles 27.9% market share, rank: 2nd
Volumes and corresponding market shares for Attica are Superfast and Blue Star Ferries aggregates
Market shares data as per Greek Port Authorities and Attica data
13.1%
9.1%
21.3%23.3%
33.2%
22.2%
12.5%
17.6%17.4%
30.2%
10.2%8.1%
25.5%
29.0%
27.2%
Passengers
Freight Units
Private Vehicles
48

4949Market: Greece – Italy (cont’d)
Monthly load and revenue figures
Full Year 2007 Monthly average passengers and freight units
Monthly passenger/car and freight revenue4 Superfast and 1 Blue Star ferries
Monthly passenger/car and freight revenue4 Superfast and 1 Blue Star ferries
0
20
40
60
80
100
Jan Feb Mar Apr May Jun Jul Aug Sep Oct Nov Dec01002003004005006007008009001,000
Freight Units Passengers
0
20
40
60
80
100
Jan Feb Mar Apr May Jun Jul Aug Sep Oct Nov Dec01002003004005006007008009001,000
Freight Units Passengers
02,0004,0006,0008,000
10,00012,00014,00016,000
Jan Feb Mar Apr May Jun Jul Aug Sep Oct Nov Dec
Freight Revenue Passenger / Car Revenue
02,0004,0006,0008,000
10,00012,00014,00016,000
Jan Feb Mar Apr May Jun Jul Aug Sep Oct Nov Dec
Freight Revenue Passenger / Car Revenue
49
Full Year 2008 Monthly average passengers and freight units

5050Market: Greek Islands
Full year 2008 traffic data – Cycladic Islands (Santorini, Mykonos, Paros)
Attica operates 4 ships (avg. age 13 yrs) and serves 12 islands, daily and year-round, while the competition operates 17 ships (avg. age 18 yrs)
With 34.7% of total sailings in this market, Blue Star Ferries had:
49.3% in passenger traffic Rank: 1st
53.4% in freight unit traffic Rank: 1st
46.4% in private vehicle traffic Rank: 1st
Market shares data as per Greek Port Authorities and Attica data
30.7%
20.0%
49.3%
42.1%
4.6%
53.4%
34.7%
18.9%
46.4%
Passengers
Freight Units
Private Vehicles
50

5151Market: Greek Islands (cont’d)
Full year 2008 traffic data – Dodecanese Islands (Kos, Rhodes)
Attica operates 3 ships (aged 8 and 18 yrs) year-round, while the competition operates 2 ships (avg. age 35 yrs)
With 54% of total sailings in this market, Blue Star Ferries had:
78.0% in passenger traffic Rank: 1st
71.4% in freight unit traffic Rank: 1st
76.0% in private vehicle traffic Rank: 1st
*Following the discontinuation of the North Sea route, Blue Star 1 was rerouted to this market at end 2008
Market shares data as per Greek Port Authorities and Attica data
22.0%
78.0%
28.6%
71.4%
24.0%
76.0%
Passengers
Freight Units
Private Vehicles
51

525252Indicative 5-year potential
Projected potential traffic data 2013 and actual data 2008
52
2008A 2013F
Sailings 5,568 6,613
Freight units 276,055 351,508
Passengers 4,083,875 5,084,005
Private vehicles (all) 583,192 703,206
There are many factors influencing performance of a shipping group such as Attica; these factors include fuel costs, demand for tourism, acquisition or building of new vessels and new route deployment/utilisation
While we cannot disclose any details, based on the projected data above it is estimated that by 2013, it may be possible to achieve:
Approximately €90m in EBITDA, andApproximately €45m in net income
0
20
40
60
80
100
2008 2013
0
10
20
30
40
50
60
2008 2013
EBITDA
Net income
CAGR 14%
CAGR 15%

5353Outlook for the future
Attica is a holding companyOur expertise lies in quality shipping, transportation and leisureThrough strong and lasting growth, we are committed to adding value for the benefit of all our shareholdersWe plan to expand our business by adapting our presence according to market demandWe aim to play a bigger role in our home marketWe focus on constantly improving operational and bottom line profitability and generating positive cash flows to support our policy for higher dividend pay-out in the years to comeAlthough our route in Crete started just two months ago, we have already achieved:
27% of passenger traffic24% of private vehicle traffic13% of freight traffic
53
Market shares data as per Greek Port Authorities and Attica data

5454
Section 1
Hygeia
Section 5
54

55Hygeia – Healthcare sector
55
Leading private provider of integrated healthcare services in SEE Date of investment: January 2006
MIG Ownership: 33.3%Hygeia is a market leader in private hospital units in GreeceHygeia Group consists of 3 main divisions
Secondary Care: Hygeia General Hospital, Mitera S.A, Leto S.A, Achillion Hospital (Cyprus), Hygeia Hospital Tirana, Evangelismos Hospital (Cyprus), SAFAK Group (Turkey)Primary Care: Magnetic Health diagnostic S.A, Alpha LabCommercial Activities: Y-Pharma S.A, Y-Logimed S.A (procurement companies for pharmaceuticals and supply consumables & impantable devices respectively), Stem Health S.A, Stem Health Hellas S.A, Stem Health Unirea S.A Romania (Stem Cell banks)
9 hospitals are in full operation while 1 is under construction (Hygeia Hospital in Tirana). The total licensed bed capacity of the group as of Dec 31, 2008 was 1,548 beds, expected to be increased to 1,768 beds after the beginning of Hygeia Tirana Hospital’s operation (Jan 2010)
Company Profile
Financial Highlights (€m)
Net profit +75%11.9EBITDA +107%24.0Sales +116%130.3
Total equityNet Debt 78.0 +108%
2007 2008 Growth281.8
49.820.8
358.5 379.1 +6%162.3
55

56Hygeia – Group structure (a)
56
(a) Direct and indirect stakes as at 30 April 2009
56
Hygeia operates through three main divisions; Domestic, International, and Commercial Services

57Hygeia Group – History and key events
57
Key Dates Event1970 Establishment of Hygeia Hospital
June 2002 Listing in the ATHEX
January 2006 Marfin acquires 49% stake of Hygeia S.A.
April 2006 Hygeia acquires 24.8% of Mitera S.A.
December 2006 Mitera S.A. increases its stake to Leto S.A. from 34% to 72.4%
April 2007 Establishment of Y-Pharma S.A.
April 2007 Establishment of Stem Health S.A.
July 2007 Establishment of Hygeia Hospital Tirana Sha
November 2007 Hygeia increases its stake to Mitera S.A. to 98.6%
December 2007 Establishment of Stem Health Hellas S.A.
January 2008 Acquisition of Achillion Hospital Ltd. (Cyprus) 56.7% stake
July 2008 Acquisition of Evangelismos Hospital Ltd. (Cyprus) 60% stake
July 2008 Hygeia increases its stake to Achillion to 65.75%
September 2008 Establishment of Stem Health Unirea S.A. (Romania)
December 2008 Acquisition of Safak Group (Turkey) 50% stake
March 2009 Mitera S.A. increases its stake to Leto S.A. from 72.4% to 88.8%
57

58Hygeia – Healthcare sector
58
Key Events of 2008In January 2008 Hygeia concluded the acquisition of a 65.7% stake of Achillion Hospital in Limassol for €15.6mIn July 2008 Hygeia concluded the acquisition of a 60% stake of Evangelismos Hospital in Paphos for €7.1mIn July 2008 Stem-Health, a cell bank, commenced operationsIn September 2008 Stem-Health Unirea was established in Romania; it will commence operations in H109In December 2008 Hygeia concluded the acquisition of a 50% stake of Safak Group in Turkey. Safak Group controls 4 hospitals with 470 beds capacity in the metropolitan area of IstanbulIn view of the challenging macroeconomic environment Hygeia Group decided to realign its investment plan, proceeding only with committed investments that support sustainable organic growthIn this context Hygeia Group decided in December 2008 and Implemented in January 2009, the following initiatives:
Full redemption of the existing Convertible Bond of €306.0m on its first call (Jan 13, 2009). A share capital Increase of circa €83m, in favor of old Shareholders (to be completed in H2 09), followed by a new debt bridge financing
Year 2008 PerformanceFY2008 consolidated revenues increased by 116% y-o-y to €281.8m (Consolidated P&L is not directly comparable, due to the full-consolidation of Mitera-Leto Group, Achillion, Evangelismos and Safak Group)FY2008 EBITDA soared by 107.4% y-o-y to €49.8mEBITDA margin stood at 17.7% versus 18.4% in 2007 impacted by the integration costs of the newly acquired hospitals in Cyprus
58
Strategic & Operational Highlights of the year

59Hygeia – Mission, values, vision
59
Provide high quality services at the leading edge of medical science and technologyDevelop an integrated health services network in Greece, and in SEEPromote corporate integrity and social responsibilityServe as the recognised reference point for patients and medical staffContinue to be a reliable and responsible employerCreate value for our shareholders
Our ValuesCommitment toward patient safetyFocus on healthcare services delivery with dignity & respectProactive respect for the environmentHolistic approach toward patient carePromote medical ethics and the advancement of medical science
Our VisionTo become the largest private sector provider of integrated Healthcare services in SEE, the Mediterranean & theMiddle East
59
Our Mission

60Hygeia – Regional strengths
6060
Hygeia has taken steps to become the largest private sector provider of integrated healthcare services in SEE, the Mediterranean and the Middle East

61Hygeia – Long term strategy
61
Increased efficiency, reduction of length-of-stay (LOS)Cost containment, efficient internal controlOperating leverageExtract synergies from mergers and acquisitions, centralize suppliesSkew of revenue mix towards value added servicesModernise & upgrade key medical technologyIncrease emphasis on medical researchSupplement voids in the public health system
Greenfield expansion in SEE & the Middle EastMergers and acquisitions in Greece, SEE & the Middle EastFurther utilise relationship with Marfin Investment Group
Comprehensive hospital infrastructureOne-stop diagnostic servicesContinuation of best-in-class medical servicesBroaden outpatient servicesPioneer scientific advancementsDevelop new medical capabilities
OrganicGrowth
Geographicalexpansion in Greece and SEE
Business development
61
Hygeia has adopted the following strategies for long-term growth…

62Hygeia – Short term strategy
62
In light of the challenging macroeconomic environment, both globally and in particular in SEE,Hygeia Group has decided to realign its investment plans and implement a less aggressivestrategy in the short-term, by:
proceeding only with committed investments,and pursuing only selective acquisitions in the region that support sustainable organic growth,focusing on operating consolidation of the newly acquired companies,Fully extracting synergies that arise amongst the Hygeia Group of companies and the larger MIGfamily of companies
62
…while focusing on effectively managing its short term strategy

63Hygeia – Management views on strengths and initiatives
63
Experienced & proven management team; clearly recognised in the regionHigh brand awareness as a health organisation of high reputationDedicated and professional staffSuperior, leading customer serviceReliability - continuity of careContinuing education programsNew technologies and treatment protocolsScientific research contributions acknowledged domestically and internationally
Hygeia Group initiatives
Expand in SEE and replicate Hygeia’s successful business model, transferring know-how and technologyTake advantage of the fragmented domestic private sectorFocus on de-regulation of the domestic primary healthcare sectorFocus on de-regulation of the domestic pharmaceutical and pharmacy sectorsBenefit from increase in out-of-pocket healthcare spending of Greek & SEE citizens
63
Hygeia Group strengths

64Hygeia – The Greek healthcare market
64
Greek healthcare spending as a % of GDP stands at 9.1%The OECD countries average stands at 8.9%
Source: OECD 2008
64
10% 10% 10% 10% 10% 9% 9% 9% 9% 9% 9% 9% 9% 9% 8% 8% 8% 8% 8%8% 7% 7% 7% 7% 6% 6% 6%
11%11%
15%
11%
0%
2%
4%
6%
8%
10%
12%
14%
16%
18%
U.S.
A.Sw
itzer
land
Fran
ceGe
rman
yBe
lgium
Portu
gal
Austr
iaCa
nada
Denm
ark
The
Neth
erlan
dsN.
Zea
land
Swed
enGr
eece
Icela
nd
Italy
OECD
Ave
rage
Austr
alia
Norw
aySp
ain U.K
.Hu
ngar
yFi
nlan
dJa
pan
Irelan
dLu
xem
burg
Slov
akia
Czec
hM
exico
Kore
aPo
land
Turk
ey
Healthcare spending per GDP in OECD countries

65Hygeia – The Greek healthcare market (cont’d)
65
Greek private sector spending represents 38.4% of total spendingThe OECD countries average private sector spending stands at 27%USA private sector accounts for 54.2% of total healthcare spending
Source: OECD 2008
65
38% 38%
33%30% 30% 29% 29% 29% 29% 28% 27% 26% 24% 24% 23% 23% 22% 22% 20%
18% 18% 18% 16% 16%13% 12%
9%
40%
54%56%
45%
0%
10%
20%
30%
40%
50%
60%
Mex
icoU.
S.A.
Kore
aSw
itzer
land
Gree
ceTh
e Ne
ther
lands
Austr
alia
Polan
dCa
nada
Portu
gal
Hung
ary
Spain
Turk
eyBe
lgium
OECD
Ave
rage
Slov
akia
Finl
and
Austr
iaGe
rman
yIta
lyN.
Zea
land
Irelan
dFr
ance
Japa
nSw
eden
Islan
dNo
rway
Denm
ark
U.K.
Czec
hLu
xem
burg
Percentage of private healthcare spending in OECD countries

6666Hygeia – The Greek healthcare market (cont’d)
Private hospital and diagnostic center revenues reached €1.79bn, increasing 19% y-o-y, while the CAGR for the period 1997-2007 was 13.4%
Source: ICAP 2008, OECD 2008, NSS Revised Data July 2008
Growth trends in Greek hospitals
It is estimated that in the following 2 years, the CAGR of private general hospitals will be 16-18% y-o-y, while maternity hospitals will grow by 9-11% y-o-y and primary care by 10% y-o-y due to the following catalysts:
Ageing population: population over age 65 is 18.6% versus 13.8% in 1991; according to NSS, by 2030, 24% of population will be above 65-years oldIncreasing life expectancy: life expectancy stands at 79.3 years from 77.2 years in 1991Under-insured population: circa 10% of the population have private insuranceHighest proportion of smokers in the OECD: 38.6% of the population vs 24.3% OECD averageAround 22% of adults are classified as obeseHigh impact of immigration: approximately 1m immigrants live in Greece, overwhelming public sector hospital capabilitiesThe chronic inefficiency of the public healthcare systemleaves ample room for private sector; only 18% of population is satisfied with public sector care versus 56% E.U. averageTwo-tier private sector with very few players offering high-end services and a large number low-end players that substitute the public sectorPoor quality health care services outside the main Greek cities (Athens & Thessaloniki)Highly fragmented private sector
53.6% 52.9% 52.1% 51.6%
15.8% 16.1% 16.5% 15.5%
8.2% 8.7% 9.3% 9.5%
9.5% 10.0% 10.2% 10.7%
12.7%11.9%12.2%12.9%
0%
20%
40%
60%
80%
100%
2004 2005 2006 2007
Other IATRIKO IASO EUROMEDICA HYGEIA GROUP
More than 200 players none of them above 5% market share
66
Market share of private healthcare institutions

67Hygeia – Group hospitals
67
Hygeia Group has a portfolio of 9 hospitals in SEE, with a total licensed bed capacity of 1,548; of these, 3 hospitals are in Greece, 4 are in Turkey and 2 are in Cyprus With the conclusion of build of the new hospital in Albania by the end of 2009, the Group will have 10 hospitals with a total licensed bed capacity of 1,768 beds
Hygeia Group will have 71 operating theatersHygeia Group will have 42 delivery roomsHygeia Group will have 22 Intensive Care Units (148 beds)
During 2008, over 65,000 operations were performed and more than 21,500 babies were born in Hygeia Group hospitalsHygeia Group is the largest obstetrics and gynecology group in Greece with more than 17,500 Greek deliveries, implying a 16% market share Inpatient admissions c. 108,000 per annumOutpatient visits c. 840,000 per annum
67
The Hygeia Group has an impressive portfolio of leading state-of-the-art hospitals

68Hygeia – Group hospitals (cont’d)
68
D.T.C.A. Hygeia General Hospital is a state-of-the-art general acute care hospital of 40k m2, in the northern suburbs of Athens, in close proximity to AIA and the ports of Lavrio & Rafina. The hospital is licensed for 369 beds, has 17 operating theaters and 4 Intensive Care UnitsMitera Maternity Hospital is a state of the art Maternity, Gynaecology and General Hospital of 35k m2, adjacent to HYGEIA. The hospital is licensed for 442 beds, has 19 operating theaters, 22 delivery rooms and 3 Intensive Care Units Leto Maternity Hospital is a state of the art Maternity and Gynecology Hospital of 6.5k m2, close to Athens’ center. The hospital is licensed for 110 beds, has 7 operating theaters, 7 delivery rooms and an Intensive Care UnitAchillion Hospital was built in 2004 and is a 7k m2 facility with a licensed capacity of 86 beds in Limassol, Cyprus. The hospital has 8 operating theaters, 5 delivery rooms and an Intensive Care UnitEvangelismos Hospital was built in 2003 and is a 6.2k m2 facility with 71 licensed beds, in Paphos, Cyprus. The hospital has 3 operating theaters, 2 delivery rooms and an Intensive Care Unit
68
Hygeia Group hospitals: in detail

69Hygeia – Group hospitals (cont’d)
69
Avrupa Safak General Hospital is a state-of-the-art general acute care Hospital of 8.5k m2 that was established in 1998 in Gaziosmanpasa, Istanbul. The hospital is licensed for 180 beds, has 5 operating theaters, 2 delivery rooms and 4 Intensive Care UnitsJFK Hospital commenced operations in December 1999 and is a 9k m2
facility with licensed capacity of 126 beds in Besyuz Evler, Istanbul. The hospital has 5 operating theaters, 2 delivery rooms and 3 Intensive Care UnitsGoztepe Safak Hospital commenced operations in April 2004 and is a 6.8k m2 facility with licensed capacity for 87 beds in Goztepe, Istanbul. The hospital has 4 operating theaters, 2 delivery rooms and 3 Intensive Care UnitsIstanbul Safak commenced operations in January 2005 and is a 2.5k m2
facility with licensed capacity for 77 beds in Gaziosmanpasa, Istanbul. The hospital has 3 operating theaters, 2 delivery rooms and 2 Intensive Care UnitsHygeia Hospital Tirana will be the 1st integrated private hospital in Albania and is expected to commence operation in 2010. The 220-bed hospital will be a circa 25k m2 state-of-the-art facility on a main traffic artery of Tirana
69
Hygeia Group hospitals: in detail

70The sector leader in cutting-edge technology
70
Linear Accelerator ELEKTA AXESSETM
Hygeia is the 1st hospital in Europe to install the Elekta Axesse linear accelerator, and among the first globally. Hygeia’s Radiation Oncology Department will use the Elekta Axesse to offer the latest treatment modalities
da Vinci® S Robotic Surgery System, (Intuitive Surgical – da Vinci)This is the latest generation da Vinci S Robotic Surgery System and the 1st and only one to be installed in Greece. This device allows surgeons to perform a variety of surgical procedures using the most modern and precise techniques. The 1st
coronary artery bypass graft operation using the da Vinci S Robotic Surgery System was successfully performed at Hygeia in 2008
Open Magnetic Resonance Imaging Device with high field uniformity 1.0T (Philips Ambient Experience)
The Mitera General, Obstetrics & Gynecology and Pediatrics Clinic possesses the most advanced medical imaging technology with this new Magnetic Resonance Imaging (MRI) system. This MRI allows high definition images to be captured very quickly in a totally patient-friendly, open ambient environment
70

71The sector leader in cutting-edge technology (cont’d)
71
Hemodynamic-Angiographic and Electrophysical LaboratoryThis laboratory provides the capability for complex diagnostic examinations and invasive procedures and operates in the Mitera Pediatric Cardiac Surgery Clinic. The laboratory is in an ideal location near both the pediatric cardiac surgery intensive care unit and the pediatric cardiology & cardiac surgery unit. This laboratory is the only one of its kind in Greece treating pediatric arrhythmias
Gamma Knife (Elekta-Leksell Gamma-Knife C)This represents the most sophisticated device for treating life-threatening cancer tumors of the brain. The Leksell Gamma Knife allows these extremely complex neurosurgical procedures achieve a precision of 0,3mm. Hygeia has performed over 500 of these therapies with a success rate exceeding 95%
PET/CT (Siemens-Biograph PET-CT)Hygeia’s PET-CT Department was the first to be established in 2004 and to achieve ISO 9001:2000 certification. The PET-CT is an imaging device for patients diagnosed with cancer. In such, the PET-CT Department works very closely with Hygeia’s Radiation Therapy and Oncology Center to ensure the patient receives the best care possible. The Department has successfully conducted over 2,400 PET-CT examinations
71

72Hygeia – Group personnel and KPIs
72
The Hygeia Group has over 8,000 physicians and staff encompassing nearly 50 different specialties, of which:
3,659 nurses, administrative and other402 salaried physicians4,019 cooperating physicians
In the last year, we have dedicated over 40,000 training hours to our personnel; staff turnover has dropped from 24% in 2007 to 6.5% in 2008 The vast majority of our physicians have received all or part of their medical education & training in the United States and the UKOur objective is to continue our strategy of attracting the highest caliber physicians from abroadThe Hygeia Group will be the first healthcare group to receive the JCI Accreditation in Greece, forthcoming this year
Hygeia Group 2004 2005 2006 2007 2008Inpatients 14,536 14,893 15,144 49,501 108,257change y-o-y 2.5% 1.7% 226.9% 118.7%Outpatient Visits 66,221 69,581 77,398 321,271 839,609change y-o-y 5.1% 11.2% 315.1% 161.3%# of Deliveries 0 0 0 16,043 21,546change y-o-y 34.3%Length of Stay (Days) 4.54 4.48 4.47 3.50 3.04Occupancy Rate 71.0% 71.9% 73.0% 66.0% 71.1%
72
The Hygeia Group has over 8,000 physicians and staff contributing their skills and services to its patients

73Hygeia – Group revenue analysis
73
The Hospital Services business unit accounts for 91.4% of group salesHygeia, Mitera & Leto Hospitals account for circa 87% of salesRevenues from third countries accounts for 5% of group sales, since Achillion & Evangelismos were consolidated in 1Q08 & 3Q08 and Safak Group since Dec. 08 for the first timeWith the consolidation of Safak Group, SEE participation in 2009 will increase substantially
91.4%8.6%
Hospital ServicesPrimary Care & Commercial Services
Business units
2.6%
1.8%
7.0%0.6%
8.6%
30.8%
47.1%
Hygeia Mitera LetoAchillion Evangelismos Y-PharmaSafak
Companies
95.0%
5.0%
Greece Abroad
Geographical
73

74Hygeia – Group financials (a)
74
(a)2004-2008 under IFRS
Income Statement (€m) 2002 2003 2004 2005 2006 2007 2008Revenues 74.0 68.9 79.2 83.6 94.6 130.3 281.8change y-o-y -6.8% 14.9% 5.5% 13.2% 37.8% 116.2%EBITDA 14.7 8.9 6.3 6.8 11.6 24.0 49.8change y-o-y -39.6% -28.8% 7.5% 70.6% 106.6% 107.5%margin 19.9% 12.9% 8.0% 8.1% 12.3% 18.4% 17.7%EBIT 9.2 4.3 -1.0 -0.3 5.1 16.6 33.9change y-o-y -53.0% n.m. n.m. n.m. 223.9% 104.4%margin 12.4% 6.2% -1.3% -0.3% 5.4% 12.7% 12.0%EBT 7.9 2.9 -3.0 -2.2 3.0 16.4 15.6change y-o-y -63.6% n.m. n.m. n.m. 450.6% -5.0%margin 10.7% 4.2% -3.8% -2.7% 3.2% 12.6% 5.5%Net Income 5.0 0.9 -1.5 -2.3 1.0 12.1 21.1change y-o-y -82.9% n.m. n.m. n.m. 1053.8% 74.5%margin 6.8% 1.2% -1.9% -2.8% 1.1% 9.3% 7.5%
Balance SheetNet Fixed Assets 64.6 76.3 103.3 98.9 94.3 316.0 373.1Working Capital 3.8 3.1 -1.5 -1.9 0.4 6.5 -0.2LT Assets 0.2 0.2 2.3 2.2 73.4 198.4 241.7Total Assets 68.7 79.6 104.0 99.3 168.1 520.9 614.6Net Debt 24.0 35.4 41.6 44.7 38.5 78.0 162.3LT & Other Liabilities 0.3 0.3 12.8 14.6 28.8 111.2 112.1Equity 44.4 44.0 49.6 40.0 100.8 331.6 340.1Capital Employed 68.7 79.6 104.0 99.3 168.1 520.9 614.6
Financial RatiosWC/Sales 5.2% 4.6% -1.9% -2.2% 0.5% 5.0% -0.1%Net Debt / EBITDA 1.6 x 4.0 x 6.6 x 6.6 x 3.3 x 3.3 x 3.3 x
Current Assets / Current Liabilities 0.9 x 0.7 x 0.5 x 0.5 x 0.7 x 0.6 x 0.7 xInterest Coverage (EBITDA/Interest Expenses) 11.2 x 6.2 x 3.2 x 3.3 x 2.5 x 7.4 x 1.7 x
74

75Hygeia – the future
75
The Hygeia Group has focused its efforts to creating the highest quality private healthcaregroup in SEE, the greater Mediterranean, and the Middle East
Clearly defined long-term strategyStrong shareholder structureStrong and stable financialsHigh brand awareness, excellent reputation in both the public as well as within the medical fieldManagement team with international background & training and significant experience in the sectorHighest-caliber physicians and high quality support personnel
The Hygeia Group is well equipped to be the leading healthcare provider in the region
75

7676
Section 1
SingularLogic
Section 6
76

7777
The leader in the highly fragmented local IT market with a diverse base of more
than 40,000 SME clients, 500 Large Enterprises and more than 100
Multinational Clients
Date of Investment: December 2006MIG Ownership: 31.2%Singular Logic is a leading player in the Greek BusinessSoftware market providing integrated solutions for the privateand public sectors, in Greece and abroad through threedynamic business divisions
Singular Logic has a large and reputable customer base ofGreek and international companies serviced on the back offocused and competent offerings developed alongsidepowerful partners
Company Profile
IT Sector
EnterpriseDIS (Corporate)
SingularLogicSoftware (SMEs)
SingularLogicIntegrator
(Public Sector)
Enterprise solution provider for the private sector using both own brand and third party
software
Leading software vendor for small and medium enterprises
Service provider for system and software
integration projects for the public sector
“Oracle EE & CIS Partner of the Year 2008 - Enterprise Application Partner Award”
“ΙΒΜ Business Partner Sales Leadership Achievement Award, IBM Retail Store Solutions 2007 – Europe”
Financial highlights (€m)
Net profit +370%2.0EBITDA +69%10.1Sales +31%81.9
Total equityNet Debt/(Cash) -6.0 +61%
2007 2008 Growth107.0
17.09.5
54.2 62.8 +16%-9.6
77

7878
Strategic & Operational highlights of the year
During the last year, SingularLogic has performed a successful financial turnaround which is demonstrated in all 2008 financial metrics:
FY2008 consolidated sales soared to €107.0m presenting a substantial increase of 31% compared to FY2007 (€81.9m)Consolidated FY2008 EBITDA reached €17.0m versus €10.1m in FY2007 representing a robust uplift of 69% The EBITDA Margin of the year increased by 361 bps to 15.9% vs 12.3% in 2007Consolidated FY2008 EBT posted an impressive increase reaching €11.5m compared to €3.5m in FY2007FY2008 Net Profits after Tax presented a substantial growth of 370% versus FY2007 amounting to €9.5m FY2008 Net Profits after Tax and Minorities amounted to €8.7m, 510% higher than FY2007In FY2008 SingularLogic preserved a strong financial structure with a highly liquid balance sheet which is illustrated through its strong net cash position of €9.6m (€36.9m cash vs €27.3m debt)
SingularLogic is continuously working towards the realisation of synergies with other MIG group companies. During 2008, Hygeia Group’s IT requirements were fully outsourced to SingularLogic. Similarly, the company has been working closely with MPB, Attica and Vivartia and it will be providing valuable IT solutions support to the newest company of the group, Olympic
IT Sector78

7979
SingularLogic has outperformed its competitors in all profitability figures(1), accounting for more than 1/3 of thesector’s Net Income and possessing the healthiest cash position(2) in the industry
The undisputed leader in the Greek IT sector
1. SingularLogic achieved the highest EBITDA in terms of absolute number (€17m) and a significant EBITDA growth ratio of 69.2%, unsurpassed in the sector, together with the highest Net Income after minority rights of €8.7m, which grew by +510% vs. 2007, the highest growth of all listed companies
2. As of 31.12.2008, the company held the highest cash reserves in the sector, at €36.9m
3. Figures in blue or red refer to Net Income figures for 2008
EBITDA Growth ‘08
Sales growth ’08/’07 Size of circle = latest available revenues, €m
797979
€9.5m
€0.9m
€1.1m
€1.7m€1.7m
(€27.0m)
(€7.0m)(€151.5m)
€1.2m
€2.3m
€1.0m
Negative band not drawn to scaleSource: FactSet, Company accounts
79

8080
SingularLogic has a clear focus on software services and is ranked No 1 in the Greek market
Focus on software
Business Software LicensingBusiness Software Maintenance and Services
31%
8% 7% 7% 6%3%
38%
Sing
ular
Logi
c
SAP
Alte
c
Rea
l C
onsu
lting
Prof
ile
Q&
R
Oth
er
27%
20%
13%9% 8%
5%
17%
Sing
ular
Logi
c
SAP
Alte
c
Rea
l C
onsu
lting
Prof
ile
Q&
R
Oth
er
80

8181
SingularLogic operates through three divisions, structured around a customer-centric approach
Main operating divisions
Finance HR Strategy & Corporate Marketing IT R & D
e-government
Transportation
Defence
Health
Regional government
ERP
Commercial Packages
Accounting Packages
Payroll / HR
CRM
Hotel
BI
Retail
Consumer Industrial Services
Account management
Strat. ProductDevelopment
Services
Project mgmt
Development
Marketing
Financial
Retail Enterprises
Business Outsourcing
Services
Account management
Strat. ProductDevelopment
Network support
Training
Development
Marketing
Account management
Strat. ProductDevelopment
Services
Project mgmt
Development
Marketing
TelecomsNational Elections
81

8282
SingularLogic operates through three divisions, structured around a customer-centric approach
Main operating divisions (cont’d)
Strategic technological partner & business integrator for large enterprises & organizations in the private sector in Greece and abroad
25 years of expertise in offering integrated own developed or internationally represented IT solutions500 large and 100 international companies from all business domains (Consumer/Industrial/Services, Retail, Financial, Telco Institutions, Healthcare)Customisation & system integration to support every business need (ERP, CRM, BI, EAI, etc)
Powerful national network behind the most reliable and complete product offering for small to medium enterprises
The largest installed base with more than 80,000 active installationsThe largest distribution network with more than 500 business partnersComplete product portfolio covering more than 10 business areas
Long standing, successful track record behind large scale IT projects for the Public Sector
Elections for the last 27 yearsIntegrated Information System for GDDIA, €5mAir battle control system for Lockheed Martin, €12.5m The largest public sector project in Greece for 2008 (heating petrol chain –IFESTOS, MoE)More than 300 local authorities customers and more than €15m projects in Regional Public AdministrationElectronic Urban Planning I-II-III
82

8383
SingularLogic attracts a diverse base of more than 80,000 SME clients, 500 large enterprises and more than 100 multinational clients
Large and diverse client base83

8484
SingularLogic utilises unique salesforce models
Large and diverse client base (cont’d)
4,000
15,000
140,000
650,000
Breakdown of businesses in Greece
Corporate and public sector
Large SMEs (average revenue €2.5m)
Small SMEs (average revenue €0.7m)
Professionals
Source: SingularLogic
• Over 50 expertly trained account managers dedicated to each major corporate segment (telco, retail, financial, consumer) and major public sector organisations
• Largest and most geographically extensive sales network of over 500 dealers, managed and expertly trained and coordinated by Singular Logic
84

8585
SingularLogic offers its clients a strong portfolio of 3rd party products developed by major international vendors
Large and diverse client base (cont’d)
IP Office Compact Contact CenterApplication Enablement ServiceIP Office Professional EditionIP Office Standard EditionDistributor of the Year Excellence 2008
Platinum Partner
85
8686
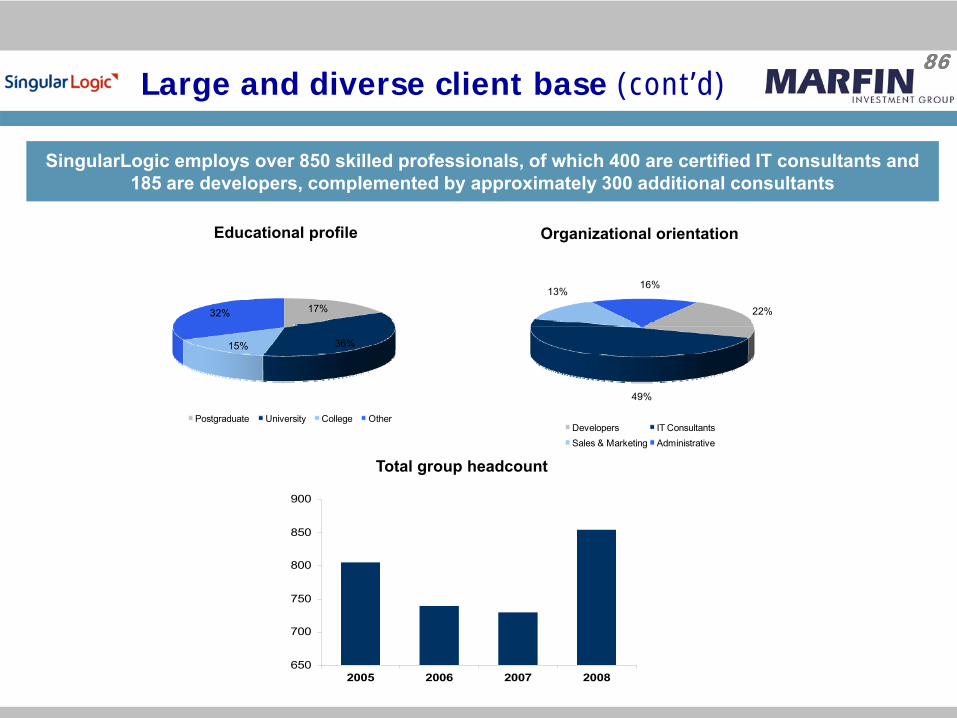
SingularLogic employs over 850 skilled professionals, of which 400 are certified IT consultants and 185 are developers, complemented by approximately 300 additional consultants
Large and diverse client base (cont’d)
Educational profile Organizational orientation
650
700
750
800
850
900
2005 2006 2007 2008
Total group headcount
86
17%
36%15%
32%
Postgraduate University College Other
22%
49%
13%16%
Developers IT ConsultantsSales & Marketing Administrative

8787
Three years ago two historical leaders with underperforming operations, and the late partial control of MIG joined forces to create a new IT leader – significantly improving profitability
SingularLogic – Result of a merger
Revenues (€m) EBITDA (€m)
Net income (€m)EBIT (€m)
(4.7)
1.0
10.1
17.0
-10
-5
0
5
10
15
20
2005 2006 2007 2008
(13.3)
(7.7)
2.0
9.5
-15
-10
-5
0
5
10
15
2005 2006 2007 2008
68.5
45.6
81.9
107.0
0
20
40
60
80
100
120
2005 2006 2007 2008
(10.0)
(2.5)
4.7
13.2
-15
-10
-5
0
5
10
15
2005 2006 2007 2008
87
8888
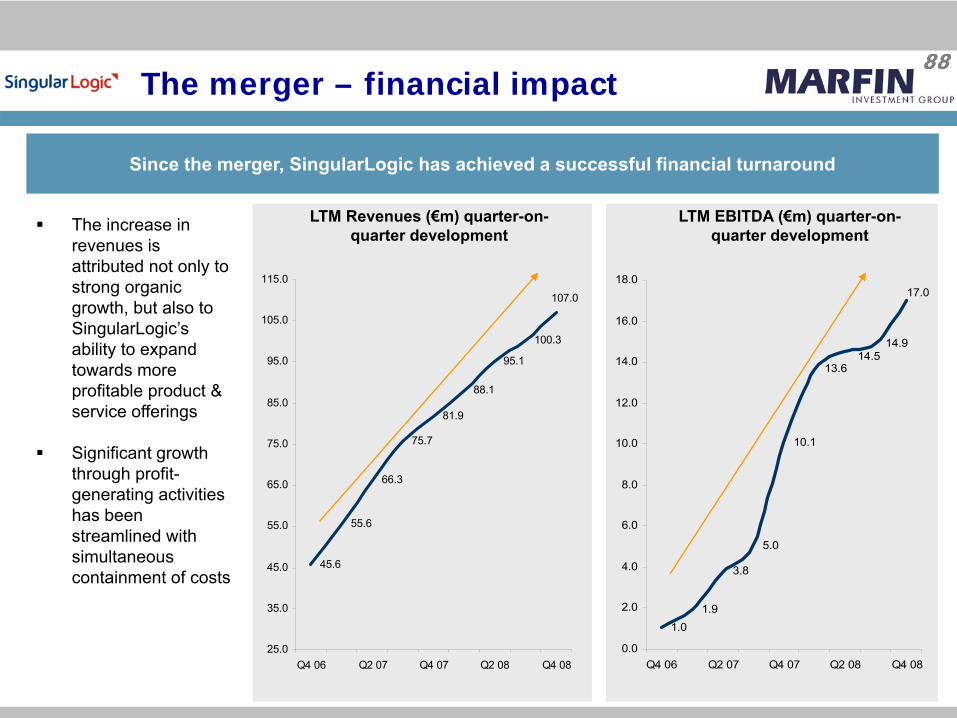
Since the merger, SingularLogic has achieved a successful financial turnaround
The merger – financial impact
LTM EBITDA (€m) quarter-on-quarter development
LTM Revenues (€m) quarter-on-quarter developmentThe increase in
revenues is attributed not only to strong organic growth, but also to SingularLogic’s ability to expand towards more profitable product & service offerings
Significant growth through profit-generating activities has been streamlined with simultaneous containment of costs
45.6
55.6
66.3
75.7
81.9
88.1
95.1
100.3
107.0
25.0
35.0
45.0
55.0
65.0
75.0
85.0
95.0
105.0
115.0
Q4 06 Q2 07 Q4 07 Q2 08 Q4 08
1.01.9
3.8
5.0
10.1
13.6
14.9
17.0
14.5
0.0
2.0
4.0
6.0
8.0
10.0
12.0
14.0
16.0
18.0
Q4 06 Q2 07 Q4 07 Q2 08 Q4 08
88

8989
SingularLogic has experienced strong growth across all divisions
Revenue analysis
Turnover divisional breakdown, 2008 (€m)Turnover (€m)
39.5
20.122.0
51.5
29.725.7
0
10
20
30
40
50
60
Enterprise Integrator Software
2007 2008
30%
48%17% 51.5
25.7
29.7
Enterprise Integrator Software
89

9090
SingularLogic has had high growth across high-margin targeted product categories
Revenue analysis (cont’d)
Turnover breakdown by product, 2008 (€m)Turnover (€m)
12.9
20.9
31.8
16.116.1
22.4
53.9
14.4
0
10
20
30
40
50
60
Licenses Maintenance Services Hardware &System Software
2007 2008
25%
7%
69%
(11%)
14.4 16.1
53.9
22.4
Licenses Maintenance
Services Hardware &System Software
90

9191
Focused strategy of innovation, increased customer utilisation and cost consciousness
Strategic plans
Capitalising on internal group
clients
SingularLogic
Market share gains and increased
penetration Through new
product development efforts
International distribution of new products
Through agreements with major
international vendors
Further selective consolidation in
sector Profitable high-growth potential
targets
Strong pipeline in place
Momentum in both private and public
sectors
Initiation of 4th CSFP
Through significantly reduced competitive
pressure
91
Capitalising on internal group
clients
Market share gains and increased
penetration Through new product development efforts
Strong pipeline in place
Momentum in both private and public
sectors

9292
SingularLogic will focus on development of outsourcing and other value-added services
Areas of interest:Disaster recovery and business continuity servicesOutsourced customer support servicesApplication service provisionValue added services (mobile applications & communication enabled solutions)Business process outsourcing
Advanced software solutions and servicesProduct innovation through Galaxy, the latest state-of-the-art technology platformNew offerings
Retail, RestaurantCRM/Payroll: SaaS, IP telephony: Avaya CEBP offeringsICTM offerings: Alert Server, Voice & Web Shop, Digital Signage Easy Pack, Credit Assist, etc.E-securityJoint ICT offerings with WIND
Expanded Revenue streamsSOA service initiatives (Stock online, Data exchange, alerting)Opportunities from large customer base (upgrades, cross sell, up sell)Business Benefit program to attract the competition’s clientsInternational expansion in SEE through network developmentDistribution agreements with large international vendors (global market reach)
Strategic plans (cont’d)92

9393
Public sector modernisation projects are expected to provide further opportunities to the IT sector
Strategic plans (cont’d)
SingularLogic will target opportunities in the following major business categories:
National Elections, Efaistos, FosOffsets / Defense – surveillanceExpansion of the Forest Fire Detection SystemFurther business opportunities in CyprusPreparation for Espa bids/projects – H2 ’09PPP expected projects – Army supplies warehouse, Port Security, Health cardGovernment issues / needs – 3% rebate medicines, Payroll for public sector, consolidation of socialsecurity agencies, tourism, Ministry of Health, local registriesInnovative solutions – FOS, surveillance, IVR/SMS, simulators
93

9494
Section 1
Olympic
Section 7
94

95The transaction perimeter
Pantheon MRO
Brand name and logoSlots in Heathrow, Gatwick, JFK, Fiumicino, Frankfurt, Charles de Gaulle, Linate, Bucharest, Brussels
Long-term leases for 2 MRO hangars located at Athens Intl Airport (‘AIA’), expiring in 2026 Selected MRO equipment
Minimum Assets
€ 45.7m € 16.7mMIG’s offer
Additional slots, certain aircraft, IT systemsOther flight-related assets from OAS, prior to its liquidation
Additional MRO equipmentIT systemsAdditional
Assets
Ground Handling
Rights for the provision of handling services at 5 main liberalised Greek airportsLeases for AIA cargo and other facilities
€ 44.8m
Additional ground handling equipmentAdditional cargo equipment
MIG has acquired a number of commercially significant assets, free of any obligations, at a very attractive price of €107m
95

96The transaction
In February / March 2009, MIG participated in the privatisation of selected assets of the financially distressed Greek state-owned air carrier previously known as Olympic AirwaysFor more than 25 years, Olympic Airways had operated in a very inefficient manner, by and large relying on state aid (through government subsidies and indirect lifelines)The government’s previous privatisation attempts (during 2000-1 and then in 2004-5) had failedIn 2008, the structure of the privatisation process was altered and the business was separated in three ‘asset groups’. Bidders were invited to submit separate offers for each of them: Flight Operations (‘Pantheon’), Technical Base Assets (‘MRO’) and Ground Handling (‘GH’)On 4 February 2009, the Interministerial Privatisation Committee announced the failure of the privatisation process for the third time and made a public appeal towards Greek business and investment groups to express their interest in acquiring the national air carrier and enter into direct negotiations with the governmentThe following day, MIG announced its intention to participate in the direct negotiation process for the acquisition of the Greek national air carrierOn 13 February 2009, MIG submitted a binding offer for Pantheon for €45.7m, and for the MRO assets for €16.7m. As a result, the Interministerial Privatisation Committee granted MIG exclusivity until 6 March 2009
Upon the end of the exclusivity period, the Government’s advisers endorsed MIG’s offer. At that time, MIG also committed to also acquire the Ground Handling Services assets for the minimum price of €44.8m, should the government’s negotiations with Swissport not consummateMIG also paid €60m, the equivalent of Pantheon’s cash balance at the timeOn 23 March 2009, MIG and the Hellenic Republic signed all legal documentation regarding the completion of the acquisitions of the three businessesPost ratification of the agreements by the Greek Parliament, MIG became a 49% shareholder in the 3 businesses
96

97
Strong brand recognition and intangible sentimental value for Greek consumers
Very significant synergetic potential with other MIG investments while overall transaction size is fairly limited
A historically inefficient operation, that nevertheless retained a solid market position and produced sizeable revenues
A substantially inflated cost base with obvious elements of ‘fat’ that can be mitigated relatively easily
Complementary operations between Pantheon, the MRO and Ground Handling businesses
We have acquired an obligation-free operation and maintain strategic and operational flexibility on key decisions vis-à-vis inter alia fleet, network, employee recruiting
The new companies will in no way be associated with the old liabilities of Olympic
Transaction highlights
A very compelling investment proposition…
Pressure from the European Commission to complete the deal and the lack of investor appetite, by and large due toconvoluted transaction structure and gloomy history, presented MIG with the opportunity to acquire highly valuable assets(logo, slots) at relatively distressed valuations
Acquisition at or near the bottom of the cycle, which provides a strong cost advantage and higher degree of flexibilityversus the competition
Significant untapped ancillary revenue potential
…supported by the numerical analysis
We have effectively acquired the right to use Olympic’s broadly recognised brand name into perpetuity but have assumed no obligation whatsoever
97

98A well-structured transition phase
Feb-
09
Apr
-09
1 O
ct-0
9
Announcement of MIG’s interest
Initial Closing: MIG acquires
49% of NewCos
Transition Period
Final Closing: MIG acquires
100% of NewCos
Acquire additional assets from old OlympicApply for additional slots, bilateral designations, licences, AOCRecruit personnel, launch trainingNegotiate leases and/or order planesParticipate in tenders for PSO routes Participate in tenders for licences for ground handling services at newly liberalised airportsNegotiate and close commercial agreements for all 3 businesses
MIG gradually (49% at first and 100% eventually) acquires the share capital of three ‘NewCos’, one for each businessThis ensures no connection between the old Olympic (and its obligations) and the new aviation group
98

99Roadmap to success
Pantheon MRO
Re-establishment of Olympic as a reliable, punctual carrierOngoing yield and revenue managementNetwork and schedule optimisationFleet rationalisationOpEx optimisation Fuel hedgingCommercial agreementsFrequent Flyer Programme
Re-establishment as a reliable, credible vendorExpansion of 3rd carrier revenuesVision to capture vacant role of maintenance hubIncrease utilisationof MRO facilitiesCommercial agreements
Key strategic initiatives
Ground Handling
Maximisation of foreign carrier revenuesCost base rationalisationUtilisation increase for cargo facilitiesMaximisation of synergies with other parts of OlympicCommercial agreements
2-3 years 1 year 1-2 years
99

100A unique geography and topography
High number of islands, dispersed across a large geographic area
A disproportionately large number of tourist destinations, mainly because of very long coastline
Sub-optimal rail and highway networks
Economic and public administration activity concentrated in 2 urban centres, Athens and Thessaloniki
Strategically located between Western Europe, Eastern Europe, the Middle East and North Africa
Aviation in Greece is both an infrastructure and a leisure play
Greece has the potential to become a regional hub
100

101
Steady revenue flows
Vast synergetic potential (indicative)
MRO
Ground Handling
Other Airlines
RetailTransportation Tourism
Banking
IT
101
Healthcare
102102
Section 1Section 8
102
Marfin Popular Bank
The GroupKey operating highlightsEconomic outlookFull-year 2008 results overview

103103Marfin Popular Bank Group (MPB) major milestones
103
MPB acquires 99% of Marine
Transport Bank, Ukraine
Marfin acquires SBM Bank of
Estonia
Egnatia acquires BNP-Dresdner Romania
Laiki Hellas founded
Egnatia Bank established
Laiki Bank of Cyprus
established
MPB acquires 43% of Malta Lombard
Bank
Marfin acquires Piraeus Prime
Marfin acquires Hellenic
SecuritiesMarfin founded
Marfinraises € 400m;
acquires 10% of Egnatia
Marfin acquires:13% of Laiki &
44% of Egnatia
MPB acquires 51% of Rosprombank in
Russia
Marfin acquires13% of Laiki Bank
Marfin acquires:44% of Egnatia Bank
1901 … 1991 1992 … 1998 … 2000 2001 2002 2003 2004 2005 2006 2007 2008 …
1991 1992 … 1998 … 2000 2001 2002 2003 2004 2005 2006 2007
1998 … 2000 2001 2002 2003 2004 2005 2006 2007
MPB is created (3-way merger of Laiki,
Marfin, Egnatia)
Marfin acquires10% of Egnatia Bank

104104
Group profile
Marfin Popular Bank Group (MPB) is strategically positioned as a regional player with two home markets, Greece & Cyprus, and operations spanning in 11 countries mainly in Emerging EuropeFocus on corporate banking, wealth management and international business bankingTen years of robust growth both organically and through a series of mergers & acquisitions and strategic alliancesSuccessful management track record and entrepreneurial culture
Corporate profile104
Figures & ratings
Assets of €38bn, 512 branches in 11 countries and 9,500 employeesLoan portfolio of €24bn and deposits & assets under management of €25bnTotal equity at €3.4bn with tangible equity at €2.2bn; Tier I ratio at 9.0% and total capital adequacy ratio at 11.3% under Basel IICredit ratings: Standard & Poors (Dec 2008) BBB- / A-3, stable outlook, Moody’s (Dec 2007) A3 / stable outlook, Fitch (Jan 2009) BBB+ / stable outlook

105
Further recent awards“Quality Recognition Award 2008 (Correspondent Bank)”, Awarded by JPMorgan“Best Investment Services Provided, Cyprus 2008”, Awarded by World Finance of Reuters (first time awarded in Cyprus)“Innovation Award- Cyprus”, Awarded by Money Markets 2008 International Custody Awards“Best Banking Awards 2009”, Awarded by World Finance“Best in Class Client Services-Cyprus” Awarded by Money Markets 2007/2008 European Custody Awards
105As of FY08, there are 512 branches internationally
105
UNITEDKINGDOM
5
GUERNSEY
AUSTRALIA 10
MALTA
ROMANIA
27
SERBIA
31
UKRAINE
84
RUSSIA 36
CYPRUS
116
GREECE
ESTONIA 4
1
6
192

106106Evolution of key Group metrics
106
Total Assets (€bn)
Branches
Net Profit (€m)
Employees
1023
3038
120
10
20
30
40
50
2004 2005 2006 2007 2008
215
563395
35 720
100
200
300
400
500
600
2004 2005 2006 2007 2008
3,692 3,7945,938
7,9889,457
01,0002,0003,0004,0005,0006,0007,0008,0009,000
10,000
2004 2005 2006 2007 2008
181311
423512
1880
100
200
300
400
500
600
2004 2005 2006 2007 2008

107107
Shareholder structure (31 March 2009)
Shareholders’ structure & corporate governance107
Corporate governanceMPB has adopted the effective institutional framework of corporate governance; meanwhile it employs a fully dedicated team, working on how to improve corporate governance and take actions over and above itThe Bank’s Board of Directors comprises of fourteen members out of which three are independent and nine non-executiveFinancial statements under IFRSMost important committees:
Executive CommitteeAudit CommitteeRisk Management CommitteeNomination CommitteeRemuneration Committee
Dedicated teams of:Investor RelationsShareholder RegistryCorporate Governance Corporate Announcements
19% 10%
3%3%
43%
10%
4%
2%
6%
Lanitis family Theocharakis family ManagementOther Investors Foreign Institutional Greek InstitutionalCypriot Institutional Dubai Group LTD MIG

108108
MPB’s market share in Cyprus (%)
Market shares in Cyprus108
Market Shares of the largest banks in Cyprus (%)
15.6%11.3%
17.3%21.5% 19.4%
16.8%12.6%
18.3%22.6%
19.8%16.4%
12.9%
27.5%
20.0% 20.4%
-2.0%
3.0%
8.0%
13.0%
18.0%
23.0%
28.0%
33.0%
Total Loans Mortgage Loans Consumer Loans Corporate Loans Total Deposits
2006 2007 2008
23.7%
15.7%18.8%
7.1% 8.5%
1.5%
26.8%
20.4% 19.1%
9.4%6.1%
1.1%0.0%
5.0%
10.0%
15.0%
20.0%
25.0%
30.0%
BoC MPB Co-ops Hellenic Alpha NBGLoans Deposits

109109
MPB’s market share in Greece (%)
Market shares in Greece109
Market Shares of the largest banks in Greece (%)
3.3%1.8%
3.5% 4.2% 3.8% 4.0%4.4%2.6%
4.5% 5.5% 4.5%
10.5%
5.2%2.8%
5.2%6.5%
4.9%
11.0%
0.0%2.0%4.0%6.0%8.0%
10.0%12.0%
Total Loans Mortgage Loans Consumer Loans Corporate Loans Total Deposits IBG - Athex share2006 2007 2008
2.6%5.2% 3.7%
17.6% 16.2% 14.9%11.5%
8.7% 8.1%4.5% 4.8%4.9%
23.5%
15.7%
11.0% 11.3%7.5% 8.9%
0.0%
5.0%
10.0%
15.0%
20.0%
25.0%
30.0%
NBG EFG Alpha BoP Emporiki ATE MPB BoC HPBLoans Deposits
9.9%
18.6% 20.4%

110110Key strategic objectives for 2009
110
Balance sheetmanagement
Less aggressive balance sheet expansion, becoming more selective on loan disbursement across geographies and sectors; enhanced focus on a) strong cash flow generation, b) high quality collaterals, and c) pricing
Pricing A more moderate balance sheet expansion is more accommodative to a less aggressive deposit gathering strategy; ongoing progress on reducing cost of deposit combined with aggressive asset re-pricing across all key geographies and product areas
Liquidity Focused on sustaining a group loan-to-deposit (L/D) ratio less than 100%; maintaining a sufficient high level of contingency liquidity surplus, taking advantage from the ECB repo facility and the securitization markets
Asset quality Comfortable asset quality position in view of high exposure in developed countries of Greece and Cyprus; southeast Europe accounts for only 5% of the Group’s loan book; nevertheless, the Group is adopting precautionary measures through a) tightening credit standards across all key product areas and b) taking pre-emptive provisions
Capital adequacy The Group’s strong capital position is underpinned by a two pillar strategy of managed balance sheet expansion and strong focus on profitability

111111Preemptive management actions
111
Balance sheetexpansion
Moderating balance sheet expansion to account for a) slower economy, b) deteriorating asset quality, and c) constrained liquidity conditions
ProfitabilityStrong emphasis on loan book repricing across geographic and product areasBalanced approach on deposit gathering trying to optimize volume versus pricingOnly selective hiring combined with ongoing reallocation of existing staff internally
LiquidityMaintaining a sufficient cushion of contingent liquidityEmphasizing on strong reliance of customer deposits versus wholesalefunding
Asset quality Elevating strictness of credit criteria, strengthening process and humanresources in debt collection
Capital adequacy Maintaining a strong capital bufferFollowing the latest issuance of €250 million non-core Tier I, MPB’s 2008 pro-forma Group Tier I and CAR stand at 9% and 11.3%

112112
Section 1Section 8 (b)
112
Marfin Popular BankThe GroupKey operating highlightsEconomic outlookFull-year 2008 results overview

113113
Total Group deposits (€bn)
Customer deposits & assets under management113
Assets under management * (€bn)
Deposits by region (2008)
IBB deposits (€bn)
* Includes mutual funds, client directly-held bonds, equities, and financial products
9.2 11.6
10.111.3
1.41.9
24.8
20.7
0
5
10
15
20
25
FY07 FY08
Greece Cyprus International
+20% y/y y/y
+37%
+12%
+27%
7.7%
46.8%
45.6%
Greece Cyprus Int'l
4.93.9
0.0
1.0
2.0
3.0
4.0
5.0
6.0
2007 2008
- 21% y/y
4.2 4.6
0.0
1.0
2.0
3.0
4.0
5.0
6.0
2007 2008
+11% y/y

114114
Group funding sources (2008)
Deposit reliant funding base114
Customer deposits per region (2008)
Maturity of outstanding debt (€m)
Funding sourcesIn terms of funding, deposits comprise 72% of MPB’s funding base; that combined with a loan-to-deposit (L/D) ratio not in excess of 100% and an attractive maturity profile of outstanding debt, makes MPB’s balance sheet one of the strongest and most liquid within the Hellenic banks’ universeKey strategic objectives
Maintain a sustainable liquidity position i.e. reflected in a loan/deposit ratio close to 100%Improving funding cost structure through expanding deposit base combined with customer micro-management and segmentation
8%
2%3%13%
74%
Deposits RepoSenior debt Subordinate and other issuesInterbank borrowings
200750
1
300
500
200400600800
1,0001,200
2009 2010 2011 2012 2013
Senior Bond Bank Loans Hybrid Tier I
46%
47%
7%
Cyprus Greece International

115115
Loan book by region (€bn)
Loan portfolio evolution by region and category115
Loan book by category (€bn)
Loan book by region
Loan book by category
9.5
6.7
8.62.1
2.8
12.8
18.3
24.2
0
5
10
15
20
25
FY07 FY08
Greece Cyprus International
+ 32% y/yy/y
+33%
+28%
+35%
5%
7%
52%
36%
Greece Cyprus Developed Countries SEE
17%
16%
67%
Mortgages Consumer Business
Retail33%
3.13.1 4.0
12.016.2
3.9
18.3
24.2
0
48
1216
2024
28
FY07 FY08Mortgages Consumer Business
+35%
+26%+28%
+ 32% y/y y/y

116116
MPB – loans breakdown per region (FY08
Well diversified Group loan book116
MPB – loans in developed countries (FY08)
MPB – loans in SEE (FY08)
The Group’s exposure in the UK and Australia is mainly in community bankingMPB’s portfolio in emerging Europe is well diversified across different countries and productsA large part of MPB’s exposure in the three neighboring countries of Romania, Serbia and Ukraine is accounted for lending to Greek subsidiaries
53%
36% 4%7%
Greece Cyprus SEE Developed Countries
4%47%
27%
11%
11%
Estonia Romania Ukraine Russia Serbia
57%
23%20%
UK Australia Malta
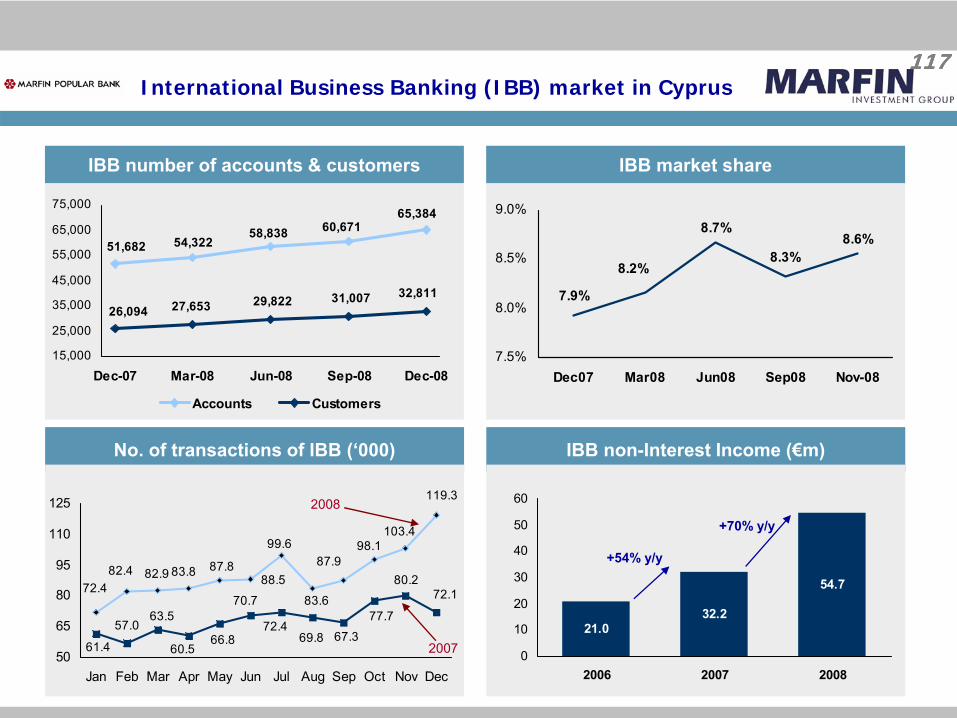
117117
IBB number of accounts & customers
International Business Banking (IBB) market in Cyprus117
No. of transactions of IBB (‘000)
IBB market share
IBB non-Interest Income (€m)
65,38460,67158,838
54,32251,682
32,81131,00729,82227,65326,094
15,000
25,000
35,000
45,000
55,000
65,000
75,000
Dec-07 Mar-08 Jun-08 Sep-08 Dec-08
Accounts Customers
80.272.170.7
72.469.8 67.3
77.7
66.860.5
63.557.0
61.4
88.5
99.6
83.6
87.998.1
103.4
119.3
87.883.882.982.472.4
50
65
80
95
110
125
Jan Feb Mar Apr May Jun Jul Aug Sep Oct Nov Dec
2008
2007
8.6%8.3%
8.7%
8.2%
7.9%
7.5%
8.0%
8.5%
9.0%
Dec07 Mar08 Jun08 Sep08 Nov-08
21.032.2
54.7
0
10
20
30
40
50
60
2006 2007 2008
+70% y/y
+54% y/y

118118
Provision charges (€m) & cost of credit risk
Resilient asset quality trends118
NPLs & coverage ratio
98
129
0.63% 0.61%
20
40
60
80
100
120
140
FY07 FY080.0%
0.5%
1.0%
1.5%
2.0%
Provisions Cost of risk
84% 80%
65% 61%
21% 22%
4.8%4.3%
FY07 FY08
Tangible collateral Cumulative Provisions
Personal / Corporate Guarantees NPL's
169 % 164 %

119119Resilient asset quality trends
119
(€m) Greece Cyprus UK Australia Malta(1) Russia(2) Estonia Romania Serbia Ukraine SEE Total
Balance Sheet
TotalAssets
18,486 15,592 1,698 456 518 282 53 726 172 370 1,603 38,353
Total Loans
12,769 8,611 950 375 331 126 42 525 116 305 1,114 24,151
Total Deposits 11,587 11,368 583 360 440 150 23 144 61 113 491 24,828
P&L
NII 281.2 363.4 22.6 10.5 12.3 5.4 2.8 15.3 7.2 23.6 54.3 744.4
Total Income 410.4 494.9 31.7 11.9 30.7 8.3 3.1 30.0 11.0 53.4 105.8 1,085.3
OPEX (268.9) (191.8) (14.4) (9.0) (20.3) (8.4) (2.7) (15.6) (16.5) (22.7) (65.9) (591.2)(3)
Net Profit 44.9 257.8 12.1 1.7 7.4 0.4 (0.8) (1.7) (12.9) 17.9 2.9 394.6
Retail Network 192 116 6(4) 10 6 36 4 27 31 84 182 512
(1) Malta was consolidated for the first time in March 2008(2) Russia was consolidated for the first time in September 2008 (3) Amortization of intangibles also added at Group level(4) One branch located in Guernsey

120120
Section 1Section 8 (c)
120
Marfin Popular BankThe GroupKey operating highlightsEconomic outlookFull-year 2008 results overview

121121MPB’s Group operating environment
121
MPB is exposed to a geographic region covering a population of more than 100 million with above-average market growth ratesGreece remains a structurally fast growing market, with €39bn expected to be invested in public infra-structure projects until 2012In Cyprus, strong domestic growth is underpinned by prolonged cyclical uptrend, impact of convergence to EU and positive implication of international business bankingIn Greece, more than 25% of total employees work for the wider public sector while in Cyprus the corresponding ratio is 18%; high levels of job security tend to make consumption patterns more stable; in Greece in particular, there is still a considerable proportion of firms and households with no or very low leverage In SEE, the potential for strong long-term economic growth prospects, prospective EU membership and very low levels of financial intermediation could offer attractive opportunities in the future
Key portfolio characteristics Country Population(m)
GDP (US$ bn)
GDP (real)
growth 2008
GDP per capita ($’000)
2008
Credit to GDP
Greece 11 357 2.9% 31 103%
Cyprus 0.8 25 3.7% 25 232%
Romania 22 200 7.1% 13 41%
Serbia 7 51 5.4% 11 38%
Ukraine 46 186 2.1% 7 80%
Estonia 1 23 -3.6% 21 99%
Bulgaria 8 50 6.0% 12 67%
Russia 142 1,672 5.6% 16 26%
Eurozone 324 13,622 0.8 33 n.a.
Source : IMF, International Financial Statistics

122122
GDP Growth
Greece: Economic overview & outlook122
Main economic indicators & forecasts Greece
Mainly services based economy with considerable reliance on shipping, tourism and bankingEconomy transformed through entry into the Eurozone in 2001, from high inflation and low growth to low inflation and strong growthHigh income economy with per capita income in 2008 at 97% of the EU-27 averageGross fixed investment is declining, but remains considerable at 21% of GDP in 2008 and 18% of GDP expected in 2009 and 2010 Public and corporate investment growth is expected to benefit from EU structural funds and the launch of public-private partnership projectsGreek banking has moderate exposure to Central and eastern European countries and at the same time remains well capitalisedIn public finance, imbalances will persist with the debt ratio surpassing 100% of GDP in 2009 and the budget deficit remaining c5% of GDP; in current account, imbalances will persist but gradual improvement is expectedGDP growth is expected to turn negative in 2009 for the first time since 1993, but remain above the Eurozone average
The Greek economy
3.4%4.5% 4.2%
3.4% 5.6% 4.9%2.9% 4.5%
4.0%
2.9%
-0.9%
2.9% 3.9%
1.9% 0.9% 0.8%2.1% 1.7%
2.9%2.6%
0.8%
-4.0%-6.0%
-4.0%
-2.0%
0.0%
2.0%
4.0%
6.0%
'99 '00 '01 '02 '03 '04 '05 '06 '07 '08 '09
Greece Eurozone
2006 2007 2008 2009F
GDP (% real change) 4.5 4.0 2.9 -0.9
Nominal GDP (€bn) 213.2 228.2 242.9 253.7
GDP per capita (€) 19,418 20,763 22,106 23,081
Recorded unemployment (%) 8.9 8.3 7.7 9.0
Consumer prices (% change) 3.2 2.9 4.1 1.8
Budget balance (% of GDP) -2.6 -3.5 -37 -5.0
Public debt (% of GDP) 95.9 94.8 97.6 103.4
Current-account balance (% of GDP) -11.1 -14.2 -12.7 -11.5

123123
GDP Growth
Cyprus: Economic overview & outlook123
Main economic indicators & forecasts Cyprus
Predominantly services based economy with a strong international banking and finance sectorAttractive tax environment with an extensive network of double tax treatiesHigh income economy with per capita income in 2008 at 93% of the EU-27 averageThe adoption of Euro in January 2008 shields the economy and creates an anchor policy necessary for macroeconomic stability Strong banking fundamentals and effective supervision enhance macroeconomic stabilityFavourable public finances with a debt ratio of 49% of GDP and a budget surplus of 1% of GDP in 2008, entail considerable potential for additional fiscal stimulus The imbalance in the current account reflects conditions of excess demand in the economy, but gradual improvement is expectedMortgage lending was based on prudent criteria and does not pose problemsIn view of the current challenging global economic environment, economic growth is expected to slow significantly in 2009, but still remain in positive territory and considerably better than the Eurozone outlook
The Cypriot economy
4.8% 5.0%4.0%
2.1%
1.9%
4.2% 3.9%4.1%
4.4%
3.7%0.3%
2.9% 3.9%1.9%
0.9% 0.8%2.1% 1.7%
2.9% 2.6%0.8%
-4.0%-6.0%
-4.0%
-2.0%
0.0%
2.0%
4.0%
6.0%
'99 '00 '01 '02 '03 '04 '05 '06 '07 '08 '09
Cyprus Eurozone
2006 2007 2008 2009F
GDP (% real change) 4.1 4.4 3.7 0.3
Nominal GDP (€ bn) 14.4 15.6 16.9 17.4
GDP per capita (€) 18,630 19,867 21,365 21,869
Recorded unemployment (%) 4.5 3.9 3.8 4.7
Consumer prices (% change) 2.5 2.4 4.7 1.1
Budget balance (% of GDP) -1.2 3.2 1.0 -2.2
Public debt (% of GDP) 64.6 59.4 49.0 48.0
Current-account balance (% of GDP) -7.1 -12.2 -18.0 -13.0

124124
Section 1Section 8 (c)
124
Marfin Popular BankThe GroupKey operating highlightsEconomic outlookFull-year 2008 results overview

125125
Revenues: FY 2008 revenues 3%(1) higher y/y to €1,085.3m; FY 2008 NII up 12% y/y to €744.4m; fee & commission income 7% lower to €286.7m; financial & other income 35%(1) lower to €54.2mBalance sheet: Group loan (net) and deposit growth of 33% and 20% respectively y/y with market share gains evident across all key geographic and product areasNet interest margin (NIM): 4Q08 NIM stood at 2.40% vs. 2.45% in 3Q08; ongoing repricing of loan book in Cyprus and Greece, as well as increasing contribution from international operations is still being offset by competition induced compression in deposit spreadsCost: Operating expenses up 11% y/y to €591.2m and 3% higher ex-acquisitions, reflecting the impact of an effective cost management strategy and the benefits of the ongoing Group wide cost re-engineering programAsset quality: Group NPL ratio down to 4.3% in December 2008 from 4.8% in December 2007, dropping 52 bps y/y; cost of risk down to 61 bps in FY08 from 63 in FY07Liquidity: Loan/deposit ratio rose to 94% in FY08 from 85% in FY07; MPB’s loan/deposit ratio remains one of the lowest among the Hellenic Banks and well below the European average Capital: Tier I capital and total regulatory capital stood at €2,095m and €2,741m respectively, with the respective proforma ratios at 9.0% and 11.3% as of December 2008 RoTE stood at 18.3% in December 2008
Full Year 2008 Group results highlights125
FY 2008 net profit reached €394.6m (30% lower y/y), while net profit adjusted for exceptional items and profit from discontinued operations stood at €302.4m (4% lower y/y)
(1) Adjusted for exceptional items

126126Group income statement
126
(€m) FY07(3) 3Q08(3) 4Q08 FY08FY08/
FY07 (%)4Q08/
3Q08 (%)Net interest income (NII) 664.9 199.9 188.0 744.4 12.0% (5.9)%
Net fee & commission income 309.0 75.2 65.2 286.7 (7.2)% (13.3)%
Financial & other income 83.3 12.0 (7.1) 54.2 (34.9)% -
Income from exceptional items 118.7 (1) - - - - -
Total income 1,175.9 287.1 246.1 1,085.3 (7.7)% (14.3)%
Total income adjusted for exceptionals 1,057.2 - - 1,085.3 2.7% -
Staff costs (325.3) (89.0) (100.8) (349.7) 7.5% 13.3%
Other operating expenses (160.6) (44.5) (69.5) (191.0) 18.9% 56.2%
Depreciation & amortization (45.3) (11.9) (15.8) (50.5) 11.5% 32.8%
Operating expenses (531.2) (145.4) (186.1) (591.2) 11.3% 27.9%
Provision for loan impairment (97.9) (22.8) (59.5) (129.4) 32.2% 161.2%
Profit/loss from associates 2.9 0.8 0.6 2.5 - -
Profit before tax 549.7 119.7 1.1 367.2 (33.2)% (99.1)%
Tax (84.5) (19.5) 1.5 (56.0) (33.7)% -
Minority interest (29.8) (2.6) 0.8 (8.8) - -
Profit from discontinued operations (2) 127.9 5.3 67.9 92.2 - -
Net profit attributable to shareholders 563.3 102.9 71.3 394.6 (30.0)% (30.7)%
(1) Exceptional items: gains from the sale of the stakes in Hellenic Bank, Bank of Cyprus and Universal life(2) Profit from discontinued operations derives from MIG in 2007 and the sale of the insurance units of the Group to CNP Assurances in 2008(3) Full year 2007 and 3Q08 figures have been adjusted for the disposal of insurance operations

127127Key Group balance sheet items & ratios
127
Key balance sheet items (€m) FY07 (2) FY08 FY08/ FY07 (%)
Loans to customers (net) 17,584 23,427 33.2%
Total assets 29,761 38,353 28.9%
Customer deposits 20,695 24,828 20.0%
Total equity 3,390 3,430 1.2%
Key ratios FY07 (2) FY08
Tier I 9.1%(3) 9.0%(4)
Capital adequacy ratio 11.2%(3) 11.3%(4)
Cost/income 50.3%(1) 54.5%
NIM 2.84% 2.40%
Loans/Deposits 85.0% 94.4%
NPLs 4.8% 4.3%
Provisioning 63 bps 61 bps
RoTE (return on tangible equity) 20.2% 18.3%
RoA 1.31%(1) 1.16%(1) Adjusted for exceptional income(2) Full-year 2007 figures have been adjusted for the disposal of insurance operations(3) As originally reported by MPB per Basel I regulations(4) Figures for Tier I capital and regulatory funds are estimated and proforma for the issuance of €250m hybrid securities in May ‘09

128128
Section 1
MIG Private Equity
Real EstateHospitality / LeisureFlight Ambulance / AviationOther
Section 9
128

129
Owner of the largest retail real estate portfolio in the countries of former Yugoslavia and one of the largest in
Europe Date of investment: October 2007
MIG Ownership: 66.7%
Robne kuce Beograd (RKB) is specialized in real estate management and retail space arrangement
RKB is historically the largest real estate department store and shopping centers chain in the countries of former Yugoslavia and one of the largest in Europe; it has a remarkable real estate portfolio in attractive, non-replicable and central locations totaling 232,000m2
The formerly state-owned department stores operator, auctioned by the Serbian Privatization Agency as the company’s bankruptcy administrator, consists of 32 department stores in Serbia (9 of which in Belgrade), 4 department stores and 1 warehouse in Montenegro, 1 logistics centre and 1 office building in Belgrade
Following modern trends in organising and managing real estate, RKB provides international and local retailers with prime real estate, ensuring an optimal quality/price ratio
Company profile
Real Estate
Financial highlights (€m)
During 2008 RKB portfolio assets were under refurbishment, therefore no material income has been generated
129

130
Attractive assets in prime locations
Strong brand recognition boosted
through intensive rebranding and
marketing campaign
Completely refurbished and
modernized properties
Old tenants were expeditiously
evicted and new high-quality tenants
have been introduced
Right of ownership has been
established over most properties
HoldCo/OpCo merger completed
Attractive assets in prime locations
Strong brand recognition, but
cannibalised during bankruptcy
Old-fashioned interior and exterior,
in communist-era fashion
Properties occupied by low-quality
tenants under unfavourable terms
‘Grey’ areas on right of ownership
over a number of properties
HoldCo/OpCo structure resulted in
tax inefficiencies and sub-optimal
loan securities
The new RKB
‘Old’ RKB ‘New’ RKB
In an admittedly challenging period for retail real estate globally, RKB’s management, in cooperation with the main shareholders, has managed to reshape what used to be an amalgamation of prime, but
problematic, assets into a robust, sound and well-structured company
• Refurbishment• Marketing to tenants
• Rebranding• Legal ‘housekeeping’• Merger
130

131
Extensive refurbishment and modernisation
Refurbishment of properties
During 2008, the company’s department stores underwent extensive refurbishment
3 department stores opened during 2008 (Terazije, Dušanovac, Zemun) and have been fully leased to tenants
The refurbishment of a total 22 department stores has been completed and all of them are expected to be leased and
open by mid-May
The refurbishment of all remaining department stores is expected to be completed by end of May 2009, with the
exception of 2 properties where additional space can be built and, to that end, they will be ready by end of 2009
DS Miljakovac DS SavaDS Dusanovac DS Zemun
Bef
ore
Afte
r
DS Zajecar
131

132
1. Subotica2. Sombor 3. Bačka Topola 4. Kula 5. Kikinda6. Zrenjanin7. Vršac 8. Belgrade
8.1 Terazije8.2 Stari grad8.3 Kalemegdan 8.4 Beograđanka8.5 Fontana 8.6 Dušanovac 8.7 Miljakovac 8.8 Zemun 8.9 Sava 8.10 Headquarters Building8.11 Distribution Centre
9. Požarevac 10. Smederevska Palanka11. Valjevo 12. Bajina Bašta13. Užice14. Kraljevo15. Kragujevac16. Jagodina17. Paraćin18. Bor 19. Zaječar20. Knjaževac21. Niš 22. Leskovac23. Pirot24. Vranje
1. Bjelo Polje 2. Podgorica
Locations in Montenegro - all owned
An unparalleled footprint in Serbia
1. Bjelo Polie
2. Podgorica
1. Subotica
2. Sombor3.Backa Topola 5. Kikinda
4. Kula 6. Zrenjanin7. Vrsac
8.1-8.11 BEOGRAD9. Pozarevac
10. SmederevskaPalanka
11. Valjevo
12. Bajina Basta13. Uzice
14.Kraljevo
19. Zajecar
18. Bor
17. Paracin
15. Kragujevac
16. Jagodina
24. Vranje
22. Leskovac
20. Knjazevac
21. Nis 23. Pirot
Serbia
Montenegro
Locations in Serbia - all owned
132

133
Sunce is one of the largest groups in the Croatian hospitality and leisure industry Date of investment: July 2008
MIG Ownership: 49.9%Sunce (Bluesun Hotels & Resorts) is one of the largest groups in the Croatian hospitality and leisure industrySunce owns and operates 11 hotels with a total capacity of 2,247 rooms and 4,510 beds In 2008, Sunce’s activities accounted for a 4.6% market share of total overnight stays of the Croatian tourist marketA well diversified client portfolio; tourists from Germany, Croatia and Russia represented 46% of total touristsInternational Awards
Bluesun hotel Afrodita, Tučepi - TUI Holly 2008 (amongst top 100 hotels out of 5,800)Bluesun hotel Alga, Tučepi –SAGA
Year 2008 Performance4% increase of total revenues for 2008 compared to last year despite adverse market conditionsFY2008 EBITDA margin stood at 12.2% vs. 11.6% in 2007Net Debt stood at €87.6m compared to €84.2m in Dec 07
Company profile
Hospitality & Leisure
Financial Highlights (€m)
Net profit -4%-5.2EBITDA +8%3.9Sales +4%33.1
Total equityNet Debt/(Cash) 84.2 +4%
2007 2008 Growth34.34.2
-5.483.2 75.5 -9%
87.6
133

134
Brac Island hotels725 rooms in three hotels on the largest island off theDalmatian coastLocated within 5 minutes walking distance from the famousbeach of Zlatni Rat, recently rated among the top 15European beaches by the Daily Telegraph
Brela hotels755 rooms in four hotelsLocated on the mainland, with a superb view of the complexof islands (Brac, Hvar, etc.)Benefiting from a very beautiful nearby marina
Tucepi hotels767 rooms in four hotelsVery attractive holiday resort, only 3km away from the town ofMakarskaDistinguished by longest gravel beach of the MakarskaRiviera
The Bluesun assets
Portfolio of uniquely positioned hotels…
Airport BracRecently undergone extensive refurbishment; Annual capacity of 5,000 aircraft
Agricultural landOwns 317,000m2 of agricultural land on Brac Island and a 40-year concession for another 2,600,000m2
Non-operating assetsThree hotels and one residential building located in Brela and Bol
…strengthened by other attractive assets
134
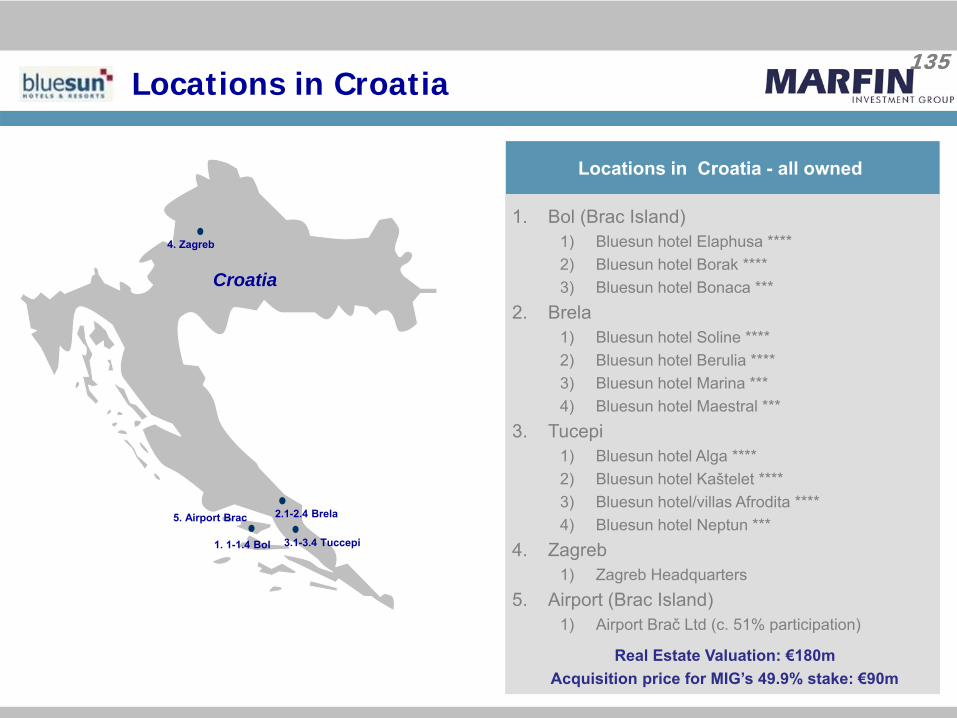
135
Locations in Croatia - all owned
Locations in Croatia
4. Zagreb
1. 1-1.4 Bol 3.1-3.4 Tuccepi
2.1-2.4 Brela
Croatia
5. Airport Brac
1. Bol (Brac Island)1) Bluesun hotel Elaphusa ****2) Bluesun hotel Borak **** 3) Bluesun hotel Bonaca ***
2. Brela1) Bluesun hotel Soline ****2) Bluesun hotel Berulia ****3) Bluesun hotel Marina ***4) Bluesun hotel Maestral ***
3. Tucepi1) Bluesun hotel Alga ****2) Bluesun hotel Kaštelet ****3) Bluesun hotel/villas Afrodita ****4) Bluesun hotel Neptun ***
4. Zagreb1) Zagreb Headquarters
5. Airport (Brac Island)1) Airport Brač Ltd (c. 51% participation)
Real Estate Valuation: €180mAcquisition price for MIG’s 49.9% stake: €90m
135

136136
Hilton, the only 5-star hotel in NicosiaDate of investment: August 2007MIG Ownership: 75.1%Hilton Cyprus is the only 5-star Hotel in Nicosia, consisting of 298 rooms out of which 76 are executive and 24 are suites
Cypriot Market Statistics:Revenue from tourism in 2008 was estimated at €1.8bn, recording a decrease of 3.6% in relation to the corresponding figure for 2007 (€1.9bn)The biggest market share of tourist arrivals was captured by Europe, which accounted for the 94.3% of total arrivals in 2008. Tourist arrivals from UK (representing the 52% of total tourist arrivals) declined by 3.1% y-o-y
Year 2008 PerformanceSales stood at €16.0m, increased by 8.4% versus 2007EBITDA reached €5.2m vs €4.9m a year ago (+7.0% y-o-y)Net income stood at €3.8m (+31.3% y-o-y)Net Debt decreased €3.7m vs €4.7m in 2007Occupancy rates increased by 663bps to 55.7%
Company profile
Hospitality & Leisure
Financial Highlights (€m)
Net profit +31%2.9EBITDA +7%4.9Sales +8%14.8
Total equityNet Debt 4.7 -21%
2007 2008 Growth16.05.23.8
54.1 74.0 +37%3.7
136

137137Hilton – revenue analysis 2008
Revenues per segment Room revenues breakdown
Sales increased by 8% despite a negative trend in the Cypriot tourism market
Room revenues and Food & Beverage revenues have an almostequal split in the company’s total income, however in terms of grossmargin the split changes in favor of room revenues
A total percentage of 39% of room revenues is generated by corporate customers, while tour packages, long term contracts & conferences represent 17%, 14% and 10% respectively
137

138Room revenues breakdown
By room type By customer type
Int. Business Travel
34%
Leisure
19%
Convention
9%
Permanent
14%
Rack
13%
Meetings
10%
20082008
Guest Room
61%
Deluxe & Executive
30%
Suites
9%
Guest Room
60%
Deluxe & Executive
31%
Suites
9%
2007
Int. Business Travel
35%Leisure
23%
Convention
11%
Meetings
10%
Rack
14%
Permanent 7%2007
138

139Tourism in Cyprus
139
The Cyprus Organisation of Tourism’s strategic plan for 2010 includes the following main goals: Revenues for 2010 of €3bn (€1.8bn in 2008 and €1.9bn in 2007)Travelers: 3.5 million (2.4m both in years 2008 and 2007)Average length of stay: 11.6 (10.1 days in 2008 and 10.0 days in 2007)

140Tourism in Cyprus (cont’d)
140
Mar
ket S
ize
Small
Large
Low HighPotential for growth
Wedding Ceremonies
Internal Tourism
GolfCasino
Agri-Tourism
Enterprising Tourism
Tourism of City
Cultural TourismConference Tourism
Athletic Tourism
Based on a strategic study performed on 10 February 2006 by Pricewaterhouse Coopers, GMC, Cypronetwork, ALA Planning Partnership
Hilton Cyprus is a leader in conference and athletic tourism and weddings

141
FAI is one of the top 3 European and top 5 globally fixed-wing medical evacuation
companies Date of investment: January 2009MIG Ownership: 49.9%Main customers include the major insurance and assistance companies, governmental agencies and corporatesFAI employs 90 full-time employees, from 20 nations, plus 50 freelance physicians and paramedicsThe company controls an efficient fleet of owned and managed, based in the low-cost 24/7 Nuernberg International AirportFAI operates a modern fleet of 8 owned and 3 leased jetsFAI will build a state-of-the-art owned 2,500 sqm hangar and 1,000 m2 office in the Airport, to be completed by Q3 2009International Awards
2007 EURAMI’s (European Aero-Medical Institute) Certificate “Critical Care”
A robust business modelc.75% of revenues comes from medical transfers, a much less competitive market than corporate aviationThrough track record and streamlined operations, top-of-class utilisation rates per aircraft (>1,000 p.a.)5 solid contracts with the largest NGO in the worldMajority of fuel cost is passed on to clientsFully fledged in-house maintenance capabilities
Company profile
Flight Ambulance
Financial Highlights (€m)
EBT -19%4.2EBITDA +13%5.5Total revenue +33%21.9
Fleet Book ValueNet Debt/(Cash) 4.1 +180%
2007 2008 Growth26.56.23.4
4.0 9.3 +131%11.6
141

142Key financial highlights
Operational revenue breakdown (€m)
12,014,6 15,0
18,0
1,20,3
1,8
3,0
1,7
4,0
6,0
10,5
2,2
1,3
3,7
1,5
17,1
20,0
26,5
33,0
0
2
4
6
8
10
12
0
5
10
15
20
25
30
35
2006A 2007A 2008A 2009E
Fixed-Wing Ambulance Fixed-Wing Non-Ambulance Fixed-Wing Public Services
Other Services Number of Aircraft (RHS)
17.0%
32.5%
24.5%
Robust year-on-year revenue growth from operationsIncreasing reliance on more visible long contracts of Fixed-Wing Public Services segment
142

143The fleet
LJ 55 (total jets: 5)
• 4 jets• FAI owned• NGO contract
LJ 35(total jets: 2)
• 1 jet • FAI owned• Air Ambulance
• 2 jets • FAI owned• Air Ambulance
LJ 60(total jets: 2)
• 1 jet• FAI owned• VIP Charter & Air Ambulance
• 1 jet• Managed• NGO contract
Falcon 900DX(total jets: 1)
• 1 jet• Managed• VIP Charter
CL 604(total jets: 1)
• 1 jet• Managed• VIP Charter & Air Ambulance
143

145
In June 2007, MIG acquired 50% of Attika Real Estate, which was later renamed to MIG Real EstateMIG Real Estate is one of the very few REITs available in Greece, benefiting from advantageous tax regime
Exemption from corporate income tax (instead, 10% of the ECB reference rate + 1% tax on the average value of investments)Exemption from depreciation procedure
Highly experienced management and a very transparent decision-making process, through a 5-member investment committeeSince the introduction of MIG into its share capital, MIG Real Estate expanded its portfolio from 7 to 30 propertiesMIG Real Estate is planning its IPO on the Athens Exchange during 2009
MIG Real Estate – REIT in Greece 145

146
A high-quality property portfolio, comprising:32 commercial properties with total GLA close to 21,000 m2
Appraised value in excess of €69mNo single property has a value greater than €7m
A robust, high-quality tenant baseHigh rental yields (close to 7.5%)Strong lease terms
Standard lease terms of 12 years70% of the leases expire between 2015 and 2020 while the remaining 30% expires between 2009 and 2013All tenants responsible for maintenance expenses
MIG Real Estate – Portfolio highlights146
Portfolio breakdown by property type
Portfolio breakdown by geography
45%
38%
17%
Office space Bank outlets Other commercial
80%
10%
10%
Greater Athens Thessaloniki Other Greek cities

147
Radio Korasidis is the most historic Greek retail chain of electronic goods
Date of investment: January 2008The company went through financial distress in the early 2000s and filed for protection from creditorsA new management team was introduced to restructure the company and managed to do so through the favorable conditions prescribed by Article 44 of Greek Law
Current strategy: Target market penetration & market developmentFocus on white goods Pursue selective geographic expansionFurther utilise state-of-the-art logistics facility in the Greater Athens areaRedefinition of the original planned shop restructuring scheduleCurrently 49 shops exist across the countryChange of exterior layout and signage for all existing stores is currently under way Plans exist for the opening of another 11 new shops during 2009
Company profile
Radio Korasidis
Revenue breakdown 2008
147

148148
Section 1Intra-group synergies
Section 10
148

149149
A strong portfolio for the extraction of synergies
Providing financial services to MIG’s subsidiaries and extending its services to their clients, employees and suppliers
Providing commercial space for the Group’s retail operations
Providing food & beverage products in Attica’s vessels
Synergetic activities with Hygeia Group for hospital meals preparation
Providing software services and support on the IT needs of the Group and subsidiaries
Providing accommodation and services on business events of MIG and subsidiaries
Extracting synergies with Marfin Travel
Proving on-board Point-of-Sales for Vivartia’s segments
Vivartia’s cargo travel on Attica’s vessels
MPB (Installed ATMs on Attica’s vessels)
Extracting synergies with Marfin Travel
MIG Real Estate
Providing real estate management and retail space arrangement for MIG and subsidiaries
Providing healthcare services to MIG and subsidiaries’ employees and their families
Introduction of synergetic products with MPB
Synergetic activities with Vivartia
IT/database management with SingularLogic
First-level synergies within MIG149
(RKB)

150150MIG’s synergetic environment
The above analysis outlines the first level of easily identifiable and addressable synergies. As integration between companies is enhanced, second and third-level synergies can be extracted;
these synergies are estimated at €100m and are expected to be realised over a 3-year horizon
150
Cost reductionNet income generationGaining competitive advantage
Sources of synergies
CorporateStaffSuppliersSales NetworksCustomers
5 pillars
Key Building BlocksBuild staff culture and loyalty; incentivise own-product useUtilise advantages from large economies of scale
Progress YTD95% of staff payroll payments and 40% of all suppliers payments are executed through MPBCost-cutting through better central procurement procedures for fuel, couriers, postage, stationery, telecommunication sand IT, construction, facilities management, business travel, leasing and insurance contracts, media expenses
EVERY DAY, over 22 million people purchase or utilise a MIG product or service
Total estimated financial benefit for 2009: €26m

151151
DisclaimerThis presentation contains forward-looking statements, which include comments, statements and opinions withrespect to our objectives and strategies, and the results of our operations and our business, consideringenvironment and risk conditions.However, by their nature, these forward-looking statements involve numerous assumptions, uncertainties andopportunities, both general and specific. We caution that that these statements represent the MIG’s judgmentsand future expectations and that we have based these forward-looking statements on our current expectationsand projections about future events. The risk exists that these statements may differ materially from actualfuture results or events and may not be fulfilled. We caution readers of this presentation not to place unduereliance on these forward-looking statements as a number of factors could cause future MIG results to differmaterially from these targets.Forward-looking statements may be influenced in particular by factors such as movements in local andinternational securities markets, fluctuations in interest rates and exchange rates, the effects of competition inthe areas in which we operate, general market, macroeconomic, governmental and regulatory trends andchanges in economic, regulatory and technological conditions. We caution that the foregoing list is notexhaustive.When relying on forward-looking statements to make decisions, investors should carefully consider theaforementioned factors as well as other uncertainties and events. Any statements regarding past trends oractivities should not be taken as a representation that such trends or activities will continue in the future. Allforward - looking statements are based on information available to MIG on the date of this presentation andMIG assumes no obligation to update such statements, unless otherwise required by applicable law.Nothing on this presentation should be construed as a solicitation or offer, or recommendation, to acquire ordispose of any investment or to engage in any other transaction.Neither this presentation nor a copy of it may be taken or transmitted into the United States of America,Australia, Canada or Japan, or distributed, directly or indirectly, in the United States of America, Australia,Canada or Japan. Any failure to comply with this restriction may constitute a violation of United States,Australian, Canadian or Japanese securities law. The distribution of this presentation in other jurisdictions maybe restricted by law and persons into whose possession this presentation comes should inform themselvesabout, and observe, any such restrictions.
151

152152
CONTACT INFORMATION
Investor Relations OfficeMarfin Investment Group
+30 210 817 3000+44 207 054 9280
www.marfininvestmentgroup.com
MARFIN INVESTMENT GROUP HOLDINGS S.A.24 Kifissias Ave, 151 25 Maroussi,
Greece
152


