Atlas Copco Annual Report 2002 02 Atlas Copco’s revenues declined 7% to MSEK 47,562. Excluding goodwill impairment charge, operating profit was MSEK 5,261, corresponding to a margin of 11.1 % (12.0), and earnings per share decreased to SEK 13.88 (14.63).
Transcript
Atlas Copco Annual Report 2002 02
Atlas Copco’s revenues declined 7% to MSEK 47,562. Excluding goodwill impairment charge, operating profit was MSEK 5,261, corresponding to a margin of 11.1% (12.0), and earnings per share decreased to SEK 13.88 (14.63).
Atlas Copco ABSE-105 23 Stockholm, Sweden
Phone: +46 8 743 8000www.atlascopco-group.com
Pro
du
ction
: Atla
s Co
pco
AB
an
d In
telle
cta C
orp
ora
te A
B. P
ho
to: V
ecka
ns A
ffäre
r/Su
ne
Frid
ell (p
ag
e 4
–5
), Gu
y V
an
de
n B
osch
(pa
ge
17
–23
, 57
), Q-im
ag
e (p
ag
e5
8–
59
). Prin
t: Tryckin
du
stri Info
rma
tion
AB
. Co
py
righ
t 20
03
, Atla
s Co
pco
AB
, Sto
ckho
lm, S
we
de
n.
98
50
90
44
01
AddressesAtlas Copco Group Center
Atlas Copco AB (publ)SE-105 23 Stockholm, SwedenPhone: +46-8-743 8000Fax: +46-8-644 9045www.atlascopco-group.comCorp. id. no: 556014-2720
Atlas Copco Compressor Technique
AirpowerP O Box 100BE-2610 Wilrijk, BelgiumPhone: +32-3-870 2111Fax: +32-3-870 2443
AirtecP O Box 101BE-2610 Wilrijk, BelgiumPhone: +32-3-870 2111Fax: +32-3-870 2443
Atlas Copco Construction ToolsSE-105 23 Stockholm, SwedenPhone: +46-8-743 9600Fax: +46-8-743 9650
Atlas Copco WagnerP O Box 20307Portland, OR 97294-0307, USAPhone: +1-503-255 2863Fax: +1-503-255 7175
Atlas CopcoAnnual Report 2002
F I N A N C I A L I N F O R M AT I O N
Financial InformationWelcome to the Annual General MeetingAtlas Copco shareholders are hereby notified that the Annual General Meeting will beheld on Monday, April 28, 2003, at 5 p.m. in Berwaldhallen, Dag Hammarskjölds väg 3,Stockholm.
Financial information from Atlas CopcoApril 28, 2003 Q1—first quarter results July 17, 2003 Q2—second quarter results October 23, 2003 Q3—third quarter results February 2, 2004 Q4—fourth quarter resultsMarch, 2004 Annual Report 2003
Order the Annual Report Order the Annual Report from Atlas Copco AB, Group Communications, SE-105 23 Stockholm, Sweden.www.atlascopco-group.com, Phone: +46-8-743 8000, Fax: +46-8-643 3718.
www.atlascopco-group.com The Atlas Copco Group site serves the financial markets with information. Here, youwill find financial reports and key figures in ready-to-use digital formats and you cansubscribe to information from the Group. Investor presentations can be downloadedand you can view and/or listen to presentations of quarterly reports via your computer.A comprehensive overview of the company and its operations can also be found at thesite, with links to the Group’s brands and the different countries where the Group hasoperations.
MediaAnnika Berglund, Senior Vice President Group CommunicationsPhone: +46 8 743 8070, Mobile: +46 70 322 [email protected]
Summary
Atlas Copco 2002 3Facts in Brief 4Chairman of the Board 6President and CEO 7
Atlas Copco Group
Board of Directors’ Report 8Compressor Technique 16Rental Service 18Industrial Technique 20Construction and Mining Technique 22Consolidated Income Statement 24Consolidated Balance Sheet 25Cash Flow Statement 26Notes to Atlas Copco Group Cash Flow Statement 27Five Years in Summary 29Summary in USD 30Summary in EUR 31Quarterly Data 32
Accounting Principles 33Definitions 36Notes 37Shares and Participations 50Financial Exposure 52U.S. and International Accounting Standards 54Appropriation of Profit 56Auditors’ Report 56
Investor and Shareholder Information
Group Management 57Board of Directors and Auditors 58The Atlas Copco Share 60Financial Information 63Addresses 64
Contents
Three Key Publications at Your ServiceAtlas Copco has three separate publications to better serve itsmain stakeholders.
The Annual Report fulfills the legal requirements for infor-mation. It also includes information of specific interest to theinvestor community.
Achieve presents how Atlas Copco works to reach itsvision. Strategic moves are highlighted and the Group
communicates what Atlas Copco is focusing on. In this publi-cation you can also read how the President and CEO GunnarBrock describes the Group in-depth.
The Sustainability Report is Atlas Copco’s report on envi-ronmental and social issues.
All reports are available in pdf format on the Group’s website www.atlascopco-group.com.
Achieve and the Sustainability Report are not part of theAnnual Report and they are not audited.
Atlas Copco AB and its subsidiaries are sometimes referred toas the Atlas Copco Group, the Group, or Atlas Copco. AtlasCopco AB is also sometimes referred to as Atlas Copco. Anymention of the Board of Directors or the Directors refers to theBoard of Directors of Atlas Copco AB.
Atlas Copco Annual Report 2002 02
Atlas Copco’s revenues declined 7% to MSEK 47,562. Excluding goodwill impairment charge, operating profit was MSEK 5,261, corresponding to a margin of 11.1% (12.0), and earnings per share decreased to SEK 13.88 (14.63).
AchieveAtlas Copco Operational Report 2002
Inventions, Innovations, and Incremental Improvements
The Rush is on for Growth in Russia
Committed to Demanding Customers
Atlas Copco Sustainability Report 2002 02
Stable level of value added despite lower profits. Stable environmentaland workplace performance. ISO-certified environmental managementsystems implemented in almost all divisions.
3A T L A S C O P C O 2 0 0 2
Atlas Copco 2002 Summary• Tough business environment affected demand negatively.
• Strengthened market positions through product and market investmentsas well as acquisition of complementary businesses.
• The Board of Directors proposes a dividend of SEK 5.75 (5.50) per share,the 9th consecutive year with an increase.
• Continued strong cash generation with operating cash flow of MSEK 5,599 (5,744).
• Goodwill impairment charge in the Rental Service business area of MSEK –6,798, net after tax, lead to a loss per share of SEK –18.55.
• Excluding the goodwill impairment charge, the operating profit was MSEK 5,261 (6,130), a margin of 11.1% (12.0), the profit after financial items MSEK 4,481 (4,700), a margin of 9.4% (9.2) and earnings per shareSEK 13.88 (14.63).
• Order volume for comparable units declined 2%.
• Revenues declined to MSEK 47,562 (51,139), affected by a 5% negativetranslation effect from foreign exchange rate fluctuations. Volumedeclined 3%.
• Sales in high potential markets as China and Russia increased sharply.
• The Group successfully launched innovative products and completedfurther investments in research and development facilities.
• Improved manufacturing and supply-chain structure in the Group.
0201009998
Revenues and earnings per share
Revenues
Earnings per share*
*) Excluding goodwill impairment charge 2002.
60,000
50,000
40,000
30,000
20,000
10,000
0
18
15
12
9
6
3
0
MSEK SEK
4 A T L A S C O P C O 2 0 0 2
AT L A S C O P C O G R O U P
% of revenues Business concept Brands*
* Registered trademarks.
33%
16%
24%
27%
Compressor Technique develops, manufactures,markets and distributes oil-free and oil-injected aircompressors, portable air compressors, gas-and-process compressors, turbo expanders, electricalpower generators, air treatment equipment (suchas compressed air dryers, coolers and filters), air management systems, and a variety of aftermarketproducts. Compressor Technique has advancedresearch and development facilities for its coretechnology areas, as well as assembly facilitiesand the manufacturing capability for productionof compressor elements and other core compo-nents. Furthermore, the business area offers spe-cialty rental services based on compressors andgenerators.
Construction and Mining Technique develops,manufactures, and markets rock drills, rockdrilling tools, tunneling and mining equipment,surface drilling equipment, construction tools,and equipment for exploration drilling andground engineering applications.
Industrial Technique develops, manufactures, andmarkets industrial power tools and assembly sys-tems, as well as professional electric power tools.It serves the needs of advanced industrial manu-facturing like the automotive and the aerospaceindustries, industrial maintenance, light construc-tion, and building installations.
Rental Service satisfies customer needs for rentalequipment, new and used equipment sales, andmaintenance and service through its NorthAmerican network of more than 500 stores in theUnited States, Canada, and Mexico. The focus isto offer a comprehensive range of high-qualityproducts and services mainly to the constructionand manufacturing industries. Rental Service isthe second largest equipment rental company inNorth America.
Ren
tal S
ervi
ceC
om
pre
sso
r Te
chn
iqu
e In
du
stri
al T
ech
niq
ue
Co
nst
ruct
ion
an
d M
inin
g T
ech
niq
ue
Facts in Brief
5A T L A S C O P C O 2 0 0 2
AT L A S C O P C O G R O U P
Customers/Applications Characteristics Key events in 2002
The products are intended for a wide spectrum ofapplications where compressed air is used as asource of power, or where it plays an active rolein industrial processes. Clean, dry, oil-free qualityair is the preferred solution for applicationswhere compressed air comes into direct contactwith the end product. Air treatment equipment isfully integrated in the compressor package, orcan be installed separately. Portable compressorsand engine-driven electric power generators area reliable power source for machines and tools inthe construction sector, but also in numerousother industrial applications. Gas and processcompressors and expanders are supplied to vari-ous process industries.
The continued success of Compressor Techniqueand its position as the global industry leader isbased on Atlas Copco’s philosophy to be andremain first in mind—first in choice throughproduct innovation and customer interaction andcommitment. This is a solid position maintainedand driven by continuous research and develop-ment in compressor technology and in fieldsrelated to energy savings and environmentalcare. All major operations are certified accordingto ISO 9001 for Quality Management and to ISO14001 for Environmental Management.
• Continuous flow of innovative new products.
• Expansion in new markets.
• Acquisition of Liutech in China.
• New product development facility for small andmedium sized industrial compressors.
The products are sold, rented, and serviced forbuilding and construction companies, largeinfrastructure projects, quarries, and miningcompanies around the world. The business areahas its principal manufacturing plants inSweden, South Africa, United States, Canada,and India.
Construction and Mining Technique builds itsbusiness on its well-established reputation as aglobal supplier of state-of-the-art products forthe construction and mining segments. The busi-ness area aims to safeguard its position as aleader in terms of quality, reliability, productivity,service, the environment, and ergonomics.
• Solid volume growth.
• Acquisitions further strengthens market position.
• Consolidation of manufacturing to Örebro andFagersta, Sweden.
• Strong development of use-of-products revenues.
Industrial Technique is the world leader in indus-trial tools and assembly systems for safety-criti-cal joints. Industrial tools are used for manufac-turing applications like assembling, fastening,tightening, drilling, grinding, and riveting.Assembly systems are supplied primarily to themotor vehicle industry for multiple and synchro-nized nut tightening. Professional electric toolsare used for light construction and buildinginstallations in the industrial, commercial, andresidential construction markets.
Industrial Technique’s success is based on inten-sive research and development, innovative prod-ucts with extraordinary performance, the abilityto serve customers on a global basis, a uniquedistribution system, and products carrying worldfamous brands. Industrial Technique is the sec-ond largest manufacturer in North America forprofessional electric tools and among the top fivemanufacturers worldwide.
• Enhanced penetration and increased sales tothe motor vehicle industry.
• Successful launch of Milwaukee heavy-dutyelectric tools in Europe.
• Increased pace of product development andcontinuous launch of products.
• Strengthening of manufacturing and supplychain structure.
Rental Service serves a well-balanced and diver-sified customer base of contractors, industrialcompanies, and homeowners with differentneeds and activities. Rental Service fulfills therental and sales demands of the construction,industrial/petrochemical, manufacturing, govern-ment, and homeowner markets. Rental Servicehas more than 330,000 active customers in theUnited States, Canada, and Mexico. With astrong North American competition base, RentalService strives to set itself apart from the restwith superior customer service, quality equip-ment, and aggressive pricing to serve as everycustomer’s complete equipment provider.
Rental Service has developed its strong marketposition by applying superior service concepts,efficient information systems, and economies ofscale to logistics and purchasing. Highlights ofits business that benefit Rental Service cus-tomers: 24/7 Customer Care, short- or long-termrentals, customized rental programs, nationalaccount programs, equipment delivery and pickup, new and used equipment, small tools andsupplies for sale, and rent to own/rental pur-chase option programs.
• Decentralized organization with focus toimprove service to customers.
• Continuous efficiency improvements.
• Strong cash flow.
• Goodwill impairment.
Atlas Copco is a global industrial group headquartered in Stockholm,
Sweden. Revenues for 2002 totaled MSEK 47,562, MEUR 5,200. The Group
employs close to 26,000 people and manufactures products in 15 countries
on five continents. The products are sold and rented under different brands through a worldwide sales and
service network reaching some 150 countries, half of which are served by wholly or partly owned companies.
Financial targets over a business cycle Target Last 5-yearRevenue growth (%) 8 9.6Operating margin (%) 15 12.4
For 2002, Atlas Copco’sprofit after financial items,but excluding the goodwillcharge, was somewhat lowerthan in the preceding year.In the same period, a solidcash flow contributed to animproved financial positionfor the Group, with adecreased net borrowing.
The goodwill impairmentcharge in itself has no effecton the cash flow and doesnot affect the dividend cap-acity in 2002. Therefore,I have the pleasure to report that a dividend to shareholders of 5.75 is proposed by the board, an increase for the ninth con-secutive year.
Professional workThe prevailing business climate required urgent performancefrom all employees—from decision to action—and a continuedstrong focus on core activities. The Board is grateful for the com-mitment and the professional work conducted by Atlas Copcoemployees around the world. In a tough economic environmentthey have managed to maintain or improve their market posi-tions. Innovation, one of the Group’s core values, has material-ized in the large number of new products launched in the year.
On July 1, Gunnar Brock took on the position as Presidentand CEO for the Atlas Copco Group. He replaced Giulio Mazzalupi, who retired after 31 years in the Group. Brock hasduring his short period with the company worked intensively to reinforce and increase customer focus. With his broad knowl-edge and long international career he will no doubt contributein a positive way, enhancing product development, marketexpansion and use-of-products activities.
On behalf of the Board, I would like to express my warmestthanks to Group Management and to all employees in the Groupfor their contribution during the year.
Thank you!
Anders Scharp, Chairman of the Board
Stockholm, Sweden, February 3, 2003
6 A T L A S C O P C O 2 0 0 2
C H A I R M A N O F T H E B O A R D
The world economy deteriorated during the latter part of 2001and, with few exceptions, economic growth stalled or turnednegative. This situation was also significant for the business climate prevailing during 2002. The North American marketwas characterized by an overall low investment level, some-thing that was also significant for Europe. One exception wasAsia, where especially China continued to show solid growth.By the end of the year some positive signs of a recovery wereshown, but it is very uncertain whether this is really the begin-ning of an economic upturn.
An objective for Atlas Copco is to develop its global presenceand grow in markets where there is still a large potential for theGroup. Examples of such markets are chiefly countries in Asia,but also Eastern Europe and the United States. In 2002, theGroup expanded further in China, and also acquired a Chinesecompressor manufacturer. In Russia, the Group set up new salesand service offices to provide a better support to customers.
Atlas Copco’s use-of-products strategy has been establishedfor a long time in all business areas in the Group. The strategycomprises service and spare parts, accessories and consumables,and equipment rental. The objective is to increase revenuesthroughout the time the products are in use at the customers.This is a way to reduce the sensitivity to business cyclicality and,at the same time, this business has generally a higher profitability.
The major acquisitions of equipment rental companies inthe United States in 1997 and 1999, were important steps inthis use-of-products strategy. We are convinced that this was theright move for Atlas Copco to take, even if we have learned thatthe timing of the acquisitions was not the best. During theautumn, Atlas Copco recorded an impairment charge in theRental Service business area, as the expected financial returnsof the rental business did not fully justify the acquisition costsof the rental companies. These companies were acquired at atime of substantially higher market valuations than today.
From the owners’ viewpointThe Atlas Copco Group has set financial targets to ensure thatshareholder value is created and continuously increased. Theoverall objective is to achieve a return on capital employed thatalways exceeds the Group’s total capital cost. The targets are to have an average annual revenue growth of 8%, an operatingmargin of 15%, and to steadily improve the efficiency of oper-ating capital in terms of inventory, receivables, and rental fleetutilization. Atlas Copco’s targets are intended to be achievedover a business cycle. Furthermore, all operational units muststrive for stability first, followed by profitability, and finallygrowth. This proven development process will be pursued toensure that financial targets are reached.
Fellow Shareholders
Seen and judged against the2002 perspectives, it is encour-aging to note that the overallperformance of Atlas Copcomust be considered satisfac-tory and our competitive posi-tion has been strengthened onmany markets.
The general business cli-mate weakened compared to2001. The major customersegment for Atlas Copco—the construction industry ingeneral and the non-residen-tial construction sector in
particular—showed a significant fall in demand in both NorthAmerica and Europe. The general industry had a weak demand,the motor vehicle industry was stable and the mining industryshowed a relatively good growth. Capacity utilization in mostindustries remained on a low level.
During 2002 the U.S. dollar declined sharply and the year-endrate in relation to the Swedish krona was 17% lower than at thebeginning of the year. As Atlas Copco invoices a large part of itsproducts and services in U.S. dollars, this represented a challenge.
The effort invested in improving our efficiency has paid offin the generation of high and stable operational cash flow.This has provided the opportunity to substantially reduce ourinterest bearing debt through the repayment of approximately 3,500.
Group achievementsOur largest business area, Compressor Technique, performedwell. This goes particularly for the stationary industrial com-pressor business and aftermarket activities. However, we experi-enced weak sales for portable compressors. We want continuedgrowth in China and the Chinese compressor manufacturer,Liuzhou Tech Machinery Co. Ltd, was acquired in the year.
The weak activity levels in the North American market hada negative effect on the Rental Service business area, and boththe construction and industrial rental activity suffered. Force-ful actions to reduce cost and improve capital efficiency weretaken during the year. Alongside a reduction in the number ofrental stores in low-potential areas and a reduction of the totalrental fleet, the availability of the rental fleet was improved andthe utilization rate increased. These actions imply that whenthe economy turns, we will stand strong.
The Industrial Technique business area continued successfullyto further increase sales of sophisticated fastening tools and
Observations on 2002
7A T L A S C O P C O 2 0 0 2
P R E S I D E N T A N D C E O
systems to the motor vehicle industry. The professional electrictools business increased sales in many markets, following a dif-ficult year in 2001. One of the larger marketing activities forelectric professional tools was the launch of the Milwaukeebrand to the European market.
Overall, order volumes for our Construction and MiningTechnique business area increased in 2002. In line with the mar-ket development, sales of rock drilling equipment, loaders,associated consumables, spare parts, and service increased,while exploration equipment sales declined. To better serve themining industry, the drill rig and loader business will be inte-grated into one division in Sweden. German manufacturer,Krupp Berco Bautechnik GmbH, was acquired to complementthe range of hydraulic breakers and demolition tools for theconstruction industry.
Setting prioritiesTo grow profitably must be seen as a priority in order to gener-ate value for those who have invested in the Group. This doesnot only relate to a financial investment in our Group, but alsoto all those employees who invest their time in the company. Allin all, this contributes to the solid platform that we will buildupon during 2003.
During the year there has been an increase in resources devotedto product innovations and to the development of services. Therange of oil-free VSD (variable speed drive) compressors wasextended. A number of new tools, both for industrial and profes-sional use, were brought to market. With increased customer productivity in mind, a computerized surface crawler drill waslaunched, enabling an increased production capacity of 10–15%.
There is a large concentration of our sales in North Americaand Europe and, whilst much effort is devoted to even furtherimproving our positions in these areas, it is in Asia, EasternEurope and Russia where major market investment is and willcontinue to be undertaken.
By delivering products and systems, that increase the com-petitiveness of our customers and minimize their environmentalimpact, we can help them grow. By having an efficient aftermar-ket and service function we can contribute towards increasingthe efficiency and reliability of our products.
Thank you for your support!
Gunnar Brock, President and Chief Executive Officer
Stockholm, Sweden, February 3, 2003
The Atlas Copco Group’s revenues decreased 7% in 2002,to MSEK 47,562 (51,139). Markets outside Sweden account-ed for 98% of revenues. Orders received declined 6%, atMSEK 47,946 (50,916). For comparable units, volumes ofrevenues and orders received declined 3% and 2%respectively.
Operating loss/profit was MSEK –1,689 (6,130). TheGroup’s loss/profit after financial items amounted to MSEK
–2,469 (4,700). An impairment charge of goodwill of MSEK
6,950 was recorded during the year. Excluding the good-will impairment, the operating profit was MSEK 5,261, corre-sponding to a margin of 11.1% (12.0). The profit after finan-cial items was MSEK 4,481, and the margin was 9.4% (9.2).
Loss per share was SEK –18.55. Excluding the goodwillimpairment charge, earnings per share amounted toSEK 13.88 (14.63)
Dividend The Board of Directors proposes a dividend of SEK 5.75 (5.50) per share.
Most recent outlook (February 3, 2003) Overall, the demand for Atlas Copco’s products and services is expected to remainunchanged during the coming quarter, but the political situation in the Middle East has increased the uncertainty.
Demand for rental equipment in the United States is expected to stay at the present level, adjusted for normal seasonalweakness in the first quarter.
8 A T L A S C O P C O 2 0 0 2
B O A R D O F D I R E C T O R S’ R E P O RT
Board of Directors’ Report on 2002 operationsMSEK unless otherwise indicated, numbers in parentheses represent comparative figures for the preceding year.
Forward-looking statements: Some statements in this report are forward-looking, and the actual outcomes could be materially different. In additionto the factors explicitly discussed, other factors could have a materialeffect on the actual outcomes. Such factors include, but are not limited to,
general business conditions, fluctuations in exchange rates and interestrates, political developments, the impact of competing products and theirpricing, product development, commercialization and technological diffi-culties, interruptions in supply, and major customer credit losses.
The Atlas Copco Group has a global market presence and strivesto maintain close and long-term relationships with its customers.Products and services are marketed through the Group’s ownsales operations in close to 70 countries and through distributorsand a service network in another 80 countries.
North America is the largest market for Atlas Copco, repre-senting 48% of orders received. The second largest region,Europe, accounted for 32% of the Group’s business. Asia, wherethe Group’s long-term goal is to have the same presence in termsof sales, service, and assembly as it has in North America andEurope, accounted for 10% of order intake. Atlas Copco isdetermined to expand the relative share of emerging markets.
Order volumes increased in Europe, Asia/Australia and
0201009998
Revenues and orders received
55,000
44,000
33,000
22,000
11,000
0
MSEK
Revenues
Orders received
Revenues
55,000
44,000
33,000
22,000
11,000
0
MSEK
I II III IV I II III IV I II III IV00 01 02
12-month figures3-month figures
9A T L A S C O P C O 2 0 0 2
B O A R D O F D I R E C T O R S ’ R E P O RT
Africa/Middle East and decreased in North and South America.The decline in volumes in North America, which was furtheramplified by a negative currency translation impact, led to areduced share of revenues coming from the region. Overall,order volumes decreased 2%.
Industry segmentsConstructionThe construction industry segment consists of building (residentialand non-residential) and non-building/infrastructure andaccounted for about 38% (42) of the Group’s sales.
Business activity in the construction segment continued tobe weak in 2002, particularly in the non-residential buildingsegment in the United States. Weakness in this segment affectedprimarily the equipment rental business, which supplies customerswith rental machinery, new and used equipment, parts, merchan-dise, and service. The weak market conditions, which also pre-vailed in Europe, also negatively affected demand for portablecompressors and light construction equipment. However, somelarge infrastructure projects improved demand for rock drillingequipment.
The building industry uses electric tools for installation andlight construction. Demand was stable in North America, dueto a relatively high level of activity in the residential buildingsegment but was, however, weak in Europe.
MiningMining represented approximately 8% (8) of sales.
The most important products offered to the mining industryare drilling rigs, rock tools, and loaders. Compressors are alsosold to mines. Sales of equipment, consumables, service andspare parts developed favorably.
ManufacturingThe manufacturing industry accounted for approximately 24%(24) of sales.
Compressors and related equipment are used in most manu-facturing operations, including machinery and electronics.
Sales of all types of indus-trial compressors improvedduring the year. New prod-ucts performed strongly andcaptured market shares.
Manufacturing industryuse industrial tools, systemsand service. Demand forindustrial tools continued theweakening trend that startedin 2001 and sales volumesdecreased overall. However,as a result of improved pene-tration in the market, AtlasCopco increased its sales tothe motor vehicle industry,which is the most importantsegment for industrial tools.
Demand for equipmentrental services from industrial
customers weakened as low capacity utilization and low industrialactivity characterized the sector.
ProcessThe process industry, including chemical and petrochemical,food, and textile, accounted for about 13% (12) of Group sales.
Customers in this sector demand mainly large air and processcompressors, but also rental equipment for maintenance andoverhaul. Demand improved for large standardized air andprocess compressors. However, demand for rental equipmentwas weak.
ServiceThe service industry, including commercial and public services andutilities, represented about 7% (6) of sales. Compressed air solu-tions and equipment rental services are in demand from this seg-ment.
OtherOther customer groups, such as distributors of tools and machineryand the entertainment industry, represented approximately 10% (8)of the Group’s sales.
Geographic distribution of orders received
■ Portion of Group orders received
■ Change in value, MSEK, 2002/2001
3 % –24 %
48 % –12 % 32 % 0 %
5 % +7 %12 % +7 %
Mining 8%
Construction industry 38%
Manufacturing industry 24%
Process industry 13%
Service industry 7%
Other 10%
Orders received by customer category
Geographic distribution of orders received, %Group CT RS IT CMT GroupNorth America 14 100 56 18 48South America 5 1 8 3Europe 51 35 41 32Africa/Middle East 7 2 14 5Asia/Australia 23 6 19 12Total 100 100 100 100 100
10 A T L A S C O P C O 2 0 0 2
B O A R D O F D I R E C T O R S ’ R E P O RT
0201009998
Return and capital turnover
Capital turnover, ratio*
Return on capital employed*, %
Return on equity*, %
Weighted average cost of capital after tax, %
28
24
20
16
12
8
4
0
1.40
1.20
1.00
0.80
0.60
0.40
0.20
0
% ratio
0201009998
Profit margin
Operating profit margin*
Profit margin after financialitems*
14
12
10
8
6
4
2
0
%
Key figures by business areaInvestments in
Restructuring Return on capital Fixed assets, incl.Revenues Operating profit costs employed, % rental fleet
2002 2002* 2001Revenues 47,562 47,562 51,139Operating loss/profit –1,689 5,261 6,130Operating margin, % –3.6 11.1 12.0Loss/profit after financial items –2,469 4,481 4,700Profit margin, % –5.2 9.4 9.2Loss/earnings per share, SEK –18.55 13.88 14.63Return on capital employed, % –3.2 12.3 12.6Return on equity, % –16.2 10.9 11.7
*) Excluding goodwill impairment charge.
Revenues for the Group decreased 7% to 47,562 (51,139),affected by a 5% negative translation effect from foreignexchange rate fluctuations. Volume declined 3% for comparableunits, mainly due to the Rental Service (–9%) and CompressorTechnique (–4%) business areas partly offset by volume increase(+5%) in Construction and Mining Technique and a flat volumedevelopment in Industrial Technique. Structural changes (acqui-sitions and divestments) contributed with a 1% increase to therevenues. See also business area sections and page 36.
In the third quarter, Atlas Copco recorded an impairment
charge of goodwill related to acquisitions in the Rental Servicebusiness area of 6,950. After the tax effects of 152,this corresponds to 32.43 per share. The charge has no cashflow effect and does not affect the company’s dividend capacityfor 2002.
During the last two years, non-residential building activitiesin the United States have fallen substantially. The resultinglower demand, combined with an oversupply of rental equip-ment in the industry, has made the marketplace very competi-tive. The weak market caused the Group to reassess theassumptions for average revenue growth and rental rates, whichwere used at the time of the acquisitions. As a consequence, theexpected financial returns of the rental business did not fully jus-tify the acquisition costs of the rental companies, which wereacquired at a time of substantially higher market valuations.
The size of the charge is a result of an impairment test (inaccordance with Swedish GAAP/IAS), whereby the presentvalue of future, estimated, cash flow is compared with the bookvalues of the related business.
The underlying facts and reasons as to why Atlas Copcoentered into the equipment rental business are still valid. Thetrend towards outsourcing continues, i.e. to rent instead ofown, and companies look for suppliers that offer the functionrather than the product. Providing a rental service is in line withAtlas Copco’s “use-of-products” strategy and allows theGroup to come closer to the end user, which in itself has substan-tial merits.
The Rental Service business area has carried out an aggres-sive rationalization and is continuously adapting to the currentmarket conditions. With a very good cash flow and a more effi-cient rental operation, the business area is well positioned to growand improve profitability as the demand improves. The long-termprospects for the equipment rental industry are considered good.
The impairment charge is included in the reported operat-ing profit, but has been excluded from the analysis of earn-ings and return in the section below in order to enhance com-parability with previous year.
EarningsOperating profit declined 869, or 14%, to 5,261(6,130), and the operating profit margin decreased to 11.1%(12.0). Profit was affected by restructuring costs of 116(260), 68 in the Construction & Mining Technique busi-ness area and 48 in Industrial Technique. The precedingyear included restructuring costs of 160 and 100 inthe Rental Service and Industrial Technique business areas,respectively. In addition, new accounting standards related tocapitalization of development costs, the adjustment of rental*) Excluding goodwill impairment charge 2002.
11A T L A S C O P C O 2 0 0 2
B O A R D O F D I R E C T O R S ’ R E P O RT
invoicing volumes. Restructuring costs for the transfer of theloading business from Portland, Oregon, USA to Örebro, Swe-den, amounting to 68 , was charged to the 2002 result.Excluding this and the effect of changed accounting standardsfor development costs, the profit margin was 9.2%. Return oncapital employed, including the restructuring costs, was 20% (23).
The Group’s net financial items totaled –780 (–1,430),of which net interest items were –722 (–1,402). Interestexpense declined considerably because of strong operating cashflow during the year, lower interest rates and successful interestrate management. Financial foreign exchange differences were –62 (–33), and other financial income equaled 4 (5).
Atlas Copco Group profit after financial items declined to 4,481 (4,700). Excluding restructuring costs and otheritems affecting comparability, profit decreased 868, andthe profit margin was 8.6% (9.7). The total negative effect offoreign exchange rate fluctuations was approximately 380.
Excluding the tax effect of goodwill impairment, taxes forthe year totaled 1,513 (1,622), corresponding to 33.8%(34.5) of profit after financial items, see also Note 8.
Excluding the goodwill impairment charge, net profit for the year amounted to 2,909 (3,067). Earnings per shareequaled 13.88 (14.63), down 5%.
During the year, the Group’s total assets decreased 24% to
48,668 (64,357), primarily a result of the 6,950 impairmentcharge and foreign exchange translation effects caused by thestrengthening of the Swedish krona (approximately 12%). Thedecrease was also influenced by lower investment in the rentalfleet in the Rental Service business area and by reductions inworking capital, predominantly trade receivables.
The capital turnover ratio was 0.83 (0.78) (excluding theeffects of the impairment charge: 0.80). This ratio was heavilyimpacted by the rental business, which is more capital intensivethan the other businesses in the Group. Excluding the RentalService business area, the capital turnover ratio was 1.40 (1.36).
InvestmentsGross investment in rental equipment decreased to 2,144(2,751), while sales of used equipment totaled 1,402(2,145). The investments declined as a result of the lower cus-tomer demand and continued efforts to improve the fleet util-ization in the Rental Service operation. The drop in sales ofused equipment was primarily a result of active fleet restructur-ing efforts during 2001, which boosted sales in that year.
Investments in property and machinery totaled 965(951), in line with the annual depreciation. Investments in newequipment were made at several production plants in 2002.Major investments were made in Compressor Technique’smain plant in Antwerp, Belgium, and Milwaukee ElectricTool’s plants in the United States.
fleet useful life estimates, and reduced goodwill amortizationduring the fourth quarter, due to the impairment charge, hadpositive effects on the profit in 2002 compared to 2001 of
284, 170 and 51, respectively. Excluding all theseitems, operating profit declined to 4,872, correspondingto a profit margin of 10.2% (12.5). Operating profit decreasedmainly because of lower volumes, particularly lower rental reve-nues, and unfavorable fluctuations in foreign exchange rates. Theimpact from foreign exchange rate fluctuations, particularly theweakening of , was approximately –410, having aneffect of about –0.3 percentage points on the operating margin.
In 2002, depreciation and amortization totaled 3,956(4,556), of which rental equipment accounted for 2,333(2,874), property and machinery 943 (957), and amortiza-tion of intangible assets 680 (725). The Group appliesamortization periods of 40 years for goodwill arising from theacquisitions of the U.S. companies Milwaukee Electric Tool(acquired in 1995), Prime Service (1997), and Rental ServiceCorporation (1999) and up to 20 years for other acquisitions.See also page 42.
Return on capital employed decreased to 12.3% (12.6) and thereturn on shareholders’ equity to 10.9% (11.7). The Group uses aweighted average cost of capital (WACC) of 7.8%, correspondingto a pre-tax cost of capital of approximately 12%.
Operating profit for the Compressor Technique business areadecreased by 197 to 3,005 (3,202), corresponding toa margin of 18.8% (19.0). Lower invoicing volumes and unfa-vorable changes in exchange rates were the main reasons for thereduced profit. Excluding the effect of changed accounting forcapitalization of certain development costs, the profit marginwas 17.6%. The return on capital employed remained at a veryhigh level, 68% (69).
Operating profit for the Rental Service business area, includingordinary goodwill amortization, decreased to 686 (1,255).The profit margin was 5.3% (8.1). Lower rental rates and volumeshad a strong negative effect on the operating margin, which waspartly compensated by improved fleet utilization and reductionof operational costs. The revision of useful life estimates oncertain fleet categories at the beginning of the year resulted in a 170 lower depreciation expense as compared to the previousyear. The impairment charge in the third quarter led to 51lower goodwill amortization in the fourth quarter. A charge of 160 related to restructuring of the operations affected theresults for 2001. Return on capital employed was 3% (4).
Operating profit for the Industrial Technique business areadeclined 73 to 1,050 (1,123). Restructuring costs for theAtlas Copco Electric Tools division, including relocation of cer-tain assembly operations from Germany to the Czech Republic,amounted to 48. Previous year’s result included restructuringcosts of 100 mainly for the consolidation of production inthe Milwaukee Electric Tool division. The profit margin, exclud-ing restructuring costs and the effects of changed accounting stan-dards for development costs, decreased to 9.1% (10.1). This wasprimarily due to unfavorable changes in the sales mix betweenindustrial tools and professional electric tools and currencyexchange rates. Return on capital employed improved to 14% (13).
Operating profit for the Construction and Mining Techniquebusiness area decreased 56, to 680 (736), correspond-ing to a margin of 8.9% (10.1). The strong Swedish krona had anegative impact on profit, offsetting the positive effect from higher
12 A T L A S C O P C O 2 0 0 2
B O A R D O F D I R E C T O R S ’ R E P O RT
Geographic distribution of investments in tangible fixed assets including rental fleet
2002 2001North America 2,183 2,701South America 58 78Europe 720 740
of which Sweden 251 167Africa/Middle East 57 41Asia/Australia 91 142Total 3,109 3,702
Investments in other, financial and intangible, fixed assetsamounted to 349 (64), mainly related to capitalization ofcertain development costs according to new Swedish account-ing standards.
Inventories and trade receivablesThe value of inventories as a proportion of revenues rose to12.2% (11.7). Excluding Rental Service, the proportion was15.0% (14.4). The increase was mainly due to higher sales in theConstruction and Mining Technique business area with longerthroughput times than the other businesses areas.
Trade receivables in relation to revenues were 18.0% (19.7).This decrease resulted primarily from activities in all businessareas to improve control of receivables.
Cash flow and net indebtednessAt year-end, liquid funds amounted to 1,356 (1,343), equalto 3% (3) of revenues. To complement the relatively low level ofliquid funds, the Group has negotiated a committed stand-bycredit facility with banks. See Funding risk on page 53.
The operating cash surplus after tax (defined as revenuesless operating expenses after the reversal of non-cash items,such as depreciation and amortization, and after taxes) totaled 6,922 (6,771), equal to 15% (13) of Group revenues.
Working capital decreased 377 (385) in 2002 as a resultof decreased volumes and dedicated asset management activi-ties in all business areas. Net investment in tangible and otherfixed assets totaled 1,700 (1,412). Most of that increase
0201009998
Trade receivables
Trade receivables as % of revenues
Trade receivables, MSEK
12,000
10,000
8,000
6,000
4,000
2,000
0
MSEK
24
20
16
12
8
4
0
%
0201009998
Inventories
Inventories as % of revenues
Inventories, MSEK
6,000
5,000
4,000
3,000
2,000
1,000
0
MSEK
24
20
16
12
8
4
0
%
was attributable to the capitalization of product developmentcosts. Operating cash flow before acquisitions and dividendsamounted to 5,599 (5,744), equal to 12% (11) of Grouprevenues. Net payments for company acquisitions and divest-ments were 712 (300), mainly related to the acquisition ofKrupp Berco Bautechnik and Ankertechnik (MAI) in the Con-struction and Mining Technique business area.
Net cash flow, before change in interest-bearing liabilities, butafter dividends paid of 1,165 (1,125) was 3,722 (4,319).
The Group’s net indebtedness (defined as the differencebetween interest-bearing liabilities and liquid funds) amountedto 13,694 (20,078), of which 1,778 (1,736) wasattributable to pension provisions. The debt/equity ratio(defined as net indebtedness divided by shareholders’ equity)was 67% (72) (excluding impairment charge: 52%).
of which depreciation added back 3,956* 4,556Change in working capital 377 385Cash flow from operations 7,299 7,156Investments in tangible fixed assets –3,109 –3,702Sale of tangible fixed assets 1,758 2,354Company acquisitions/divestments –712 –300Other investments, net –349 –64Cash flow from investments –2,412 –1,712Dividends paid –1,165 –1,125Net cash flow 3,722 4,319
*) Excluding goodwill impairment charge.
Shareholders’ equityAt December 31, 2002, Group shareholders’equity includingminority interests totaled 20,354 (27,789). Shareholders’equity per share was 97 (133). Equity accounted for 42% (43)(excluding impairment charge: 48%) of total assets. Atlas Copco’stotal market capitalization on the Stockholmsbörsen at year-endwas 34,552 (48,176), or 171% (175) of net book value.
Changes in shareholders’ equity (excl. minority interest)MSEK 2002 2001Opening balance 27,568 23,982Dividend to shareholders –1,153 –1,100Provision for valuation ofemployee stock option program* –138 -Translation differences for the period –2,194 1,619Net profit for the period –3,889 3,067Closing balance 20,194 27,568
*) See page 13, Share value based Incentive Programs.
Asbestos cases in the United StatesAtlas Copco has, as of December 31, 2002, a total number of84 asbestos cases filed with a total of 16,556 individualclaimants. The average number of defendants was 163 com-panies per case. None of these cases identifies a specific AtlasCopco product.
In 2002 there was one case involving an identified Atlas Copcoproduct, as one among many other products. This case wassettled in the fourth quarter at an immaterial cost, substantiallylower than the deductible cost used in Atlas Copco’s insurances.
The Group has not deemed it necessary to book any provi-sions related to these pending cases.
13A T L A S C O P C O 2 0 0 2
B O A R D O F D I R E C T O R S ’ R E P O RT
Personnel2002 2001
Average number of employees, total 25,787 26,201Sweden 2,578 2,532Outside Sweden 23,209 23,669
Business areasCompressor Technique 8,625 8,577Rental Service 6,094 6,637Industrial Technique 5,798 5,986Construction and Mining Technique 4,706 4,540
Other 564 461
In 2002, the average number of employees in the Atlas CopcoGroup decreased by 414, to 25,787 (26,201). Of that total, 10%(10) were employed in Swedish units. See also Note 2. At year-end, the Group had a total of 25,705 employees (25,529). Forcomparable units, the number of employees decreased by 462during the year.
Share value based Incentive Programs During 1997–1999 a number of Group executives were grantedcall options on Atlas Copco shares free of charge. The optionswere issued by a third party. They have a term of six years fromgrant date. The call options may be transferred and may also beexercised after termination of Atlas Copco employment.
In 2000 the Board of Directors resolved to implement aworldwide incentive plan aimed at key employees in the Group.The plan mainly includes personnel stock options, which enti-tles holders to acquire Atlas Copco A shares at a pre-deter-mined exercise price. In some countries (USA, Belgium, Canada,India, Malaysia, and the Philippines) Share AppreciationRights (SARs) were granted instead due to legal and tax rea-sons. SARs do not entitle the holder to acquire shares, but onlyto receive the gain in cash. This gain is equal to the differencebetween the share price of the A-share at exercise and a fixedprice (grant value), corresponding to the exercise price of thestock options. Stock option/SAR grants have been offered eachyear during the period of 2000–2002.
The terms for the stock options/SARs are mainly the follow-ing. They have a term of six years from grant date and are issuedwith a limited right to be exercised during the first three yearsduring which they become exercisable with one third per year.Stock options/SARs expire if employment is terminated, butvested options and SARs are exercisable within one month(grant year 2000 and 2001) or three months (grant year 2002)after termination of employment (expires after 12 months in
case of retirement. They aregranted free of charge andare not transferable. Theexercise price/grant value isequal to 110% of the averageshare price during a limitedperiod before the grant date.
In 2002 stock options cor-responding to 461,588 sharesand SARs corresponding to384,196 shares were granted.Total market value as atDecember 31 has been esti-mated to 14. This valuehas been calculated by usingthe Black & Scholes model.
The purpose with theincentive plan is to retain keyemployees and align their performance with shareholders’ inter-est. The employees to whom stock options are granted are cho-sen on a wholly discretionary basis from year to year. The selec-tion criteria are position, performance and contribution.
Costs for incentive programsThe call option programs 1997–1999 have been issued by athird party and are neither expected to result in any future costsfor Atlas Copco nor any dilution of the holdings of the currentshareholders.
In order to secure the delivery of the shares for the employeestock options, to pay for cash settlement of the SARs and to paythe social fees that may arise in connection with the program, anagreement has been contracted with a third party bank. Underthis agreement, the bank acquires Atlas Copco shares in the openmarket. Also in accordance with this agreement and the terms ofthe option program, the bank will either deliver shares after pay-ment of the exercise price by the holder of the option or make acash payment equal to the difference between the share price atthe exercise date and the exercise price. The agreement insuresthat Atlas Copco does not have the risk of increases in the shareprice but does result in Atlas Copco being required to reimbursethe bank in those cases where the market value at the end of theoption period is less than the bank’s acquisition value. The agree-ment also requires that Atlas Copco pay the bank finance costsduring the term of the option program.In accordance with the terms of the agreement for the 2002options granted, Atlas Copco is liable for the difference between
Summary share value based incentive programs:Call Options Employee Stock Options SARs
Grant year 1997 1998 1999 2000 2001 2002 2000 2001 2002Initial number of employees 27 26 26 120 142 145 28 118 125Expiration date Feb. 14, Feb. 13, Feb. 11, April 26, May 13, May 12, April 26, May 13, May 12,
2003 2004 2005 2006 2007 2008 2006 2007 2008Exercise price/Grant value (SEK) 285* 250* 257 230 243 273 230 243 273Type of share A A A A A A A A ANumber, Jan. 1, 2002 54,191 66,422 64,054 403,544 447,768 0 93,976 362,084 0Exercised 2002, Number - 5,287 3,242 5,530 0 0 0 0 0Expired 2002, Number - - - 20,269 15,663 0 16,584 55,280 11,056Number, Dec. 31, 2002 54,191 61,135 60,812 377,745 432,105 456,060 77,392 306,804 381,432
*) Adjusted for 1999 new issue.
0201009998
Employees, average
30,000
25,000
20,000
15,000
10,000
5,000
0
Sweden
Outside Sweden
14 A T L A S C O P C O 2 0 0 2
B O A R D O F D I R E C T O R S ’ R E P O RT
Production and Product Development
2002 2001Research and development costs—expensed during the year 900 1,107—capitalized during the year,
net of amortization 284Total 1,184 1,107—as a percentage of revenues* 3.4 3.1
*) Excluding revenues from the business area Rental Service.
Production is concentrated in three main regions. About halfof the cost of manufactured goods sold originates from manu-
facturing in central Europe, mainly Belgium, Germany, GreatBritain, and France. The United States accounts for about 15%of all manufacturing and Sweden for about 20%. The remain-der of manufacturing is primarily in China, India, Brazil, andSouth Africa.
Continuous research and development to secure innovativeproducts are critical for maintaining the competitiveness ofAtlas Copco’s divisions. In 2002, the amount spent on theseactivities increased 77 compared to the preceding year.For further information see description under Business Areas.In accordance with Swedish accounting standards (RR 15) effec-tive January 1, 2002, certain development costs have been capital-ized if the product is technically and commercially feasible. Thecapitalized costs will be amortized over the estimated useful life.
Environmental ImpactAtlas Copco strives to conduct business in a manner that doesnot put the environment at risk, and complies with environ-mental legislation in its operations and processes. The Groupconducts operations requiring permission based on Swedishenvironmental regulations in five Swedish companies. Theseoperations mostly involve machining and assembly of compo-nents, and the permits refer to e.g. emissions to water and air,including noise pollution.
To support environmental efforts, Atlas Copco has a Group-wide policy that guides the organization. The Group has estab-lished an Environmental Council with representatives from eachbusiness area to promote this policy internally and ensure that therequired processes, as well as reporting procedures, are in place.
The policy states that all divisions in the Atlas Copco Groupmust implement an Environmental Management System (EMS)and major manufacturing sites should be certified in accordance
with the international standard, ISO 14001.At year-end 2002, 88 % (84) of the Group’s manufacturing
and logistics capacity had implemented EMS, and 80 % (74) hadISO 14001 certification. In 2002 a number of sites achieved ISO14001 certification, including tool production at CP Desoutterin Hemel Hempstead, Great Britain, Atlas Copco Tools andAssembly Systems’ Tierp Works, Sweden, and Atlas CopcoCraelius’ manufacturing unit in Märsta, Sweden.
Most products have a greater impact on the environmentduring the time it is in use than the impact that its manufacturehas. Environmental and ergonomic aspects have been integratedin Atlas Copco’s product development process for many years.A good example of this is the range of compressors with variablespeed drives, which consume up to 35% less energy than stan-dard compressors.
In May 2002, Atlas Copco published its first SustainabilityReport with a focus on environmental issues. The Group’s secondSustainability Report, covering 2002 performance, is availableat www.atlascopco-group.com.
Parent CompanyEarningsEarnings from shares in subsidiaries equaled 1,763 (1,685)and from associated companies 0 (7). Profit after financialitems totaled 1,365 (2,014). The Parent Company report-ed a net profit after appropriations and taxes of 899(1,589). Undistributed earnings totaled 4,801 (5,193).
Write-down of shares in subsidiariesAs a consequense of the impairment charge of goodwill recorded
by the Atlas Copco Group during the year, the Parent companyhas written down its holding in Atlas Copco North AmericaInc. by 710. See Note 13.
FinancingThe total assets of the Parent Company decreased 8,693,to 29,678. At year-end 2002, cash, bank deposits, and short-term investments amounted to 37 (9) and interest-bearingliabilities to 15,894 (23,257). Shareholders’ equity, includ-ing the equity portion of untaxed reserves, represents 43% (34)of total assets.
the share price as of the exercise date in May 2008 and the acqui-sition value of 248. For the options granted for 2001 and2000, the corresponding acquisition values were 220 and 209, respectively. As of December 31, 2002, the variance inthe share price and the acquisition values for the 2000, 2001 and2002 employee option programs amounted to 138. This
amount has been recorded as a provision as of December 31,2002, with a corresponding amount being recorded directly toequity.
The net finance and administration expenses for 2002 for thethree-option/SAR programs amounted to 15 (7) and areincluded in current earnings.
TargetsThe overall objective for the AtlasCopco Group is to achieve a returnon capital employed that willalways exceed the Group’s totalcost of capital while growing thesize of the business.
Financial targets for the next busi-ness cycle:• to have an average annual revenuegrowth of 8%,
• to have an average operating mar-gin of 15%, and
• to challenge continuously theoperating capital efficiency interms of stock, receivables, andrental fleet utilization.
This will lead to that share-holder value is created and continuously increased. The stra-tegy used for reaching these objectives will follow the provendevelopment process for all operational units in the Group:stability first, then profitability and finally growth.
Profitable growth is a top priority for the Atlas CopcoGroup. This growth must be accomplished with a balance oforganic and acquisition growth.
15A T L A S C O P C O 2 0 0 2
B O A R D O F D I R E C T O R S ’ R E P O RT
PersonnelThe average number of employees in the Parent Company was65 (58). Fees and other remuneration paid to the Board ofDirectors, the President, and other members of Group man-agement are specified in Note 2.
Distribution of sharesAt year-end, Atlas Copco had share capital totaling 1,048(1,048). Each share has a par value of 5. For further infor-mation, see page 60.
DividendThe Atlas Copco Group’s non-restricted shareholders’ equityequals 9,363. Of total retained earnings, 33 will betransferred to restricted reserves.
The Board of Directors proposes a dividend of 5.75(5.50) per share, corresponding to a total of 1,205 (1,153).See page 56.
Atlas Copco’s StrategiesThe Group focuses on organic growth, which is supported bycomplementary acquisitions. Market presence and expansionwill be achieved by offering new products developed from coretechnologies, by finding new applications in new market niches,increasing scope of supply, but also by increasing and/or byacquiring businesses that offer complementary products and/orservices. The Asian markets are a focus area, together withEastern Europe and the United States. The Group will alsoexpand revenues related to the “use-of-products”, such as serviceand maintenance, spare parts and accessories, consumables,and rental. These aftermarket activities help the Group form acloser relationship with its customers, and ensure even greaterparticipation in customers’ business activities.
The development of the Group’s products and core competencesis safeguarded by continuous improvements in existing operationsand by innovations. Continuous improvements in manufactur-ing, products, marketing, organization, and business flows areintended to provide customers with better service and to safe-guard short-term profitability. Break-through innovations are a means of staying ahead of the competition and maximizingperformance in the long run. The Group strongly supports specificprojects to foster innovation in technology, concepts, and methods.
The Group’s multi-brand strategy plays a significant role.To better satisfy specific customer needs, products and servicesare differentiated and marketed under various brands throughdifferent distribution channels. The Group owns more than 20brands, and each brand has a clear role and is justified when itadds to revenues and profit.
Atlas Copco expects all products and services to boost cus-tomers’ productivity and competitiveness. All divisions shouldbe leaders in the area of environmental protection, which willstrengthen their businesses. In the marketplace, Atlas Copcofocuses on being first in mind—first in choice of its customers.Surveys are continuously conducted to assess the success ofAtlas Copco companies in this regard.
0201009998 0201009998
Operating margin
Average 98–02
Target
Growth from previous year*
15
12
9
6
3
0
%
0201009998 0201009998
Revenue growth
Average 98–02
Target
Growth from previous year
40
30
20
10
0
–10
%
0201009998 0201009998
ROCE
Weighted average cost of capital (pretax)
Return on capital employed*
*) Excluding goodwill impairment charge 2002.
25
20
15
10
5
0
%
16 A T L A S C O P C O 2 0 0 2
B U S I N E S S A R E A R E V I E W
Compressor Technique• Continuous flow of innovative new products.
• Expansion in new markets.
• Acquistion of Liutech in China.
• New product development facility for small andmedium sized industrial compressors.
The Compressor Technique business area develops, manufac-tures, markets, distributes, and services oil-free and oil-injectedstationary air compressors, portable air compressors, gas andprocess compressors, turbo expanders, electrical power genera-tors, air treatment equipment (such as compressed air dryers,coolers, and filters) and air management systems. The businessarea also has in-house resources for basic development in its coretechnologies. In addition, the business area offers specialty rentalservices based on compressors and generators. Development,manufacturing, and assembly are concentrated in Belgium, withother units situated in the United States, Germany, France, Italy,Great Britain, China, India, and Brazil.
The multi-brand strategy is important for the business area,which owns a number of brands in addition to the Atlas Copcobrand. The other brands focus on specific customer segmentsand/or geographic regions.
The business area’s strategy is to further develop its leadingposition in the field of compressed air by capitalizing on its strongmarket presence worldwide, improving market penetration inAsia, North America, Middle East, and eastern Europe, and con-tinuously developing products and services to satisfy increasingdemands from customers. The strategy also includes developingthe generator business for portable and temporary power genera-tion and integral gear compressors for process gas applications.
Customers and product mixCompressor Technique has a diversified customer base. Thelargest customer segments are the manufacturing and processindustries, which together represent more than two thirds ofrevenues. The construction industry is also an important segment,primarily for portable compressors and generators. Customersare also found among utility companies and in the service sector.
The products are intended for a wide spectrum of applica-tions in which compressed air is either used as a source of powerin manufacturing or the construction industry or as active airin industrial processes. Clean, dry, and oil-free quality air ispreferred for applications in which compressed air comes intodirect contact with the end-product. Where Quality air applica-
tions play a major role in the customers’ processes, addedaccessories and services are becoming increasingly important.Portable compressors and diesel-driven electric power generatorsare reliable power sources for machines and tools in the construc-tion sector as well as in numerous industrial applications. Gasand process compressors are supplied to various process indus-tries, such as air separation plants, and to power utilities.
Stationary industrial compressors and associated air-treat-ment products and aftermarket activities represent about 70%of sales. The balance is represented by portable compressors,generators, specialty rental, and gas- and process compressors.
CompetitionCompressor Technique’s largest competitor in the market for aircompressors is Ingersoll-Rand. Other competitors are CompAir,Kaeser, Gardner-Denver, Sullair, Kobelco, and regional or localcompetitors. In the market for compressors for process gas appli-cations, the main competitors are MAN Turbo and Siemens.
Market reviewLow capacity utilization prevailed in most manufacturing andprocess industries, which affected demand particularly in theAmericas, but also in western Europe. Demand in Asia and east-ern Europe, however, developed favorably. Improved demand wasnoticed from China, United Kingdom, Italy and Russia, whilethe United States, France, Brazil and Japan weakened. The trendtowards more demanding air quality specifications continued todevelop favorably.
Portable compressors and generators, primarily servingconstruction-related customers through rental companies anddistributors, suffered from poor market conditions. Only a fewmarkets recorded increased demand.
2002 2001 2000Orders received 16,334 16,633 15,098Revenues 15,993 16,873 14,720Operating profit 3,005 3,202 2,737Operating margin, % 18.8 19.0 18.6Return on capital employed, % 68 69 62Investments 387 536 407Average number of employees 8,625 8,577 8,171
Revenues totaled 15,993 (16,873). Operating profit decre-ased to 3,005 (3,202), corresponding to a margin of 18.8%(19.0). The return on capital employed reached 68% (69).
Business developmentInvestments in market- and product development continued ona high level. Compressor Technique strengthened its position
17A T L A S C O P C O 2 0 0 2
B U S I N E S S A R E A R E V I E W
Bengt Kvarnbäck Oscar Duprix Luc Hendrickx
Ronnie Leten Filip Vandenberghe James Tapkas
Business area managementBusiness Area Executive: Bengt Kvarnbäck
Compressor Technique’s divisions are:
• Portable Air, President Oscar Duprix
• Oil-free Air, President Luc Hendrickx
• Industrial Air, President Ronnie Leten
• Airtec, President Filip Vandenberghe
• Atlas Copco Applied Compressor andExpander Technique*, President James Tapkas
*) The division changed name to Gas andProcess, January 1, 2003. President AndréSchmitz.
as world leader in the compressed air business.Good performance from the stationary industrial compressor
business and increased aftersales revenues did not fully mitigatethe weak demand from construction-related customers. This,together with negative currency effects, resulted in decreasedbusiness area revenues.
Orders received declined in volume by 1% in 2002, reflectinga weak market demand for portable compressors, particularlyfrom rental companies. Orders for industrial compressors andgas and process compressors for manufacturing and processindustries grew in volume.
Sales of industrial compressors and associated businessincreased mainly as a consequence of improved presence in themarket place, a strong product portfolio and successful productlaunches, resulting in increased market shares. The aftermarketbusiness continued to grow in all geographical areas.
Variable Speed Drive (VSD) regulation, both for oil-free andoil-injected compressors, kept growing. Customers continue todemand and favor lower energy consumption and lower noiselevels, as these features improve the workplace and the environ-ment and result in lower costs of operation.
Interaction with primary business partners via the Internetcontinued to develop favorably. Product information on Internetis provided in a multilingual format in 18 languages.
With the objective of increasing market penetration andfocus on the growing business potential, a new regional supportcenter is being set up in Bahrain. It will cover the countries inthe Gulf Cooperation Council and Yemen.
In April, the Chinese compressor manufacturer LiuzhouTech Machinery Co. Ltd, was acquired. The company assemblesoil-injected screw compressors and air dryers and has an estab-lished sales and service organization. It is part of the IndustrialAir division and continue to operate under its established brandLiutech. The acquisition is in line with the strategy to increasepresence in China.
Product development The business area develops new products that provide consider-able savings on energy costs for the customer and reduce envi-ronmental impacts. New products were continuously launched.
The range of oil-free VSD compressors was extended to coverthe entire range from 37 kW up to 900 kW, and a VSD version ofthe successful PETPACK® compressor for the PET bottle blow-ing industry was introduced. Also the range of oil-injected VSDcompressors was extended down to 18 kW. New regulators, whichallow remote monitoring via the Internet, and intelligent machinecontrol in order to manage compressed air systems multiple com-pressor installations in an even more efficient way, were devel-oped. A brand new tooth compression technology for smaller oil-free compressors, enabling a low-noise WorkPlace Air System®,was brought to market.
To further expand and enhance testing capacity and reducetime-to-market for more products, an investment was made in newlaboratory and test facilities for small and medium size industrialcompressors and air-treatment equipment.
Competence developmentCompetence mapping and development has received increasingattention and effort throughout the business area. Key compe-tencies have been identified and, as part of the knowledge man-
Share of Group revenues 33%
0201009998
Earnings and return
Return on capital employed, %
Operating profit, MSEK
3,500
2,800
2,100
1,400
700
0
100
80
60
40
20
0
MSEK
0201009998
Revenues
20,000
16,000
12,000
8,000
4,000
0
MSEK %
North America 14%
South America 5%
Europe 51%
Africa/Middle East 7%
Asia/Australia 23%
Revenue split
agement program, have been further developed and strength-ened through more training and mobility of employees.
18 A T L A S C O P C O 2 0 0 2
B U S I N E S S A R E A R E V I E W
Rental Service• Decentralized organization with focus to improve
service to customers.
• Continuous efficiency improvements.
• Strong cash flow.
• Goodwill impairment.
The Rental Service business area, with 506 rental stores through-out the United States, Canada, and Mexico, provides equipmentrental and related services to more than 330,000 customers inthe construction, industrial manufacturing, and homeownersegments. Sales of new and used equipment, spare parts, acces-sories, and merchandise support the business.
The strategy of the business area is to be the first choice forcustomers who rent equipment by offering a comprehensiverange of products, performing at optimum efficiency, and pro-viding services with proven benefits to customers. Availability,proximity, price, and quality are the key factors for success. Todefend and expand its strong market position, the business areaapplies a supply and service concept by means of a hub andsatellite structure.
The business area operates with three well-respected brands.RSC serves the construction market, comprised of heavyequipment and commercial construction, Prime Industrialfocuses on the industrial and petrochemical rental segments,and Prime Energy promotes its quality air, power generation,and temperature control business.
Customers and product mixRental Service has a diverse customer base in North America.The largest customer segment is construction, representingapproximately 65% of revenues. Non-residential constructionis by far the most important area, followed by activities associ-ated with residential building, home improvement, and non-building construction.
The industrial segment accounts for the remaining 35% oftotal revenues. The business area has a solid presence in thechemical, petrochemical, and oil and gas industries. Other keycustomer groups in the industrial segment are industrial manu-facturing, commercial services, and public services and utilities.
Rental revenue represents 70–75% of the business area’s rev-enues. The largest product groups in the rental fleet consist of aer-ial work platforms, forklifts, air compressors, excavators, loaders,backhoes, compaction equipment, and generators. These prod-ucts account for approximately 85% of rental revenues. About
10% of the rental fleet consists of Atlas Copco products. There isa potential to increase that share to 15% in the medium term.
The rental equipment is depreciated over an average of eightyears, down to 10% residual value, and the used equipment isnormally sold before it is fully depreciated. Sales of used equip-ment account for 10–15% of the business area’s revenues over abusiness cycle. The average age of the fleet increased during theyear as a result of a lower rate of investment in new fleet toadapt to the market conditions. Average age of the rental fleetat year-end was 42 months.
Products, merchandise and spare parts sold by the rentalstores account for 15–20% of total revenues. Retail showroomsoffer a wide range of displayed products from preferred brand-name vendors. Individual “product specials” are routinely pro-moted and displayed in a prominent showroom location.
CompetitionThe principal competitor in the North American equipmentrental market is United Rentals. Other large rental companiesinclude Hertz, Caterpillar (Cat Rental Stores), NationsRent,Neff, National Equipment Services, and Sunbelt. The equipmentrental market is fragmented and numerous local and regionalrental companies make up a large portion of the market.
Market reviewThe slowdown in construction activity, which started already in early 2001, continued throughout the year. Most significantwas the downturn in non-residential construction activity, whereactivity levels measured as dollars spent were approximately15% below previous year. Monetary and fiscal measures taken bythe Unites States’ government to support activity had littleeffect and did not mitigate the weak demand for constructionequipment. Low capacity utilization characterized the industrialsector and industrial activity decreased substantially.
2002 2001 2000Revenues 12,829 15,469 13,955Operating profit 686* 1,255 1,855Operating margin, % 5.3* 8.1 13.3Return on capital employed, % 3* 4 6Investments 2,019 2,467 5,570Average number of employees 6,094 6,637 7,048
*) Excluding goodwill impairment charge.
Rental Service revenues were 12,829 (15,469). Rental andrelated services accounted for 74% (72) of revenues; sales ofnew equipment, parts and related merchandise 17% (16); andsales of used equipment 9% (12). Operating profit was
686 (1,255), including goodwill amortization, but excluding the
19A T L A S C O P C O 2 0 0 2
B U S I N E S S A R E A R E V I E W
impairment charge of goodwill of 6,950. The operatingmargin, excluding the impairment charge, was 5.3% (8.1). Thereturn on capital employed was 3% (4), and the return on oper-ating capital was 6% (8).
Business developmentThe weak activity levels affected both construction and industrialrental activity resulting in a 6% drop in rental volume and a 4%drop in average rental rates. The weakness was more significantin the early part of the year, where rental volume declinedalmost 10% in volume. As from mid-year, the volume drop wasreduced to a low single digit rate and rental rates stabilized.The relative improvement was mainly attributable to improvedcustomer service, resulting in better presence among customersand increased market share.
Forceful actions to lower cost and improve capital efficiencywere taken during the year. The total number of employeesdecreased by 568 as the business area adapted to lower demandand increased the regional focus to improve customer service.As a consequence, the centrally located functions were down-sized. The business area consolidated 30 rental stores and opened6 sites to reach a total of 506 stores at year-end.
Alongside the reduction in the number of rental stores, theavailability of the rental fleet was improved by reducing theshare of the rental fleet which is not available for rent, due toservice, transportation etc. During the year the non-availablefleet was reduced by 30%, thus freeing up close to 2,000 offleet value. This improvement enabled the business area to fur-ther decrease the size of the rental fleet, and reduce capital tiedup, without affecting the service to the customers. Accordingly,replacement investments in rental equipment were limited andno growth investments were made, while sales of used equip-ment continued. As a consequence, cash generation was verystrong and the business area contributed significantly to theGroup’s operating cash flow.
A number of campaigns were initiated to promote rentalequipment services and to influence decision makers about thesignificant benefits of rental compared with ownership.
Development of servicesThe business area continued to develop its e-service solutionsduring the year. The on-line rental application, which is fullyintegrated with the rental operating system, was enhanced andintroduced to more select customers. The customer reportmanagement system was enhanced by several new features,enabling customers to improve their equipment management.
The on-line catalogue for used equipment containing some30,000 items, introduced in 2001, was further improved,attracting 40% more traffic.
Competence developmentInternally, the business area continues to grow its people. Someof the key training initiatives were: price and profit management,sales management, process improvement, coaching and training,successful teams, and communication with employees. Addition-ally, the Driver Training group provided safety driving programsas well as safety-related loading and unloading training. Aninternal e-portal was launched to increase efficiency in workflow.
Freek Nijdam
Business area managementBusiness Area Executive: Freek Nijdam, from February 28, 2002
Rental Service has one division:
• Rental Service Corporation, President Freek Nijdam
0201009998
Revenues
18,000
15,000
12,000
9,000
6,000
3,000
0
MSEK
Share of Group revenues 27%
0201009998
Earnings and return
Return on capital employed*, %
Operating profit*, MSEK
*) Including goodwill for acquisitions,but excluding goodwill impairmentcharge 2002.
2,100
1,750
1,400
1,050
700
350
0
MSEK
30
25
20
15
10
5
0
%
North America 100%
Revenue split
20 A T L A S C O P C O 2 0 0 2
B U S I N E S S A R E A R E V I E W
Industrial Technique• Enhanced penetration and increased sales to the
motor vehicle industry.
• Successful launch of Milwaukee heavy-duty electrictools in Europe.
• Increased pace of product development and continuous launch of products.
• Strengthening of manufacturing and supply chainstructure.
Industrial Technique’s business concept is to develop, manufac-ture, and market industrial power tools and assembly systems,as well as professional electric power tools. It serves the needsof advanced industrial manufacturing like the automotive and theaerospace industry, industrial maintenance, light constructionand building installations.
The brands used by Industrial Technique are among the mostrecognized in the industry: Atlas Copco, Milwaukee, AEG PowerTools, and CP Chicago Pneumatic. These are marketed andsold by Atlas Copco sales companies and industrial distributors.Industrial Technique operates plants in the United States, Sweden,Germany, France and Great Britain.
The objective of Industrial Technique is to reach a positionof first in mind—first choice for customers in the motor vehicleindustry and to become widely recognized in general industryfor its power tools and assembly systems. In professional electrictools, the objective is to become the first choice among profes-sional users. Industrial Technique seeks to increase revenues byexpanding service, accessory and system offers and by geographi-cal expansion. The business area continuously invests in productand process development in order to offer its customers a con-stant flow of innovative products and services.
Customer and product mixIndustrial Technique is the world leader in industrial tools andassembly systems for safety-critical joints. The business area isthe second largest manufacturer in North America of profes-sional electric tools. To meet exacting customer demands, thetools are efficient, reliable, ergonomic, and innovative.
The largest customer group for industrial power tools, systems,and service is the motor vehicle industry, representing more than20% of business area revenues, followed by the general industry.Half of the industrial tools and assembly systems revenues aregenerated in Europe and about one third in North America.
Professional electric tools are sold to contractors and to
tradesmen, often engaged in residential construction, throughindustrial distributors, specialty trade, and at home improve-ment stores. This customer segment represents more than halfof the business area revenues, with about two thirds of the salesin North America.
CompetitionIndustrial Technique’s competitors in the industrial tools businessinclude Ingersoll Rand, Cooper Industries, and several local orregional competitors from the United States, Europe, andJapan. Main competitors for professional electric tools areRobert Bosch GmbH and Black & Decker Corporation.
Market reviewDemand for industrial tools, systems, and service continued theweakening trend that started in 2001 in the first part of 2002,primarily caused by low investments from the general industryboth in Europe and North America. Some improvements fromgeneral industry could be seen late in the year. Starting at themodest levels of late 2001, overall investments from the motorvehicle industry were fairly even throughout the year. Demandfor standard industrial tools was weak in Europe, while electricindustrial tools with control units were in higher demand through-out the year.
Residential construction activity increased somewhat comparedto the previous year in the important North American marketand demand for professional electric tools improved accordingly.A slowdown was, however, noticed at the end of the year. InEurope, particularly in Germany, the demand was very low.
2002 2001 2000Orders received 11,502 12,068 11,425Revenues 11,481 12,126 11,454Operating profit 1,050 1,123 1,238Operating margin, % 9.1 9.3 10.8Return on capital employed, % 14 13 16Investments 296 340 322Average number of employees 5,798 5,986 6,759
Revenues totaled 11,481 (12,126). Operating profitdecreased 7% to 1,050 (1,123), corresponding to a profitmargin of 9.1% (9.3). The operating profit includes restructuringcosts of 48 (100). Return on capital employed was 14% (13).
Business developmentThe industrial tools business suffered from the prevailing weakdemand and overall orders declined in volume compared to 2001.Atlas Copco improved its presence and gained market share inthe area of sophisticated tools and systems to the important
21A T L A S C O P C O 2 0 0 2
B U S I N E S S A R E A R E V I E W
Göran Gezelius Dan Perry Peter Möller
Charlie Robison Åke Sundby
Business area managementBusiness Area Executive: Göran Gezelius
Industrial Technique’s divisions are:
• Milwaukee Electric Tool, President Dan Perry
• Atlas Copco Industrial Tools and Assembly Systems, President Peter MöllerPresident Fredrik Möller, from March 1, 2003
• Chicago Pneumatic, President Charlie Robison
• Atlas Copco Electric Tools, President Åke Sundby, from March 1, 2002
motor vehicle industry as sales to this segment increased. Parti-cularly in the second half of 2002, many important orders werereceived from customers in North America.
The Chicago Pneumatic division announced a program toconsolidate its production of pneumatic tools to Great Britainand to create a center of excellence in France for the division’sgrowing electric tool and assembly system business.
The professional electric tools business increased sales inmany markets, following a difficult year in 2001. Milwaukee Elec-tric Tool strengthened its presence in the North American marketthrough targeted marketing activities and by the introduction ofnew products. Additionally, market demand developed favorably.In Europe, a premium line of Milwaukee branded professionalelectric tools was launched. This introduction was successful andmitigated an otherwise weak demand.
Milwaukee Electric Tool’s program to strengthen its manufac-turing base in the United States progressed as planned. Impor-tant steps to create an efficient supply chain, anchored to the dis-tribution center in Olive Branch, Mississippi, and the componentplant in Jackson, Mississippi, were taken during the year. In addi-tion, an investment of 100 to expand production capacityand refine manufacturing technology for power tools accessoriesin the United States was decided in the year. The investment willbe completed at the end of 2003. In Europe, it was decided to setup an assembly plant in the Czech Republic. The plant will befully operational at the end of 2003. Costs related to these mea-sures were charged to the 2001 and 2002 accounts.
Product developmentThe business area makes significant investments in productdevelopment.
The industrial tool divisions launched a wide array of newtools and systems, among them an extremely powerful impactwrench based on a patented new motor, pneumatic drills andscrewdrivers, and a quality assurance system for controlledtightening tools.
The professional electric tools divisions launched numerousheavy-duty tools, extending the range of both corded and cord-less tools offered to their customers. The introduction of theMilwaukee brand and the inclusion of products from the AtlasCopco range created the first truly heavy-duty offer of electricpower tools to European professionals.
Competence developmentA focused activity during the year has been to offer appraisals,training and competence development for all employees in linewith or above target for Atlas Copco Group. Such targetsincludes 40 hours of training per employee and year and theright for each employee to have an appraisal talk with his/hersuperior once per year.
An important development of competence is to train cus-tomer service employees in order to enhance their skills andknowledge at the same rate at which our tools develop, fromrelatively standardized tools to advanced tool systems includ-ing software.
E-learning is gradually becoming more important. Thereare several Atlas Copco Group initiatives complemented bymany projects on division level, which has led to significantlyincreased numbers of E-learning program, courses etc. during2001 and 2002.
0201009998
Earnings and return
Return on capital employed, %
Operating profit, MSEK
1,500
1,250
1,000
750
500
250
0
MSEK
0201009998
Revenues
15,000
12,500
10,000
7,500
5,000
2,500
0
MSEK
North America 56%
South America 1%
Europe 35%
Africa/Middle East 2%
Asia/Australia 6%
Revenue split
Share of Group revenues 24%
30
25
20
15
10
5
0
%
22 A T L A S C O P C O 2 0 0 2
B U S I N E S S A R E A R E V I E W
Construction and Mining Technique• Solid volume growth.
• Acquisitions further strengthen market position.
• Consolidation of manufacturing to Örebro andFagersta, Sweden.
• Strong development of use-of-products revenues.
The Construction and Mining Technique business area develops,manufactures, and markets rock drilling tools, tunneling andmining equipment, surface drilling rigs, loading equipment,exploration drilling equipment, and construction tools.
The products are sold, rented, and serviced for building andconstruction companies, large infrastructure projects, quarries,and mining companies around the world. The business area hasits principal manufacturing plants in Sweden, the UnitedStates, and South Africa.
The business area aims to be first in mind—first in choice assupplier of equipment and aftermarket sevices for rock excava-tion and demolition applications to the mining and constructionindustry. The strategy is to maintain and reinforce its leadingmarket position as a global supplier for drilling and loadingapplications, to develop its positions in exploration drilling andlight construction equipment and to increase revenues fromuse-of-products by offering more aftermarket services to cus-tomers. This shall be accomplished through continuous devel-opment of products and services that enhance productivity,improved market penetration, and acquisitions of complemen-tary operations.
Customers and product mixA key customer segment for the business area is the mining sector, representing almost half of revenues, which includes pro-duction and development work for both underground and surfacemining. This segment requires rock-drilling equipment, rock tools,loading and haulage equipment, as well as exploration equipment.
Another key customer segment is construction, whichaccounts for about half of revenues. General and civil engi-neering contractors, often involved in infrastructure projectslike tunneling or dam construction, are important customersfor rock-drilling equipment and tools, while special trade con-tractors and rental companies are important customers forconstruction tools. The business area also has a rental operationfor rock-drilling equipment in Europe, specializing in infra-structure projects.
Both mining and contracting customers are vital groups for
use-of-products, such as consumables, maintenance contracts,service, parts, and rental. This part of revenues is steadilyincreasing.
CompetitionConstruction and Mining Technique’s principal competitor is Sandvik. Other competitors include Ingersoll-Rand andFurukawa in the market for drilling rigs and constructiontools; Boart Longyear for exploration drilling equipment androck-drilling tools; and Caterpillar Elphinstone for loadingequipment.
Market reviewIn the mining sector demand for equipment improved gradual-ly in the year, reflecting increased investments in rock drillingand loading equipment from existing mining operations.Development of new or existing mines was limited, whichaffected demand for exploration equipment and, to someextent, rock drilling equipment. Ore production remained sta-ble and the trend to outsource non-core activities continued,benefiting demand for service, consumables and spare parts.The improved demand was evident in all geographic regionsand especially strong in the Americas and the Africa/MiddleEast region.
Underground construction activity in projects (tunnelingand hydropower) was initially weak, but the trend broke in themiddle of the year supporting increased demand for rockdrilling equipment from all important markets. Demand forcrawler rigs for surface applications, like building stone pro-duction in quarries and rock excavation for road and railroadprojects, was healthy. Demand was strongest in North Americaand Europe. The aftermarket business sustained a good activitylevel. The general construction markets was weak, negativelyaffecting demand for light construction equipment.
2002 2001 2000Orders received 7,633 7,282 6,921Revenues 7,618 7,253 7,083Operating profit 680 736 650Operating margin, % 8.9 10.1 9.2Return on capital employed, % 20 23 21Investments 434 454 370Average number of employees 4,706 4,540 4,156
Revenues totaled 7,618 (7,253). Operating profit ended at 680 (736) and operating profit margin was 8.9% (10.1).The operating profit includes costs of 68 related torestructuring of the loader/truck production. Return on capitalemployed was 20% (23).
23A T L A S C O P C O 2 0 0 2
B U S I N E S S A R E A R E V I E W
Business developmentIn line with market trends, sales of rock drilling equipment,loaders, associated consumables, spare parts, and serviceincreased, while sales of exploration equipment declined.Orders for light construction equipment started the year ratherstrongly, but declined in the year as end markets weakened.Order volumes increased by 4% for comparable units. The businessarea continued to offer more services to its customers in responseto the trend to outsource non-core activities, such as cost permeter contracts for consumables and service contracts fordrilling equipment. The share of revenues that comes from use-of-products was 56% (58) of total revenues.
In April, the Austrian company Ankertechnik GmbH, therock reinforcement division of MAI International GmbH, withannual revenues of about 70, was acquired. The acquisi-tion complements the rock reinforcement product range and isin line with the strategy to increase the share of revenues thatcomes from use-of-products. The company is a part of theAtlas Copco Rock Drilling Equipment division.
Krupp Berco Bautechnik GmbH, which manufactureshydraulic breakers and demolitions tools and has annual rev-enues of about 600, was acquired in June. The company ispart of the Atlas Copco Construction Tools division and offers agood complement to the division’s product range.
In the beginning of October, the business area announcedthe decision to integrate its drill rig and loader/truck businessinto one division in Sweden. The transfer will be made in 2003and substantial synergies will be achieved in product develop-ment, manufacturing, purchasing, logistics, and administration.The decision also involves increased resources for productdevelopment for the loader/truck business.
The move of the manufacturing of rock drilling tools inÖstersund to the Fagersta plant in Sweden was completed dur-ing the year.
Product developmentCustomer productivity remained the focus of all new productdevelopment and a number of new and improved productswere launched.
A computerized surface crawler drill with a number of newfeatures, which enables increased production capacity by 10–15%,was introduced. Two new rock drills, 15 kW and 25 kW respec-tively, were successfully brought to market, improving the existingproduct range further. Atlas Copco Wagner introduced a 15 tonloader for underground mining and tunneling applications.
The Atlas Copco Construction Tools division introduced ahydraulic scaler used for scaling in tunnels and mines and AtlasCopco Secoroc extended futher the range of drifter equipment,which was successfully launched in 2001.
Competence developmentDuring the year, the business area held a variety of training ac-tivities involving products and business skills. The development of computer-based training advanced, and the business area con-tinued to develop software systems to support its customers.These training activities were carried out for customers andemployees and are also available on the Internet.
Björn Rosengren Lars Engström Patrik Nolåker
John Noordwijk Claes Ahrengart Johan Halling
Business area managementBusiness Area Executive: Björn Rosengren, from March 1, 2002
Construction and Mining Technique’s divisions are:
• Atlas Copco Rock Drilling Equipment,President Björn Rosengren, until June 20, 2002President Lars Engström, from July 1, 2002
• Atlas Copco Craelius, President Patrik Nolåker
• Atlas Copco Wagner, President John Noordwijk
• Atlas Copco Construction Tools, President Claes Ahrengart
• Atlas Copco Secoroc, President Johan Halling, from April 1, 2002
0201009998
Earnings and return
Return on capital employed, %
Operating profit, MSEK
900
750
600
450
300
150
0
MSEK
0201009998
Revenues
9,000
7,500
6,000
4,500
3,000
1,500
0
MSEK
North America 18%
South America 8%
Europe 41%
Africa/Middle East 14%
Asia/Australia 19%
Revenue split
Share of Group revenues 16%
30
25
20
15
10
5
0
%
24 A T L A S C O P C O 2 0 0 2
AT L A S C O P C O G R O U P
Consolidated Income StatementConsolidated Income StatementAmounts in MSEK 2002 2001
Revenues Note 1 47,562 51,139
Cost of goods sold –32,803 –35,134
Gross profit 14,759 16,005
Cost of marketing, administration,
research and development Note 3 –9,059 –9,092
Goodwill amortization Note 4, 11 –650 –713
Goodwill impairment Note 11 –6,950 -
Other income and expenses from operations Note 5 211 –70
Total shareholders’ equity and liabilities 48,668 64,357
Assets pledged Note 26 6 54
Contingent liabilities Note 26 1,797 1,953
Consolidated Balance Sheet
26 A T L A S C O P C O 2 0 0 2
Cash Flow StatementGroup Parent Company
Amounts in MSEK 2002 2001 2002 2001
Operations
Operating loss/profit –1,689 6,130 –143 –95
Depreciation and amortization 3,956 4,556 3 3
Goodwill impairment 6,950 -
Capital gain/loss and other non-cash items –447 –511 –2 –8
Operating cash surplus 8,770 10,175 –142 –100
Net financial income/expense –782 –1,433 2,232 2,108
Dividends from associated companies 2 9 - 7
Cash flow from equity hedge/other items 187 –439
Taxes paid –1,255 –1,541 –438 –327
Cash flow before change in working capital 6,922 6,771 1,652 1,688
Change in
Inventories –57 369
Operating receivables 289 535 –526 –325
Operating liabilities 145 –519 –1,174 294
Change in working capital 377 385 –1,700 –31
Cash flow from operations 7,299 7,156 –48 1,657
Investments
Investments in tangible fixed assets Note B –3,109 –3,702 –4 –2
Sale of tangible fixed assets Note B 1,758 2,354 - -
Investments in intangible assets –312 –7
Acquisition of subsidiaries Note C –706 –300 –105 –13
Divestment of subsidiaries Note C –6 - - -
Other investments, net –37 –57 3 –6
Cash flow from investments –2,412 –1,712 –106 –21
Financing
Dividends paid –1,165 –1,125 –1,153 –1,100
Change in interest-bearing liabilities –3,568 –4,280 1,335 –549
Cash flow from financing –4,733 –5,405 182 –1,649
Cash flow after financing 154 39 28 –13
Liquid funds
Liquid funds at beginning of year 1,343 1,237 9 22
Cash flow after financing 154 39 28 –13
Exchange-rate difference in liquid funds -141 67
Liquid funds at year end 1,356 1,343 37 9
AT L A S C O P C O
27A T L A S C O P C O 2 0 0 2
AT L A S C O P C O G R O U P
Notes to Atlas Copco GroupCash Flow StatementMSEK unless otherwise noted
Net cash flowGroup
2002 2001Cash flow from operations 7,299 7,156Cash flow from investments excl. company acquisitions/divestments –1,700 –1,412Cash flow from operations before financing 5,599 5,744Company acquisitions/divestments Note C –712 –300Dividends paid –1,165 –1,125Net cash flow Note A 3,722 4,319
Five year summary of cash flow statements 1998–2002Operating cash surplus after tax 28,760
of which depreciation added back 16,986Change in working capital –177Cash flow from operations 28,583
Investments in tangible fixed assets –19,141Sale of tangible fixed assets 8,189Company acquisitions/divestments –16,151Other investments, net –450Cash flow from investments –27,553
Dividends paid –4,916New issue of shares 4,125Net cash flow 239
—as a percentage of revenues 8.7 10.2 9.9 8.0 7.8 8.9 10.5** 10.5–48.1**
*) The operating margin of Rental Service including goodwill impairment charge is negative. The margin excluding impairment charge is 6.8 % for the third quarter.
**) The margins for the Group are presented excluding and including goodwill impairment charge.
32 A T L A S C O P C O 2 0 0 2
Q U A RT E R LY D ATA
Quarterly Data
33A T L A S C O P C O 2 0 0 2
N O T E S T O T H E F I N A N C I A L S TAT E M E N T S
Notes to the Financial StatementsMSEK unless otherwise stated
Accounting principlesThe financial statements of Atlas Copco have been prepared inaccordance with the Swedish Annual Accounts Act and stan-dards, hereafter referred to as “RR”, issued by the SwedishFinancial Accounting Standards Council.
Change in accounting principlesThe following accounting standards issued by the SwedishFinancial Accounting Standards Council became effective January 1, 2002: RR 1:00 Consolidated Financial Statementsand Business Combinations, RR 15 Intangible Assets, RR 16Provisions, Contingent Liabilities and Contingent Assets, RR 17Impairment of Assets, RR 19 Discontinuing Operations, RR 21Borrowing Costs, and RR 23 Related Party Disclosures.
The adoption of standard RR 15 dealing with intangibleassets increased operating profit by 284 for 2002 as comparedto 2001 since certain development expenditures were recognizedas assets instead of being expensed. These intangible assets willbe amortized over their estimated useful lives of three to fiveyears. The adoption of the other accounting principles did nothave a material effect on the Group’s financial position.
ConsolidationThe Consolidated Income Statement and Balance Sheet of theAtlas Copco Group include all companies in which the ParentCompany, directly or indirectly, holds more than 50% of thevoting rights as well as those companies in which the Group insome other manner has decisive influence.
The consolidated financial statements have been prepared in accordance with the purchase method whereby assets andliabilities of acquired companies are reported at fair value atthe time of acquisition. Any excess of the purchase price overthe fair value is accounted for as goodwill.
Earnings of companies acquired during the year are reportedin the Consolidated Income Statement from the date of acqui-sition. The gain or loss on companies divested during the yearis calculated on the basis of the Group’s reported net assets insuch companies including earnings to the date of divestment.
Intra-group balances and transactions, and any unrealizedgains arising from intra-group transactions, are eliminated inpreparing the consolidated financial statements.
Associated companiesCompanies in which the Atlas Copco Group controls between20 and 50% of the voting rights, and in which it has a substantialownership involvement, are reported as associated companies.
Holdings in associated companies are reported in the Con-
solidated Income Statement and Balance Sheet in accordancewith the equity method.
Atlas Copco’s share of income after net financial items inassociated companies is reported in the Income Statement,under the heading Other income and expenses from operations.Atlas Copco’s portion of taxes in associated companies isreported in the consolidated tax expense.
The related acquisition costs are reported under financialassets in the Balance Sheet, after adjustments for shares ofincome, less dividend received. Undistributed income in thesecompanies is reported among restricted reserves in consolidatedshareholders’ equity.
Unrealized gains arising from transactions with associatesare eliminated to the extent of the Group’s interest.
Foreign currencyForeign currency transactionsTransactions in foreign currencies are translated at the foreignexchange rate ruling at the date of the transaction. Receivablesand liabilities denominated in foreign currencies are translatedusing the foreign exchange rate at the balance sheet date. Inappropriate cases, hedged receivables and liabilities are valuedat the underlying forward rate.
When a loan in a foreign currency has been converted to a dif-ferent currency through the use of a swap agreement, the loan isvalued at the year-end exchange rate for the swapped currency.
Exchange rates for major currencies used in the year-endaccounts are shown on page 53.
Translation of accounts of foreign subsidiariesAtlas Copco applies the current-rate method in translating theaccounts of foreign subsidiaries, in accordance with the stan-dards of RR. In applying this method, the subsidiaries areprimarily reported as independent units with operations con-ducted in foreign currencies and in which the Parent Companyhas a net investment. The exceptions to this approach are thosesubsidiaries, which are located in high-inflation countries, andthose referred to as integrated companies. The accounts of suchsubsidiaries are translated according to the monetary method.
In accordance with the current-rate method, all assets andliabilities in the balance sheets of subsidiaries are translated atyear-end rates, and all items in the income statements at theaverage exchange rate for the year. Translation differences thatarise are reported directly as a component of shareholders’equity and are not included in current earnings. When divestingof subsidiaries considered to be independent, the accumulatedtranslation differences less the effects of hedges of the netinvestment are recognized in the capital gain or loss.
34 A T L A S C O P C O 2 0 0 2
For those subsidiaries’ financial statements that are translated inaccordance with the monetary method, all non-monetary itemssuch as real estate (land and buildings), machinery and equip-ment, inventories and shareholders’ equity are translated at theacquisition date exchange rates. Monetary items are translatedat year-end rates. The income statement has been translated atthe average rate for the year except for cost of goods sold anddepreciation, which have been translated at the historical rate.Differences arising from the translation of the accounts forthese companies have been included in the Income Statement.
GoodwillGoodwill arising on an acquisition represents the excess of thecost of the acquisition over the fair value of the net identifiableassets acquired. Goodwill is stated at cost less accumulatedamortization and impairment losses.
Goodwill is normally amortized over 10 years, while good-will arising from strategic acquisitions is amortized over aperiod of 20–40 years.
Goodwill is evaluated for impairment on a regular basis byestimating the discounted future cash flows of the business towhich the goodwill relates.
Research and development costsExpenditure on research activities, undertaken with theprospect of gaining new scientific or technical knowledge isexpensed in current earnings as incurred.
Effective January 1, 2002, Atlas Copco adopted the Swedishaccounting standard RR 15, Intangible Assets. Under thisstandard, expenditure on development activities, wherebyresearch findings are applied to a plan or design for the produc-tion of new or substantially improved products or processes, iscapitalized if the product or process is technically or commer-cially feasible. The expenditure capitalized includes the cost ofmaterials, direct labor and an appropriate proportion of over-heads. Capitalized development expenditure is stated at costless accumulated amortization and impairment losses.
Tangible assetsProperty, plant and equipment Items of property, plant and equipment are stated at cost lessaccumulated depreciation and impairment losses.
Rental equipmentThe rental fleet includes a broad selection of equipment ranging from small items such as pumps, generators and electrichand tools to larger equipment such as air compressors, dirtequipment, aerial manlifts, skid-steer loaders, and backhoes.
Rental equipment is recorded at cost and is depreciated over theestimated useful lives of the equipment using the straight-linemethod. The range of estimated useful lives for rental equip-ment is one to twelve years. Rental equipment is depreciated toa salvage value of 0–10% of cost. Ordinary repair and mainten-ance costs are included in current operations as incurred.
Depreciation and amortizationDepreciation and amortization is calculated based on the ori-ginal cost using the straight-line method over the estimateduseful life of the asset.
The following economic lives are used for depreciation andamortization:
YearsGoodwill and other intangible assets
strategic acquisitions 21–40other acquisitions 5–20product development 3–5
Buildings 25–50Machinery, technical plant and equipment 3–10Vehicles 4–5Computer hardware and software 3–4Rental equipment 1–12
ImpairmentThe carrying amount of the Group’s assets excluding inventoriesand deferred taxes are reviewed regularly to determine whetherthere is any indication of impairment. If any such indicationexists, the asset’s recoverable amount is estimated. The recover-able amount is the greater of their net selling price and value inuse. In assessing value in use, the estimated future cash flowsare discounted to their present value using a pre-tax discountrate that reflects current market assessments of the time valueof money and the risks specific to the asset.
An impairment loss is recognized whenever the carryingamount of the asset or its cash-generating unit exceeds itsrecoverable amount. Impairment losses are recognized in theincome statement.
LeasingLeases are classified in the consolidated financial statement aseither finance leases or operating leases. A finance lease entailsthe transfer to the lessee, to a material extent, of the economicrisks and benefits associated with ownership. If this is not thecase, the lease is accounted for as an operating lease. Account-ing for finance leases implies that the fixed asset in question isreported as an asset in the balance sheet and that a correspond-ing liability is recorded. Fixed assets under financial leases are
N O T E S T O T H E F I N A N C I A L S TAT E M E N T S
35A T L A S C O P C O 2 0 0 2
N O T E S T O T H E F I N A N C I A L S TAT E M E N T S
depreciated over their estimated useful lives, while the leasepayments are reported as interest and amortization of the leaseliability. An operating lease implies that there is no asset orliability to report in the Balance Sheet. In the Income State-ment, the costs of operating leases are distributed over the termof the lease.
InventoriesInventories are valued at the lower of cost or net realizable value.Net realizable value is the estimated selling price less the estimatedcosts of completion and selling expenses. Inventories are basedon the first-in first-out principle and include the costs in acquiringthem and bringing them to the existing location and condition.Manufactured inventories and work in progress include anappropriate share of overheads. Inventories are reported net ofdeductions for obsolescence and internal profits arising in con-nection with deliveries from the production companies to thesales companies.
Financial investments and cash and bankFinancial and other investments that are to be held to maturityare valued at amortized cost. Investments intended for tradingare valued at the lower of cost or market.
Cash and bank include cash balances and short term highlyliquid investments that are readily convertible to knownamounts of cash.
Provisions including warranties A provision is recognized in the balance sheet when the Grouphas a legal or constructive obligation as a result of a past event,and it is probable that an outflow of economic benefits will berequired to settle the obligation.
A provision for warranties is charged as cost of goods soldat the time the products are sold based on the estimated costusing historical data for level of repairs and replacements.
Employee benefitsObligations for contribution to defined contribution plans arerecognized as an expense in the income statement as incurred.The Group also has a number of defined benefit plans relatedto pensions and post-retirement health care benefits, which arereported in accordance with the accounting principles for therespective country.
In connection with the employee option and Share Appreci-ation Right (SAR) programs, Atlas Copco has entered into anagreement with a bank. The agreement hedges the risk ofincreases in the share price but requires Atlas Copco to reim-burse the bank in case the share price is less than the acquisi-
tion cost at the end of the option program. The effects of thedeclines in the price of Atlas Copco shares are recorded as aprovision with a corresponding amount being recorded directlyto equity. All other costs for the employee option/SAR pro-grams are included in current earnings.
Revenue RecognitionGoods sold and services renderedRevenue from sale of goods is recognized when delivery hasoccurred and the significant risks and rewards of ownershiphave been transferred to the buyer. Revenue from services isrecognized in current earnings in proportion to the stage ofcompletion of the transaction at the balance sheet dates pro-viding that a reliable profit estimate can be made.
Rental operationsRevenues are derived and recognized from the rental of equip-ment on a daily, weekly or monthly basis, as well as from salesof parts, supplies, and new and used equipment. Customersvary widely by location and consist of the following generalcategories: industrial, construction, government and home-owners.
Borrowing costsBorrowing costs are recognized as an expense in the period inwhich they are incurred regardless of how the borrowings areapplied.
Derivative instrumentsProvisions are recorded for unrealized losses to the extent theseexceed unrealized gains when valuing outstanding forward con-tracts, options and swaps. Unrealized gains that exceed unreal-ized losses are not recognized as income.
HedgingThe Group enters into commercial flow hedges whereby forwardexchange contracts are used to hedge certain future transactionsbased on forecasted volume. Unrealized gains and losses onsuch forward exchange contracts are deferred and recognizedin the income statement in the same period that the hedgedtransaction is recognized.
Current policy stipulates that derivative contracts such asforwards, swaps and options shall not be used for hedging ofnet assets in foreign subsidiaries, since derivative contracts giverise to cash flow risks at rollover dates.
TaxesIncome taxes include both current and deferred taxes in the
36 A T L A S C O P C O 2 0 0 2
N O T E S T O T H E F I N A N C I A L S TAT E M E N T S
consolidated accounts. A current tax liability or asset is recog-nized for the estimated taxes payable or refundable for the currentyear. The calculation of deferred taxes is based on the differencesbetween the values reported in the balance sheet and theirrespective values for taxation. Deferred taxes are recorded onthese temporary differences. The liability method is applied inthe calculation of deferred taxes including the use of the enact-ed tax rate for the individual tax jurisdiction. A deferred taxasset is recognized only to the extent that it is probable thatfuture taxable profits will be available against which the assetcan be utilized. Deferred tax assets are reduced to the extentthat it is no longer probable that the related tax benefit will berealized.
DefinitionsOperating profit margin
Operating profit as a percentage of revenues.
Profit margin
Profit after financial items as a percentage of revenues.
Capital employed
Total assets less non-interest-bearing liabilities/provisions.In calculating capital employed in the business areas, in con-
trast to the calculation for the Group, deferred tax liabilities are notdeducted. Capital employed reported by business area includesan allocation of the total Group cash and financial investments inproportion to average capital employed.
Return on capital employed (ROCE)
Profit after financial items plus interest paid and foreign exchangedifferences as a percentage of average capital employed.
Return on equity
Profit after financial items less taxes and minority interest as apercentage of average shareholders’ equity.
Equity/assets ratio
Shareholders’ equity and minority interest, as a percentage oftotal assets.
Capital turnover ratio
Revenues divided by average total assets.
Net indebtedness
Interest-bearing liabilities/provisions less liquid funds.
Debt/equity ratio
Net indebtedness in relation to shareholders’ equity, includingminority interest.
Operating cash flow
Cash flow from operations and cash flow from investments,excluding company acquisitions/divestments.
Net cash flow
Change in net indebtedness excluding currency exchange-rateeffects.
Interest coverage ratio
Profit after financial items plus interest paid and foreign exchangedifferences divided by interest paid and foreign exchange differ-ences.
Earnings per share
Profit after financial items less taxes and minority interest,divided by the average number of shares outstanding.
Weighted average cost of capital (WACC)
interest-bearing liabilities x i + market capitalization x r
i: The Swedish risk-free interest rate (10-year government bonds)plus 0.5 percentage points to compensate for the premiumAtlas Copco pays on borrowings compared to that of theSwedish state.
r: The Swedish risk-free interest rate, plus a risk premium (5.0%).
Taxes—Parent CompanyIn accordance with the Swedish Accounting Standard RR 9,deferred taxes have been recorded on temporary differencesbetween the values reported on the balance sheet and thosereported for taxation. Also in accordance with this standard,allocations to untaxed reserves continue to be reported on agross basis in the parent company accounts. In the consolidation,these reserves are allocated to deferred taxes and restrictedequity with changes in the reserves being recorded as deferredtaxes in current earnings.
Acquisitions and divestmentsThe following table summarizes the significant acquisitions and divestments during the years 2001 and 2002:Date Acquisitions Divestments Business area Revenues* Number of employees*2002 Aug. 22 Revathi Equipment Industrial Technique 100 1142002 June 3 Krupp Berco Bautechnik** Construction and Mining Technique 600 4202002 April 18 Liuzhou Tech Machinery Co Compressor Technique 100 1902002 April 17 MAI-Ankertechnik Construction and Mining Technique 70 152001 Dec. 6 Grassair Compressor Technique 85 752001 Aug. 31 Christensen Products Construction and Mining Technique 160 72001 May 1 Masons Compressor Technique 140 502001 Q1 Various small rental cos. Rental Service 36 30
*) Annual revenues and number of employees at time of acquisition/divestment.**) Name changed to Atlas Copco Construction Tools GmbH.
The Group acquired 100 % of the voting shares for the acquisitions listed above and were accounted for using the purchase methodof consolidation.
37A T L A S C O P C O 2 0 0 2
1 Revenues by business area and marketRevenues by business area
Group2002 2001
Compressor Technique 15,993 16,873Rental Service 12,829 15,469Industrial Technique 11,481 12,126Construction and Mining Technique 7,618 7,253Eliminations –359 –582
47,562 51,139
Revenues by market
Group2002 2001
North America 22,750 25,942South America 1,606 2,043Europe 15,187 15,555
of which Sweden 846 882of which EU 12,404 12,910
Africa/Middle East 2,294 2,269Asia/Australia 5,725 5,330
47,562 51,139
Group operating profit by business area is reported in theBoard of Directors’ Report. Revenues and operating profit perquarter are shown on page 32.
2 Employees and personnel expensesAverage number of employees
2002 2001Women Men Total Total
Parent Company
Sweden 26 39 65 58Subsidiaries
North America 1,797 7,928 9,725 10,444South America 130 926 1,056 1,011Europe 2,060 9,181 11,241 11,010
of which Sweden 385 2,128 2,513 2,474of which EU 1,866 8,560 10,426 10,291
Africa/Middle East 195 760 955 807Asia/Australia 378 2,367 2,745 2,871Total in subsidiaries 4,560 21,162 25,722 26,143Grand total 4,586 21,201 25,787 26,201
Salaries and other remuneration
2002 2001Board Other Board Other
& Presi- employ- & Presi- employ-dents ees dents ees
Parent Company
Sweden 24 35 18 38of which bonuses 6 4
Subsidiaries
North America 36 4,308 34 4,740South America 10 168 14 179Europe 119 3,993 124 3,784
of which Sweden 11 828 12 781of which EU 105 3,773 109 3,592
Africa/Middle East 6 106 7 111Asia/Australia 21 449 21 471Total in subsidiaries 192 9,024 200 9,285
of which bonuses 20 24Grand total 216 9,059 218 9,323
Group Parent Company2002 2001 2002 2001
Salaries and other remuneration 9,275 9,541 59 56Contractual pension benefits for Board members and Presidents 14 13 1 1Contractual pension benefits for other employees 699 713 22 17Other social costs 1,690 1,603 20 16Total 11,678 11,870 102 90Capitalized pension obligations to Board members and Presidents 46 41 21 17
Note 2, to be continued.
Notes
N O T E S T O T H E F I N A N C I A L S TAT E M E N T S
38 A T L A S C O P C O 2 0 0 2
Note 2, continued.
Remuneration and other fees for members of the Board, the
President and CEO, and other members of the Group Management
Board of Directors
In 2002, the Chairman of the Board received 1,000,000and the Vice Chairman received 350,000 on an annualbasis. Board member Charles Long received 206,250 (for nine months) plus 40,000 for Board Membership ofAtlas Copco North America Inc. Board member Hari ShankarSinghania received 68,750 (for three months) plus
100,000 for Board Membership in Atlas Copco India Ltd.Other Board members not employed by the Company(Michael Treschow, Thomas Leysen, Sune Carlsson, LennartJeansson, Kurt Hellström and Ulla Litzén) received
275,000 each on an annual basis.
President and CEO
The former President and Chief Executive Officer, GiulioMazzalupi, who left his position June 30, 2002, received asalary for the first six months of the year of 4,309,495plus a variable compensation of 3,000,000 for the year2001 and 1,450,002 for the part of the year 2002 that he was employed. In addition he has a pension from theCompany of 47% of the base salary, payable from age 65.This has been funded through annual payments into pen-sion insurances.
The present President and Chief Executive Officer, GunnarBrock, was employed May 1, 2002, and was appointed CEOon July 1, 2002. He was paid a base salary for the period hewas employed during 2002 of 4,333,333. He has a variablecompensation plan, which is related to the pre-tax result andcan give maximum 70% of the base salary.
The Chief Executive Officer is entitled to benefits accord-ing to Atlas Copco Group Pension Policy for SwedishExecutives, which is a defined contribution plan. The contri-bution is age related and is, for the CEO, 35% of the basesalary and includes provisions for survivor’s pension. He isentitled to retire at the age of 60. In addition he is entitled to a disability pension of 50% of his base salary. The cost for thedisability pension in 2002 was 142,000.
In addition to the above, the Chief Executive Officer has a company car, as per the policy for employees in Sweden en-titled to such benefit and is entitled to membership in insurancefor private medical care.
The principle for termination of the CEO’s employment isthat, if either party intends to terminate the contract, a noticetime of six months is stipulated. The CEO is entitled to a sev-erance pay of 12 months of base salary if the Company ter-minates the employment and a further 12 months if otheremployment is not available. If he receives income from otheremployment or business activity during the time that sever-
ance pay is received, it shall be reduced by income received.The basis for the severance pay is the base salary only.
Number of options granted in 2002 as well as holdings asat December 31 will be found in the summary below.
Other members of the Group Management
The Group Management, as defined by Board Decision, con-sists of eight positions, in addition to the CEO (four BusinessArea Executives and four Senior Vice Presidents).
The total of their salaries and cash remuneration amountedto 21,593,719 for 2002 including their variable compensa-tion plans, which can amount to maximum 34% of their basesalaries. All Swedish members of the Group Management havea defined contribution pension plan, with contribution rangingfrom 25% to 35% of their base salaries, percentage varyingaccording to age. Also the executives not based in Sweden havea defined contribution plan and one of them has in addition adefined benefit plan in his home country.
One of the executives is entitled to retire when reaching theage of 60, with an early retirement pension payable from theearly retirement date to the age of 65. The amount of pensiondepends on when the agreement is invoked, but is maximizedto 60% of the pensionable salary. As a prerequisite, maximum20% of full time unpaid consultancy work for the companybetween early retirement and age of 65 is required. After age65 this payment ceases and the pension as per the defined con-tribution plan takes over.
As per the rules of terminating their employment, themembers of the Group Management are entitled to sever-ance pay, if the Company terminates their employment.The amount of severance pay depends on the length ofemployment with the company and the age of the Executive,but is never less than 12 months base salary and never morethan 24 months base salary. Any income that the Executivereceives from employment or other business activity, whilstseverance pay is being paid, will reduce the amount of sever-ance pay accordingly.
In addition to the above, each member of the GroupManagement is entitled to company car as per the car policyin place for employees in Sweden and membership in insur-ance for private medical care. The total premium for thisinsurance for the year 2002 in aggregate is 38,130.
As a principle, base salary is for position and general per-formance whereas variable compensation is for achievement ofspecific results. This compensation always has a ceiling.
No member of the Group Management receives any feesfor memberships of boards in companies in the Group or anyother compensation for other duties that they may perform outside the immediate scope of their positions.
Number of options/SARs granted in 2002 as well as hold-ings as at December 31 are detailed in the following sections.
N O T E S T O T H E F I N A N C I A L S TAT E M E N T S
39A T L A S C O P C O 2 0 0 2
Option/SAR1 grants and holdings for
Board of Directors and Group Management
Call options Stock options/SARs
Grant year 1997 1998 1999 2000 2001Board: Number as at Jan. 1 andDec. 31, 2002 0 0 0 0 0CEO:Number as at Jan. 1, 2002 0 5,287 3,242 11,056 11,056Exercised in 2002 0 –5,287 –3,242 0 0Expired in 2002 -3,685 -7,370Number as at Dec. 31, 2002 0 0 0 7,371 3,686Other members of Group Management: Number as at Jan. 1, 2002 9,139 9,234 13,497 60,808 60,808Exercised in 2002 0 0 0 –3,686 0Number as at Dec. 31, 2002 9,139 9,234 13,497 57,122 60,808
1) Terms for the employee options/SAR program are detailed onpage 13.
2) Total estimated market value at grant date. The value hasbeen calculated using the Black & Scholes model with interestrates prevailing at the grant date and a volatility of 35% as thesignificant assumptions. Since the options/SARs are non-transferable, the theoretical value of the Black & Scholesmodel was reduced by 30%. The value of the employeeoptions at the grant dated has been calculated to SEK 49.
Remuneration to auditors
Audit fees and consultancy fees to auditors, for advice orassistance other than audit, were as follows:
Group Parent Company2002 2001 2002 2001
KPMGAudit fee 24 11 2 1Other 17 12 1 2
AndersenAudit fee - 9 0 0Other - 6 1 1
Other audit firmsAudit fee 3 2 - -
44 40 4 4
During 2001 the audit of the Group was performed jointly byKPMG and Andersen. For 2002, KPMG are the sole auditorsof the Group, appointed for four years at the annual GeneralMeeting 2002.
Activities of the Board of Directors
of Atlas Copco AB during the year 2002
The Board of Directors of the Company had ten members,one of which is the President and Chief Executive Officer,elected by the Annual General Meeting and three members,with three personal deputies, appointed by the unions.During 2002, there were seven board meetings, of which onewas held outside Sweden and one was a per capsulam meet-ing. Each meeting was governed by an approved agenda.To ensure an efficient process at each meeting, the Boardmembers received a package of written documentation priorto the meeting covering agenda items. This ensured that mat-ters raised were supported by such sufficient and relevantinformation as was required to form a basis for a decision.Members of the Executive Group Management were regularlypresent at the Board meetings. In between meetings, therewere regular contacts between the Chairman and thePresident. Each Board member received a written update fromthe President on major events and business development inthose months when there was no Board meeting.
To ensure that decisions on major matters would not beunduly delayed, the Board can appoint smaller committeesamong its members to follow up and make proposals to theBoard regarding such matters. Such committees during theyear acted in the areas of Company President succession andselection of auditors. The remuneration committee, which wasappointed in 1999, also met during the year.
The following process applied regarding the nomination ofthe Board members who will be proposed by a group of majorshareholders for election at the Annual General Meeting in2003; in December 2002, the Chairman made an assessmentof the work of the Board and its members during the year.He then met with representatives of Investor AB, RoburFonder, Handelsbanken Fonder and Alecta and presented hisassessment of the need of special Board competence andcompared such needs with available resources in the Board.
In April, the Board adopted a revised version of its Rulesof Procedure and Written Instructions.
The Company’s external auditors reported their observa-tions from the annual audit in person and presented their viewson the quality of internal control in the Group at the February2003 Board meeting and also participated in the October 2002Board meeting, when impairment test was discussed.
Remuneration Committee
The Board of Atlas Copco AB established a remunerationcommittee in 1999 consisting of the Chairman, Vice Chair-man and Michael Treschow.
The committee analyses and proposes for approval by theBoard, the base salary, variable compensation, pension bene-fits and participation in option plans for the CEO and themembers of the Group Management.
Audit Committee
In December, the Board of Directors appointed an AuditCommittee with Anders Scharp, Ulla Litzén, and ThomasLeysen as members. The committee will act as a qualifiedadvisory body to the Board of Directors regarding auditorselection and review of the audit process.
N O T E S T O T H E F I N A N C I A L S TAT E M E N T S
40 A T L A S C O P C O 2 0 0 2
3 Cost of marketing, administration, research and development
Group Parent Company2002 2001 2002 2001
Marketing costs 4,980 4,894 - -Administrative costs 3,179 3,091 206 161Research and development costs 900 1,107 2 -
9,059 9,092 208 161
4 Amortization and depreciationGroup Parent Company
For 2002, items affecting comparability are comprised ofrestructuring costs of 68 in the Construction and Mining Tech-nique Business Area and 48 in the Industrial Technique Busi-ness Area.
For 2001, items affecting comparability include restructur-ing costs of 160 in the Rental Service Business Area, and costsof 100 for consolidation of production in Milwaukee ElectricTool in the Industrial Technique Business Area.
Other operating income includes profits from insuranceoperations, capital gains on the sale of fixed assets totaling 137 (50), commissions received of 27 (25), capital gain on saleof companies 28 (11) and exchange-rate gains attributable tooperations of 69 (3).
Other operating income for the Parent Company includescommissions received totaling 55 (62).
6 Financial income and expensesGroup Parent Company
2002 2001 2002 2001Profit from shares
in Group companies
Dividends received 703 734Group contributions 1,060 951Write-downs –724 -
–1,091 –1,594 –972 –1,613Financial income and expenses –780 –1,430 1,508 2,109
The interest portion of provision for pensions is not chargedagainst operating income but is shown as interest expense forboth Swedish and foreign companies. The amount is based onthe average of the opening and closing pension provisions. ForSwedish companies, interest has been calculated at 6.3% (3.7).The interest portion for 2002 amounted to 81 (64), of whichSwedish companies accounted for 7 (3). In the Parent Com-pany, the corresponding amount was 2 (1).
N O T E S T O T H E F I N A N C I A L S TAT E M E N T S
41A T L A S C O P C O 2 0 0 2
7 Appropriations—Parent Company
Tax legislation in Sweden and in certain other countries allowscompanies to retain untaxed earnings through tax-deductibleallocations to untaxed reserves. By utilizing these regulations,companies can appropriate and retain earnings within the busi-ness without being taxed. The untaxed reserves created in thismanner cannot be distributed as dividends.
The untaxed reserves are subject to tax only when they areutilized. If the company reports a loss, certain untaxed reservescan be utilized to cover the loss without being taxed.
Parent Company2002 2001
Appropriation to tax allocation reserve, net –155 –139Dissolution of foreign exchange reserve 42 42
–113 –97
If the Parent Company reported deferred tax on appropriationsas reported in the consolidated accounts, deferred tax expensewould have amounted to –32 (–27).
8 TaxesGroup Parent Company
2002 2001 2002 2001Current taxes
Sweden –353 –379 –353 –327Other countries –902 –1,162
The following is a reconciliation of the companies’ weightedaverage tax based on the national tax for the country ascompared to the actual tax charge:
Group2002 2001
Loss/profit after financial items –2,469 4,700Weighted average tax based on national rates 1,237 –1,576—In % 50.1 33.5
Tax effect of:Goodwill amortization/impairment –2,660 –228Non-deductible expenses –149 –85Withholding tax on dividends –24 –30Tax-exempt income 243 251Adjustments from prior years –54 69Effects of tax losses/credits utilized 18 26Change in tax rate 41 1Tax losses not available for utilization –2 –40Other items –11 –10
–1,361 –1,622—In % –55.1 34.5
Excluding the goodwill impairment charge, the weighted aver-age tax rate based on national rates was 33.7% and the effectivetax rate was 33.8%.
The Group’s total tax expense, compared to Swedish corporatetax rate, is affected by its strong position in countries with high-er tax rates, including Belgium, France, Germany, and theUnited States. Non-deductible goodwill depreciation also hasan adverse effect on the tax ratio.
The tax adjustments in prior years includes current taxes of–1 (–4).
The Swedish corporate tax rate is 28%. The Parent Com-pany’s effective tax rate of 28.1% (17.1) is primarily affected bynon-taxable dividends from subsidiaries that was offset in 2002by non-deductible write down of shares in subsidiaries.
See Note 21 for additional information.
9 Minority interest in subsidiaries’ equity and earnings
Minority interest in profit after financial items amounted to 84(16).
The income statement reports minority shares in theGroup’s profit after tax of 59 (11). These minority interestsrelate primarily to Atlas Copco India, Atlas Copco Malaysiaand subsidiaries in China. The subsidiary of Chicago Pneu-matic was divested during the year.
GroupMinority interest, Jan. 1 221Minority acquired –2Minority sold –74Dividends –12Translation differences –32Profit for the year 59Minority interest, Dec. 31 160
10 Earnings per share2002 2001
Loss/profit for the year –3,889 3,067Average number of shares 209,602,184 209,602,184Loss/earnings per share, SEK –18.55 14.63
Earning per share excluding impairment charge of goodwillwas 13.88.
Shares, which may be issued under the share value basedincentive programs, will not result in any dilution of earningsper share. The Group has entered into share swap agreementswith a third party whereby any shares provided to managementat the exercise of the option will be made from shares alreadyoutstanding.
N O T E S T O T H E F I N A N C I A L S TAT E M E N T S
42 A T L A S C O P C O 2 0 0 2
United States Financial Accounting Standards Board issuedSFAS 142, Goodwill and Other Intangible Assets, which becameeffective January 1, 2002. This Statement does not presume thatthose assets are wasting assets. Instead, goodwill and intangibleassets that have indefinite useful lives are not amortized butrather tested at least annually for impairment.
In December 2002, the International Accounting StandardsBoard (IASB) issued an exposure draft dealing with businesscombinations, which proposes that goodwill (including thatwhich was previously recognized) is not amortized but tested forimpairment annually or more frequently if events or changes incircumstances indicate that goodwill might be impaired. Com-ments from the public and other parties regarding the exposuredraft are to be received by IASB by April 4, 2003. Approval ofthe exposure draft and issuance of an International FinancialReporting Standard (IFRS) is expected after this. The Swedishstandard would be expected to be revised in line with the revisedIFRS.
Due to the significant changes in the accounting for goodwillthat has happened and is foreseen to happen, Atlas Copco de-cided to continue to amortize the strategic US acquisitions over a period of 40 years for both for the 2001and 2002 financial state-ments. Given the short time before the Group will adapt therevised IFRS, this treatment offers the best comparability andcontinuity in the Group’s financial results.
The following illustrates the effect of amortization using anestimated useful life of 20 years as compared to 40 years on cur-rent earnings, earnings per share and equity/assets ratio.
11 Intangible assetsProduct development
Goodwill and software Patents, etc. TotalAccumulated cost
Opening balance, Jan. 1 26,141 84 89 26,314Investments - 312 1 313Acquisition of subsidiaries 596 7 - 603Divestment and disposal –17 –15 –2 –34Reclassified items 2 –2 -Translation differences for the year –4,268 –8 –3 –4,279Closing balance, Dec. 31 22,452 382 83 22,917
Accumulated amortization
Opening balance, Jan. 1 3,616 75 23 3,714Amortization for the year 650 25 5 680Divestment and disposal –17 –15 –1 –33Reclassified items 2 –2 -Translation differences for the year –551 –4 1 –554Closing balance, Dec. 31 3,698 83 26 3,807
Accumulated impairment charge
Opening balance, Jan. 1 - -Impairment charge 6,950 6,950Translation differences for the year –796 –796Closing balance, Dec. 31 6,154 6,154
Non-residential building activity in the United States hasdecreased significantly since 2000. The resulting lower demandand excess supply in the rental equipment industry caused theGroup to assess the recoverable amount of the goodwill relatingto the Rental Service operations in North America. Based on thisassessment goodwill was written down by 6,950, representing43% of the net carrying amount. The estimates of the recover-able amount were based on value in use, calculated using five-year forecasted cash flows based on management’s detailedassumptions for the rental operations. It also includes cash flowsfor the remaining useful life using a steady rate of growth. A pre-tax discount rate of 10.8 % was used to determine the recoverableamount.
Amortization
Atlas Copco’s strategic acquisitions involve three large Americancompanies with operations and sales almost exclusively in theUnited States. These companies generate large operating cashflows and derive ongoing operating benefits from strong brandnames and extensive customer lists. These factors are strong indi-cators of an estimated useful life longer than 20 years.
Analysts and other users of financial statements have notedthat intangible assets including goodwill are an increasinglyimportant economic resource for many entities and are anincreasing proportion of the assets acquired in many transac-tions and the setters of accounting standards have reconsideredthe accounting for such assets. For instance in June 2001, the
N O T E S T O T H E F I N A N C I A L S TAT E M E N T S
43A T L A S C O P C O 2 0 0 2
Condensed income statement 2002
Amortization period 20 years 40 yearsRevenues 47,562 47,562Goodwill impairment –5,109 –6,950Operating expense –42,796 –42,301Operating loss –343 –1,689—as % of revenues –0,7 –3.6Loss after financial items –1,123 –2,469—as % of revenues –2.4 –5.2Loss for the year –2,543 –3,889Loss per share, SEK –12.13 –18.55Equity/assets ratio, % 40.9 41.8
Amortization of goodwill was distributed as follows:
2002 2001Goodwill amortization over 40 years 495 573Goodwill amortization over 20 years 101 100Goodwill amortization within 10 years 54 40
Buildings and land 1,767 2,228 6 6Machinery and other technical plant 1,900 2,174 - -Equipment, etc. 505 642 8 7Construction in progress and advances 275 214 - -Other tangible assets 4,447 5,258 14 13Rental equipment 11,294 14,935 - -
15,741 20,193 14 13Tax assessment value, buildings and land 154 163 11 9
The tax assessment values reported for the Group pertain exclusively to buildings and land in Sweden.The residual value of these is 164 (168).
The leasing costs for assets under operating leases, such as rentedpremises, machinery, and major computer and office equipmentare reported among operating expenses and amounted to 996(906). Future payments for non-cancelable leasing contractsamounted to 2,845 (3,292). Future payments for non-cancelableoperating leasing contracts fall due as follows:
2003 7792004–2007 1,7232008 or later 343Total 2,845
Buildings Equip-Parent Company and land ment, etc. TotalAccumulated cost
Opening balance, Jan.1 –572Write-down for the year –724Closing balance, Dec. 31 –1,296Book value, Dec. 31 3,983
14 Shares and participations in associated companiesNumber Percentage Adjusted
of shares of capital equityOwned by Parent Company
AVC Intressenter AB, 556506-8789, Gothenburg, Sweden 6,750,250 50 1
Owned by subsidiaries
Atlas Copco Changchun Electric Power Tool Ltd., Changchun, China 25 0Atlas Copco-Diethelm Ltd., Bangkok, Thailand 49 22NEAC Compressor Service USA Inc., Franklin, PA 50 0Pneumatic Equipment Corp, Makati City, Philippines 30 0Shenzhen Nectar Engineering & Equipment Co. Ltd., Shenzhen, China 25 0Toku-Hanbai KK, Fukuoka, Japan 50 52
75
Parent Group Company
Accumulated capital participation/purchase cost
Opening balance, Jan. 1 91 72Dividends –2Loss for the year –1Translation differences for the year –13Closing balance, Dec. 31 75 72
Accumulated write-downs
Opening and closing balance –72
Book value, Dec. 31 75 0
Dividends from associated companies totaled 2 (9). The Group’sshare in the shareholders’ equity of associated companies,equaled 75 (91) at year end.
Transactions with non-consolidated affiliates
The Group sold various products and purchased goods throughcertain non-consolidated affiliates on terms generally similar tothose prevailing with unrelated parties. The following table summarizes the Group’s related party transactions with its non-consolidated affiliates:
The Parent Company’s guaranteed, but unutilized, credit linesequaled 6,150. Subsidiaries had been granted but had not uti-lized overdraft facilities equaling 205.
18 Shareholders’ equityShare Restricted Retained
Group capital reserves earningsOpening balance, Jan. 1, 2001 1,048 10,484 12,450Dividend to shareholders –1,100Transfers between restricted equity and retained earnings 1,028 –1,028Translation differences for the year 1,619Profit for the year 3,067Closing balance, Dec. 31, 2001 1,048 11,512 15,008
Dividend to shareholders –1,153Provision for valuation of employee stock option program –138Transfers between restricted equity and retained earnings –1,729 1,729Translation differences for the year –2,194Loss for the year –3,889Closing balance, Dec. 31, 2002 1,048 9,783 9,363
Atlas Copco’s share capital amounted to 1,048,010,920distributed among 209,602,184 shares, each with a par value of 5.
In connection with the granting of employee stock optionsand SARs, the Group has entered into an agreement with abank. The agreement hedges the risk of increases in the shareprice but requires Atlas Copco to reimburse the bank in casethe share price is less than the acquisition cost at the end of theoption program. As of December 31, 2002, the variance in theshare price and the acquisition values for the 2000, 2001 and,2002 option programs amounted to 138. The amount is includ-ed in provisions and reported directly to equity.
Group shareholders’ equity has been affected by translationdifferences arising from the application of the current-ratemethod. The accumulated translation difference in equity sincebeginning of 1992 amounts to 1,668 (3,862).
Translation differences for the year –2,201 1,765Equity hedging - –135Realized on divestment of subsidiaries 7 –11
Total translation difference for the year –2,194 1,619Closing balance, Dec. 31 1,668 3,862
Share Share Legal Retained Parent Company capital premium reserve earningsOpening balance, Jan. 1, 2002 1,048 3,994 1,737 5,193Dividend to shareholders –1,153Provision for valuation of employee stock option program –138Profit for the year 899Closing balance, Dec. 31, 2002 1,048 3,994 1,737 4,801
The Atlas Copco Group’s retained earnings are defined as follows: Parent Company’s retained earnings plus the Group’sshare in each subsidiary’s retained earnings, to the extent thatthey can be distributed without writing down the shares in thesubsidiary.
This amount has been reduced by deducting the Group’sshare in the accumulated losses and other reductions of capitalin subsidiaries to the extent that these amounts have not affectedshare values in the Parent Company’s accounts.
Of the Group’s retained earnings, 33 will be transferred torestricted reserves based on the proposals of the board ofdirectors in each company.
Any evaluation of the Atlas Copco Group’s retained earningsand loss for the year should take into account that a substantialportion is earned by companies outside Sweden and that in cer-tain cases profits transferred to the Parent Company are sub-ject to taxation or restrictions.
19 Untaxed reserves—Parent Company
The breakdown of untaxed reserves reported in the Parent Company Balance Sheet is shown below. Untaxed reserves areeliminated in the consolidated accounts as described in Account-ing principles, page 36, Taxes Parent Company. Of the ParentCompany’s total untaxed reserves of 1,652 (1,539), deferred taxof 463 (431) is reported in the consolidated accounts.
Pension liabilities and pension expenses for the year are calcu-lated by Atlas Copco Group companies according to localrules and regulations. To the extent these rules and regulationsallow irrevocable pension obligations not to be reported ascosts as pension rights accrue, adjustments have been made inthe consolidated accounts. A certain portion of the pensioncosts for the year is reported as an interest expense, Note 6.
Accordingly, the item Provision for pensions is reported amonginterest-bearing provisions.
The majority of the Group’s pension obligations are in Sweden, Germany, the United States, and Belgium. In additionto the statutory pension fees paid to government authorities,there are also costs for supplementary pension benefits basedon individual or collective agreements between employer andemployee representatives.
In Sweden, salaried employees’ pension plans are adminis-tered by the Pensions Registration Institute (FPG/PRI).
The amount for foreign companies includes 268 (305) forhealth care benefits in the United States. The Atlas CopcoGroup applies U.S. standards in accordance with FAS 106(Employer’s accounting for post-retirement benefits other thanpensions) for medical care costs for retired employees, resultingin the present value of future health care benefits reported as aprovision in the balance sheet.
21 Deferred tax assets and liabilities
The deferred tax assets and liabilities recognized in the balance sheet are attributable to the following:
Other items primarily include tax deductions (tax allocationreserve etc.) which are not related to specific balance sheet items.
At December 31, 2002 the Group had tax loss carry-forwardsof approximately 3,515, of which 3,249 was recognized in calcu-lating deferred taxes. Tax losses of 422 are available to reduce taxexpense in future years but have not been recognized as it is notconsidered probable that future taxable profit will be availablefrom which the Group can utilize the benefits. Of the tax losscarry-forwards, approximately 90 expire within five years.
The following reconciles the net liability balance of deferredtaxes at the beginning of the year to that at the end of the year:
Group2002 2001
Net balance, Jan. 1 –1,702 –1,448Acquisition of subsidiaries –2 -Divestment of subsidiaries –2 -Charges to profit of the year –103 –79Translation differences 259 –175Net balance, Dec. 31 –1,550 –1,702
Changes in temporary differences during the year that are recog-nized in the income statement are attributable to the following:
Deferred tax receivable in the Parent Company of 7 (8) relate totemporary differences on pension obligations.
Deferred taxes relating to temporary difference between bookvalue and tax base of directly held shares in subsidiaries and asso-ciated companies have not been recognized. For group companiesthe Parent Company controls the realization of the deferred taxprovisions/asset, and realization is not in the foreseeable future.
See Note 8 for additional information.
48 A T L A S C O P C O 2 0 0 2
N O T E S T O T H E F I N A N C I A L S TAT E M E N T S
Product Restruc- Service Total pro- warranty turing contracts Other visions
Opening balance, Jan. 1 363 196 116 378 1,053During the year
provisions made 203 187 105 350 845provisions used –170 –125 –103 –239 –637provisions reversed –13 –33 –1 –13 –60
Acquired/divested subsidiaries 17 11 - 75 103Translation differences for the year –26 36 3 –82 –69Closing balance, Dec. 31 374 272 120 469 1,235
Costs of 138 associated with the hedging of the employeeoption programs are included in the other provisions madeduring the year as well as in the other year-end balances above.
23 Long-term liabilities to credit institutions
Long-term interest-bearing liabilities to credit institutions andothers are as follows:
The future maturities of loan liabilities are as follows, trans-lated at the exchange rates prevailing at December 31, 2002.
Group Parent Company2003 76 532004 2,575 2,4882005 27 02006 728 7252007 661 6602008 and later 6,831 6,813
10,898 10,739
Atlas Copco has currently a long-term debt rating of A-/A3.
Group loan liabilities include liabilities under finance leasingcontracts as follows:
Future minimum base payments 66Future finance charges –17Present value of lease liabilities 49
Future payments will fall due as follows:
Group2003 212004–2007 172008 and later 11
49
49A T L A S C O P C O 2 0 0 2
24 Current liabilities to credit institutionsGroup Parent Company
2002 2001 2002 2001Liabilities to credit institutions, etc. 2,374 5,912 1,513 5,210Current portion of long-term liabilities 76 2,179 53 2,123Liabilities to Group companies 3,604 4,364Total interest-bearing liabilities 2,450 8,091 5,170 11,697
The Group’s current loan liabilities to credit institutions andothers are as follows:
2002 2001Parent Company
Available under “MUSD 200 Euro Commercial Paper Program”Outstanding MUSD (6.9) - 74
MEUR 29.7 273 324Available under
“MUSD 1,000 U.S.Commercial Paper Program”Outstanding MUSD 118.8 (65.9) 1,044 700
Available under “MEUR 250 Treasury Note Program”Outstanding MEUR (89.7) - 841
MUSD (39.5) - 420Available under
“MSEK 4,000 Commercial Paper Program” 196 2,226
Available under“MSEK 5,000 Medium Term Note Program” - 600
Other short-term loans and promissory notes - 25The Parent Company’s loan liabilities 1,513 5,210Subsidiaries 861 702Group loan liabilities 2,374 5,912
The Atlas Copco Group’s short-term and long-term loans aredistributed among the following currencies. The table alsoreflects the effect of derivatives at year end.
Atlas Copco AB has commercial paper programs for short-termborrowing in the United States, Sweden, and in other Europeancountries, with a combined volume of about 1,950, corre-sponding to 17,100. These programs have a K1 rating inSweden and an A2/P2/F2 rating internationally.
Notes discounted 62 58 - -Sureties and other contingent liabilities 1,735 1,895 261 284
1,797 1,953 261 284
Sureties and other contingent liabilities include bank and com-mercial guarantees as well as performance bonds. Of the con-tingent liabilities reported in the Parent Company, 238 (257)relates to contingent liabilities on behalf of subsidiaries.
N O T E S T O T H E F I N A N C I A L S TAT E M E N T S
50 A T L A S C O P C O 2 0 0 2
N O T E S T O T H E F I N A N C I A L S TAT E M E N T S
Shares and ParticipationsAtlas Copco ABDecember 2002
Per-Number of cent Book
shares held1 value
Directly owned product companies
Atlas Copco Rock Drills AB, 556077-9018, Örebro 1,000,000 100 200
Industria Försäkrings AB, 516401-7930, Nacka 50,000 100 5
Atlas Copco Reinsurance SA, Luxembourg 4,999 100 8
16 dormant companies 100 32
TOTAL BOOK VALUE 3,983
1) Percentage of number of shares equal to percentage of votes. In caseswhere two figures representing percentage of ownership are presented,the first number refers to percent held by Atlas Copco AB, whereas thesecond number represents total percent held by the Group.
52 A T L A S C O P C O 2 0 0 2
Financial ExposureIn line with its overall targets for growth, operating margin,and return on capital, the objective of Atlas Copco’s financialrisk policy is to minimize the financial risks to which the Groupis exposed. The policy is designed to create stable conditionsfor the business operations of the divisions and contribute to steady growth in shareholders’ equity and dividends, while protecting the interests of creditors.
Currency riskChanges in exchange rates affect Group earnings and equity invarious ways:• Group earnings—when revenues from sales and costs for pro-
duction and sourcing are denominated in different currencies(transaction risk).
• Group earnings—when earnings of foreign subsidiaries aretranslated into (translation risk).
• Group shareholders’ equity—when the net assets of foreignsubsidiaries are translated into (translation risk).
Transaction riskThe Group’s net cash flows in foreign currency which corres-pond to a value of approximately 6,670 annually give riseto transaction risks. The largest surplus currencies, i.e. those in which inflows exceed outflows, and the deficit currencies,are shown in graph 1. Graph 2 gives an indication of effects on Group pre-tax earnings of one-sided variations in USD
and EUR against all other currencies, if no hedging transactions
had been undertaken to cover the exposure and before anyimpact of price adjustments and similar measures.
According to policy, each division must hedge foreign cur-rency flows against sudden exchange rate fluctuations, but onlyfor the period estimated necessary to adjust prices and/or coststo the new exchange rates. These periods vary among the divi-sions and average 3–4 months for the Group.
This hedging of currencies, for which forward contracts arenormally used, is aimed at securing calculated gross marginsand not maximizing them through speculation. In addition tothe described general currency hedging, Group managementhas initiated certain currency hedging for somewhat longerperiods, which currently (February 2003) have terms ending inSeptember 2003. In this case, option strategies are used. Theamount of outstanding hedges including options as at Decem-ber 31, 2002, is also shown in graph 1.
Given the development of exchange rates and the Group’stransaction exposure during year 2002, hedging activity had an estimated positive impact on profit after financial items(excluding goodwill impairment charges) of approximately 5%.
If all outstanding hedges of cash flows had been closed onDecember 31, 2002, the net pre-tax effect on Group earningswould have been a positive 68.
Translation riskThe risk policy states that the translation effect of currencychanges on the Group’s equity, expressed in , shall be
Graph 1
Estimated Annual Transaction Exposure (in the most important currencies)
Transaction exposure
Outstanding outright contracts
Outstandingoptions
6
4
2
0
–2
–4
– 6
Billions SEK
US
D
CA
D
AU
D
HK
D
EU
R
SE
K 543210–1–2–3–4–5 %
Graph 2
Transaction exposure —effect of USD and EUR fluctuations before hedging
USD EUR
300
200
100
0
–100
–200
–300
MSEK
% change against all other currencies
N O T E S T O T H E F I N A N C I A L S TAT E M E N T S
53A T L A S C O P C O 2 0 0 2
reduced by matching the currency of loans with the currency ofthe net assets in foreign entities.
Current policy stipulates that derivative contracts such asforwards, swaps and options shall not be used for equity hedgingpurpose, since derivative contracts give rise to cash flow risks atroll-over dates.
The value of the net assets of foreign subsidiaries at year-end 2002 corresponded to approximately 9,800 and isshown in graph 3, by main currencies.
Graph 4 shows the approximate sensitivity to currencytranslation effects of Group annual earnings when the earningsof foreign subsidiaries are translated to .
Interest-rate risk Atlas Copco’s net interest expense as well as its overall compet-itive position are affected by changes in market interest rates.The impact of a permanent change in the interest rate level onGroup earnings depends on the duration of the fixed interestrate periods of loans and financial investments. The Group’searnings and competitive position are also influenced by thedegree to which other cash flows from both assets and liabilitiesare variable or fixed and can be adjusted for changes in marketinterest levels.
According to the financial risk policy, the duration of theinterest periods of liabilities should match as much as possiblethe duration of cash flows of assets in order to hedge theimpact of changes in market interest rates.
In view of the current structure of assets, the average dura-tion of the fixed interest rates of liabilities should be kept atabout 6 months. In February 2003, the average interest-rateperiod for loans was approximately 12 months.
Derivative instruments are actively used to control interest-rate exposure, for example, by extending or reducing the aver-age interest-rate period without replacing the underlying loanor deposit.
Funding riskAtlas Copco’s financial policy states there should always besufficient funds in cash and committed credit facilities to coverexpected requirements for the next 12 months. Furthermore, asubstantial portion of the total debt shall always be long-term.
The funding risk is controlled by limiting the amount ofdebt maturing in any single year, as well as by always keepingthe average tenor of outstanding debt above a minimum
(years to final maturity). According to policy, the Group’sinterest-bearing debt should have a minimum average of3 years, and a maximum of 700 of interest-bearing debt isallowed to mature in any single 365 days period (rolling basis).In February 2003, average was about 4.8 years, and theGroup had committed unutilized credit facilities of 6,350.
Credit ratingAtlas Copco’s long-term debt is currently rated by Standard &Poor’s (A-) and Moody’s (A3). Also the short-term debt israted by S&P (A2), Moody’s (P2) and Fitch (F2).
Atlas Copco Internal BankIn the area of financing and financial risk management central-ized management for an international Group like Atlas Copcoprovides clear and obvious advantages. The Atlas Copco Inter-
nal Bank was developed to ensure that these benefits remain inthe Group, while recognizing the decentralized operating struc-ture of the Group.
The Internal Bank’s mission is to serve the subsidiaries within the Group with working capital financing, hedging ofcurrency and interest rate exposure, and trade finance solutions.All transactions between the Internal Bank and the Group companies are carried out at market rates and conditions.
The Internal Bank also manages the inter-company nettingsystem, payments and cash pooling within the Group. It is furthermore the only entity that can take active risk positionsin the currency, money, and bond markets. This trading activityis governed by a risk mandate from the Board of Directors andthe Internal Bank has provided a steady contribution to theGroup’s result since its creation.
N O T E S T O T H E F I N A N C I A L S TAT E M E N T S
US
D
EU
R
GB
P
OT
HE
R
Change in earnings, MSEK
54 A T L A S C O P C O 2 0 0 2
N O T E S T O T H E F I N A N C I A L S TAT E M E N T S
U.S. and International Accounting StandardsThe Group prepares its financial statements in accordance withgenerally accepted accounting principles in Sweden (SwedishGAAP). Swedish GAAP differs in certain significant respectsfrom accounting principles generally accepted in the UnitedStates (US GAAP) and International Accounting Standards(IAS) adopted by the International Accounting StandardsBoard. The following sections include information of certainsignificant differences for standards currently in effect betweenUS GAAP and Swedish GAAP, and IAS and Swedish GAAP,which management believes is relevant to the Group.
US GAAPCapitalization of interestAccording to Swedish GAAP, the interest on external financing ofassets constructed or otherwise produced for own use may beexpensed. US GAAP requires that interest must be capitalized forcertain qualifying assets if certain conditions are met as part of thehistorical cost of acquiring and making ready for their intended use.
Financial instruments and hedging activitiesThe Group uses forward exchange contracts to hedge certainfuture transactions based on forecasted volume. For SwedishGAAP purposes, unrealized gains and losses on such forwardexchange contracts are deferred and recognized in the incomestatement in the same period that the hedged transaction is recognized.
Under US GAAP, gains and losses on forward exchangecontracts can be deferred only to the extent that the forwardexchange contract is designated and is effective as a hedge.Forward exchange contracts that exceed the amount of or thatare not designated as hedges are marked to market under USGAAP and unrealized gains and losses are recorded in theincome statement.
Derivative instruments, including embedded derivatives, mustbe recorded on the balance sheet at fair value as either assets orliabilities. A company must designate, document and assess theeffectiveness of a hedge to qualify for hedge accounting treatment.The accounting for changes in the fair value of a derivativeinstrument depends on the intended use and designation of thederivative at its inception.
For derivative instruments designated as “fair-value hedges,”gains and losses from derivative hedging instruments are recor-ded in earnings. For derivatives designated as “cash flow hedges,”changes in fair value, to the extent the hedge is effective, are recognized in other comprehensive income until the hedgeditem is recognized in earnings. Any changes in the fair value of
the derivative instrument resulting from hedge ineffectivenessare recognized in earnings immediately. For derivatives desig-nated as “foreign currency hedges of net investments in a for-eign operation,” the effective portion of the gain or loss fromthe hedging instrument is reported in other comprehensiveincome. The ineffective portion of the gain or loss is recognizedimmediately in earnings. For all other derivatives, gains andlosses from derivative instruments are recorded in earnings.
PensionsBoth Swedish and U.S. standards have the same objective whichis the accruing for the projected cost of providing such pensions.There are certain differences with US GAAP being generallymore prescriptive, requiring the use of the projected unit creditmethod; whereas under Swedish GAAP, the accrued benefitobligation is calculated. Other areas of differences include theactuarial assumptions, the treatment of actuarial gains andlosses and plan changes. Provisions for pensions and relatedexpenses for Atlas Copco’s U.S. subsidiaries have been reportedin the consolidated accounts in accordance with US GAAP.
Business combinationsUnder Swedish GAAP, there are a number of criteria whichdetermine whether a combination should be accounted for as amerger (pooling of interests). The criteria are designed to deter-mine whether the business combination meets the conceptualdefinition of a merger.
Under recently issued accounting standards in the UnitedStates, all business combinations initiated after June 30, 2001must be accounted for using the purchase method. There arealso specific criteria that intangible assets acquired in a businesscombination must meet in order to be recognized and reportedseparately from goodwill.
Goodwill and other intangiblesGenerally Atlas Copco accounts for subsidiaries acquired byuse of the purchase method which requires that goodwill arisingon consolidation is capitalized and amortized on a straight-linebasis over periods up to 40 years. Intangible assets are subjectto an impairment test using discounted cash flows.
Under US GAAP, all long-lived assets including goodwillare subject to a specific impairment test using undiscounted cashflows. Accounting standards, which became effective January 1,2002, require that goodwill and intangible assets with indefiniteuseful lives no longer be amortized, but instead be tested forimpairment at least annually.
55A T L A S C O P C O 2 0 0 2
N O T E S T O T H E F I N A N C I A L S TAT E M E N T S
Debt and marketable equity securitiesAtlas Copco accounts for financial and other investments heldfor trading purposes at the lower of cost or market. Financialand other investments, that are to be held to maturity, are valuedat amortized cost.
US GAAP requires that all debt and marketable equitysecurities be classified within one of the three following cate-gories: “held-to-maturity”, “trading”, or “available for sale”.Debt securities which management has the positive intent andability to hold to maturity are classified as held-to-maturityand reported at amortized cost. Securities bought and heldprincipally for the purpose of selling them in the near futureare classified as trading securities and measured at fair valuewith the unrealized gains and losses included in net profit.Debt and marketable equity securities not classified as eitherheld-to-maturity or trading are classified as available for saleand recorded at fair value with the unrealized gains and lossesexcluded from net profit and reported, net of applicable incometaxes, as a separate component of shareholders’ equity.
Translation of foreign currency financial statements in hyper-inflationary economiesFor subsidiaries that operate in hyper-inflationary economies,primarily Latin America, the Group in consolidation re-measuresthe financial statements of the subsidiary as if was thefunctional currency.
Under US GAAP, the group would be required to translatethe financial statements of subsidiaries that operate in hyper-inflationary economies as if the reporting currency, , wasthe functional currency of the subsidiary.
LeasesUnder Swedish GAAP, leases are reported in the consolidatedfinancial statements as either finance or operating leases. A financelease entails the transfer to the lessee, to a material extent, theeconomic risks and benefits generally associated with ownership.If this is not the case, the lease is reported as an operating leaseand the lease payments are expensed over the lease term.
The lease accounting rules under US GAAP are generallymore prescriptive and would require leases that either transferownership, contain minimum payments in excess of 90% offair market value of the leased asset, or the lease term is equalto or greater than 75% of the estimated economic life in theproperty, or contain a bargain purchase option are to be treatedas a capital or finance lease.
Sale and leasebackUnder Swedish GAAP, capital gains from property sold arerecognized at the time of sale even when an operating lease issigned with the new owner.
Under US GAAP, gains realized would be deferred over theduration of the lease contract.
Product developmentIn accordance with Swedish accounting standards, the Groupcapitalizes product development costs if the product or processis technically or commercially feasible. Capitalized developmentexpenditure is stated at cost less accumulated amortization andimpairment losses.
In accordance with US GAAP, expenditures for productdevelopment are expensed as incurred.
International Accounting Standards (IAS)Retirement benefitsSimilarly to US GAAP, the actuarial methods and assumptionsprescribed under IAS vary from Swedish GAAP with IAS alsorequiring the use of the projected unit credit method. Likewiseactuarial assumptions and the treatment of actuarial gains andlosses and plan changes may differ from Swedish GAAP.
Development costsIn accordance with Swedish GAAP prior to Jan. 1, 2002, devel-opment costs were expensed as incurred. IAS requires thatexpenditures on development activities are capitalized if theproduct is technically and commercially feasible and sufficientresources are available to complete development. Effective Jan. 1,2002, Swedish standards comply with IAS.
Financial instrumentsSimilar to US GAAP, derivative financial instruments are recog-nized initially at cost. Subsequent to initial recognition, deriva-tive financial instruments are stated at fair value. Recognitionof any unrealized gain or loss depends on the nature of the itembeing hedged.
56 A T L A S C O P C O 2 0 0 2
A P P R O P R I AT I O N O F P R O F I T A N D A U D I T O R ’S R E P O RT
Proposed distribution of profitAs shown in the balance sheet of Atlas Copco AB, the followingfunds are available for appropriation by the Annual GeneralMeeting:
Unappropriated earnings from preceding year 3,901,982,899Profit for the year 899,148,738
4,801,131,637
Appropriation of ProfitThe Board of Directors and the President propose that theseearnings be appropriated as follow:
To the shareholders, a dividend of 5.75 per share 1,205,212,558To be retained in the business 3,595,919,079
4,801,131,637
Nacka, February 3, 2003
Anders ScharpChairman
Jacob Wallenberg Michael Treschow Sune Carlsson
Lennart Jeansson Kurt Hellström Ulla Litzén
Thomas Leysen Charles E. Long Gunnar BrockPresident and CEO
Bengt Lindgren Lars-Erik Soting Håkan Hagerius
Auditors’ ReportTo the General Meeting of the shareholders of Atlas Copco AB (publ), Corporate identity number 556014-2720
We have audited the annual accounts, the consolidated accounts,the accounting records and the administration of the Board of Directors and the President of Atlas Copco AB (publ) forthe year 2002. These accounts and the administration of thecompany are the responsibility of the Board of Directors andthe President. Our responsibility is to express an opinion on the annual accounts, the consolidated accounts and the admin-istration based on our audit.
We conducted our audit in accordance with generallyaccepted auditing standards in Sweden. Those standardsrequire that we plan and perform the audit to obtain reason-able assurance that the annual accounts and the consolidatedaccounts are free of material misstatement. An audit includesexamining, on a test basis, evidence supporting the amountsand disclosures in the accounts. An audit also includes assess-ing the accounting principles used and their application by theBoard of Directors and the President, as well as evaluating theoverall presentation of information in the annual accounts andthe consolidated accounts. As a basis for our opinion concern-ing discharge from liability, we examined significant decisions,
actions taken and circumstances of the company in order to be able to determine the liability, if any, to the company ofany board member or the President. We also examined whetherany board member or the President has, in any other way, actedin contravention of the Companies Act, the Annual AccountsAct or the Articles of Association. We believe that our auditprovides a reasonable basis for our opinion set out below.
The annual accounts and the consolidated accounts havebeen prepared in accordance with the Annual Accounts Actand, thereby, give a true and fair view of the Company’s and the Group’s financial position and results of operationsin accordance with generally accepted accounting principlesin Sweden.
We recommend to the general meeting of shareholders thatthe income statements and balance sheets of the Parent Com-pany and the Group be adopted, that the profit for the ParentCompany be dealt with in accordance with the proposal in theBoard of Directors’ Report and that the members of the Boardof Directors and the President be discharged from liability forthe financial year.
Nacka, February 19, 2003
KPMG Bohlins ABStefan Holmström
Authorized Public Accountant
57A T L A S C O P C O 2 0 0 2
G R O U P M A N A G E M E N T
Group Management
Gunnar Brock
President and Chief Execu-tive Officer for the AtlasCopco Group. Employedsince 2002. Born 1950. Hold-ings: 2,500 A and 22,112employee stock options.
Bengt Kvarnbäck
Senior Executive Vice Presi-dent of Atlas Copco AB, andBusiness Area Executive forCompressor Technique.Employed since 1992. Born1945. Holdings: 11,371 A, 57B, 9,014 A call options, and33,168 employee stockoptions/SARs.
Freek Nijdam
Senior Executive Vice Presi-dent of Atlas Copco AB, andBusiness Area Executive forRental Service. Employedsince 1970. Born 1940. Holdings: 1,317 A, 2,784 Acall options, and 29,482employee stockoptions/SARs.
Göran Gezelius
Senior Executive Vice Presi-dent of Atlas Copco AB, andBusiness Area Executive forIndustrial Technique.Employed since 2000. Born1950. Holdings: 33,168employee stock options.
Björn Rosengren
Senior Executive Vice Presi-dent of Atlas Copco AB, andBusiness Area Executive forConstruction and MiningTechnique. Employed since1998. Born 1959. Holdings:2,396 A call options and22,112 employee stockoptions.
Hans Ola Meyer
Senior Vice President Con-trolling and Finance.Employed since 1991. Born 1955. Holdings: 571 A,300 B, 5,384 A call options,and 16,584 employee stockoptions.
Marianne Hamilton
Senior Vice President, Orga-nizational Development andManagement Resources.Employed since 1990. Born1947. Holdings: 3,175 A,5,384 A call options, and16,584 employee stockoptions.
Hans Sandberg
Senior Vice President,General Counsel. Employedsince 1975. Born 1946. Holdings: 200 A, 3,902 A call options, and 16,584employee stock options.
Annika Berglund
Senior Vice President GroupCommunications. Employedsince 1979. Born 1954. Holdings: 1,300 A, 165 B,3,006 A call options, and16,584 employee stockoptions.
Management changes
July 1, 2002, Gunnar Brock replaced Giulio Mazzalupi as President and CEO for theAtlas Copco Group.
February 28, 2002, Freek Nijdam replaced Thomas Bennett as Business Area Execu-tive for Rental Service.
March 1, 2002, Björn Rosengren replaced Freek Nijdam as Business Area Executivefor Construction and Mining Technique.
58 A T L A S C O P C O 2 0 0 2
B O A R D O F D I R E C T O R S A N D A U D I T O R S
Anders Scharp Jacob Wallenberg Gunnar Brock Michael Treschow
Sune Carlsson Lennart Jeansson Kurt Hellström Ulla Litzén
Board of Directors and Auditors
Board of DirectorsAnders Scharp Chairman (1992). Born 1934.Chairman of the Boards of AB SKF, Saab AB,and AB Nederman. Member of the Board ofInvestor AB. Holdings: 31,000 A.
Jacob Wallenberg Vice Chairman (1998).Born 1956. Chairman of the Board of SEB.Vice Chairman of Investor AB, The Knut andAlice Wallenberg Foundation, AB Electroluxand SAS AB. Board Member of ABB Ltd andConfederation of Swedish Enterprise. Hold-ings: 26,657 A.
Gunnar Brock (2002). Born 1950. Presidentand Chief Executive Officer of Atlas Copco.Employed by Atlas Copco since 2002. Mem-ber of the Boards of OM-Gruppen, Sweden; Lego AS, Denmark. Member of the RoyalSwedish Academy of Engineering Sciences(IVA). Holdings: 2,500 A and 22,112 employeestock options.
Michael Treschow (1991). Born 1943. Chairman of TelefonaktiebolagetLM Ericsson. Vice chairman of the Confederation of Swedish Enter-prise. Member of the Board of Electrolux. Holdings: 32,000 A.
Sune Carlsson (1997). Born 1941. President and Chief Executive Offi-cer of AB SKF. Member of the Board of AB SKF and Investor AB. Hold-ings: 5,714 B.
Lennart Jeansson (1997). Born 1941. Executive Vice President of ABVolvo. Chairman of Stena AB. Member of the Board of Bilia and StenaMetall. Holdings: 2,142 A.
Kurt Hellström (1999). Born 1943. President and Chief Executive Offi-cer of Telefonaktiebolaget L M Ericsson. Holdings: 1,142 A.
Ulla Litzén (1999). Born 1956. President W Capital Managmeent AB.Member of the Board of AB SKF, Posten AB, AB Svensk Stiftelseför-valtning, and W Capital Management AB. Holdings: 10,700 A.
Thomas Leysen (2001). Born 1960. Chief Executive Officer of Umicore.Chairman of VUM Media (Belgium), Director of KBC Bank and Insur-ance (Belgium). Holdings: 3,500 A.
HonoraryChairmanPeter Wallenberg DrEcon. h.c. Employedin various positionswithin Atlas Copco,1953–1974. Chairmanof the Board 1974–1996. Honorary Chair-man of Investor AB.Chairman of TheKnut and Alice Wal-lenberg Foundation.
59A T L A S C O P C O 2 0 0 2
B O A R D O F D I R E C T O R S A N D A U D I T O R S
Thomas Leysen Charles E. Long Bengt Lindgren Lars-Erik Soting
Håkan Hagerius Sune Kjetselberg Mikael Bergstedt Rodny Thorén
Charles E. Long (2002). Born 1940. Former Vice Chairman of Citicorp.Member of the Board of Directors of U.S.-based Introgen Therapeu-tics, The Drummond Company, Atlas Copco North America Inc., andSweden-based Gendux AB. Holdings: 2,000 ADR.
Employee representativesBengt Lindgren (1990). Born 1957. Chairman, Atlas Copco Secoroclocal of the Metal Workers Union, Fagersta. Holdings: 0.
Lars-Erik Soting (1993). Born 1965. Chairman, Atlas Copco Rock Drillslocal of the Metal Workers Union, Örebro. Holdings: 0.
Håkan Hagerius (1994). Born 1942. Chairman of the Swedish Union ofClerical and Technical Employees in Industry (SIF) at Atlas Copco RockDrills, Örebro. Holdings: 0.
Sune Kjetselberg Deputy Member (1992). Born 1951. Chairman, AtlasCopco Tools local of the Metal Workers Union, Tierp. Holdings: 0.
Mikael Bergstedt Deputy Member (2000). Born 1960. Chairman, AtlasCopco Tools local of the foremen’s union (Ledarna), Tierp. Holdings: 0.
Rodny Thorén Deputy Member (2001). Born 1949. Chairman of theSwedish Union of Clerical and Technical Employees in Industry (SIF)at Atlas Copco CMT Sweden AB. Holdings: 0.
AuditorsThe audit firm KPMG Bohlins AB is the appointed auditor of Atlas CopcoAB, with authorized public accountant Stefan Holmström as responsible.
60 A T L A S C O P C O 2 0 0 2
T H E AT L A S C O P C O S H A R E
The Atlas Copco Share
Highest – Lowest Share Price, A share
Traded shares (A+B), thousands,Stockholmsbörsen
General Index Engineering Index
Share capitalAtlas Copco’s share capital at year-end 2002 amounted to 1,048,010,920 distributed among 209,602,184 shares, eachwith a par value of 5. Class A shares entitle the holder toone voting right, and class B shares entitle the holder to one-tenth of a voting right. Each round lot consists of 100 shares.
Distribution of shares, December 31, 2002Class of share Shares outstanding % of votes % of capitalA shares 139,899,016 95.3 66.7B shares 69,703,168 4.7 33.3Total 209,602,184 100.0 100.0
At year-end 2002, Atlas Copco had 38,810 shareholders (38,036).The proportion of shares held by institutional investors was 77%(78). The 10 largest shareholders accounted for 36% (40) of thevoting rights and 36% (41) of the number of shares. Non-Swedish
At December 31, 2002, the price of the Atlas Copco
A share was SEK 170. During 2002, the price of the
A share decreased 38%, while the Stockholm
Exchange’s, Stockholmsbörsen, Industrial Index lost
24% and the General Index lost 37%. The annual total
return on the Atlas Copco A share, equal to dividend
plus the appreciation of the share price, averaged
12.3% for the past 10 years and –3.4% for the past
five years. The corresponding total yield for the
Stockholmsbörsen as a whole was 12.9% (1993–2002)
and –1.5% (1998–2002).
Share price Number of shares
700
600
500
400
300
200
100
0
56,000
48,000
40,000
32,000
24,000
16,000
8,000
0
1998 1999 2000 2001 2002
SEK
61A T L A S C O P C O 2 0 0 2
T H E AT L A S C O P C O S H A R E
investors held 42% (35) of the shares and represented 47% (40) ofthe voting rights.
Ownership structure, December 31, 2002Number of shares % of shareholders % of capital
Shareholders by country, December 31, 2002% of votes % of capital
Sweden 53.4 58.2The United States 16.4 14.4Great Britain 14.7 14.6Singapore 2.5 1.9Luxembourg 2.1 2.0France 1.9 1.4Belgium 1.7 1.5Netherlands 1.3 1.0Japan 1.2 1.0Germany 1.0 0.7Others 3.8 3.3Total 100.0 100.0
Market capitalizationAtlas Copco’s market capitalization at December 31, 2002 wasMSEK 34,552 (48,176), which corresponds to 1.9% (1.7) of thetotal market value of the Stockholmsbörsen.
Dividend policyThe Board’s goal is for dividends to shareholders to correspondto 30 to 40% of earnings per share. Atlas Copco AB’s goal is tocover the major part of the dividend payment with dividendincome from subsidiaries.
If the shareholders approve the Board of Directors’ pro-posal for a dividend of 5.75 per share for 2002, the averagedividend growth for the five-year period 1998–2002 will equal
7.1%. During that period, thedividend has averaged 38% ofearnings per share. Expressedas a percentage of sharehold-ers’ equity, the dividend pro-posed for 2002 is 5.9% (4.1).
TradingTrading of the Atlas Copco ABshares primarily takes place onStockholmsbörsen. In 2002,Atlas Copco shares were the10th (12th) most actively tradedshares on this stock exchange.A total of 376,022,140 shareswere traded (296,387,119 classA, 79,635,021 class B), corre-sponding to a value of
77,945 (66,860). On average,1,504,089 shares (1,275,105) weretraded each business day.The turnover rate (degree of liquidity) in 2002 was 179% (152),compared with the stock market average of 122% (134).As of December 2002, foreign trading in the Atlas Copco shareshowed a net export of 3,326 (844). Atlas Copco shares are also listed on the London and Frankfurt stock exchanges.
ADR program in the U.S.In 1990, a program for American Depositary Receipts (ADRs)was established in the U.S. Since then, both A and B shares areavailable as depositary receipts in the U.S. without being formallyregistered on a U.S. stock exchange. One ADR corresponds to oneshare. The depositary bank is Citibank N.A. At year-end 2002,there were 662,316 (530,671) depositary receipts outstanding, ofwhich 381,494 represented class A shares and 280,822 class B.
Atlas Copco optionsThe Atlas Copco options listed on the Stockholmsbörsen con-sist of call options and put options, each linked with 100shares. Option contracts traded in 2002 corresponded to
approximately 22.8 million shares (23.4), orabout 11% (11) of the total number of AtlasCopco shares. Every day, an average of 91,395Atlas Copco shares was affected by trading inoptions. Since the options confer on the holderthe right to buy or sell existing shares only, theyhave no dilution effect.
Share riskThe Atlas Copco share’s beta value provides anassessment of its risk. The beta value is a relativemeasure of the risk attached to the share, reflectinghow it has tracked different stock indices during aspecified period of time. A beta value below 1.0indicates that the share moves less than the index.
The beta value can, however, vary quite con-siderably (from 0.5 to 1.2 approximately),depending on which index and time period areused as basis for the calculation. The Atlas CopcoGroup uses a beta value of 1.0 internally.
Earnings and dividend per share
18
15
12
9
6
3
0
SEK
10 largest shareholders, December 31, 2002% of % of
Number of shares A-shares B-shares votes capitalInvestor Group 31,454,971 31,454,971 0 21.4 15.0SEB Group 7,149,619 4,423,288 2,726,331 3.2 3.4Government of Singapore 3,762,863 3,496,922 265,941 2.4 1.8Handelsbanken Group 5,120,667 2,489,514 2,631,153 1.9 2.4Third National Pension Insurance Fund 3,733,015 2,439,363 1,293,652 1.7 1.8First National Pension Insurance Fund 2,715,188 1,965,716 749,472 1.4 1.2Fourth National Pension Insurance Fund 2,436,600 1,888,600 548,000 1.3 1.2FöreningsSparbanken Group 9,650,832 678,118 8,972,714 1.1 4.6Second National Pension Insurance Fund 2,246,359 1,357,364 888,995 1.0 1.1Alecta 7,279,808 784,333 6,495,475 1.0 3.5Others 134,052,262 88,920,827 45,131,435 63.6 64.0Total 209,602,184 139,899,016 69,703,168 100.0 100.0
The table above shows the largest shareholdings, by voting rights, registered with VPC, the Swedish Securities Register Center.
98 99 00 01 02
Earnings*
Dividend (for 2002 proposed)
*) Excluding goodwill impairmentcharge 2002.
62 A T L A S C O P C O 2 0 0 2
T H E AT L A S C O P C O S H A R E
Statutory limitations on coupon shares and bonus sharesNon-VPC registered shares from 1974 and unclaimed sharesfrom the bonus issue in 1989 were sold during the year and
the right to these shares has been transformed to a right toreceive the proceeds. These rights will expire in 2010 and2004, respectively.
New issue (non-preferential) 2,765,000 shares at SEK 135 69.1 373.31989 Bonus issue 1 B share: 3 A shares 195.51990 New issue (non-preferential) 4,000,000 B shares at SEK 320.13 100.0 1,280.5
Conversion* 914,496 shares 22.9 137.21994 Split 5:1 par value SEK 51999 New issue 1:7 SEK 160 130.4 4,173.8
*) Pertains to 1987/1993 convertible debenture loan.
**) In connection with the acquisition of The Robbins Company.
Analysts following Atlas Copco
ABG Sundal Collier Klas Andersson Alfred Berg Gustaf Lindskog Carnegie Anders Idborg Cheuvreux Peter Karlsson Commerzbank David Blackwood Credit Suisse First Boston Patrick Marshall Deutsche Bank Peter Reilly Dresdner Kleinwort Wasserstein Fredrik Karlsson Enskilda Securities Anders Eriksson Evli Bank Michael Andersson Fischer Partners Fondkommission Henrik Moberg Goldman Sachs Nick Paton Hagströmer & Qviberg Lars Glemstedt
Handelsbanken Mikael Sens HSBC Roddy Bridge JP Morgan Andreas Willi JP Nordiska Peder FrölénLehman Brothers Peter Lawrence Merrill Lynch Mark Troman Morgan Stanley Daniel Cunliffe Nordea Securities Johan Sivander Schroders Securities Tim Adams Swedbank/Föreningssparbanken Mats Liss UBS Warburg Anders Fagerlund WestLB Panmure Ralf Dörper Öhman Fondkommission Anders Roslund
*
22
*
F I N A N C I A L I N F O R M AT I O N
Financial InformationWelcome to the Annual General MeetingAtlas Copco shareholders are hereby notified that the Annual General Meeting will beheld on Monday, April 28, 2003, at 5 p.m. in Berwaldhallen, Dag Hammarskjölds väg 3,Stockholm.
Financial information from Atlas CopcoApril 28, 2003 Q1—first quarter results July 17, 2003 Q2—second quarter results October 23, 2003 Q3—third quarter results February 2, 2004 Q4—fourth quarter resultsMarch, 2004 Annual Report 2003
Order the Annual Report Order the Annual Report from Atlas Copco AB, Group Communications, SE-105 23 Stockholm, Sweden.www.atlascopco-group.com, Phone: +46-8-743 8000, Fax: +46-8-643 3718.
www.atlascopco-group.com The Atlas Copco Group site serves the financial markets with information. Here, youwill find financial reports and key figures in ready-to-use digital formats and you cansubscribe to information from the Group. Investor presentations can be downloadedand you can view and/or listen to presentations of quarterly reports via your computer.A comprehensive overview of the company and its operations can also be found at thesite, with links to the Group’s brands and the different countries where the Group hasoperations.
MediaAnnika Berglund, Senior Vice President Group CommunicationsPhone: +46 8 743 8070, Mobile: +46 70 322 [email protected]
Summary
Atlas Copco 2002 3Facts in Brief 4Chairman of the Board 6President and CEO 7
Atlas Copco Group
Board of Directors’ Report 8Compressor Technique 16Rental Service 18Industrial Technique 20Construction and Mining Technique 22Consolidated Income Statement 24Consolidated Balance Sheet 25Cash Flow Statement 26Notes to Atlas Copco Group Cash Flow Statement 27Five Years in Summary 29Summary in USD 30Summary in EUR 31Quarterly Data 32
Accounting Principles 33Definitions 36Notes 37Shares and Participations 50Financial Exposure 52U.S. and International Accounting Standards 54Appropriation of Profit 56Auditors’ Report 56
Investor and Shareholder Information
Group Management 57Board of Directors and Auditors 58The Atlas Copco Share 60Financial Information 63Addresses 64
Contents
Three Key Publications at Your ServiceAtlas Copco has three separate publications to better serve itsmain stakeholders.
The Annual Report fulfills the legal requirements for infor-mation. It also includes information of specific interest to theinvestor community.
Achieve presents how Atlas Copco works to reach itsvision. Strategic moves are highlighted and the Group
communicates what Atlas Copco is focusing on. In this publi-cation you can also read how the President and CEO GunnarBrock describes the Group in-depth.
The Sustainability Report is Atlas Copco’s report on envi-ronmental and social issues.
All reports are available in pdf format on the Group’s website www.atlascopco-group.com.
Achieve and the Sustainability Report are not part of theAnnual Report and they are not audited.
Atlas Copco AB and its subsidiaries are sometimes referred toas the Atlas Copco Group, the Group, or Atlas Copco. AtlasCopco AB is also sometimes referred to as Atlas Copco. Anymention of the Board of Directors or the Directors refers to theBoard of Directors of Atlas Copco AB.
Atlas Copco Annual Report 2002 02
Atlas Copco’s revenues declined 7% to MSEK 47,562. Excluding goodwill impairment charge, operating profit was MSEK 5,261, corresponding to a margin of 11.1% (12.0), and earnings per share decreased to SEK 13.88 (14.63).
AchieveAtlas Copco Operational Report 2002
Inventions, Innovations, and Incremental Improvements
The Rush is on for Growth in Russia
Committed to Demanding Customers
Atlas Copco Sustainability Report 2002 02
Stable level of value added despite lower profits. Stable environmentaland workplace performance. ISO-certified environmental managementsystems implemented in almost all divisions.
Atlas Copco Annual Report 2002 02
Atlas Copco’s revenues declined 7% to MSEK 47,562. Excluding goodwill impairment charge, operating profit was MSEK 5,261, corresponding to a margin of 11.1% (12.0), and earnings per share decreased to SEK 13.88 (14.63).
Atlas Copco ABSE-105 23 Stockholm, Sweden
Phone: +46 8 743 8000www.atlascopco-group.com
Pro
du
ction
: Atla
s Co
pco
AB
an
d In
telle
cta C
orp
ora
te A
B. P
ho
to: V
ecka
ns A
ffäre
r/Su
ne
Frid
ell (p
ag
e 4
–5
), Gu
y V
an
de
n B
osch
(pa
ge
17
–23
, 57
), Q-im
ag
e (p
ag
e5
8–
59
). Prin
t: Tryckin
du
stri Info
rma
tion
AB
. Co
py
righ
t 20
03
, Atla
s Co
pco
AB
, Sto
ckho
lm, S
we
de
n.
98
50
90
44
01
AddressesAtlas Copco Group Center
Atlas Copco AB (publ)SE-105 23 Stockholm, SwedenPhone: +46-8-743 8000Fax: +46-8-644 9045www.atlascopco-group.comCorp. id. no: 556014-2720
Atlas Copco Compressor Technique
AirpowerP O Box 100BE-2610 Wilrijk, BelgiumPhone: +32-3-870 2111Fax: +32-3-870 2443
AirtecP O Box 101BE-2610 Wilrijk, BelgiumPhone: +32-3-870 2111Fax: +32-3-870 2443
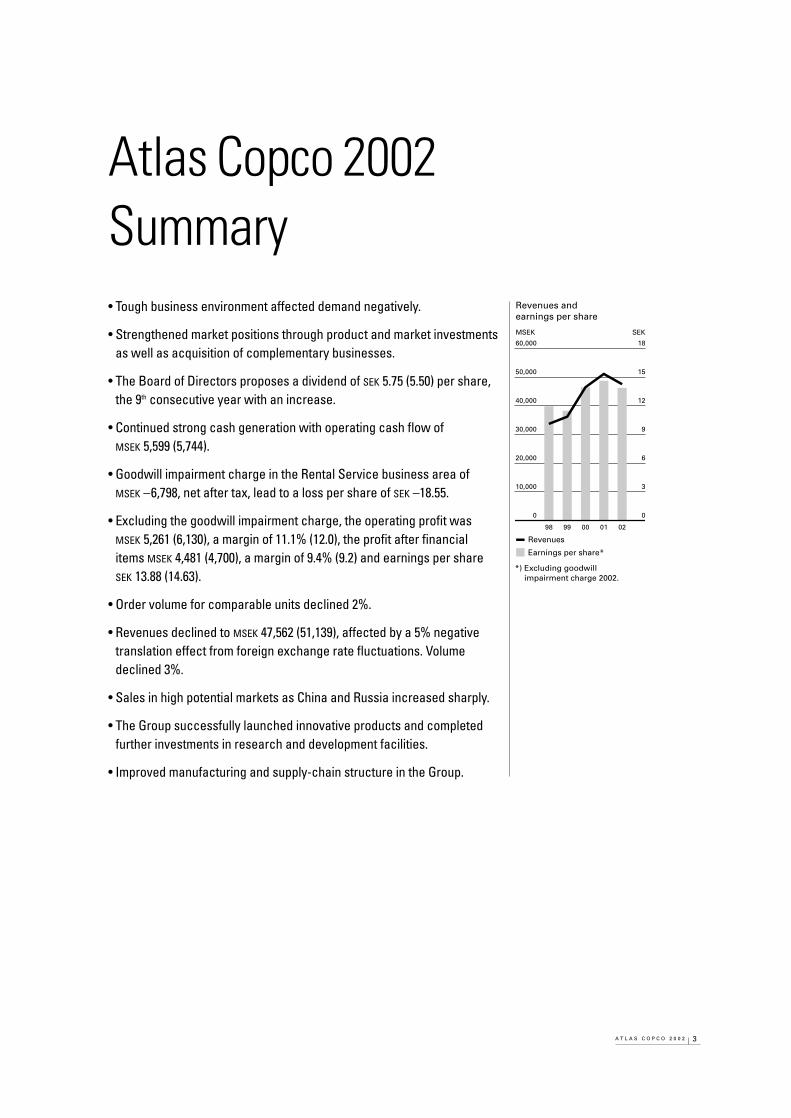
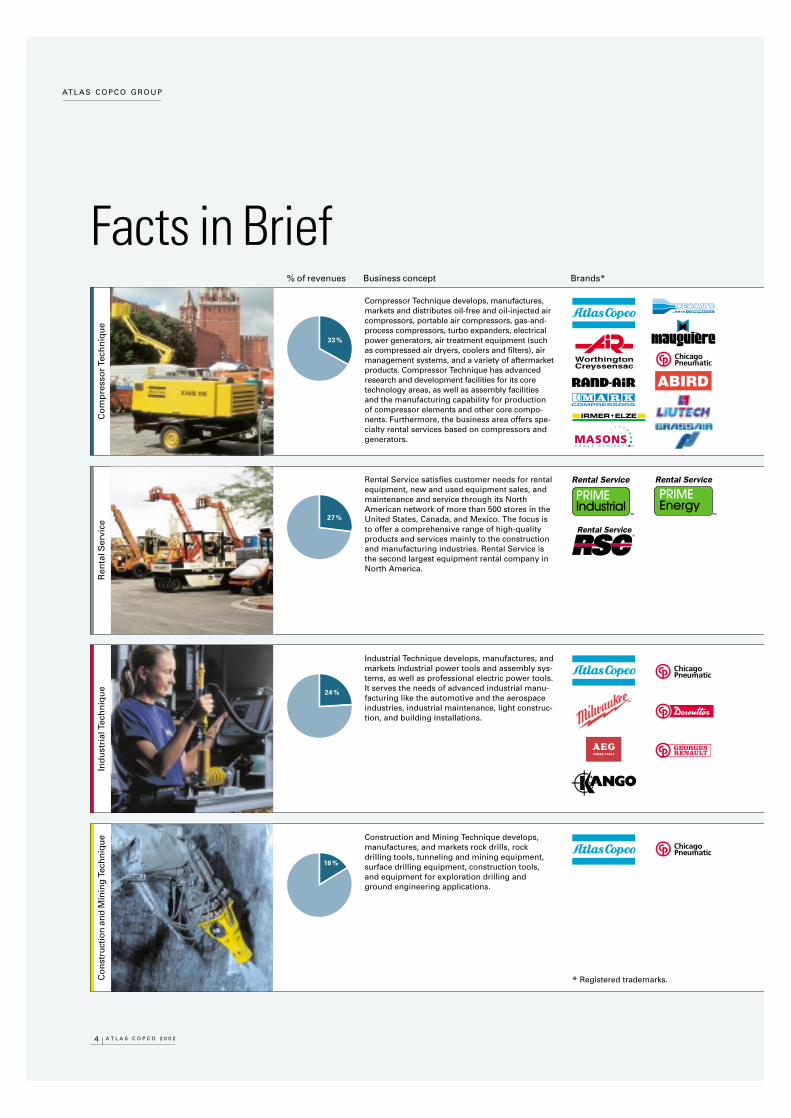
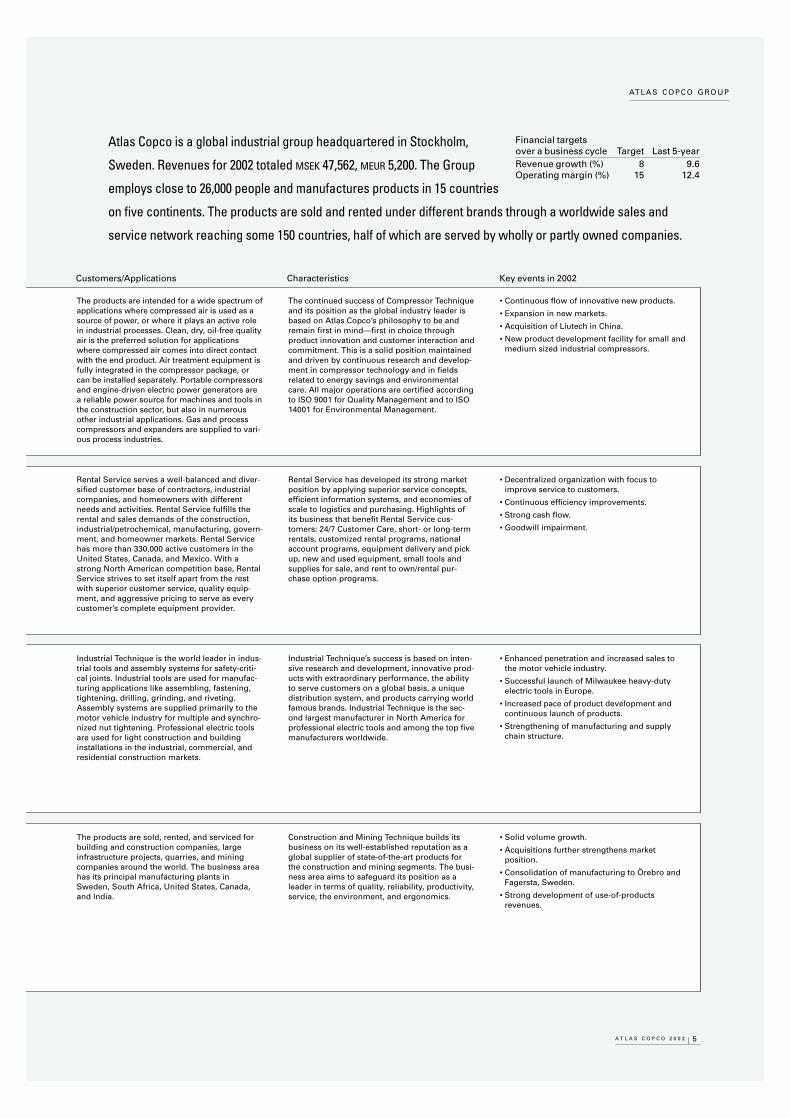
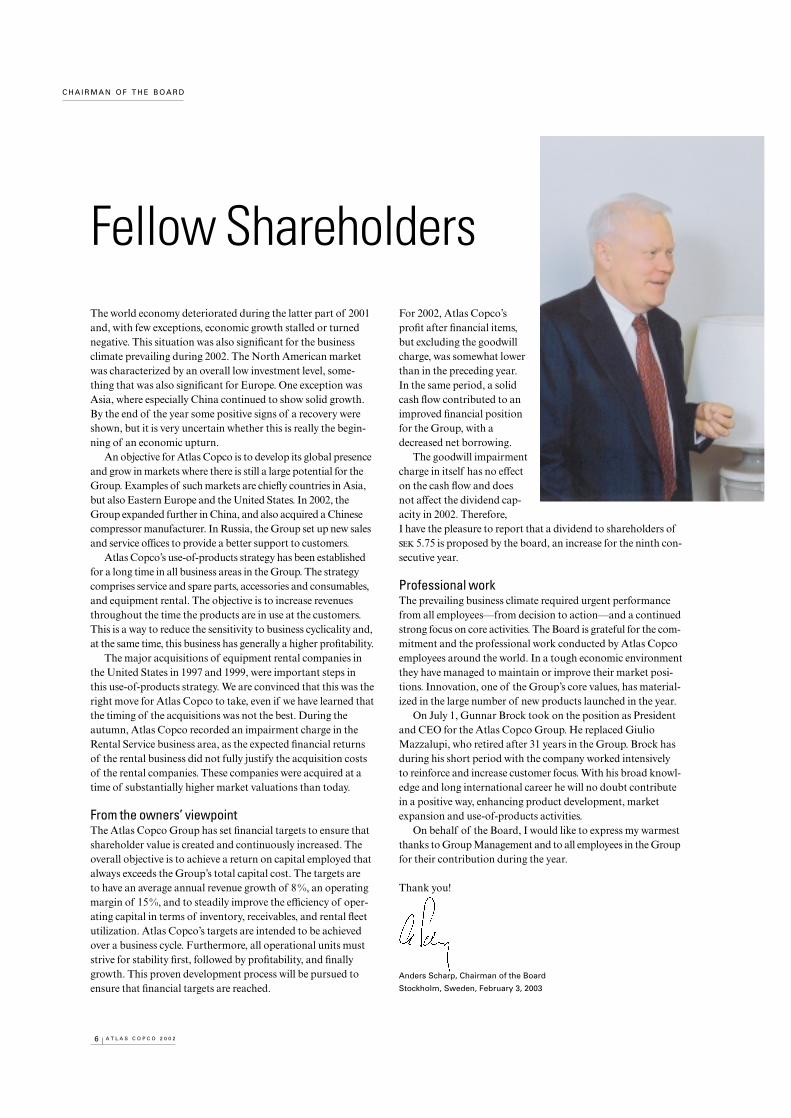
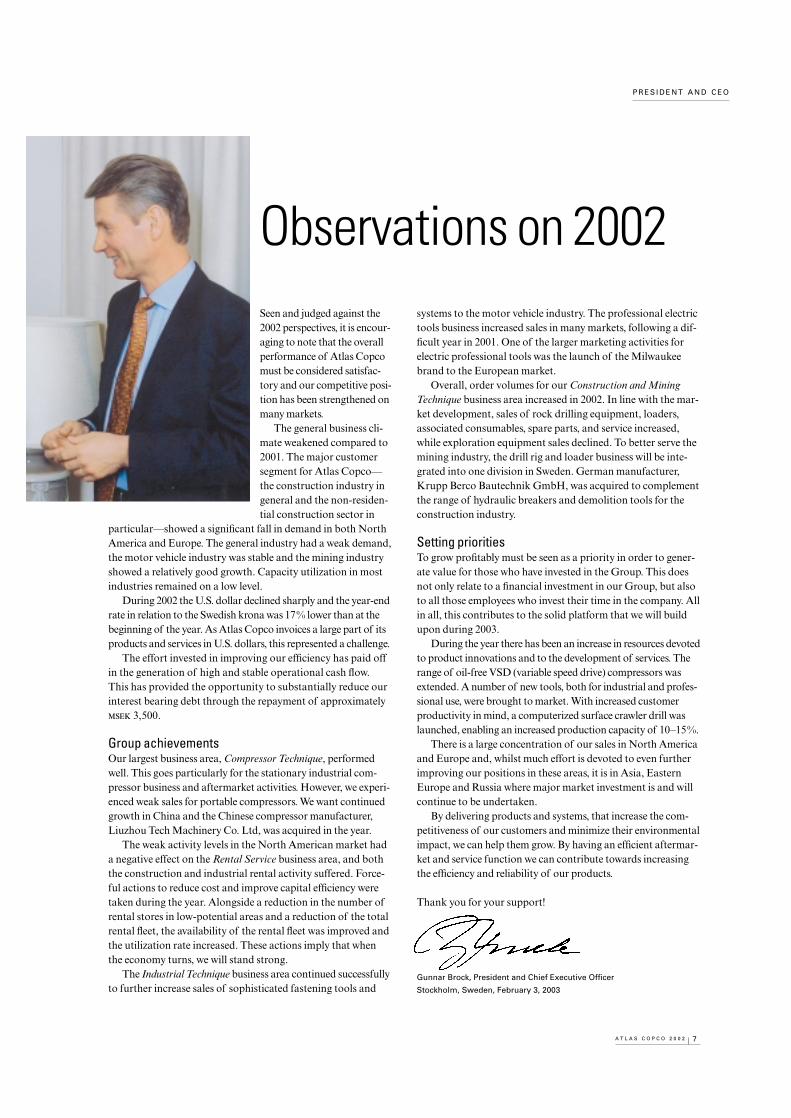
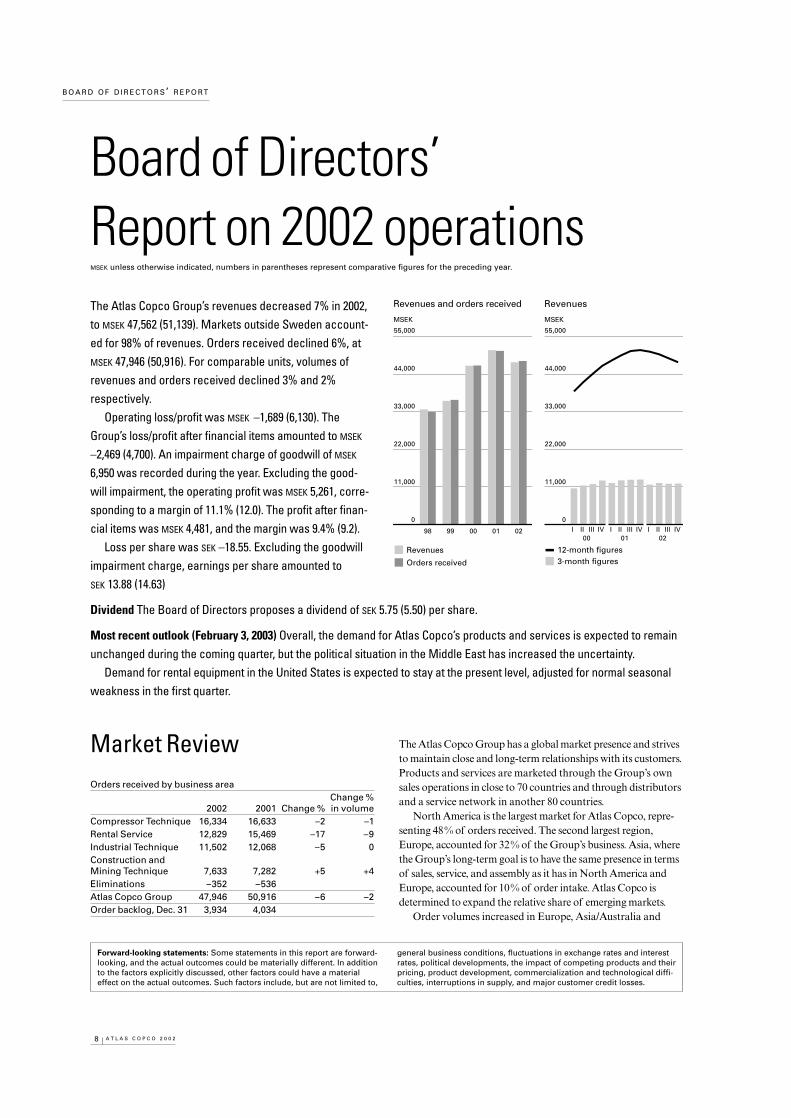
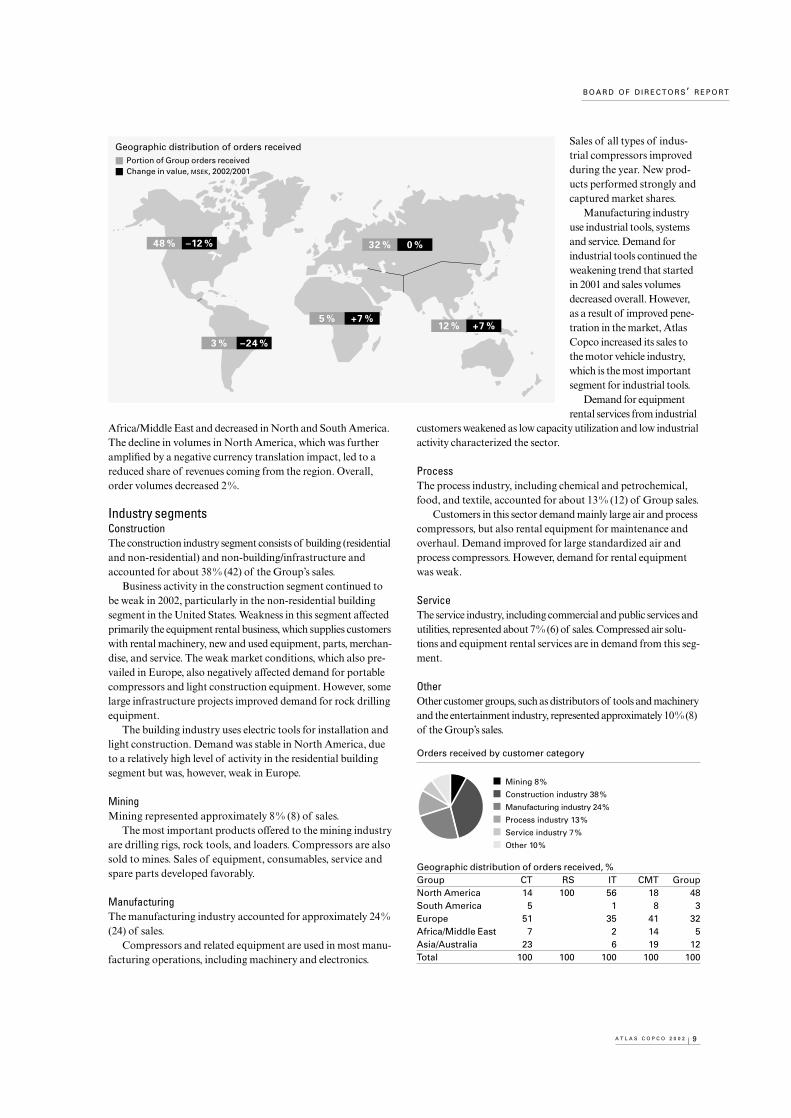
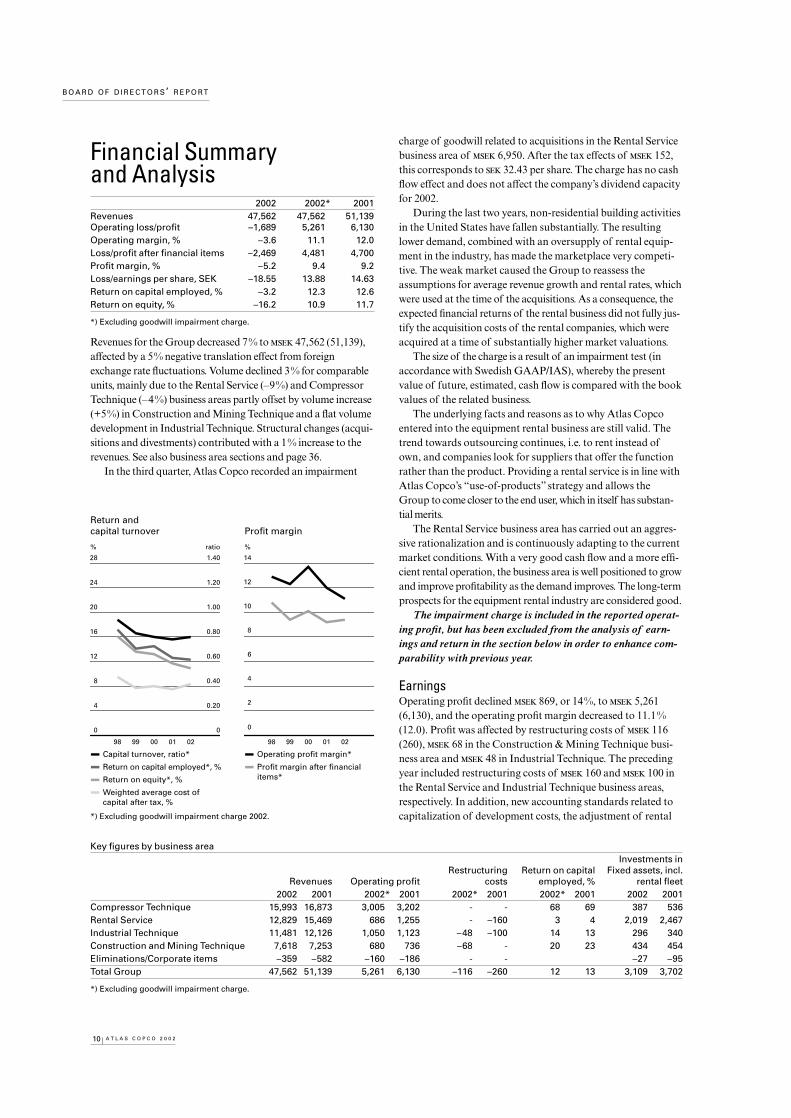
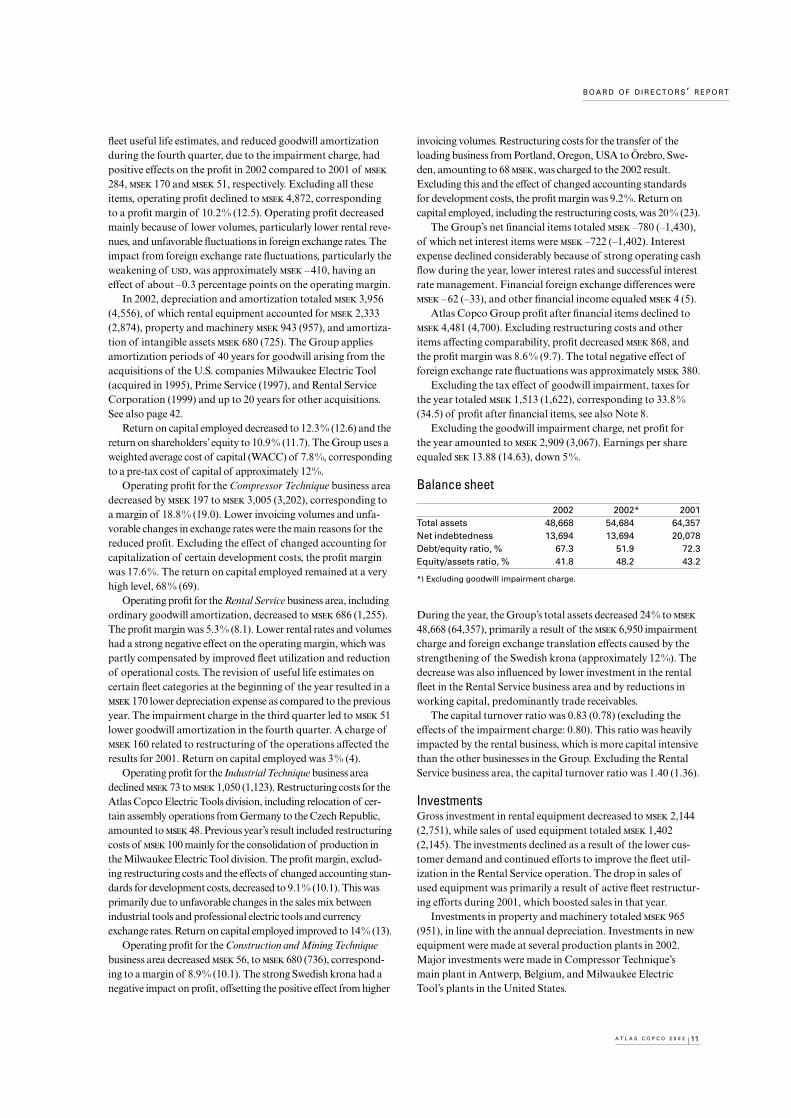
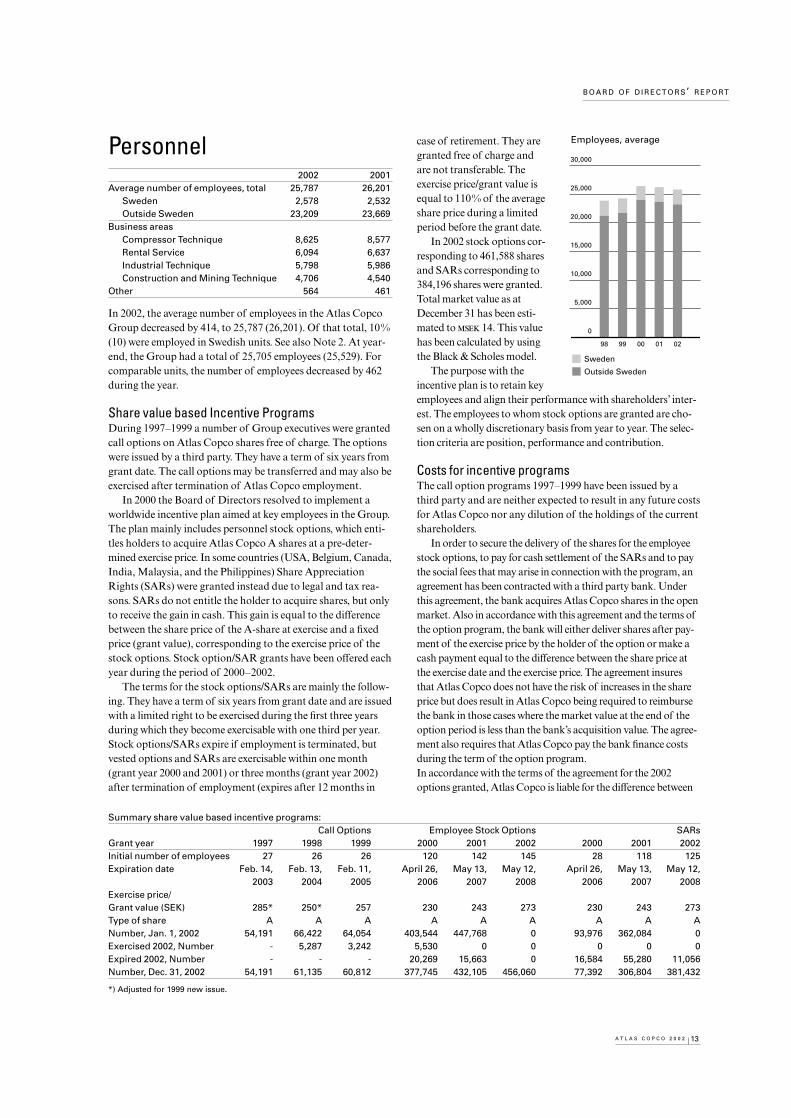
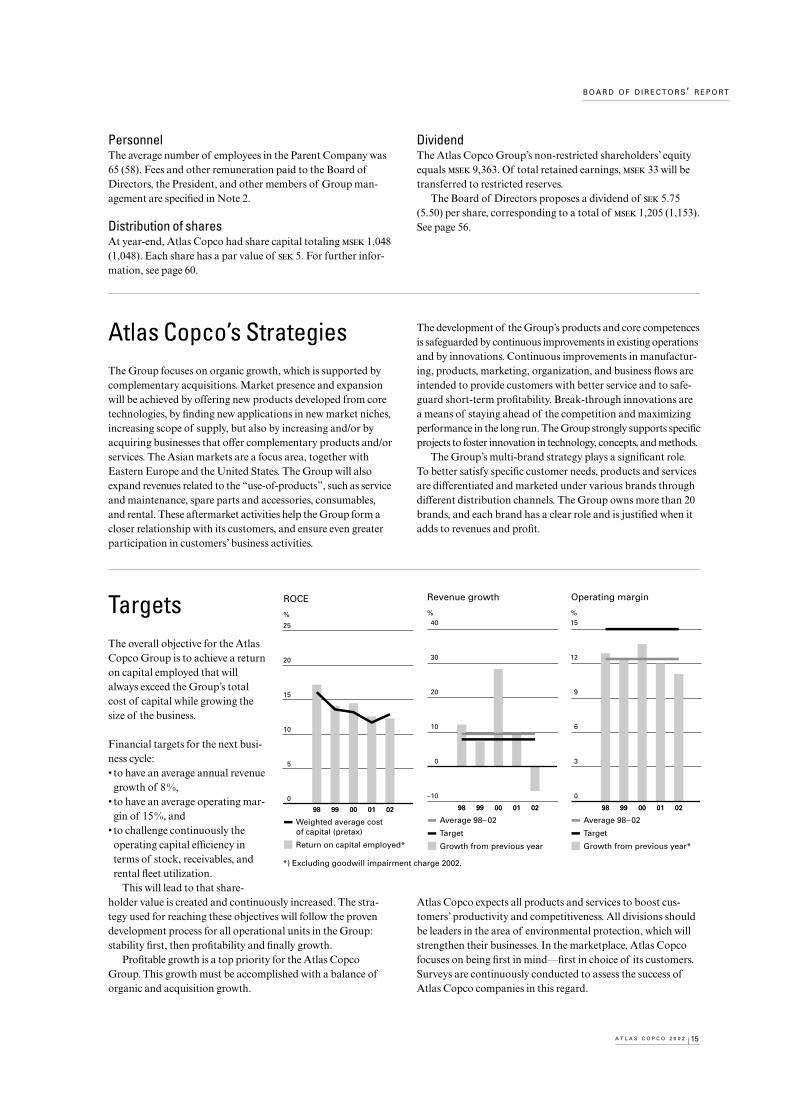
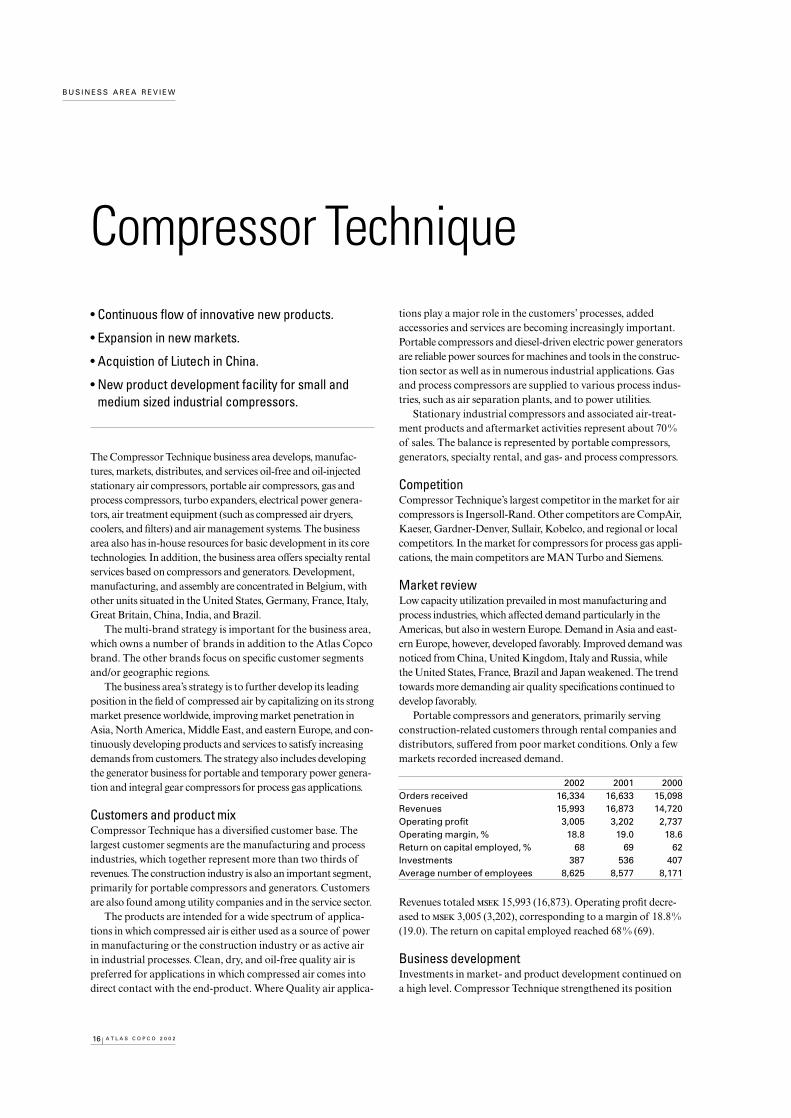
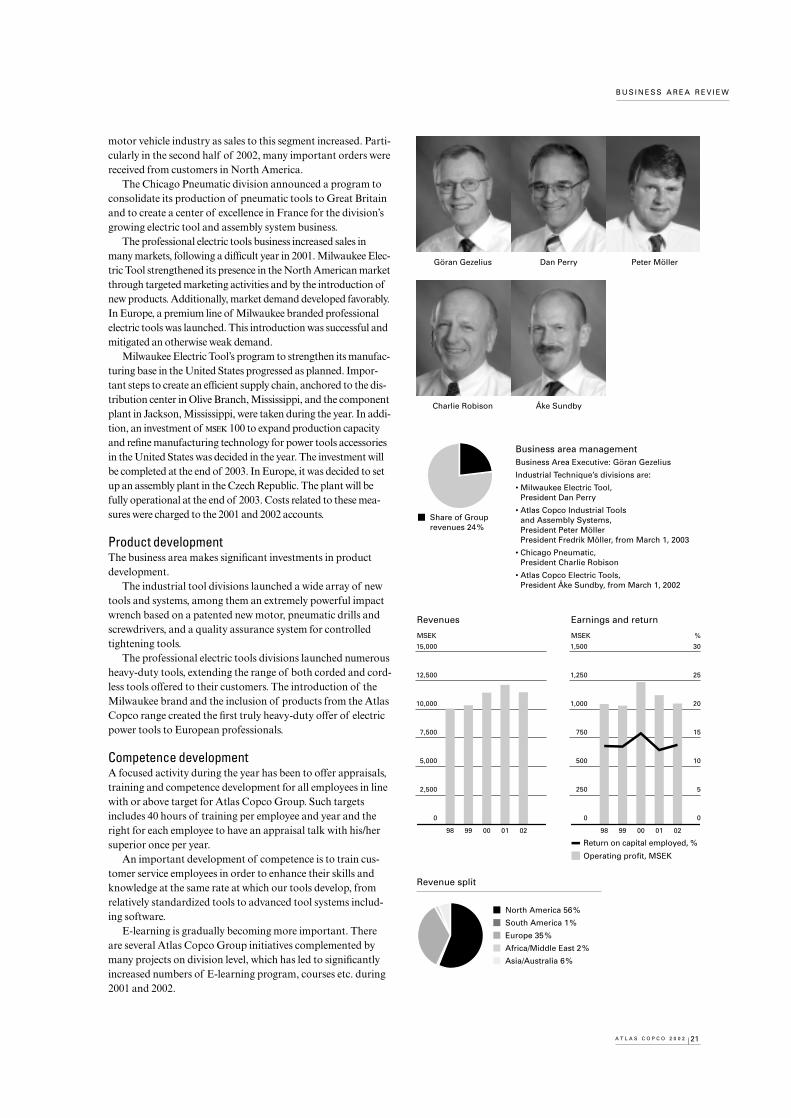
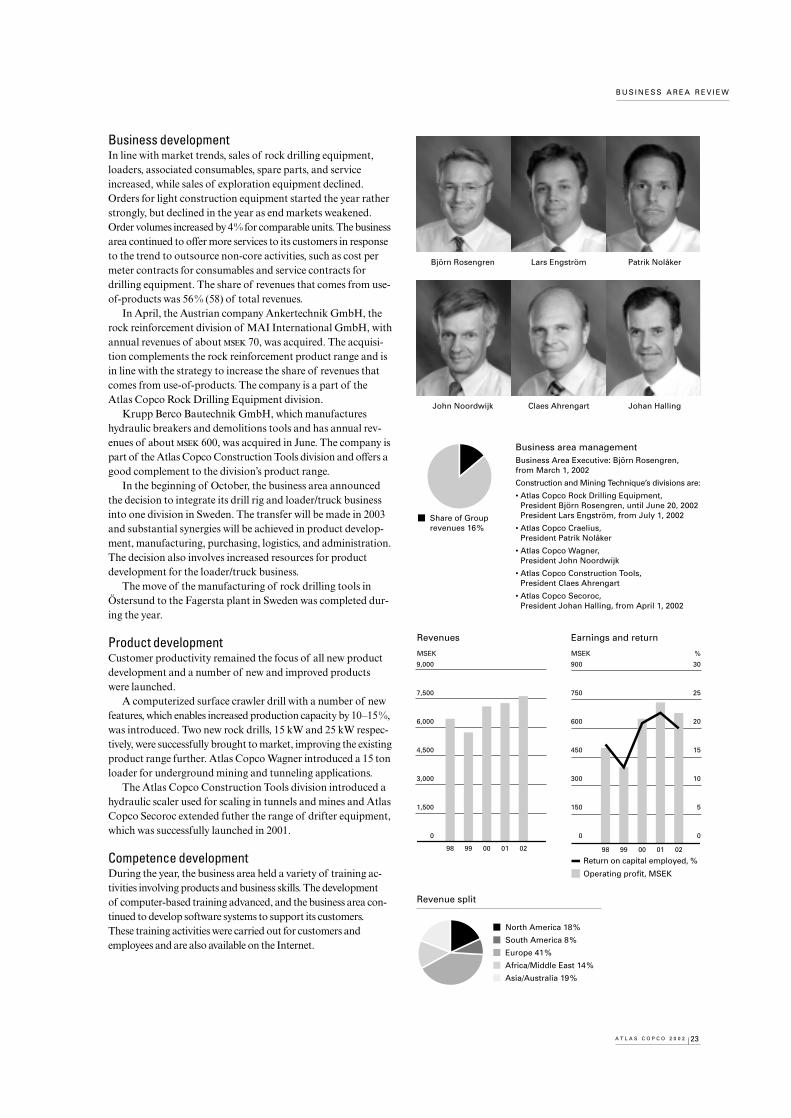
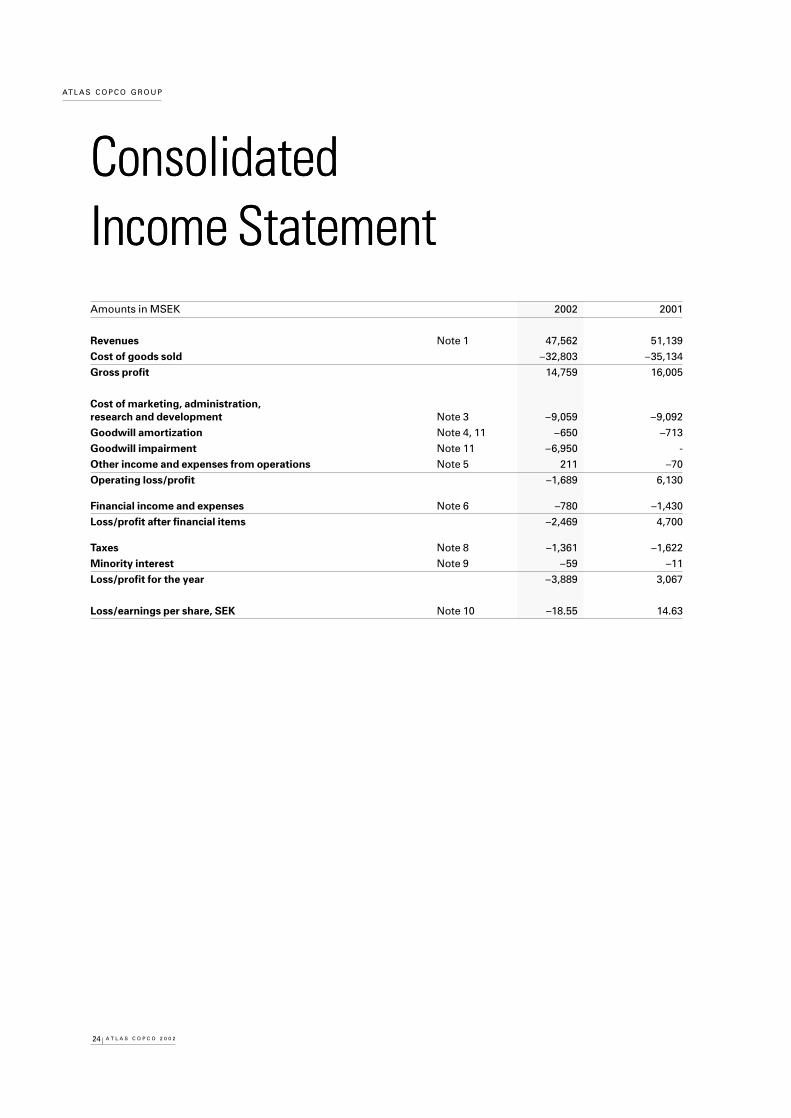
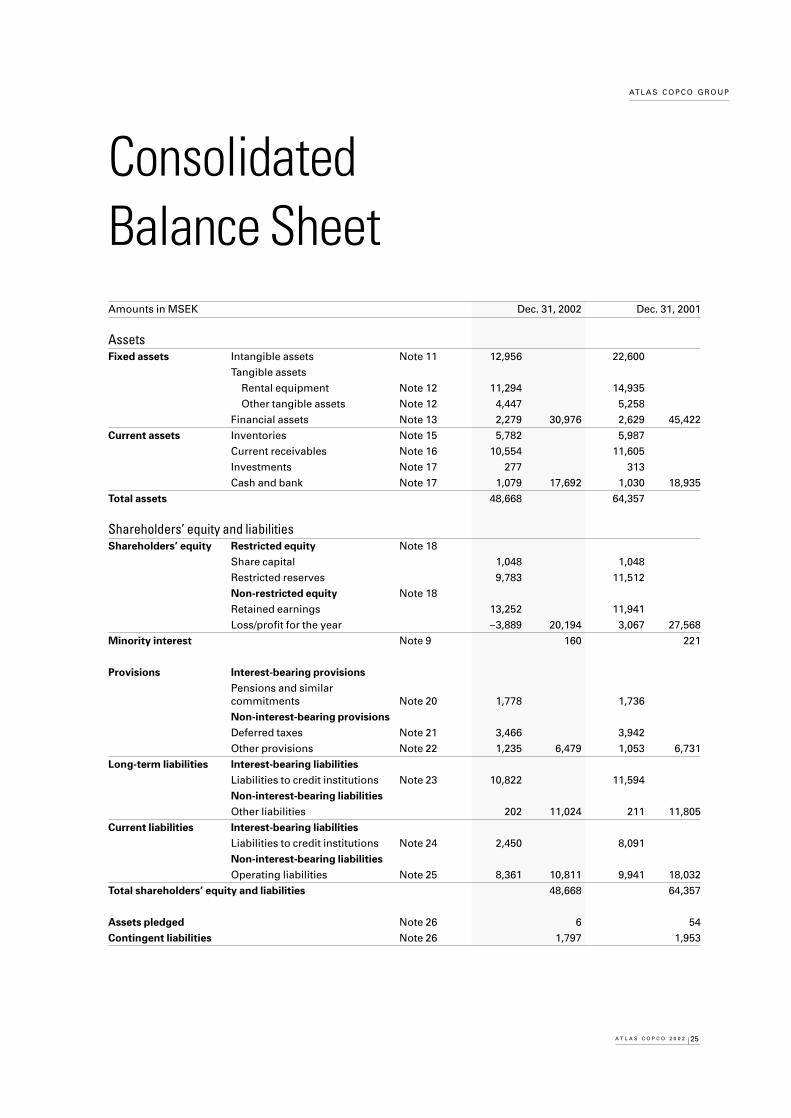
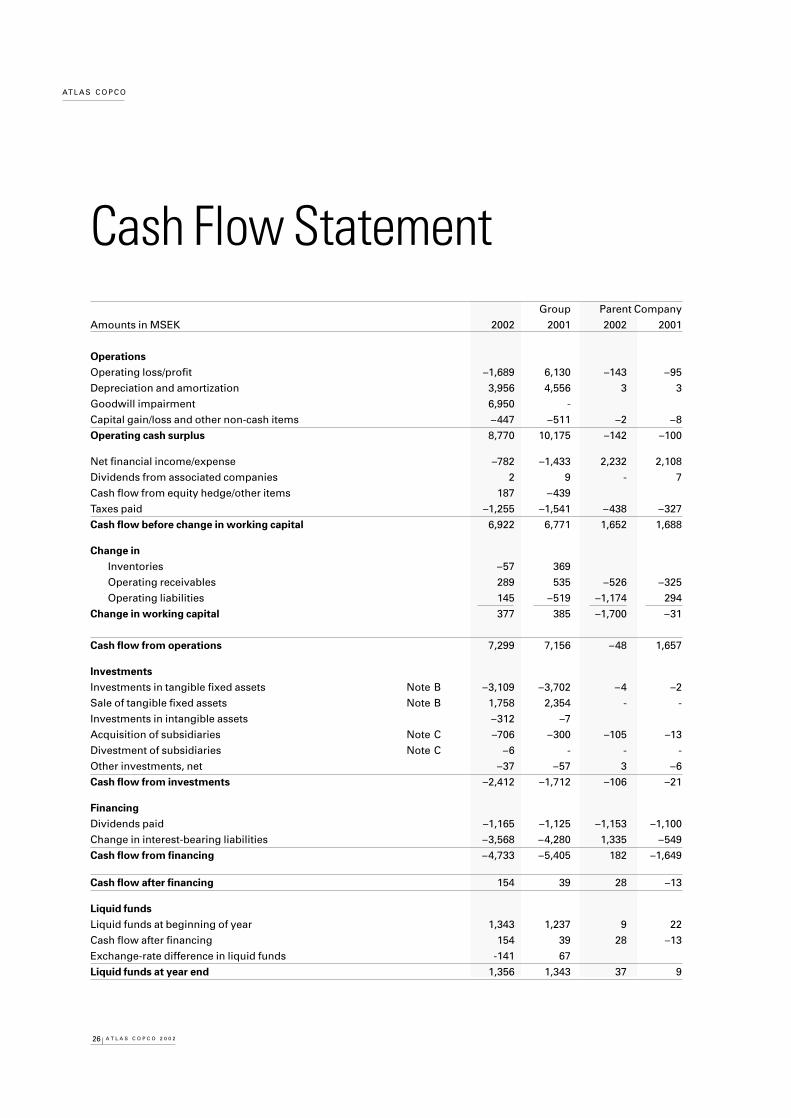
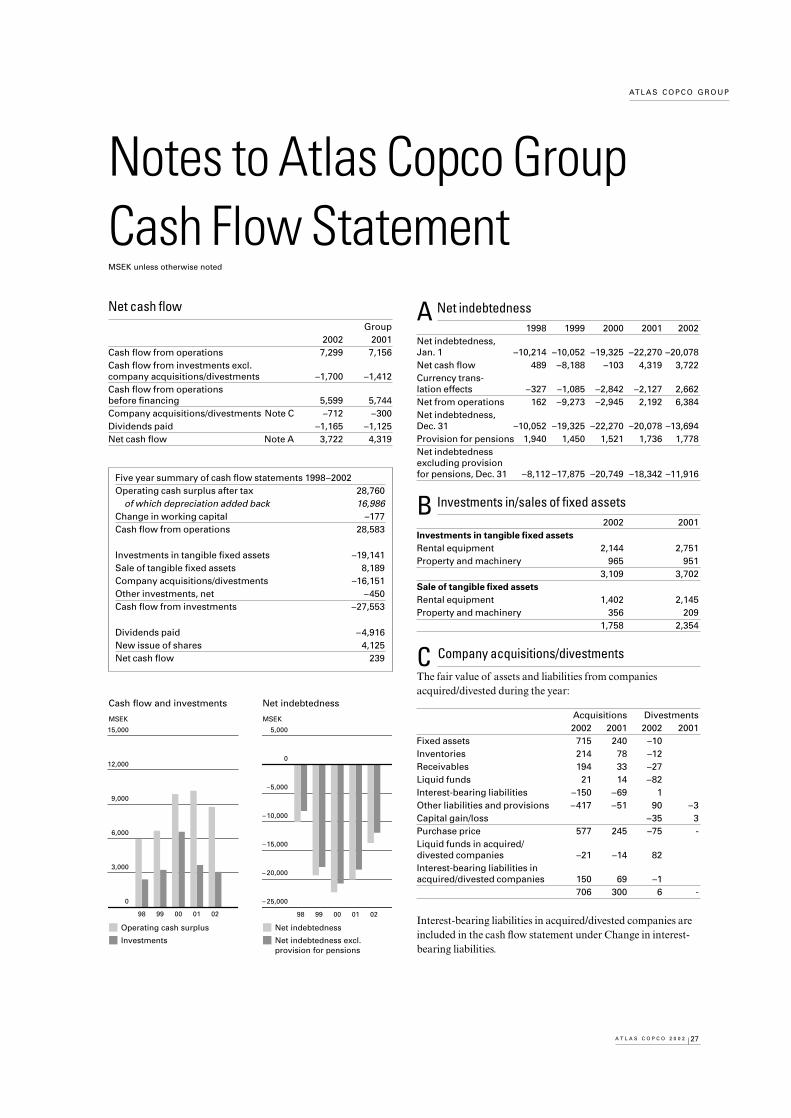
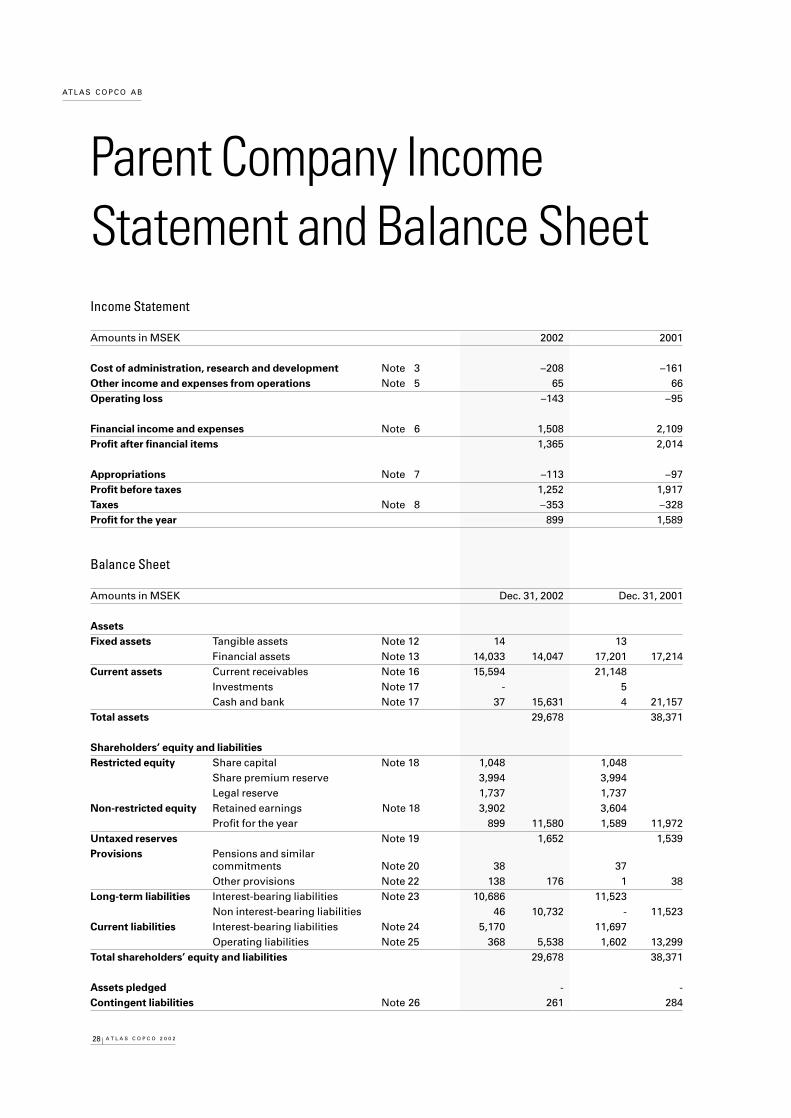
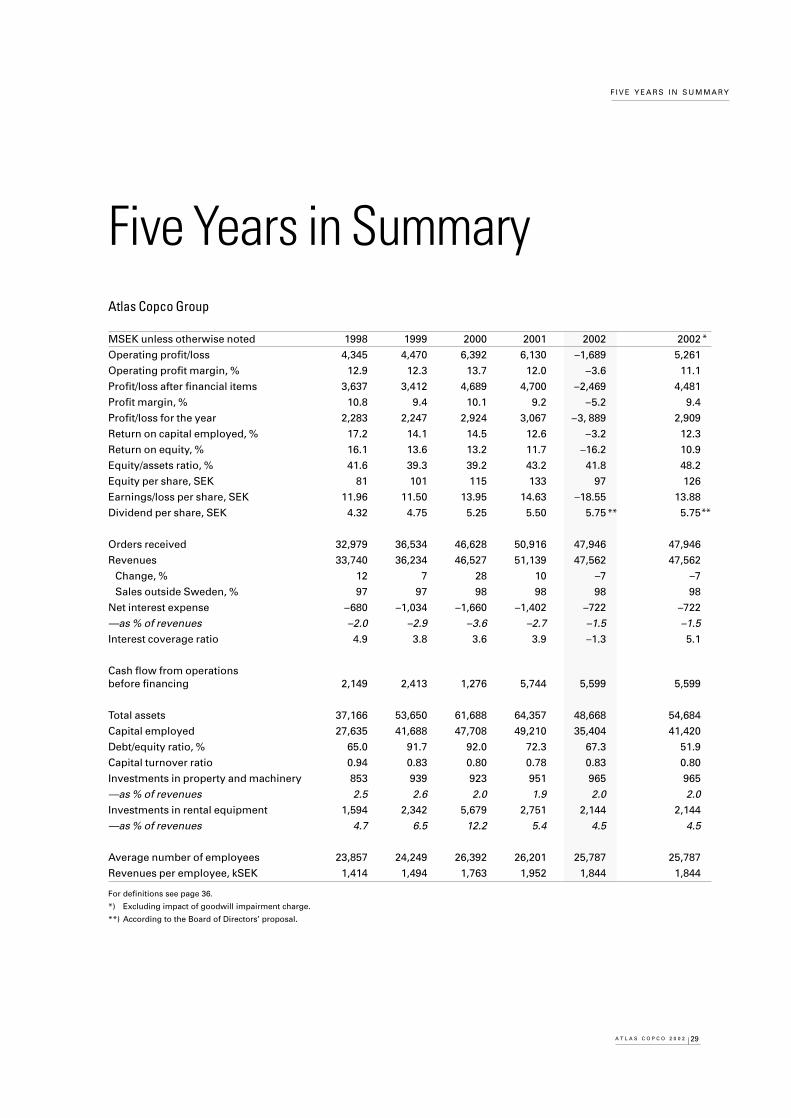
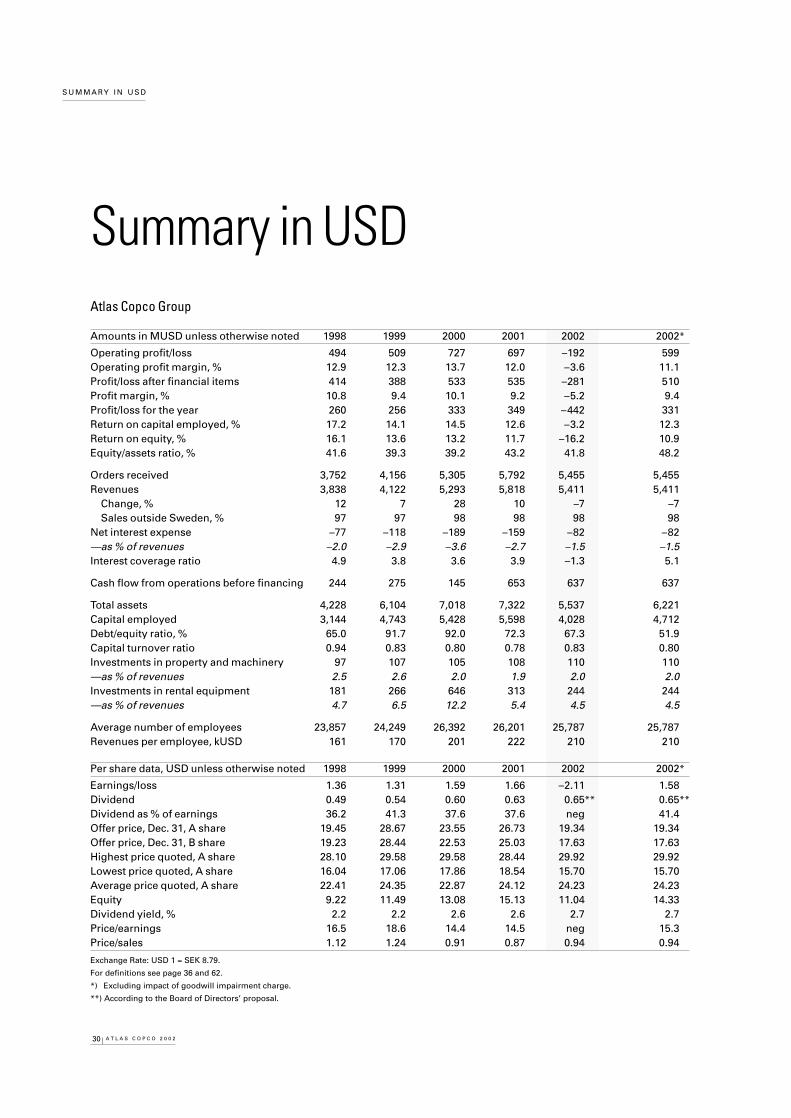
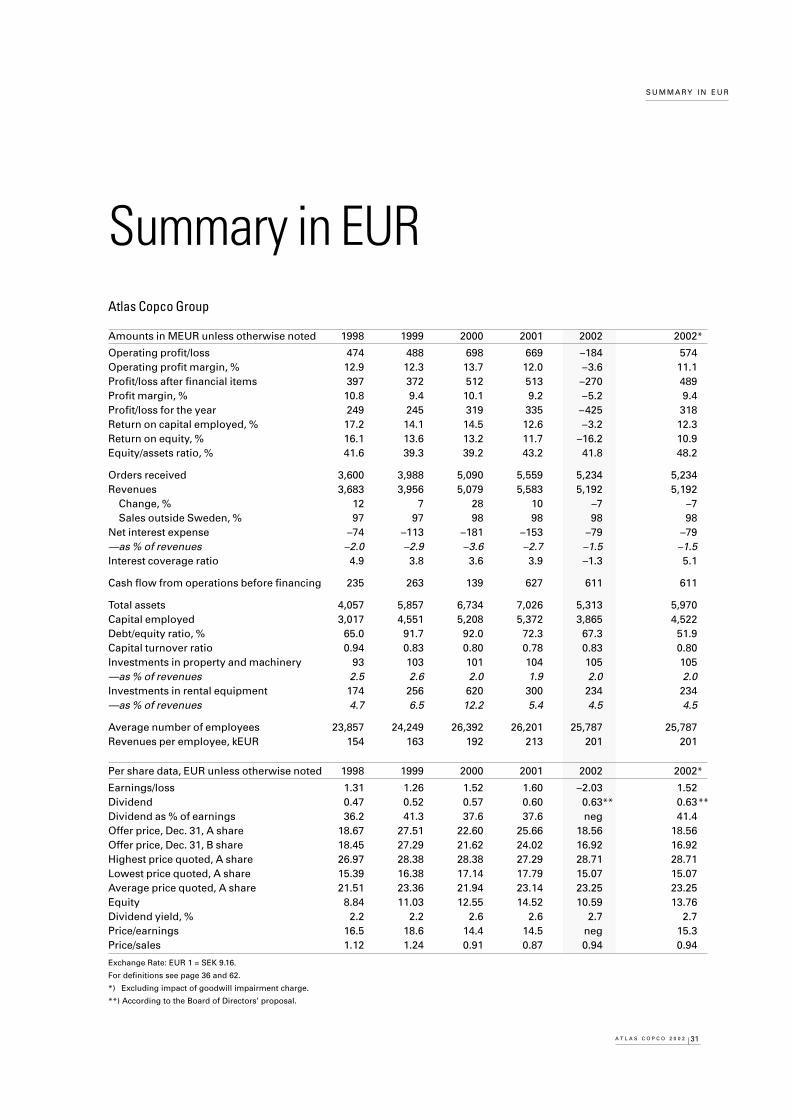
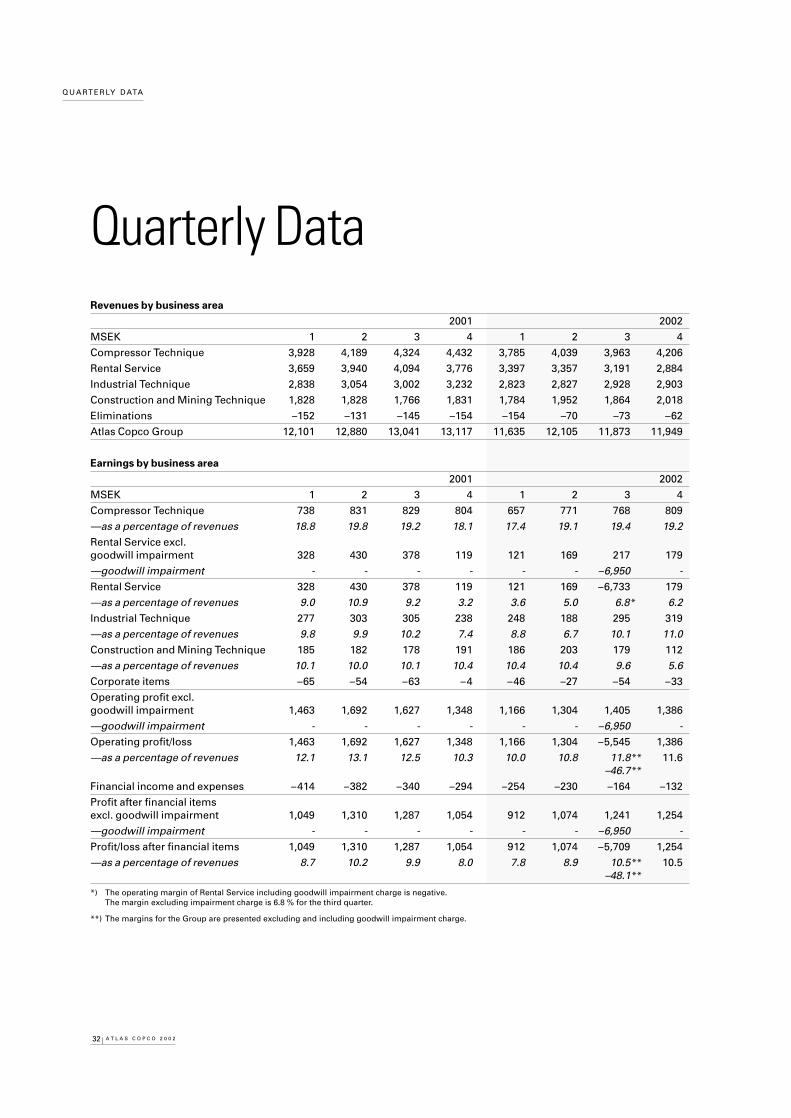
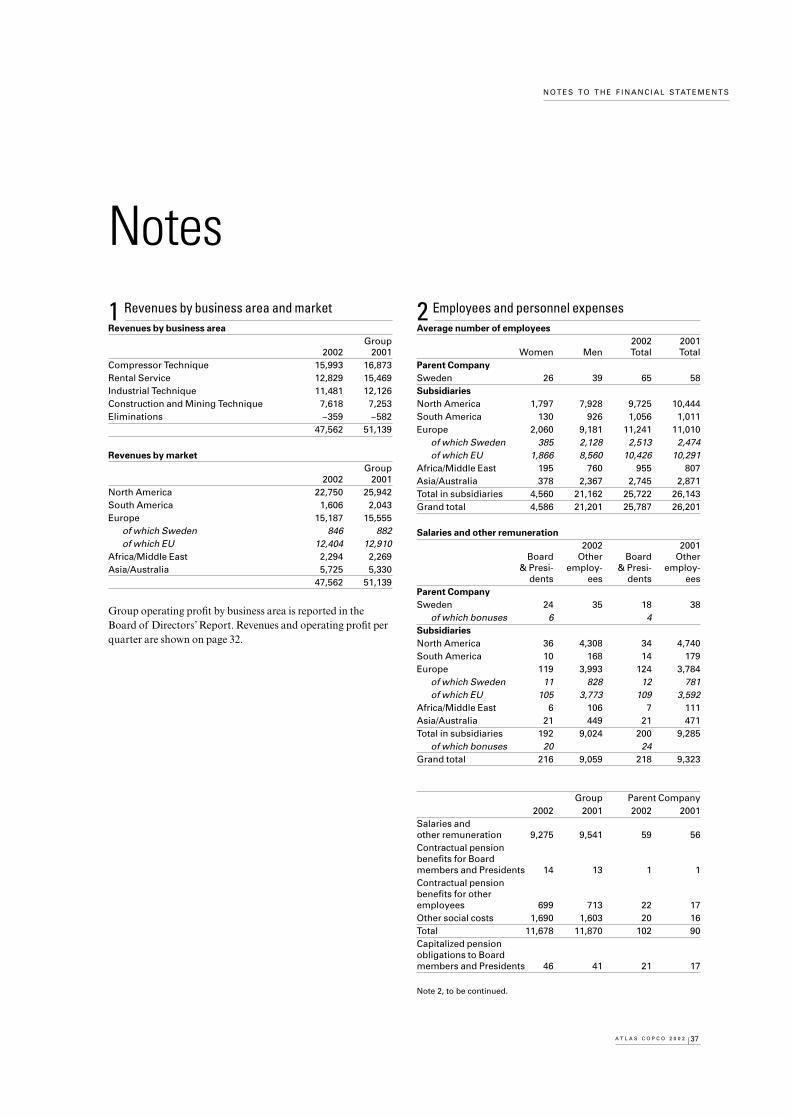
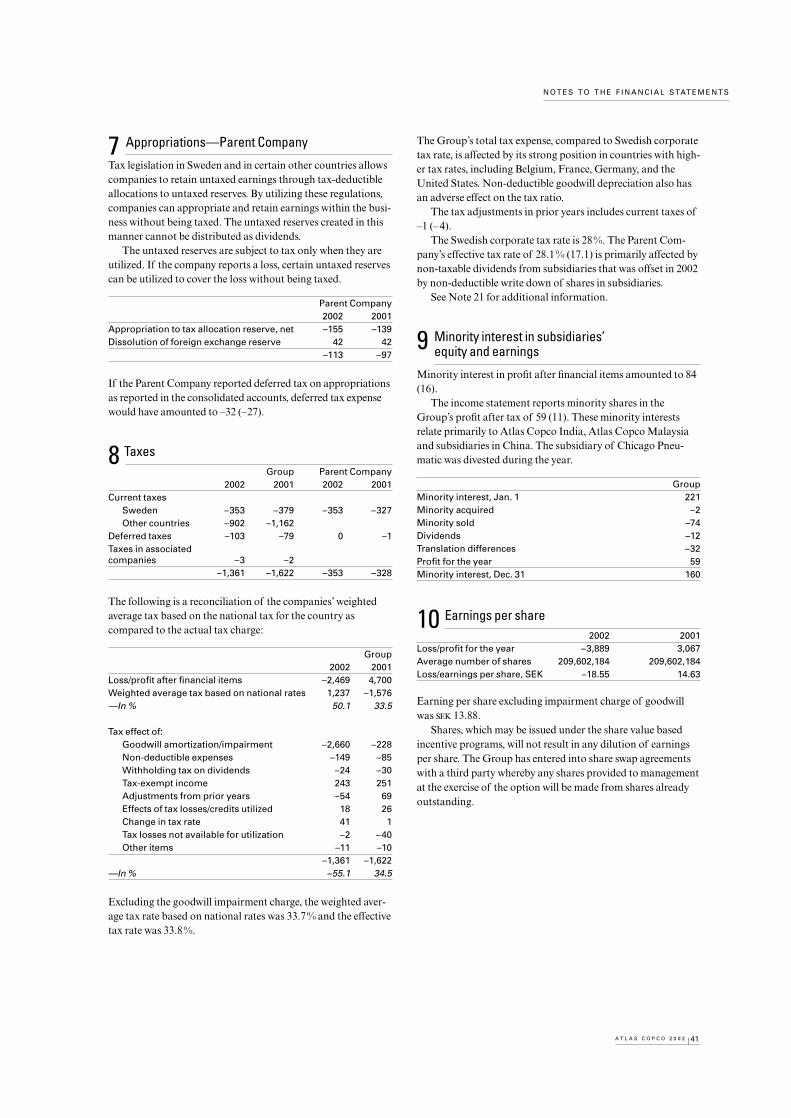
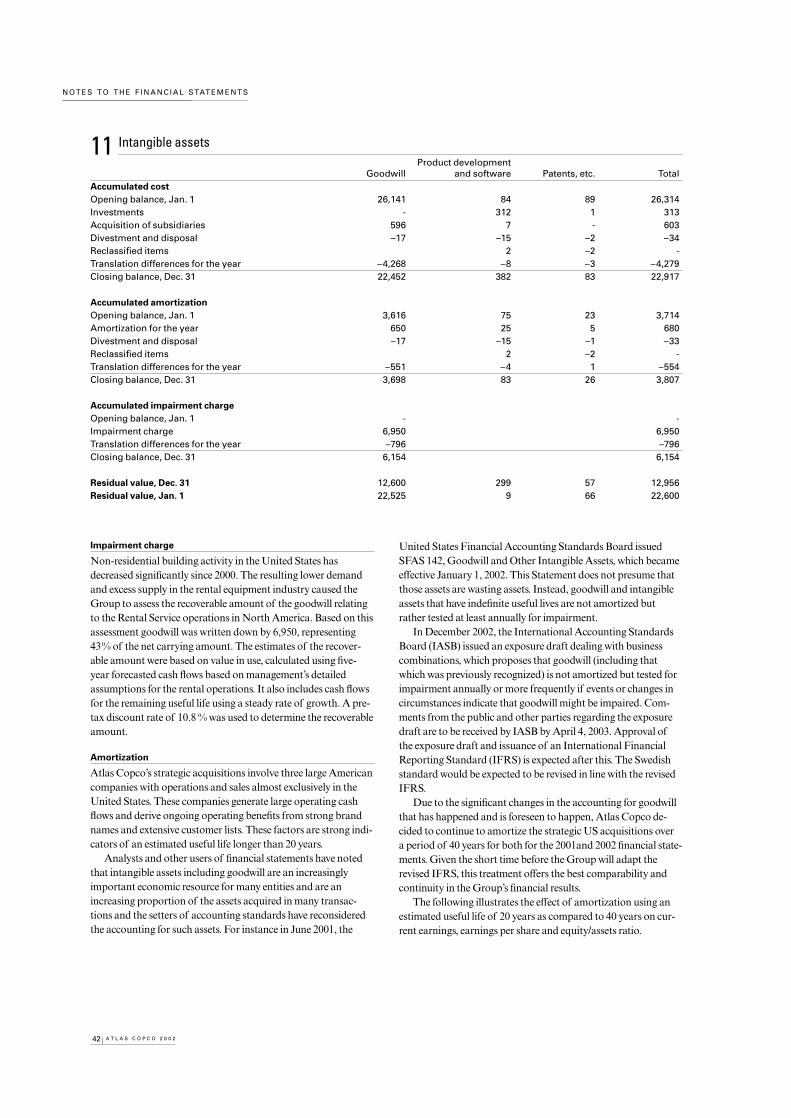
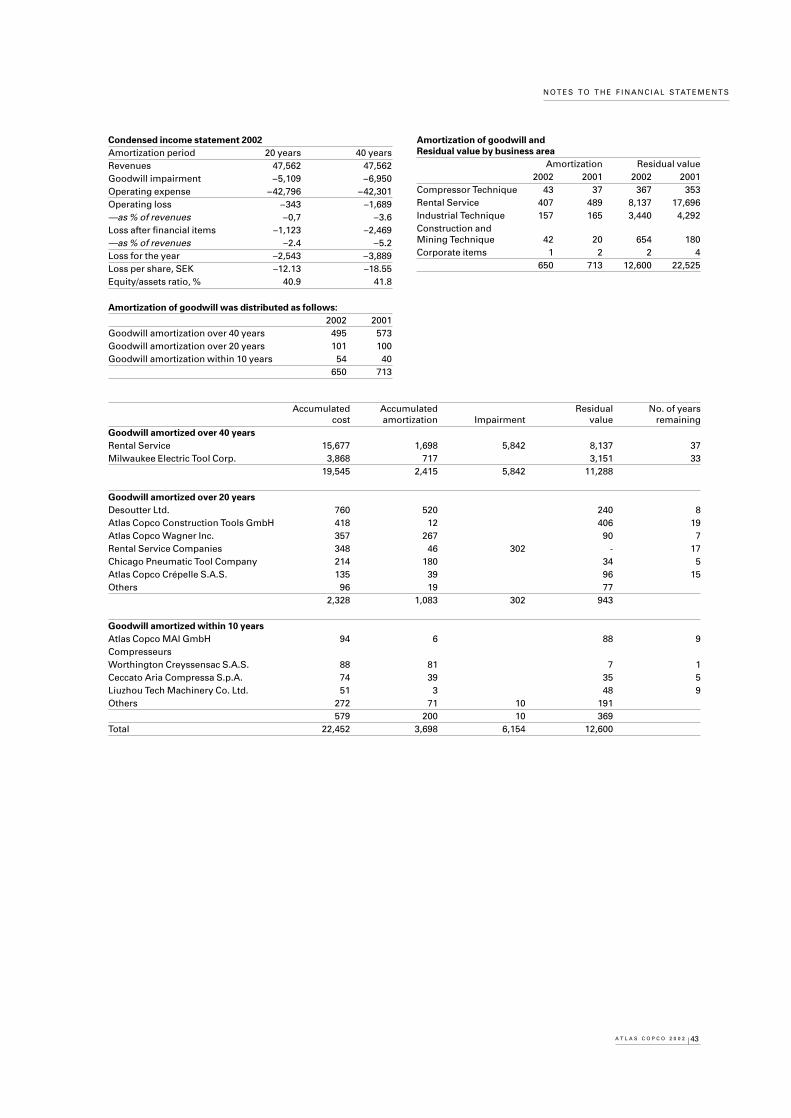
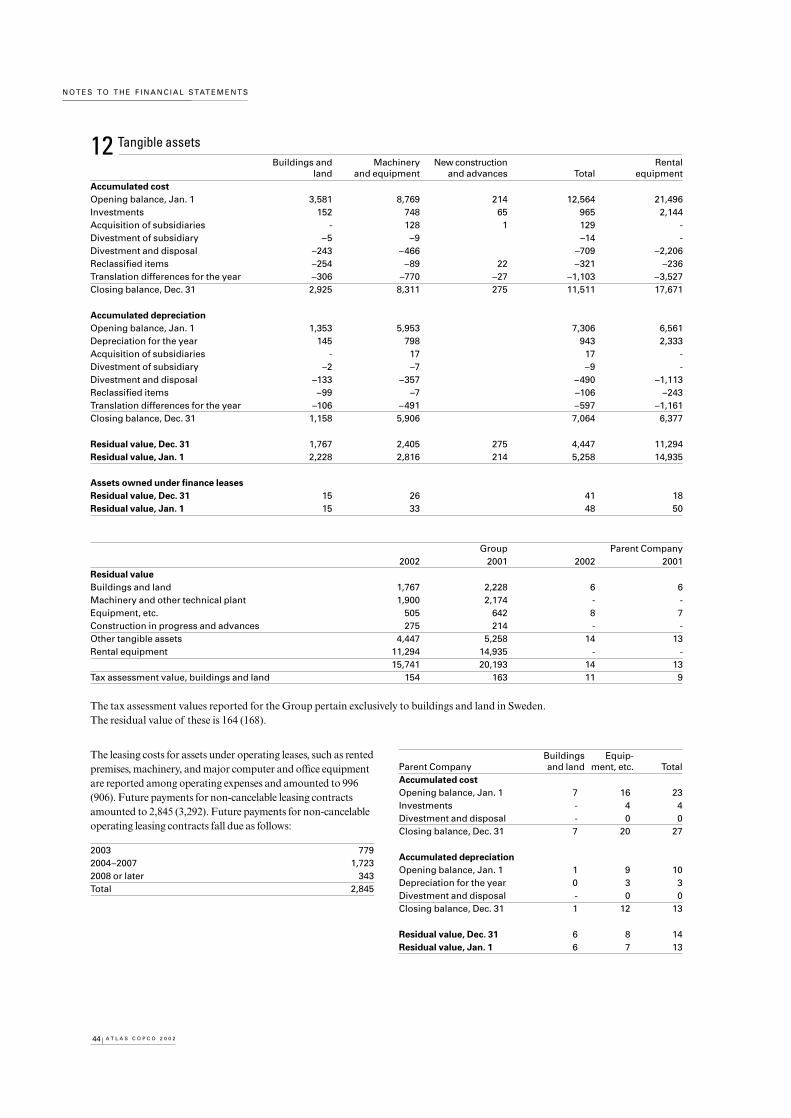
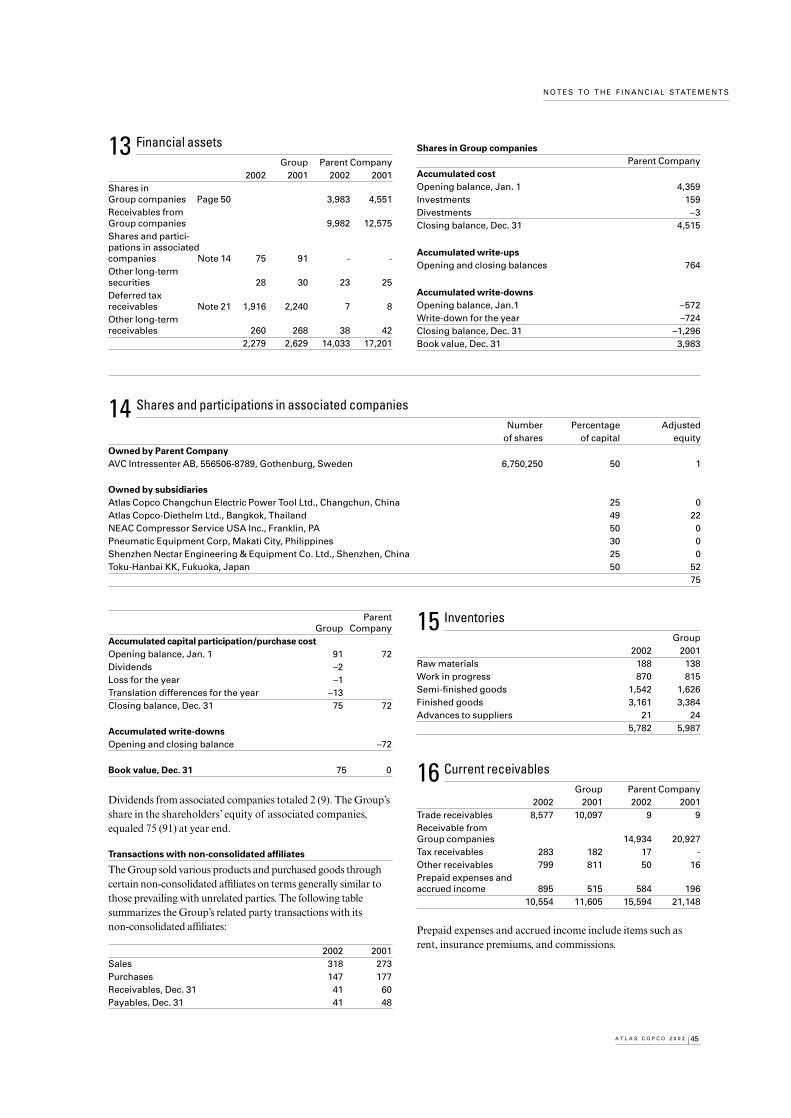
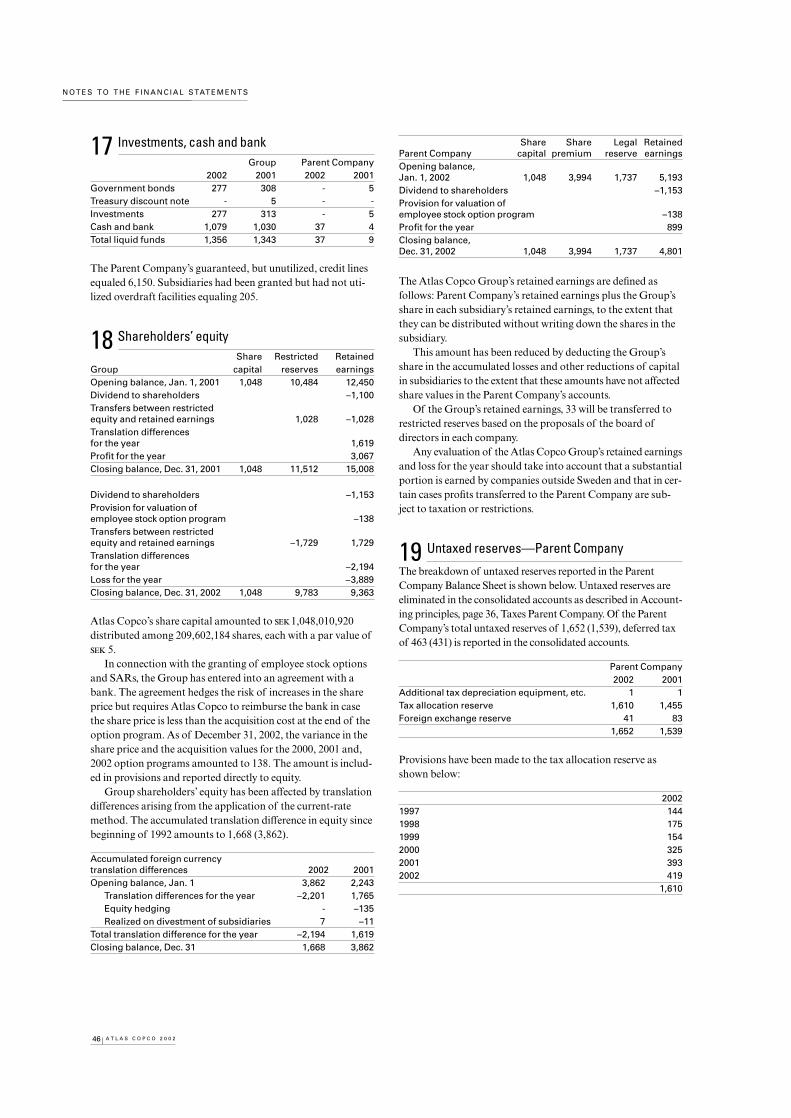
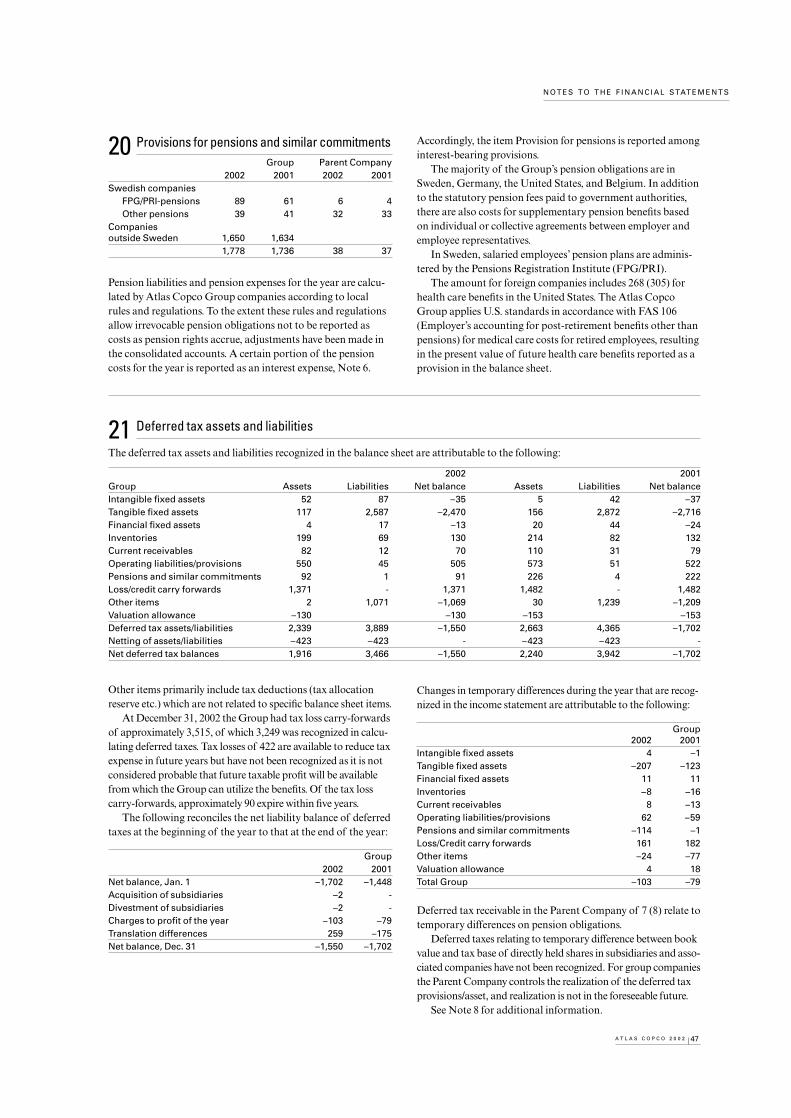
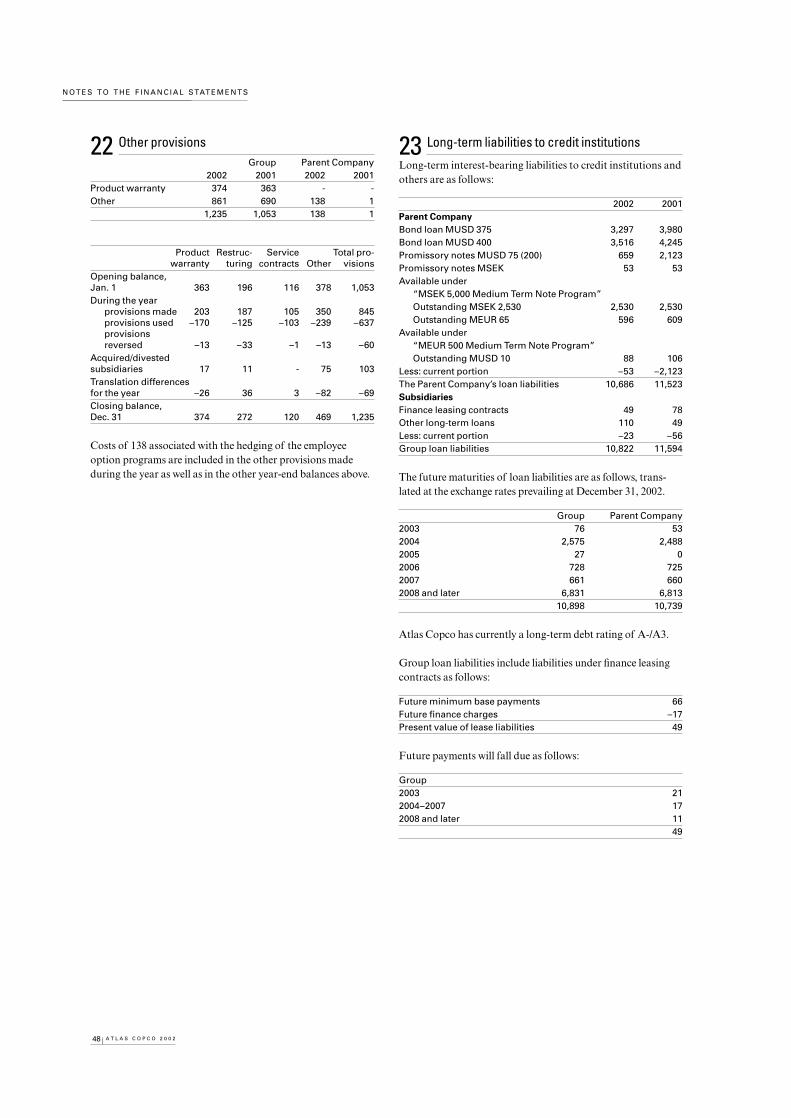
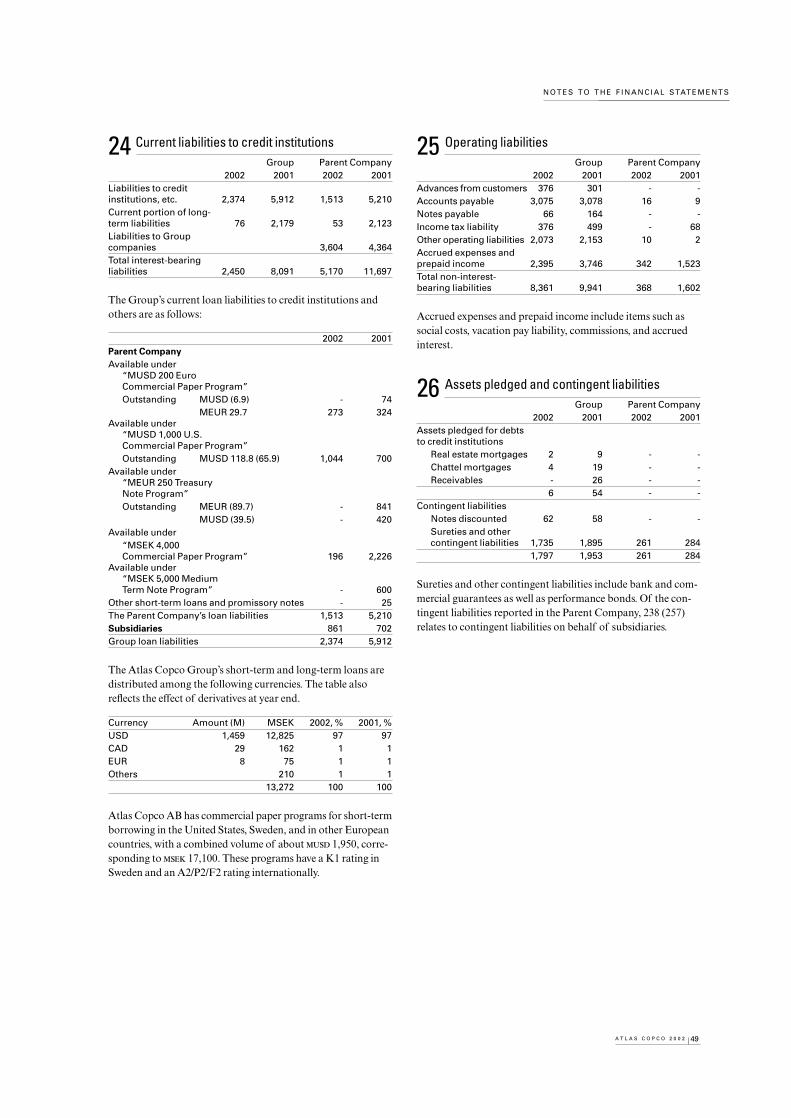
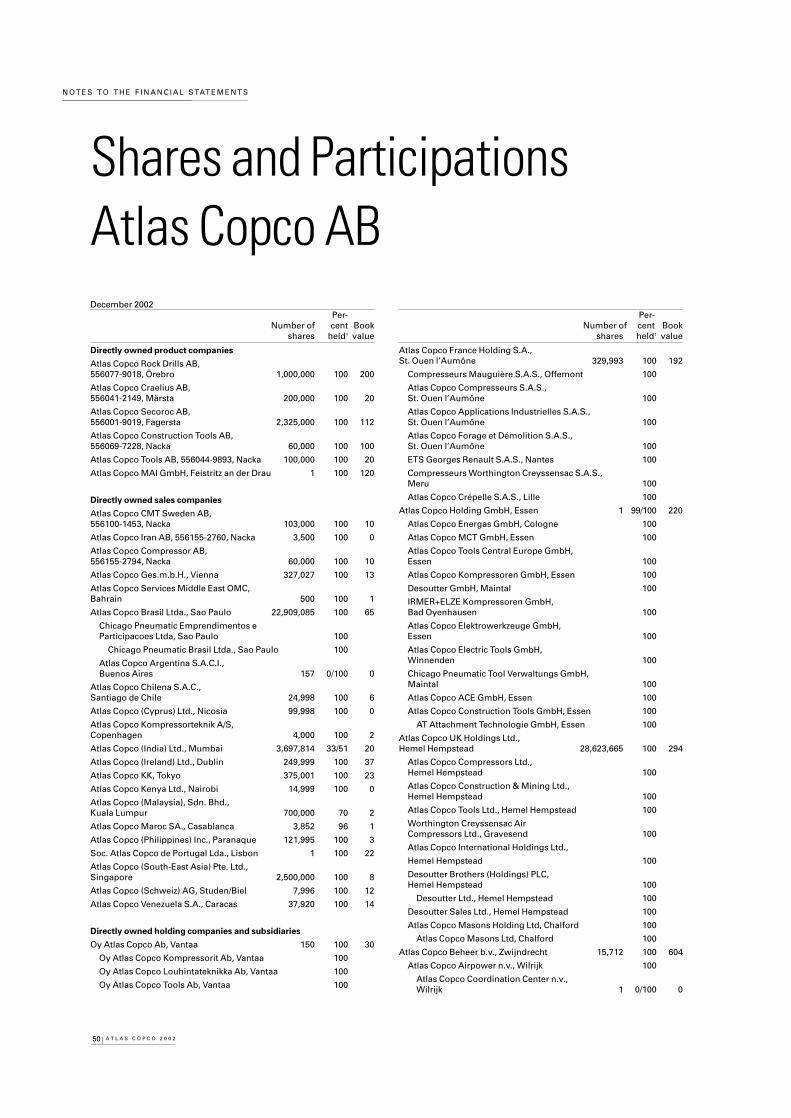
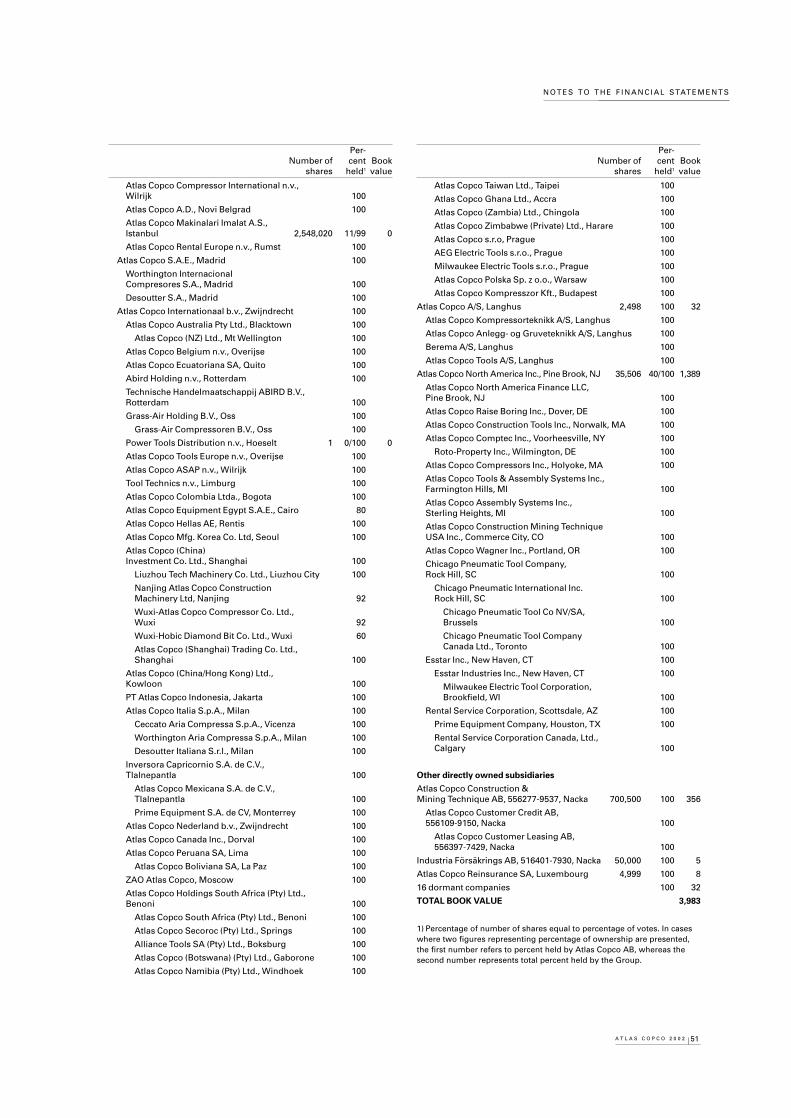
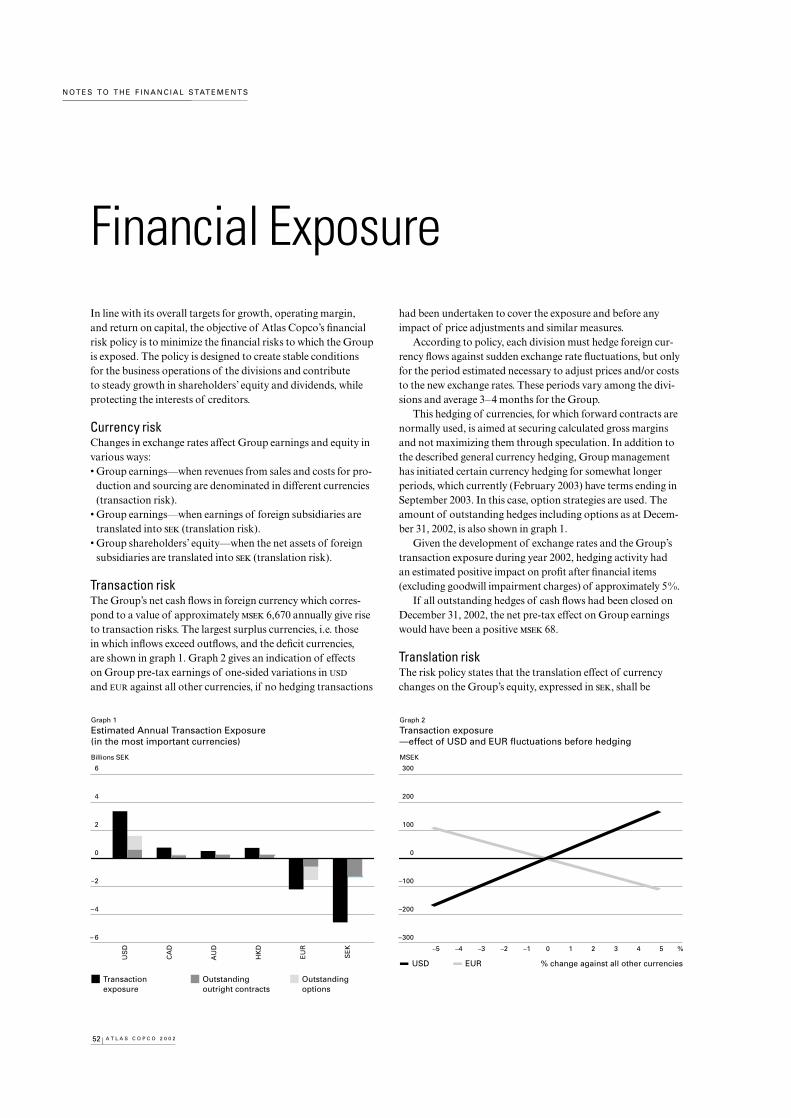
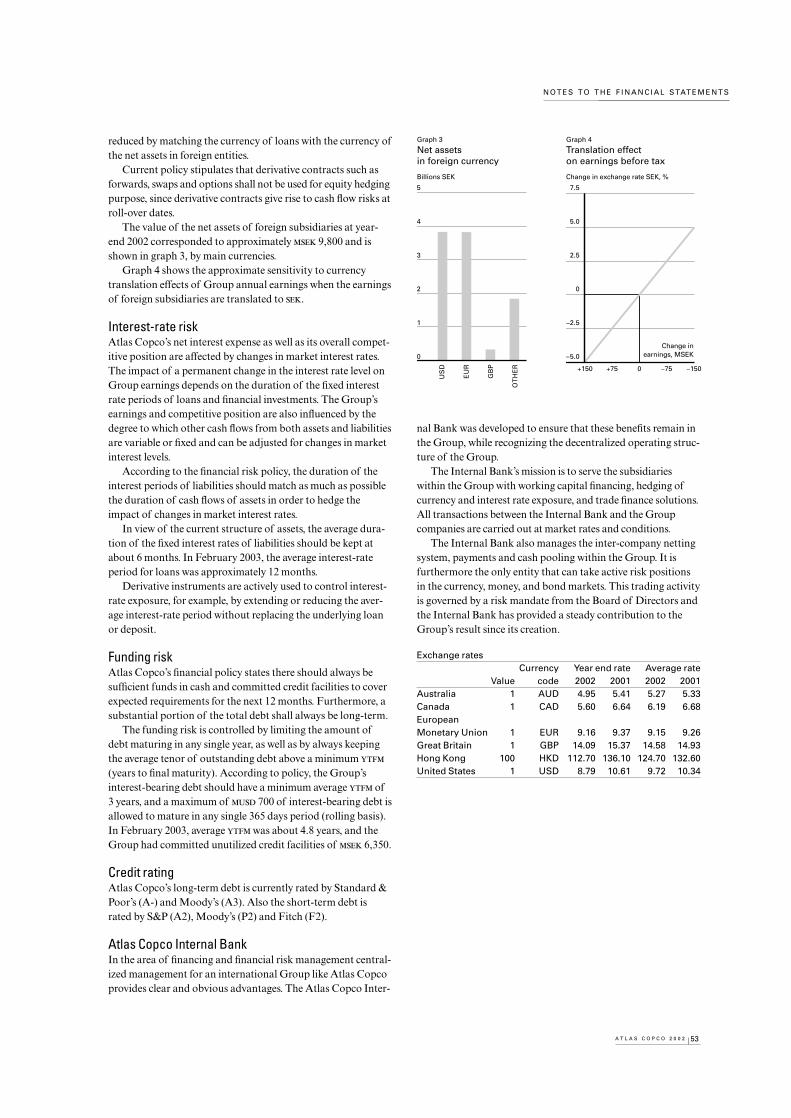
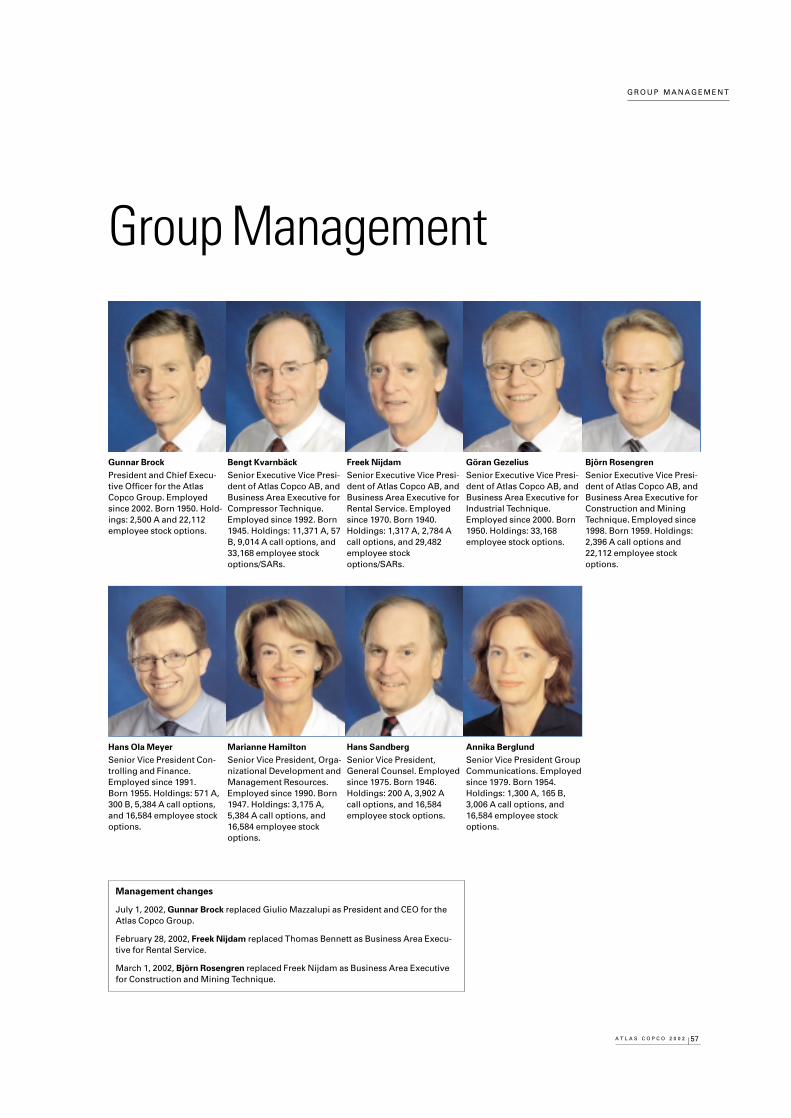
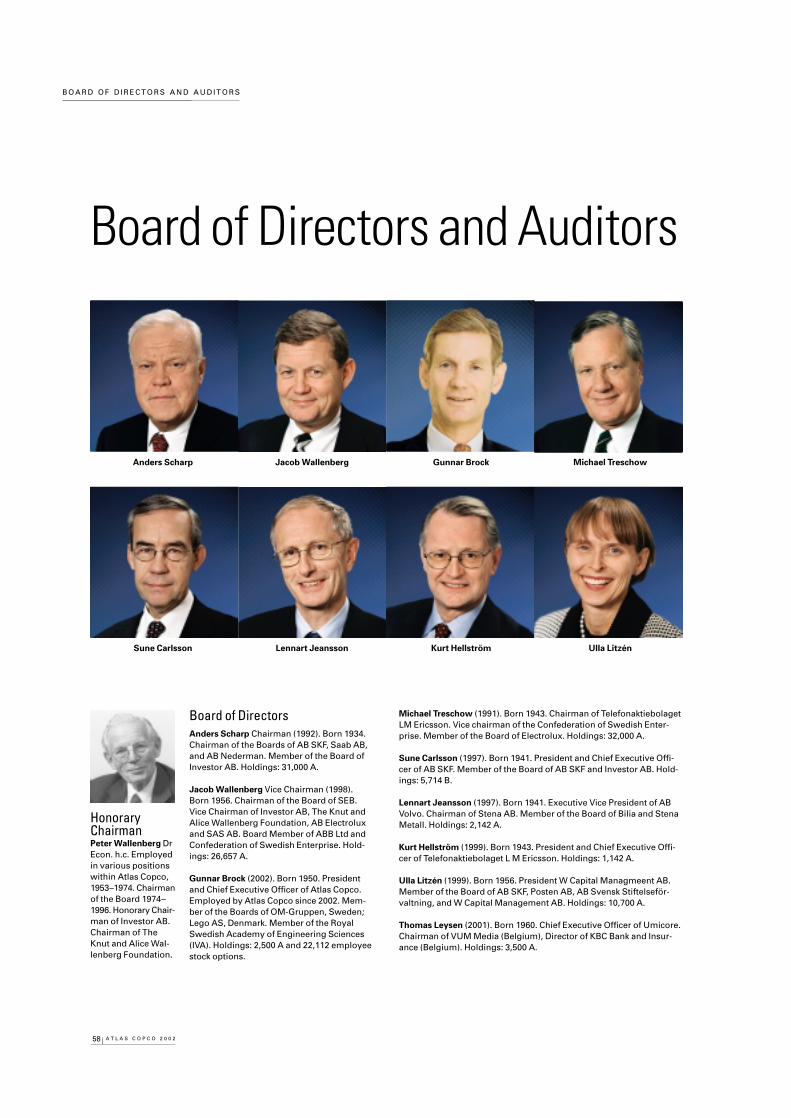
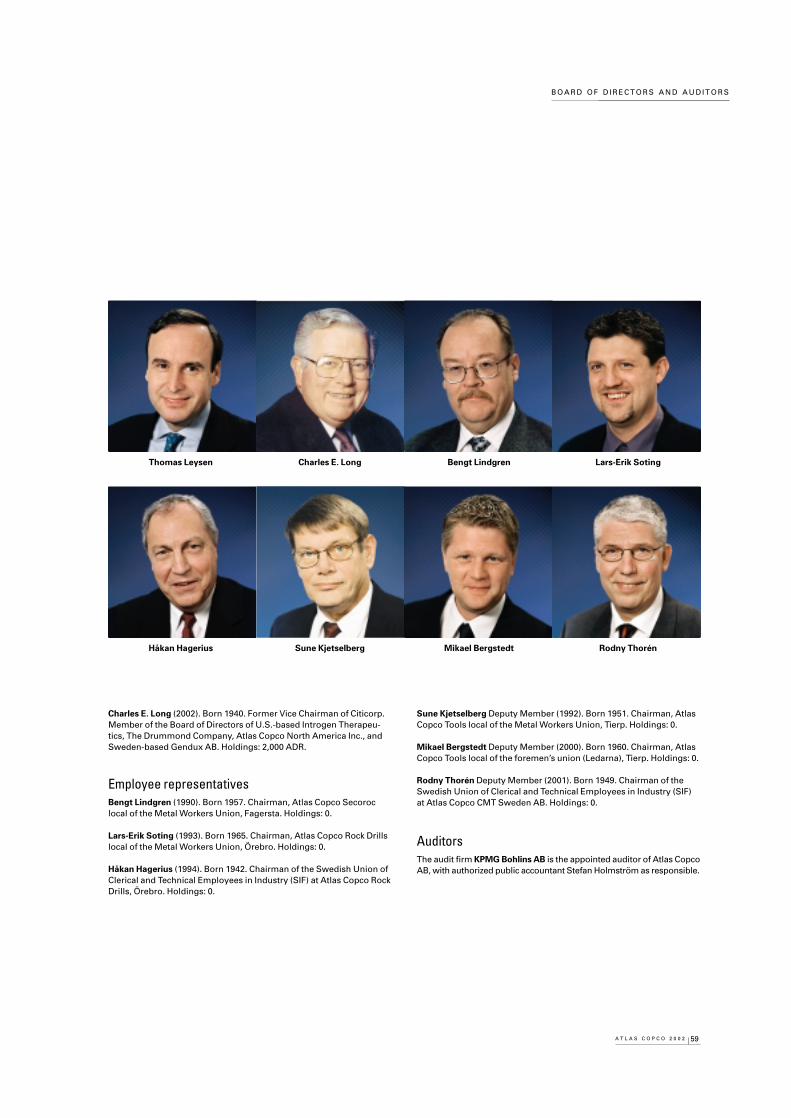
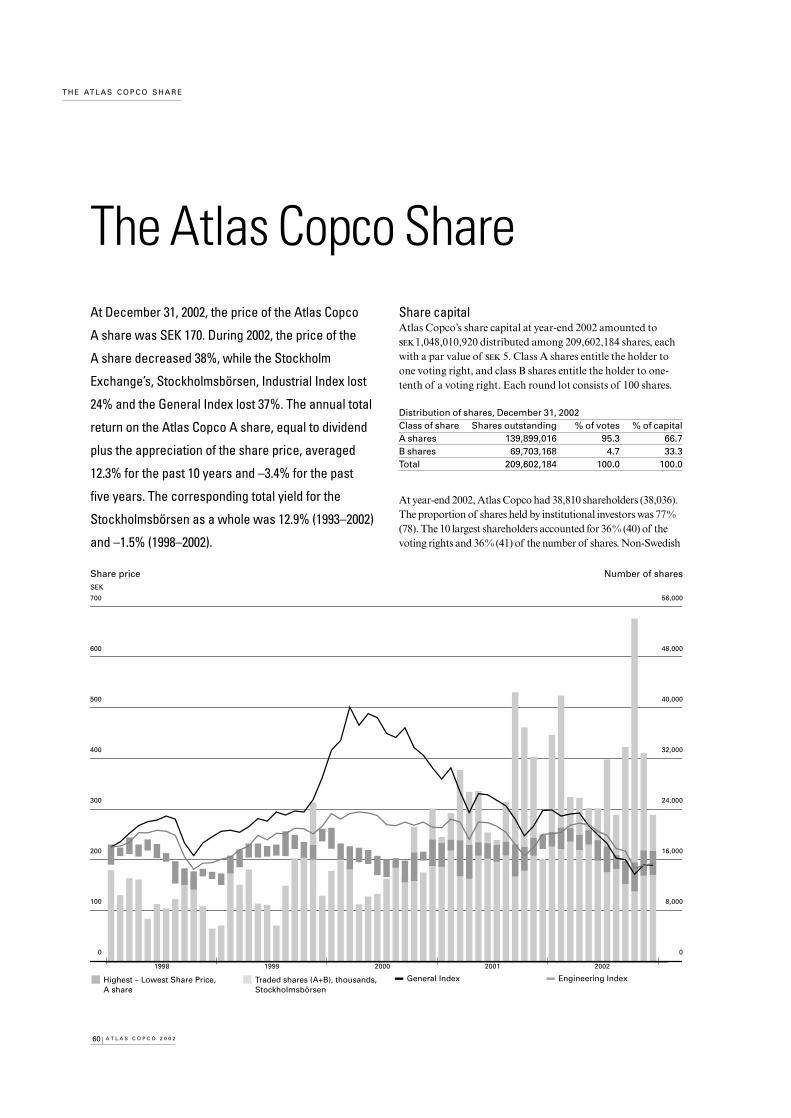
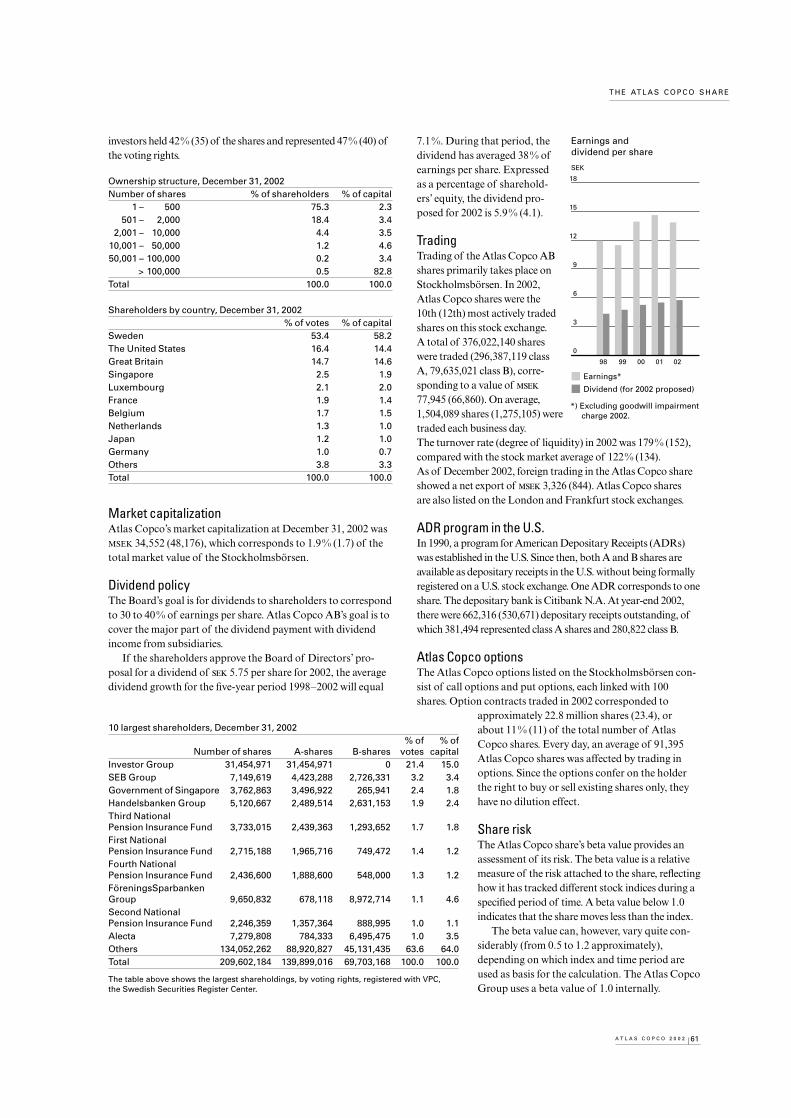


![Atlas Copco (India) Limited · 3. Atlas Copco International B.V. ACO0101339 4. Atlas Copco AB ACO0101595, ACO0101097, A 0005191 and 10177354 5. Atlas Copco [I] Ltd Charitable Foundation](https://static.documents.pub/doc/80x56/5ec4197bfe534e04f779e397/atlas-copco-india-limited-3-atlas-copco-international-bv-aco0101339-4-atlas.jpg)


