138
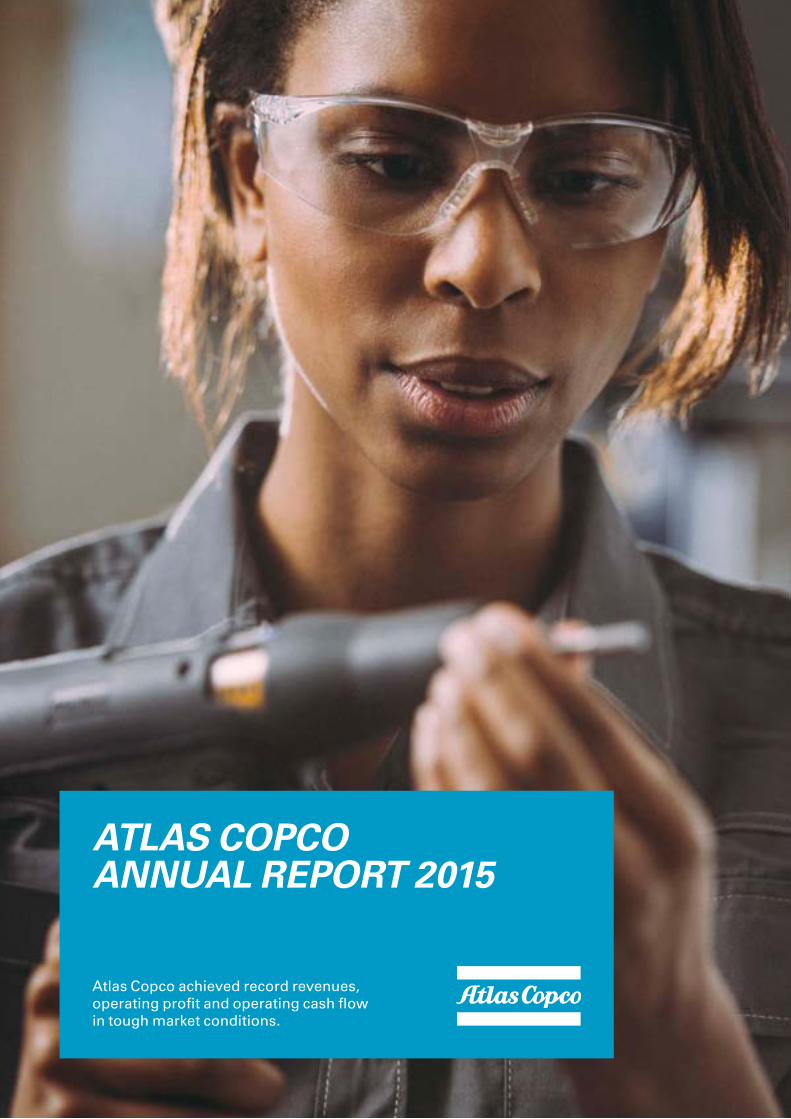
ATLAS COPCO ANNUAL REPORT 2015 Atlas Copco achieved record revenues, operating profit and operating cash flow in tough market conditions.
ATLAS COPCO ANNUAL REPORT 2015
Atlas Copco achieved record revenues, operating profit and operating cash flow in tough market conditions.
ABOUT THE ANNUAL REPORT Atlas Copco believes in delivering innovative products, reliable services and profitable growth while being a responsible corporate citizen. This annual report reflects Atlas Copco’s mission of creating sustainable, profitable growth and it integrates financial, sustainability and governance information in order to describe Atlas Copco in a comprehensive and cohesive manner.
Atlas Copco Group Inside front cover
President and CEO 2
THIS IS ATLAS COPCO 6
This section contains Atlas Copco’s vision, mission, strategy, structure and governance, how we do business and create value.
THE YEAR IN REVIEW Administration report
This section describes Atlas Copco’s annual performance and achievements. 14
Compressor Technique 20
Industrial Technique 24
Mining and Rock Excavation Technique 28
Construction Technique 32
Risks, risk management and opportunities 36
Innovation 40
Employees 44
Impacting society and the environment 48
The Atlas Copco share 54
Corporate governance 56
OUR FINANCIAL RESULTS
Financial statements (Group) 66
Notes (Group) 71
Financial statements (Parent) 108
Notes (Parent) 110
Signatures of the Board of Directors 122
Audit report 123
Financial definitions 124
Sustainability notes (Group) 125
Auditor’s Limited Assurance Report on Atlas Copco AB’s Sustainability Report 132
Five years in summary 133
CONTENTS
NOTE The amounts are presented in MSEK unless otherwise indicated and numbers in parentheses represent comparative figures for the preceding year.
FORWARD-LOOKING STATEMENTS Some statements in this report are forward-looking, and the actual outcomes could be materially different. In addition to the factors explicitly discussed, other factors could have a material effect on the actual outcomes. Such factors include, but are not limited to, general business conditions, fluctuations in exchange rates and interest rates, political developments, the impact of competing products and their pricing, product development, commercialization and technological difficulties, interruptions in supply, and major customer credit losses.
ATLAS COPCO AB and its subsidiaries are sometimes referred to as the Atlas Copco Group, the Group, or Atlas Copco. Atlas Copco AB is also sometimes referred to as Atlas Copco. Any mention of the Board of Directors or the Board refers to the Board of Directors of Atlas Copco AB.
CONTACTS
Investor Relations
Mattias Olsson, Vice President Investor Relations [email protected]
Media
Ola Kinnander, Media Relations Manager [email protected]
Sustainability
Mala Chakraborti, Vice President Corporate Responsibility [email protected]
The audited annual accounts and consolidated accounts can be found on pages 14–47 and 56–122. The corporate governance report examined by the auditors can be found on pages 56–65.
Sustainability information that has been reviewed by the auditors can be found on pages 10–13, 40–53 and 125–131.
Production: Atlas Copco AB, Griller Grafisk Form AB, Text Helene AB.
Copyright 2016, Atlas Copco AB, Stockholm, Sweden.
Print: Hylte Tryck AB. 9853 8333 01 (3 700)
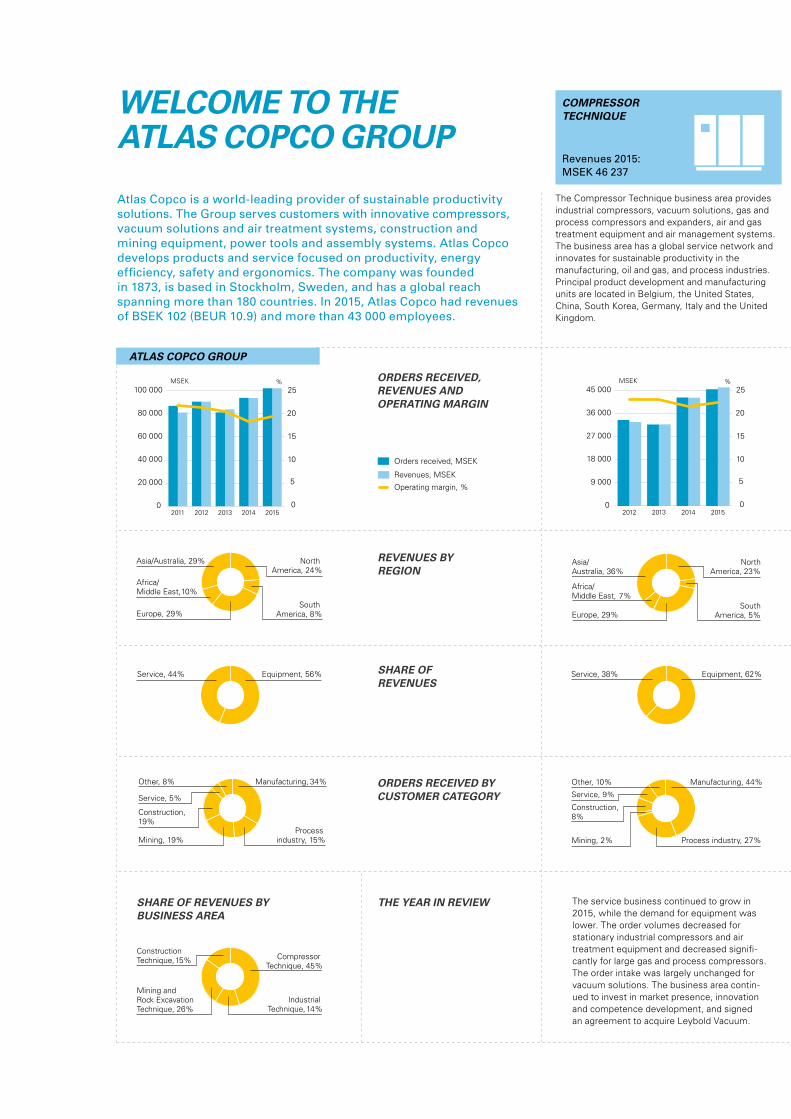
WELCOME TO THE ATLAS COPCO GROUP
Atlas Copco is a world-leading provider of sustainable productivity solutions. The Group serves customers with innovative compressors, vacuum solutions and air treatment systems, construction and mining equipment, power tools and assembly systems. Atlas Copco develops products and service focused on productivity, energy efficiency, safety and ergonomics. The company was founded in 1873, is based in Stockholm, Sweden, and has a global reach spanning more than 180 countries. In 2015, Atlas Copco had revenues of BSEK 102 (BEUR 10.9) and more than 43 000 employees.
ConstructionTechnique, 15% Compressor
Technique, 45%
Industrial Technique, 14%
Mining and Rock Excavation Technique, 26%
ORDERS RECEIVED, REVENUES AND OPERATING MARGIN
REVENUES BY REGION
SHARE OF REVENUES
0
20 000
40 000
60 000
80 000
100 000
201520142013201220110
5
10
15
20
25MSEK
Orders received, MSEK
%
Operating margin, %
Revenues, MSEK
0
20 000
40 000
60 000
80 000
100 000
201520142013201220110
5
10
15
20
25MSEK
Orders received, MSEK
%
Operating margin, %
Revenues, MSEK
THE YEAR IN REVIEW
ATLAS COPCO GROUP
Asia/Australia, 29% North America, 24%
Africa/Middle East, 10%
Europe, 29%South
America, 8%
Equipment, 56%Service, 44%
SHARE OF REVENUES BY BUSINESS AREA
ORDERS RECEIVED BY CUSTOMER CATEGORY
Other, 8% Manufacturing, 34%
Construction, 19%
Service, 5%
Mining, 19%Process
industry, 15%
COMPRESSOR TECHNIQUE
Revenues 2015:MSEK 46 237
The Compressor Technique business area provides industrial compressors, vacuum solutions, gas and process compressors and expanders, air and gas treatment equipment and air management systems. The business area has a global service network and innovates for sustainable productivity in the manufacturing, oil and gas, and process industries. Principal product development and manufacturing units are located in Belgium, the United States, China, South Korea, Germany, Italy and the United Kingdom.
0
9 000
18 000
27 000
36 000
45 000
20152014201320120
5
10
15
20
25MSEK %
The service business continued to grow in 2015, while the demand for equipment was lower. The order volumes decreased for stationary industrial compressors and air treatment equipment and decreased signifi-cantly for large gas and process compressors. The order intake was largely unchanged for vacuum solutions. The business area contin-ued to invest in market presence, innovation and competence development, and signed an agreement to acquire Leybold Vacuum.
Asia/Australia, 36%
NorthAmerica, 23%
Africa/Middle East, 7%
Europe, 29%South
America, 5%
Service, 38% Equipment, 62%
Other, 10% Manufacturing, 44%
Construction, 8%
Service, 9%
Mining, 2% Process industry, 27%
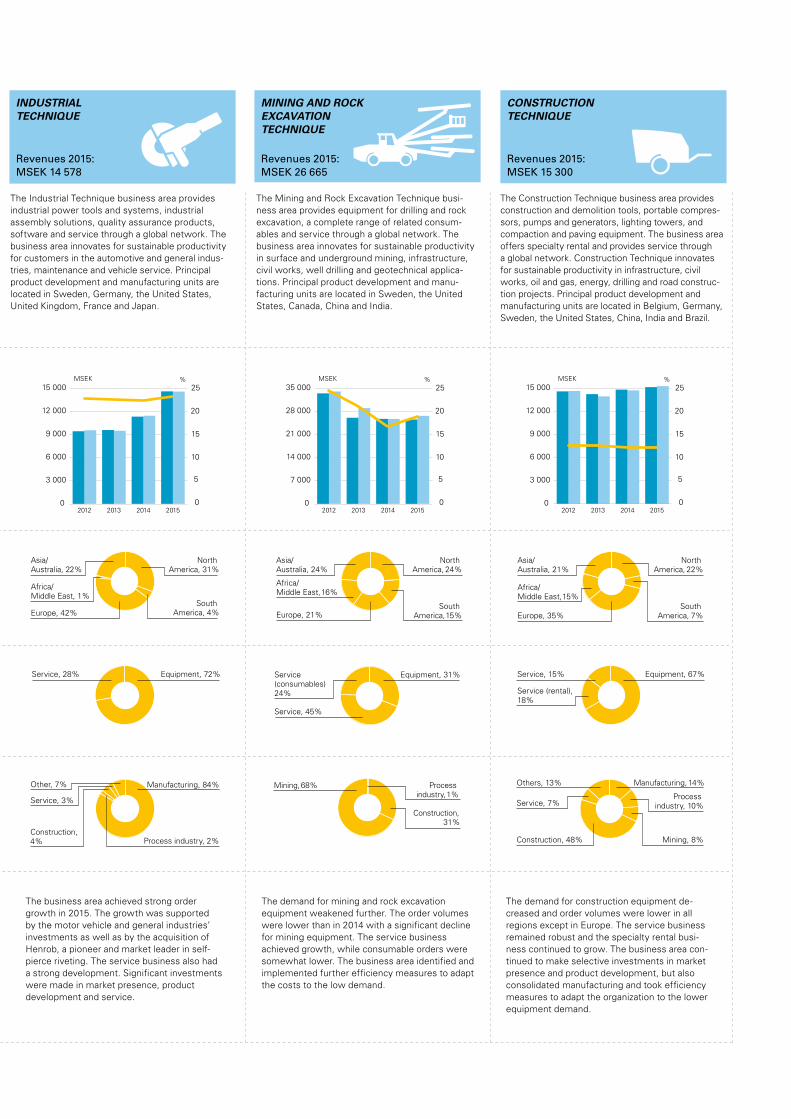
The Construction Technique business area provides construction and demolition tools, portable compres-sors, pumps and generators, lighting towers, and compaction and paving equipment. The business area offers specialty rental and provides service through a global network. Construction Technique innovates for sustainable productivity in infrastructure, civil works, oil and gas, energy, drilling and road construc-tion projects. Principal product development and manufacturing units are located in Belgium, Germany, Sweden, the United States, China, India and Brazil.
The Mining and Rock Excavation Technique busi-ness area provides equipment for drilling and rock excavation, a complete range of related consum-ables and service through a global network. The business area innovates for sustainable productivity in surface and underground mining, infrastructure, civil works, well drilling and geotechnical applica-tions. Principal product development and manu-facturing units are located in Sweden, the United States, Canada, China and India.
The Industrial Technique business area provides industrial power tools and systems, industrial assembly solutions, quality assurance products, software and service through a global network. The business area innovates for sustainable productivity for customers in the automotive and general indus-tries, maintenance and vehicle service. Principal product development and manufacturing units are located in Sweden, Germany, the United States, United Kingdom, France and Japan.
Asia/Australia, 22%
North America, 31%
Africa/Middle East, 1%
Europe, 42%South
America, 4%
Asia/Australia, 24%
North America, 24%
Africa/Middle East, 16%
Europe, 21%South
America,15%
Asia/Australia, 21%
North America, 22%
Africa/Middle East, 15%
Europe, 35%South
America, 7%
Service, 28% Equipment, 72% Service, 15% Equipment, 67%
Service (rental), 18%
Service(consumables) 24%
Equipment, 31%
Service, 45%
0
3 000
6 000
9 000
12 000
15 000
20152014201320120
5
10
15
20
25MSEK %
0
7 000
14 000
21 000
28 000
35 000
20152014201320120
5
10
15
20
25MSEK %
0
3 000
6 000
9 000
12 000
15 000
20152014201320120
5
10
15
20
25MSEK %
The business area achieved strong order growth in 2015. The growth was supported by the motor vehicle and general industries’ investments as well as by the acquisition of Henrob, a pioneer and market leader in self-pierce riveting. The service business also had a strong development. Significant investments were made in market presence, product development and service.
The demand for mining and rock excavationequipment weakened further. The order volumes were lower than in 2014 with a significant decline for mining equipment. The service business achieved growth, while consumable orders were somewhat lower. The business area identified and implemented further efficiency measures to adapt the costs to the low demand.
The demand for construction equipment de-creased and order volumes were lower in all regions except in Europe. The service business remained robust and the specialty rental busi-ness continued to grow. The business area con-tinued to make selective investments in market presence and product development, but also consolidated manufacturing and took efficiency measures to adapt the organization to the lower equipment demand.
INDUSTRIAL TECHNIQUE
Revenues 2015:MSEK 14 578
MINING AND ROCK EXCAVATION TECHNIQUE
Revenues 2015:MSEK 26 665
CONSTRUCTION TECHNIQUE
Revenues 2015:MSEK 15 300
Other, 7% Manufacturing, 84%
Service, 3%
Process industry, 2%Construction, 4%
Process industry, 1%
Mining, 68%
Construction, 31%
Manufacturing, 14%Others, 13%
Construction, 48%
Service, 7%
Mining, 8%
Process industry, 10%
Atlas Copco 2015 1
R&D EXPENDITURES
+9%to MSEK 3 253
OPERATING MARGIN
19.3% in 2015
PROPOSED DIVIDEND, SEK
6.30 per share
REVENUES, MSEK
102161in 2015
Thanks to more than 43 000 committed employees!
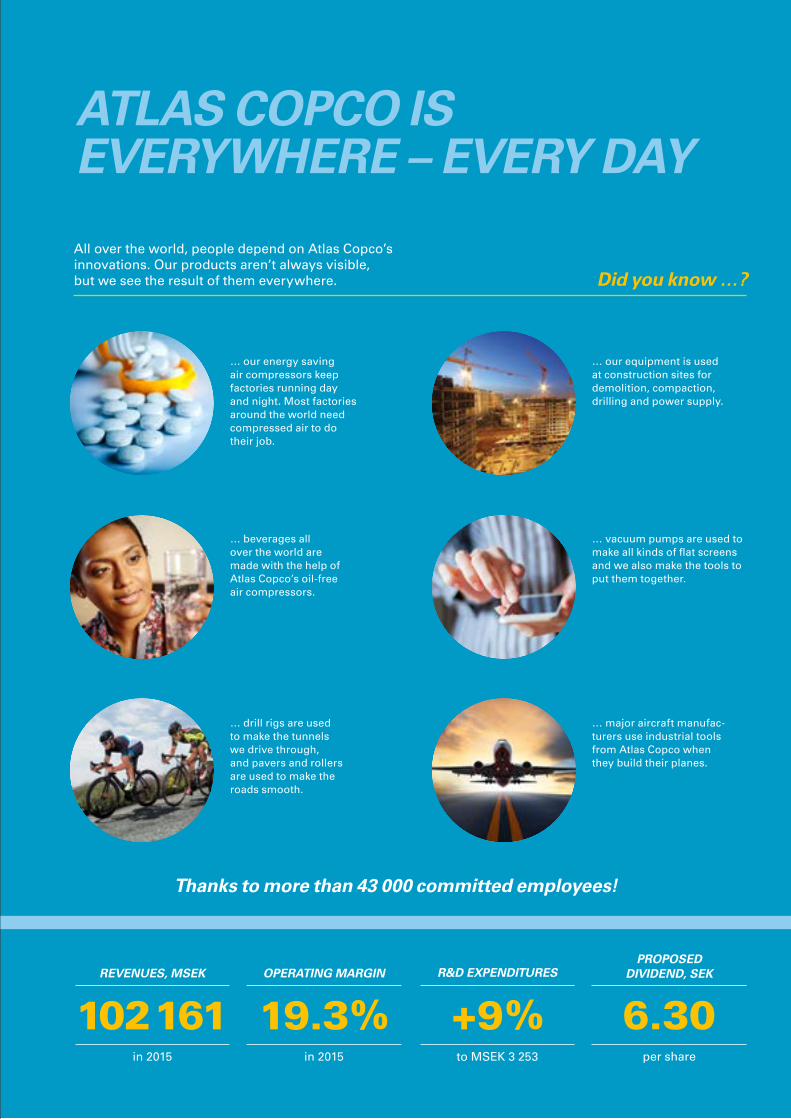
ATLAS COPCO IS EVERYWHERE – EVERY DAY
All over the world, people depend on Atlas Copco’s innovations. Our products aren’t always visible, but we see the result of them everywhere. Did you know …?
… our energy saving air compressors keep factories running day and night. Most factories around the world need compressed air to do their job.
… beverages all over the world are made with the help of Atlas Copco’s oil-free air compressors.
… drill rigs are used to make the tunnels we drive through, and pavers and rollers are used to make the roads smooth.
… our equipment is used at construction sites for demolition, compaction, drilling and power supply.
… vacuum pumps are used to make all kinds of flat screens and we also make the tools to put them together.
… major aircraft manufac-turers use industrial tools from Atlas Copco when they build their planes.
PRESIDENT AND CEO
2 Atlas Copco 2015
Atlas Copco reported solid results for 2015 in a challenging business climate. Sectors such as aerospace and automotive showed strong demand for our industrial tools and assembly systems, while mining, construction and oil and gas were weak. The market for large com-pressors was difficult for most of the year, and for small and medium-sized compressors it softened toward the second half of the year. The service business continued to grow. Europe finally started growing again in 2015, while China slowed and Brazil contracted dra-matically. The United States, Atlas Copco’s biggest market, remained solid though not as strong as in the previous year. We are focusing on creating customer value through our inno-vative products and services while staying agile by keeping a close eye on efficiency.
Growing our presence
Atlas Copco continued to strengthen its presence around the world and now sells into 183 countries and has local personnel in 92 countries. We are truly a global organization but always with local expertise. In order to keep growing we make sure we are present in all the right markets.
We expanded our presence in the product segments. Acqusitions play an important role here as they can provide a gateway to adjacent businesses in addition to offering synergies with our existing product offer-ings. We for example acquired a company in Germany, which provides laboratory and field calibration services to customers in the motor vehicle, manufacturing and aero-space industries. By joining forces we will create more value for customers by offering them expanded smart service packages.
The Group also took a step towards increasing its presence in the important vacuum solutions business. In 2014 we became a significant player in the vacuum industry with the acquisition of Edwards Group. Vacuum can among other things create a pure, particle-free manufacturing environment. In late 2015 we followed this up with the agreement to acquire the Leybold vacuum business. The deal, which is expected to be completed in mid-2016 after regulatory approval, will further strengthen our technology platform for superior vacuum solutions.
STANDING FIRM IN A TOUGH MARKET
Atlas Copco stands strong. We are focusing on boosting customers’ productivity through our continuous drive for innovation. Staying efficient is also key, partly by being on top of the digital transformation. For the first time, the Group generated more than BSEK 100 in revenues. We also achieved record operating profit and cash flow, despite tough market conditions.
Revenues increased
9%to MSEK 102 161
Operating profit MSEK
19 7282014: 17 015
SUSTAINABLE PROFITABLE GROWTH
Goal: Annual revenue growth over a business cycle of 8%
9.2%Compounded annual
growth rate 2005–2015
Goal: High return on
capital employed
27%Return on capital employed in 2015
SEE PAGES 14–18
“Atlas Copco reported solid results for 2015
in a challenging business climate.”
PRESIDENT AND CEO
Atlas Copco 2015 3
Innovation a top focus
Atlas Copco is all about the innovative spirit. Our more than 3 000 engineers working in R&D safeguard a steady output of absolutely top-notch products. But the breakthroughs that truly create customer value do not come automatically. They are the result of hard work, sound strategies, a well-run organiza-tion and strong interaction with all stake-holders, primarily our customers.
Our innovative efforts go hand in hand with broader global trends such as the legis-lative requirements to cut emissions. For example, we are cooperating with automo-tive manufacturers to reduce the weight of their vehicles, resulting in lower fuel con-sumption. Tougher emissions legislation is prompting the automakers to make vehicles with aluminum instead of steel to cut weight. Welding, the traditional assembly method for steel, does not work well with aluminum. That is where we come in – through our SCA and Henrob units, we are providing cutting-edge assembly technolo-gies using adhesive dispensing and riveting systems. This is creating true value for our customers, for us, and for the world.
Atlas Copco won three prestigious Red Dot design awards in 2015 for high-precision screwdriver systems. The products improve ergonomics and enhance productivity for manufacturing customers especially in the electronics industry.
For the mining companies, which are tightening their belts as commodity prices have dropped, it is more important than ever to use machines that are productive, energy efficient and have a lower total cost of opera-tions. Atlas Copco’s mining equipment can be relied on in the most remote parts of the world, is best in class on operator safety and emissions, and offers the best long-term eco-nomic value for the customer. We achieve this by focusing not just on the products themselves but on the complete value chain, including suppliers.
A key trend for future mining equipment will be automation. This includes drilling machines that can be controlled remotely with the operator located anywhere in the
world, or drill rigs that run completely by themselves. The trend towards autonomous mining is an exciting area where we are very much on the forefront. This will create true customer value.
Innovation is of course key also for our compressors. These machines are silently working hard in the background in most corners of society. Most manufacturers, food processing plants, construction sites and hospitals, to name a few places, use compressed air. Industrial facilities can typi-cally save up to 10% on their total energy bills by using our compressors, which are industry-leading in efficiency. Meanwhile, society benefits from lower emissions.
The VSD+ compressor with new break-through technology that we introduced in 2013 has been received by the market with great enthusiasm. Customers have realized the benefits of this machine, which uses only half the energy consumed by traditional compressors. Additional VSD+ features such as the compact size and low noise levels are nice bonuses. We started the VSD+ journey with the smaller models, and in 2016 we are rolling out bigger versions. This means that customers with greater com-pressed air needs will be able to take advan-tage of the powerful technology.
Our construction equipment is also the result of an innovative spirit. In 2015 we boosted sales of the LT rammer, a versatile compaction tool developed for example for repair and improvements to trenches and foundations. Customers embraced the ram-mer for its ergonomic, user-friendly design that really puts the operator in focus. The LT6005 rammer won two prestigious design awards in 2015; the iF Product Design Award in Germany and the Swedish Grand Award of Design in the Public’s Favorite category.
Innovation goes beyond products and service. We are working on improving our IT solutions, logistics systems, production methods and sales approaches. Our mindset is: if we are not leading when it comes to all this, then why not and what can we do about it? There is always a better way.
TIME TO COMPETENCESpeeding up the transformation of knowledge into performance is one of Atlas Copco’s priorities when it comes to building competent teams.
SEE PAGE 47
–22%Work related accidents decreased significantly compared to 2014.
“ Atlas Copco is all about the innovative spirit.”
PRESIDENT AND CEO
4 Atlas Copco 2015
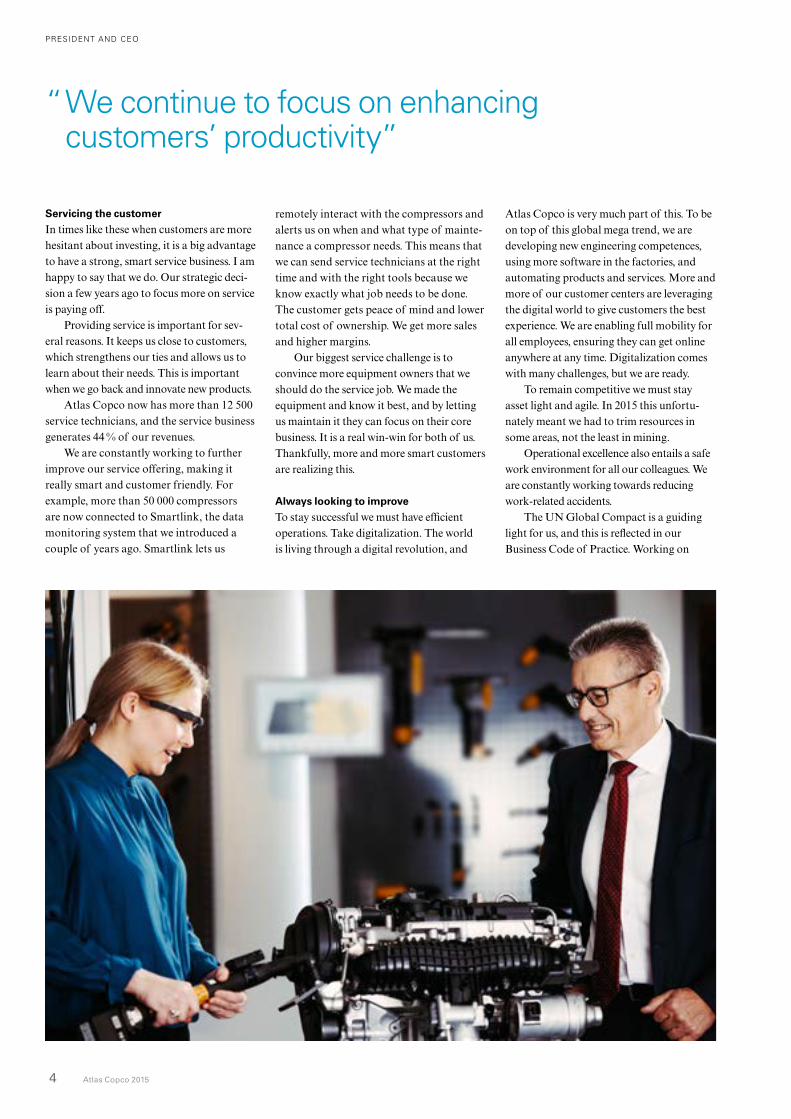
Servicing the customer
In times like these when customers are more hesitant about investing, it is a big advantage to have a strong, smart service business. I am happy to say that we do. Our strategic deci-sion a few years ago to focus more on service is paying off.
Providing service is important for sev-eral reasons. It keeps us close to customers, which strengthens our ties and allows us to learn about their needs. This is important when we go back and innovate new products.
Atlas Copco now has more than 12 500 service technicians, and the service business generates 44 % of our revenues.
We are constantly working to further improve our service offering, making it really smart and customer friendly. For example, more than 50 000 compressors are now connected to Smartlink, the data monitoring system that we introduced a couple of years ago. Smartlink lets us
“ We continue to focus on enhancing customers’ productivity”
remotely interact with the compressors and alerts us on when and what type of mainte-nance a compressor needs. This means that we can send service technicians at the right time and with the right tools because we know exactly what job needs to be done. The customer gets peace of mind and lower total cost of ownership. We get more sales and higher margins.
Our biggest service challenge is to convince more equipment owners that we should do the service job. We made the equipment and know it best, and by letting us maintain it they can focus on their core business. It is a real win-win for both of us. Thankfully, more and more smart customers are realizing this.
Always looking to improve
To stay successful we must have efficient operations. Take digitalization. The world is living through a digital revolution, and
Atlas Copco is very much part of this. To be on top of this global mega trend, we are developing new engineering competences, using more software in the factories, and automating products and services. More and more of our customer centers are leveraging the digital world to give customers the best experience. We are enabling full mobility for all employees, ensuring they can get online anywhere at any time. Digitalization comes with many challenges, but we are ready.
To remain competitive we must stay asset light and agile. In 2015 this unfortu-nately meant we had to trim resources in some areas, not the least in mining.
Operational excellence also entails a safe work environment for all our colleagues. We are constantly working towards reducing work-related accidents.
The UN Global Compact is a guiding light for us, and this is reflected in our Business Code of Practice. Working on

PRESIDENT AND CEO
Atlas Copco 2015 5
Ronnie Leten President and CEOStockholm, January 28, 2016
human rights, labor, environment and anti-corruption is not only ethically the right thing to do but also creates the most long-term business value. We are proud to con-tinue to be recognized as one of the world’s most sustainable companies. The prestigious Global 100 list ranks us as the world’s most sustainable company in the machinery industry, and we are included in the Dow Jones Sustainabiliy Indices. We ranked 11th in the world and highest in the industrial segment in the Newsweek Green Rankings, one of the world’s main scorings on corpo-rate sustainability.
The global community came together last year at the Paris Climate Conference and took a major step against climate change. The agreement, which aims to keep warming at “well below 2°C”, is positive for Atlas Copco. Making energy-efficient prod-ucts is a core part of our business model, and we can really help customers reduce their emissions in addition to boosting their productivity.
People make the difference
Our skillful people make all the difference, so investing in our colleagues’ competence is crucial. Take Russia as a specific example, a country that is suffering through an unusu-ally challenging business climate. Our man-agers in Russia are putting a big focus on people development and growing talents inside the organization. Almost all recruit-ments for manager positions in Russia are done internally. People feel motivated when they know they can develop their skills and grow within the company, especially amid tough external circumstances.
Our global internal job market makes it easier for all employees to grow and find new challenges. Our ambition is to have 85% of managers internally recruited, and in 2015 the outcome was 88%.
Diversity is another key to success, whether it is gender, age, nationalities or education. Our ratio of female managers in the Group is 17%, on par with the ratio of female employees. This will likely keep
growing as about a third of external recruit-ments of recent graduates are female. We are tapping into a vast global talent pool; the 409 most senior managers represent 51 nationalities.
Staying focused
Our five strategic pillars – presence, innova-tion, service, operational excellence and people – continue to be the foundation for our success. To complement them and ensure that our business stays strong long into the future, we have introduced focused priorities. The priorities are innovation, business ethics, safety and health, resource efficiency, and competent teams. By incor-porating these, we safeguard that the strategy is truly sustainable.
Atlas Copco is staying strong even as the market conditions have worsened. The solid result achieved in 2015 in a tough environ-ment is further proof of our agile and resil-ient business model. Long term, we will continue to benefit from several larger global trends; these include the industry’s drive for emissions reductions and higher produc-tivity, and the ongoing urbanization that requires significant infrastructure invest-ments. We will also be able to capitalize on the opportunities offered by the digital transformation.
We continue to focus on enhancing cus-tomers’ productivity by providing them with the most innovative, safe, energy-efficient and ergonomic products and services.
Let me extend a big thank you to our shareholders, customers, employees and other stakeholders who are contributing to Atlas Copco’s sustainable productivity.
”The world is living through a digital revolution,
and Atlas Copco is very much part of this.”
Significant suppliers that confirmed compliance with the 10 Criteria Letter (based on Atlas Copco’s Business Code of Practice):
88% 2014: 82%
Atlas Copco has sales in
183countries
Sick leave
1.9%2014: 1.9%
ETHICS
SAFETY
INNOVATION
COMPETENCE
RESOURCES
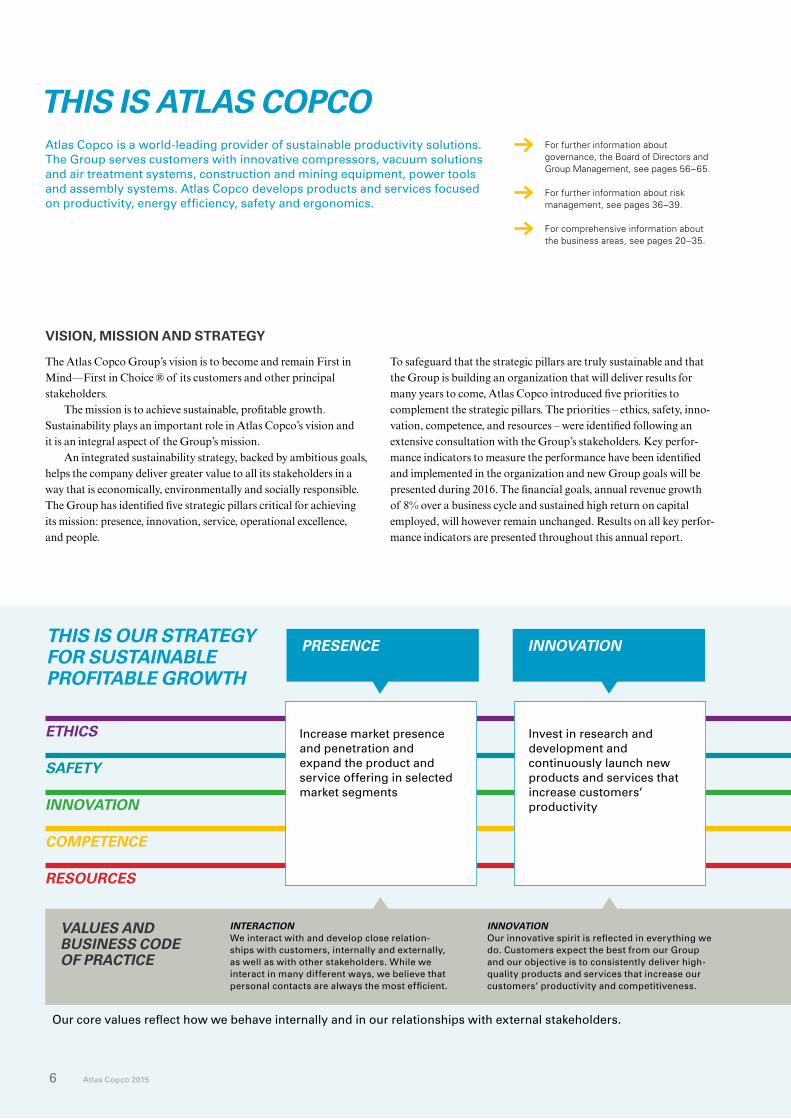
THIS IS OUR STRATEGY FOR SUSTAINABLE PROFITABLE GROWTH
Our core values reflect how we behave internally and in our relationships with external stakeholders.
PRESENCE INNOVATION SERVICE OPERATIONAL EXCELLENCE
PEOPLE
VALUES AND BUSINESS CODE OF PRACTICE
INTERACTIONWe interact with and develop close relation-ships with customers, internally and externally, as well as with other stakeholders. While we interact in many different ways, we believe that personal contacts are always the most efficient.
INNOVATIONOur innovative spirit is reflected in everything we do. Customers expect the best from our Group and our objective is to consistently deliver high-quality products and services that increase our customers’ productivity and competitiveness.
Invest in research and development and continuously launch new products and services that increase customers’ productivity
Increase market presence and penetration and expand the product and service offering in selected market segments
6 Atlas Copco 2015
THIS IS ATLAS COPCO
The Atlas Copco Group’s vision is to become and remain First in Mind—First in Choice ® of its customers and other principal stakeholders.
The mission is to achieve sustainable, profitable growth. Sustainability plays an important role in Atlas Copco’s vision and it is an integral aspect of the Group’s mission.
An integrated sustainability strategy, backed by ambitious goals, helps the company deliver greater value to all its stakeholders in a way that is economically, environmentally and socially responsible. The Group has identified five strategic pillars critical for achieving its mission: presence, innovation, service, operational excellence, and people.
Atlas Copco is a world-leading provider of sustainable productivity solutions. The Group serves customers with innovative compressors, vacuum solutions and air treatment systems, construction and mining equipment, power tools and assembly systems. Atlas Copco develops products and services focused on productivity, energy efficiency, safety and ergonomics.
For further information about governance, the Board of Directors and Group Management, see pages 56–65.
For further information about risk management, see pages 36–39.
For comprehensive information about the business areas, see pages 20–35.
VISION, MISSION AND STRATEGY
To safeguard that the strategic pillars are truly sustainable and that the Group is building an organization that will deliver results for many years to come, Atlas Copco introduced five priorities to complement the strategic pillars. The priorities – ethics, safety, innovation, competence, and resources – were identified following an extensive consultation with the Group’s stakeholders. Key performance indicators to measure the performance have been identified and implemented in the organization and new Group goals will be presented during 2016. The financial goals, annual revenue growth of 8% over a business cycle and sustained high return on capital employed, will however remain unchanged. Results on all key performance indicators are presented throughout this annual report.
THIS IS ATLAS COPCO
ETHICS
SAFETY
INNOVATION
COMPETENCE
RESOURCES
PRESENCE INNOVATION SERVICE OPERATIONAL EXCELLENCE
PEOPLE
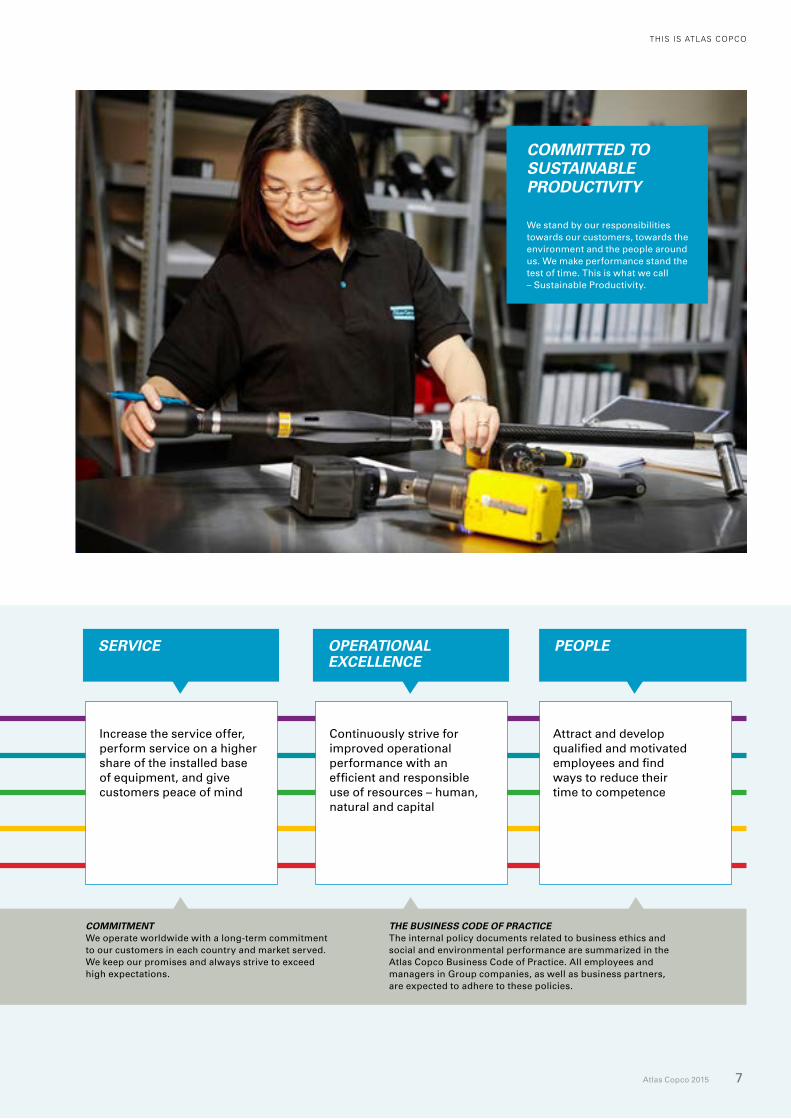
COMMITMENTWe operate worldwide with a long-term commitment to our customers in each country and market served. We keep our promises and always strive to exceed high expectations.
THE BUSINESS CODE OF PRACTICE The internal policy documents related to business ethics and social and environmental performance are summarized in the Atlas Copco Business Code of Practice. All employees and managers in Group companies, as well as business partners, are expected to adhere to these policies.
Attract and develop qualified and motivated employees and find ways to reduce their time to competence
Continuously strive for improved operational performance with an efficient and responsible use of resources – human, natural and capital
Increase the service offer, perform service on a higher share of the installed base of equipment, and give customers peace of mind
Atlas Copco 2015 7
COMMITTED TO SUSTAINABLE PRODUCTIVITY
We stand by our responsibilities towards our customers, towards the environment and the people around us. We make performance stand the test of time. This is what we call – Sustainable Productivity.
THIS IS ATLAS COPCO
8 Atlas Copco 2015
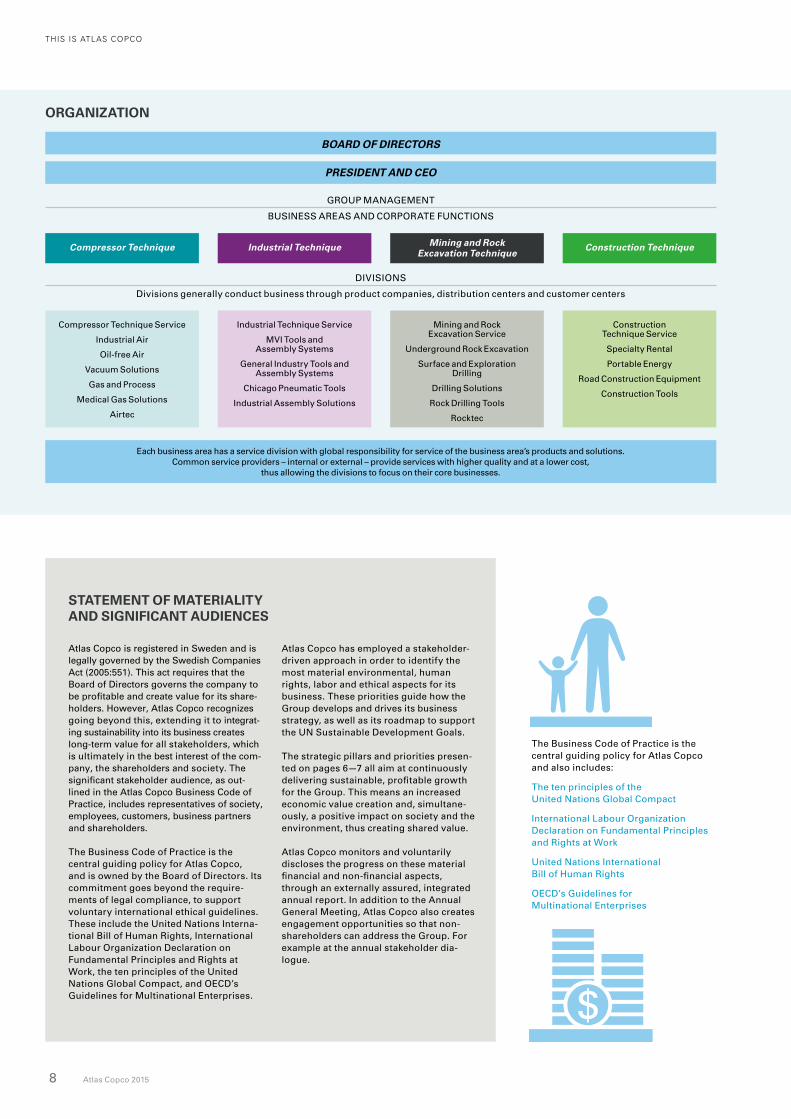
ORGANIZATION
Each business area has a service division with global responsibility for service of the business area’s products and solutions. Common service providers – internal or external – provide services with higher quality and at a lower cost,
thus allowing the divisions to focus on their core businesses.
Compressor Technique Mining and Rock Excavation Technique
Industrial Technique Construction Technique
GROUP MANAGEMENT
BUSINESS AREAS AND CORPORATE FUNCTIONS
Compressor Technique Service
Industrial Air
Oil-free Air
Vacuum Solutions
Gas and Process
Medical Gas Solutions
Airtec
Mining and Rock Excavation Service
Underground Rock Excavation
Surface and Exploration Drilling
Drilling Solutions
Rock Drilling Tools
Rocktec
Industrial Technique Service
MVI Tools and Assembly Systems
General Industry Tools and Assembly Systems
Chicago Pneumatic Tools
Industrial Assembly Solutions
Construction Technique Service
Specialty Rental
Portable Energy
Road Construction Equipment
Construction Tools
BOARD OF DIRECTORS
PRESIDENT AND CEO
DIVISIONS
Divisions generally conduct business through product companies, distribution centers and customer centers
Atlas Copco is registered in Sweden and is legally governed by the Swedish Companies Act (2005:551). This act requires that the Board of Directors governs the company to be profitable and create value for its share-holders. However, Atlas Copco recognizes going beyond this, extending it to integrat-ing sustainability into its business creates long-term value for all stakeholders, which is ultimately in the best interest of the com-pany, the shareholders and society. The significant stakeholder audience, as out-lined in the Atlas Copco Business Code of Practice, includes representatives of society, em ployees, customers, business partners and shareholders.
The Business Code of Practice is the central guiding policy for Atlas Copco, and is owned by the Board of Directors. Its commitment goes beyond the require-ments of legal compliance, to support voluntary international ethical guidelines. These include the United Nations Interna-tional Bill of Human Rights, International Labour Organization Declaration on Fundamental Principles and Rights at Work, the ten principles of the United Nations Global Compact, and OECD’s Guidelines for Multinational Enterprises.
Atlas Copco has employed a stakeholder- driven approach in order to identify the most material environmental, human rights, labor and ethical aspects for its business. These priorities guide how the Group develops and drives its business strategy, as well as its roadmap to support the UN Sustainable Development Goals.
The strategic pillars and priorities presen-ted on pages 6—7 all aim at continuously delivering sustainable, profitable growth for the Group. This means an increased economic value creation and, simultane-ously, a positive impact on society and the environment, thus creating shared value.
Atlas Copco monitors and voluntarily discloses the progress on these material financial and non-financial aspects, through an externally assured, integrated annual report. In addition to the Annual General Meeting, Atlas Copco also creates engagement opportunities so that non-shareholders can address the Group. For example at the annual stakeholder dia-logue.
STATEMENT OF MATERIALITY AND SIGNIFICANT AUDIENCES
The Business Code of Practice is the central guiding policy for Atlas Copco and also includes:
The ten principles of the United Nations Global Compact
International Labour Organization Declaration on Fundamental Principles and Rights at Work
United Nations International Bill of Human Rights
OECD’s Guidelines for Multinational Enterprises
THIS IS ATLAS COPCO
Atlas Copco 2015 9
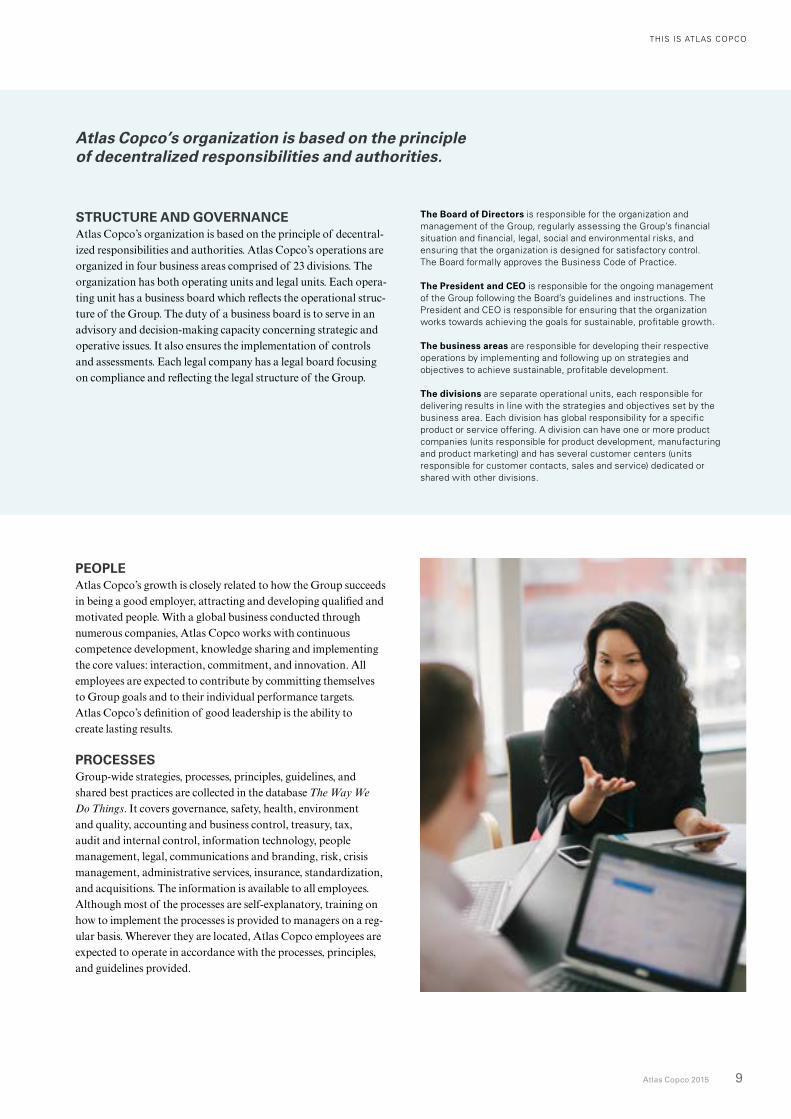
PEOPLEAtlas Copco’s growth is closely related to how the Group succeeds in being a good employer, attracting and developing qualified and motivated people. With a global business conducted through numerous companies, Atlas Copco works with continuous competence development, knowledge sharing and implementing the core values: interaction, commitment, and innovation. All employees are expected to contribute by committing themselves to Group goals and to their individual performance targets. Atlas Copco’s definition of good leadership is the ability to create lasting results.
STRUCTURE AND GOVERNANCEAtlas Copco’s organization is based on the principle of decentralized responsibilities and authorities. Atlas Copco’s operations are organized in four business areas comprised of 23 divisions. The organization has both operating units and legal units. Each operating unit has a business board which reflects the operational structure of the Group. The duty of a business board is to serve in an advisory and decisionmaking capacity concerning strategic and operative issues. It also ensures the implementation of controls and assessments. Each legal company has a legal board focusing on compliance and reflecting the legal structure of the Group.
Atlas Copco’s organization is based on the principle of decentralized responsibilities and authorities.
PROCESSESGroupwide strategies, processes, principles, guidelines, and shared best practices are collected in the database The Way We Do Things. It covers governance, safety, health, environment and quality, accounting and business control, treasury, tax, audit and internal control, information technology, people management, legal, communications and branding, risk, crisis management, administrative services, insurance, standardization, and acquisitions. The information is available to all employees. Although most of the processes are selfexplanatory, training on how to implement the processes is provided to managers on a regular basis. Wherever they are located, Atlas Copco employees are expected to operate in accordance with the processes, principles, and guidelines provided.
The Board of Directors is responsible for the organization and management of the Group, regularly assessing the Group’s financial situation and financial, legal, social and environmental risks, and ensuring that the organization is designed for satisfactory control. The Board formally approves the Business Code of Practice.
The President and CEO is responsible for the ongoing management of the Group following the Board’s guidelines and instructions. The President and CEO is responsible for ensuring that the organization works towards achieving the goals for sustainable, profitable growth.
The business areas are responsible for developing their respective operations by implementing and following up on strategies and objectives to achieve sustainable, profitable development.
The divisions are separate operational units, each responsible for delivering results in line with the strategies and objectives set by the business area. Each division has global responsibility for a specific product or service offering. A division can have one or more product companies (units responsible for product development, manufacturing and product marketing) and has several customer centers (units responsible for customer contacts, sales and service) dedicated or shared with other divisions.
THIS IS ATLAS COPCO
10 Atlas Copco 2015
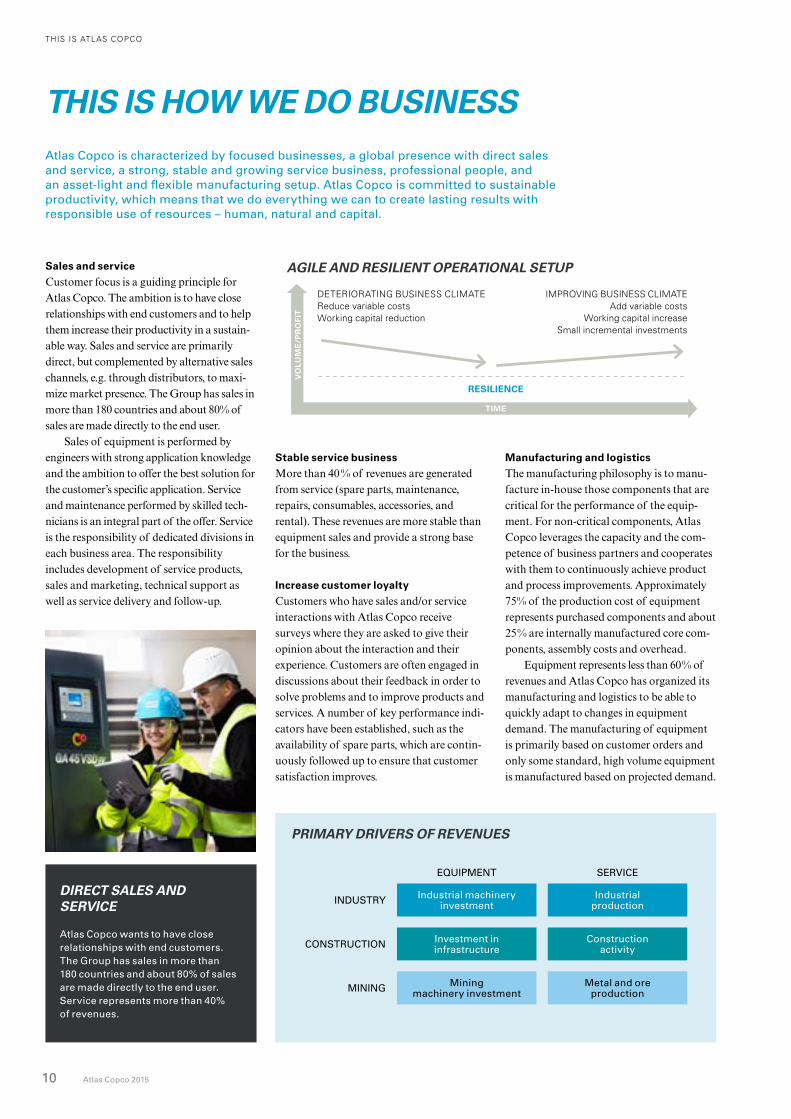
Sales and service
Customer focus is a guiding principle for Atlas Copco. The ambition is to have close relationships with end customers and to help them increase their productivity in a sustain-able way. Sales and service are primarily direct, but complemented by alternative sales channels, e.g. through distri butors, to maxi-mize market presence. The Group has sales in more than 180 countries and about 80% of sales are made directly to the end user.
Sales of equipment is performed by engineers with strong application knowledge and the ambition to offer the best solution for the customer’s specific application. Service and maintenance performed by skilled tech-nicians is an integral part of the offer. Service is the responsibility of dedicated divisions in each business area. The responsibility includes development of service products, sales and marketing, technical support as well as service delivery and follow-up.
THIS IS HOW WE DO BUSINESSAtlas Copco is characterized by focused businesses, a global presence with direct sales and service, a strong, stable and growing service business, professional people, and an asset-light and flexible manu facturing setup. Atlas Copco is committed to sustainable productivity, which means that we do everything we can to create lasting results with responsible use of resources – human, natural and capital.
PRIMARY DRIVERS OF REVENUES
EQUIPMENT SERVICE
INDUSTRY Industrial machinery investment
Industrial production
CONSTRUCTION Investment in infrastructure
Construction activity
MINING Mining machinery investment
Metal and ore production
VO
LUM
E/P
RO
FIT
TIME
DETERIORATING BUSINESS CLIMATEReduce variable costsWorking capital reduction
IMPROVING BUSINESS CLIMATEAdd variable costs
Working capital increaseSmall incremental investments
AGILE AND RESILIENT OPERATIONAL SETUP
RESILIENCE
Stable service business
More than 40% of revenues are generated from service (spare parts, maintenance, repairs, consumables, accessories, and rental). These revenues are more stable than equipment sales and provide a strong base for the business.
Increase customer loyalty
Customers who have sales and/or service interactions with Atlas Copco receive surveys where they are asked to give their opinion about the interaction and their experience. Customers are often engaged in discussions about their feedback in order to solve problems and to improve products and services. A number of key performance indi-cators have been established, such as the availa bility of spare parts, which are contin-uously followed up to ensure that customer satis faction improves.
Manufacturing and logistics
The manufacturing philosophy is to manu-facture in-house those components that are critical for the performance of the equip-ment. For non-critical components, Atlas Copco leverages the capacity and the com-petence of business partners and cooperates with them to continuously achieve product and process improvements. Approximately 75% of the production cost of equipment represents purchased components and about 25% are internally manufactured core com-ponents, assembly costs and overhead.
Equipment represents less than 60% of revenues and Atlas Copco has organized its manufacturing and logistics to be able to quickly adapt to changes in equipment demand. The manufacturing of equipment is primarily based on customer orders and only some standard, high volume equipment is manufactured based on projected demand.
DIRECT SALES AND SERVICE
Atlas Copco wants to have close relationships with end customers. The Group has sales in more than 180 countries and about 80% of sales are made directly to the end user. Service represents more than 40% of revenues.
THIS IS ATLAS COPCO
Atlas Copco 2015 11
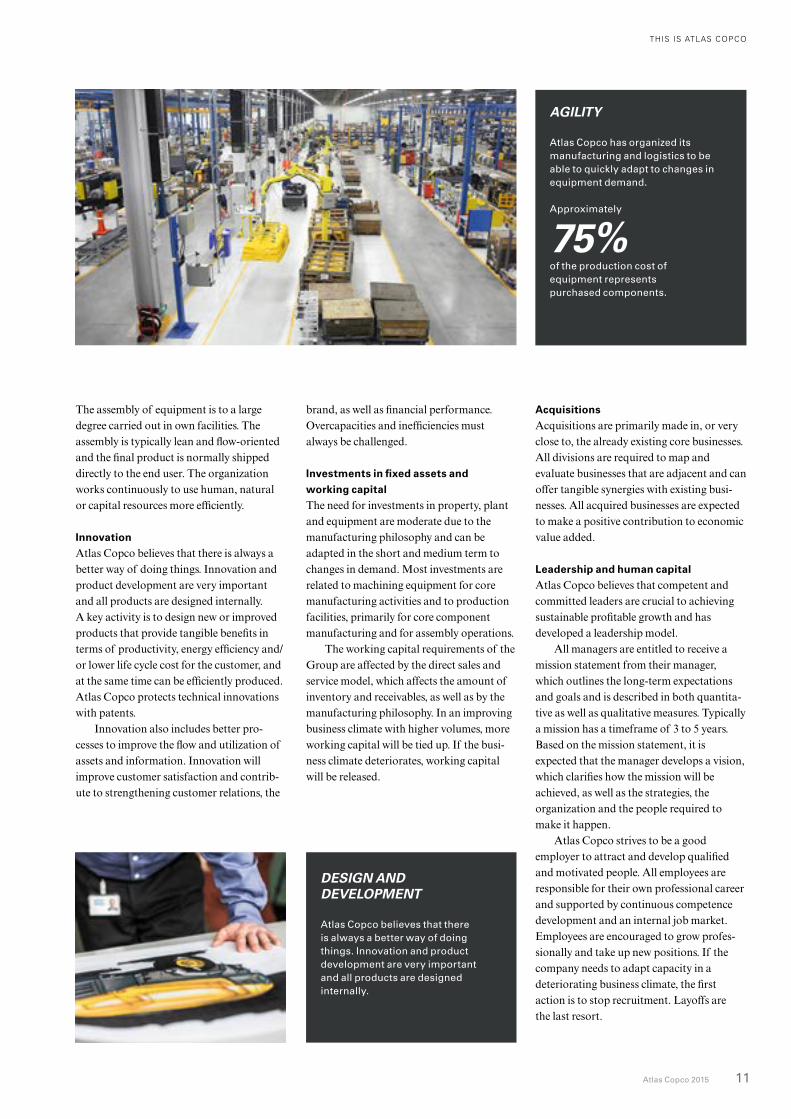
The assembly of equipment is to a large degree carried out in own facilities. The assembly is typically lean and flow-oriented and the final product is normally shipped directly to the end user. The organization works continuously to use human, natural or capital resources more efficiently.
Innovation
Atlas Copco believes that there is always a better way of doing things. Innovation and product development are very important and all products are designed internally. A key activity is to design new or improved products that provide tangible benefits in terms of productivity, energy efficiency and/or lower life cycle cost for the customer, and at the same time can be efficiently produced. Atlas Copco protects technical innovations with patents.
Innovation also includes better pro-cesses to improve the flow and utilization of assets and information. Innovation will improve customer satisfaction and contrib-ute to strengthening customer relations, the
brand, as well as financial performance. Overcapacities and inefficiencies must always be challenged.
Investments in fixed assets and
working capital
The need for investments in property, plant and equipment are moderate due to the manufacturing philosophy and can be adapted in the short and medium term to changes in demand. Most investments are related to machining equipment for core manufacturing activities and to production facilities, primarily for core component manufacturing and for assembly operations.
The working capital requirements of the Group are affected by the direct sales and service model, which affects the amount of inventory and receivables, as well as by the manufacturing philosophy. In an improving business climate with higher volumes, more working capital will be tied up. If the busi-ness climate deteriorates, working capital will be released.
Acquisitions
Acquisitions are primarily made in, or very close to, the already existing core businesses. All divisions are required to map and evaluate businesses that are adjacent and can offer tangible synergies with existing busi-nesses. All acquired businesses are expected to make a positive contribution to economic value added.
Leadership and human capital
Atlas Copco believes that competent and committed leaders are crucial to achieving sustainable profitable growth and has developed a leadership model.
All managers are entitled to receive a mission statement from their manager, which outlines the long-term expectations and goals and is described in both quantita-tive as well as qualitative measures. Typically a mission has a timeframe of 3 to 5 years. Based on the mission statement, it is expected that the manager develops a vision, which clarifies how the mission will be achieved, as well as the strategies, the organization and the people required to make it happen.
Atlas Copco strives to be a good employer to attract and develop qualified and motivated people. All employees are respon sible for their own professional career and supported by continuous competence de velopment and an internal job market. Employees are encouraged to grow profes-sionally and take up new positions. If the company needs to adapt capacity in a deteriorating business climate, the first action is to stop recruitment. Layoffs are the last resort.
AGILITY
Atlas Copco has organized its manufacturing and logistics to be able to quickly adapt to changes in equipment demand.
Approximately
75%of the production cost of equipment represents purchased components.
DESIGN AND DEVELOPMENT
Atlas Copco believes that there is always a better way of doing things. Innovation and product development are very important and all products are designed internally.
12 Atlas Copco 2015
THIS IS ATLAS COPCO
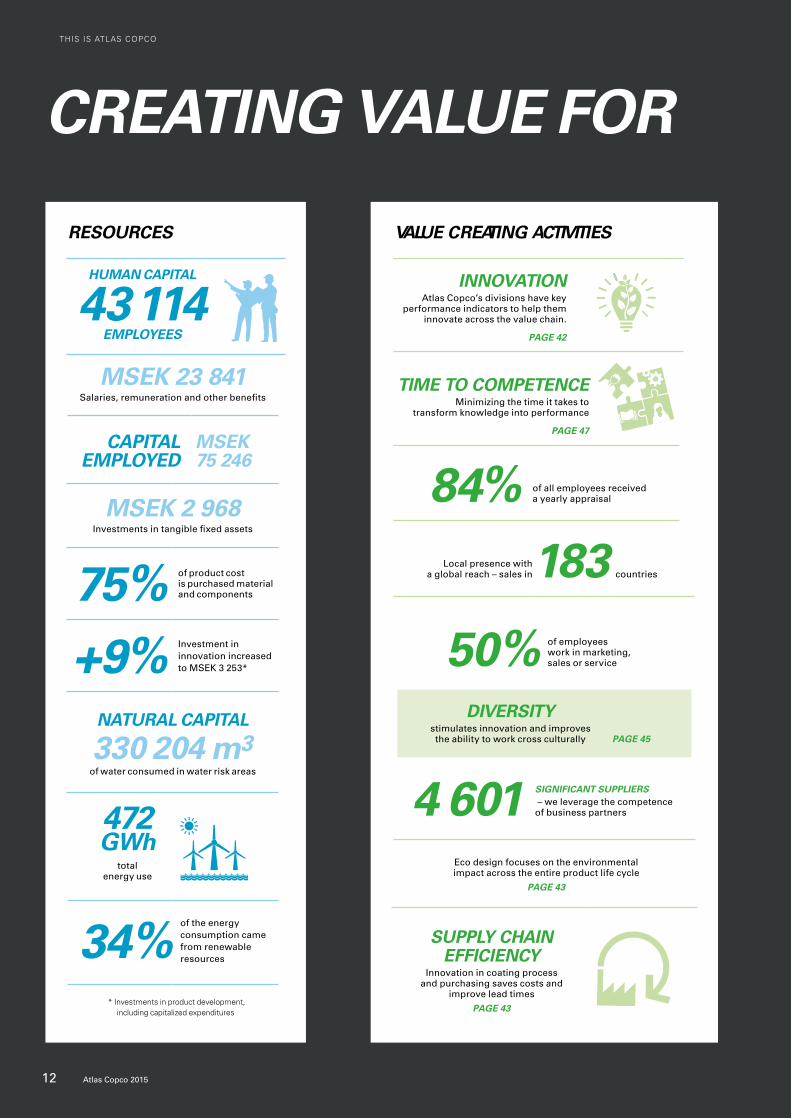
CREATING VALUE FOR ALL STAKEHOLDERS
RESOURCES
HUMAN CAPITAL
43 114EMPLOYEES
MSEK 23 841Salaries, remuneration and other benefits
CAPITAL EMPLOYED
MSEK 75 246
MSEK 2 968 Investments in tangible fixed assets
75% of product cost is purchased material and components
+9% Investment in innovation increased to MSEK 3 253*
NATURAL CAPITAL
330 204 m3 of water consumed in water risk areas
472 GWh
total energy use
34%of the energy consumption came from renewable resources
* Investments in product development, including capitalized expenditures
VALUE CREATING ACTIVITIES
INNOVATION Atlas Copco’s divisions have key
performance indicators to help them innovate across the value chain.
PAGE 42
TIME TO COMPETENCEMinimizing the time it takes to
transform knowledge into performance
PAGE 47
84% of all employees received a yearly appraisal
Local presence with a global reach – sales in183 countries
50% of employees work in marketing, sales or service
DIVERSITY stimulates innovation and improves the ability to work cross culturally PAGE 45
4 601 SIGNIFICANT SUPPLIERS – we leverage the competence of business partners
Eco design focuses on the environmental impact across the entire product life cycle
PAGE 43
SUPPLY CHAIN EFFICIENCY
Innovation in coating process and purchasing saves costs and
improve lead times
PAGE 43
Atlas Copco 2015 13
THIS IS ATLAS COPCO
CREATING VALUE FOR ALL STAKEHOLDERS
OUR ACHIEVEMENTS
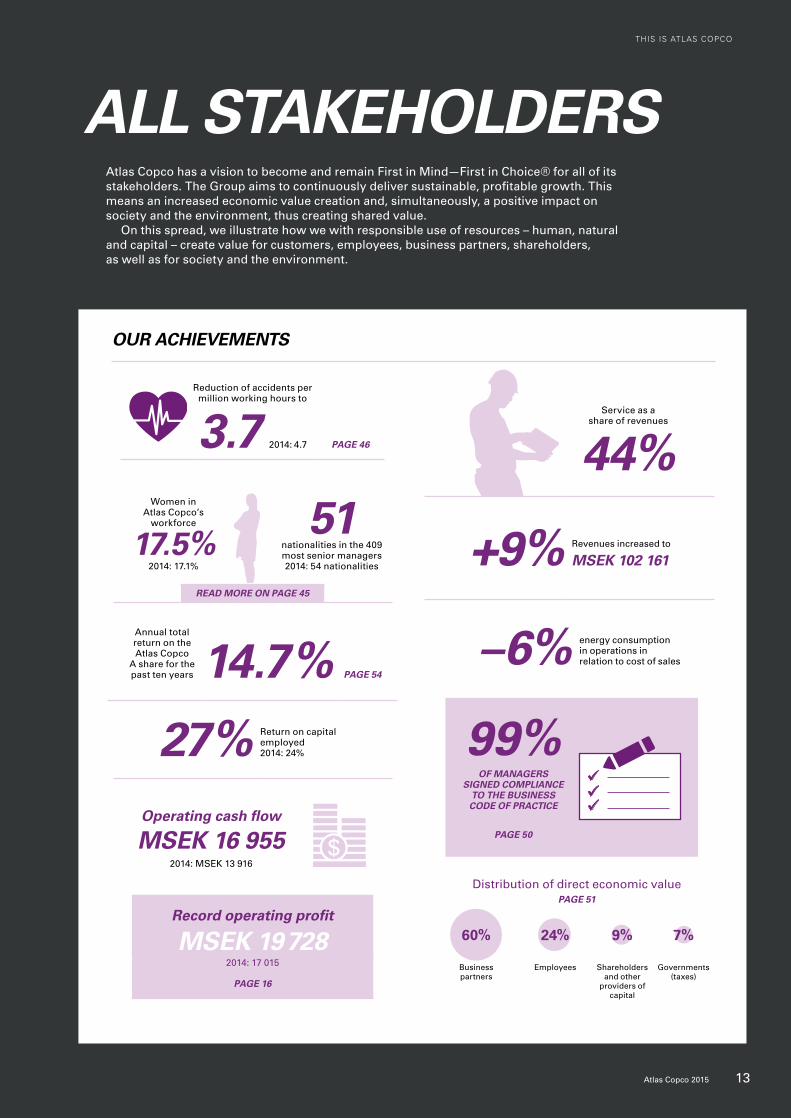
Service as a share of revenues
44%
+9% Revenues increased to
MSEK 102 161
–6% energy consumption in operations in relation to cost of sales
99%OF MANAGERS
SIGNED COMPLIANCE TO THE BUSINESS CODE OF PRACTICE
PAGE 50
Reduction of accidents per million working hours to
3.7 2014: 4.7 PAGE 46
Women in Atlas Copco’s
workforce
17.5%2014: 17.1%
51nationalities in the 409 most senior managers2014: 54 nationalities
READ MORE ON PAGE 45
Annual total return on the Atlas Copco
A share for the past ten years 14.7% PAGE 54
27% Return on capital employed 2014: 24%
Operating cash flow
MSEK 16 9552014: MSEK 13 916
Record operating profit
MSEK 19 7282014: 17 015
PAGE 16
Governments (taxes), 5%
Business partners, 62%
Employees, 23%
Shareholders and other providers of capital, 10%
62%Businesspartners
23%Employees
10%Shareholders
and other providers of capital
5%Governments
(taxes)
60%
Business partners
24%
Employees
9%
Shareholders and other
providers of capital
7%
Governments (taxes)
Distribution of direct economic valuePAGE 51
Atlas Copco has a vision to become and remain First in Mind—First in Choice® for all of its stakeholders. The Group aims to continuously deliver sustainable, profitable growth. This means an increased economic value creation and, simultaneously, a positive impact on society and the environment, thus creating shared value.
On this spread, we illustrate how we with responsible use of resources – human, natural and capital – create value for customers, employees, business partners, shareholders, as well as for society and the environment.
14 Atlas Copco 2015 Administration Report
MARKET REVIEW AND DEMAND DEVELOPMENT
The demand for Atlas Copco’s equipment and services was mixed in 2015. The Group’s order intake increased 7% to a record MSEK 100 241 (93 873). More favorable exchange rates contributed with 9% and acquisitions with 2%, while the organic order decline was 4%.
The service business continued to grow and achieved 3% organic growth. The specialty rental business also continued to grow and achieved 5% organic growth. Consumables for mining and civil engineering, however, declined about 5% organically.
The orders received for equipment decreased with approxi-mately 6% organically. Customers were hesitant to make large investments and the order intake decreased significantly for large compressors for oil and gas and other process industries. Orders also decreased for mining and rock excavation equipment as well as for construction equipment for infrastructure and civil engineering work as a result of low demand from mining and construction cus-tomers. The order intake for small and medium-sized compressors and for vacuum equipment for applications in the manufacturing industry was affected by softer demand in some markets and seg-ments, but remained robust overall. The sales of industrial tools, assembly systems and solutions increased, supported by strong demand from customers in the automotive, aerospace and electron-ics industries.
See also business area sections on pages 20–35.
North America
The order intake in local currencies in North America decreased 4%. Order volumes increased for industrial tools, assembly systems and solutions, but decreased for most other equipment, most signifi-cantly for large compressors and mining equipment. The service business grew in all business areas. In total, North America accounted for 24% (23) of orders received.
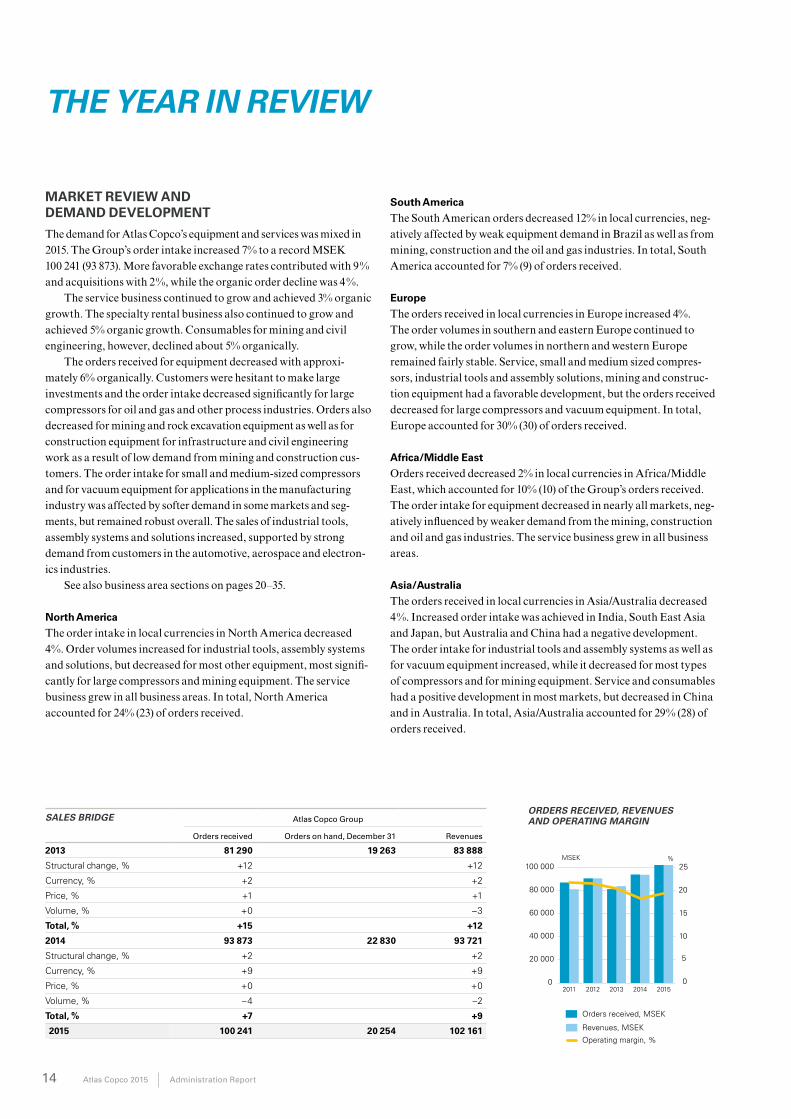
SALES BRIDGE Atlas Copco Group
Orders received Orders on hand, December 31 Revenues
2013 81 290 19 263 83 888
Structural change, % +12 +12
Currency, % +2 +2
Price, % +1 +1
Volume, % +0 –3
Total, % +15 +12
2014 93 873 22 830 93 721
Structural change, % +2 +2
Currency, % +9 +9
Price, % +0 +0
Volume, % –4 –2
Total, % +7 +9
2015 100 241 20 254 102 161
0
20 000
40 000
60 000
80 000
100 000
201520142013201220110
5
10
15
20
25MSEK
Orders received, MSEK
%
Operating margin, %
Revenues, MSEK
0
20 000
40 000
60 000
80 000
100 000
201520142013201220110
5
10
15
20
25MSEK
Orders received, MSEK
%
Operating margin, %
Revenues, MSEKORDERS RECEIVED, REVENUES AND OPERATING MARGIN
THE YEAR IN REVIEW
South America
The South American orders decreased 12% in local currencies, neg-atively affected by weak equipment demand in Brazil as well as from mining, construction and the oil and gas industries. In total, South America accounted for 7% (9) of orders received.
Europe
The orders received in local currencies in Europe increased 4%. The order volumes in southern and eastern Europe continued to grow, while the order volumes in northern and western Europe remained fairly stable. Service, small and medium sized compres-sors, industrial tools and assembly solutions, mining and construc-tion equipment had a favorable development, but the orders received decreased for large compressors and vacuum equipment. In total, Europe accounted for 30% (30) of orders received.
Africa/Middle East
Orders received decreased 2% in local currencies in Africa/Middle East, which accounted for 10% (10) of the Group’s orders received. The order intake for equipment decreased in nearly all markets, neg-atively influenced by weaker demand from the mining, construction and oil and gas industries. The service business grew in all business areas.
Asia/Australia
The orders received in local currencies in Asia/Australia decreased 4%. Increased order intake was achieved in India, South East Asia and Japan, but Australia and China had a negative development. The order intake for industrial tools and assembly systems as well as for vacuum equipment increased, while it decreased for most types of compressors and for mining equipment. Service and consumables had a positive development in most markets, but decreased in China and in Australia. In total, Asia/Australia accounted for 29% (28) of orders received.
THE YEAR IN REVIEW
Administration Report Atlas Copco 2015 15
Market presence
The presence was further strengthened with the addition of sales and service engineers in many markets.
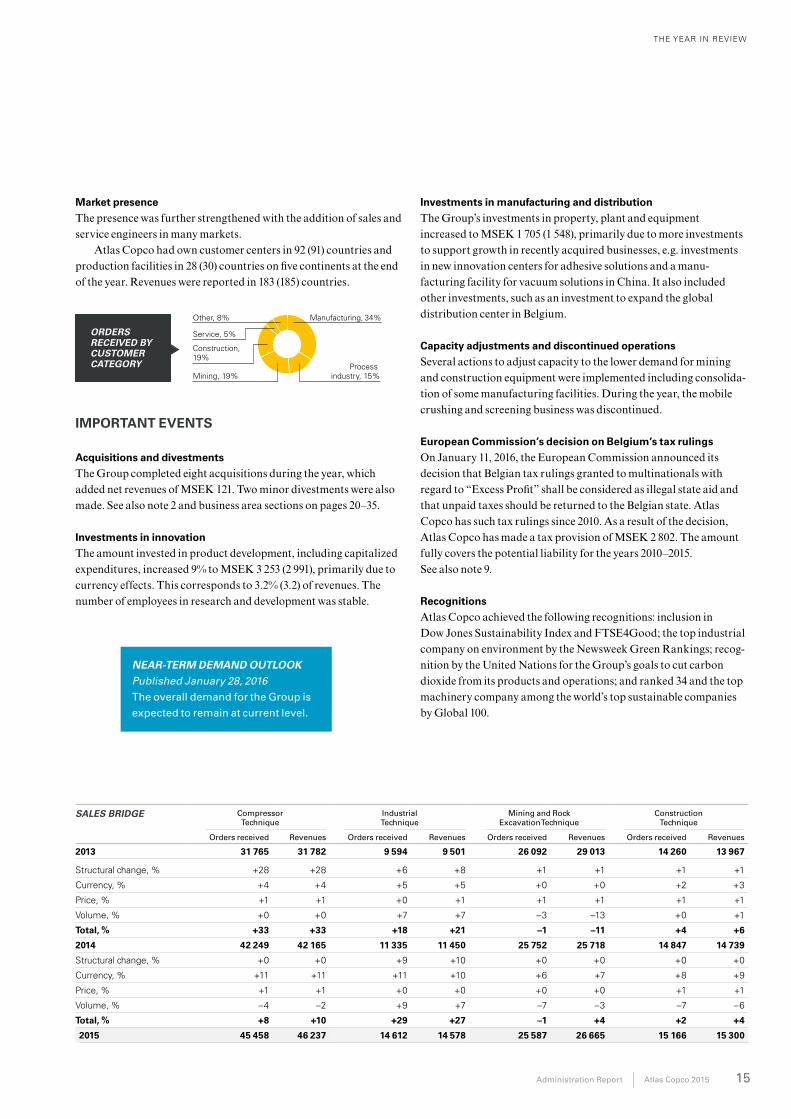
Atlas Copco had own customer centers in 92 (91) countries and production facilities in 28 (30) countries on five continents at the end of the year. Revenues were reported in 183 (185) countries.
ORDERS RECEIVED BY CUSTOMER CATEGORY
Other, 8% Manufacturing, 34%
Construction, 19%
Service, 5%
Mining, 19%Process
industry, 15%
IMPORTANT EVENTS
Acquisitions and divestments
The Group completed eight acquisitions during the year, which added net revenues of MSEK 121. Two minor divestments were also made. See also note 2 and business area sections on pages 20–35.
Investments in innovation
The amount invested in product development, including capitalized expenditures, increased 9% to MSEK 3 253 (2 991), primarily due to currency effects. This corresponds to 3.2% (3.2) of revenues. The number of employees in research and development was stable.
Investments in manufacturing and distribution
The Group’s investments in property, plant and equipment increased to MSEK 1 705 (1 548), primarily due to more investments to support growth in recently acquired businesses, e.g. investments in new innovation centers for adhesive solutions and a manu-facturing facility for vacuum solutions in China. It also included other investments, such as an investment to expand the global distribution center in Belgium.
Capacity adjustments and discontinued operations
Several actions to adjust capacity to the lower demand for mining and construction equipment were implemented including consolida-tion of some manufacturing facilities. During the year, the mobile crushing and screening business was discontinued.
European Commission’s decision on Belgium’s tax rulings
On January 11, 2016, the European Commission announced its decision that Belgian tax rulings granted to multinationals with regard to “Excess Profit” shall be considered as illegal state aid and that unpaid taxes should be returned to the Belgian state. Atlas Copco has such tax rulings since 2010. As a result of the decision, Atlas Copco has made a tax provision of MSEK 2 802. The amount fully covers the potential liability for the years 2010–2015. See also note 9.
Recognitions
Atlas Copco achieved the following recognitions: inclusion in Dow Jones Sustainability Index and FTSE4Good; the top industrial company on environment by the Newsweek Green Rankings; recog-nition by the United Nations for the Group’s goals to cut carbon dioxide from its products and operations; and ranked 34 and the top machinery company among the world’s top sustainable companies by Global 100.
SALES BRIDGE Compressor Technique
Industrial Technique
Mining and Rock Excavation Technique
Construction Technique
Orders received Revenues Orders received Revenues Orders received Revenues Orders received Revenues
2013 31 765 31 782 9 594 9 501 26 092 29 013 14 260 13 967
Structural change, % +28 +28 +6 +8 +1 +1 +1 +1
Currency, % +4 +4 +5 +5 +0 +0 +2 +3
Price, % +1 +1 +0 +1 +1 +1 +1 +1
Volume, % +0 +0 +7 +7 –3 –13 +0 +1
Total, % +33 +33 +18 +21 –1 –11 +4 +6
2014 42 249 42 165 11 335 11 450 25 752 25 718 14 847 14 739
Structural change, % +0 +0 +9 +10 +0 +0 +0 +0
Currency, % +11 +11 +11 +10 +6 +7 +8 +9
Price, % +1 +1 +0 +0 +0 +0 +1 +1
Volume, % –4 –2 +9 +7 –7 –3 –7 –6
Total, % +8 +10 +29 +27 –1 +4 +2 +4
2015 45 458 46 237 14 612 14 578 25 587 26 665 15 166 15 300
NEAR-TERM DEMAND OUTLOOK Published January 28, 2016 The overall demand for the Group is
expected to remain at current level.
THE YEAR IN REVIEW
16 Atlas Copco 2015 Administration Report
FINANCIAL SUMMARY AND ANALYSIS
KEY FINANCIAL DATA, MSEK 2015 2014 CHANGE, %
Orders received 100 241 93 873 +7
Revenues 102 161 93 721 +9
EBITDA 24 075 20 724 +16
– in % of revenues 23.6 22.1
Operating profit 19 728 17 015 +16
– in % of revenues 19.3 18.2
Adjusted operating profit 20 087 17 744 +13
– in % of revenues 19.7 18.9
Profit before tax 18 823 16 091 +17
– in % of revenues 18.4 17.2
Profit for the year 11 723 12 175 –4
Profit for the year, adjusted for tax provision of MSEK 2 802 14 525 12 175 +19
Basic earnings per share, SEK 9.62 10.01 –4
Adjusted basic earnings per share, SEK 11.92 10.01 +19
Diluted earnings per share, SEK 9.58 9.99 –4
Revenues
The Group’s revenues increased by 9% to a record MSEK 102 161 (93 721). The goal is to achieve annual revenue growth of 8% over a business cycle. In the past 10 years, the compounded annual growth rate has been 9.2%.
The Group’s goal for annual revenue growth is 8%, measured over a business cycle. At the same time the ambition is to grow faster than the most important competitors. Growth should primarily be organic, supported by selective acquisitions.
0
2
4
6
8
10
12
2011–20152006–20151996–2015
%
Goal
Revenue growth, averageANNUAL REVENUE GROWTH RATE
Operating profit
The operating profit was MSEK 19 728 (17 015), corresponding to a margin of 19.3% (18.2). Items affecting comparability were MSEK –359 (–729) and the adjusted operating margin was 19.7% (18.9). See also the bridge below.
The operating profit for the Compressor Technique business area increased 15% to MSEK 10 324 (8 974), corresponding to a mar-gin of 22.3% (21.3). The profit included items affecting comparability of MSEK –55 (–180) and the adjusted margin increased to 22.4% (21.7). The margin was supported by currency and mix, but nega-tively impacted by lower equipment volumes.
The operating profit for the Industrial Technique business area increased 31% to MSEK 3 355 (2 557), with strong contribution from acquisitions. The margin increased to 23.0% (22.3) and was sup-ported by higher volumes and currency, but was impacted negatively by dilution from acquisitions.
The operating profit for the Mining and Rock Excavation Tech-nique business area increased 16% to MSEK 4 993 (4 307), corre-sponding to a margin of 18.7% (16.7). The profit included items affecting comparability of MSEK –65 (–415) and the adjusted mar-gin increased to 19.0% (18.4). The margin was impacted negatively by lower equipment volumes, but supported by currency and mix.
The operating profit for the Construction Technique business area increased 4% to MSEK 1 839 (1 768), corresponding to a margin of 12.0% (12.0). The profit included items affecting comparability of MSEK –95 and the adjusted operating margin increased to 12.6% (12.0). The margin was supported by currency, but negatively impacted by lower volumes.
Costs for common Group functions and eliminations were MSEK –783 (–591), including the effect from the provision for share-related long-term incentive programs of MSEK –144 (–174) and an insurance reimbursement of MSEK 40 in 2014.
Depreciation and EBITDA
Depreciation and amortization increased to MSEK 4 347 (3 709), mainly due to currency and acquisitions. Earnings before deprecia-tion and amortization, EBITDA, was MSEK 24 075 (20 724), corre-sponding to a margin of 23.6% (22.1).
Net financial items
The Group’s net financial items totaled MSEK –905 (–924). The net interest expense increased to MSEK –758 (–699). Other financial items were MSEK –147 (–225). See note 8 and 27.
BRIDGE – REVENUES AND OPERATING PROFIT
MSEK 2015Volume, price, mix and other Currency Acquisitions
Restructuring and capital gain
Share-based long-term incentive programs 2014
Revenues 102 161 –1 830 8 845 1 425 – – 93 721
Operating profit 19 728 –957 3 070 230 340 30 17 015
Effect on margin, % 19.3 –0.6 +1.4 –0.0 +0.3 +0.0 18.2
RevenuesOperating
profitOperating margin, %
Return on capital employed, %
Investments in tangible fixed assets 1)
MSEK 2015 2014 2015 2014 2015 2014 2015 2014 2015 2014
Compressor Technique 46 237 42 165 10 324 8 974 22.3 21.3 38 40 586 639
Industrial Technique 14 578 11 450 3 355 2 557 23.0 22.3 31 36 532 270
Mining and Rock Excavation Technique 26 665 25 718 4 993 4 307 18.7 16.7 34 29 981 967
Construction Technique 15 300 14 739 1 839 1 768 12.0 12.0 12 12 555 939
Common Group functions/eliminations –619 –351 –783 –591 314 452
Total Group 102 161 93 721 19 728 17 015 19.3 18.2 27 24 2 968 3 2671) Excluding assets leased.
The operating margin increased to 19.3% (18.2). It was positively affected by currency and items affecting comparability, but negatively affected by volume.
THE YEAR IN REVIEW
Administration Report Atlas Copco 2015 17
Profit before tax
Profit before tax was MSEK 18 823 (16 091), corresponding to a profit margin of 18.4% (17.2).
Taxes and tax provision in Belgium
Taxes for the year amounted to MSEK 7 100 (3 916) and includes a tax provision of MSEK 2 802 following the European Commission’s decision on Belgium’s tax rulings. The effective tax rate was 37.7% (24.3) and 22.8% excluding the tax provision. See note 9.
Profit and earnings per share
Profit for the year decreased 4% to MSEK 11 723 (12 175), whereof MSEK 11 717 (12 169) and MSEK 6 (6) attributable to owners of the parent and non-controlling interests, respectively. Basic and diluted earnings per share were SEK 9.62 (10.01) and SEK 9.58 (9.99), respec-tively. Excluding the tax provision in Belgium, profit for the year increased 19% to MSEK 14 525 (12 175) and basic earnings per share were SEK 11.92 (10.01).
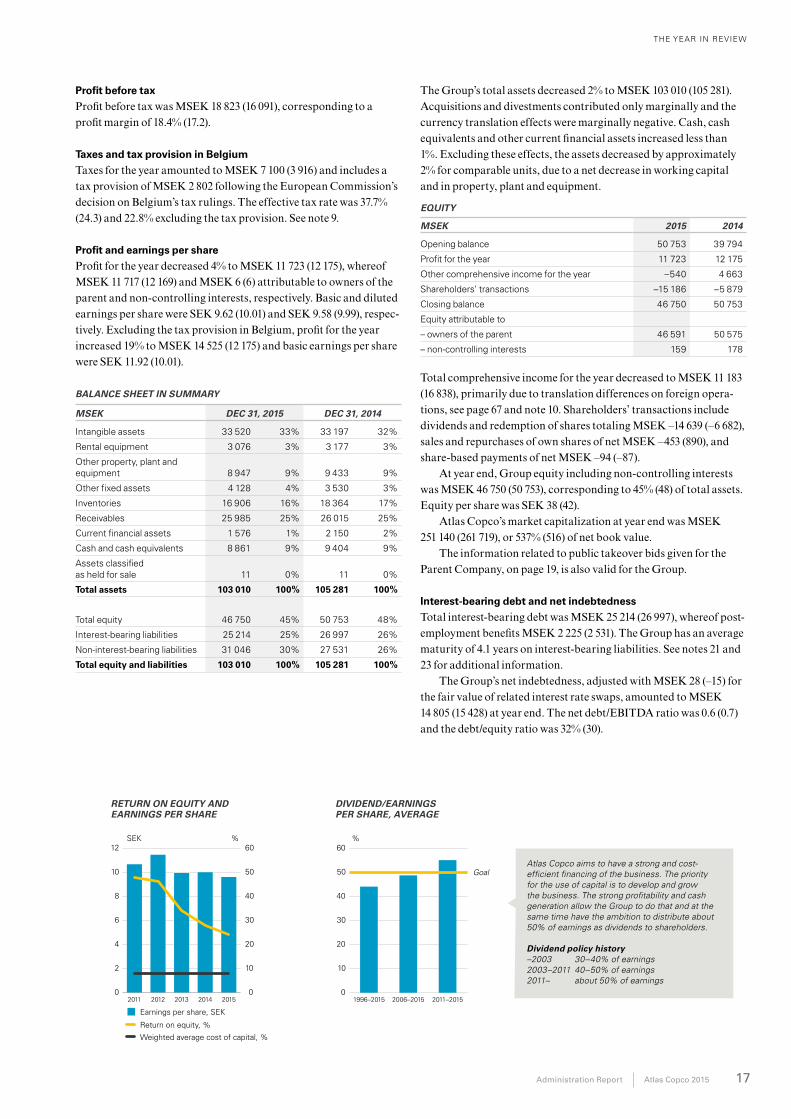
BALANCE SHEET IN SUMMARY
MSEK DEC 31, 2015 DEC 31, 2014
Intangible assets 33 520 33% 33 197 32%
Rental equipment 3 076 3% 3 177 3%
Other property, plant and equipment 8 947 9% 9 433 9%
Other fixed assets 4 128 4% 3 530 3%
Inventories 16 906 16% 18 364 17%
Receivables 25 985 25% 26 015 25%
Current financial assets 1 576 1% 2 150 2%
Cash and cash equivalents 8 861 9% 9 404 9%
Assets classified as held for sale 11 0% 11 0%
Total assets 103 010 100% 105 281 100%
Total equity 46 750 45% 50 753 48%
Interest-bearing liabilities 25 214 25% 26 997 26%
Non-interest-bearing liabilities 31 046 30% 27 531 26%
Total equity and liabilities 103 010 100% 105 281 100%
The Group’s total assets decreased 2% to MSEK 103 010 (105 281). Acquisitions and divestments contributed only marginally and the currency translation effects were marginally negative. Cash, cash equivalents and other current financial assets increased less than 1%. Excluding these effects, the assets decreased by approximately 2% for comparable units, due to a net decrease in working capital and in property, plant and equipment.
EQUITY
MSEK 2015 2014
Opening balance 50 753 39 794
Profit for the year 11 723 12 175
Other comprehensive income for the year –540 4 663
Shareholders’ transactions –15 186 –5 879
Closing balance 46 750 50 753
Equity attributable to
– owners of the parent 46 591 50 575
– non-controlling interests 159 178
Total comprehensive income for the year decreased to MSEK 11 183 (16 838), primarily due to translation differences on foreign opera-tions, see page 67 and note 10. Shareholders’ transactions include dividends and redemption of shares totaling MSEK –14 639 (–6 682), sales and repurchases of own shares of net MSEK –453 (890), and share-based payments of net MSEK –94 (–87).
At year end, Group equity including non-controlling interests was MSEK 46 750 (50 753), corresponding to 45% (48) of total assets. Equity per share was SEK 38 (42).
Atlas Copco’s market capitalization at year end was MSEK 251 140 (261 719), or 537% (516) of net book value.
The information related to public takeover bids given for the Parent Company, on page 19, is also valid for the Group.
Interest-bearing debt and net indebtedness
Total interest-bearing debt was MSEK 25 214 (26 997), whereof post-employment benefits MSEK 2 225 (2 531). The Group has an average maturity of 4.1 years on interest-bearing liabilities. See notes 21 and 23 for additional information.
The Group’s net indebtedness, adjusted with MSEK 28 (–15) for the fair value of related interest rate swaps, amounted to MSEK 14 805 (15 428) at year end. The net debt/EBITDA ratio was 0.6 (0.7) and the debt/equity ratio was 32% (30).
0
2
4
6
8
10
12
201520142013201220110
10
20
30
40
50
60SEK
Earnings per share, SEK
%
Return on equity, %
Weighted average cost of capital, %
Return on equity and earnings per share
0
10
20
30
40
50
60
2011–20152006–20151996–2015
%
GoalAtlas Copco aims to have a strong and cost- efficient financing of the business. The priority for the use of capital is to develop and grow the business. The strong profitability and cash generation allow the Group to do that and at the same time have the ambition to distribute about 50% of earnings as dividends to shareholders.
Dividend policy history –2003 30–40% of earnings 2003–2011 40–50% of earnings 2011– about 50% of earnings
RETURN ON EQUITY AND EARNINGS PER SHARE
DIVIDEND/EARNINGS PER SHARE, AVERAGE
THE YEAR IN REVIEW
18 Atlas Copco 2015 Administration Report
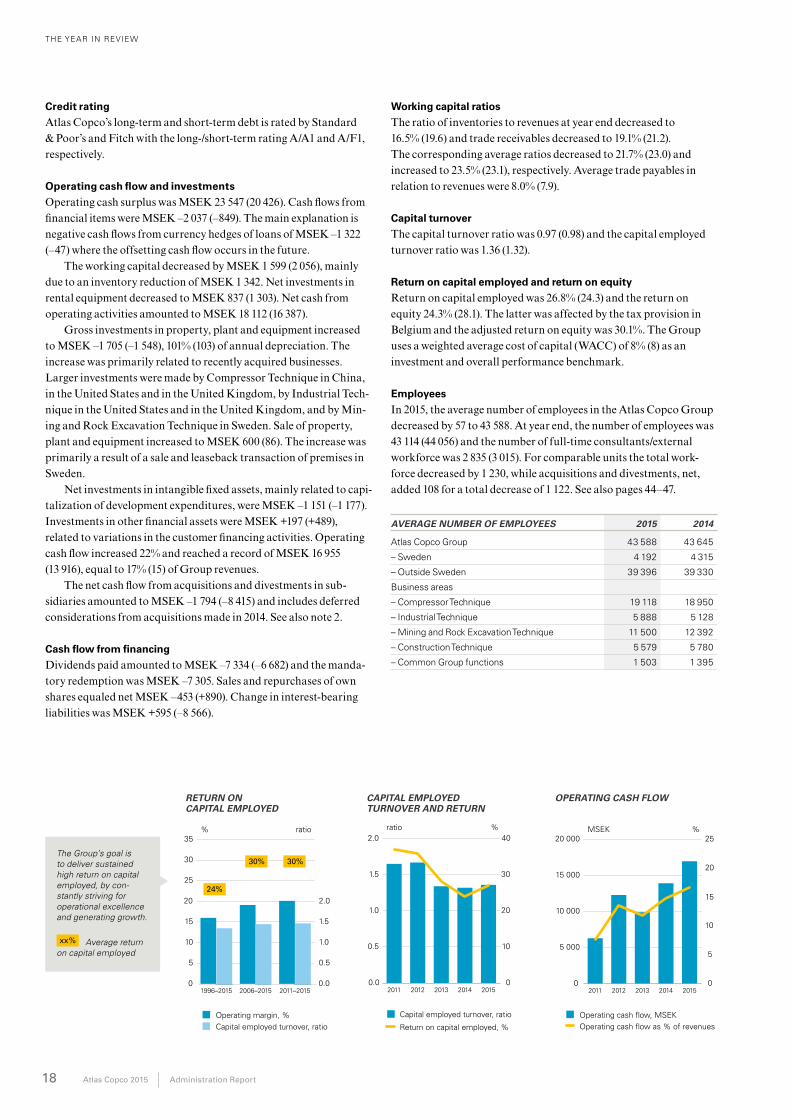
Credit rating
Atlas Copco’s long-term and short-term debt is rated by Standard & Poor’s and Fitch with the long-/short-term rating A/A1 and A/F1, respectively.
Operating cash flow and investments
Operating cash surplus was MSEK 23 547 (20 426). Cash flows from financial items were MSEK –2 037 (–849). The main explanation is negative cash flows from currency hedges of loans of MSEK –1 322 (–47) where the offsetting cash flow occurs in the future.
The working capital decreased by MSEK 1 599 (2 056), mainly due to an inventory reduction of MSEK 1 342. Net investments in rental equipment decreased to MSEK 837 (1 303). Net cash from operating activities amounted to MSEK 18 112 (16 387).
Gross investments in property, plant and equipment increased to MSEK –1 705 (–1 548), 101% (103) of annual depreciation. The increase was primarily related to recently acquired businesses. Larger investments were made by Compressor Technique in China, in the United States and in the United Kingdom, by Industrial Tech-nique in the United States and in the United Kingdom, and by Min-ing and Rock Excavation Technique in Sweden. Sale of property, plant and equipment increased to MSEK 600 (86). The increase was primarily a result of a sale and leaseback transaction of premises in Sweden.
Net investments in intangible fixed assets, mainly related to capi-talization of development expenditures, were MSEK –1 151 (–1 177).Investments in other financial assets were MSEK +197 (+489), related to variations in the customer financing activities. Operating cash flow increased 22% and reached a record of MSEK 16 955 (13 916), equal to 17% (15) of Group revenues.
The net cash flow from acquisitions and divestments in sub-sidiaries amounted to MSEK –1 794 (–8 415) and includes deferred considerations from acquisitions made in 2014. See also note 2.
Cash flow from financing
Dividends paid amounted to MSEK –7 334 (–6 682) and the manda-tory redemption was MSEK –7 305. Sales and repurchases of own shares equaled net MSEK –453 (+890). Change in interest-bearing liabilities was MSEK +595 (–8 566).
Working capital ratios
The ratio of inventories to revenues at year end decreased to 16.5% (19.6) and trade receivables decreased to 19.1% (21.2). The corresponding average ratios decreased to 21.7% (23.0) and increased to 23.5% (23.1), respectively. Average trade payables in relation to revenues were 8.0% (7.9).
Capital turnover
The capital turnover ratio was 0.97 (0.98) and the capital employed turnover ratio was 1.36 (1.32).
Return on capital employed and return on equity
Return on capital employed was 26.8% (24.3) and the return on equity 24.3% (28.1). The latter was affected by the tax provision in Belgium and the adjusted return on equity was 30.1%. The Group uses a weighted average cost of capital (WACC) of 8% (8) as an investment and overall performance benchmark.
Employees
In 2015, the average number of employees in the Atlas Copco Group decreased by 57 to 43 588. At year end, the number of employees was 43 114 (44 056) and the number of full-time consultants/external workforce was 2 835 (3 015). For comparable units the total work-force decreased by 1 230, while acquisitions and divestments, net, added 108 for a total decrease of 1 122. See also pages 44–47.
AVERAGE NUMBER OF EMPLOYEES 2015 2014
Atlas Copco Group 43 588 43 645
– Sweden 4 192 4 315
– Outside Sweden 39 396 39 330
Business areas
– Compressor Technique 19 118 18 950
– Industrial Technique 5 888 5 128
– Mining and Rock Excavation Technique 11 500 12 392
– Construction Technique 5 579 5 780
– Common Group functions 1 503 1 395
0.0
0.5
1.0
1.5
2.0
201520142013201220110
10
20
30
40ratio
Capital employed turnover, ratio
%
Return on capital employed, %
Capital employed turnover and return
0
5 000
10 000
15 000
20 000
201520142013201220110
5
10
15
20
25MSEK
Operating cash flow, MSEK
%
Operating cash flow as % of revenues
Operating cash flow
The Group’s goal is to deliver sustained high return on capital employed, by con-stantly striving for operational excellence and generating growth.
Average return on capital employed
CAPITAL EMPLOYED TURNOVER AND RETURN
OPERATING CASH FLOWReturn on capital employed, average
0
5
10
15
20
25
30
35
2011–20152006–20151996–20150.0
0.5
1.0
1.5
2.0
%
Operating margin, %Capital employed turnover, ratio
ratio
21%
25%
29%
Har flyttat ut boxarna nedan eftersom de inte visades med fylld vit färg på provtrycken. Säkrast att lägga dessa i InDesign.
0,0
0,5
1,0
1,5
2,0
2,5
3,0
3,5
2010–20142005–20141995-2014
STAPLARNA NEDAN ÄR KOPIERADE IN I VÄNSTRA DIAGRAMMET
RETURN ON CAPITAL EMPLOYED
30%30%
24%
xx%
THE YEAR IN REVIEW
Administration Report Atlas Copco 2015 19
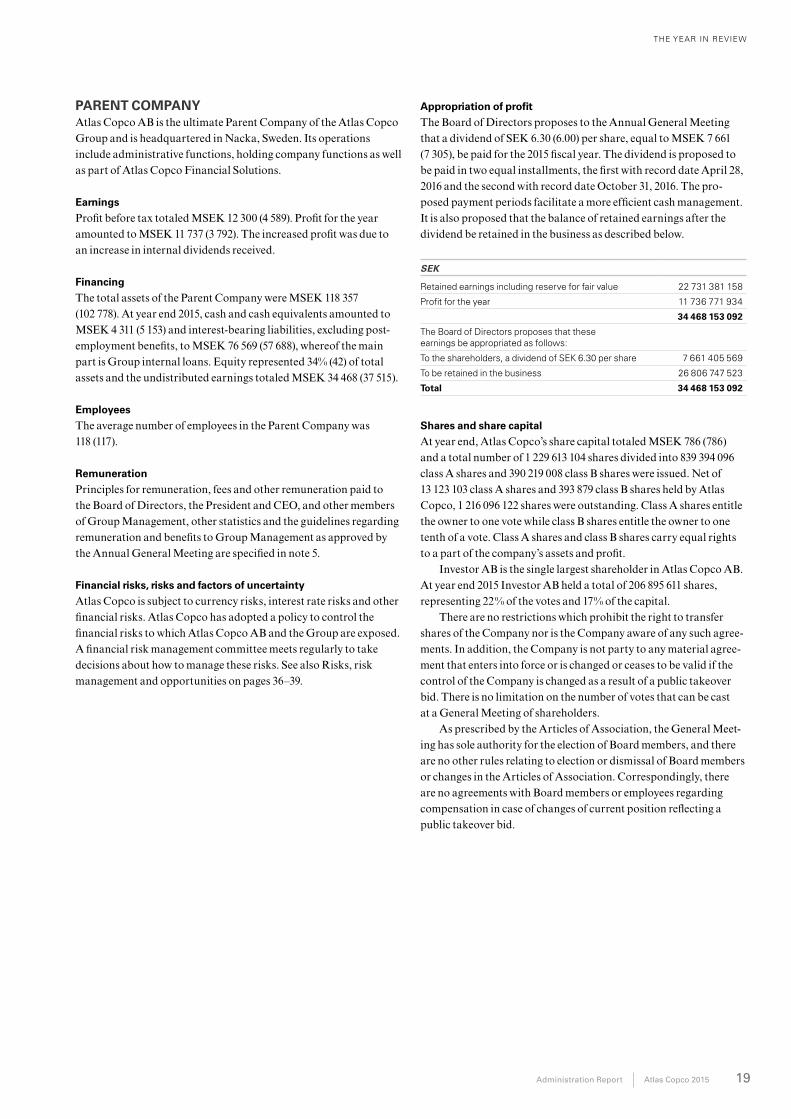
PARENT COMPANYAtlas Copco AB is the ultimate Parent Company of the Atlas Copco Group and is headquartered in Nacka, Sweden. Its operations include administrative functions, holding company functions as well as part of Atlas Copco Financial Solutions.
Earnings
Profit before tax totaled MSEK 12 300 (4 589). Profit for the year amounted to MSEK 11 737 (3 792). The increased profit was due to an increase in internal dividends received.
Financing
The total assets of the Parent Company were MSEK 118 357 (102 778). At year end 2015, cash and cash equivalents amounted to MSEK 4 311 (5 153) and interest-bearing liabilities, excluding post-employment benefits, to MSEK 76 569 (57 688), whereof the main part is Group internal loans. Equity represented 34% (42) of total assets and the undistributed earnings totaled MSEK 34 468 (37 515).
Employees
The average number of employees in the Parent Company was 118 (117).
Remuneration
Principles for remuneration, fees and other remuneration paid to the Board of Directors, the President and CEO, and other members of Group Management, other statistics and the guidelines regarding remuneration and benefits to Group Management as approved by the Annual General Meeting are specified in note 5.
Financial risks, risks and factors of uncertainty
Atlas Copco is subject to currency risks, interest rate risks and other financial risks. Atlas Copco has adopted a policy to control the financial risks to which Atlas Copco AB and the Group are exposed. A financial risk management committee meets regularly to take decisions about how to manage these risks. See also Risks, risk management and opportunities on pages 36–39.
Appropriation of profit
The Board of Directors proposes to the Annual General Meeting that a dividend of SEK 6.30 (6.00) per share, equal to MSEK 7 661 (7 305), be paid for the 2015 fiscal year. The dividend is proposed to be paid in two equal installments, the first with record date April 28, 2016 and the second with record date October 31, 2016. The pro-posed payment periods facilitate a more efficient cash management. It is also proposed that the balance of retained earnings after the dividend be retained in the business as described below.
SEK
Retained earnings including reserve for fair value 22 731 381 158
Profit for the year 11 736 771 934
34 468 153 092
The Board of Directors proposes that these earnings be appropriated as follows:
To the shareholders, a dividend of SEK 6.30 per share 7 661 405 569
To be retained in the business 26 806 747 523
Total 34 468 153 092
Shares and share capital
At year end, Atlas Copco’s share capital totaled MSEK 786 (786) and a total number of 1 229 613 104 shares divided into 839 394 096 class A shares and 390 219 008 class B shares were issued. Net of 13 123 103 class A shares and 393 879 class B shares held by Atlas Copco, 1 216 096 122 shares were outstanding. Class A shares entitle the owner to one vote while class B shares entitle the owner to one tenth of a vote. Class A shares and class B shares carry equal rights to a part of the company’s assets and profit.
Investor AB is the single largest shareholder in Atlas Copco AB. At year end 2015 Investor AB held a total of 206 895 611 shares, representing 22% of the votes and 17% of the capital.
There are no restrictions which prohibit the right to transfer shares of the Company nor is the Company aware of any such agree-ments. In addition, the Company is not party to any material agree-ment that enters into force or is changed or ceases to be valid if the control of the Company is changed as a result of a public takeover bid. There is no limitation on the number of votes that can be cast at a General Meeting of shareholders.
As prescribed by the Articles of Association, the General Meet-ing has sole authority for the election of Board members, and there are no other rules relating to election or dismissal of Board members or changes in the Articles of Association. Correspondingly, there are no agreements with Board members or employees regarding compensation in case of changes of current position reflecting a public takeover bid.
THE YEAR IN REVIEW – COMPRESSOR TECHNIQUE
20 Atlas Copco 2015 Administration report
COMPRESSOR TECHNIQUE
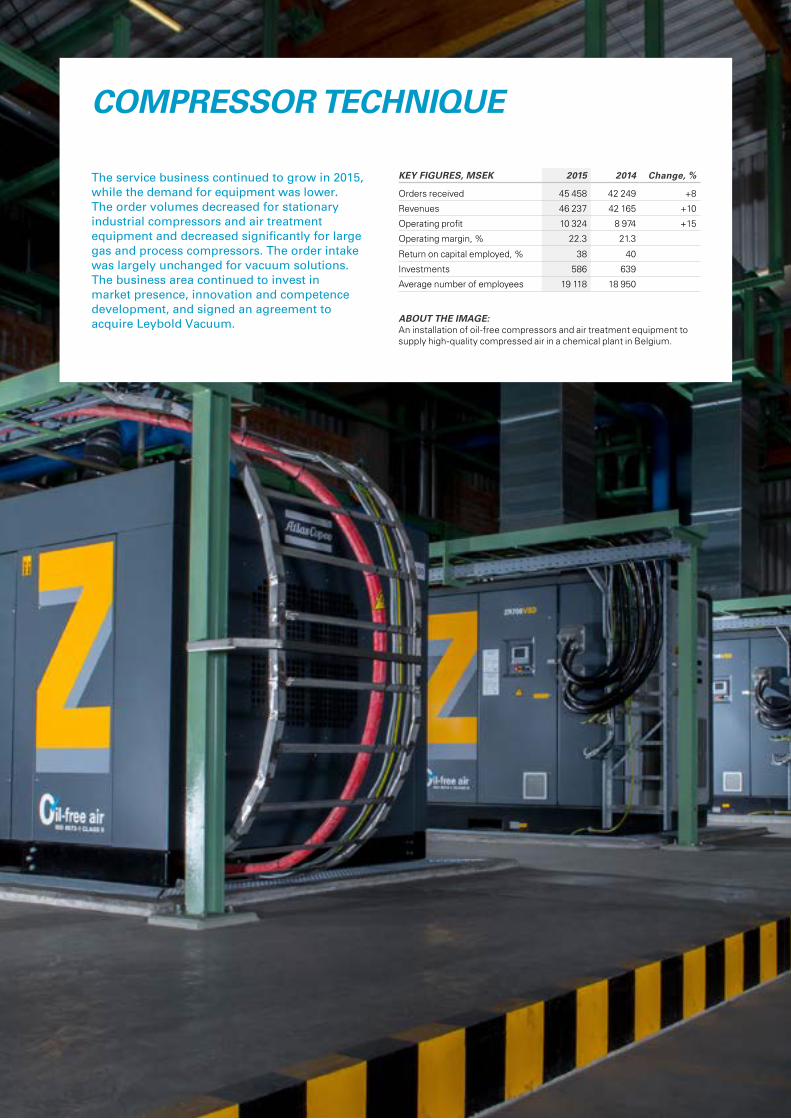
KEY FIGURES, MSEK 2015 2014 Change, %
Orders received 45 458 42 249 +8
Revenues 46 237 42 165 +10
Operating profit 10 324 8 974 +15
Operating margin, % 22.3 21.3
Return on capital employed, % 38 40
Investments 586 639
Average number of employees 19 118 18 950
The service business continued to grow in 2015, while the demand for equipment was lower. The order volumes decreased for stationary industrial compressors and air treatment equipment and decreased significantly for large gas and process compressors. The order intake was largely unchanged for vacuum solutions. The business area continued to invest in market presence, innovation and competence development, and signed an agreement to acquire Leybold Vacuum. ABOUT THE IMAGE:
An installation of oil-free compressors and air treatment equipment to supply high-quality compressed air in a chemical plant in Belgium.
THE YEAR IN REVIEW – COMPRESSOR TECHNIQUE
Administration report Atlas Copco 2015 21
Other, 10% Manufacturing, 44%
Construction, 8%
Service, 9%
Mining, 2% Process industry, 27%
ORDERS RECEIVED BY CUSTOMER CATEGORY
REVENUES BY REGION
Asia/Australia, 36%
NorthAmerica, 23%
Africa/Middle East, 7%
Europe, 29%South
America, 5%
Business development
The demand for the business area’s equip-ment and services was mixed during 2015. In total, the order intake decreased 3 % organi-cally. The service business continued to grow in all major markets while the orders received for equipment decreased as cus-tomers were hesitant to make investments. The order volumes decreased for stationary industrial compressors and air treatment equipment and decreased significantly for large gas and process compressors. Geo-graphically, orders for compressors decreased in all regions, most significantly in Asia. The demand from customers in the electronics and semiconductor industries remained robust and the order volumes were largely unchanged for vacuum solutions.
Market presence and organizational
development
Despite challenging market conditions, the business area continued to invest in market presence and in innovation. During 2015, additional investments were made in the vacuum solutions business, where the num-ber of employees in sales, marketing and research and development increased. In addition, a manufacturing facility for vac-uum and abatement solutions was built in Qingdao, China. Atlas Copco has invested about MSEK 330 in the state-of-the-art facility.
Acquisitions and divestments
The business area made five acquisitions in 2015 and one in January 2016:• Maes Compressoren N.V., a compressor
distributor in Belgium, with about 30 employees.
• Air Repair Sales and Services, a distribu-tor in Canada, with twelve employees.
• Applied Plasma Systems Co., Ltd. (Apsys), a manufacturer of abatement systems in Korea, with five employees.
• The U.S. vacuum pump service provider Innovative Vacuum Solutions Inc., with revenues of MSEK 32 and 19 employees.
• The U.S. compressor distributors Air Supply Systems and A1 with 37 employees.
• In January 2016, Capitol Research Equip-ment Inc., a U.S. parts and service pro-vider for vacuum pumps, was acquired. The company had revenues of about MSEK 22 and 15 employees.
SHARE OF REVENUES
Service, 38% Equipment, 62%
An agreement to acquire Leybold Vacuum, for a total enterprise value of MEUR 486 (MSEK 4 520) was signed in November. The business is headquartered in Cologne, Germany, has about 1 600 employees, and had revenues in 2014 of about MSEK 3 335. The acquisition is estimated to be completed in the first half of 2016.
In January 2016, Atlas Copco agreed to acquire FIAC, a manufacturer of piston compressors and related equipment, with a global sales network. The company had revenues in 2014 of about MSEK 640 and about 400 employees. The acquisition is expected to be completed during the first quarter of 2016.
Two businesses based in the United States were divested. JC Carter, which produces cryogenic submerged motor pumps, and Ortman Fluid Power, which manufactures hydraulic and pneumatic cylinders and valve actuators. The busi-nesses had 30 and 19 employees, respectively.
Revenues, profits and returns
Revenues increased 10 % to a record of MSEK 46 237 (42 165) with a strong contribution from currency. The revenues decreased 1% organically. Operating profit increased 15% to a record of MSEK 10 324 (8 974), corresponding to a margin of 22.3% (21.3). The operating profit was affected pos-itively by currency, but negatively by items affecting comparability of MSEK –55 (–180). These relate primarily to reduction of capacity in Cologne, Germany, due to weak demand for large compressors.
The adjusted operating margin was 22.4 % (21.7) supported by currency and a positive mix, but negatively impacted by lower equipment volumes. The return on capital employed was 38 % (40).
ORDERS RECEIVED, REVENUES AND OPERATING MARGIN
The year in review
0
9 000
18 000
27 000
36 000
45 000
20152014201320120
5
10
15
20
25MSEK %
0
20 000
40 000
60 000
80 000
100 000
201420132012201120100
5
10
15
20
25MSEK
Orders received, MSEK
%
Operating margin, %
Revenues, MSEK
• A range of oil-injected screw compressors. The range has an enhanced design that improves the performance up to 5% compared to the previous generation.
• The range of nitrogen generators was extended and upgraded. The range has top-end energy efficiency that ensures low cost of ownership and quick payback.
• A variable speed drive vacuum pump for general industrial applications. The pump, called GHS VSD+, delivers significant energy savings of around 50%.
• An upgraded range of industrial vacuum pumps. The range has a unique screw tech-nology and high efficiency drives, enabling advanced temperature control and long service intervals, and delivering best-in-class pumping speeds and low running costs.
• A range of compressed air filters, which combine two filtration processes in one product. The filters reduce pressure drops with 40% compared to traditional filter packages.
INNOVATION Several new products and solutions were introduced, including the following examples:
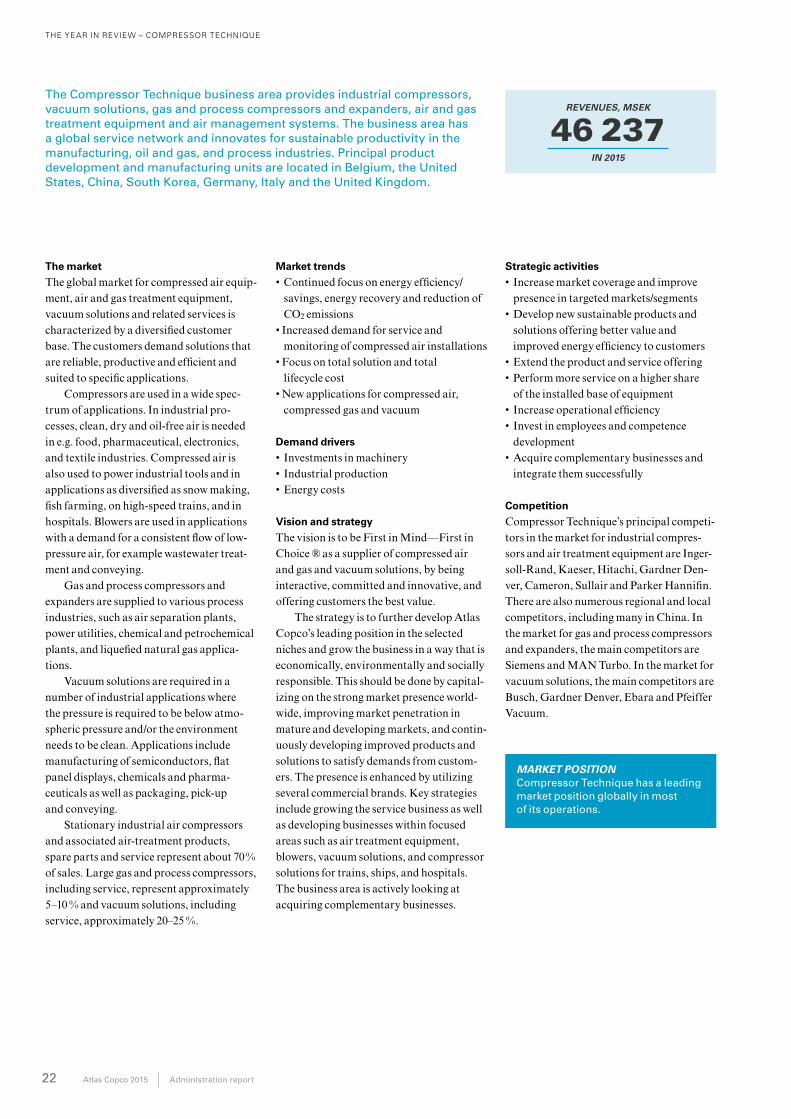
THE YEAR IN REVIEW – COMPRESSOR TECHNIQUE
22 Atlas Copco 2015 Administration report
The market
The global market for compressed air equip-ment, air and gas treatment equipment, vacuum solutions and related services is characterized by a diversified customer base. The customers demand solutions that are reliable, productive and efficient and suited to specific applications.
Compressors are used in a wide spec-trum of applications. In industrial pro-cesses, clean, dry and oil-free air is needed in e.g. food, pharmaceutical, electronics, and textile industries. Compressed air is also used to power industrial tools and in applications as diversified as snow making, fish farming, on high-speed trains, and in hospitals. Blowers are used in applications with a demand for a consistent flow of low-pressure air, for example waste water treat-ment and conveying.
Gas and process compressors and expanders are supplied to various process industries, such as air separation plants, power utilities, chemical and petro chemical plants, and liquefied natural gas applica-tions.
Vacuum solutions are required in a number of industrial applications where the pressure is required to be below atmo-spheric pressure and/or the environment needs to be clean. Applications include manufacturing of semiconductors, flat panel displays, chemicals and pharma-ceuticals as well as packaging, pick-up and conveying.
Stationary industrial air compressors and associated air-treatment products, spare parts and service represent about 70 % of sales. Large gas and process compressors, including service, represent approximately 5–10 % and vacuum solutions, including service, approximately 20–25 %.
Market trends
• Continued focus on energy efficiency/ savings, energy recovery and reduction of CO2 emissions
• Increased demand for service and monitoring of compressed air installations
• Focus on total solution and total lifecycle cost
• New applications for compressed air, compressed gas and vacuum
Demand drivers
• Investments in machinery• Industrial production• Energy costs
Vision and strategy
The vision is to be First in Mind—First in Choice ® as a supplier of compressed air and gas and vacuum solutions, by being interactive, committed and innovative, and offering customers the best value.
The strategy is to further develop Atlas Copco’s leading position in the selected niches and grow the business in a way that is economically, environmentally and socially responsible. This should be done by capital-izing on the strong market presence world-wide, improving market penetration in mature and developing markets, and contin-uously developing improved products and solutions to satisfy demands from custom-ers. The presence is enhanced by utilizing several commercial brands. Key strategies include growing the service business as well as developing businesses within focused areas such as air treatment equipment, blowers, vacuum solutions, and compressor solutions for trains, ships, and hospitals. The business area is actively looking at acquiring complementary businesses.
Strategic activities
• Increase market coverage and improve presence in targeted markets/segments
• Develop new sustainable products and solutions offering better value and improved energy efficiency to customers
• Extend the product and service offering• Perform more service on a higher share
of the installed base of equipment• Increase operational efficiency• Invest in employees and competence
development• Acquire complementary businesses and
integrate them successfully
Competition
Compressor Technique’s principal competi-tors in the market for industrial compres-sors and air treatment equipment are Inger-soll-Rand, Kaeser, Hitachi, Gardner Den-ver, Cameron, Sullair and Parker Hannifin. There are also numerous regional and local competitors, including many in China. In the market for gas and process compressors and expanders, the main com petitors are Siemens and MAN Turbo. In the market for vacuum solutions, the main competitors are Busch, Gardner Denver, Ebara and Pfeiffer Vacuum.
MARKET POSITION Compressor Technique has a leading market position globally in most of its operations.
The Compressor Technique business area provides industrial compressors, vacuum solutions, gas and process compressors and expanders, air and gas treatment equipment and air management systems. The business area has a global service network and innovates for sustainable productivity in the manufacturing, oil and gas, and process industries. Principal product development and manufacturing units are located in Belgium, the United States, China, South Korea, Germany, Italy and the United Kingdom.
REVENUES, MSEK
46 237IN 2015
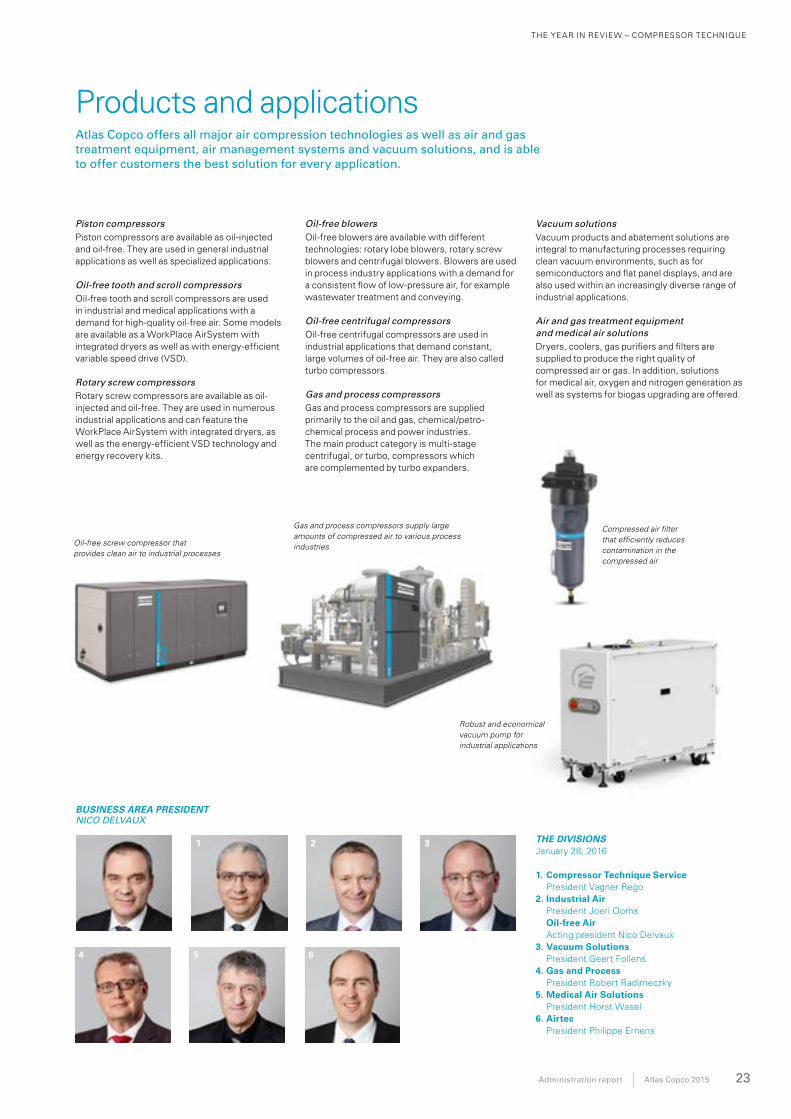
THE YEAR IN REVIEW – COMPRESSOR TECHNIQUE
Administration report Atlas Copco 2015 23
Products and applications
Piston compressors Piston compressors are available as oil-injected and oil-free. They are used in general industrial applications as well as specialized applications.
Oil-free tooth and scroll compressors Oil-free tooth and scroll compressors are used in industrial and medical applications with a demand for high-quality oil-free air. Some models are available as a WorkPlace AirSystem with integrated dryers as well as with energy-efficient variable speed drive (VSD).
Rotary screw compressors Rotary screw compressors are available as oil-injected and oil-free. They are used in numerous industrial applications and can feature the WorkPlace AirSystem with integrated dryers, as well as the energy-efficient VSD technology and energy recovery kits.
Oil-free blowers Oil-free blowers are available with different technologies: rotary lobe blowers, rotary screw blowers and centrifugal blowers. Blowers are used in process industry applications with a demand for a consistent flow of low-pressure air, for example wastewater treatment and conveying.
Oil-free centrifugal compressors Oil-free centrifugal compressors are used in industrial applications that demand constant, large volumes of oil-free air. They are also called turbo compressors.
Gas and process compressors Gas and process compressors are supplied primarily to the oil and gas, chemical/petro-chemical process and power industries. The main product category is multi-stage centrifugal, or turbo, compressors which are complemented by turbo expanders.
Vacuum solutions Vacuum products and abatement solutions are integral to manufacturing processes requiring clean vacuum environments, such as for semiconductors and flat panel displays, and are also used within an increasingly diverse range of industrial applications.
Air and gas treatment equipment and medical air solutionsDryers, coolers, gas purifiers and filters are supplied to produce the right quality of compressed air or gas. In addition, solutions for medical air, oxygen and nitrogen generation as well as systems for biogas upgrading are offered.
THE DIVISIONSJanuary 28, 2016
1. Compressor Technique Service President Vagner Rego
2. Industrial Air President Joeri Ooms
Oil-free Air Acting president Nico Delvaux3. Vacuum Solutions
President Geert Follens4. Gas and Process
President Robert Radimeczky5. Medical Air Solutions
President Horst Wasel6. Airtec President Philippe Ernens
Atlas Copco offers all major air compression technologies as well as air and gas treatment equipment, air management systems and vacuum solutions, and is able to offer customers the best solution for every application.
BUSINESS AREA PRESIDENT NICO DELVAUX
1 2
4 5 6
3
Gas and process compressors supply large amounts of compressed air to various process industries
Compressed air filter that efficiently reduces contamination in the compressed air
Oil-free screw compressor that provides clean air to industrial processes
Robust and economical vacuum pump for industrial applications
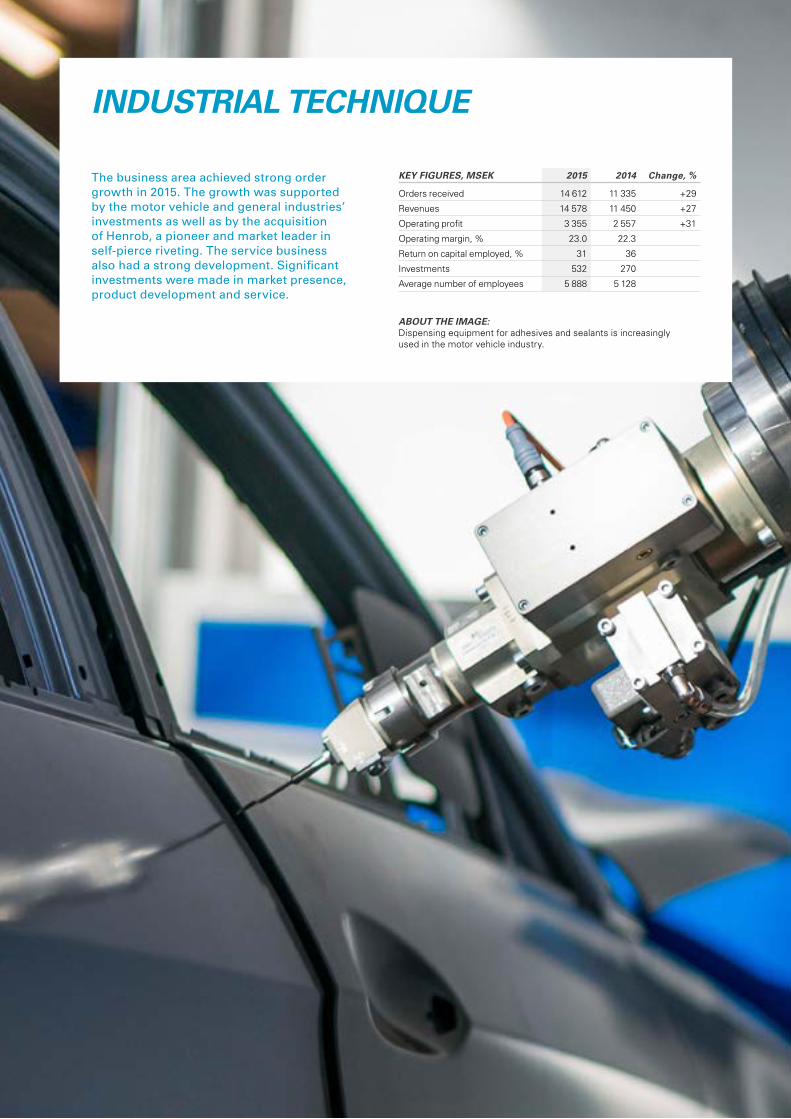
THE YEAR IN REVIEW – INDUSTRIAL TECHNIQUE
24 Atlas Copco 2015 Administration report
INDUSTRIAL TECHNIQUE
KEY FIGURES, MSEK 2015 2014 Change, %
Orders received 14 612 11 335 +29
Revenues 14 578 11 450 +27
Operating profit 3 355 2 557 +31
Operating margin, % 23.0 22.3
Return on capital employed, % 31 36
Investments 532 270
Average number of employees 5 888 5 128
The business area achieved strong order growth in 2015. The growth was supported by the motor vehicle and general industries’ investments as well as by the acquisition of Henrob, a pioneer and market leader in self-pierce riveting. The service business also had a strong development. Significant investments were made in market presence, product development and service.
ABOUT THE IMAGE: Dispensing equipment for adhesives and sealants is increasingly used in the motor vehicle industry.
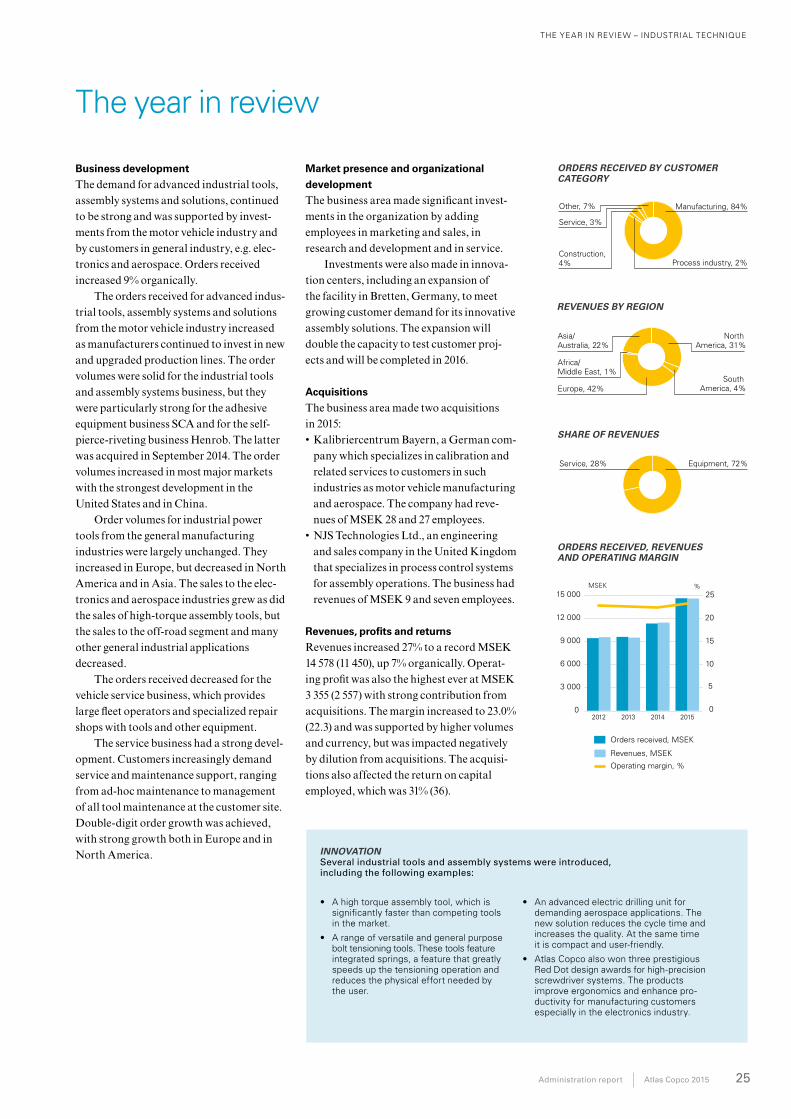
THE YEAR IN REVIEW – INDUSTRIAL TECHNIQUE
Administration report Atlas Copco 2015 25
Business development
The demand for advanced industrial tools, assembly systems and solutions, continued to be strong and was supported by invest-ments from the motor vehicle industry and by customers in general industry, e.g. elec-tronics and aerospace. Orders received increased 9% organically.
The orders received for advanced indus-trial tools, assembly systems and solutions from the motor vehicle industry increased as manufacturers continued to invest in new and upgraded production lines. The order volumes were solid for the industrial tools and assembly systems business, but they were particularly strong for the adhesive equipment business SCA and for the self-pierce-riveting business Henrob. The latter was acquired in September 2014. The order volumes increased in most major markets with the strongest development in the United States and in China.
Order volumes for industrial power tools from the general manufacturing industries were largely unchanged. They increased in Europe, but decreased in North America and in Asia. The sales to the elec-tronics and aerospace industries grew as did the sales of high-torque assembly tools, but the sales to the off-road segment and many other general industrial applications decreased.
The orders received decreased for the vehicle service business, which provides large fleet operators and specialized repair shops with tools and other equipment.
The service business had a strong devel-opment. Customers increasingly demand service and maintenance support, ranging from ad-hoc maintenance to management of all tool maintenance at the customer site. Double-digit order growth was achieved, with strong growth both in Europe and in North America.
Market presence and organizational
development
The business area made significant invest-ments in the organization by adding employees in marketing and sales, in research and development and in service.
Investments were also made in innova-tion centers, including an expansion of the facility in Bretten, Germany, to meet growing customer demand for its innovative assembly solutions. The expansion will double the capacity to test customer proj-ects and will be completed in 2016.
Acquisitions
The business area made two acquisitions in 2015:• Kalibriercentrum Bayern, a German com-
pany which specializes in calibration and related services to customers in such industries as motor vehicle manufacturing and aerospace. The company had reve-nues of MSEK 28 and 27 employees.
• NJS Technologies Ltd., an engineering and sales company in the United Kingdom that specializes in process control systems for assembly operations. The business had revenues of MSEK 9 and seven employees.
Revenues, profits and returns
Revenues increased 27% to a record MSEK 14 578 (11 450), up 7% organically. Operat-ing profit was also the highest ever at MSEK 3 355 (2 557) with strong contribution from acquisitions. The margin increased to 23.0% (22.3) and was supported by higher volumes and currency, but was impacted negatively by dilution from acquisitions. The acquisi-tions also affected the return on capital employed, which was 31% (36).
Other, 7% Manufacturing, 84%
Service, 3%
Process industry, 2%Construction, 4%
Asia/Australia, 22%
North America, 31%
Africa/Middle East, 1%
Europe, 42%South
America, 4%
Service, 28% Equipment, 72%
ORDERS RECEIVED BY CUSTOMER CATEGORY
REVENUES BY REGION
SHARE OF REVENUES
ORDERS RECEIVED, REVENUES AND OPERATING MARGIN
0
3 000
6 000
9 000
12 000
15 000
20152014201320120
5
10
15
20
25MSEK %
0
20 000
40 000
60 000
80 000
100 000
201520142013201220110
5
10
15
20
25MSEK
Orders received, MSEK
%
Operating margin, %
Revenues, MSEK
• A high torque assembly tool, which is significantly faster than competing tools in the market.
• A range of versatile and general purpose bolt tensioning tools. These tools feature integrated springs, a feature that greatly speeds up the tensioning operation and reduces the physical effort needed by the user.
• An advanced electric drilling unit for demanding aerospace applications. The new solution reduces the cycle time and increases the quality. At the same time it is compact and user-friendly.
• Atlas Copco also won three prestigious Red Dot design awards for high-precision screwdriver systems. The products im prove ergonomics and enhance pro-ductivity for manufacturing customers especially in the electronics industry.
INNOVATION Several industrial tools and assembly systems were introduced, including the following examples:
The year in review
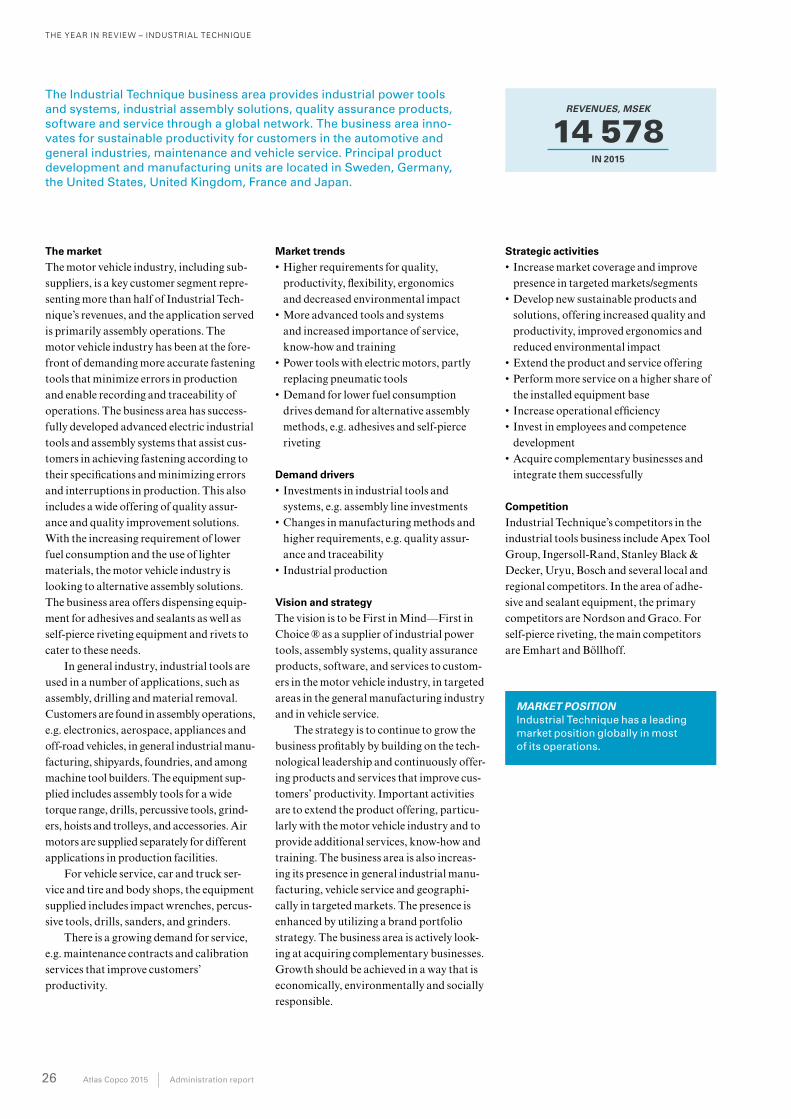
THE YEAR IN REVIEW – INDUSTRIAL TECHNIQUE
26 Atlas Copco 2015 Administration report
The market
The motor vehicle industry, including sub-suppliers, is a key customer segment repre-senting more than half of Industrial Tech-nique’s revenues, and the application served is primarily assembly operations. The motor vehicle industry has been at the fore-front of demanding more accurate fastening tools that minimize errors in production and enable recording and traceability of operations. The business area has success-fully developed advanced electric industrial tools and assembly systems that assist cus-tomers in achieving fastening according to their specifications and minimizing errors and interruptions in production. This also includes a wide offering of quality assur-ance and quality improvement solutions. With the increasing requirement of lower fuel consumption and the use of lighter materials, the motor vehicle industry is looking to alternative assembly solutions. The business area offers dispensing equip-ment for adhesives and sealants as well as self-pierce riveting equipment and rivets to cater to these needs.
In general industry, industrial tools are used in a number of applications, such as assembly, drilling and material removal. Customers are found in assembly operations, e.g. electronics, aerospace, appliances and off-road vehicles, in general industrial manu-facturing, shipyards, foundries, and among machine tool builders. The equipment sup-plied includes assembly tools for a wide torque range, drills, percussive tools, grind-ers, hoists and trolleys, and accessories. Air motors are supplied separately for different applications in production facilities.
For vehicle service, car and truck ser-vice and tire and body shops, the equipment supplied includes impact wrenches, percus-sive tools, drills, sanders, and grinders.
There is a growing demand for service, e.g. maintenance contracts and calibration services that improve customers’ productivity.
Market trends
• Higher requirements for quality, productivity, flexibility, ergonomics and decreased environmental impact
• More advanced tools and systems and increased importance of service, know-how and training
• Power tools with electric motors, partly replacing pneumatic tools
• Demand for lower fuel consumption drives demand for alternative assembly methods, e.g. adhesives and self-pierce riveting
Demand drivers
• Investments in industrial tools and systems, e.g. assembly line investments
• Changes in manufacturing methods and higher requirements, e.g. quality assur-ance and traceability
• Industrial production
Vision and strategy
The vision is to be First in Mind—First in Choice ® as a supplier of industrial power tools, assembly systems, quality assurance products, software, and services to custom-ers in the motor vehicle industry, in targeted areas in the general manufacturing industry and in vehicle service.
The strategy is to continue to grow the business profitably by building on the tech-nological leadership and continuously offer-ing pro ducts and services that improve cus-tomers’ productivity. Important activities are to extend the product offering, particu-larly with the motor vehicle industry and to provide additional services, know-how and training. The business area is also increas-ing its presence in general industrial manu-facturing, vehicle service and geographi-cally in targeted markets. The presence is enhanced by utilizing a brand portfolio strategy. The business area is actively look-ing at acquiring complementary businesses. Growth should be achieved in a way that is economically, environmentally and socially responsible.
Strategic activities
• Increase market coverage and improve presence in targeted markets/segments
• Develop new sustainable products and solutions, offering increased quality and productivity, improved ergonomics and reduced environmental impact
• Extend the product and service offering• Perform more service on a higher share of
the installed equipment base• Increase operational efficiency• Invest in employees and competence
development• Acquire complementary businesses and
integrate them successfully
Competition
Industrial Technique’s competitors in the industrial tools business include Apex Tool Group, Ingersoll-Rand, Stanley Black & Decker, Uryu, Bosch and several local and regional competitors. In the area of adhe-sive and sealant equipment, the primary competitors are Nordson and Graco. For self-pierce riveting, the main competitors are Emhart and Böllhoff.
MARKET POSITION Industrial Technique has a leading market position globally in most of its operations.
The Industrial Technique business area provides industrial power tools and systems, industrial assembly solutions, quality assurance products, software and service through a global network. The business area inno-vates for sustainable productivity for customers in the automotive and general industries, maintenance and vehicle service. Principal product development and manufacturing units are located in Sweden, Germany, the United States, United Kingdom, France and Japan.
REVENUES, MSEK
14 578IN 2015
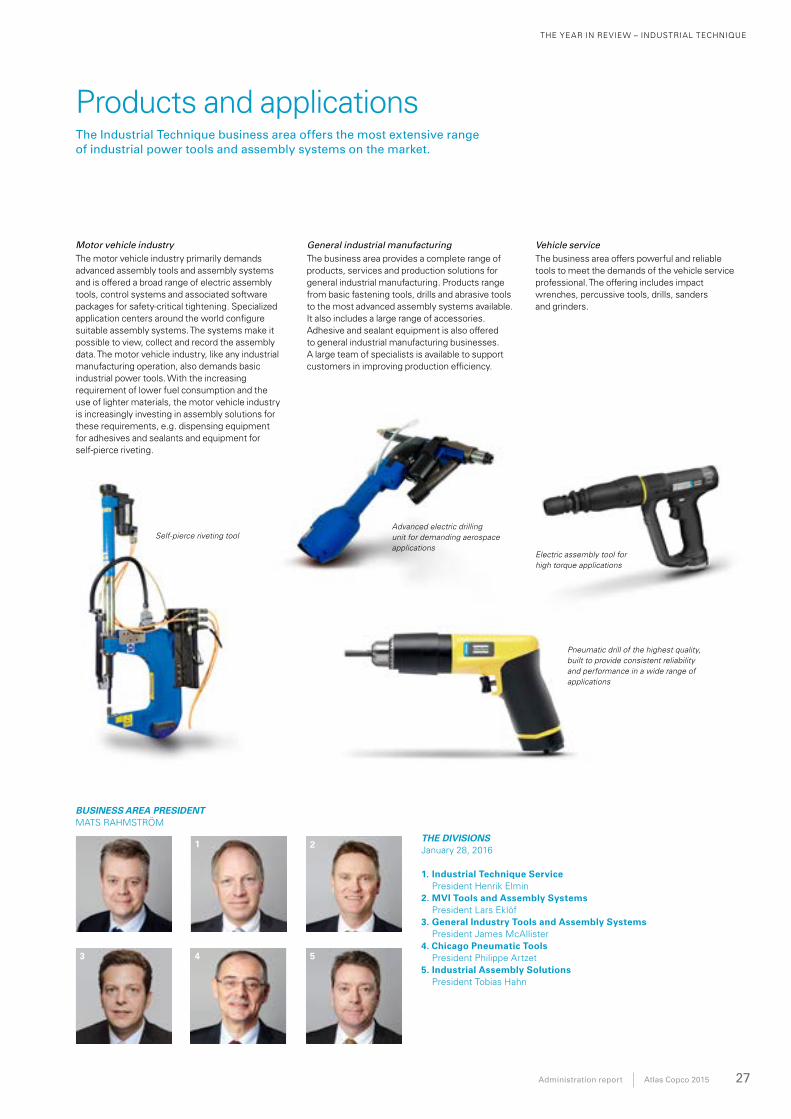
THE YEAR IN REVIEW – INDUSTRIAL TECHNIQUE
Administration report Atlas Copco 2015 27
Products and applications
THE DIVISIONSJanuary 28, 2016
1. Industrial Technique Service President Henrik Elmin
2. MVI Tools and Assembly Systems President Lars Eklöf
3. General Industry Tools and Assembly Systems President James McAllister
4. Chicago Pneumatic Tools President Philippe Artzet
5. Industrial Assembly Solutions President Tobias Hahn
The Industrial Technique business area offers the most extensive range of industrial power tools and assembly systems on the market.
BUSINESS AREA PRESIDENT MATS RAHMSTRÖM
2
4 5
1
3
Pneumatic drill of the highest quality, built to provide consistent reliability and performance in a wide range of applications
Self-pierce riveting toolAdvanced electric drilling unit for demanding aerospace applications
Electric assembly tool for high torque applications
Motor vehicle industryThe motor vehicle industry primarily demands advanced assembly tools and assembly systems and is offered a broad range of electric assembly tools, control systems and associated software packages for safety-critical tightening. Specialized application centers around the world configure suitable assembly systems. The systems make it possible to view, collect and record the assembly data. The motor vehicle industry, like any industrial manufacturing operation, also demands basic industrial power tools. With the increasing requirement of lower fuel consumption and the use of lighter materials, the motor vehicle industry is increasingly investing in assembly solutions for these requirements, e.g. dispensing equipment for adhesives and sealants and equipment for self-pierce riveting.
General industrial manufacturing The business area provides a complete range of products, services and production solutions for general industrial manufacturing. Products range from basic fastening tools, drills and abrasive tools to the most advanced assembly systems available. It also includes a large range of accessories. Adhesive and sealant equipment is also offered to general industrial manufacturing businesses. A large team of specialists is available to support customers in improving production efficiency.
Vehicle serviceThe business area offers powerful and reliable tools to meet the demands of the vehicle service professional. The offering includes impact wrenches, percussive tools, drills, sanders and grinders.
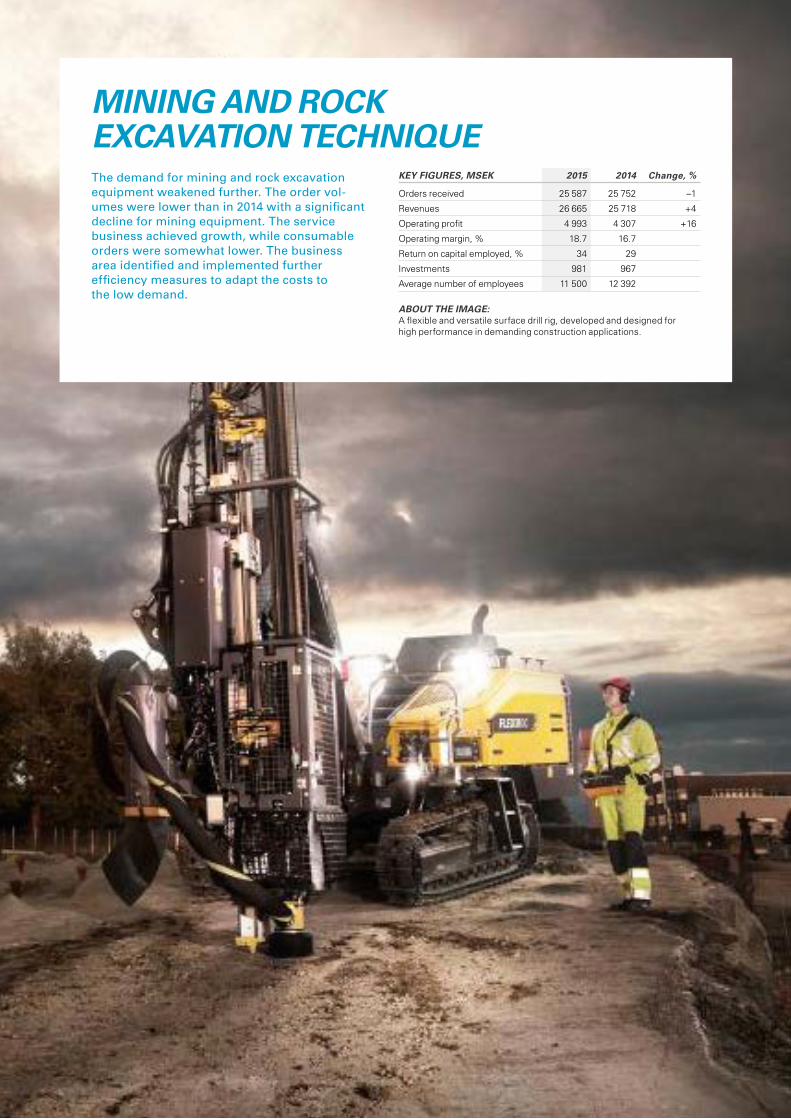
MINING AND ROCK EXCAVATION TECHNIQUE – THE YEAR IN REVIEW
28 Atlas Copco 2015 Administration report
MINING AND ROCK EXCAVATION TECHNIQUE
KEY FIGURES, MSEK 2015 2014 Change, %
Orders received 25 587 25 752 –1
Revenues 26 665 25 718 +4
Operating profit 4 993 4 307 +16
Operating margin, % 18.7 16.7
Return on capital employed, % 34 29
Investments 981 967
Average number of employees 11 500 12 392
The demand for mining and rock excavation equipment weakened further. The order vol-umes were lower than in 2014 with a significant decline for mining equipment. The service business achieved growth, while consumable orders were somewhat lower. The business area identified and implemented further efficiency measures to adapt the costs to the low demand.
ABOUT THE IMAGE:A flexible and versatile surface drill rig, developed and designed for high performance in demanding construction applications.
MINING AND ROCK EXCAVATION TECHNIQUE – THE YEAR IN REVIEW
Administration report Atlas Copco 2015 29
Business development
The demand for equipment from customers in the mining industry remained weak as customers made low investments in capital equipment. The order volumes decreased for all types of underground and surface equipment both compared to the previous year and during the year. Geographically, the order intake increased in Europe with a positive development in Russia and Sweden, but decreased in all other regions, most sig-nificantly in Australia and South America.
The order intake for equipment for infrastructure projects also decreased, which affected both underground and surface drilling rigs. The order volumes were somewhat better in Europe, but were negative in all other regions.
The sales of consumables decreased and volumes were lower in all regions except Europe and Africa/Middle East. The sales were negatively impacted by lower activity in mine development and civil engineering.
Demand for service and spare parts remained robust despite the tough market conditions. Order volumes increased in Europe, South America and Africa/Middle East, they were stable in North America, while they had a negative development in Asia and Australia.
In total, the order intake decreased by 7% organically.
Organizational development
The business area continued to identify and implement further efficiency measures in order to strengthen the operations for the future, including consolidation of some manufacturing facilities and further ratio-nalization measures. The workforce was further reduced, mostly in manufacturing, but also in other functions such as sales, service and administration.
The mobile crushing and screening business, with manufacturing in Austria, was discontinued during the year. The busi-ness had about 70 employees and revenues in 2014 of about MSEK 255.
Revenues, profits and returns
Revenues increased 4% to MSEK 26 665 (25 718) with strong support from currency. This corresponds to 3% organic decline. Operating profit increased 16% to MSEK 4 993 (4 307), corresponding to a margin of 18.7% (16.7). The profit included restruc-turing and other items affecting compara-bility of MSEK –65 (–415) and the adjusted operating margin increased to 19.0% (18.4). The margin was supported by currency and revenue mix, but impacted negatively by lower volumes. Return on capital employed was 34% (29).
ORDERS RECEIVED BY CUSTOMER CATEGORY
REVENUES BY REGION
SHARE OF REVENUES
ORDERS RECEIVED, REVENUES AND OPERATING MARGIN
0
7 000
14 000
21 000
28 000
35 000
20152014201320120
5
10
15
20
25MSEK %
0
20 000
40 000
60 000
80 000
100 000
201520142013201220110
5
10
15
20
25MSEK
Orders received, MSEK
%
Operating margin, %
Revenues, MSEK
The year in review
Process industry, 1%
Mining, 68%
Construction, 31%
Asia/Australia, 24%
North America, 24%
Africa/Middle East, 16%
Europe, 21%South
America,15%
Service(consumables) 24%
Equipment, 31%
Service, 45%
• A unique remote operator station that enables operators to do their job from a safe distance. The station can handle up to three surface drill rigs in parallel, which multiplies the operator efficiency.
• A range of drill bits with greatly increased service life. Depending on rock type, service life is up to 75% better than the competition.
• A surface drill rig for construction applica-tions and small quarries. The rig meets the demands for speed and efficiency in drilling small and medium-sized holes and is equipped with a Tier 4 low emissions engine and a system that eliminates oil leakages.
• A low pressure rock drill for surface drilling applications. It is intended for customers whose top priority is to operate a reliable rock drill with consistent performance.
• An exploration drilling rig with an advanced control system that enables automatic func-tions such as drilling and rod handling. The automatic functions are not only increasing the safety for the operator, it also improves the working environment and increases the productivity.
INNOVATION Several new products and solutions were introduced, including the following examples:
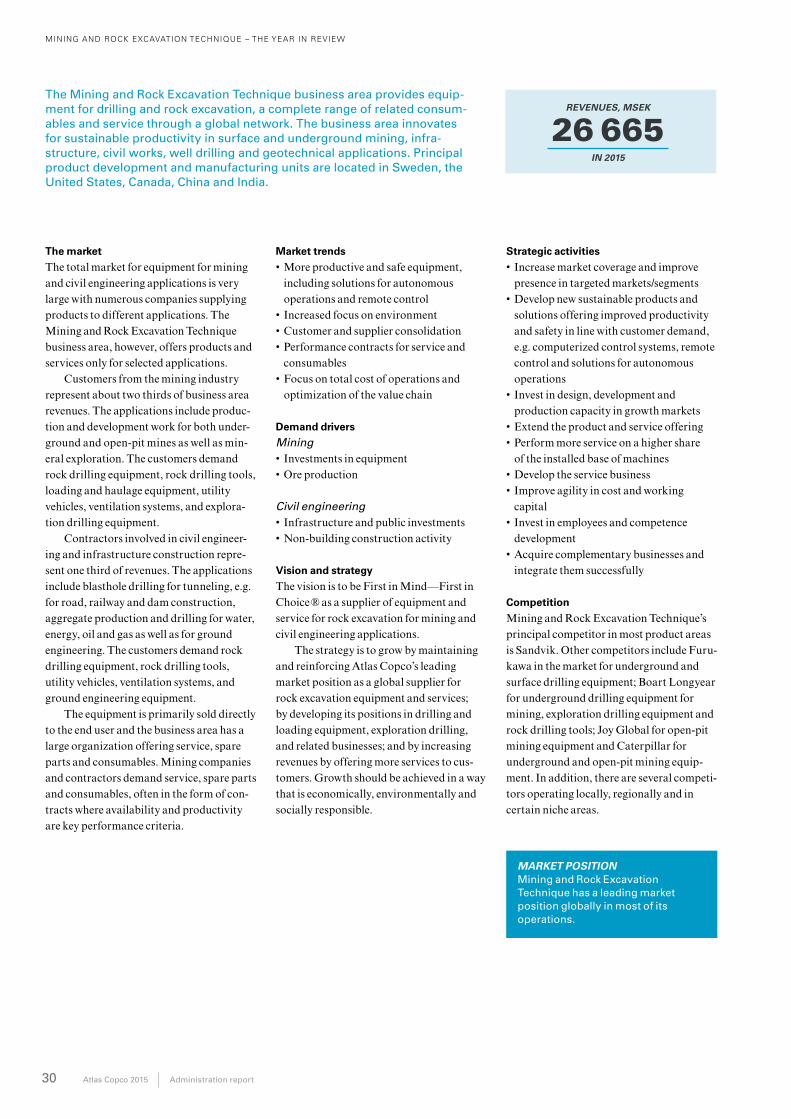
MINING AND ROCK EXCAVATION TECHNIQUE – THE YEAR IN REVIEW
30 Atlas Copco 2015 Administration report
The market
The total market for equipment for mining and civil engineering applications is very large with numerous companies supplying products to different applications. The Mining and Rock Excavation Technique business area, however, offers products and services only for selected applications.
Customers from the mining industry represent about two thirds of business area revenues. The applications include produc-tion and development work for both under-ground and open-pit mines as well as min-eral exploration. The customers demand rock drilling equipment, rock drilling tools, loading and haulage equipment, utility vehicles, ventilation systems, and explora-tion drilling equipment.
Contractors involved in civil engineer-ing and infrastructure construction repre-sent one third of revenues. The applications include blasthole drilling for tunneling, e.g. for road, railway and dam construction, aggregate production and drilling for water, energy, oil and gas as well as for ground engineering. The customers demand rock drilling equipment, rock drilling tools, utility vehicles, ventilation systems, and ground engineering equipment.
The equipment is primarily sold directly to the end user and the business area has a large organization offering service, spare parts and consumables. Mining companies and contractors demand service, spare parts and consumables, often in the form of con-tracts where availability and productivity are key performance criteria.
Market trends
• More productive and safe equipment, including solutions for autonomous operations and remote control
• Increased focus on environment• Customer and supplier consolidation• Performance contracts for service and
consumables• Focus on total cost of operations and
optimization of the value chain
Demand drivers
Mining• Investments in equipment• Ore production
Civil engineering• Infrastructure and public investments• Non-building construction activity
Vision and strategy
The vision is to be First in Mind—First in Choice ® as a supplier of equipment and service for rock excavation for mining and civil engineering applications.
The strategy is to grow by maintaining and reinforcing Atlas Copco’s leading market position as a global supplier for rock excavation equipment and services; by developing its positions in drilling and loading equipment, exploration drilling, and related businesses; and by increasing revenues by offering more services to cus-tomers. Growth should be achieved in a way that is economically, environmentally and socially responsible.
Strategic activities
• Increase market coverage and improve presence in targeted markets/segments
• Develop new sustainable products and solutions offering improved productivity and safety in line with customer demand, e.g. computerized control systems, remote control and solutions for autonomous operations
• Invest in design, development and production capacity in growth markets
• Extend the product and service offering• Perform more service on a higher share
of the installed base of machines• Develop the service business• Improve agility in cost and working
capital• Invest in employees and competence
development• Acquire complementary businesses and
integrate them successfully
Competition
Mining and Rock Excavation Technique’s principal competitor in most product areas is Sandvik. Other competitors include Furu-kawa in the market for underground and surface drilling equipment; Boart Longyear for underground drilling equipment for mining, exploration drilling equipment and rock drilling tools; Joy Global for open-pit mining equipment and Caterpillar for underground and open-pit mining equip-ment. In addition, there are several competi-tors operating locally, regionally and in certain niche areas.
MARKET POSITION Mining and Rock Excavation Technique has a leading market position globally in most of its operations.
The Mining and Rock Excavation Technique business area provides equip-ment for drilling and rock excavation, a complete range of related consum-ables and service through a global network. The business area innovates for sustainable productivity in surface and underground mining, infra-structure, civil works, well drilling and geotechnical applications. Principal product development and manufacturing units are located in Sweden, the United States, Canada, China and India.
REVENUES, MSEK
26 665IN 2015
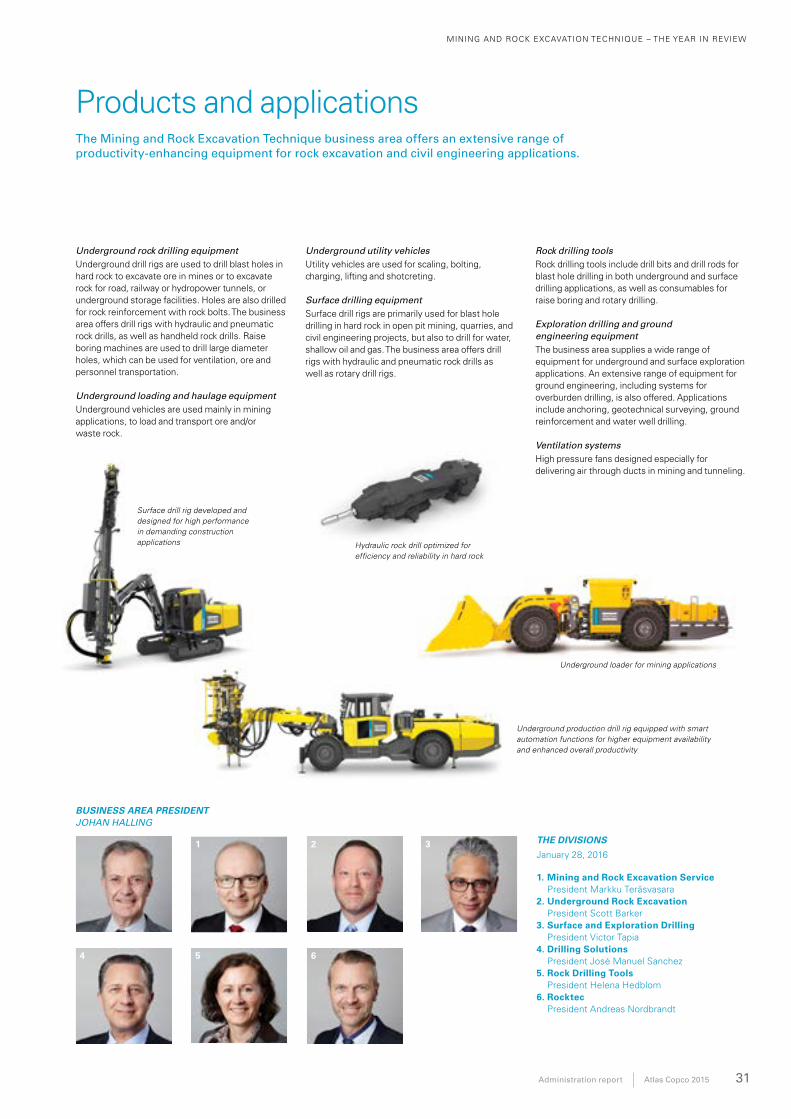
MINING AND ROCK EXCAVATION TECHNIQUE – THE YEAR IN REVIEW
Administration report Atlas Copco 2015 31
Products and applications
THE DIVISIONS
January 28, 2016
1. Mining and Rock Excavation Service President Markku Teräsvasara
2. Underground Rock Excavation President Scott Barker
3. Surface and Exploration Drilling President Victor Tapia
4. Drilling Solutions President José Manuel Sanchez
5. Rock Drilling Tools President Helena Hedblom
6. Rocktec President Andreas Nordbrandt
BUSINESS AREA PRESIDENT JOHAN HALLING
The Mining and Rock Excavation Technique business area offers an extensive range of productivity-enhancing equipment for rock excavation and civil engineering applications.
Surface drill rig developed and designed for high performance in demanding construction applications Hydraulic rock drill optimized for
efficiency and reliability in hard rock
Underground loader for mining applications
Underground production drill rig equipped with smart automation functions for higher equipment availability and enhanced overall productivity
Underground rock drilling equipmentUnderground drill rigs are used to drill blast holes in hard rock to excavate ore in mines or to excavate rock for road, railway or hydropower tunnels, or underground storage facilities. Holes are also drilled for rock reinforcement with rock bolts. The business area offers drill rigs with hydraulic and pneumatic rock drills, as well as handheld rock drills. Raise boring machines are used to drill large diameter holes, which can be used for ventilation, ore and personnel transportation.
Underground loading and haulage equipmentUnderground vehicles are used mainly in mining applications, to load and transport ore and/or waste rock.
Underground utility vehiclesUtility vehicles are used for scaling, bolting, charging, lifting and shotcreting.
Surface drilling equipmentSurface drill rigs are primarily used for blast hole drilling in hard rock in open pit mining, quarries, and civil engineering projects, but also to drill for water, shallow oil and gas. The business area offers drill rigs with hydraulic and pneumatic rock drills as well as rotary drill rigs.
Rock drilling toolsRock drilling tools include drill bits and drill rods for blast hole drilling in both underground and surface drilling applications, as well as consumables for raise boring and rotary drilling.
Exploration drilling and ground engineering equipmentThe business area supplies a wide range of equipment for underground and surface exploration applications. An extensive range of equipment for ground engineering, including systems for overburden drilling, is also offered. Applications include anchoring, geotechnical surveying, ground reinforcement and water well drilling.
Ventilation systemsHigh pressure fans designed especially for delivering air through ducts in mining and tunneling.
1
4
2
5
3
6
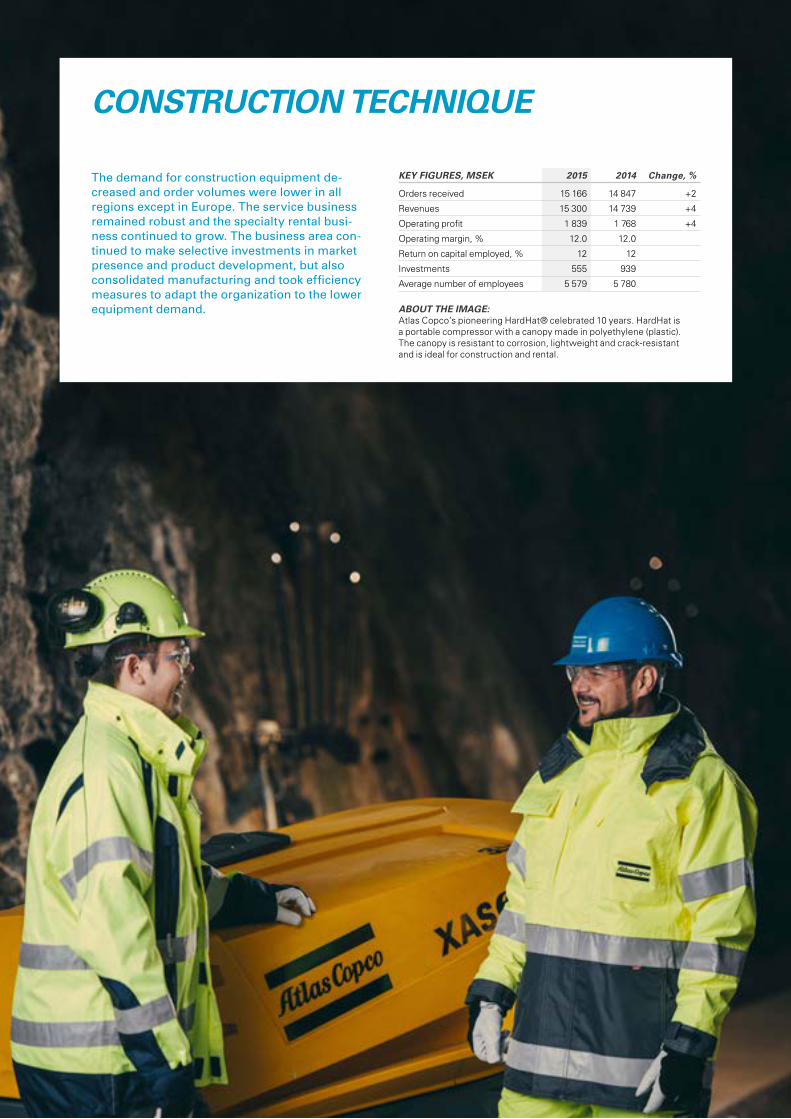
THE YEAR IN REVIEW – CONSTRUCTION TECHNIQUE
32 Atlas Copco 2015 Administration report
CONSTRUCTION TECHNIQUE
KEY FIGURES, MSEK 2015 2014 Change, %
Orders received 15 166 14 847 +2
Revenues 15 300 14 739 +4
Operating profit 1 839 1 768 +4
Operating margin, % 12.0 12.0
Return on capital employed, % 12 12
Investments 555 939
Average number of employees 5 579 5 780
The demand for construction equipment decreased and order volumes were lower in all regions except in Europe. The service business remained robust and the specialty rental business continued to grow. The business area continued to make selective investments in market presence and product development, but also consolidated manufacturing and took efficiency measures to adapt the organization to the lower equipment demand. ABOUT THE IMAGE:
Atlas Copco’s pioneering HardHat® celebrated 10 years. HardHat is a portable compressor with a canopy made in polyethylene (plastic). The canopy is resistant to corrosion, lightweight and crack-resistant and is ideal for construction and rental.
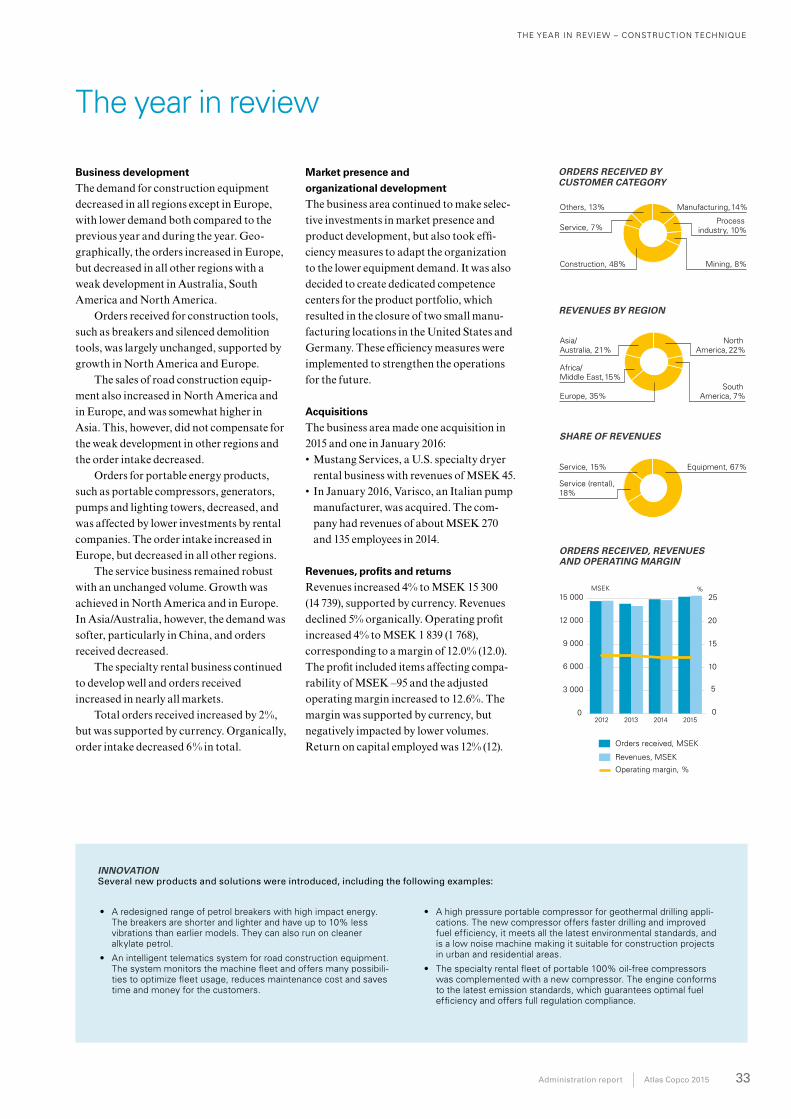
THE YEAR IN REVIEW – CONSTRUCTION TECHNIQUE
Administration report Atlas Copco 2015 33
ORDERS RECEIVED BY CUSTOMER CATEGORY
REVENUES BY REGION
Business development
The demand for construction equipment decreased in all regions except in Europe, with lower demand both compared to the previous year and during the year. Geo-graphically, the orders increased in Europe, but decreased in all other regions with a weak development in Australia, South America and North America.
Orders received for construction tools, such as breakers and silenced demolition tools, was largely unchanged, supported by growth in North America and Europe.
The sales of road construction equip-ment also increased in North America and in Europe, and was somewhat higher in Asia. This, however, did not compensate for the weak development in other regions and the order intake decreased.
Orders for portable energy products, such as portable compressors, generators, pumps and lighting towers, decreased, and was affected by lower investments by rental companies. The order intake increased in Europe, but decreased in all other regions.
The service business remained robust with an unchanged volume. Growth was achieved in North America and in Europe. In Asia/Australia, however, the demand was softer, particularly in China, and orders received decreased.
The specialty rental business continued to develop well and orders received increased in nearly all markets.
Total orders received increased by 2%, but was supported by currency. Organically, order intake decreased 6% in total.
Market presence and
organizational development
The business area continued to make selec-tive investments in market presence and product development, but also took effi-ciency measures to adapt the organization to the lower equipment demand. It was also decided to create dedicated competence centers for the product portfolio, which resulted in the closure of two small manu-facturing locations in the United States and Germany. These efficiency measures were implemented to strengthen the operations for the future.
Acquisitions
The business area made one acquisition in 2015 and one in January 2016:• Mustang Services, a U.S. specialty dryer
rental business with revenues of MSEK 45.• In January 2016, Varisco, an Italian pump
manufacturer, was acquired. The com-pany had revenues of about MSEK 270 and 135 employees in 2014.
Revenues, profits and returns
Revenues increased 4% to MSEK 15 300 (14 739), supported by currency. Revenues declined 5% organically. Operating profit increased 4% to MSEK 1 839 (1 768), corresponding to a margin of 12.0% (12.0). The profit included items affecting compa-rability of MSEK –95 and the adjusted operating margin increased to 12.6%. The margin was supported by currency, but negatively impacted by lower volumes. Return on capital employed was 12% (12).
SHARE OF REVENUES
ORDERS RECEIVED, REVENUES AND OPERATING MARGIN
The year in review
0
3 000
6 000
9 000
12 000
15 000
20152014201320120
5
10
15
20
25MSEK %
0
20 000
40 000
60 000
80 000
100 000
201520142013201220110
5
10
15
20
25MSEK
Orders received, MSEK
%
Operating margin, %
Revenues, MSEK
• A redesigned range of petrol breakers with high impact energy. The breakers are shorter and lighter and have up to 10% less vibrations than earlier models. They can also run on cleaner alkylate petrol.
• An intelligent telematics system for road construction equipment. The system monitors the machine fleet and offers many possibili-ties to optimize fleet usage, reduces maintenance cost and saves time and money for the customers.
• A high pressure portable compressor for geothermal drilling appli-cations. The new compressor offers faster drilling and improved fuel efficiency, it meets all the latest environmental standards, and is a low noise machine making it suitable for construction projects in urban and residential areas.
• The specialty rental fleet of portable 100% oil-free compressors was complemented with a new compressor. The engine conforms to the latest emission standards, which guarantees optimal fuel efficiency and offers full regulation compliance.
INNOVATION Several new products and solutions were introduced, including the following examples:
Manufacturing, 14%Others, 13%
Construction, 48%
Service, 7%
Mining, 8%
Process industry, 10%
Asia/Australia, 21%
North America, 22%
Africa/Middle East, 15%
Europe, 35%South
America, 7%
Service, 15% Equipment, 67%
Service (rental), 18%
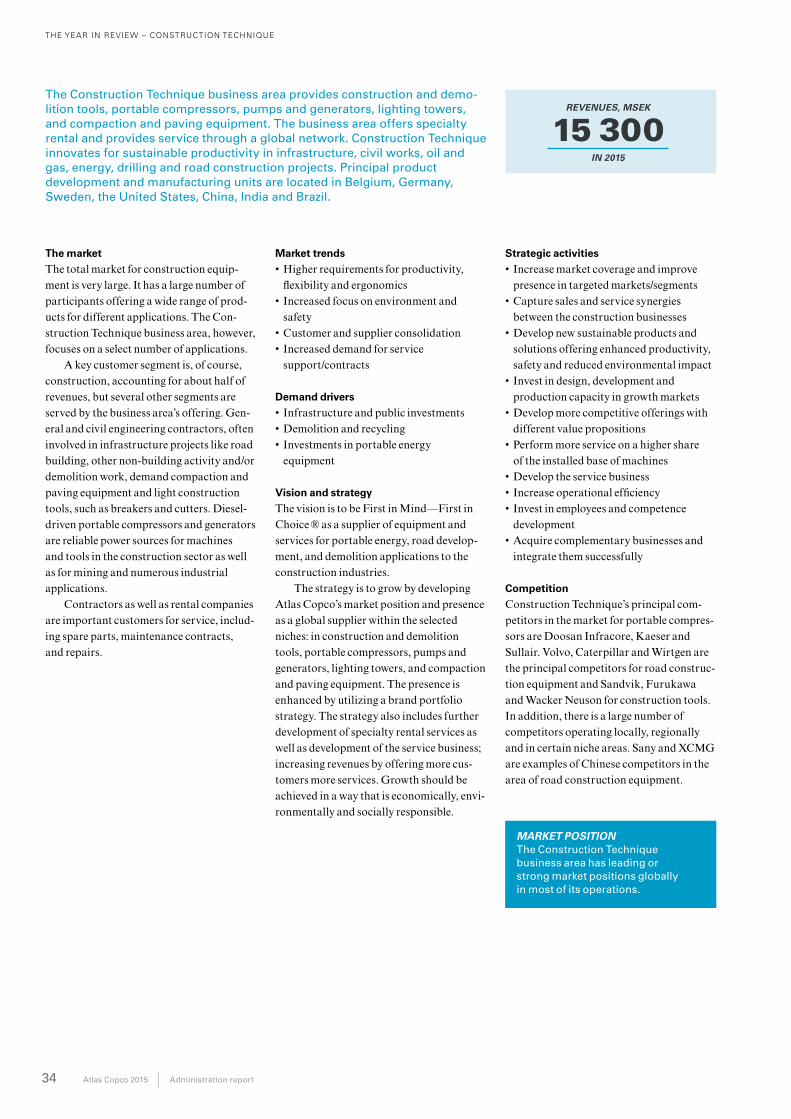
THE YEAR IN REVIEW – CONSTRUCTION TECHNIQUE
34 Atlas Copco 2015 Administration report
The market
The total market for construction equip-ment is very large. It has a large number of participants offering a wide range of prod-ucts for different applications. The Con-struction Technique business area, however, focuses on a select number of applications.
A key customer segment is, of course, construction, accounting for about half of revenues, but several other segments are served by the business area’s offering. Gen-eral and civil engineering contractors, often involved in infrastructure projects like road building, other non-building activity and/or demolition work, demand compaction and paving equipment and light construction tools, such as breakers and cutters. Diesel-driven portable compressors and generators are reliable power sources for machines and tools in the construction sector as well as for mining and numerous industrial applications.
Contractors as well as rental companies are important customers for service, includ-ing spare parts, maintenance contracts, and repairs.
Market trends
• Higher requirements for productivity, flexibility and ergonomics
• Increased focus on environment and safety
• Customer and supplier consolidation• Increased demand for service
support/contracts
Demand drivers
• Infrastructure and public investments• Demolition and recycling• Investments in portable energy
equipment
Vision and strategy
The vision is to be First in Mind—First in Choice ® as a supplier of equipment and services for portable energy, road develop-ment, and demolition applications to the construction industries.
The strategy is to grow by developing Atlas Copco’s market position and presence as a global supplier within the selected niches: in construction and demolition tools, portable compressors, pumps and generators, lighting towers, and compaction and paving equipment. The presence is enhanced by utilizing a brand portfolio strategy. The strategy also includes further development of specialty rental services as well as development of the service business; increasing revenues by offering more cus-tomers more services. Growth should be achieved in a way that is economically, envi-ronmentally and socially responsible.
Strategic activities
• Increase market coverage and improve presence in targeted markets/segments
• Capture sales and service synergies between the construction businesses
• Develop new sustainable products and solutions offering enhanced productivity, safety and reduced environmental impact
• Invest in design, development and production capacity in growth markets
• Develop more competitive offerings with different value propositions
• Perform more service on a higher share of the installed base of machines
• Develop the service business• Increase operational efficiency• Invest in employees and competence
development• Acquire complementary businesses and
integrate them successfully
Competition
Construction Technique’s principal com-petitors in the market for portable compres-sors are Doosan Infracore, Kaeser and Sullair. Volvo, Caterpillar and Wirtgen are the principal competitors for road construc-tion equipment and Sandvik, Furukawa and Wacker Neuson for construction tools. In addition, there is a large number of competitors operating locally, regionally and in certain niche areas. Sany and XCMG are examples of Chinese competitors in the area of road construction equipment.
MARKET POSITION The Construction Technique business area has leading or strong market positions globally in most of its operations.
The Construction Technique business area provides construction and demolition tools, portable compressors, pumps and generators, lighting towers, and compaction and paving equipment. The business area offers specialty rental and provides service through a global network. Construction Technique innovates for sustainable productivity in infrastructure, civil works, oil and gas, energy, drilling and road construction projects. Principal product development and manufacturing units are located in Belgium, Germany, Sweden, the United States, China, India and Brazil.
REVENUES, MSEK
15 300IN 2015
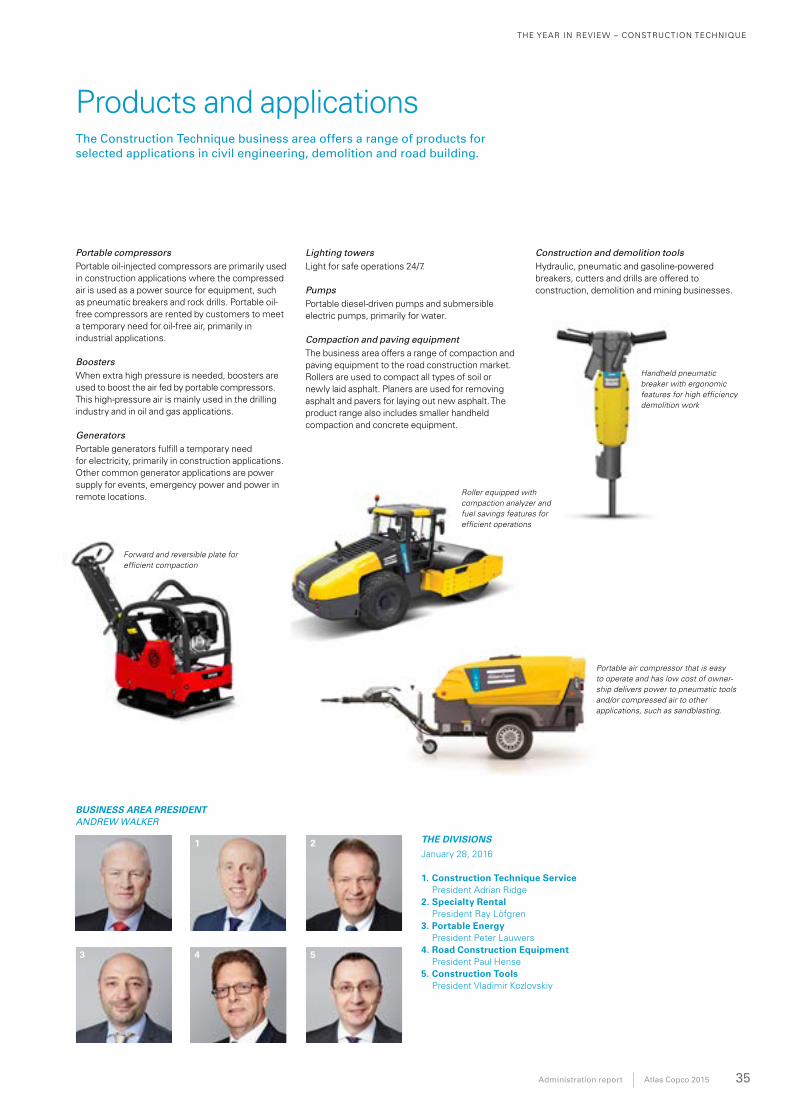
THE YEAR IN REVIEW – CONSTRUCTION TECHNIQUE
Administration report Atlas Copco 2015 35
Products and applications
THE DIVISIONS
January 28, 2016
1. Construction Technique Service President Adrian Ridge
2. Specialty Rental President Ray Löfgren
3. Portable Energy President Peter Lauwers
4. Road Construction Equipment President Paul Hense
5. Construction Tools President Vladimir Kozlovskiy
The Construction Technique business area offers a range of products for selected applications in civil engineering, demolition and road building.
BUSINESS AREA PRESIDENT ANDREW WALKER
1
3 4 5
2
Portable compressorsPortable oil-injected compressors are primarily used in construction applications where the compressed air is used as a power source for equipment, such as pneumatic breakers and rock drills. Portable oil-free compressors are rented by customers to meet a temporary need for oil-free air, primarily in industrial applications.
Boosters When extra high pressure is needed, boosters are used to boost the air fed by portable compressors. This high-pressure air is mainly used in the drilling industry and in oil and gas applications.
GeneratorsPortable generators fulfill a temporary need for electricity, primarily in construction applications. Other common generator applications are power supply for events, emergency power and power in remote locations.
Lighting towersLight for safe operations 24/7.
PumpsPortable diesel-driven pumps and submersible electric pumps, primarily for water.
Compaction and paving equipmentThe business area offers a range of compaction and paving equipment to the road construction market. Rollers are used to compact all types of soil or newly laid asphalt. Planers are used for removing asphalt and pavers for laying out new asphalt. The product range also includes smaller handheld compaction and concrete equipment.
Construction and demolition toolsHydraulic, pneumatic and gasoline-powered breakers, cutters and drills are offered to construction, demolition and mining businesses.
Forward and reversible plate for efficient compaction
Portable air compressor that is easy to operate and has low cost of owner-ship delivers power to pneumatic tools and/or compressed air to other applications, such as sandblasting.
Handheld pneumatic breaker with ergonomic features for high efficiency demolition work
Roller equipped with compaction analyzer and fuel savings features for efficient operations
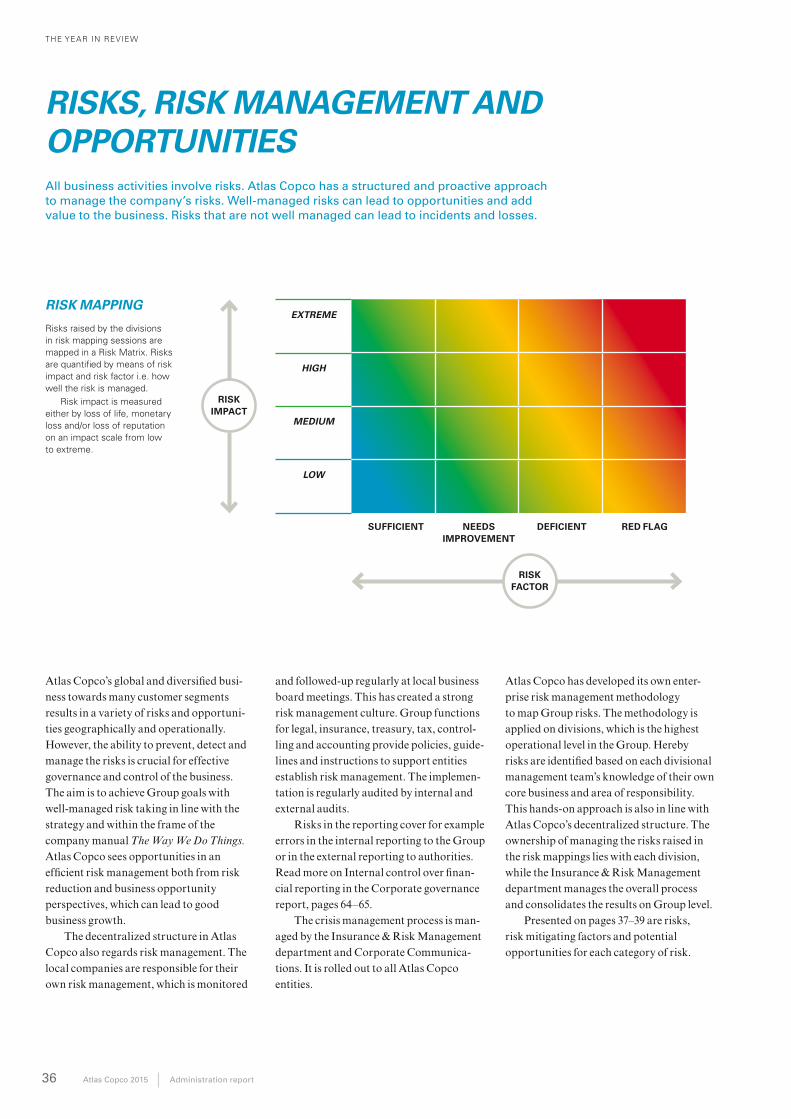
THE YEAR IN REVIEW
36 Atlas Copco 2015 Administration report
RISKS, RISK MANAGEMENT AND OPPORTUNITIESAll business activities involve risks. Atlas Copco has a structured and proactive approach to manage the company’s risks. Well-managed risks can lead to opportunities and add value to the business. Risks that are not well managed can lead to incidents and losses.
Atlas Copco’s global and diversified busi-ness towards many customer segments results in a variety of risks and opportuni-ties geographically and operationally. However, the ability to prevent, detect and manage the risks is crucial for effective governance and control of the business. The aim is to achieve Group goals with well-managed risk taking in line with the strategy and within the frame of the company manual The Way We Do Things. Atlas Copco sees opportunities in an efficient risk management both from risk reduction and business opportunity perspectives, which can lead to good business growth.
The decentralized structure in Atlas Copco also regards risk management. The local companies are responsible for their own risk management, which is monitored
and followed-up regularly at local business board meetings. This has created a strong risk management culture. Group functions for legal, insurance, treasury, tax, control-ling and accounting provide policies, guide-lines and instructions to support entities establish risk management. The implemen-tation is regularly audited by internal and external audits.
Risks in the reporting cover for example errors in the internal reporting to the Group or in the external reporting to authorities. Read more on Internal control over finan-cial reporting in the Corporate governance report, pages 64–65.
The crisis management process is man-aged by the Insurance & Risk Management department and Corporate Communica-tions. It is rolled out to all Atlas Copco entities.
Atlas Copco has developed its own enter-prise risk management methodology to map Group risks. The methodology is applied on divisions, which is the highest operational level in the Group. Hereby risks are identified based on each divisional management team’s knowledge of their own core business and area of responsibility. This hands-on approach is also in line with Atlas Copco’s decentralized structure. The ownership of managing the risks raised in the risk mappings lies with each division, while the Insurance & Risk Management department manages the overall process and consolidates the results on Group level.
Presented on pages 37–39 are risks, risk mitigating factors and potential opportunities for each category of risk.
EXTREME
HIGH
MEDIUM
LOW
RISK MAPPING
SUFFICIENT NEEDS IMPROVEMENT
DEFICIENT RED FLAG
RISK IMPACT
Risks raised by the divisions in risk mapping sessions are mapped in a Risk Matrix. Risks are quantified by means of risk impact and risk factor i.e. how well the risk is managed.
Risk impact is measured either by loss of life, monetary loss and/or loss of reputation on an impact scale from low to extreme.
RISK FACTOR
THE YEAR IN REVIEW
Administration report Atlas Copco 2015 37
MARKET RISKS
A widespread financial crisis and economic downturn would not only affect the Group nega-tively but it could also impact customers’ ability to finance their investments. Changes in cus-tomers’ production levels also have an effect on the Group’s sales of spare parts, service and consumables. In developing markets, new small-er competitors continuously appear which may affect Atlas Copco negatively.
P Well-diversified sales to customers in multiple countries and industries. Sales of spare parts and service are relatively stable in comparison to equipment sales.
P Monthly follow up of market and sales develop-ment enables quick actions.
P Flexible manufacturing setup makes it possible to quickly adapt to changes in equipment demand.
P Leading position in most market segments provides economies of scale.
➔ A significant competitive advantage as a result of a strong global presence, including growth markets.
➔ Opportunities to positively impact both the soci-ety and environment, through the Group’s high quality sustainable products and high ethical standards.
➔ Continue to develop close, long-term and strategic relationships with customers and suppliers.
PRODUCT DEVELOPMENT RISKS
One of the challenges for Atlas Copco’s long-term growth and profitability will be to continuously develop innovative, sustainable products that con-sume fewer resources over the entire life cycle. Atlas Copco’s product offering is also affected by national and regional legislation, on issues such as emissions, noise, vibrations, and recycling. How-ever, there may be increased risk of competition in emerging markets where low-cost products are not affected by such rules.
P Continuous investments in research and develop-ment to develop products in line with customer demand and expectations, even during economic downturns.
P Designing products with a life-cycle perspective and measurable efficiency targets for the main product categories for each Division.
P Designing products with reduced emissions, vibrations or noise and increased recycling potential to meet legislative requirements.
➔ Substantial opportunities to strengthen the competitive edge by innovating high quality, sustainable products and creating an integrated value proposition for customers.
PRODUCTION RISKS
Core component manufacturing is concentrated in a few locations and if there are interruptions or lack of capacity in these locations, this may have an effect on deliveries or on the quality of products.
Production facilities could also have a risk of damaging the environment through operations, e.g. through hazardous waste and emissions.
Atlas Copco is directly and indirectly exposed to raw material prices.
P Manufacturing units continuously monitor the production process, test the safety and quality of the products, make risk assessments, and train employees.
P Manufacturing units invest in modern equipment that can perform multiple operations.
P Production units are subject to continuous risk management surveys to safeguard that they comply with the Atlas Copco loss prevention standard.
P Ambition to certify all manufacturing units in accordance with the ISO 14001 standard.
➔ Continued opportunities to extensively promote operational excellence to streamline production, minimize inefficiencies and maintain a high flexi-bility in the production process.
➔ Cost increases for raw materials and compo-nents often coincide with strong end-customer demand and can partly be compensated by increased sales to mining customers and by increased market prices.
SUPPLY CHAIN RISKS
Atlas Copco and its business partners such as suppliers, sub-contractors and joint venture part-ners, must share the same values as expressed in Atlas Copco’s Business Code of Practice, other-wise there is a risk of compromising the Group’s reputation and brand. The availability of many components is dependent on suppliers and if they have interruptions or lack capacity, this may have an undesirable effect on deliveries.
The use of many suppliers gives rise to the risk that products contain components which are not sustainably produced, e.g. that electronic com-ponents contain conflict minerals (whose trade or taxation fund armed groups in conflict areas such as the Democratic Republic of Congo).
P Select and evaluate business partners on the basis of objective factors including quality, deliv-ery, price, and reliability, as well as commitment to environmental and social performance.
P Continue the process to investigate and eradi-cate the presence of conflict minerals in its value chain.
P Establishment of a global network of sub- suppliers, to prevent supplier dependency.
P Business partners sign a compliance letter to the Business Code of Practice.
P E-learning for business partners developed to raise awareness of the Business Code of Practice.
➔ Further increase business agility and reduce costs by improving supplier inventory manage-ment in response to changes in demand.
➔ Continue to be a preferred business partner and promote efficiency, sustainability and safety. Good supplier relations help to improve Atlas Copco’s competitive position.
➔ Opportunity to strengthen customer relation-ships by being ready to support customers who are impacted by the Dodd Frank legislation on conflict minerals.
➔ Promote human rights and work towards improv-ing labor conditions, reducing corruption and conflicts.
DISTRIBUTION RISKS
Atlas Copco primarily distributes products and services directly to the end customer. If the dis-tribution is not efficient, it may impact customer satisfaction, sales and profits. Damages and losses during the course of distribution can be costly.
Some sales are made indirect through distribu-tors and rental companies and their performance can have a negative effect on sales.
The distribution of products can result in increased CO2 emissions from transport.
P Physical distribution of products is concentrated to a number of distribution centers and the delivery efficiency of these is continuously monitored.
P Resources are allocated to training and develop-ment of the service organization.
P As indirect sales are local/regional, the negative impact of poor performance is limited.
P Increased focus on safer and more effective transports to reduce losses, costs and the total emissions per transport.
➔ Continue to strengthen the relationship with customers through timely deliveries of products and services.
➔ Transport efficiencies and safe transports can save the customer time and cost while reducing the environ mental impact of their own opera-tions.
➔ Reduce fuel costs and resource requirements which improves business agility for the Group.
RISKS WITH ACQUISITIONS AND DIVESTMENTS
The integration of acquired businesses is a cumbersome process and it is not certain that it will be successful. Synergies can take longer than foreseen to materialize.
Annual impairment tests are made on acquired goodwill. If goodwill is not deemed justified in such tests it can result in a write-down, affecting the Group’s result.
Acquisitions and divestments can impact local communities and/or the environment, directly or indirectly.
P The Group has established an Acquisitions Process Council which provides training and supports all business units prior to, during and post an acquisition.
P Atlas Copco guidelines and policies are applied to assess and manage the environmental and social impact of operations in the affected communities after an acquisition is complete.
P Human rights and environmental considerations are integrated when acquisitions and divest-ments are made.
➔ Acquisitions give possibility to enter new markets, market segments, new technologies, new clients, increase in revenues, etc.
➔ Identifying the obstacles to integration can allow Atlas Copco to improve the process through methods such as job rotation, training or team building exercises. This would not only result in a smoother integration process but also lower operational costs by decreasing downtime and allowing newly acquired companies to become productive and efficient more rapidly.
RISKS, RISK MANAGEMENT AND OPPORTUNITIES
RISK CONTEXT MITIGATING FACTORS OPPORTUNITIES
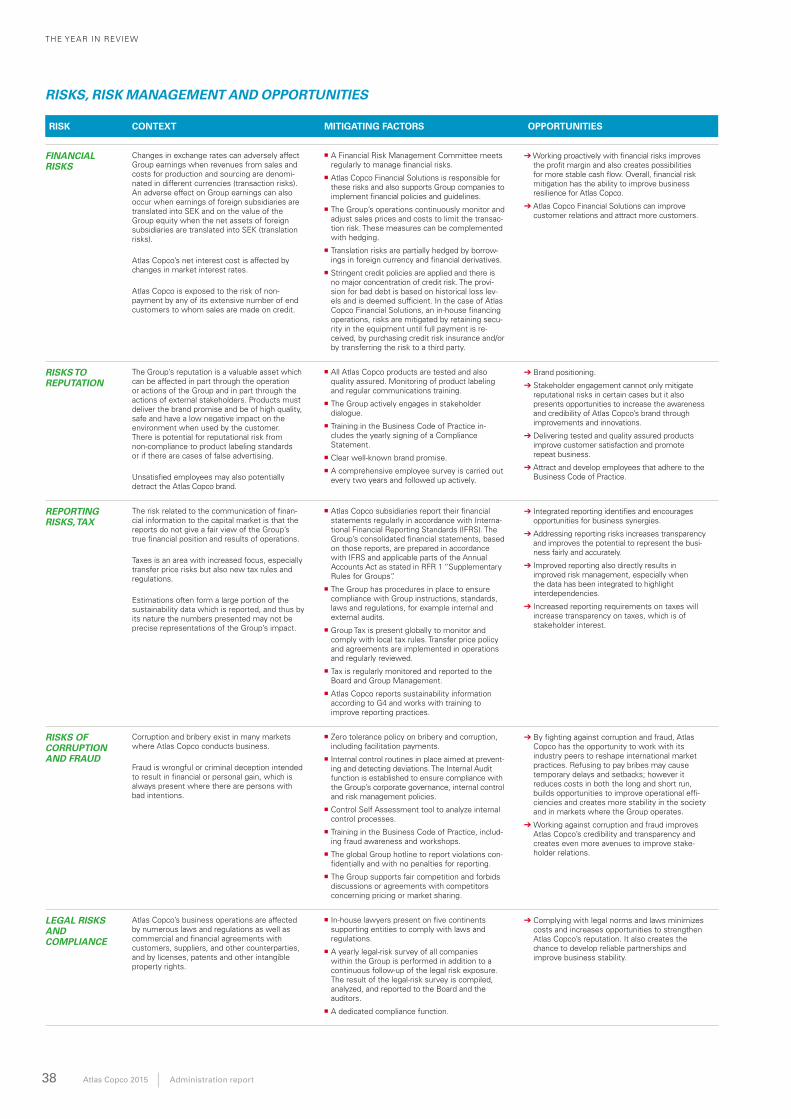
THE YEAR IN REVIEW
38 Atlas Copco 2015 Administration report
FINANCIAL RISKS
Changes in exchange rates can adversely affect Group earnings when revenues from sales and costs for production and sourcing are denomi-nated in different currencies (transaction risks). An adverse effect on Group earnings can also occur when earnings of foreign subsidiaries are translated into SEK and on the value of the Group equity when the net assets of foreign subsidiaries are translated into SEK (translation risks).
Atlas Copco’s net interest cost is affected by changes in market interest rates.
Atlas Copco is exposed to the risk of non- payment by any of its extensive number of end customers to whom sales are made on credit.
P A Financial Risk Management Committee meets regularly to manage financial risks.
P Atlas Copco Financial Solutions is responsible for these risks and also supports Group companies to implement financial policies and guidelines.
P The Group’s operations continuously monitor and adjust sales prices and costs to limit the transac-tion risk. These measures can be complemented with hedging.
P Translation risks are partially hedged by borrow-ings in foreign currency and financial derivatives.
P Stringent credit policies are applied and there is no major concentration of credit risk. The provi-sion for bad debt is based on historical loss lev-els and is deemed sufficient. In the case of Atlas Copco Financial Solutions, an in-house financing operations, risks are mitigated by retaining secu-rity in the equipment until full payment is re-ceived, by purchasing credit risk insurance and/or by transferring the risk to a third party.
➔ Working proactively with financial risks improves the profit margin and also creates possibilities for more stable cash flow. Overall, financial risk mitigation has the ability to improve business resilience for Atlas Copco.
➔ Atlas Copco Financial Solutions can improve customer relations and attract more customers.
RISKS TO REPUTATION
The Group’s reputation is a valuable asset which can be affected in part through the operation or actions of the Group and in part through the actions of external stakeholders. Products must deliver the brand promise and be of high quality, safe and have a low negative impact on the environment when used by the customer. There is potential for reputational risk from non-compliance to product labeling standards or if there are cases of false advertising.
Unsatisfied employees may also potentially detract the Atlas Copco brand.
P All Atlas Copco products are tested and also quality assured. Monitoring of product labeling and regular communications training.
P The Group actively engages in stakeholder dialogue.
P Training in the Business Code of Practice in-cludes the yearly signing of a Compliance Statement.
P Clear well-known brand promise. P A comprehensive employee survey is carried out
every two years and followed up actively.
➔ Brand positioning.
➔ Stakeholder engagement cannot only mitigate reputational risks in certain cases but it also presents opportunities to increase the awareness and credibility of Atlas Copco’s brand through improvements and innovations.
➔ Delivering tested and quality assured products improve customer satisfaction and promote repeat business.
➔ Attract and develop employees that adhere to the Business Code of Practice.
REPORTING RISKS, TAX
The risk related to the communication of finan-cial information to the capital market is that the reports do not give a fair view of the Group’s true financial position and results of operations.
Taxes is an area with increased focus, especially transfer price risks but also new tax rules and regulations.
Estimations often form a large portion of the sustainability data which is reported, and thus by its nature the numbers presented may not be precise representations of the Group’s impact.
P Atlas Copco subsidiaries report their financial statements regularly in accordance with Interna-tional Financial Reporting Standards (IFRS). The Group’s consolidated financial statements, based on those reports, are prepared in accordance with IFRS and applicable parts of the Annual Accounts Act as stated in RFR 1 “Supplementary Rules for Groups”.
P The Group has procedures in place to ensure compliance with Group instructions, standards, laws and regulations, for example internal and external audits.
P Group Tax is present globally to monitor and comply with local tax rules. Transfer price policy and agreements are implemented in operations and regularly reviewed.
P Tax is regularly monitored and reported to the Board and Group Management.
P Atlas Copco reports sustainability information according to G4 and works with training to improve reporting practices.
➔ Integrated reporting identifies and encourages opportunities for business synergies.
➔ Addressing reporting risks increases transparency and improves the potential to represent the busi-ness fairly and accurately.
➔ Improved reporting also directly results in improved risk management, especially when the data has been integrated to highlight interdependencies.
➔ Increased reporting requirements on taxes will increase transparency on taxes, which is of stakeholder interest.
RISKS OF CORRUPTION AND FRAUD
Corruption and bribery exist in many markets where Atlas Copco conducts business.
Fraud is wrongful or criminal deception intended to result in financial or personal gain, which is always present where there are persons with bad intentions.
P Zero tolerance policy on bribery and corruption, including facilitation payments.
P Internal control routines in place aimed at prevent-ing and detecting deviations. The Internal Audit function is established to ensure compliance with the Group’s corporate governance, internal control and risk management policies.
P Control Self Assessment tool to analyze internal control processes.
P Training in the Business Code of Practice, includ-ing fraud awareness and workshops.
P The global Group hotline to report violations con-fidentially and with no penalties for reporting.
P The Group supports fair competition and forbids discussions or agreements with competitors concerning pricing or market sharing.
➔ By fighting against corruption and fraud, Atlas Copco has the opportunity to work with its industry peers to reshape international market practices. Refusing to pay bribes may cause temporary delays and setbacks; however it reduces costs in both the long and short run, builds opportunities to improve operational effi-ciencies and creates more stability in the society and in markets where the Group operates.
➔ Working against corruption and fraud improves Atlas Copco’s credibility and transparency and creates even more avenues to improve stake-holder relations.
LEGAL RISKS AND COMPLIANCE
Atlas Copco’s business operations are affected by numerous laws and regulations as well as commercial and financial agreements with customers, suppliers, and other counterparties, and by licenses, patents and other intangible property rights.
P In-house lawyers present on five continents supporting entities to comply with laws and regulations.
P A yearly legal-risk survey of all companies within the Group is performed in addition to a continuous follow-up of the legal risk exposure. The result of the legal-risk survey is compiled, analyzed, and reported to the Board and the auditors.
P A dedicated compliance function.
➔ Complying with legal norms and laws minimizes costs and increases opportunities to strengthen Atlas Copco’s reputation. It also creates the chance to develop reliable partnerships and improve business stability.
RISK CONTEXT MITIGATING FACTORS OPPORTUNITIES
RISKS, RISK MANAGEMENT AND OPPORTUNITIES
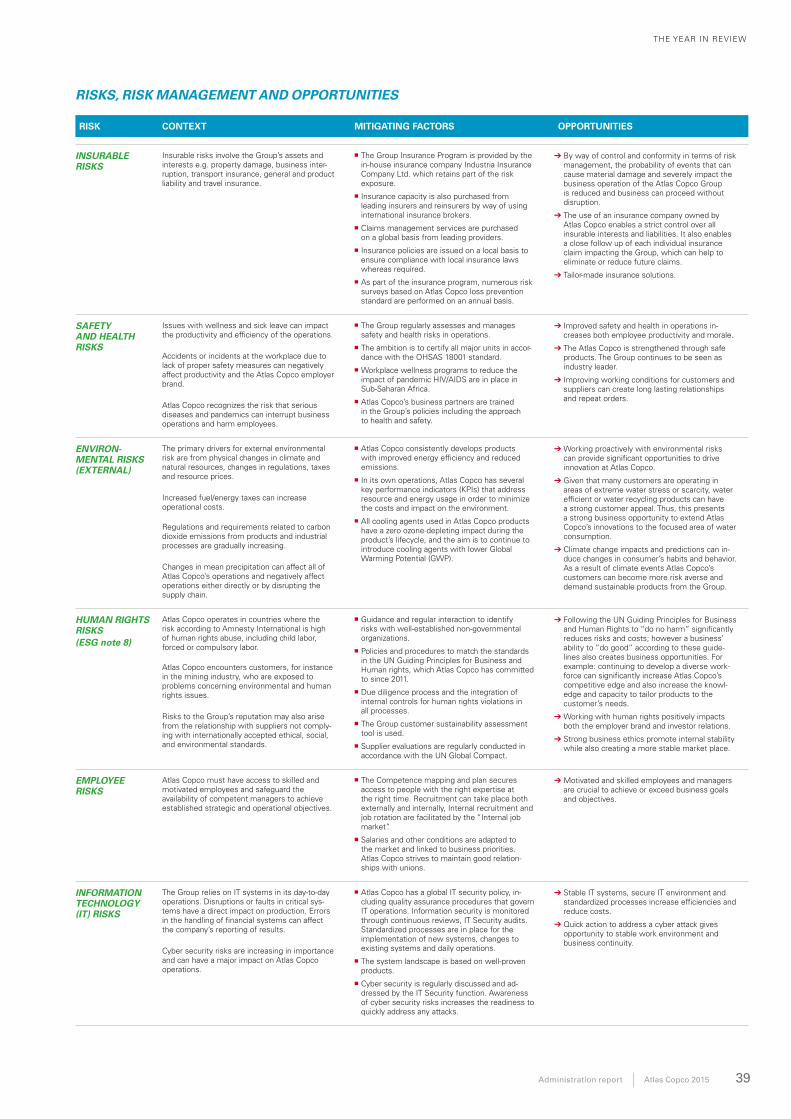
THE YEAR IN REVIEW
Administration report Atlas Copco 2015 39
INSURABLE RISKS
Insurable risks involve the Group’s assets and interests e.g. property damage, business inter-ruption, transport insurance, general and product liability and travel insurance.
P The Group Insurance Program is provided by the in-house insurance company Industria Insurance Company Ltd. which retains part of the risk exposure.
P Insurance capacity is also purchased from leading insurers and reinsurers by way of using international insurance brokers.
P Claims management services are purchased on a global basis from leading providers.
P Insurance policies are issued on a local basis to ensure compliance with local insurance laws whereas required.
P As part of the insurance program, numerous risk surveys based on Atlas Copco loss prevention standard are performed on an annual basis.
➔ By way of control and conformity in terms of risk management, the probability of events that can cause material damage and severely impact the business operation of the Atlas Copco Group is reduced and business can proceed without disruption.
➔ The use of an insurance company owned by Atlas Copco enables a strict control over all insurable interests and liabilities. It also enables a close follow up of each individual insurance claim impacting the Group, which can help to eliminate or reduce future claims.
➔ Tailor-made insurance solutions.
SAFETY AND HEALTH RISKS
Issues with wellness and sick leave can impact the productivity and efficiency of the operations.
Accidents or incidents at the workplace due to lack of proper safety measures can negatively affect productivity and the Atlas Copco employer brand.
Atlas Copco recognizes the risk that serious diseases and pandemics can interrupt business operations and harm employees.
P The Group regularly assesses and manages safety and health risks in operations.
P The ambition is to certify all major units in accor-dance with the OHSAS 18001 standard.
P Workplace wellness programs to reduce the impact of pandemic HIV/AIDS are in place in Sub-Saharan Africa.
P Atlas Copco’s business partners are trained in the Group’s policies including the approach to health and safety.
➔ Improved safety and health in operations in-creases both employee productivity and morale.
➔ The Atlas Copco is strengthened through safe products. The Group continues to be seen as industry leader.
➔ Improving working conditions for customers and suppliers can create long lasting relationships and repeat orders.
ENVIRONMENTAL RISKS (EXTERNAL)
The primary drivers for external environmental risk are from physical changes in climate and natural resources, changes in regulations, taxes and resource prices.
Increased fuel/energy taxes can increase operational costs. Regulations and requirements related to carbon dioxide emissions from products and industrial processes are gradually increasing.
Changes in mean precipitation can affect all of Atlas Copco’s operations and negatively affect operations either directly or by disrupting the supply chain.
P Atlas Copco consistently develops products with improved energy efficiency and reduced emissions.
P In its own operations, Atlas Copco has several key performance indicators (KPIs) that address resource and energy usage in order to minimize the costs and impact on the environment.
P All cooling agents used in Atlas Copco products have a zero ozone-depleting impact during the product’s lifecycle, and the aim is to continue to introduce cooling agents with lower Global Warming Potential (GWP).
➔ Working proactively with environmental risks can provide significant opportunities to drive innovation at Atlas Copco.
➔ Given that many customers are operating in areas of extreme water stress or scarcity, water efficient or water recycling products can have a strong customer appeal. Thus, this presents a strong business opportunity to extend Atlas Copco’s innovations to the focused area of water consumption.
➔ Climate change impacts and predictions can in-duce changes in consumer’s habits and behavior. As a result of climate events Atlas Copco’s customers can become more risk averse and demand sustainable products from the Group.
HUMAN RIGHTS RISKS(ESG note 8)
Atlas Copco operates in countries where the risk according to Amnesty International is high of human rights abuse, including child labor, forced or compulsory labor. Atlas Copco encounters customers, for instance in the mining industry, who are exposed to problems concerning environmental and human rights issues.
Risks to the Group’s reputation may also arise from the relationship with suppliers not comply-ing with internationally accepted ethical, social, and environmental standards.
P Guidance and regular interaction to identify risks with well-established non-governmental organizations.
P Policies and procedures to match the standards in the UN Guiding Principles for Business and Human rights, which Atlas Copco has committed to since 2011.
P Due diligence process and the integration of internal controls for human rights violations in all processes.
P The Group customer sustainability assessment tool is used.
P Supplier evaluations are regularly conducted in accordance with the UN Global Compact.
➔ Following the UN Guiding Principles for Business and Human Rights to “do no harm” significantly reduces risks and costs; however a business’ ability to “do good” according to these guide-lines also creates business opportunities. For example: continuing to develop a diverse work-force can significantly increase Atlas Copco’s competitive edge and also increase the knowl-edge and capacity to tailor products to the customer’s needs.
➔ Working with human rights positively impacts both the employer brand and investor relations.
➔ Strong business ethics promote internal stability while also creating a more stable market place.
EMPLOYEE RISKS
Atlas Copco must have access to skilled and motivated employees and safeguard the availability of competent managers to achieve established strategic and operational objectives.
P The Competence mapping and plan secures access to people with the right expertise at the right time. Recruitment can take place both externally and internally, Internal recruitment and job rotation are facilitated by the “Internal job market”.
P Salaries and other conditions are adapted to the market and linked to business priorities. Atlas Copco strives to maintain good relation-ships with unions.
➔ Motivated and skilled employees and managers are crucial to achieve or exceed business goals and objectives.
INFORMATION TECHNOLOGY (IT) RISKS
The Group relies on IT systems in its day-to-day operations. Disruptions or faults in critical sys-tems have a direct impact on production. Errors in the handling of financial systems can affect the company’s reporting of results.
Cyber security risks are increasing in importance and can have a major impact on Atlas Copco operations.
P Atlas Copco has a global IT security policy, in-cluding quality assurance procedures that govern IT operations. Information security is monitored through continuous reviews, IT Security audits. Standardized processes are in place for the implementation of new systems, changes to existing systems and daily operations.
P The system landscape is based on well-proven products.
P Cyber security is regularly discussed and ad-dressed by the IT Security function. Awareness of cyber security risks increases the readiness to quickly address any attacks.
➔ Stable IT systems, secure IT environment and standardized processes increase efficiencies and reduce costs.
➔ Quick action to address a cyber attack gives opportunity to stable work environment and business continuity.
RISK CONTEXT MITIGATING FACTORS OPPORTUNITIES
RISKS, RISK MANAGEMENT AND OPPORTUNITIES
THE YEAR IN REVIEW
40 Atlas Copco 2015 Administration report
INNOVATION
In an increasingly resource-restricted world, Atlas Copco’s research and development initiatives create value for the Group’s customers by continuously innovating sustainable products and services.
ABOUT THE IMAGE:An advanced, light and compact electric screwdriver with controller for high quality and high productivity assembly in the electronics industry.
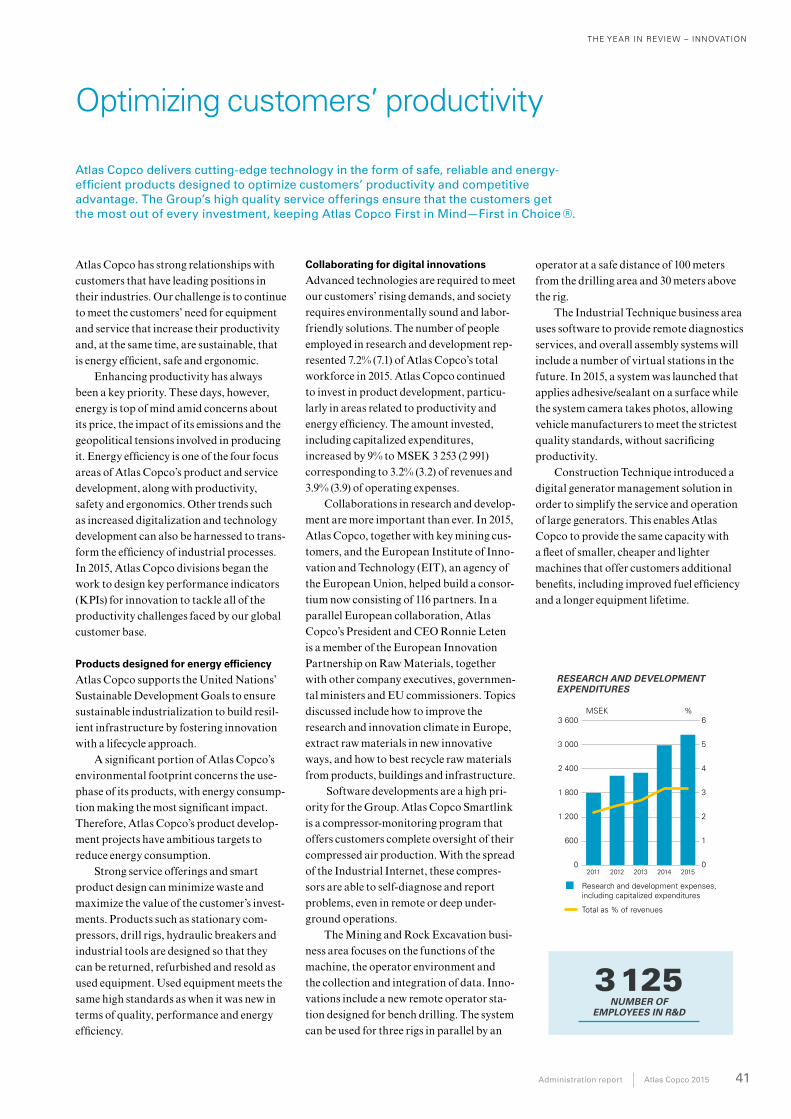
THE YEAR IN REVIEW – INNOVATION
Administration report Atlas Copco 2015 41
Atlas Copco has strong relationships with customers that have leading positions in their industries. Our challenge is to continue to meet the customers’ need for equipment and service that increase their productivity and, at the same time, are sustainable, that is energy efficient, safe and ergonomic.
Enhancing productivity has always been a key priority. These days, however, energy is top of mind amid concerns about its price, the impact of its emissions and the geopolitical tensions involved in producing it. Energy efficiency is one of the four focus areas of Atlas Copco’s product and service development, along with productivity, safety and ergonomics. Other trends such as increased digitalization and technology development can also be harnessed to trans-form the efficiency of industrial processes. In 2015, Atlas Copco divisions began the work to design key performance indicators (KPIs) for innovation to tackle all of the productivity challenges faced by our global customer base.
Products designed for energy efficiency
Atlas Copco supports the United Nations’ Sustainable Development Goals to ensure sustainable industrialization to build resil-ient infrastructure by fostering innovation with a lifecycle approach.
A significant portion of Atlas Copco’s environmental footprint concerns the use-phase of its products, with energy consump-tion making the most significant impact. Therefore, Atlas Copco’s product develop-ment projects have ambitious targets to reduce energy consumption.
Strong service offerings and smart product design can minimize waste and maximize the value of the customer’s invest-ments. Products such as stationary com-pressors, drill rigs, hydraulic breakers and industrial tools are designed so that they can be returned, refurbished and resold as used equipment. Used equipment meets the same high standards as when it was new in terms of quality, performance and energy efficiency.
Collaborating for digital innovations
Advanced technologies are required to meet our customers’ rising demands, and society requires environmentally sound and labor-friendly solutions. The number of people employed in research and development rep-resented 7.2% (7.1) of Atlas Copco’s total workforce in 2015. Atlas Copco continued to invest in product development, particu-larly in areas related to productivity and energy efficiency. The amount invested, including capitalized expenditures, increased by 9% to MSEK 3 253 (2 991) corresponding to 3.2% (3.2) of revenues and 3.9% (3.9) of operating expenses.
Collaborations in research and develop-ment are more important than ever. In 2015, Atlas Copco, together with key mining cus-tomers, and the European Institute of Inno-vation and Technology (EIT), an agency of the European Union, helped build a consor-tium now consisting of 116 partners. In a parallel European collaboration, Atlas Copco’s President and CEO Ronnie Leten is a member of the European Innovation Partnership on Raw Materials, together with other company executives, governmen-tal ministers and EU commissioners. Topics discussed include how to improve the research and innovation climate in Europe, extract raw materials in new innovative ways, and how to best recycle raw materials from products, buildings and infrastructure.
Software developments are a high pri-ority for the Group. Atlas Copco Smartlink is a compressor-monitoring program that offers customers complete oversight of their compressed air production. With the spread of the Industrial Internet, these compres-sors are able to self-diagnose and report problems, even in remote or deep under-ground operations.
The Mining and Rock Excavation busi-ness area focuses on the functions of the machine, the operator environment and the collection and integration of data. Inno-vations include a new remote operator sta-tion designed for bench drilling. The system can be used for three rigs in parallel by an
Optimizing customers’ productivity
Atlas Copco delivers cutting-edge technology in the form of safe, reliable and energy- efficient products designed to optimize customers’ productivity and competitive advantage. The Group’s high quality service offerings ensure that the customers get the most out of every investment, keeping Atlas Copco First in Mind—First in Choice ®.
0
600
1 200
1 800
2 400
3 000
3 600
201520142013201220110
1
2
3
4
5
6MSEK %
Research and development expenses,including capitalized expenditures
Total as % of revenues
RESEARCH AND DEVELOPMENT EXPENDITURES
operator at a safe distance of 100 meters from the drilling area and 30 meters above the rig.
The Industrial Technique business area uses software to provide remote diagnostics services, and overall assembly systems will include a number of virtual stations in the future. In 2015, a system was launched that applies adhesive/sealant on a surface while the system camera takes photos, allowing vehicle manufacturers to meet the strictest quality standards, without sacrificing productivity.
Construction Technique introduced a digital generator management solution in order to simplify the service and operation of large generators. This enables Atlas Copco to provide the same capacity with a fleet of smaller, cheaper and lighter machines that offer customers additional benefits, including improved fuel efficiency and a longer equipment lifetime.
3 125NUMBER OF
EMPLOYEES IN R&D
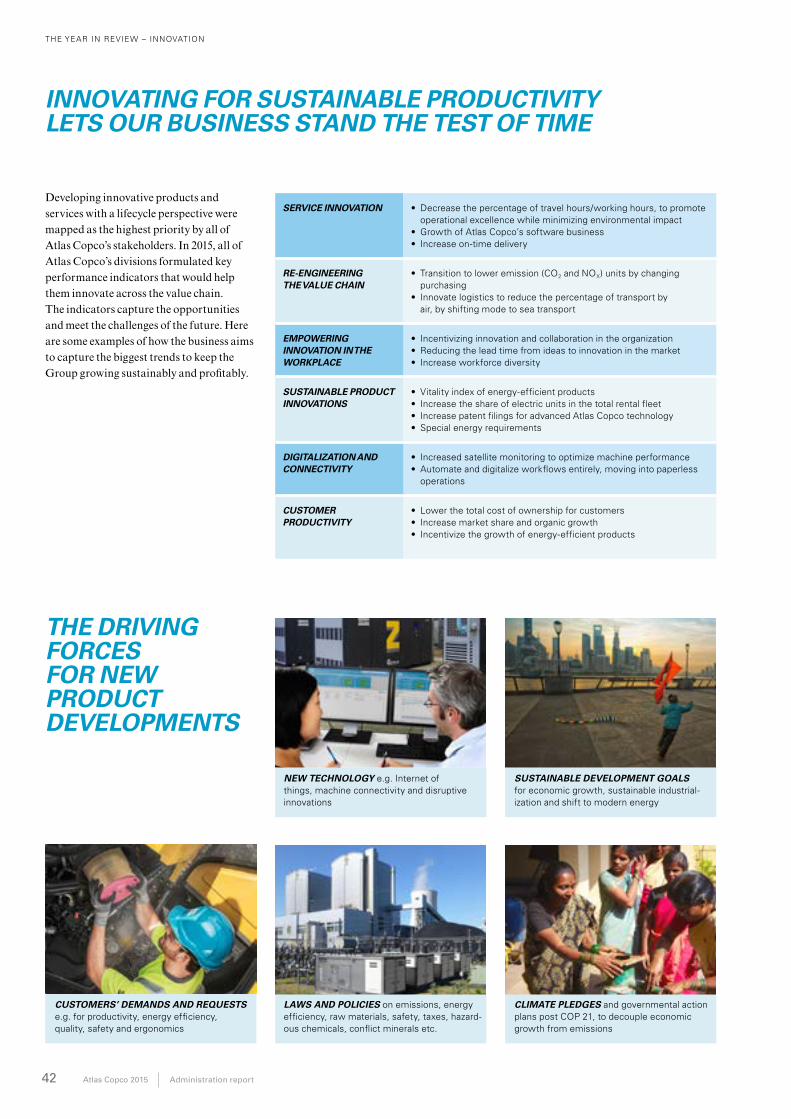
THE YEAR IN REVIEW – INNOVATION
42 Atlas Copco 2015 Administration report
INNOVATING FOR SUSTAINABLE PRODUCTIVITY LETS OUR BUSINESS STAND THE TEST OF TIME
SUSTAINABLE DEVELOPMENT GOALS for economic growth, sustainable industrial-ization and shift to modern energy
CUSTOMERS’ DEMANDS AND REQUESTS e.g. for productivity, energy efficiency, quality, safety and ergonomics
LAWS AND POLICIES on emissions, energy efficiency, raw materials, safety, taxes, hazard-ous chemicals, conflict minerals etc.
NEW TECHNOLOGY e.g. Internet of things, machine connectivity and disruptive innovations
CLIMATE PLEDGES and governmental action plans post COP 21, to decouple economic growth from emissions
THE DRIVING FORCES FOR NEW PRODUCT DEVELOPMENTS
SERVICE INNOVATION • Decrease the percentage of travel hours/working hours, to promote operational excellence while minimizing environmental impact
• Growth of Atlas Copco’s software business• Increase on-time delivery
RE-ENGINEERING THE VALUE CHAIN
• Transition to lower emission (CO2 and NOX) units by changing purchasing
• Innovate logistics to reduce the percentage of transport by air, by shifting mode to sea transport
EMPOWERING INNOVATION IN THE WORKPLACE
• Incentivizing innovation and collaboration in the organization• Reducing the lead time from ideas to innovation in the market• Increase workforce diversity
SUSTAINABLE PRODUCT INNOVATIONS
• Vitality index of energy-efficient products • Increase the share of electric units in the total rental fleet• Increase patent filings for advanced Atlas Copco technology• Special energy requirements
DIGITALIZATION AND CONNECTIVITY
• Increased satellite monitoring to optimize machine performance• Automate and digitalize workflows entirely, moving into paperless
operations
CUSTOMER PRODUCTIVITY
• Lower the total cost of ownership for customers• Increase market share and organic growth• Incentivize the growth of energy-efficient products
Developing innovative products and services with a lifecycle perspective were mapped as the highest priority by all of Atlas Copco’s stakeholders. In 2015, all of Atlas Copco’s divisions formulated key performance indicators that would help them innovate across the value chain. The indicators capture the opportunities and meet the challenges of the future. Here are some examples of how the business aims to capture the biggest trends to keep the Group growing sustainably and profitably.
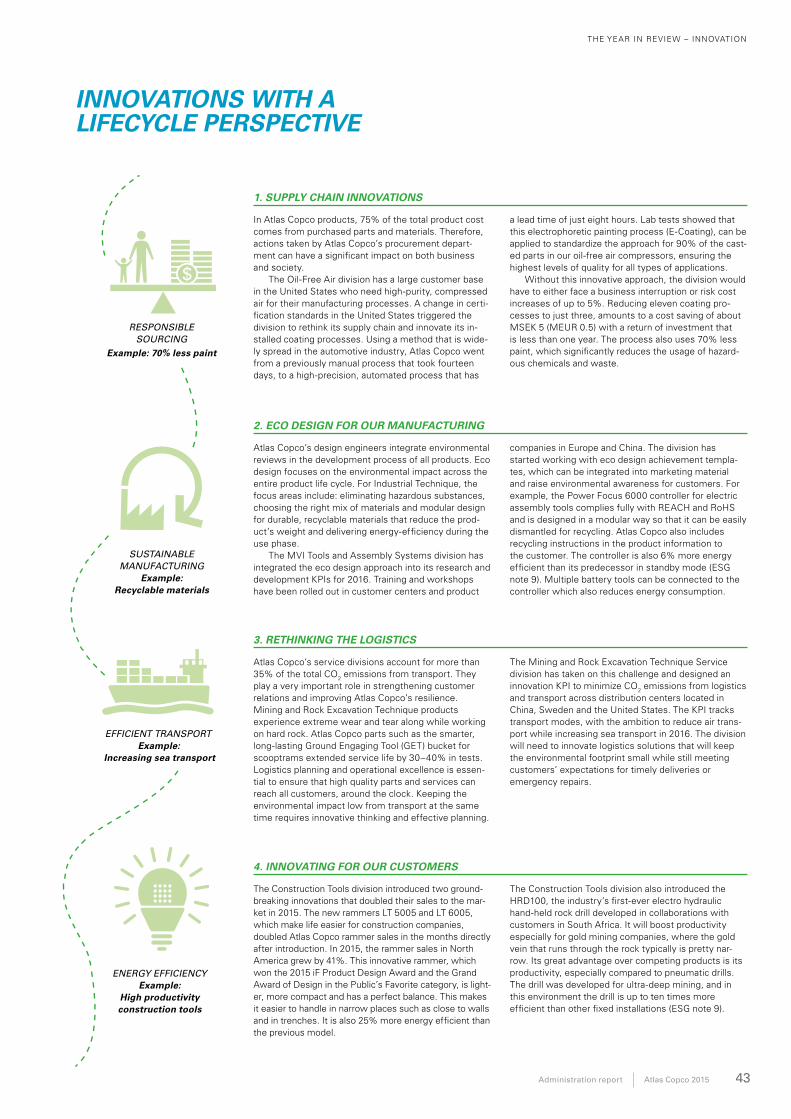
THE YEAR IN REVIEW – INNOVATION
Administration report Atlas Copco 2015 43
INNOVATIONS WITH A LIFECYCLE PERSPECTIVE
Atlas Copco’s design engineers integrate environmental reviews in the development process of all pro ducts. Eco design focuses on the environmental impact across the entire product life cycle. For Industrial Technique, the focus areas include: eliminating hazardous substances, choosing the right mix of materials and modular design for durable, recyclable materials that reduce the prod-uct’s weight and delivering energy-efficiency during the use phase.
The MVI Tools and Assembly Systems division has integrated the eco design approach into its research and development KPIs for 2016. Training and workshops have been rolled out in customer centers and product
companies in Europe and China. The division has started working with eco design achievement templa-tes, which can be integrated into marketing material and raise environmental awareness for customers. For example, the Power Focus 6000 controller for electric assembly tools complies fully with REACH and RoHS and is designed in a modular way so that it can be easily dismantled for recycling. Atlas Copco also includes recycling instructions in the product information to the customer. The controller is also 6% more energy efficient than its predecessor in standby mode (ESG note 9). Multiple battery tools can be connected to the controller which also reduces energy consumption.
Atlas Copco’s service divisions account for more than 35% of the total CO2 emissions from transport. They play a very important role in strengthening customer relations and improving Atlas Copco’s resilience. Mining and Rock Excavation Technique products experience extreme wear and tear along while working on hard rock. Atlas Copco parts such as the smarter, long-lasting Ground Engaging Tool (GET) bucket for scooptrams extended service life by 30–40% in tests. Logistics planning and operational excellence is essen-tial to ensure that high quality parts and services can reach all customers, around the clock. Keeping the environmental impact low from transport at the same time requires innovative thinking and effective planning.
In Atlas Copco products, 75% of the total product cost comes from purchased parts and materials. Therefore, actions taken by Atlas Copco’s procurement depart-ment can have a significant impact on both business and society.
The Oil-Free Air division has a large customer base in the United States who need high-purity, compressed air for their manufacturing processes. A change in certi-fication standards in the United States triggered the division to rethink its supply chain and innovate its in-stalled coating processes. Using a method that is wide-ly spread in the automotive industry, Atlas Copco went from a previously manual process that took fourteen days, to a high-precision, automated process that has
a lead time of just eight hours. Lab tests showed that this electrophoretic painting process (E-Coating), can be applied to standardize the approach for 90% of the cast-ed parts in our oil-free air compressors, ensuring the highest levels of quality for all types of applications.
Without this innovative approach, the division would have to either face a business interruption or risk cost increases of up to 5%. Reducing eleven coating pro-cesses to just three, amounts to a cost saving of about MSEK 5 (MEUR 0.5) with a return of investment that is less than one year. The process also uses 70% less paint, which significantly reduces the usage of hazard-ous chemicals and waste.
1. SUPPLY CHAIN INNOVATIONS
2. ECO DESIGN FOR OUR MANUFACTURING
3. RETHINKING THE LOGISTICS
4. INNOVATING FOR OUR CUSTOMERS
SUSTAINABLE MANUFACTURING
Example: Recyclable materials
ENERGY EFFICIENCYExample:
High productivity construction tools
The Construction Tools division introduced two ground-breaking innovations that doubled their sales to the mar-ket in 2015. The new rammers LT 5005 and LT 6005, which make life easier for construction companies, doubled Atlas Copco rammer sales in the months directly after introduction. In 2015, the rammer sales in North America grew by 41%. This innovative rammer, which won the 2015 iF Product Design Award and the Grand Award of Design in the Public’s Favorite category, is light-er, more compact and has a perfect balance. This makes it easier to handle in narrow places such as close to walls and in trenches. It is also 25% more energy efficient than the previous model.
The Construction Tools division also introduced the HRD100, the industry’s first-ever electro hydraulic hand-held rock drill developed in collaborations with customers in South Africa. It will boost productivity especially for gold mining companies, where the gold vein that runs through the rock typically is pretty nar-row. Its great advantage over competing products is its productivity, especially compared to pneumatic drills. The drill was developed for ultra-deep mining, and in this environment the drill is up to ten times more efficient than other fixed installations (ESG note 9).
EFFICIENT TRANSPORTExample:
Increasing sea transport
RESPONSIBLE SOURCING
Example: 70% less paint
The Mining and Rock Excavation Technique Service division has taken on this challenge and designed an innovation KPI to minimize CO2 emissions from logistics and transport across distribution centers located in China, Sweden and the United States. The KPI tracks transport modes, with the ambition to reduce air trans-port while increasing sea transport in 2016. The division will need to innovate logistics solutions that will keep the environmental footprint small while still meeting customers’ expectations for timely deliveries or emergency repairs.
THE YEAR IN REVIEW
44 Atlas Copco 2015 Administration report
EMPLOYEES
Atlas Copco’s success is built on strong values and the talented employees who carry them. The Group believes in providing its people a working environment that sets a high standard for leadership and provides opportunities for each individual to develop professionally. Offering a diverse workplace with good health, safety and labor practices is an important part of Atlas Copco’s brand as an employer, and thereby a key success factor for the Group.
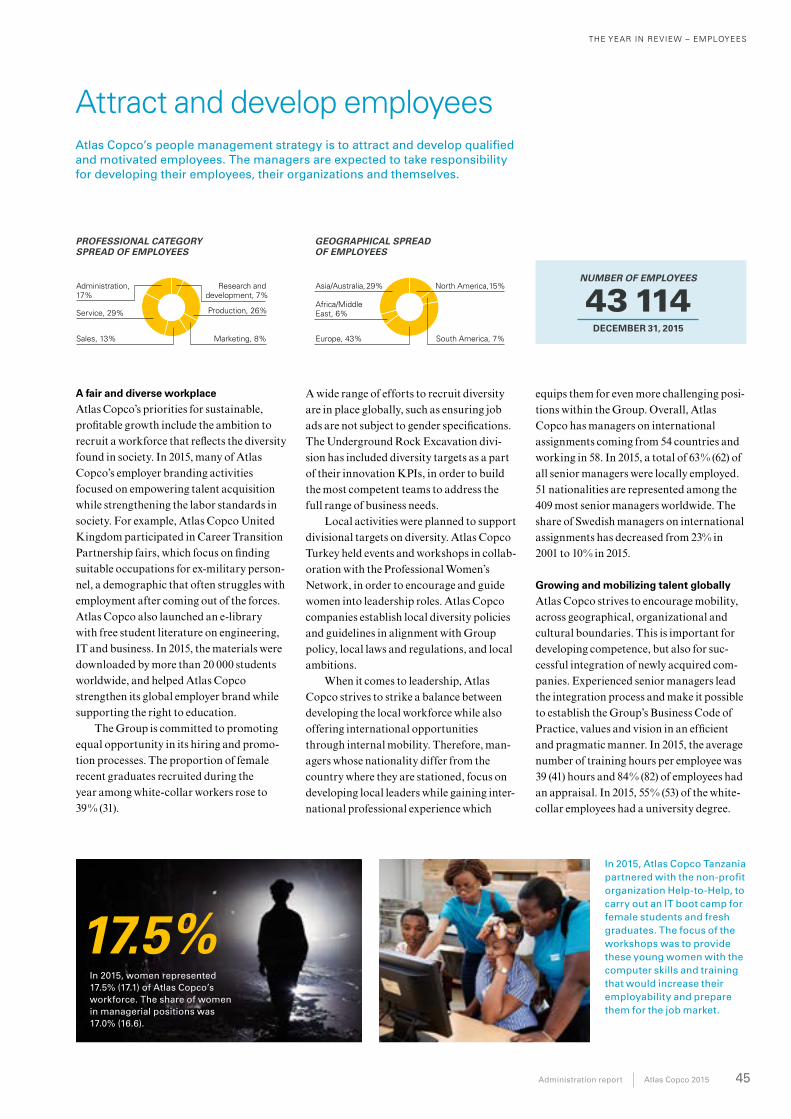
Administration report Atlas Copco 2015 45
THE YEAR IN REVIEW – EMPLOYEES
A fair and diverse workplace
Atlas Copco’s priorities for sustainable, profitable growth include the ambition to recruit a workforce that reflects the diversity found in society. In 2015, many of Atlas Copco’s employer branding activities focused on empowering talent acquisition while strengthening the labor standards in society. For example, Atlas Copco United Kingdom participated in Career Transition Partnership fairs, which focus on finding suitable occupations for ex-military person-nel, a demographic that often struggles with employment after coming out of the forces. Atlas Copco also launched an e-library with free student literature on engineering, IT and business. In 2015, the materials were downloaded by more than 20 000 students worldwide, and helped Atlas Copco strengthen its global employer brand while supporting the right to education.
The Group is committed to promoting equal opportunity in its hiring and promo-tion processes. The proportion of female recent graduates recruited during the year among white-collar workers rose to 39% (31).
A wide range of efforts to recruit diversity are in place globally, such as ensuring job ads are not subject to gender specifications. The Underground Rock Excavation divi-sion has included diversity targets as a part of their innovation KPIs, in order to build the most competent teams to address the full range of business needs.
Local activities were planned to support divisional targets on diversity. Atlas Copco Turkey held events and workshops in collab-oration with the Professional Women’s Network, in order to encourage and guide women into leadership roles. Atlas Copco companies establish local diversity policies and guidelines in alignment with Group policy, local laws and regulations, and local ambitions.
When it comes to leadership, Atlas Copco strives to strike a balance between developing the local workforce while also offering international opportunities through internal mobility. Therefore, man-agers whose nationality differ from the country where they are stationed, focus on developing local leaders while gaining inter-national professional experience which
equips them for even more challenging posi-tions within the Group. Overall, Atlas Copco has managers on international assignments coming from 54 countries and working in 58. In 2015, a total of 63% (62) of all senior managers were locally employed. 51 nationalities are represented among the 409 most senior managers worldwide. The share of Swedish managers on international assignments has decreased from 23% in 2001 to 10% in 2015.
Growing and mobilizing talent globally
Atlas Copco strives to encourage mobility, across geographical, organizational and cultural boundaries. This is important for developing competence, but also for suc-cessful integration of newly acquired com-panies. Experienced senior managers lead the integration process and make it possible to establish the Group’s Business Code of Practice, values and vision in an efficient and pragmatic manner. In 2015, the average number of training hours per employee was 39 (41) hours and 84% (82) of employees had an appraisal. In 2015, 55% (53) of the white-collar employees had a university degree.
GEOGRAPHICAL SPREAD OF EMPLOYEES
PROFESSIONAL CATEGORY SPREAD OF EMPLOYEES
Asia/Australia, 29% North America,15%
Africa/Middle East, 6%
Europe, 43% South America, 7%
Administration, 17%
Research and development, 7%
Production, 26%Service, 29%
Sales, 13% Marketing, 8%
Attract and develop employeesAtlas Copco’s people management strategy is to attract and develop qualified and motivated employees. The managers are expected to take responsibility for developing their employees, their organizations and themselves.
17.5%In 2015, women represented 17.5% (17.1) of Atlas Copco’s workforce. The share of women in managerial positions was 17.0% (16.6).
In 2015, Atlas Copco Tanzania partnered with the non-profit organization Help-to-Help, to carry out an IT boot camp for female students and fresh graduates. The focus of the workshops was to provide these young women with the computer skills and training that would increase their employability and prepare them for the job market.
NUMBER OF EMPLOYEES
43 114DECEMBER 31, 2015
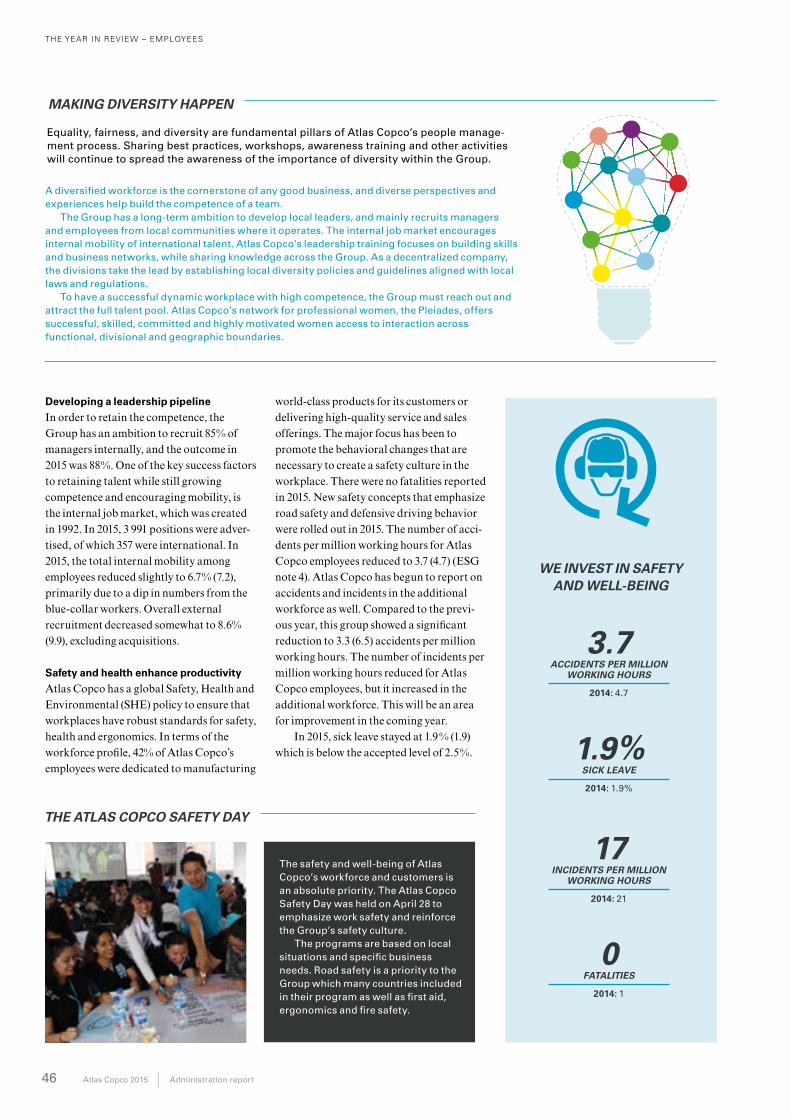
46 Atlas Copco 2015 Administration report
THE YEAR IN REVIEW – EMPLOYEES
Developing a leadership pipeline
In order to retain the competence, the Group has an ambition to recruit 85% of managers internally, and the outcome in 2015 was 88%. One of the key success factors to retaining talent while still growing competence and encouraging mobility, is the internal job market, which was created in 1992. In 2015, 3 991 positions were adver-tised, of which 357 were international. In 2015, the total internal mobility among employees reduced slightly to 6.7% (7.2), primarily due to a dip in numbers from the blue-collar workers. Overall external recruitment decreased somewhat to 8.6% (9.9), excluding acquisitions.
Safety and health enhance productivity
Atlas Copco has a global Safety, Health and Environmental (SHE) policy to ensure that workplaces have robust standards for safety, health and ergonomics. In terms of the workforce profile, 42% of Atlas Copco’s employees were dedicated to manufacturing
The safety and well-being of Atlas Copco’s workforce and customers is an absolute priority. The Atlas Copco Safety Day was held on April 28 to emphasize work safety and reinforce the Group’s safety culture.
The programs are based on local situations and specific business needs. Road safety is a priority to the Group which many countries included in their program as well as first aid, ergonomics and fire safety.
THE ATLAS COPCO SAFETY DAY
3.7ACCIDENTS PER MILLION
WORKING HOURS
2014: 4.7
1.9%SICK LEAVE
2014: 1.9%
WE INVEST IN SAFETY AND WELL-BEING
17INCIDENTS PER MILLION
WORKING HOURS
2014: 21
0FATALITIES
2014: 1
world-class products for its customers or delivering high-quality service and sales offerings. The major focus has been to promote the behavioral changes that are necessary to create a safety culture in the workplace. There were no fatalities reported in 2015. New safety concepts that emphasize road safety and defensive driving behavior were rolled out in 2015. The number of acci-dents per million working hours for Atlas Copco employees reduced to 3.7 (4.7) (ESG note 4). Atlas Copco has begun to report on accidents and incidents in the additional workforce as well. Compared to the previ-ous year, this group showed a significant reduction to 3.3 (6.5) accidents per million working hours. The number of incidents per million working hours reduced for Atlas Copco employees, but it increased in the additional workforce. This will be an area for improvement in the coming year.
In 2015, sick leave stayed at 1.9% (1.9) which is below the accepted level of 2.5%.
MAKING DIVERSITY HAPPEN
Equality, fairness, and diversity are fundamental pillars of Atlas Copco’s people manage-ment process. Sharing best practices, workshops, awareness training and other activities will continue to spread the awareness of the importance of diversity within the Group.
A diversified workforce is the cornerstone of any good business, and diverse perspectives and experiences help build the competence of a team.
The Group has a long-term ambition to develop local leaders, and mainly recruits managers and employees from local communities where it operates. The internal job market encourages internal mobility of international talent. Atlas Copco’s leadership training focuses on building skills and business networks, while sharing knowledge across the Group. As a decentralized company, the divisions take the lead by establishing local diversity policies and guidelines aligned with local laws and regulations.
To have a successful dynamic workplace with high competence, the Group must reach out and attract the full talent pool. Atlas Copco’s network for professional women, the Pleiades, offers successful, skilled, committed and highly motivated women access to interaction across functional, divisional and geographic boundaries.
Administration report Atlas Copco 2015 47
THE YEAR IN REVIEW – EMPLOYEES
Speeding up the transformation of training and know ledge into performance is one of Atlas Copco’s priorities when it comes to building competent teams. The Group’s concept Time to Competence drives the rapid and efficient uptake of core, functio-nal and product specific competencies and skills.
In 2015, the Compressor Technique Service division geared up their efforts and launched the Compressor Technique Service Academy – a central system managing all the division’s learning activities for all its employees. The Compressor Technique Service Academy
SPEEDING UP TIME TO COMPETENCE
Atlas Copco’s innovative technology, products and expertise deliver value for our business and society, and people are an important pillar for the Group’s strate-gy. Guided by the priorities for sustainable profitable growth, Atlas Copco developed key performance indicators to link our talent pool’s competence to maximizing our potential to innovate.
The Rocktec division develops and manufactures rock drills and components, and provides services exclusively for the Mining and Rock Excavation business area. One of the innovation KPIs focuses on incentivizing innovative thinking and empowering the organization to create continuous improvement. Rocktec achieves this by providing employees the best tools and freedom to use them, and collaborating within the Group to align and
enable rapid creation of high-performing products and solutions. This supports Rocktec’s ambition to be industry leaders and provide advancing technology to cus-tomers, and provide technical support and application expertise for the products they create.
This KPI is embedded in the division’s incentive model, along with KPIs for profit-ability, and Safety, Health, Environment and Quality (SHEQ).
In another example, the Gas and Process division’s innovation KPIs include a target to reduce the lead time to trans-form innovative ideas into actual sales. This will require strong coordination, competence development and processes to align various functions from research and development, to sales.
EMPOWERING INNOVATION IN THE WORKPLACE
Committed to high labor standards
As a voluntary member of the UN Global Compact since 2008, Atlas Copco ensures that advised labor practices such as the right to collective bargaining are included in the Business Code of Practice, which is updated regularly. The Group views trade unions and employee representatives as a necessary and valuable support system for its people, and fosters relationships based on mutual respect and constructive dialogue. In 2015, 38% of all employees were covered by collective bargaining agreements, and it is estimated that several hundred local consul-tations/negotiations took place with unions
regarding working conditions and organiza-tional changes. As a decentralized organiza-tion, this engagement and constructive dialogue with labor unions takes place at a local level. In countries where no indepen-dent labor union may exist, Atlas Copco has taken measures to establish forums for employer/employee relations, for example in China, through environment and safety committees. A non-discrimination policy covers all employees and the Business Code of Practice also covers employee rights. For full disclosure on wages and employee benefits, see Note 5.
84%EMPLOYEES WITH
YEARLY APPRAISAL
2014: 82%
5.8%TURNOVER,
VOLUNTARY LEAVE
2014: 6.3%
17.0%FEMALE MANAGERS
2014: 16.6%
13.6%RECENT GRADUATES OF WHITE
COLLAR RECRUITMENT
2014: 10.7%
WE BUILD THE MOST COMPETENT TEAMS
provides the division’s service technicians with the knowledge and skills to execute service activities on equipment in an efficient way. It also provides learning resources that develop the skills of service sales people to sell the value of the division’s service products to customers.
The employees’ knowledge is measured objectively by the system and learning activities are matched with individual knowledge and needs. The organization benefits from a tool that better matches the right service technician with specific service jobs and improves the division’s capacity planning.
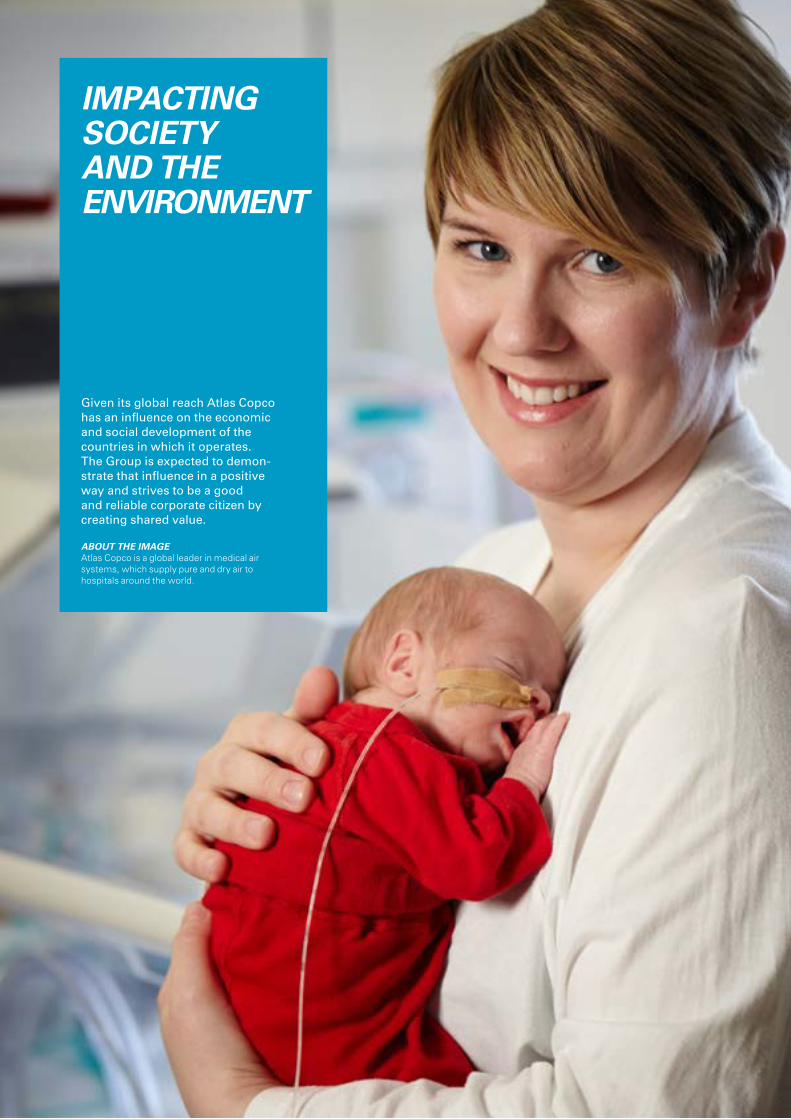
THE YEAR IN REVIEW – ADMINISTRATION REPORT
IMPACTINGSOCIETY AND THE ENVIRONMENT
Given its global reach Atlas Copco has an influence on the economic and social development of the countries in which it operates. The Group is expected to demon-strate that influence in a positive way and strives to be a good and reliable corporate citizen by creating shared value.
ABOUT THE IMAGEAtlas Copco is a global leader in medical air systems, which supply pure and dry air to hospitals around the world.
THE YEAR IN REVIEW – SOCIETY
Atlas Copco 2015 49
Living by the highest ethical standards
Ensuring that the business grows with a clear stance against corruption and a strong commitment to respecting human rights is the right way to expand Atlas Copco’s global presence. The Group works continuously with its entire value chain, to protect the business from risks and to promote better standards in society.
Atlas Copco’s business model is agile because of strategic partnerships with business partners such as suppliers, sub-contractors and joint venture partners. Pur-chased components represent about 75% of the product cost. Therefore, nurturing long-term relationships with business partners is mutually beneficial, securing the Group’s competitive edge and development potential in a responsible and sustainable way. Work-ing with business partners who share the Group’s high standards of quality, business ethics and resource efficiency is necessary to effectively manage risks, and to enhance productivity in the value chain.
Responsible sourcing practices
Atlas Copco’s purchasing strategies are decentralized to give the organization higher flexibility. The Group has a very large international supplier base, which presents significant challenges in maintain-ing supply chain standards. Purchasing councils oversee supply chain management at a divisional level, but come together as a part of the Group purchasing council to develop central policies and tools that impact all operations.
Atlas Copco prioritizes follow-up activ-ities with suppliers who represent the bulk of the annual purchase value as well as the highest risk from markets with corruption or human rights risk.
In 2015, 4 601 suppliers were within the scope of this risk-based approach, and 95% of these significant suppliers were requested to confirm compliance to Atlas Copco’s 10 criteria letter. 88% confirmed compliance, and 19% were audited for safety, health and environment issues. 27% were audited for quality.
The 10-point checklist is based on the UN Global Compact and the International Labour Organization’s Declaration on Fun-damental Principles and Rights at Work, as well as through on-site visits (ESG note 5). All business partners are impartially evalu-ated on parameters including price, quality, reliability as well as key environmental, social and ethical concerns.
88%Significant suppliers that confirmed compliance with the Business Code of Practice. 2014: 82%
Compliance with the environmental, social and business ethics clauses in the checklist is required for 100 % of new agreements. How-ever, for non-red-flag issues (such as having environmental management systems), Atlas Copco tries to work with business partners to set up an action plan to help them meet the criteria within 6–12 months’ time.
In 2015, 1 221 (1 369) significant suppli-ers were audited for quality and 891 (1 192) for safety, health, environmental and ethical standards. Of those, 16 (17) were rejected due to quality issues and another 13 (14) for safety, health, environmental and ethical standards.
Local purchasing (non-core) is encour-aged to generate societal value in the com-munities where Atlas Copco operates, by creating job opportunities as well as gener-ating direct and indirect income. This is mostly carried out by individual companies, and also decreases the environmental impact from transport.
Applying the Business Code to
distributors and agents
Approximately 20% of Atlas Copco’s reve-nues are generated through sales via distrib-utors, agents and contractors. In 2015, Atlas Copco established a KPI to develop and roll out sustainability risk assessments for agents and distributors. The first phase of the roll out will focus on select high risk markets, and be expanded to other markets after the pilot phase.
Sales compliance process
The Group began using the customer sus-tainability tool in 2013 in order to investigate potential risks based on environmental, labor, human rights and corruption in mar-kets and industries where Atlas Copco is present (ESG note 7). In 2015, Atlas Copco shared the tool with industry peers in order to promote a standard approach to sales compliance among capital goods providers.
Atlas Copco’s Compliance board over-sees and guides the operations, to ensure that the Group is not complicit in human rights violations in accordance to its com-
mitment to the Guiding Principles on Business and Human Rights. The lack of enforcement of legal and political infra-structure in some complex markets repre-sents a challenge. Atlas Copco engaged in a dialogue with the Swedish Government during the drafting of Sweden’s National Action Plan. Bilateral engagements with civil society and investors are crucial for the Group to successfully escalate issues in challenging markets. The Group engaged on the topic also in its 5th annual stake-holder dialogue, which was publicly broad-casted online.
In 2015, Atlas Copco conducted a human rights due diligence in Myanmar. The Group has a limited direct presence in the market and local business development will proceed cautiously to address the risks that have been identified.
In 2016,sustainability risk assessments will be carried out for distributors, agents and contractors in select high risk countries.
GEOGRAPHICAL SPREAD OF SUPPLIERS
Asia/Australia, 36%
North America,14%
Europe, 48%South America,
2%
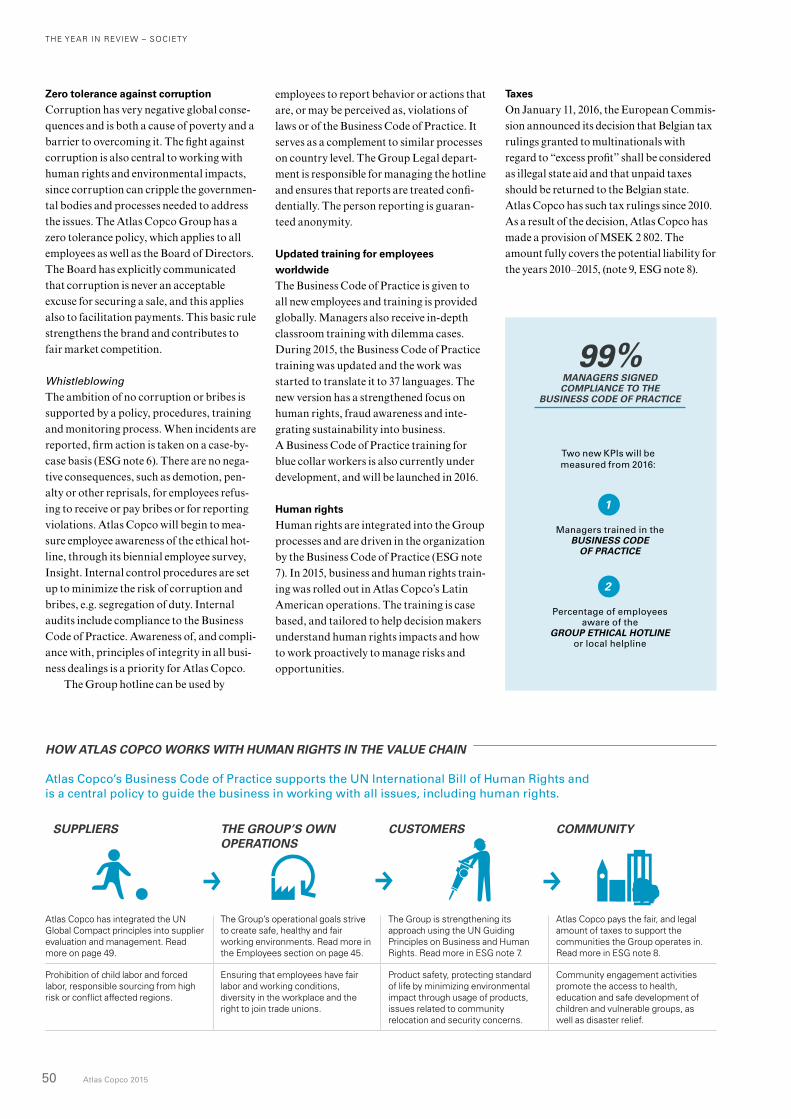
THE YEAR IN REVIEW – SOCIETY
50 Atlas Copco 2015
Zero tolerance against corruption
Corruption has very negative global conse-quences and is both a cause of poverty and a barrier to overcoming it. The fight against corruption is also central to working with human rights and environmental impacts, since corruption can cripple the governmen-tal bodies and processes needed to address the issues. The Atlas Copco Group has a zero tolerance policy, which applies to all employees as well as the Board of Directors. The Board has explicitly communicated that corruption is never an acceptable excuse for securing a sale, and this applies also to facilitation payments. This basic rule strengthens the brand and contributes to fair market competition.
WhistleblowingThe ambition of no corruption or bribes is supported by a policy, procedures, training and monitoring process. When incidents are reported, firm action is taken on a case-by-case basis (ESG note 6). There are no nega-tive consequences, such as demotion, pen-alty or other reprisals, for employees refus-ing to receive or pay bribes or for reporting violations. Atlas Copco will begin to mea-sure employee awareness of the ethical hot-line, through its biennial employee survey, Insight. Internal control procedures are set up to minimize the risk of corruption and bribes, e.g. segregation of duty. Internal audits include compliance to the Business Code of Practice. Awareness of, and compli-ance with, principles of integrity in all busi-ness dealings is a priority for Atlas Copco.
The Group hotline can be used by
HOW ATLAS COPCO WORKS WITH HUMAN RIGHTS IN THE VALUE CHAIN
Atlas Copco’s Business Code of Practice supports the UN International Bill of Human Rights and is a central policy to guide the business in working with all issues, including human rights.
10
101010
SUPPLIERS THE GROUP’S OWN OPERATIONS
CUSTOMERS COMMUNITY
Atlas Copco has integrated the UN Global Compact principles into supplier evaluation and management. Read more on page 49.
The Group’s operational goals strive to create safe, healthy and fair working environments. Read more in the Employees section on page 45.
The Group is strengthening its approach using the UN Guiding Principles on Business and Human Rights. Read more in ESG note 7.
Atlas Copco pays the fair, and legal amount of taxes to support the communities the Group operates in. Read more in ESG note 8.
Prohibition of child labor and forced labor, responsible sourcing from high risk or conflict affected regions.
Ensuring that employees have fair labor and working conditions, diversity in the workplace and the right to join trade unions.
Product safety, protecting standard of life by minimizing environmental impact through usage of products, issues related to community relocation and security concerns.
Community engagement activities promote the access to health, education and safe development of children and vulnerable groups, as well as disaster relief.
99%MANAGERS SIGNED COMPLIANCE TO THE
BUSINESS CODE OF PRACTICE
Two new KPIs will be measured from 2016:
1
Managers trained in the BUSINESS CODE
OF PRACTICE
2
Percentage of employees aware of the
GROUP ETHICAL HOTLINE or local helpline
employees to report behavior or actions that are, or may be perceived as, violations of laws or of the Business Code of Practice. It serves as a complement to similar processes on country level. The Group Legal depart-ment is responsible for managing the hotline and ensures that reports are treated confi-dentially. The person reporting is guaran-teed anonymity.
Updated training for employees
worldwide
The Business Code of Practice is given to all new employees and training is provided globally. Managers also receive in-depth classroom training with dilemma cases. During 2015, the Business Code of Practice training was updated and the work was started to translate it to 37 languages. The new version has a strengthened focus on human rights, fraud awareness and inte-grating sustainability into business. A Business Code of Practice training for blue collar workers is also currently under development, and will be launched in 2016.
Human rights
Human rights are integrated into the Group processes and are driven in the organization by the Business Code of Practice (ESG note 7). In 2015, business and human rights train-ing was rolled out in Atlas Copco’s Latin American operations. The training is case based, and tailored to help decision makers understand human rights impacts and how to work proactively to manage risks and opportunities.
Taxes
On January 11, 2016, the European Commis-sion announced its decision that Belgian tax rulings granted to multinationals with regard to “excess profit” shall be considered as illegal state aid and that unpaid taxes should be returned to the Belgian state. Atlas Copco has such tax rulings since 2010. As a result of the decision, Atlas Copco has made a provision of MSEK 2 802. The amount fully covers the potential liability for the years 2010–2015, (note 9, ESG note 8).
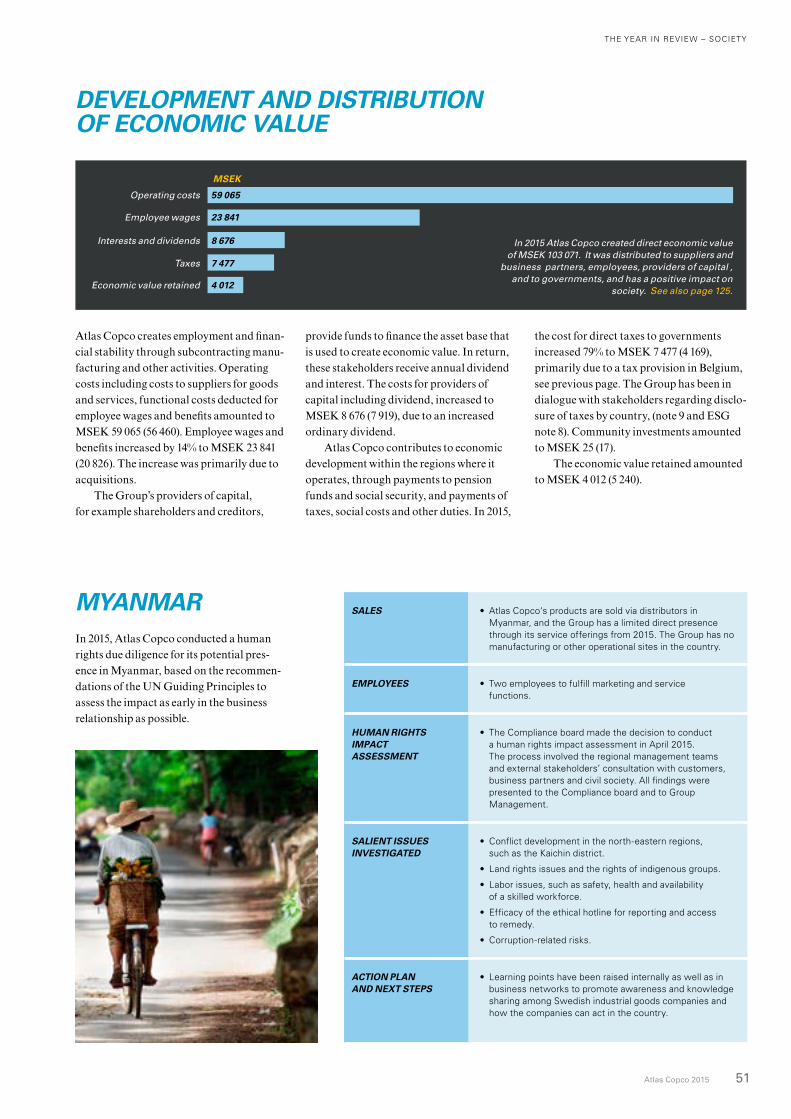
THE YEAR IN REVIEW – SOCIETY
Atlas Copco 2015 51
Atlas Copco creates employment and finan-cial stability through subcontracting manu-facturing and other activities. Operating costs including costs to suppliers for goods and services, functional costs deducted for employee wages and benefits amounted to MSEK 59 065 (56 460). Employee wages and benefits increased by 14% to MSEK 23 841 (20 826). The increase was primarily due to acquisitions.
The Group’s providers of capital, for example shareholders and creditors,
SALES • Atlas Copco‘s products are sold via distributors in Myanmar, and the Group has a limited direct presence through its service offerings from 2015. The Group has no manu facturing or other operational sites in the country.
EMPLOYEES • Two employees to fulfill marketing and service functions.
HUMAN RIGHTS IMPACT ASSESSMENT
• The Compliance board made the decision to conduct a human rights impact assessment in April 2015. The process involved the regional management teams and external stakeholders’ consultation with customers, business partners and civil society. All findings were presented to the Compliance board and to Group Management.
SALIENT ISSUES INVESTIGATED
• Conflict development in the north-eastern regions, such as the Kaichin district.
• Land rights issues and the rights of indigenous groups.
• Labor issues, such as safety, health and availability of a skilled workforce.
• Efficacy of the ethical hotline for reporting and access to remedy.
• Corruption-related risks.
ACTION PLAN AND NEXT STEPS
• Learning points have been raised internally as well as in business networks to promote awareness and knowledge sharing among Swedish industrial goods companies and how the companies can act in the country.
provide funds to finance the asset base that is used to create economic value. In return, these stakeholders receive annual dividend and interest. The costs for providers of capital in cluding dividend, increased to MSEK 8 676 (7 919), due to an increased ordinary dividend.
Atlas Copco contributes to economic development within the regions where it operates, through payments to pension funds and social security, and payments of taxes, social costs and other duties. In 2015,
DEVELOPMENT AND DISTRIBUTION OF ECONOMIC VALUE
the cost for direct taxes to governments increased 79% to MSEK 7 477 (4 169), primarily due to a tax provision in Belgium, see previous page. The Group has been in dialogue with stakeholders regarding disclo-sure of taxes by country, (note 9 and ESG note 8). Community investments amounted to MSEK 25 (17).
The economic value retained amounted to MSEK 4 012 (5 240).
Economic value retained
Taxes to governments
Costs for providers of capital
Employee wages
Operating costs
MSEK
In 2015 Atlas Copco created direct economic value of MSEK 103 071. It was distributed to suppliers and
business partners, employees, providers of capital , and to governments, and has a positive impact on
society. See also page 125.
Operating costs 59 065
Employee wages 23 841
Interests and dividends 8 676
Taxes 7 477
Economic value retained 4 012
MYANMARIn 2015, Atlas Copco conducted a human rights due diligence for its potential pres-ence in Myanmar, based on the recommen-dations of the UN Guiding Principles to assess the impact as early in the business relationship as possible.
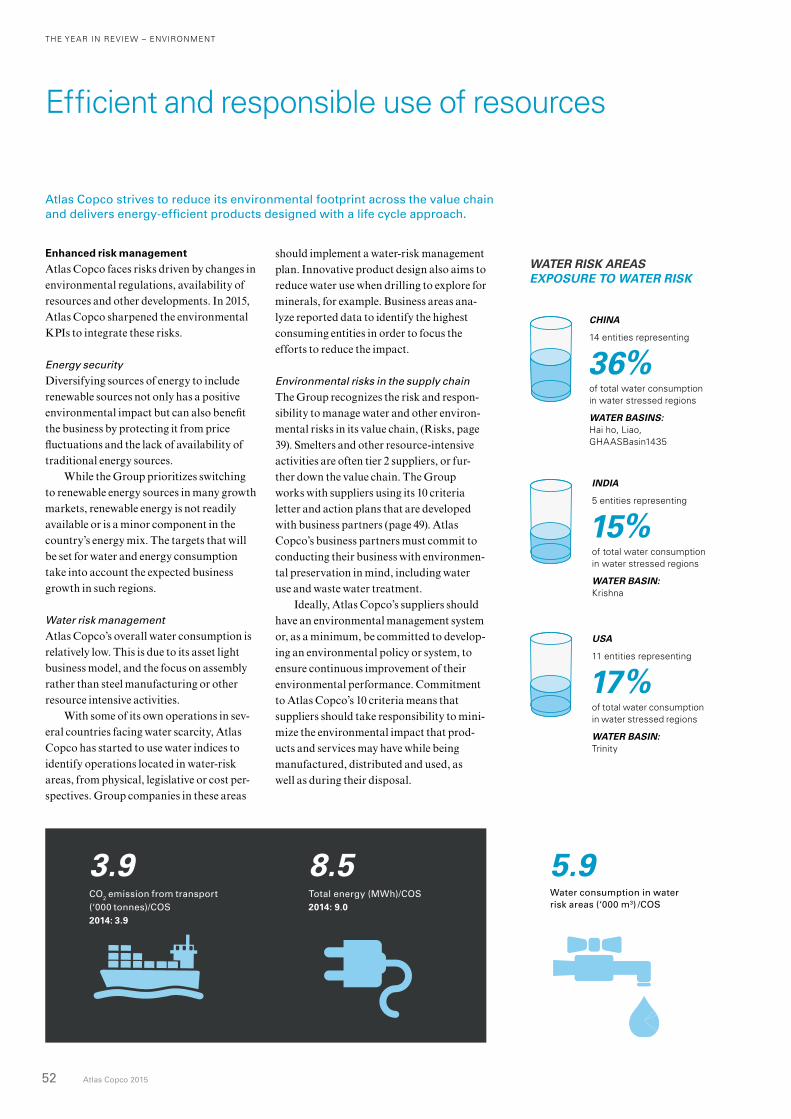
52 Atlas Copco 2015
should implement a water-risk management plan. Innovative product design also aims to reduce water use when drilling to explore for minerals, for example. Business areas ana-lyze reported data to identify the highest consuming entities in order to focus the efforts to reduce the impact.
Environmental risks in the supply chainThe Group recognizes the risk and respon-sibility to manage water and other environ-mental risks in its value chain, (Risks, page 39). Smelters and other resource-intensive activities are often tier 2 suppliers, or fur-ther down the value chain. The Group works with suppliers using its 10 criteria letter and action plans that are developed with business partners (page 49). Atlas Copco’s business partners must commit to conducting their business with environmen-tal preservation in mind, including water use and waste water treatment.
Ideally, Atlas Copco’s suppliers should have an environmental management system or, as a minimum, be committed to develop-ing an environmental policy or system, to ensure continuous improvement of their environmental performance. Commitment to Atlas Copco’s 10 criteria means that suppliers should take responsibility to mini-mize the environmental impact that prod-ucts and services may have while being manufactured, distributed and used, as well as during their disposal.
THE YEAR IN REVIEW – ENVIRONMENT
Efficient and responsible use of resources
Atlas Copco strives to reduce its environmental footprint across the value chain and delivers energy-efficient products designed with a life cycle approach.
Enhanced risk management
Atlas Copco faces risks driven by changes in environmental regulations, availability of resources and other developments. In 2015, Atlas Copco sharpened the environmental KPIs to integrate these risks.
Energy security Diversifying sources of energy to include renewable sources not only has a positive environmental impact but can also benefit the business by protecting it from price fluctuations and the lack of availability of traditional energy sources.
While the Group prioritizes switching to renewable energy sources in many growth markets, renewable energy is not readily available or is a minor component in the country’s energy mix. The targets that will be set for water and energy consumption take into account the expected business growth in such regions.
Water risk managementAtlas Copco’s overall water consumption is relatively low. This is due to its asset light business model, and the focus on assembly rather than steel manufacturing or other resource intensive activities.
With some of its own operations in sev-eral countries facing water scarcity, Atlas Copco has started to use water indices to identify operations located in water-risk areas, from physical, legis lative or cost per-spectives. Group companies in these areas
3.9CO2 emission from transport (‘000 tonnes)/COS 2014: 3.9
8.5Total energy (MWh)/COS2014: 9.0
5.9Water consumption in water risk areas (‘000 m3) /COS
WATER RISK AREAS EXPOSURE TO WATER RISK
CHINA
14 entities representing
36%of total water consumption in water stressed regions
WATER BASINS:Hai ho, Liao, GHAASBasin1435
USA
11 entities representing
17%of total water consumption in water stressed regions
WATER BASIN: Trinity
INDIA
5 entities representing
15%of total water consumption in water stressed regions
WATER BASIN: Krishna
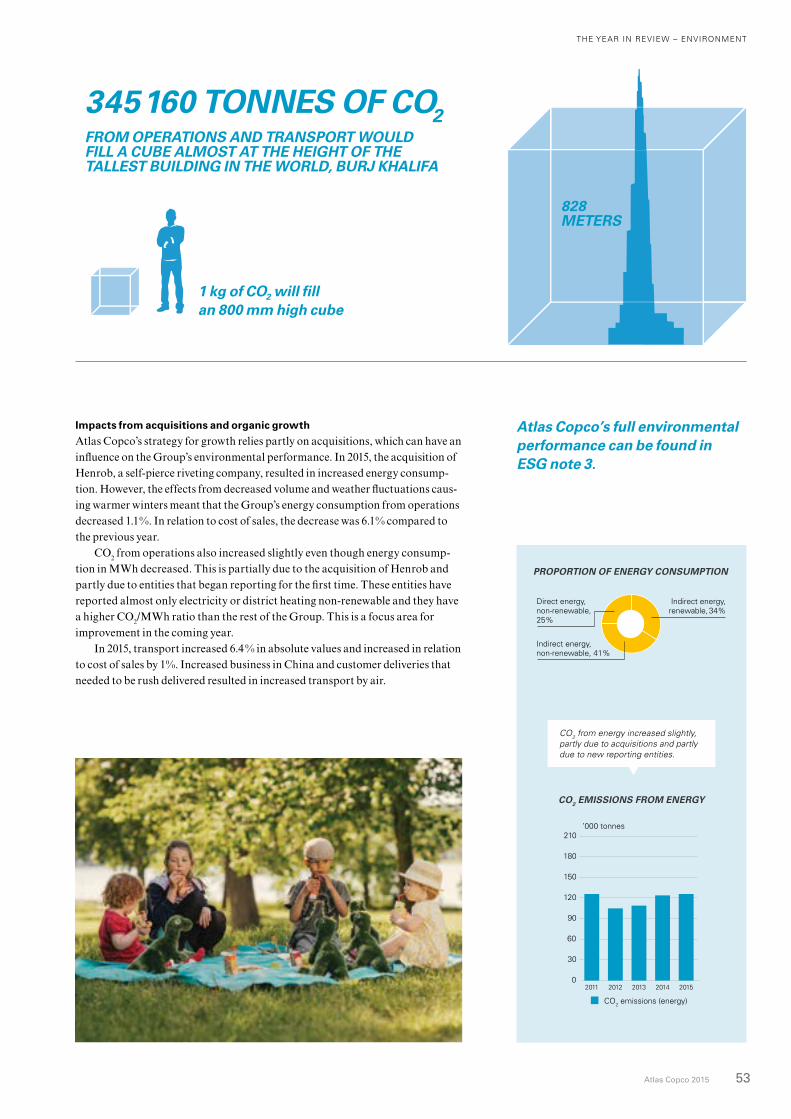
Atlas Copco 2015 53
THE YEAR IN REVIEW – ENVIRONMENT
PROPORTION OF ENERGY CONSUMPTION
Direct energy, non-renewable, 25%
Indirect energy,renewable, 34%
Indirect energy,non-renewable, 41%
0
30
60
90
120
150
180
210
20152014201320122011
’000 tonnes
CO2 emissions (energy)
Target: –20% (2020)
0
20
40
60
80
100
120
1009080706
’000 tons
CO2 emissions (energy)
0
20
40
60
80
100
120Index
Index in relation to cost of sales
Target: –20% (2020)
0
20
40
60
80
100
120
201110090807
’000 tons
CO2 emissions (energy)
0
20
40
60
80
100
120Index
Index in relation to cost of sales
GOAL
CO2 EMISSIONS FROM ENERGY
CO2 from energy increased slightly, partly due to acquisitions and partly due to new reporting entities.
345 160 TONNES OF CO2FROM OPERATIONS AND TRANSPORT WOULD FILL A CUBE ALMOST AT THE HEIGHT OF THE TALLEST BUILDING IN THE WORLD, BURJ KHALIFA
1 kg of CO2 will fill an 800 mm high cube
828 METERS
Atlas Copco’s full environmental performance can be found in ESG note 3.
Impacts from acquisitions and organic growth
Atlas Copco’s strategy for growth relies partly on acquisitions, which can have an influence on the Group’s environmental performance. In 2015, the acquisition of Henrob, a self-pierce riveting company, resulted in increased energy consump-tion. However, the effects from decreased volume and weather fluctuations caus-ing warmer winters meant that the Group’s energy consumption from operations decreased 1.1%. In relation to cost of sales, the decrease was 6.1% compared to the previous year.
CO2 from operations also increased slightly even though energy consump-tion in MWh decreased. This is partially due to the acquisition of Henrob and partly due to entities that began reporting for the first time. These entities have reported almost only electricity or district heating non-renewable and they have a higher CO2/MWh ratio than the rest of the Group. This is a focus area for improvement in the coming year.
In 2015, transport increased 6.4% in absolute values and increased in relation to cost of sales by 1%. Increased business in China and customer deliveries that needed to be rush delivered resulted in increased transport by air.
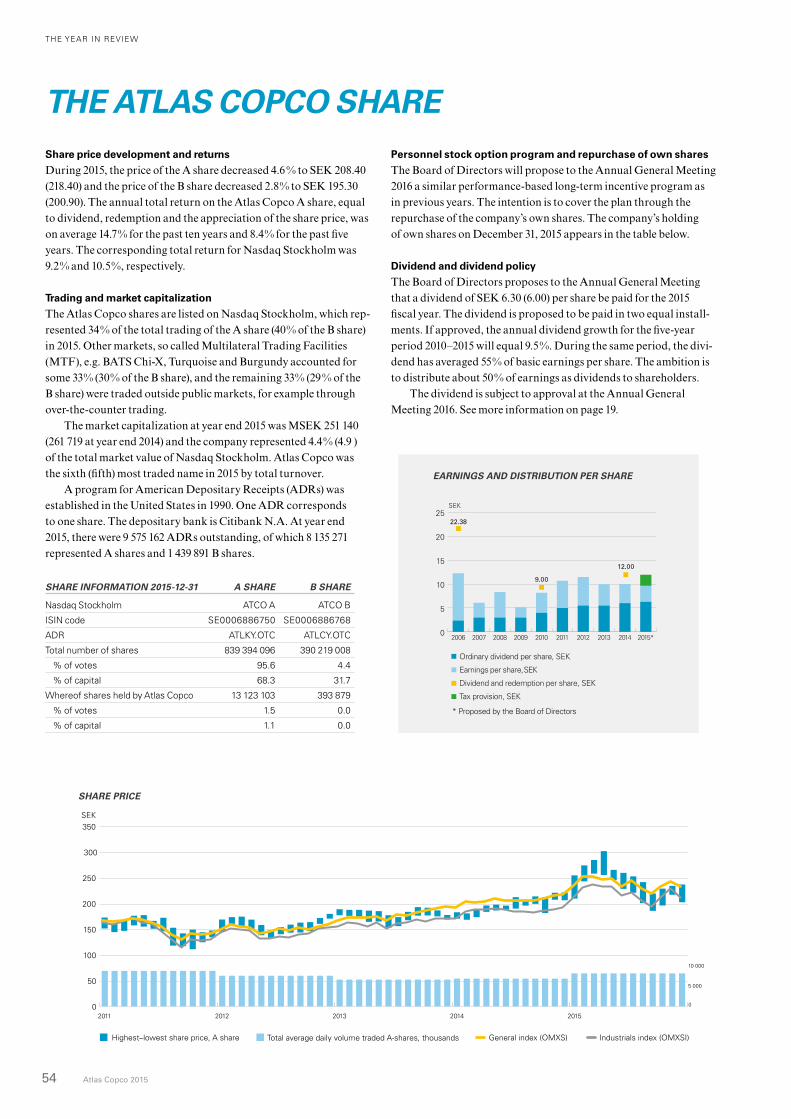
THE YEAR IN REVIEW
54 Atlas Copco 2015
0
50
100
150
200
250
300
350
20152014201320122011
SEK
Highest–lowest share price, A share General index (OMXS) Industrials index (OMXSI)
0100000
200000 300000
400000500000 600000700000800000900000100000011000001200000130000014000001500000
16000001700000180000019000002000000
Total average daily volume traded A-shares, thousands
0
5 000
10 000
EARNINGS AND DISTRIBUTION PER SHARE
THE ATLAS COPCO SHAREShare price development and returns
During 2015, the price of the A share decreased 4.6% to SEK 208.40 (218.40) and the price of the B share decreased 2.8% to SEK 195.30 (200.90). The annual total return on the Atlas Copco A share, equal to dividend, redemption and the appreciation of the share price, was on average 14.7% for the past ten years and 8.4% for the past five years. The corresponding total return for Nasdaq Stockholm was 9.2% and 10.5%, respectively.
Trading and market capitalization
The Atlas Copco shares are listed on Nasdaq Stockholm, which rep-resented 34% of the total trading of the A share (40% of the B share) in 2015. Other markets, so called Multilateral Trading Facilities (MTF), e.g. BATS Chi-X, Turquoise and Burgundy accounted for some 33% (30% of the B share), and the remaining 33% (29% of the B share) were traded outside public markets, for example through over-the-counter trading.
The market capitalization at year end 2015 was MSEK 251 140 (261 719 at year end 2014) and the company represented 4.4% (4.9 ) of the total market value of Nasdaq Stockholm. Atlas Copco was the sixth (fifth) most traded name in 2015 by total turnover.
A program for American Depositary Receipts (ADRs) was established in the United States in 1990. One ADR corresponds to one share. The depositary bank is Citibank N.A. At year end 2015, there were 9 575 162 ADRs outstanding, of which 8 135 271 represented A shares and 1 439 891 B shares.
SHARE INFORMATION 2015-12-31 A SHARE B SHARE
Nasdaq Stockholm ATCO A ATCO B
ISIN code SE0006886750 SE0006886768
ADR ATLKY.OTC ATLCY.OTC
Total number of shares 839 394 096 390 219 008
% of votes 95.6 4.4
% of capital 68.3 31.7
Whereof shares held by Atlas Copco 13 123 103 393 879
% of votes 1.5 0.0
% of capital 1.1 0.0
Personnel stock option program and repurchase of own shares
The Board of Directors will propose to the Annual General Meeting 2016 a similar performance-based long-term incentive program as in previous years. The intention is to cover the plan through the repurchase of the company’s own shares. The company’s holding of own shares on December 31, 2015 appears in the table below.
Dividend and dividend policy
The Board of Directors proposes to the Annual General Meetingthat a dividend of SEK 6.30 (6.00) per share be paid for the 2015 fiscal year. The dividend is proposed to be paid in two equal install-ments. If approved, the annual dividend growth for the five-year period 2010–2015 will equal 9.5%. During the same period, the divi-dend has averaged 55% of basic earnings per share. The ambition is to distribute about 50% of earnings as dividends to shareholders.
The dividend is subject to approval at the Annual General Meeting 2016. See more information on page 19.
SHARE PRICE
SEK
0
5
10
15
20
25
2015*201420132012201120102009200820072006
22.38
9.00
12.00
Ordinary dividend per share, SEK
Earnings per share, SEK
Dividend and redemption per share, SEK
Tax provision, SEK
* Proposed by the Board of Directors
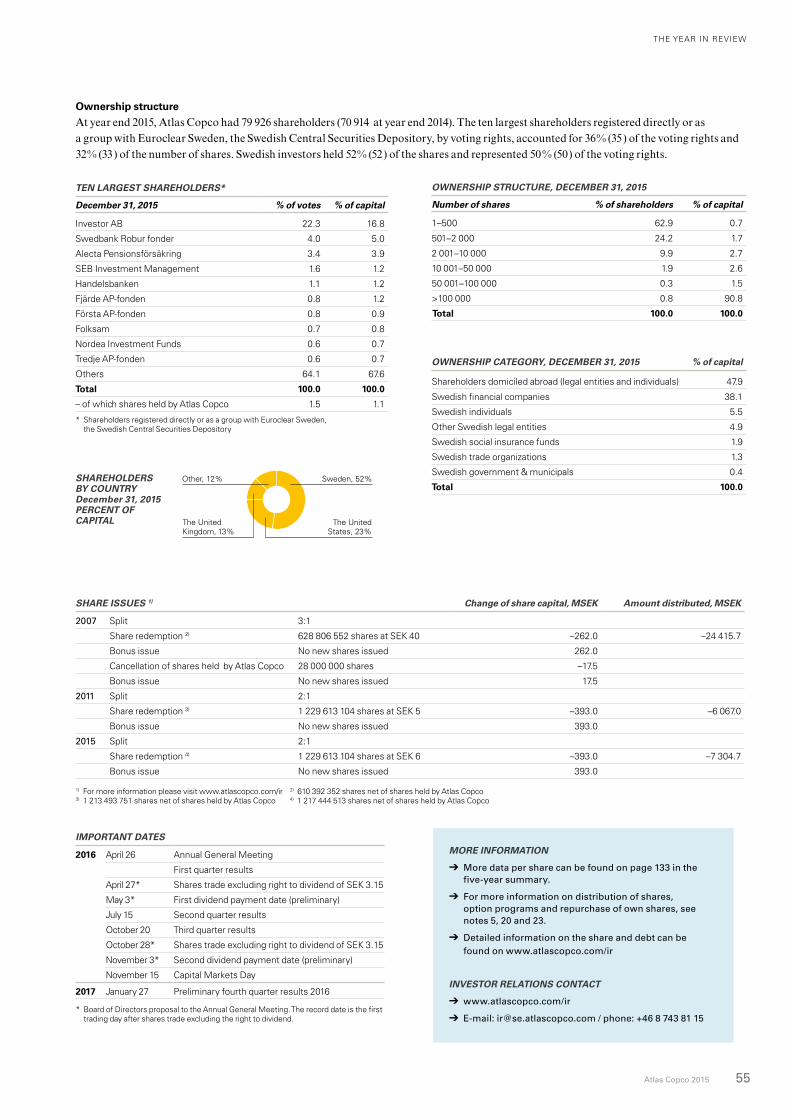
THE YEAR IN REVIEW
Atlas Copco 2015 55
SHARE ISSUES 1) Change of share capital, MSEK Amount distributed, MSEK
2007 Split 3:1
Share redemption 2) 628 806 552 shares at SEK 40 –262.0 –24 415.7
Bonus issue No new shares issued 262.0
Cancellation of shares held by Atlas Copco 28 000 000 shares –17.5
Bonus issue No new shares issued 17.5
2011 Split 2:1
Share redemption 3) 1 229 613 104 shares at SEK 5 –393.0 –6 067.0
Bonus issue No new shares issued 393.0
2015 Split 2:1
Share redemption 4) 1 229 613 104 shares at SEK 6 –393.0 –7 304.7
Bonus issue No new shares issued 393.0
1) For more information please visit www.atlascopco.com/ir 2) 610 392 352 shares net of shares held by Atlas Copco 3) 1 213 493 751 shares net of shares held by Atlas Copco 4) 1 217 444 513 shares net of shares held by Atlas Copco
IMPORTANT DATES
2016 April 26 Annual General Meeting
First quarter results
April 27* Shares trade excluding right to dividend of SEK 3.15
May 3* First dividend payment date (preliminary)
July 15 Second quarter results
October 20 Third quarter results
October 28* Shares trade excluding right to dividend of SEK 3.15
November 3* Second dividend payment date (preliminary)
November 15 Capital Markets Day
2017 January 27 Preliminary fourth quarter results 2016
* Board of Directors proposal to the Annual General Meeting. The record date is the first trading day after shares trade excluding the right to dividend.
SHAREHOLDERS BY COUNTRY December 31, 2015 PERCENT OF CAPITAL
Other, 12% Sweden, 52%
The United Kingdom, 13%
The UnitedStates, 23%
TEN LARGEST SHAREHOLDERS*
December 31, 2015 % of votes % of capital
Investor AB 22.3 16.8
Swedbank Robur fonder 4.0 5.0
Alecta Pensionsförsäkring 3.4 3.9
SEB Investment Management 1.6 1.2
Handelsbanken 1.1 1.2
Fjärde AP-fonden 0.8 1.2
Första AP-fonden 0.8 0.9
Folksam 0.7 0.8
Nordea Investment Funds 0.6 0.7
Tredje AP-fonden 0.6 0.7
Others 64.1 67.6
Total 100.0 100.0
– of which shares held by Atlas Copco 1.5 1.1
* Shareholders registered directly or as a group with Euroclear Sweden, the Swedish Central Securities Depository
OWNERSHIP STRUCTURE, DECEMBER 31, 2015
Number of shares % of shareholders % of capital
1–500 62.9 0.7
501–2 000 24.2 1.7
2 001–10 000 9.9 2.7
10 001–50 000 1.9 2.6
50 001–100 000 0.3 1.5
>100 000 0.8 90.8
Total 100.0 100.0
OWNERSHIP CATEGORY, DECEMBER 31, 2015 % of capital
Shareholders domiciled abroad (legal entities and individuals) 47.9
Swedish financial companies 38.1
Swedish individuals 5.5
Other Swedish legal entities 4.9
Swedish social insurance funds 1.9
Swedish trade organizations 1.3
Swedish government & municipals 0.4
Total 100.0
Ownership structure
At year end 2015, Atlas Copco had 79 926 shareholders (70 914 at year end 2014). The ten largest shareholders registered directly or as a group with Euroclear Sweden, the Swedish Central Securities Depository, by voting rights, accounted for 36% (35) of the voting rights and 32% (33) of the number of shares. Swedish investors held 52% (52) of the shares and represented 50% (50) of the voting rights.
MORE INFORMATION
➔ More data per share can be found on page 133 in the five-year summary.
➔ For more information on distribution of shares, option programs and repurchase of own shares, see notes 5, 20 and 23.
➔ Detailed information on the share and debt can be found on www.atlascopco.com/ir
INVESTOR RELATIONS CONTACT
➔ www.atlascopco.com/ir
➔ E-mail: [email protected] / phone: +46 8 743 81 15
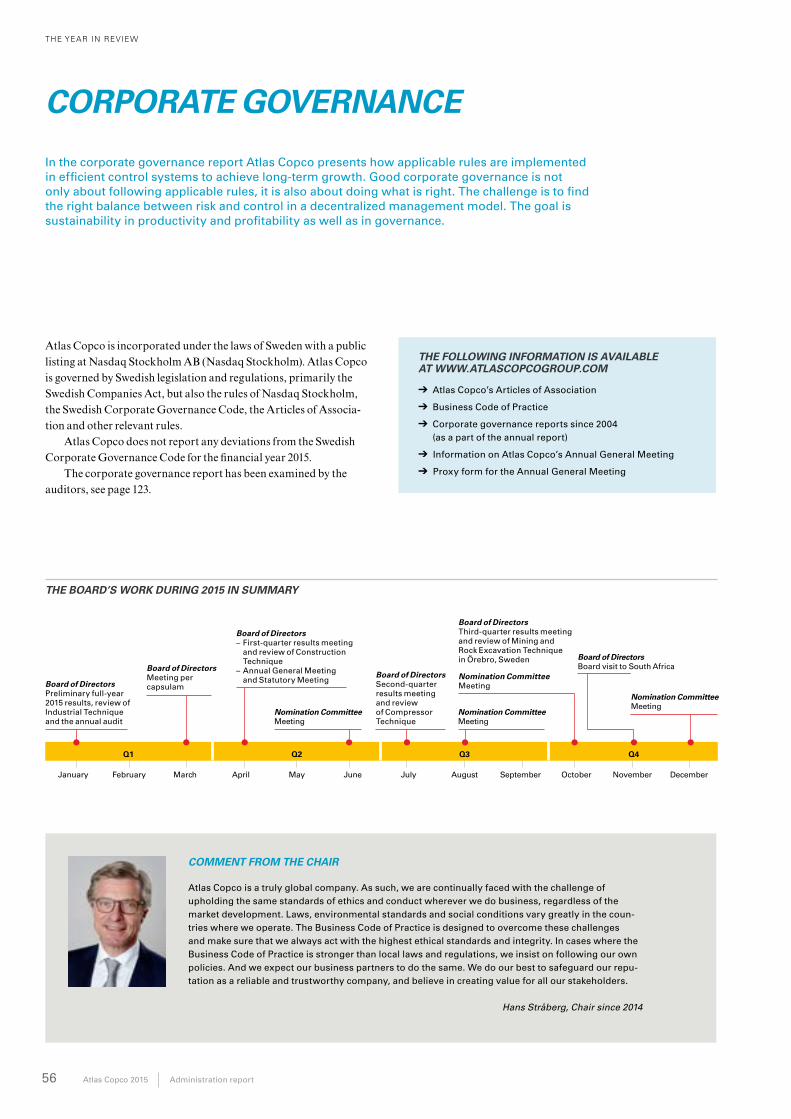
56 Atlas Copco 2015 Administration report
THE YEAR IN REVIEW
In the corporate governance report Atlas Copco presents how applicable rules are implemented in efficient control systems to achieve long-term growth. Good corporate governance is not only about following applicable rules, it is also about doing what is right. The challenge is to find the right balance between risk and control in a decentralized management model. The goal is sustainability in pro ductivity and profitability as well as in governance.
CORPORATE GOVERNANCE
THE BOARD’S WORK DURING 2015 IN SUMMARY
Q1 Q2 Q3 Q4
January February March April May June July August September October November December
Board of Directors Preliminary full-year 2015 results, review of Industrial Technique and the annual audit
Board of Directors Meeting per capsulam
Board of Directors – First-quarter results meeting
and review of Construction Technique
– Annual General Meeting and Statutory Meeting
Board of Directors Second-quarter results meeting and review of Compressor Technique
Board of Directors Third-quarter results meeting and review of Mining and Rock Excavation Technique in Örebro, Sweden
Nomination Committee Meeting
Board of DirectorsBoard visit to South Africa
THE FOLLOWING INFORMATION IS AVAILABLE AT WWW.ATLASCOPCOGROUP.COM
➔ Atlas Copco’s Articles of Association
➔ Business Code of Practice
➔ Corporate governance reports since 2004 (as a part of the annual report)
➔ Information on Atlas Copco’s Annual General Meeting
➔ Proxy form for the Annual General Meeting
Atlas Copco is incorporated under the laws of Sweden with a public listing at Nasdaq Stockholm AB (Nasdaq Stockholm). Atlas Copco is governed by Swedish legislation and regulations, primarily the Swedish Companies Act, but also the rules of Nasdaq Stockholm, the Swedish Corporate Governance Code, the Articles of Associa-tion and other relevant rules.
Atlas Copco does not report any deviations from the Swedish Corporate Governance Code for the financial year 2015.
The corporate governance report has been examined by the auditors, see page 123.
Nomination Committee Meeting
COMMENT FROM THE CHAIR
Atlas Copco is a truly global company. As such, we are continually faced with the challenge of upholding the same standards of ethics and conduct wherever we do business, regardless of the market development. Laws, environmental standards and social conditions vary greatly in the coun-tries where we operate. The Business Code of Practice is designed to overcome these challenges and make sure that we always act with the highest ethical standards and integrity. In cases where the Business Code of Practice is stronger than local laws and regulations, we insist on following our own policies. And we expect our business partners to do the same. We do our best to safeguard our repu-tation as a reliable and trustworthy company, and believe in creating value for all our stakeholders.
Hans Stråberg, Chair since 2014
Nomination Committee Meeting
Nomination Committee Meeting
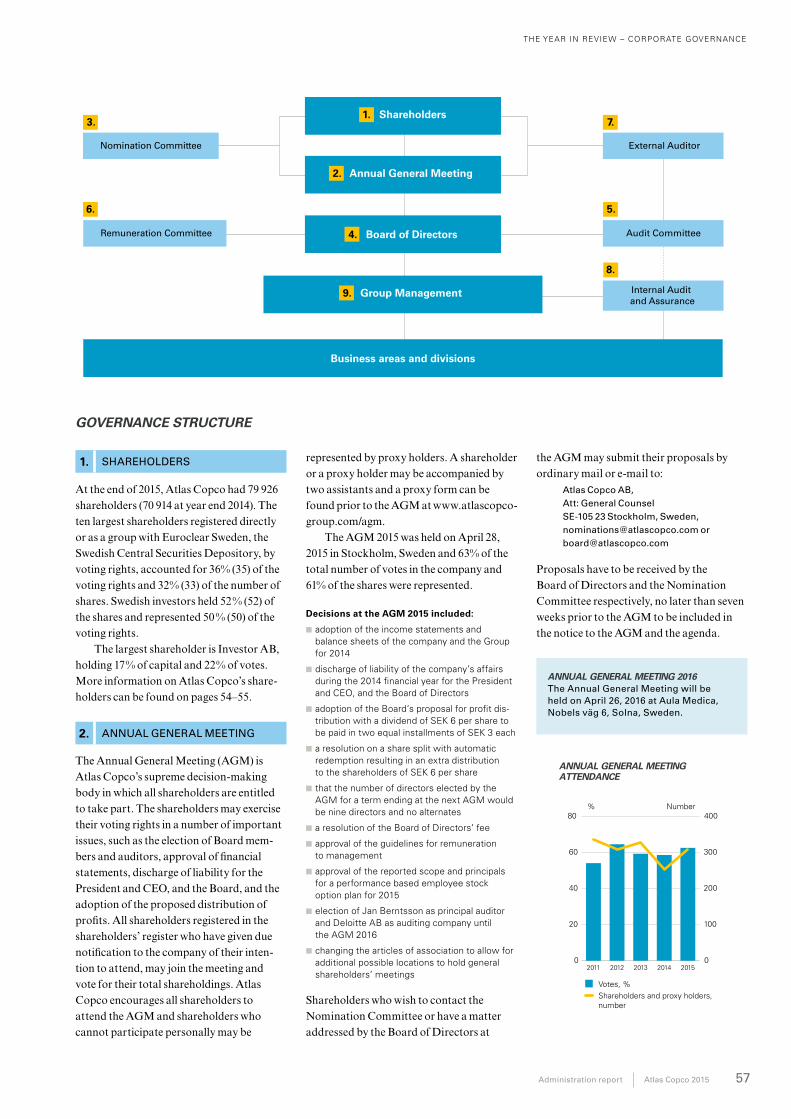
THE YEAR IN REVIEW – CORPORATE GOVERNANCE
Administration report Atlas Copco 2015 57
Nomination Committee
Internal Audit and Assurance
External Auditor
Business areas and divisions
Remuneration Committee
6.
3. 1. Shareholders
4. Board of Directors
2. Annual General Meeting
Audit Committee
5.
7.
8.
9. Group Management
1. SHAREHOLDERS
At the end of 2015, Atlas Copco had 79 926 shareholders (70 914 at year end 2014). The ten largest shareholders registered directly or as a group with Euroclear Sweden, the Swedish Central Securities Depository, by voting rights, accounted for 36% (35) of the voting rights and 32% (33) of the number of shares. Swedish investors held 52% (52) of the shares and represented 50% (50) of the voting rights.
The largest shareholder is Investor AB, holding 17% of capital and 22% of votes. More information on Atlas Copco’s share-holders can be found on pages 54–55.
2. ANNUAL GENERAL MEETING
The Annual General Meeting (AGM) is Atlas Copco’s supreme decision-making body in which all shareholders are entitled to take part. The shareholders may exercise their voting rights in a number of important issues, such as the election of Board mem-bers and auditors, approval of financial statements, discharge of liability for the President and CEO, and the Board, and the adoption of the proposed distribution of profits. All shareholders registered in the shareholders’ register who have given due notification to the company of their inten-tion to attend, may join the meeting and vote for their total shareholdings. Atlas Copco encourages all shareholders to attend the AGM and shareholders who cannot participate personally may be
represented by proxy holders. A shareholder or a proxy holder may be accompanied by two assistants and a proxy form can be found prior to the AGM at www.atlascopco-group.com/agm.
The AGM 2015 was held on April 28, 2015 in Stockholm, Sweden and 63% of the total number of votes in the company and 61% of the shares were represented.
Decisions at the AGM 2015 included:
■ adoption of the income statements and balance sheets of the company and the Group for 2014
■ discharge of liability of the company’s affairs during the 2014 financial year for the President and CEO, and the Board of Directors
■ adoption of the Board’s proposal for profit dis-tribution with a dividend of SEK 6 per share to be paid in two equal installments of SEK 3 each
■ a resolution on a share split with automatic redemption resulting in an extra distribution to the shareholders of SEK 6 per share
■ that the number of directors elected by the AGM for a term ending at the next AGM would be nine directors and no alternates
■ a resolution of the Board of Directors’ fee
■ approval of the guidelines for remuneration to management
■ approval of the reported scope and principals for a performance based employee stock option plan for 2015
■ election of Jan Berntsson as principal auditor and Deloitte AB as auditing company until the AGM 2016
■ changing the articles of association to allow for additional possible locations to hold general shareholders’ meetings
Shareholders who wish to contact the Nomination Committee or have a matter addressed by the Board of Directors at
the AGM may submit their proposals by ordinary mail or e-mail to:
Atlas Copco AB, Att: General Counsel SE-105 23 Stockholm, Sweden, [email protected] [email protected]
Proposals have to be received by the Board of Directors and the Nomination Committee respectively, no later than seven weeks prior to the AGM to be included in the notice to the AGM and the agenda.
ANNUAL GENERAL MEETING 2016The Annual General Meeting will be held on April 26, 2016 at Aula Medica, Nobels väg 6, Solna, Sweden.
ANNUAL GENERAL MEETING ATTENDANCE
0
20
40
60
80
201520142013201220110
100
200
300
400%
Votes, %
Number
Shareholders and proxy holders, number
GOVERNANCE STRUCTURE
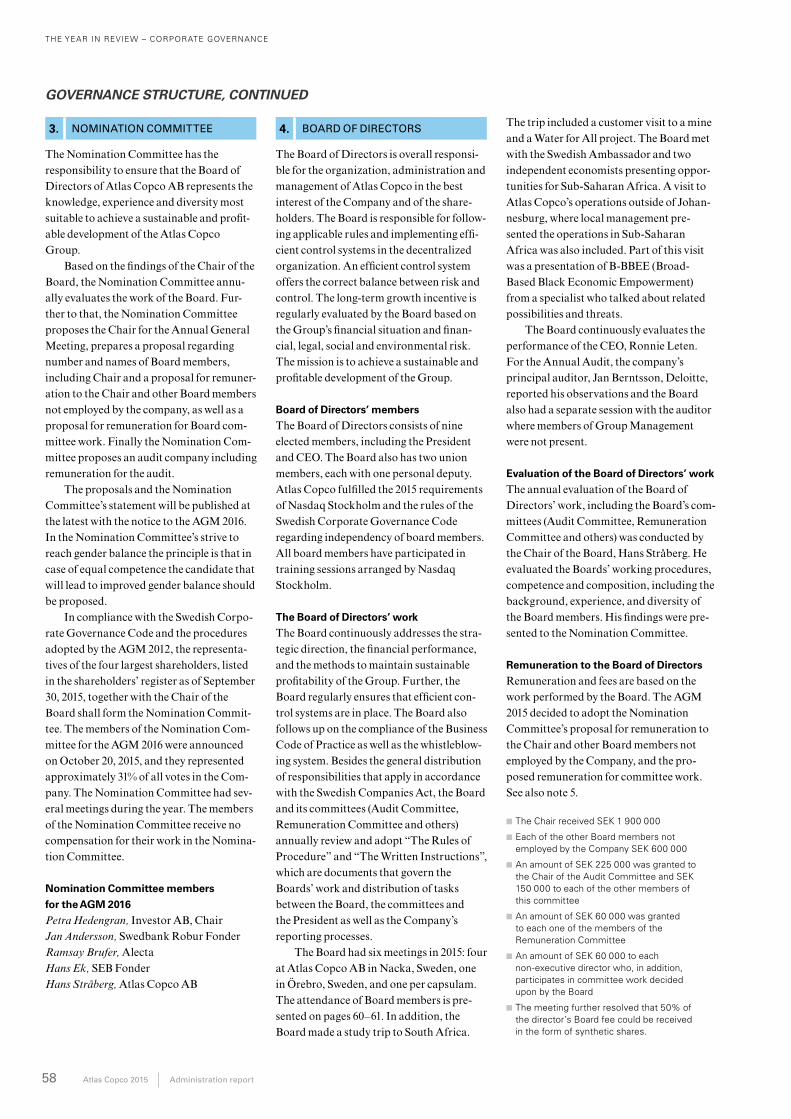
THE YEAR IN REVIEW – CORPORATE GOVERNANCE
58 Atlas Copco 2015 Administration report
3. NOMINATION COMMITTEE
The Nomination Committee has the responsibility to ensure that the Board of Directors of Atlas Copco AB represents the knowledge, experience and diversity most suitable to achieve a sustainable and profit-able development of the Atlas Copco Group.
Based on the findings of the Chair of the Board, the Nomination Committee annu-ally evaluates the work of the Board. Fur-ther to that, the Nomination Committee proposes the Chair for the Annual General Meeting, prepares a proposal regarding number and names of Board members, including Chair and a proposal for remuner-ation to the Chair and other Board members not employed by the company, as well as a proposal for remuneration for Board com-mittee work. Finally the Nomination Com-mittee proposes an audit company including remuneration for the audit.
The proposals and the Nomination Committee’s statement will be published at the latest with the notice to the AGM 2016. In the Nomination Committee’s strive to reach gender balance the principle is that in case of equal competence the candidate that will lead to improved gender balance should be proposed.
In compliance with the Swedish Corpo-rate Governance Code and the procedures adopted by the AGM 2012, the representa-tives of the four largest shareholders, listed in the shareholders’ register as of September 30, 2015, together with the Chair of the Board shall form the Nomination Commit-tee. The members of the Nomination Com-mittee for the AGM 2016 were announced on October 20, 2015, and they represented approximately 31% of all votes in the Com-pany. The Nomination Committee had sev-eral meetings during the year. The members of the Nomination Committee receive no compensation for their work in the Nomina-tion Committee.
Nomination Committee members
for the AGM 2016
Petra Hedengran, Investor AB, ChairJan Andersson, Swedbank Robur Fonder Ramsay Brufer, AlectaHans Ek, SEB Fonder Hans Stråberg, Atlas Copco AB
GOVERNANCE STRUCTURE, CONTINUED
4. BOARD OF DIRECTORS
The Board of Directors is overall responsi-ble for the organization, administration and management of Atlas Copco in the best interest of the Company and of the share-holders. The Board is responsible for follow-ing applicable rules and implementing effi-cient control systems in the decentralized organization. An efficient control system offers the correct balance between risk and control. The long-term growth incentive is regularly evaluated by the Board based on the Group’s financial situation and finan-cial, legal, social and environmental risk. The mission is to achieve a sustainable and profitable development of the Group.
Board of Directors’ members
The Board of Directors consists of nine elected members, including the President and CEO. The Board also has two union members, each with one personal deputy. Atlas Copco fulfilled the 2015 requirements of Nasdaq Stockholm and the rules of the Swedish Corporate Governance Code regarding independency of board members. All board members have participated in training sessions arranged by Nasdaq Stockholm.
The Board of Directors’ work
The Board continuously addresses the stra-tegic direction, the financial performance, and the methods to maintain sustainable profitability of the Group. Further, the Board regularly ensures that efficient con-trol systems are in place. The Board also follows up on the compliance of the Business Code of Practice as well as the whistleblow-ing system. Besides the general distribution of responsibilities that apply in accordance with the Swedish Companies Act, the Board and its committees (Audit Committee, Remuneration Committee and others) annually review and adopt “The Rules of Procedure” and “The Written Instructions”, which are documents that govern the Boards’ work and distribution of tasks between the Board, the committees and the President as well as the Company’s reporting processes.
The Board had six meetings in 2015: four at Atlas Copco AB in Nacka, Sweden, one in Örebro, Sweden, and one per capsulam. The attendance of Board members is pre-sented on pages 60–61. In addition, the Board made a study trip to South Africa.
The trip included a customer visit to a mine and a Water for All project. The Board met with the Swedish Ambassador and two independent economists presenting oppor-tunities for Sub-Saharan Africa. A visit to Atlas Copco’s operations outside of Johan-nesburg, where local management pre-sented the operations in Sub-Saharan Africa was also included. Part of this visit was a presentation of B-BBEE (Broad-Based Black Economic Empowerment) from a specialist who talked about related possibilities and threats.
The Board continuously evaluates the performance of the CEO, Ronnie Leten. For the Annual Audit, the company’s principal auditor, Jan Berntsson, Deloitte, reported his observations and the Board also had a separate session with the auditor where members of Group Management were not present.
Evaluation of the Board of Directors’ work
The annual evaluation of the Board of Directors’ work, including the Board’s com-mittees (Audit Committee, Remuneration Committee and others) was conducted by the Chair of the Board, Hans Stråberg. He evaluated the Boards’ working procedures, competence and composition, including the background, experience, and diversity of the Board members. His findings were pre-sented to the Nomination Committee.
Remuneration to the Board of Directors
Remuneration and fees are based on the work performed by the Board. The AGM 2015 decided to adopt the Nomination Committee’s proposal for remuneration to the Chair and other Board members not employed by the Company, and the pro-posed remuneration for committee work. See also note 5.
■ The Chair received SEK 1 900 000
■ Each of the other Board members not employed by the Company SEK 600 000
■ An amount of SEK 225 000 was granted to the Chair of the Audit Committee and SEK 150 000 to each of the other members of this committee
■ An amount of SEK 60 000 was granted to each one of the members of the Remuneration Committee
■ An amount of SEK 60 000 to each non-executive director who, in addition, participates in committee work decided upon by the Board
■ The meeting further resolved that 50% of the director’s Board fee could be received in the form of synthetic shares.
THE YEAR IN REVIEW – CORPORATE GOVERNANCE
Administration report Atlas Copco 2015 59
5. AUDIT COMMITTEE
The Audit Committee’s primary task is to support the Board of Directors in fulfilling its responsibilities in the areas of audit and internal control, accounting, financial reporting and risk management as well as to supervise the financial structure and opera-tions of the Group and approve financial guarantees, delegated by the Board. The Audit Committee work further includes reviewing internal audit procedures. The work of the Audit Committee is directed by the Audit Committee Charter, which is reviewed and approved annually by the Board. The Chair of the committee has the accounting competence required by the Swedish Companies Act and two of the members are independent from the Com-pany and its main shareholder.
During the year, the committee con-vened five times. All members were present at these meetings. All meetings of the Audit Committee have been reported to the Board of Directors and the corresponding Minutes have been distributed to the Board.
Audit Committee 2015–2016
Ulla Litzén, Chair Hans Stråberg Staffan BohmanJohan Forssell
6. REMUNERATION COMMITTEE
The Remuneration Committee’s primary task is to propose to the Board the remuner-ation to the President and CEO and a long-term incentive plan for key employees. The goal with a long-term incentive plan is to align the interests of key personnel with those of the shareholders. The Remunera-tion Policy for Group Management aims to establish principles for a fair and consistent remuneration with respect to compensation, benefits, and termination. The base salary is determined by position and performance and the variable compensation is for the achievement of individual goals. The Remu-neration Policy is reviewed annually and the AGM 2015 approved the guidelines for remuneration. See also note 5.
The Remuneration Committee had three meetings in 2015. All members were present. During the year, the Remuneration Committee also supported the President and CEO in determining remuneration to the other members of Group Management. All meetings of the Remuneration Commit-tee have been reported to the Board and the corresponding Minutes have been distributed.
Remuneration Committee 2015–2016
Hans Stråberg, Chair Peter Wallenberg Jr Anders Ullberg
7. EXTERNAL AUDITOR
The task of the external auditor is to examine Atlas Copco’s annual accounts and account-ing practices, as well as to review the Board and the CEO’s management of the Company. At the AGM 2015 the audit firm Deloitte AB, Sweden, was elected external auditor until the AGM 2016 in compliance with a proposal from the Nomination Committee. The princi-pal auditor is Jan Berntsson, Authorized Public Accountant at Deloitte AB.
At the AGM 2015, Jan Berntsson referred to the auditor’s report for the Com-pany and the Group in the annual report and explained the process applied when per-forming the audit. He also recommended adoption of the presented income state-ments and balance sheets, discharge of lia-bility for the President and CEO and the Board of Directors, and adoption of the proposed distribution of profits.
8. INTERNAL AUDIT AND ASSURANCE
The Board of Directors is responsible for that Atlas Copco has adequate internal con-trol systems in place for financial reporting. Read more on pages 64–65.
9. GROUP MANAGEMENT
Besides the President and CEO, the Group Management consists of four business area executives and executives responsible for the main Group functions; Corporate Commu-nications and Governmental Affairs, Orga-nizational Development, Controlling and Finance, and Legal. The President and CEO is responsible for the ongoing management of the Group following the Board’s guide-lines and instructions.
Remuneration to Group Management The Remuneration Policy is reviewed and pre-sented to the AGM by the Board of Directors for approval every year. In 2015, the AGM decided to adopt the Board’s proposal.
The remuneration covers an annual base salary, variable compensation, possi-ble long-term incentive (personnel options), pension premium and other benefits. The variable compensation is limited to a maxi-mum percentage of the base salary. No fees are paid for Board memberships in Group companies or for other duties performed.
The Board continuously addresses the strategic direction, the financial performance, and the methods to maintain sustainable profitability of the Group.
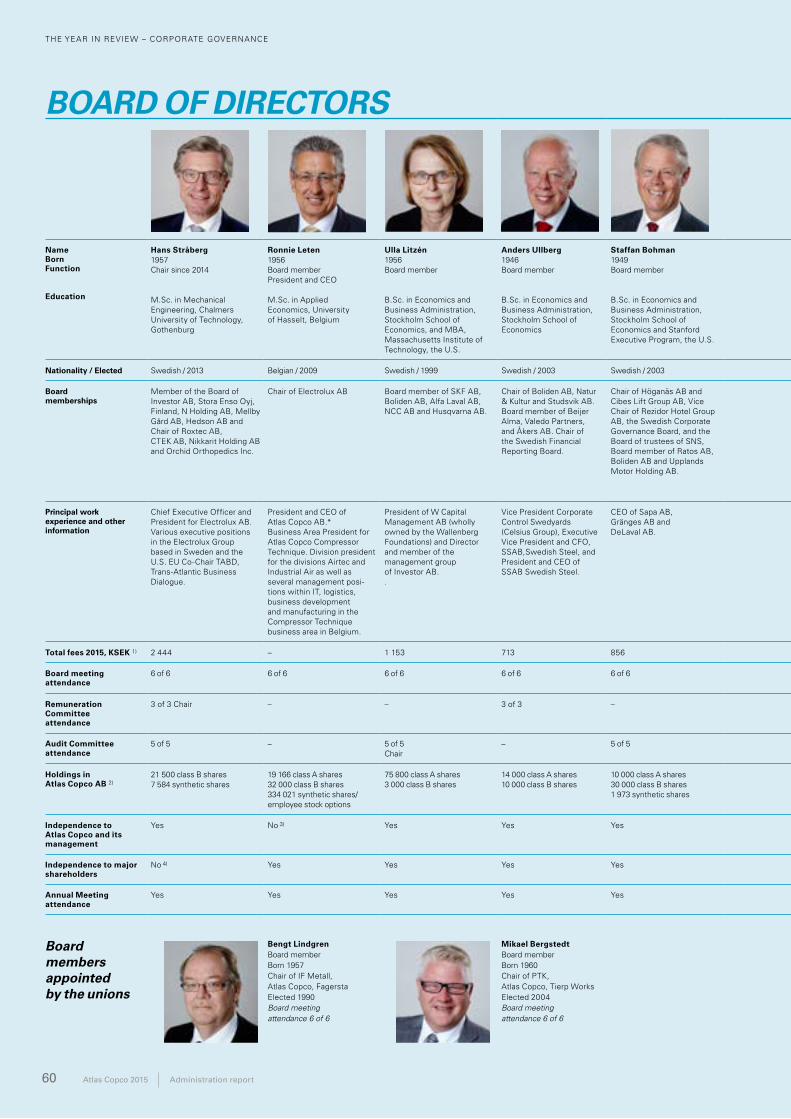
THE YEAR IN REVIEW – CORPORATE GOVERNANCE
60 Atlas Copco 2015 Administration report
NameBornFunction
Education
Hans Stråberg1957Chair since 2014
M.Sc. in Mechanical Engineering, Chalmers University of Technology, Gothenburg
Ronnie Leten1956Board memberPresident and CEO
M.Sc. in Applied Economics, University of Hasselt, Belgium
Ulla Litzén1956Board member
B.Sc. in Economics and Business Administration, Stockholm School of Economics, and MBA, Massachusetts Institute of Technology, the U.S.
Anders Ullberg1946Board member
B.Sc. in Economics and Business Administration, Stockholm School of Economics
Staffan Bohman1949Board member
B.Sc. in Economics and Business Administration, Stockholm School of Economics and Stanford Executive Program, the U.S.
Margareth Øvrum 1958Board member
M.Sc. in Technical Physics, Norwegian University of Science and Technology, Trondheim, Norway
Johan Forssell1971Board member
M.Sc. in Economics and Business Administration, Stockholm School of Economics
Gunilla Nordström1959Board member
M.Sc. in Electronics, Industrial Marketing Management, Linköping University
Peter Wallenberg Jr1959Board member
BSBA Hotel Administration, University of Denver, the U.S. and International Bachaloria, American School, Leysin, Switzerland
Nationality / Elected Swedish / 2013 Belgian / 2009 Swedish / 1999 Swedish / 2003 Swedish / 2003 Norwegian / 2008 Swedish / 2008 Swedish / 2010 Swedish / 2012
Board memberships
Member of the Board ofInvestor AB, Stora Enso Oyj, Finland, N Holding AB, Mellby Gård AB, Hedson AB and Chair of Roxtec AB,CTEK AB, Nikkarit Holding AB and Orchid Orthopedics Inc.
Chair of Electrolux AB Board member of SKF AB, Boliden AB, Alfa Laval AB, NCC AB and Husqvarna AB.
Chair of Boliden AB, Natur & Kultur and Studsvik AB. Board member of Beijer Alma, Valedo Partners, and Åkers AB. Chair of the Swedish Financial Reporting Board.
Chair of Höganäs AB and Cibes Lift Group AB, Vice Chair of Rezidor Hotel Group AB, the Swedish Corporate Governance Board, and the Board of trustees of SNS, Board member of Ratos AB, Boliden AB and Upplands Motor Holding AB.
Board member of Alfa Laval AB.
Board member of Saab AB, Patricia Industries AB and EQT Holdings AB.
Board member of Wärtsilä Oyj, Finland.
Chair of Foundation Adminis-tration Management Sweden AB, The Grand Group, The Royal Swedish Automobile Club. Vice Chair of the Knut and Alice Wallenberg Foundation. Board member of Aleris Holding AB, Founda-tion Asset Management Sweden AB, Investor AB and Scania AB.
Principal work experience and other information
Chief Executive Officer and President for Electrolux AB. Various executive positions in the Electrolux Group based in Sweden and the U.S. EU Co-Chair TABD, Trans-Atlantic Business Dialogue.
President and CEO of Atlas Copco AB.* Business Area President for Atlas Copco Compressor Technique. Division president for the divisions Airtec and Industrial Air as well as several management posi-tions within IT, logistics, business development and manufac turing in the Compressor Technique business area in Belgium.
President of W Capital Management AB (wholly owned by the Wallenberg Foundations) and Director and member of the management group of Investor AB..
Vice President Corporate Control Swedyards (Celsius Group), Executive Vice President and CFO, SSAB,Swedish Steel, and President and CEO of SSAB Swedish Steel.
CEO of Sapa AB, Gränges AB and DeLaval AB.
Executive Vice President for Statoil ASA.* Several leading positions within technology, projects, production, maintenance, health/safety/environment, and procurement in Statoil. All positions in Norway.
President and CEO of Inves-tor AB*. Managing Director, Head of Core Investments and member of the manage-ment group of Investor AB.
Senior management positions with Electrolux AB, telefonaktiebolaget LM Ericsson and Sony Ericsson in Europe, Latin America and Asia.
President and CEO of The Grand Hotel Holdings,General Manager, TheGrand Hotel, PresidentHotel Division Stockholm-Saltsjön.
Total fees 2015, KSEK 1) 2 444 – 1 153 713 856 596 746 596 656
Board meeting attendance
6 of 6 6 of 6 6 of 6 6 of 6 6 of 6 6 of 6 6 of 6 6 of 6 6 of 6
Remuneration Committeeattendance
3 of 3 Chair – – 3 of 3 – – – – 3 of 3
Audit Committeeattendance
5 of 5 – 5 of 5 Chair
– 5 of 5 – 5 of 5 – –
Holdings in Atlas Copco AB 2)
21 500 class B shares7 584 synthetic shares
19 166 class A shares32 000 class B shares334 021 synthetic shares/employee stock options
75 800 class A shares3 000 class B shares
14 000 class A shares10 000 class B shares
10 000 class A shares30 000 class B shares1 973 synthetic shares
8 308 synthetic shares 5 000 class B shares8 308 synthetic shares
6 335 synthetic shares 166 667 class A shares 6 500 synthetic shares
Independence to Atlas Copco and its management
Yes No 3) Yes Yes Yes Yes Yes Yes Yes
Independence to major shareholders
No 4) Yes Yes Yes Yes Yes No 5) Yes No 4)
Annual Meeting attendance
Yes Yes Yes Yes Yes Yes Yes Yes Yes
Board members appointed by the unions
Bengt LindgrenBoard memberBorn 1957Chair of IF Metall, Atlas Copco, FagerstaElected 1990Board meeting attendance 6 of 6
Mikael BergstedtBoard member Born 1960Chair of PTK, Atlas Copco, Tierp Works Elected 2004Board meeting attendance 6 of 6
Ulf StrömDeputyBorn 1961Chair of IF Metall, Atlas Copco Rock Drills AB, ÖrebroElected 2008Board meeting attendance 6 of 6
Kristina KanestadDeputyBorn 1966 Chair of Unionen, Atlas Copco Rock Drills AB, ÖrebroElected 2007 Board meeting attendance 6 of 6
BOARD OF DIRECTORS
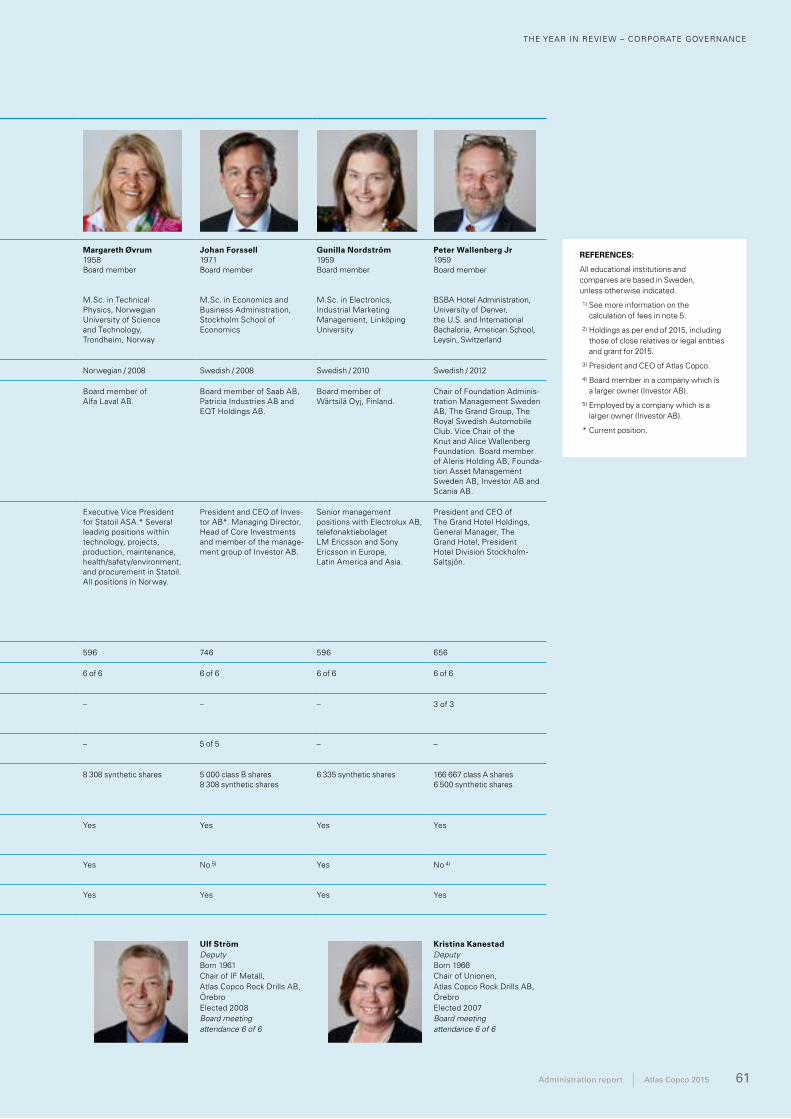
THE YEAR IN REVIEW – CORPORATE GOVERNANCE
Administration report Atlas Copco 2015 61
NameBornFunction
Education
Hans Stråberg1957Chair since 2014
M.Sc. in Mechanical Engineering, Chalmers University of Technology, Gothenburg
Ronnie Leten1956Board memberPresident and CEO
M.Sc. in Applied Economics, University of Hasselt, Belgium
Ulla Litzén1956Board member
B.Sc. in Economics and Business Administration, Stockholm School of Economics, and MBA, Massachusetts Institute of Technology, the U.S.
Anders Ullberg1946Board member
B.Sc. in Economics and Business Administration, Stockholm School of Economics
Staffan Bohman1949Board member
B.Sc. in Economics and Business Administration, Stockholm School of Economics and Stanford Executive Program, the U.S.
Margareth Øvrum 1958Board member
M.Sc. in Technical Physics, Norwegian University of Science and Technology, Trondheim, Norway
Johan Forssell1971Board member
M.Sc. in Economics and Business Administration, Stockholm School of Economics
Gunilla Nordström1959Board member
M.Sc. in Electronics, Industrial Marketing Management, Linköping University
Peter Wallenberg Jr1959Board member
BSBA Hotel Administration, University of Denver, the U.S. and International Bachaloria, American School, Leysin, Switzerland
Nationality / Elected Swedish / 2013 Belgian / 2009 Swedish / 1999 Swedish / 2003 Swedish / 2003 Norwegian / 2008 Swedish / 2008 Swedish / 2010 Swedish / 2012
Board memberships
Member of the Board ofInvestor AB, Stora Enso Oyj, Finland, N Holding AB, Mellby Gård AB, Hedson AB and Chair of Roxtec AB,CTEK AB, Nikkarit Holding AB and Orchid Orthopedics Inc.
Chair of Electrolux AB Board member of SKF AB, Boliden AB, Alfa Laval AB, NCC AB and Husqvarna AB.
Chair of Boliden AB, Natur & Kultur and Studsvik AB. Board member of Beijer Alma, Valedo Partners, and Åkers AB. Chair of the Swedish Financial Reporting Board.
Chair of Höganäs AB and Cibes Lift Group AB, Vice Chair of Rezidor Hotel Group AB, the Swedish Corporate Governance Board, and the Board of trustees of SNS, Board member of Ratos AB, Boliden AB and Upplands Motor Holding AB.
Board member of Alfa Laval AB.
Board member of Saab AB, Patricia Industries AB and EQT Holdings AB.
Board member of Wärtsilä Oyj, Finland.
Chair of Foundation Adminis-tration Management Sweden AB, The Grand Group, The Royal Swedish Automobile Club. Vice Chair of the Knut and Alice Wallenberg Foundation. Board member of Aleris Holding AB, Founda-tion Asset Management Sweden AB, Investor AB and Scania AB.
Principal work experience and other information
Chief Executive Officer and President for Electrolux AB. Various executive positions in the Electrolux Group based in Sweden and the U.S. EU Co-Chair TABD, Trans-Atlantic Business Dialogue.
President and CEO of Atlas Copco AB.* Business Area President for Atlas Copco Compressor Technique. Division president for the divisions Airtec and Industrial Air as well as several management posi-tions within IT, logistics, business development and manufac turing in the Compressor Technique business area in Belgium.
President of W Capital Management AB (wholly owned by the Wallenberg Foundations) and Director and member of the management group of Investor AB..
Vice President Corporate Control Swedyards (Celsius Group), Executive Vice President and CFO, SSAB,Swedish Steel, and President and CEO of SSAB Swedish Steel.
CEO of Sapa AB, Gränges AB and DeLaval AB.
Executive Vice President for Statoil ASA.* Several leading positions within technology, projects, production, maintenance, health/safety/environment, and procurement in Statoil. All positions in Norway.
President and CEO of Inves-tor AB*. Managing Director, Head of Core Investments and member of the manage-ment group of Investor AB.
Senior management positions with Electrolux AB, telefonaktiebolaget LM Ericsson and Sony Ericsson in Europe, Latin America and Asia.
President and CEO of The Grand Hotel Holdings,General Manager, TheGrand Hotel, PresidentHotel Division Stockholm-Saltsjön.
Total fees 2015, KSEK 1) 2 444 – 1 153 713 856 596 746 596 656
Board meeting attendance
6 of 6 6 of 6 6 of 6 6 of 6 6 of 6 6 of 6 6 of 6 6 of 6 6 of 6
Remuneration Committeeattendance
3 of 3 Chair – – 3 of 3 – – – – 3 of 3
Audit Committeeattendance
5 of 5 – 5 of 5 Chair
– 5 of 5 – 5 of 5 – –
Holdings in Atlas Copco AB 2)
21 500 class B shares7 584 synthetic shares
19 166 class A shares32 000 class B shares334 021 synthetic shares/employee stock options
75 800 class A shares3 000 class B shares
14 000 class A shares10 000 class B shares
10 000 class A shares30 000 class B shares1 973 synthetic shares
8 308 synthetic shares 5 000 class B shares8 308 synthetic shares
6 335 synthetic shares 166 667 class A shares 6 500 synthetic shares
Independence to Atlas Copco and its management
Yes No 3) Yes Yes Yes Yes Yes Yes Yes
Independence to major shareholders
No 4) Yes Yes Yes Yes Yes No 5) Yes No 4)
Annual Meeting attendance
Yes Yes Yes Yes Yes Yes Yes Yes Yes
Board members appointed by the unions
Bengt LindgrenBoard memberBorn 1957Chair of IF Metall, Atlas Copco, FagerstaElected 1990Board meeting attendance 6 of 6
Mikael BergstedtBoard member Born 1960Chair of PTK, Atlas Copco, Tierp Works Elected 2004Board meeting attendance 6 of 6
Ulf StrömDeputyBorn 1961Chair of IF Metall, Atlas Copco Rock Drills AB, ÖrebroElected 2008Board meeting attendance 6 of 6
Kristina KanestadDeputyBorn 1966 Chair of Unionen, Atlas Copco Rock Drills AB, ÖrebroElected 2007 Board meeting attendance 6 of 6
REFERENCES:
All educational institutions and companies are based in Sweden, unless otherwise indicated.
1) See more information on the calculation of fees in note 5.
2) Holdings as per end of 2015, including those of close relatives or legal entities and grant for 2015.
3) President and CEO of Atlas Copco.
4) Board member in a company which is a larger owner (Investor AB).
5) Employed by a company which is a larger owner (Investor AB).
* Current position.
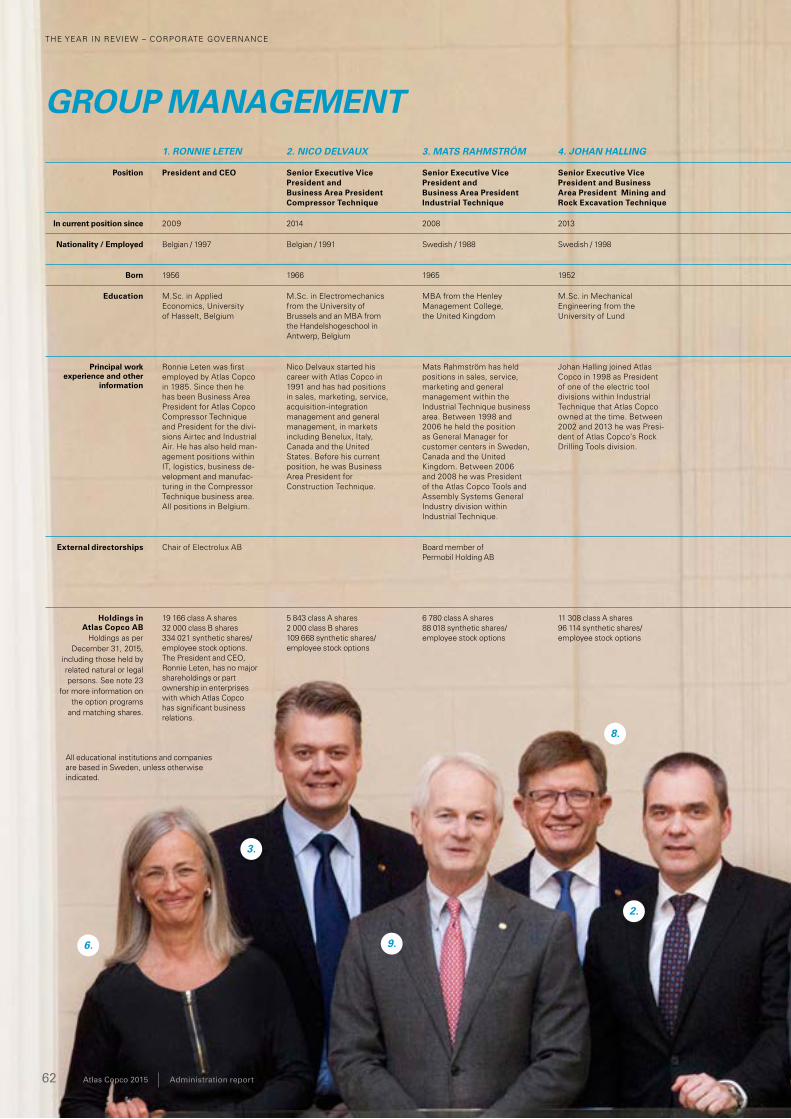
THE YEAR IN REVIEW – CORPORATE GOVERNANCE
62 Atlas Copco 2015 Administration report
1. RONNIE LETEN 2. NICO DELVAUX 3. MATS RAHMSTRÖM 4. JOHAN HALLING 5. ANDREW WALKER 6. ANNIKA BERGLUND 7. JEANETTE LIVIJN 8. HANS OLA MEYER 9. HÅKAN OSVALD
Position President and CEO Senior Executive Vice President and Business Area President Compressor Technique
Senior Executive Vice President and Business Area President Industrial Technique
Senior Executive Vice President and Business Area President Mining and Rock Excavation Technique
Senior Executive Vice President and Business Area President Construction Technique
Senior Vice President Corporate Communications and Governmental Affairs
Senior Vice President Organizational Development
Senior Vice President Controlling and Finance
Senior Vice President General Counsel
In current position since 2009 2014 2008 2013 2014 1997 2007 1999 2012
Nationality / Employed Belgian / 1997 Belgian / 1991 Swedish / 1988 Swedish / 1998 Irish / 1986 Swedish / 1979 Swedish / 1987 Swedish / 1991 Swedish / 1985
Born 1956 1966 1965 1952 1961 1954 1963 1955 1954
Education M.Sc. in Applied Economics, University of Hasselt, Belgium
M.Sc. in Electro mechanics from the University of Brussels and an MBA from the Handels hogeschool in Antwerp, Belgium
MBA from the Henley Management College, the United Kingdom
M.Sc. in Mechanical Engineering from the University of Lund
M. Sc. in Industrial Engineering and an MBA from University College Dublin, Ireland
B.Sc. in Economics and Business Administration from Stockholm School of Economics and an MBA from the University of Antwerp, Belgium
M.Sc. in BusinessAdministration from Växjö högskola
B.Sc. in Economics and Business Administration from Stockholm School of Economics
Master of Law from Uppsala University
Principal work experience and other
information
Ronnie Leten was first employed by Atlas Copco in 1985. Since then he has been Business Area President for Atlas Copco Compressor Technique and President for the divisions Airtec and Industrial Air. He has also held management positions within IT, logistics, business development and manufacturing in the Compressor Technique business area. All positions in Belgium.
Nico Delvaux started his career with Atlas Copco in 1991 and has had positions in sales, marketing, service, acquisitionintegration management and general management, in markets including Benelux, Italy, Canada and the United States. Before his current position, he was Business Area President for Construction Technique.
Mats Rahmström has held positions in sales, service, marketing and general management within the Industrial Technique business area. Between 1998 and 2006 he held the position as General Manager for customer centers in Sweden, Canada and the United Kingdom. Between 2006 and 2008 he was President of the Atlas Copco Tools and Assembly Systems General Industry division within Industrial Technique.
Johan Halling joined Atlas Copco in 1998 as President of one of the electric tool divisions within Industrial Technique that Atlas Copco owned at the time. Between 2002 and 2013 he was President of Atlas Copco’s Rock Drilling Tools division.
Andrew Walker started his career with Atlas Copco in Ireland 1986 and has since then had several different management positions in markets including United Kingdom, Ireland, Belgium and the United States. Before his current position, Andrew Walker was President of the Service division within Compressor Technique.
Annika Berglund began her career in marketing analysis and market research with Atlas Copco in 1979. Since then, she has held a number of positions in the Group related to marketing, sales, and business controlling in Europe. Prior to her current position, she was Marketing Manager for the electronic company Atlas Copco Controls (Danaher Motion).
Jeanette Livijn started to work for Atlas Copco in the field of financial and business controlling in 1987 and held various positions in this function. Since 1997 she has held managerial positions within human resource management. Before she took up her present position she was Vice President Human Resources for the Industrial Technique business area.
Hans Ola Meyer was employed in 1978 to work with Group accounting and controlling. Later he moved to Ecuador as Financial Manager. Between 1984 and 1991, he held various positions at the broker Penningmarknadsmäklarna. He returned to Atlas Copco in 1991 as Financial Manager in Spain and in 1993 he became Senior Vice President Finance, for Atlas Copco AB and a member of Group Management.
Håkan Osvald joined Atlas Copco in 1985 as Legal Counsel. From 1989 he was General Counsel for Atlas Copco North America Inc. and Chicago Pneumatic Tool Company, the United States. In 1991 he was appointed Vice President Deputy General Counsel Atlas Copco Group, with a special responsibility for acquisitions. Prior to his current position, he was General Counsel Operations. Since 2012 he is Secretary of the Board of Directors for Atlas Copco AB.
External directorships Chair of Electrolux AB Board member of Permobil Holding AB
Member of The Swedish Financial Reporting Board and member of the Board of Upplands Motor Holding AB and PRI Pensionsgaranti (Mutual)
Chair of ICC Sweden, reference group Competition
Holdings in Atlas Copco AB
Holdings as per December 31, 2015,
including those held by related natural or legal persons. See note 23
for more information on the option programs
and matching shares.
19 166 class A shares32 000 class B shares334 021 synthetic shares/employee stock options. The President and CEO, Ronnie Leten, has no major shareholdings or part ownership in enterprises with which Atlas Copco has significant business relations.
5 843 class A shares 2 000 class B shares109 668 synthetic shares/employee stock options
6 780 class A shares88 018 synthetic shares/employee stock options
11 308 class A shares 96 114 synthetic shares/employee stock options
3 998 class A shares, 28 855 synthetic shares/employee stock options
10 467 class A shares7 900 class B shares80 575 synthetic shares/employee stock options
3 414 class A shares57 320 synthetic shares/employee stock options
7 286 class A shares22 021 class B shares84 247 synthetic shares/employee stock options
4 821 class A shares2 600 class B shares58 019 synthetic shares/employee stock options
GROUP MANAGEMENT
2.
3.
6. 9.
8.
All educational institutions and companies are based in Sweden, unless otherwise indicated.
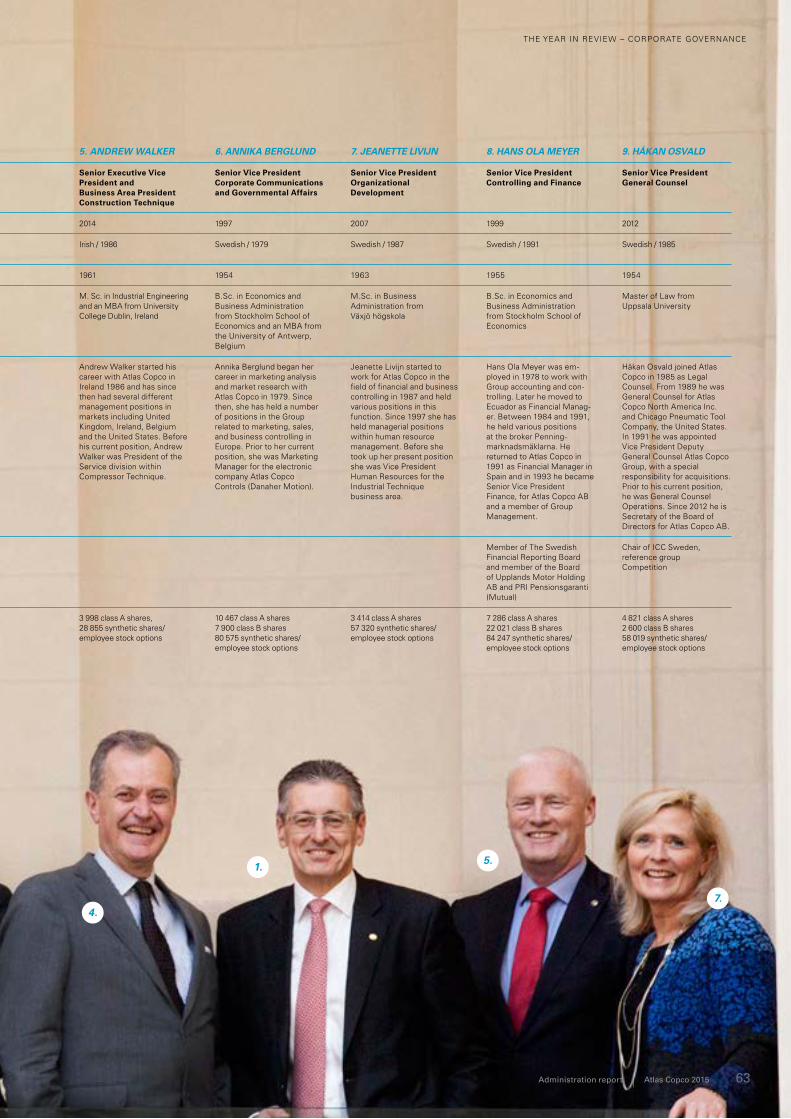
THE YEAR IN REVIEW – CORPORATE GOVERNANCE
Administration report Atlas Copco 2015 63
1. RONNIE LETEN 2. NICO DELVAUX 3. MATS RAHMSTRÖM 4. JOHAN HALLING 5. ANDREW WALKER 6. ANNIKA BERGLUND 7. JEANETTE LIVIJN 8. HANS OLA MEYER 9. HÅKAN OSVALD
Position President and CEO Senior Executive Vice President and Business Area President Compressor Technique
Senior Executive Vice President and Business Area President Industrial Technique
Senior Executive Vice President and Business Area President Mining and Rock Excavation Technique
Senior Executive Vice President and Business Area President Construction Technique
Senior Vice President Corporate Communications and Governmental Affairs
Senior Vice President Organizational Development
Senior Vice President Controlling and Finance
Senior Vice President General Counsel
In current position since 2009 2014 2008 2013 2014 1997 2007 1999 2012
Nationality / Employed Belgian / 1997 Belgian / 1991 Swedish / 1988 Swedish / 1998 Irish / 1986 Swedish / 1979 Swedish / 1987 Swedish / 1991 Swedish / 1985
Born 1956 1966 1965 1952 1961 1954 1963 1955 1954
Education M.Sc. in Applied Economics, University of Hasselt, Belgium
M.Sc. in Electro mechanics from the University of Brussels and an MBA from the Handels hogeschool in Antwerp, Belgium
MBA from the Henley Management College, the United Kingdom
M.Sc. in Mechanical Engineering from the University of Lund
M. Sc. in Industrial Engineering and an MBA from University College Dublin, Ireland
B.Sc. in Economics and Business Administration from Stockholm School of Economics and an MBA from the University of Antwerp, Belgium
M.Sc. in BusinessAdministration from Växjö högskola
B.Sc. in Economics and Business Administration from Stockholm School of Economics
Master of Law from Uppsala University
Principal work experience and other
information
Ronnie Leten was first employed by Atlas Copco in 1985. Since then he has been Business Area President for Atlas Copco Compressor Technique and President for the divisions Airtec and Industrial Air. He has also held management positions within IT, logistics, business development and manufacturing in the Compressor Technique business area. All positions in Belgium.
Nico Delvaux started his career with Atlas Copco in 1991 and has had positions in sales, marketing, service, acquisitionintegration management and general management, in markets including Benelux, Italy, Canada and the United States. Before his current position, he was Business Area President for Construction Technique.
Mats Rahmström has held positions in sales, service, marketing and general management within the Industrial Technique business area. Between 1998 and 2006 he held the position as General Manager for customer centers in Sweden, Canada and the United Kingdom. Between 2006 and 2008 he was President of the Atlas Copco Tools and Assembly Systems General Industry division within Industrial Technique.
Johan Halling joined Atlas Copco in 1998 as President of one of the electric tool divisions within Industrial Technique that Atlas Copco owned at the time. Between 2002 and 2013 he was President of Atlas Copco’s Rock Drilling Tools division.
Andrew Walker started his career with Atlas Copco in Ireland 1986 and has since then had several different management positions in markets including United Kingdom, Ireland, Belgium and the United States. Before his current position, Andrew Walker was President of the Service division within Compressor Technique.
Annika Berglund began her career in marketing analysis and market research with Atlas Copco in 1979. Since then, she has held a number of positions in the Group related to marketing, sales, and business controlling in Europe. Prior to her current position, she was Marketing Manager for the electronic company Atlas Copco Controls (Danaher Motion).
Jeanette Livijn started to work for Atlas Copco in the field of financial and business controlling in 1987 and held various positions in this function. Since 1997 she has held managerial positions within human resource management. Before she took up her present position she was Vice President Human Resources for the Industrial Technique business area.
Hans Ola Meyer was employed in 1978 to work with Group accounting and controlling. Later he moved to Ecuador as Financial Manager. Between 1984 and 1991, he held various positions at the broker Penningmarknadsmäklarna. He returned to Atlas Copco in 1991 as Financial Manager in Spain and in 1993 he became Senior Vice President Finance, for Atlas Copco AB and a member of Group Management.
Håkan Osvald joined Atlas Copco in 1985 as Legal Counsel. From 1989 he was General Counsel for Atlas Copco North America Inc. and Chicago Pneumatic Tool Company, the United States. In 1991 he was appointed Vice President Deputy General Counsel Atlas Copco Group, with a special responsibility for acquisitions. Prior to his current position, he was General Counsel Operations. Since 2012 he is Secretary of the Board of Directors for Atlas Copco AB.
External directorships Chair of Electrolux AB Board member of Permobil Holding AB
Member of The Swedish Financial Reporting Board and member of the Board of Upplands Motor Holding AB and PRI Pensionsgaranti (Mutual)
Chair of ICC Sweden, reference group Competition
Holdings in Atlas Copco AB
Holdings as per December 31, 2015,
including those held by related natural or legal persons. See note 23
for more information on the option programs
and matching shares.
19 166 class A shares32 000 class B shares334 021 synthetic shares/employee stock options. The President and CEO, Ronnie Leten, has no major shareholdings or part ownership in enterprises with which Atlas Copco has significant business relations.
5 843 class A shares 2 000 class B shares109 668 synthetic shares/employee stock options
6 780 class A shares88 018 synthetic shares/employee stock options
11 308 class A shares 96 114 synthetic shares/employee stock options
3 998 class A shares, 28 855 synthetic shares/employee stock options
10 467 class A shares7 900 class B shares80 575 synthetic shares/employee stock options
3 414 class A shares57 320 synthetic shares/employee stock options
7 286 class A shares22 021 class B shares84 247 synthetic shares/employee stock options
4 821 class A shares2 600 class B shares58 019 synthetic shares/employee stock options
1.
4.
5.
7.
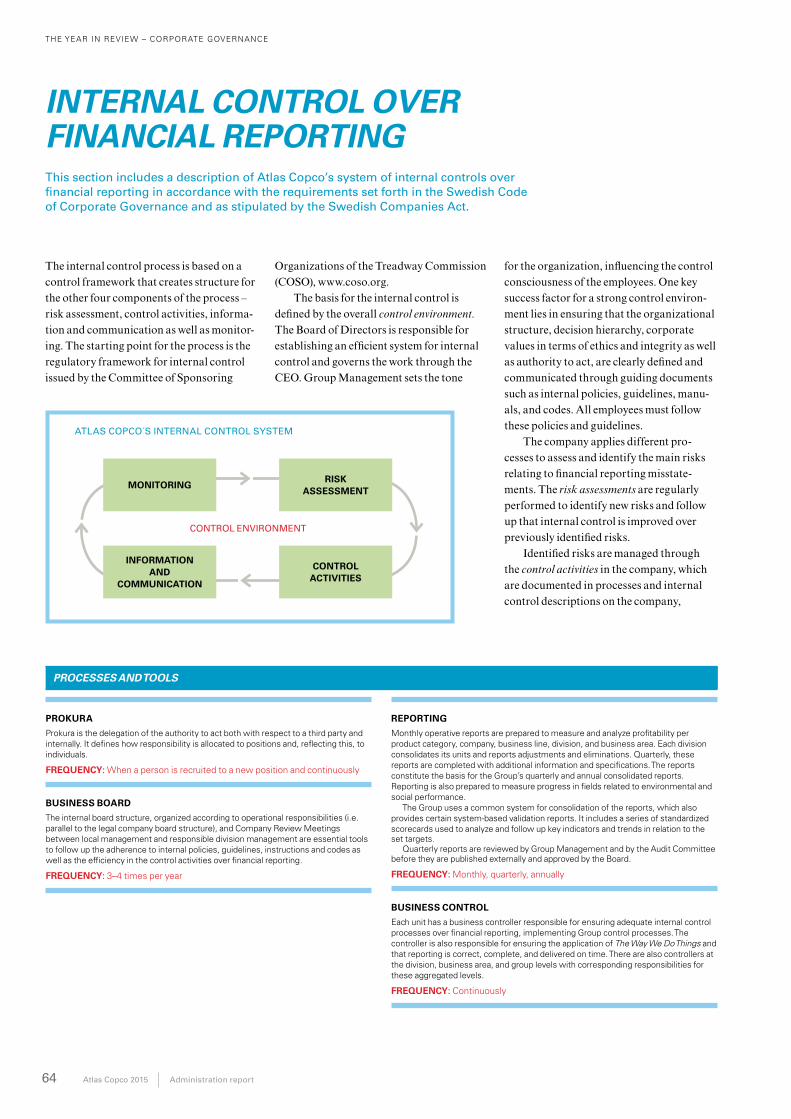
THE YEAR IN REVIEW – CORPORATE GOVERNANCE
64 Atlas Copco 2015 Administration report
PROKURA
Prokura is the delegation of the authority to act both with respect to a third party and internally. It defines how responsibility is allocated to positions and, reflecting this, to individuals.
FREQUENCY: When a person is recruited to a new position and continuously
BUSINESS BOARD
The internal board structure, organized according to operational responsibilities (i.e. parallel to the legal company board structure), and Company Review Meetings between local management and responsible division management are essential tools to follow up the adherence to internal policies, guidelines, instructions and codes as well as the efficiency in the control activities over financial reporting.
FREQUENCY: 3–4 times per year
INTERNAL CONTROL OVER FINANCIAL REPORTING
The internal control process is based on a control framework that creates structure for the other four components of the process – risk assessment, control activities, informa-tion and communication as well as monitor-ing. The starting point for the process is the regulatory framework for internal control issued by the Committee of Sponsoring
REPORTING
Monthly operative reports are prepared to measure and analyze profitability per product category, company, business line, division, and business area. Each division consolidates its units and reports adjustments and eliminations. Quarterly, these reports are completed with additional information and specifications. The reports constitute the basis for the Group’s quarterly and annual consolidated reports. Reporting is also prepared to measure progress in fields related to environmental and social performance.
The Group uses a common system for consolidation of the reports, which also provides certain systembased validation reports. It includes a series of standardized scorecards used to analyze and follow up key indicators and trends in relation to the set targets.
Quarterly reports are reviewed by Group Management and by the Audit Committee before they are published externally and approved by the Board.
FREQUENCY: Monthly, quarterly, annually
BUSINESS CONTROL
Each unit has a business controller responsible for ensuring adequate internal control processes over financial reporting, implementing Group control processes. The controller is also responsible for ensuring the application of The Way We Do Things and that reporting is correct, complete, and delivered on time. There are also controllers at the division, business area, and group levels with corresponding responsibilities for these aggregated levels.
FREQUENCY: Continuously
PROCESSES AND TOOLS
This section includes a description of Atlas Copco’s system of internal controls over financial reporting in accordance with the requirements set forth in the Swedish Code of Corporate Governance and as stipulated by the Swedish Companies Act.
Organizations of the Treadway Commission (COSO), www.coso.org.
The basis for the internal control is defined by the overall control environment. The Board of Directors is responsible for establishing an efficient system for internal control and governs the work through the CEO. Group Management sets the tone
for the organization, influencing the control consciousness of the employees. One key success factor for a strong control environ-ment lies in ensuring that the organizational structure, decision hierarchy, corporate values in terms of ethics and integrity as well as authority to act, are clearly defined and communicated through guiding documents such as internal policies, guidelines, manu-als, and codes. All employees must follow these policies and guidelines.
The company applies different pro-cesses to assess and identify the main risks relating to financial reporting misstate-ments. The risk assessments are regularly performed to identify new risks and follow up that internal control is improved over previously identified risks.
Identified risks are managed through the control activities in the company, which are documented in processes and internal control descriptions on the company,
ATLAS COPCO´S INTERNAL CONTROL SYSTEM
CONTROL ENVIRONMENT
MONITORINGRISK
ASSESSMENT
CONTROL ACTIVITIES
INFORMATION AND
COMMU NI CATION
THE YEAR IN REVIEW – CORPORATE GOVERNANCE
Administration report Atlas Copco 2015 65
division, business area, and group levels. These aim to prevent, detect and correct errors and non-compliances and include for example instructions for attests and author-ity to pay, controls in business systems as well as accounting and business reporting processes.
The company has information and com-munication channels designed to ensure that information is identified, captured and com-municated in a form and timeframe that enable employees and managers to carry out their responsibilities. Reporting instructions and accounting guidelines are communi-cated to personnel concerned in the internal database The Way We Do Things, supported by, for example, training programs for different categories of employees.
The company continuously monitors the adherence to internal policies, guidelines, manuals, and codes as well as efficiency in the control activities. Internal control is continuously evaluated and followed up on
in the operations, including regular man-agement reviews and supervisory activities as well as through internal audits, and con-trol self assessments. The Audit Committee has an important role in supporting the Board of Directors to monitor whether the internal control processes facilitate adequate internal control over financial reporting.
Activities in 2015
In 2015, the Group internal audit function conducted internal audits in 106 (113) units out of 489 (488). The audits were conducted in 39 countries. A risk-based internal audit plan was executed. Internal audits were con-ducted under leadership of Group internal audit staff with audit team members having diverse functional competences but always with expertise in accounting and control-ling. Internal audits covered units’ relevant processes, with additional focus on human resources and IT security. IT security audits
were carried out by the Group IT Security function and covered 53 (53) units.
During 2015, 319 (321) legal entity man-agers were invited to respond to the control self assessment survey whereof 313 (317) completed the survey.
Focus in 2016
In 2016, the Group internal audit function will continue its work to review processes and tools with focus on risks, controls and governance as well as recommending lead-ing practices. However, developing the use of data analytics will be in focus during the year.
INTERNAL CONTROL STATISTICS 2015 2014
Operative units in the Group 489 488
Internal audits conducted 106 113
Control self assessments completed 313 317
INTERNAL AUDITS
The Internal Audit process is intended to add value to each operational unit by providing independent and objective assurance and on internal control. Further, the process aims to serve as a tool for employee professional development and to identify and recommend leading practices within the Group.
Internal audits are annually planned or initiated by the Group internal audit function with a riskbased approach. This includes for example when there is a change of General Manager in a company, after major negative events or structural changes, or if a long time has passed since the last audit. Internal audits are normally performed by an interdisciplinary team of people appointed from the organization. The Accounting to Reporting process is reviewed in all internal audits.
Atlas Copco has operations in several complex markets, where the risk of human rights abuses and corruption is high. Therefore, the adherence to the Business Code of Practice is evaluated in the internal audit process, including environmental aspects and business partner relationships.
FREQUENCY: All units at least once every five years
CONTROL SELF ASSESSMENT
The objective of this process is primarily to support local unit managers evaluating the status of their control routines and to address weak areas. One of the areas is internal control, which includes internal control over financial reporting. Other areas include legal issues, communication and branding, and the Business Code of Practice. On Group level the aggregated assessments of the control routines give a base for improvement of Group processes, instructions, etc.
FREQUENCY: Annually
HOTLINE
The Group has a process where employees and other stakeholders can report on behavior or actions that are possible violations of laws or of Group policies, including violation of accounting and financial reporting guidelines and policies. This also includes perceived cases of human rights violation, discrimination or corruption. This process serves as a complement to similar procedures that exist on country level in certain countries. The reports are treated confidentially and the person who is reporting is guaranteed anonymity. There have been efforts to increase awareness of this process among all employees and managers, e.g. through training in the Business Code of Practice including fraud awareness.
FREQUENCY: As required
COMPLIANCE STATEMENT
In the compliance process Group Management, divisional managements and all managers responsible for an operational or holding unit and certain other key positions are requested to sign a statement confirming compliance to financial policies, the Business Code of Practice and applicable laws and regulations.
FREQUENCY: Annually
PROCESSES AND TOOLS
FINANCIAL STATEMENTS
FINANCIAL STATEMENTS AND NOTES MSEK unless otherwise stated
ATLAS COPCO GROUP Page
Consolidated income statement 67
Consolidated statement of comprehensive income 67
Consolidated balance sheet 68
Consolidated statement of changes in equity 69
Consolidated statement of cash flows 70
Note
1Significant accounting principles, accounting estimates and judgments 71
2 Acquisitions 77
3 Divestments and assets held for sale 79
4 Segment information 80
5 Employees and personnel expenses 83
6 Remuneration to auditors 85
7 Other operating income and expenses 85
8 Financial income and expenses 86
9 Taxes 86
10 Other comprehensive income 87
11 Earnings per share 88
12 Intangible assets 88
13 Property, plant and equipment 90
14Investments in associated companies and joint ventures 91
15 Other financial assets 91
16 Inventories 91
17 Trade receivables 92
18 Other receivables 92
19 Cash and cash equivalents 92
20 Equity 93
21 Borrowings 94
22 Leases 95
23 Employee benefits 96
24 Other liabilities 100
25 Provisions 101
26 Assets pledged and contingent liabilities 101
27Financial exposure and principles for control of financial risks 101
28 Related parties 107
29 Subsequent events 107
PARENT COMPANY Page
Income statement 108
Statement of comprehensive income 108
Balance sheet 108
Statement of changes in equity 109
Statement of cash flows 109
Note
A1 Significant accounting principles 110
A2Employees and personnel expenses and remunerations to auditors 111
A3 Other operating income and expenses 111
A4 Financial income and expenses 111
A5 Appropriations 111
A6 Income tax 112
A7 Intangible assets 112
A8 Property, plant and equipment 112
A9 Deferred tax assets and liabilities 113
A10 Shares in Group companies 113
A11 Other financial assets 113
A12 Other receivables 113
A13 Cash and cash equivalents 113
A14 Equity 113
A15 Post-employment benefits 114
A16 Other provisions 115
A17 Borrowings 116
A18 Other liabilities 116
A19Financial exposure and principles for control of financial risks 117
A20 Assets pledged and contingent liabilities 117
A21 Directly owned subsidiaries 117
A22 Related parties 119
66 Atlas Copco 2015
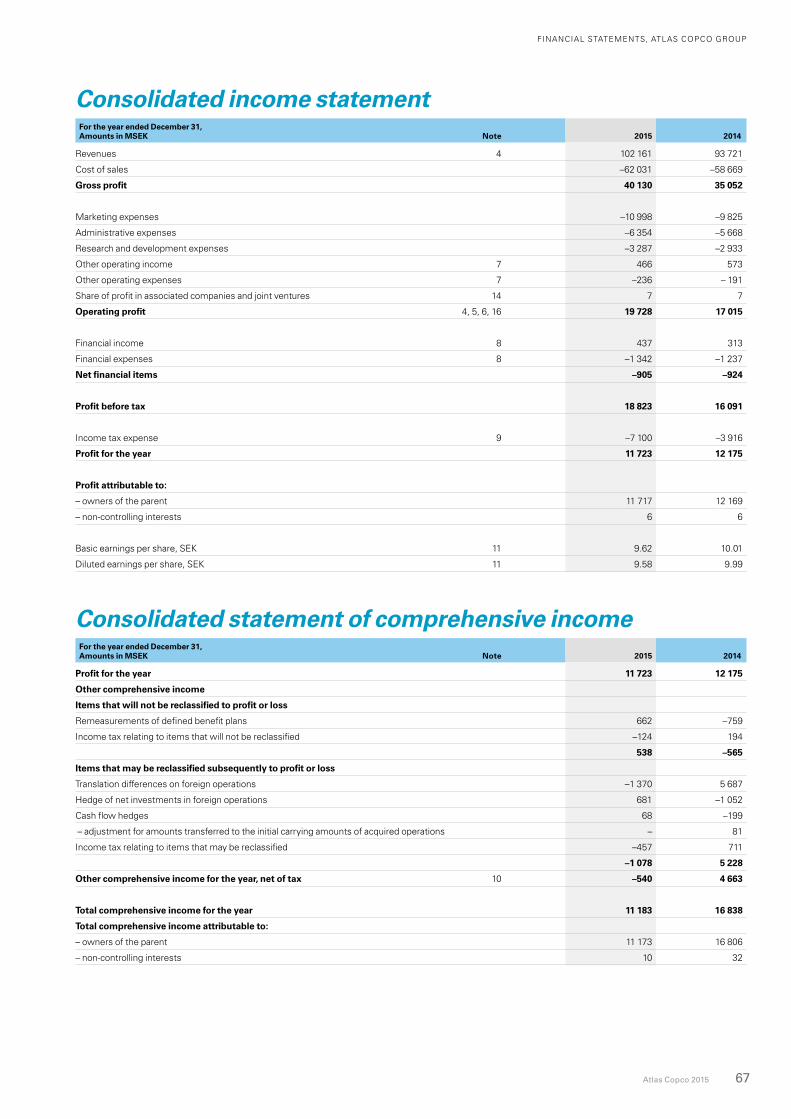
FINANCIAL STATEMENTS, ATLAS COPCO GROUP
Atlas Copco 2015 67
Consolidated income statementFor the year ended December 31, Amounts in MSEK Note 2015 2014
Revenues 4 102 161 93 721
Cost of sales –62 031 –58 669
Gross profit 40 130 35 052
Marketing expenses –10 998 –9 825
Administrative expenses –6 354 –5 668
Research and development expenses –3 287 –2 933
Other operating income 7 466 573
Other operating expenses 7 –236 – 191
Share of profit in associated companies and joint ventures 14 7 7
Operating profit 4, 5, 6, 16 19 728 17 015
Financial income 8 437 313
Financial expenses 8 –1 342 –1 237
Net financial items –905 –924
Profit before tax 18 823 16 091
Income tax expense 9 –7 100 –3 916
Profit for the year 11 723 12 175
Profit attributable to:
– owners of the parent 11 717 12 169
– non-controlling interests 6 6
Basic earnings per share, SEK 11 9.62 10.01
Diluted earnings per share, SEK 11 9.58 9.99
Consolidated statement of comprehensive incomeFor the year ended December 31, Amounts in MSEK Note 2015 2014
Profit for the year 11 723 12 175
Other comprehensive income
Items that will not be reclassified to profit or loss
Remeasurements of defined benefit plans 662 –759
Income tax relating to items that will not be reclassified –124 194
538 –565
Items that may be reclassified subsequently to profit or loss
Translation differences on foreign operations –1 370 5 687
Hedge of net investments in foreign operations 681 –1 052
Cash flow hedges 68 –199
– adjustment for amounts transferred to the initial carrying amounts of acquired operations – 81
Income tax relating to items that may be reclassified –457 711
–1 078 5 228
Other comprehensive income for the year, net of tax 10 –540 4 663
Total comprehensive income for the year 11 183 16 838
Total comprehensive income attributable to:
– owners of the parent 11 173 16 806
– non-controlling interests 10 32
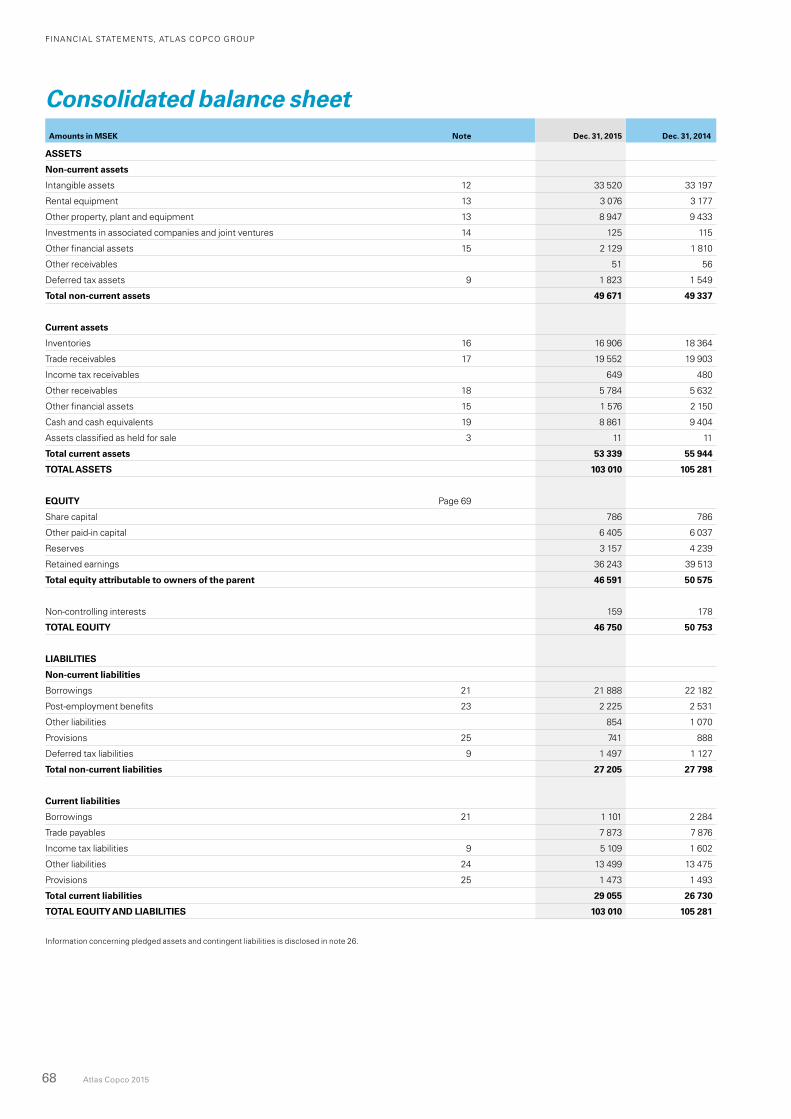
FINANCIAL STATEMENTS, ATLAS COPCO GROUP
68 Atlas Copco 2015
Consolidated balance sheet Amounts in MSEK Note Dec. 31, 2015 Dec. 31, 2014
ASSETS
Non-current assets
Intangible assets 12 33 520 33 197
Rental equipment 13 3 076 3 177
Other property, plant and equipment 13 8 947 9 433
Investments in associated companies and joint ventures 14 125 115
Other financial assets 15 2 129 1 810
Other receivables 51 56
Deferred tax assets 9 1 823 1 549
Total non-current assets 49 671 49 337
Current assets
Inventories 16 16 906 18 364
Trade receivables 17 19 552 19 903
Income tax receivables 649 480
Other receivables 18 5 784 5 632
Other financial assets 15 1 576 2 150
Cash and cash equivalents 19 8 861 9 404
Assets classified as held for sale 3 11 11
Total current assets 53 339 55 944
TOTAL ASSETS 103 010 105 281
EQUITY Page 69
Share capital 786 786
Other paid-in capital 6 405 6 037
Reserves 3 157 4 239
Retained earnings 36 243 39 513
Total equity attributable to owners of the parent 46 591 50 575
Non-controlling interests 159 178
TOTAL EQUITY 46 750 50 753
LIABILITIES
Non-current liabilities
Borrowings 21 21 888 22 182
Post-employment benefits 23 2 225 2 531
Other liabilities 854 1 070
Provisions 25 741 888
Deferred tax liabilities 9 1 497 1 127
Total non-current liabilities 27 205 27 798
Current liabilities
Borrowings 21 1 101 2 284
Trade payables 7 873 7 876
Income tax liabilities 9 5 109 1 602
Other liabilities 24 13 499 13 475
Provisions 25 1 473 1 493
Total current liabilities 29 055 26 730
TOTAL EQUITY AND LIABILITIES 103 010 105 281
Information concerning pledged assets and contingent liabilities is disclosed in note 26.
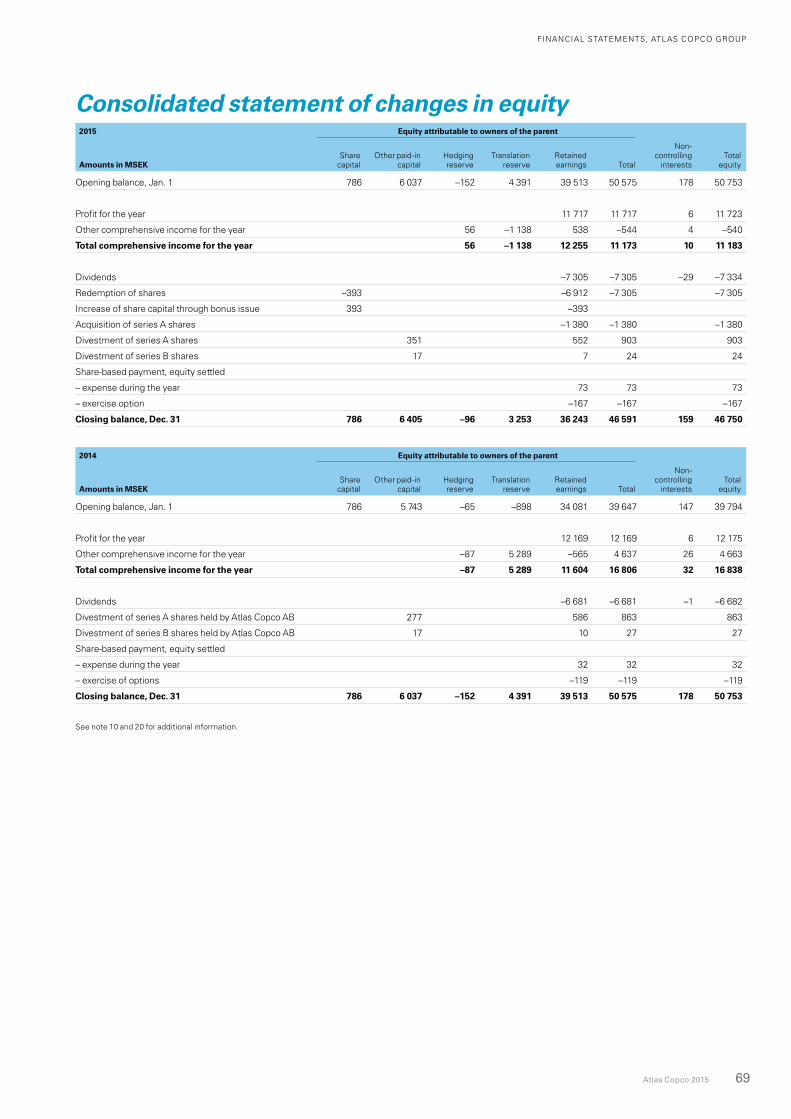
FINANCIAL STATEMENTS, ATLAS COPCO GROUP
Atlas Copco 2015 69
Consolidated statement of changes in equity2015 Equity attributable to owners of the parent
Amounts in MSEKShare
capitalOther paid-in
capitalHedging reserve
Trans lation reserve
Retained earnings Total
Non- controlling
interestsTotal
equity
Opening balance, Jan. 1 786 6 037 –152 4 391 39 513 50 575 178 50 753
Profit for the year 11 717 11 717 6 11 723
Other comprehensive income for the year 56 –1 138 538 –544 4 –540
Total comprehensive income for the year 56 –1 138 12 255 11 173 10 11 183
Dividends –7 305 –7 305 –29 –7 334
Redemption of shares –393 –6 912 –7 305 –7 305
Increase of share capital through bonus issue 393 –393
Acquisition of series A shares –1 380 –1 380 –1 380
Divestment of series A shares 351 552 903 903
Divestment of series B shares 17 7 24 24
Share-based payment, equity settled
– expense during the year 73 73 73
– exercise option –167 –167 –167
Closing balance, Dec. 31 786 6 405 –96 3 253 36 243 46 591 159 46 750
2014 Equity attributable to owners of the parent
Amounts in MSEKShare
capitalOther paid-in
capitalHedging reserve
Trans lation reserve
Retained earnings Total
Non- controlling
interestsTotal
equity
Opening balance, Jan. 1 786 5 743 –65 –898 34 081 39 647 147 39 794
Profit for the year 12 169 12 169 6 12 175
Other comprehensive income for the year –87 5 289 –565 4 637 26 4 663
Total comprehensive income for the year –87 5 289 11 604 16 806 32 16 838
Dividends –6 681 –6 681 –1 –6 682
Divestment of series A shares held by Atlas Copco AB 277 586 863 863
Divestment of series B shares held by Atlas Copco AB 17 10 27 27
Share-based payment, equity settled
– expense during the year 32 32 32
– exercise of options –119 –119 –119
Closing balance, Dec. 31 786 6 037 –152 4 391 39 513 50 575 178 50 753
See note 10 and 20 for additional information.
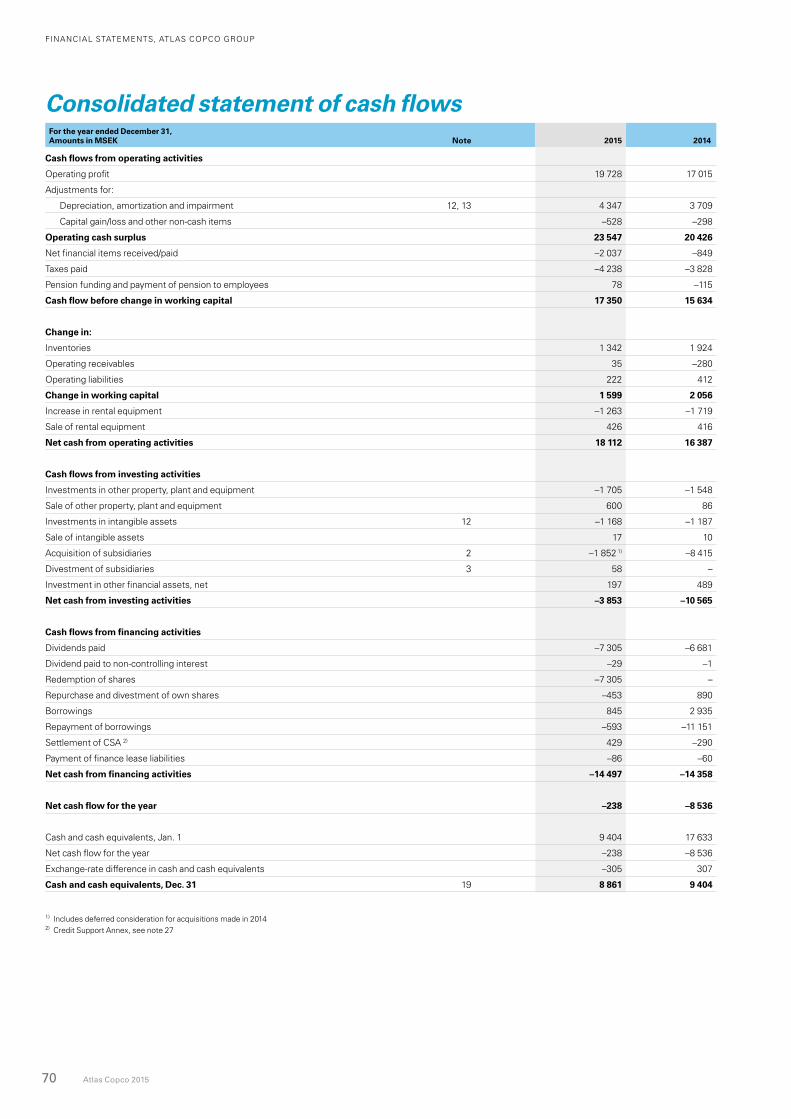
FINANCIAL STATEMENTS, ATLAS COPCO GROUP
70 Atlas Copco 2015
Consolidated statement of cash flowsFor the year ended December 31, Amounts in MSEK Note 2015 2014
Cash flows from operating activities
Operating profit 19 728 17 015
Adjustments for:
Depreciation, amortization and impairment 12, 13 4 347 3 709
Capital gain/loss and other non-cash items –528 –298
Operating cash surplus 23 547 20 426
Net financial items received/paid –2 037 –849
Taxes paid –4 238 –3 828
Pension funding and payment of pension to employees 78 –115
Cash flow before change in working capital 17 350 15 634
Change in:
Inventories 1 342 1 924
Operating receivables 35 –280
Operating liabilities 222 412
Change in working capital 1 599 2 056
Increase in rental equipment –1 263 –1 719
Sale of rental equipment 426 416
Net cash from operating activities 18 112 16 387
Cash flows from investing activities
Investments in other property, plant and equipment –1 705 –1 548
Sale of other property, plant and equipment 600 86
Investments in intangible assets 12 –1 168 –1 187
Sale of intangible assets 17 10
Acquisition of subsidiaries 2 –1 852 1) –8 415
Divestment of subsidiaries 3 58 –
Investment in other financial assets, net 197 489
Net cash from investing activities –3 853 –10 565
Cash flows from financing activities
Dividends paid –7 305 –6 681
Dividend paid to non-controlling interest –29 –1
Redemption of shares –7 305 –
Repurchase and divestment of own shares –453 890
Borrowings 845 2 935
Repayment of borrowings –593 –11 151
Settlement of CSA 2) 429 –290
Payment of finance lease liabilities –86 –60
Net cash from financing activities –14 497 –14 358
Net cash flow for the year –238 –8 536
Cash and cash equivalents, Jan. 1 9 404 17 633
Net cash flow for the year –238 –8 536
Exchange-rate difference in cash and cash equivalents –305 307
Cash and cash equivalents, Dec. 31 19 8 861 9 404
1) Includes deferred consideration for acquisitions made in 20142) Credit Support Annex, see note 27
FINANCIAL STATEMENTS, ATLAS COPCO GROUP
Atlas Copco 2015 71
SIGNIFICANT ACCOUNTING PRINCIPLESThe consolidated financial statements comprise Atlas Copco AB, the Parent Company (“the Company”), and its subsidiaries (together “the Group” or Atlas Copco) and the Group’s interest in associated com-panies and joint ventures. Atlas Copco AB is headquartered in Nacka, Sweden.
Basis of preparationThe consolidated financial statements have been prepared in accordance with International Financial Reporting Standards (IFRS) as endorsed by the EU. The statements are also prepared in accordance with the Swedish recommendation RFR 1 “Supplementary Accounting Rules for Groups” and applicable statements issued by the Swedish Financial Reporting Board. These require certain additional disclosure requirements for Swedish consolidated financial statements prepared in accordance with IFRS.
The accounting principles set out below have been consistently applied to all periods presented, unless otherwise stated, and for all enti-ties included in the consolidated financial statements. The Annual Report for the Group and for Atlas Copco AB, including financial statements, was approved for issuance on March 4, 2016, The balance sheets and income statements are subject to approval by the Annual General Meeting of the shareholders on April 26, 2016.
Basis of consolidationThe consolidated financial statements have been prepared in accordance with the acquisition method. Accordingly, business combinations are seen as if the Group directly acquires the assets and assumes the liabilities of the entity acquired. The consolidated income statements and balance sheets of the Group include all entities in which the Company, directly or indirectly, has control. Control exists when the Company has power over the entity, is exposed, or has rights, to variable returns from its involve-ment with the entity and has the ability to use its power to affect its returns. Generally, control and hence consolidation is based on owner-ship. In a few exceptions, consolidation is based on agreements that give the Group control over an entity. See note A22 for information on the Group’s subsidiaries.
Intra-group balances and internal income and expense arising from intra-group transactions are fully eliminated in preparing the consoli-dated financial statements. Gains and losses arising from intra-group transactions that are recognized in assets, such as inventory and fixed assets, are eliminated in full, but losses only to the extent that there is no evidence of impairment.
Business combinationsAt the acquisition date, the date on which control is obtained, each identi-fiable asset acquired and liability assumed is recognized at its acquisition-date fair value. The consideration transferred, measured at fair value, includes assets transferred by the Group, liabilities to the former owners of the acquiree and the equity interests issued by the Group in exchange for control of the acquiree. Any subsequent change in such fair value is recognized in profit or loss, unless the contingent consideration is classi-fied as equity. Trans actions costs that the Group incur in connection with a business combination are expensed as incurred.
Goodwill is measured as the excess of the sum of the consideration transferred, the amount of any non-controlling interests in the acquiree, and the fair value of the Group’s previously held equity interest in the acquiree (if any) over the net of acquisition-date fair value amounts of the identifiable assets acquired and liabilities assumed.
Non-controlling interest is initially measured either • at fair value, or • at the non-controlling interest’s proportionate share of the fair value
of identifiable net assets.
Subsequent profit or loss attributable to the non-controlling interest is allocated to the non-controlling interest, even if it puts the non-control-ling interest in a deficit position. Acquisitions of non-controlling interests are recognized as a transaction between equity attributable to owners of the parent and non-controlling interests. The difference between consid-eration paid and the proportionate share of net assets acquired is recog-nized in equity. For details on the acquisitions made during the year, see note 2.
1. Significant accounting principles, accounting estimates and judgments
Associated companies and joint venturesAn associate is an entity in which the Group has significant influence, but not control, over financial and operating policies. When the Group holds 20–50% of the voting power, it is presumed that significant influence exists, unless otherwise demonstrated. A joint venture is an entity over which the Group has joint control, through contractual agreements with one of more parties. Investments in associated companies and joint ven-tures are reported according to the equity method. This means that the carrying value of interests in an associate or joint venture corresponds to the Group’s share of reported equity of the associate or joint venture, any goodwill, and any other remaining fair value adjustments recognized at acquisition date.
“Shares of profit in associated companies and joint ventures”, included in the income statements, comprises the Group’s share of the associate’s and joint venture’s income after tax adjusted for any amortiza-tion and depreciation, impairment losses, and other adjustments arising from any remaining fair value adjustments recognized at acquisition date. Dividends received from an associated company or joint venture reduce the carrying value of the investment.
Unrealized gains and losses arising from transactions with an associ-ate or a joint venture are eliminated to the extent of the Group’s interest, but losses only to the extent that there is no evidence of impairment of the asset. When the Group’s share of losses in an associate or a joint ven-ture equals or exceeds its interest in the associate or joint venture, the Group does not recognize further losses unless the Group has incurred obligations or made payments on behalf of the associate.
Functional currency and foreign currency translation The consolidated financial statements are presented in Swedish krona (SEK), which is the functional currency for Atlas Copco AB and also the presentation currency for the Group’s financial reporting. Unless other-wise stated, the amounts presented are in millions Swedish krona (MSEK).
Transactions in foreign currencies are translated at the foreign exchange rate ruling at the date of the transaction. Non-monetary items carried at historical cost are reported using the exchange rate at the date of the transaction and non-monetary items carried at fair value are reported at the rate that existed when the fair values were determined. Tangible and intangible assets, inventory and advanced payments are examples of non-monetary items.
Receivables and liabilities and other monetary items denominated in foreign currencies are translated using the foreign exchange rate at the balance sheet date. The exchange gains and losses related to receivables and payables and other operating receivables and liabilities are included in “Other operating income and expenses” and foreign exchange gains and losses attributable to other financial assets and liabilities are included in “Financial income and expenses”. Exchange rate differences on trans-lation to functional currency are reported in “Other comprehensive income” in the following cases:
• translation of a financial liability designated as a hedge of the net investment in a foreign operation,
• translation of intra-group receivables from, or liabilities to, a foreign operation that in substance is part of the net investment in the foreign operation,
• cash flow hedges of foreign currency to the extent that the hedge is effective.
In the consolidation, the balance sheets of foreign subsidiaries are trans-lated to SEK using exchanges rates at the end of the reporting period and the income statements are translated at the average rates for the reporting period. Foreign exchange differences arising on such translation are rec-ognized in “Other comprehensive income” and are accumulated in the currency translation reserve in equity. Exchange rates for major curren-cies that have been used for the consolidated financial statements are shown in note 27.
Segment reportingAn operating segment is a component of the Group that engages in busi-ness activities from which it may earn revenue and incur expenses, and for which discrete financial information is available. The operating results of all operating segments are reviewed regularly by the Group’s President
FINANCIAL STATEMENTS, ATLAS COPCO GROUP
72 Atlas Copco 2015
and CEO, the chief operating decision maker, to make decisions about allocation of resources to the segments and also to assess their perfor-mance. See note 4 for additional information.
Revenue recognition Revenue is measured at the fair value of the consideration received or receivable and reduced for value added tax, estimated customer returns, discounts and other similar deductions. See note 4 for further informa-tion on revenue by segment and by geographical area.
Goods soldRevenue from goods sold is recognized when the significant risks and rewards of ownership have been transferred to the buyer, i.e. when the Group retains neither continuing right to dispose of the goods nor hold effective control of the goods sold, recovery of the consideration is prob-able and the amount of the revenue and associated costs can be measured reliably. When the product requires installation and this constitutes a sig-nificant part of the contract, revenue is recognized when the installation is completed. Revenue is not recorded for buy-back commitments if the substance of the agreement is that the risks and rewards of ownership have not been transferred to the buyer. No revenue is recognized if there is significant uncertainty regarding the possible return of goods.
Services renderedRevenue from services is recognized by reference to the stage of comple-tion of the contract. The stage of completion is determined by the pro-portion of costs incurred to date compared to the estimated total costs of the transaction. Where the outcome of a service contract cannot be esti-mated reliably, revenue is recognized to the extent of costs incurred that are expected to be recoverable. When it is probable that total contract costs will exceed total revenue, the expected loss is recognized as an expense immediately. When services are performed by an indeterminate number of activities over the service contract period, revenue is recog-nized linearly over that period.
Rental operationsRental income from rental equipment is recognized on a straight-line basis over the rental period. Sale of rental equipment is recognized as revenue when the significant risks and rewards of ownership have been transferred to the buyer. The carrying value of the rental equipment sold is recognized as cost of sales. Investments in and sales of rental equip-ment are included in cash flows from operating activities.
Other operating income and expensesCommissions and royalties are recognized on an accrual basis in accor-dance with the financial substance of the agreement. Gains and losses on disposals of an item of non-current tangible and intangible assets are determined by comparing the proceeds from disposal with the carrying amount. Such gains and losses are recognized within “Other operating income” and “Other operating expenses”. See note 7 for additional information.
Government grantsA government grant is recognized when there is a reasonable assurance that it will be received and that the Group will comply with the conditions attached to it. Government grants that compensate the Group for expenses incurred are recognized in profit or loss on a systematic basis in the same periods in which expenses are incurred and are presented net of the related expense.
Financial income and expensesInterest income and interest expenses are recognized in profit or loss using the effective interest method. Dividend income is recognized in profit or loss on the date that the Group’s right to receive payment is established. See note 8 for additional information.
Income taxes Income taxes include both current and deferred taxes. Income taxes are reported in profit or loss unless the underlying transaction is reported in “Other comprehensive income” or in equity, in which case the corre-sponding tax is reported according to the same principle.
A current tax liability or asset is recognized for the estimated taxes payable or refundable for the current year or prior years.
1. Significant accounting principles, accounting estimates and judgments, continued
Deferred tax is recognized using the balance sheet liability method. The calculation of deferred taxes is based on differences between the val-ues reported in the balance sheet and their valuation for taxation, which are referred to as temporary differences, and the carry forward of unused tax losses and tax credits. Temporary differences attributable to the fol-lowing assets and liabilities are not provided for: the initial recognition of goodwill, the initial recognition (other than in business combinations) of assets or liabilities that affect neither accounting nor taxable profit, and differences related to investments in subsidiaries, associated companies and joint ventures to the extent that they will probably not reverse in the foreseeable future, and for which the company is able to control the tim-ing of the reversal of the temporary differences.
A deferred tax asset is recognized only to the extent that it is probable that future taxable profits will be available against which the asset can be utilized. In the calculation of deferred taxes, enacted or substantively enacted tax rates are used for the individual tax jurisdictions.
Current and deferred tax assets and liabilities are offset when there is a legally enforceable right to set off current tax assets against current tax liabilities and when they relate to income taxes levied by the same taxa-tion authority and the Group intends to settle its current tax assets and liabilities on a net basis. For details regarding taxes, see note 9.
Earnings per shareBasic earnings per share are calculated based on the profit for the year attributable to owners of the parent and the basic weighted average num-ber of shares outstanding. Diluted earnings per share are calculated based on the profit for the year attributable to owners of the parent and the diluted weighted average number of shares outstanding. Dilutive effects arise from stock options that are settled in shares, or that at the employees’ choice can be settled in shares or cash in the share based incentive programs.
Stock options have a dilutive effect when the average share price dur-ing the period exceeds the exercise price of the options. When calculating the dilutive effect, the exercise price is adjusted by the value of future ser-vices related to the options. If options for which employees can choose settlement in shares or cash are dilutive, the profit for the year is adjusted for the difference between cash-settled and equity-settled treatment of options and the more dilutive of cash settlement and share settlement is used in calculating earnings per share. See note 11 for more details.
Intangible assetsGoodwill Goodwill is recognized at cost, as established at the date of acquisition of a business (see “Business combinations”), less accumulated impairment losses, if any. Goodwill is allocated to the cash-generating units (CGU) that are expected to benefit from the synergies of the business combina-tion. Impairment testing is made at least annually or whenever the need is indicated. The impairment test is performed at the level on which good-will is monitored for internal management purposes. The four business areas of Atlas Copco’s operations have been identified as CGUs. Good-will is reported as an indefinite useful life intangible asset.
Technology-based intangible assetsExpenditure on research activities is expensed as incurred. Research proj-ects acquired as part of business combinations are initially recognized at their fair value at the acquisition date. Subsequent to initial recognition, these research projects are carried at cost less amortization and impair-ment losses. Expenditure on development activities are expensed as incurred unless the activities meet the criteria for being capitalized i.e.:
• the product or process being developed is estimated to be technically and commercially feasible, and
• the Group has the intent and ability to complete and sell or use the product or process.
The expenditure capitalized includes the cost of materials, direct labor, and other costs directly attributable to the project. Capitalized develop-ment expenditure is carried at cost less accumulated amortization and impairment losses. Amortization related to research and development costs for 2015 amounted to 915 (686). This has been reported as part of research and development costs in the income statement since the Group follows up on the research and development function as a whole.
FINANCIAL STATEMENTS, ATLAS COPCO GROUP
Atlas Copco 2015 73
TrademarksTrademarks acquired by the Group are capitalized based on their fair value at the time of acquisition. Certain trademarks are estimated to have an indefinite useful life and are carried at cost less accumulated impairment losses. They are tested at least annually for impairment. Other trademarks, which have finite useful lives, are carried at cost less accumulated amortization and impairment losses.
Marketing and customer related intangible assetsAcquired marketing and customer related intangibles are capitalized based on their fair value at the time of acquisition and are carried at cost less accumulated amortization and impairment losses.
Other intangible assetsAcquired intangible assets relating to contract-based rights, such as licenses or franchise agreements, are capitalized based on their fair value at the time of acquisition and carried at cost less accumulated amortiza-tion and impairment losses. Expenditure on internally generated good-will, trademarks and similar items is expensed as incurred. Changes in the Group’s intangible assets during the year are described in note 12.
Property, plant and equipment Items of property, plant and equipment are carried at cost less accumu-lated depreciation and impairment losses. Cost of an item of property, plant and equipment comprises purchase price, import duties, and any cost directly attributable to bringing the asset to the location and condi-tion for use. The cost also includes dismantlement and removal of the asset in the future if applicable. Borrowing cost for assets that need a sub-stantial period of time to get ready for their intended use are included in the cost value until the assets are substantially ready for their use or sale and are thereafter depreciated. The Group capitalizes costs on initial rec-ognition and on replacement of significant parts of property, plant and equipment if it is probable that the future economic benefits embodied will flow to the Group and the cost can be measured reliably. All other costs are recognized as an expense in profit or loss when incurred.
Rental equipmentThe rental fleet is comprised of diesel and electric powered air compres-sors, generators, air dryers, and to a lesser extent general construction equipment. Rental equipment is initially recognized at cost and is depre-ciated over the estimated useful lives of the equipment. Rental equipment is depreciated to a residual value estimated at 0–10% of cost.
Depreciation and amortizationDepreciation and amortization is calculated based on cost using the straight-line method over the estimated useful life of the asset. Parts of property, plant and equipment with a cost that is significant in relation to the total cost of the item are depreciated separately when the useful lives of the parts do not coincide with the useful lives of other parts of the item. The following useful lives are used for depreciation and amortization:
Technology-based intangible assets 3–15 years
Trademarks with finite lives 5–15 years
Marketing and customer related intangible assets 5–10 years
Buildings 25–50 years
Machinery and equipment 3–10 years
Vehicles 4–5 years
Computer hardware and software 3–10 years
Rental equipment 3–8 years
The useful lives and residual values are reassessed annually. Land, assets under construction, goodwill, and trademarks with indefinite lives are not depreciated or amortized. For changes in the Group’s property, plant and equipment see note 13.
1. Significant accounting principles, accounting estimates and judgments, continued
LeasingThe Group acts both as lessor and lessee. Leases are classified as either finance leases or operating leases. A finance lease entails the transfer to the lessee of substantially all of the economic risks and benefits associ-ated with ownership. If this is not the case, the lease is accounted for as an operating lease.
Group as lesseeFor the lessee, a financial lease implies that the fixed asset leased is recog-nized as an asset in the balance sheet. Initially, a corresponding liability is recorded. Upon initial recognition, the leased asset is measured at an amount equal to the lower of its fair value and the present value of the future minimum lease payments. Fixed assets under finance leases are depreciated over their estimated useful lives, while the lease payments are reported as interest and amortization of the lease liability. For operating leases, the lessee does not account for the leased asset in its balance sheet. The costs of operating leases are recorded in the income statement on a straight-line basis over the term of the lease.
Group as lessorIn cases where the Group acts as the lessor under an operating lease, the asset is classified as rental equipment and is subject to the Group’s depre-ciation policies. The lease payments are included in profit or loss on a straight-line basis over the term of the lease. Under finance leases where the Group acts as lessor, the transaction is recorded as a sale and a lease receivable, comprising the future minimum lease payments and any resid-ual value guaranteed to the lessor, is recorded. Lease payments are recog-nized as interest income and repayment of the lease receivable. See note 22 for more details on leases.
Impairment of non-financial assetsThe carrying values of the Group’s non-financial assets are reviewed at least at each reporting date to determine whether there is any indication of impairment. If any such indication exists, the Group estimates the recoverable amount of the asset. An impairment loss is recognized if the carrying amount of an asset or its cash-generating unit (CGU) exceeds its recoverable amount (i.e. the greater of fair value less costs to sell and value in use). In assessing value in use, the estimated future cash flows are discounted to their present value using a discount rate that reflects cur-rent market assessments of the time value of money and the risks specific to the asset or CGU. For the purpose of assessing impairment, assets are grouped in CGUs, which are the smallest identifiable groups of assets that generate cash inflows that are largely independent of the cash inflows from other assets or group of assets. Impairment losses are recognized in profit or loss. An impairment loss related to goodwill is not reversed. In respect of other assets, impairment losses in prior periods are reviewed for possible reversal of the impairment at each reporting date.
InventoriesInventories are valued at the lower of cost and net realizable value. Net realizable value is the estimated selling price for inventories less all esti-mated costs of completion and costs necessary to make the sale. Invento-ries are recognized according to the first-in-first-out principle and includes the cost of acquiring inventories and bringing them to their existing location and condition. Inventories manufactured by the Group and work in progress include an appropriate share of production over-heads based on normal operating capacity. Inventories are reported net of deductions for obsolescence and internal profits arising in connection with deliveries from the production companies to the customer centers. See note 16 for more details.
Equity Shares issued by the company are classified as equity. Incremental costs directly attributable to the issue of ordinary shares and share options are recognized as a deduction from equity, net of any tax effect.
When share capital recognized as equity is repurchased, the amount of the consideration paid is recognized as a deduction from equity net of any tax effect. Repurchased shares are classified as treasury shares and
FINANCIAL STATEMENTS, ATLAS COPCO GROUP
74 Atlas Copco 2015
are presented as a deduction from total equity. When treasury shares are sold or subsequently reissued, the amount received is recognized as an increase in equity and the resulting surplus or deficit on the transaction is transferred to or from other paid-in capital.
ProvisionsProvisions are recognized:• when the Group has a legal or constructive obligation (as a result of
a past event), • it is probable that the Group will have to settle the obligation, and • the amount of the obligation can be estimated reliably.
The amount recognized as a provision is the best estimate of the consider-ation required to settle the present obligation at the balance sheet date.
If the effect of the time value of money is material, the provision is determined by discounting the expected future cash flows of estimated expenditures.
Provisions for product warranties are recognized as cost of sales at the time the products are sold based on the estimated cost using historical data for level of repairs and replacements.
A restructuring provision is recognized when the Group has approved a detailed and formal restructuring plan and the restructuring has either commenced or been announced publicly.
Present obligations arising under onerous contracts are recognized as provisions. An onerous contract is considered to exist where the Group has a contract under which the unavoidable costs of meeting the obliga-tions under the contract exceed the economic benefits expected to be received from the contract. Before a provision is established, the Group recognizes any impairment loss on the asset associated with the contract. For details on provisions see note 25.
Post-employment benefitsPost-employment benefit plans are classified either as defined contribu-tion or defined benefit plans. Under a defined contribution plan, the Group pays fixed contributions into a separate entity and will have no legal or constructive obligation to pay further amounts if the fund does not hold sufficient assets to pay all employee benefits. Contributions to defined contributions plans are expensed when employees provide ser-vices entitling them to the contribution.
Other post-employment benefit plans are defined benefit plans and it is the Group’s obligation to provide agreed benefits to current and former employees. The net obligation of defined benefit plans is calculated by estimating the amount of future benefits that employees have earned in return for their services in current and prior periods. The amount is dis-counted to determine its present value and the fair values of any plan assets are deducted. Funded plans with net assets, i.e. plans with assets exceeding the commitments, are reported as financial non-current assets.
The cost for defined benefit plans is calculated using the Projected Unit Credit Method, which distributes the cost over the employee’s ser-vice period. The calculation is performed annually by independent actu-aries using actuarial assumptions such as employee turnover, mortality, future increase in salaries and medical cost. Changes in actuarial assump-tions, experience adjustments of obligations and changes in fair value of plan assets result in remeasurements and are recognized in other compre-hensive income. Each quarter a remeasurement is performed to adjust the present value of pension liabilities and the fair value of pension assets against “Other comprehensive income”. Net interest on defined benefit obligations and plan assets is reported as interest income or interest expenses. See note 23 for additional information.
Share-based compensation The Group has share-based incentive programs, consisting of share options and share appreciation rights, which have been offered to certain employees based on position and performance. Additionally, the Board is offered synthetic shares.
The fair value of share options that can only be settled in shares (equity-settled) is recognized as an employee expense with a correspond-
1. Significant accounting principles, accounting estimates and judgments, continued
ing increase in equity. The fair value, measured at grant date using the Black-Scholes formula, is recognized as an expense over the vesting period. The amount recognized as an expense is adjusted to reflect the actual number of share options that vest.
The fair value of the share appreciation rights, synthetic shares, and options with a choice for employees to settle in shares or cash is recog-nized in accordance with principles for cash-settled share-based pay-ments. The value is recognized as an employee expense with a corre-sponding increase in liabilities. The fair value, measured at grant date and remeasured at each reporting date using the Black-Scholes formula, is accrued and recognized as an expense over the vesting period. Changes in fair value are, during the vesting period and after the vesting period until settlement, recognized in profit or loss as an employee expense. The accu-mulated expense recognized equals the cash amount paid at settlement.
Social security charges are paid in cash and are accounted for in con-sistence with the principles for cash-settled share-based payments, regard-less of whether they are related to equity- or cash-settled share-based payments. See note 23 for details.
Financial assets and liabilities – financial instruments Recognition and derecognitionFinancial assets and liabilities are recognized when the Group becomes a party to the contractual provision of the instrument. Transactions of financial assets are accounted for at trade date, which is the day when the Group contractually commits to acquire or dispose of the assets. Trade receivables are recognized on issuance of invoices. Liabilities are recog-nized when the other party has performed and there is a contractual obli-gation to pay. Derecognition, fully or partially, of a financial asset occurs when the rights in the contract have been realized or mature, or when the Group no longer has control over it. A financial liability is derecognized, fully or partially, when the obligation specified in the contract is dis-charged or otherwise expires.
A financial asset and a financial liability are offset and the net amount presented in the balance sheet when there is a legal right to offset the recognized amounts and there is an intention to either settle on a net basis or to realize the asset and settle the liability simultaneously.
Measurement of financial instrumentsFinancial instruments are measured, classified and recognized according to IAS 39 in the following categories:
The Group classifies its financial assets in the following categories:• Financial assets at fair value through profit or loss• Loans and receivables• Held-to-maturity investments• Assets available for sale
The Group classifies its financial liabilities in the following categories:• Financial liabilities at fair value through profit or loss • Other financial liabilities measured at amortized cost using the
effective interest method
Financial assets and liabilities at fair value through profit or loss: This cate-gory includes financial assets and liabilities held for trading or are desig-nated as such upon initial recognition. A financial asset or liability is held for trading if the Group manages such investments and makes purchase and sale decisions based on their fair value. A derivative that is not desig-nated or effective as hedging instrument is also categorized as held for trading. Financial instruments in this category are measured at fair value and changes therein are recognized in profit or loss. Fair value is deter-mined in the manner described in note 27.
Loans and receivables: Loans and receivables are non-derivative financial assets with fixed or determinable payments that are not listed in an active market, such as trade and other receivables and cash and cash equiva-lents. Loans and receivables are measured at amortized cost using the effective interest method, less any impairment losses.
FINANCIAL STATEMENTS, ATLAS COPCO GROUP
Atlas Copco 2015 75
Held-to-maturity investments: Held-to-maturity investments are non-derivative financial assets with fixed or determinable payments and fixed maturity dates that the Group has the positive intention and ability to hold to maturity. Held-to-maturity-investments are measured at amor-tized cost using the effective interest rate method, less any impairment losses.
Available-for-sale financial assets: This category consists of non- derivatives that are either designated as available-for-sale or are not clas-sified as any of above categories. These assets are measured at fair value. Changes therein are recognized in “Other comprehensive income”, except for impairment losses and foreign exchange gains and losses on available-for-sale monetary items which are recognized in profit or loss. When an investment is derecognized, the cumulative gain or loss in other compre-hensive income is transferred to profit or loss. Fair value is determined in the manner described in note 27.
Other financial liabilities: Other financial liabilities are measured at amortized cost using the effective interest method. Trade payables and loan liabilities are recognized in this category.
Impairment of financial assetsFinancial assets, except those classified as fair value through profit and loss, are assessed for indicators of impairment at the end of each report-ing period. A financial asset is considered to be impaired if objective evidence indicates that, as a result of one or more events that occurred after the initial recognition of the financial asset, the estimated future cash flow of the investment has been affected negatively. The impairment is made on an individual basis for significant financial assets and in some cases collectively in groups with similar credit risks. Impairment losses are recognized in profit or loss. An impairment loss is reversed if the reversal can be objectively related to an event occurring after the impair-ment loss was recognized. For financial assets measured at amortized cost and available-for-sale financial assets that are debt securities, the reversal is recognized in profit or loss. For available-for-sale financial assets that are equity securities, the reversal is recognized in other comprehensive income.
Derivatives and hedge accountingDerivatives are initially recognized at fair value on the date a derivative contract is entered into and are subsequently measured at fair value. The method of recognizing the resulting gain or loss depends on whether the derivative is designated as a hedging instrument, and if so, the nature of the item hedged. Changes in fair value for derivatives that do not fulfill the criteria for hedge accounting are recognized as operating or financial transactions based on the purpose of the use of the derivative. Interest payments for interest swaps are recognized as interest income or expense, whereas changes in fair value of future payments are presented as gains or losses from financial instruments.
In order to qualify for hedge accounting the hedging relationship must be
• formally designated, • expected to be highly effective, and • documented.
The Group assesses, evaluates, and documents effectiveness both at hedge inception and on an on-going basis.
Fair value hedges: Changes in the fair value of derivatives that are desig-nated and qualify as fair value hedges are recognized in profit or loss together with any changes in the fair value of the hedged asset or liability. The Group applies fair value hedge accounting for interest rate swaps used for hedging fixed interest risk on borrowings.
Cash flow hedges: Changes in the fair value of the hedging instrument are recognized in Other comprehensive income to the extent that the hedge is effective and the accumulated changes in fair value are recognized as a separate component in equity. Gains or losses relating to the ineffective part of hedges are recognized immediately in profit or loss.
1. Significant accounting principles, accounting estimates and judgments, continued
The amount recognized in equity through Other comprehensive income is reversed to profit or loss in the same period in which the hedged item affects profit or loss. However, when the hedged forecast transaction results in the recognition of a non-financial asset or a non-financial liabil-ity, the amount previously recognized in Other comprehensive income and accumulated in equity are transferred from equity and included in the initial measurement of the cost of the non-financial asset or liability. When a forecast transaction is no longer expected to occur, the gain or loss accumulated in equity is recognized immediately in profit or loss. The Group uses foreign currency forwards to hedge part of the future cash flows from forecasted transactions in foreign currencies. Interest rate swaps are also used as cash flow hedges for hedging interest on borrow-ings with variable interest.
Hedge of net investments in foreign operations: The Group hedges a sub-stantial part of net investments in foreign operations. Changes in the value of the hedge instrument relating to the effective portion of the hedge are recognized in Other comprehensive income and accumulated in equity. Gains or losses relating to the ineffective portion are recognized immediately in profit or loss. On divestment of foreign operations, the gain or loss accumulated in equity is recycled through profit or loss, increasing or decreasing the profit or loss on the divestment. The Group uses loans and forward contracts as hedging instruments.
Accounting for discontinuation of hedges: Hedge accounting is discontin-ued when the Group revokes the hedging relationship, when the hedging instrument expires or is sold, terminated, or exercised, or when it no lon-ger qualifies for hedge accounting.
For fair value hedges ,the fair value adjustment to the carrying amount of the hedged asset or liability arising from the hedged risk is amortized to profit or loss from the date the hedge was discontinued.
For cash flow hedges any gain or loss recognized in other comprehen-sive income and accumulated in equity at that time of hedge discontinua-tion remains in equity and is recognized when the forecast transaction is ultimately recognized in profit or loss. When a forecast transaction is no longer expected to occur, the gain or loss accumulated in equity is recog-nized immediately in profit or loss.
Asset held for saleAssets are classified as held for sale if their value, within one year, will be recovered through a sale and not through continued use in the operations. On the reclassification date, assets and liabilities are measured at the lower of fair value less selling expenses and the carrying amount. Follow-ing reclassification, the assets are no longer depreciated or amortized. Gains and losses recognized on remeasurements and disposals are reported in profit or loss.
Contingent liabilities A contingent liability is a possible obligation or a present obligation that arises from past events that is not reported as a liability or provision, due either to that it is not probable that an outflow of resources will be required to settle the obligation or that a sufficiently reliable calculation of the amount cannot be made.
New or amended accounting standards in 2015The following revised and amended IFRS standards have been applied by the Group from 2015 but had none or no material impact on the Group.
Annual improvements to IFRSs 2010–2012 issued in December 2013.Applied in advance.
Annual improvements to IFRSs 2011–2013 issued in December 2013.Amendments to IAS 19 (2011) Defined Benefit Plans Employee Contributions issued in November 2013.The amendments permit contributions from employees or third parties that are independent of the number of years of service to be recognized as a reduction in the service cost in the period in which the service is rendered. Applied in advance.
FINANCIAL STATEMENTS, ATLAS COPCO GROUP
76 Atlas Copco 2015
IFRIC 21 Levies.The interpretation addresses when a liability to pay a levy to a govern-ment should be recognized.
New or amended accounting standards effective after 2015The following standards, interpretations, and amendments have been issued but were not effective as of December 31, 2015 and have not been applied by the Group.
IFRS 9 Financial Instruments*The standard is intended to replace IAS 39 Financial instruments:Recognition and Measurement, and addresses the classification and mea-surement of financial instruments and hedge accounting. It is likely to affect the Group’s accounting of financial assets and financial liabilities. The effective date is January 1, 2018 and the Group is yet to assess the full impact of IFRS 9.
IFRS 15 Revenue from Contracts with Customers*This new standard that replaces existing revenue recognition standards specifies how and when the Group will recognize revenue as well as requir-ing the Group to provide users of financial statements with more informa-tive, relevant disclosures. The effective date is January 1, 2018. The assess-ment of the effect on the revenue recognition is under investigation.
IFRS 16 Leases*The standard defines the principles for the recognition, measurement, presentation and disclosure of leases for both parties to a contract. The changes relate to the accounting treatment by the lessee. IFRS 16 intro-duces a single accounting model and requires the recognition of substan-tially all leases in the balances sheet and the separation of depreciation of lease assets from interest on lease liabilities in the income statement. IFRS 16 is effective from 1 January 2019. The assessment of the effect from this standard is under investigation.
In addition to the above, other new or revised accounting standards have been published, but are not yet effective. They are not considered to have a material impact on the financial statements of Atlas Copco.
* Indicates that the standard has not yet been endorsed by the EU.
CRITICAL ACCOUNTING ESTIMATES AND JUDGMENTS The preparation of financial reports requires management’s judgment and the use of estimates and assumptions that affects the amounts reported in the consolidated financial statements. These estimates and associated assumptions are based on historical experience and various other factors that are believed to be reasonable under the prevailing cir-cumstances. Actual result may differ from those estimates. The estimates and assumptions are reviewed on an on-going basis. Changes in account-ing estimates are recognized in the period which they are revised and in any future periods affected.
The estimates and the judgments which, in the opinion of manage-ment, are significant to the underlying amounts included in the financial reports and for which there is a significant risk that future events or new information could entail a change in those estimates or judgments are as follows:
Impairment of goodwill, other intangible assets and other long-lived assetsKey sources of estimation uncertaintyGoodwill and certain trademarks are not amortized but are subject to annual tests for impairment. Other intangible assets and other long-lived assets are amortized or depreciated based on management’s estimates of the period that the assets will generate revenue but are also reviewed regu-larly for indications of impairment. The impairment tests are based on a review of the recoverable amount, which is estimated based on manage-ment’s projections of future cash flows using internal business plans and forecasts.
1. Significant accounting principles, accounting estimates and judgments, continued
Accounting judgmentAsset impairment requires management’s judgment, particularly in assessing: – whether an event has occurred that may affect asset values, – whether the carrying value of an asset can be supported by the net
present value of future cash flows, which are estimated based upon the continued use of the asset in the business,
– the appropriate assumptions to be applied in preparing cash flow projections, and
– the discounting of these cash flows.
Changing the assumptions selected by management to determine the level, if any, of impairment could affect the financial position and results of operation. See note 12.
Pension and other post-employment benefit valuation assumptionsKey sources of estimation uncertaintyPensions and other post-employment obligations are dependent on the assumptions established by management and used by actuaries in calcu-lating such amounts. The key assumptions include discount rates, infla-tion, future salary increases, mortality rates, and health care cost trend rates. The actuarial assumptions are reviewed on an annual basis and are changed when it is deemed appropriate.
See note 23 for additional information regarding assumptions used in the calculation of pension and post-employment obligations.
Trade and financial receivableKey sources of estimation uncertaintyThe Group estimates the risk that receivables will not be paid and pro-vides for doubtful accounts based on specific provisions for known cases and collective provisions for losses based on historical loss levels.
Accounting judgmentManagement’s judgment considers rapidly changing market conditions which may be particularly sensitive in customer financing operations. Additional information is included in section “Credit risk” in note 27.
InventoryAccounting judgmentThe Group values inventory at the lower of historical cost, based on the first-in, first-out basis, and net realizable value. The calculation of net realizable value involves management’s judgment as to the estimated sales prices, over-stock articles, out-dated articles, damaged goods, and selling costs. If the estimated net realizable value is lower than cost, a valuation allowance is established for inventory obsolescence. See note 16 for addi-tional information.
Legal proceedings and tax claimsAccounting judgment Atlas Copco recognizes a liability when the Group has an obligation from a past event involving the transfer of economic benefits and when a rea-sonable estimate can be made of what the transfer might be. The Group reviews outstanding legal cases regularly in order to assess the need for provisions in the financial statements. These reviews consider the factors of the specific case by internal legal counsel and through the use of out-side legal counsel and advisors when necessary. The financial statements may be affected to the extent that management’s assessments of the factors considered are not consistent with the actual outcome.
Additionally, the legal entities of the Group are frequently subject to audits by tax authorities in accordance with standard practice in the countries where the Group operates. In instances where the tax authori-ties have a different view on how to interpret the tax legislation, the Group makes estimates as to the likelihood of the outcome of the dis-pute, as well as estimates of potential claims. The actual results may differ from these estimates.
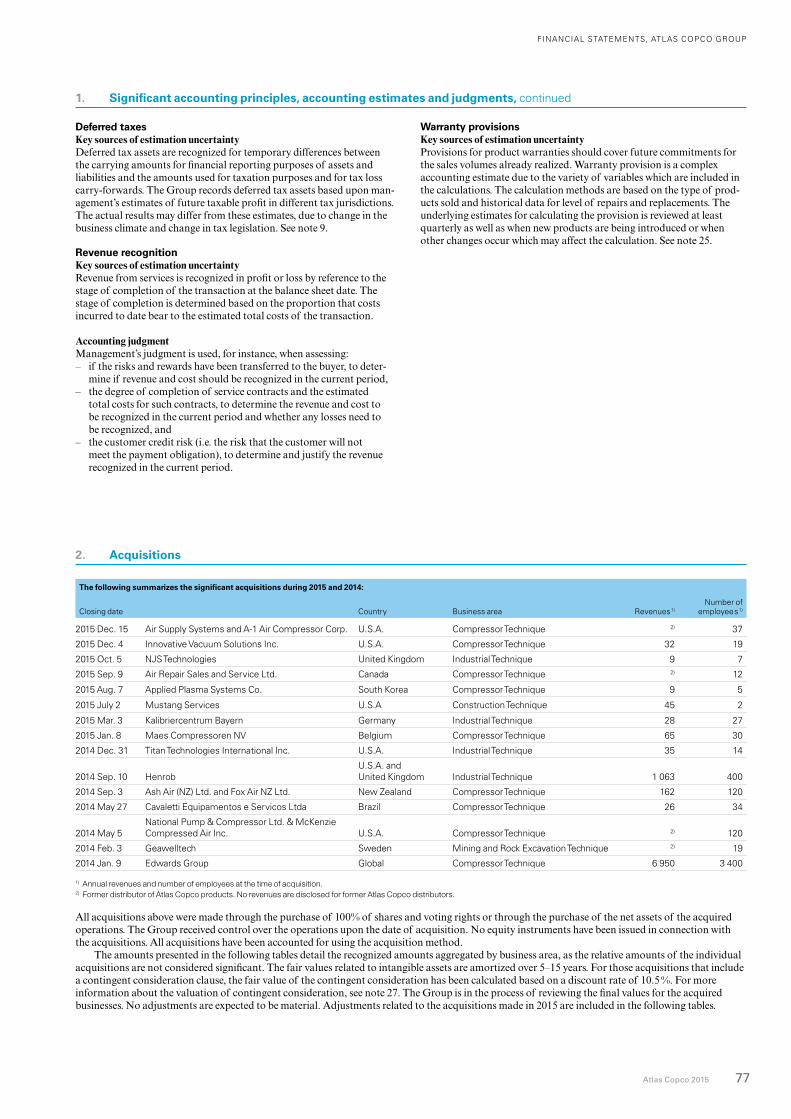
FINANCIAL STATEMENTS, ATLAS COPCO GROUP
Atlas Copco 2015 77
The following summarizes the significant acquisitions during 2015 and 2014:
Closing date Country Business area Revenues1) Number of
employees1)
2015 Dec. 15 Air Supply Systems and A-1 Air Compressor Corp. U.S.A. Compressor Technique 2) 37
2015 Dec. 4 Innovative Vacuum Solutions Inc. U.S.A. Compressor Technique 32 19
2015 Oct. 5 NJS Technologies United Kingdom Industrial Technique 9 7
2015 Sep. 9 Air Repair Sales and Service Ltd. Canada Compressor Technique 2) 12
2015 Aug. 7 Applied Plasma Systems Co. South Korea Compressor Technique 9 5
2015 July 2 Mustang Services U.S.A Construction Technique 45 2
2015 Mar. 3 Kalibriercentrum Bayern Germany Industrial Technique 28 27
2015 Jan. 8 Maes Compressoren NV Belgium Compressor Technique 65 30
2014 Dec. 31 Titan Technologies International Inc. U.S.A. Industrial Technique 35 14
2014 Sep. 10 Henrob U.S.A. and United Kingdom Industrial Technique 1 063 400
2014 Sep. 3 Ash Air (NZ) Ltd. and Fox Air NZ Ltd. New Zealand Compressor Technique 162 120
2014 May 27 Cavaletti Equipamentos e Servicos Ltda Brazil Compressor Technique 26 34
2014 May 5National Pump & Compressor Ltd. & McKenzie Compressed Air Inc. U.S.A. Compressor Technique 2) 120
2014 Feb. 3 Geawelltech Sweden Mining and Rock Excavation Technique 2) 19
2014 Jan. 9 Edwards Group Global Compressor Technique 6 950 3 400
1) Annual revenues and number of employees at the time of acquisition.2) Former distributor of Atlas Copco products. No revenues are disclosed for former Atlas Copco distributors.
All acquisitions above were made through the purchase of 100% of shares and voting rights or through the purchase of the net assets of the acquired operations. The Group received control over the operations upon the date of acquisition. No equity instruments have been issued in connection with the acquisitions. All acquisitions have been accounted for using the acquisition method.
The amounts presented in the following tables detail the recognized amounts aggregated by business area, as the relative amounts of the individual acquisitions are not considered significant. The fair values related to intangible assets are amortized over 5–15 years. For those acquisitions that include a contingent consideration clause, the fair value of the contingent consideration has been calculated based on a discount rate of 10.5 %. For more information about the valuation of contingent consideration, see note 27. The Group is in the process of reviewing the final values for the acquired businesses. No adjustments are expected to be material. Adjustments related to the acquisitions made in 2015 are included in the following tables.
2. Acquisitions
Deferred taxesKey sources of estimation uncertaintyDeferred tax assets are recognized for temporary differences between the carrying amounts for financial reporting purposes of assets and liabilities and the amounts used for taxation purposes and for tax loss carry-forwards. The Group records deferred tax assets based upon man-agement’s estimates of future taxable profit in different tax jurisdictions. The actual results may differ from these estimates, due to change in the business climate and change in tax legislation. See note 9.
Revenue recognitionKey sources of estimation uncertaintyRevenue from services is recognized in profit or loss by reference to the stage of completion of the transaction at the balance sheet date. The stage of completion is determined based on the proportion that costs incurred to date bear to the estimated total costs of the transaction.
Accounting judgmentManagement’s judgment is used, for instance, when assessing: – if the risks and rewards have been transferred to the buyer, to deter-
mine if revenue and cost should be recognized in the current period, – the degree of completion of service contracts and the estimated
total costs for such contracts, to determine the revenue and cost to be recognized in the current period and whether any losses need to be recognized, and
– the customer credit risk (i.e. the risk that the customer will not meet the payment obligation), to determine and justify the revenue recognized in the current period.
Warranty provisionsKey sources of estimation uncertaintyProvisions for product warranties should cover future commitments for the sales volumes already realized. Warranty provision is a complex accounting estimate due to the variety of variables which are included in the calculations. The calculation methods are based on the type of prod-ucts sold and historical data for level of repairs and replacements. The underlying estimates for calculating the provision is reviewed at least quarterly as well as when new products are being introduced or when other changes occur which may affect the calculation. See note 25.
1. Significant accounting principles, accounting estimates and judgments, continued
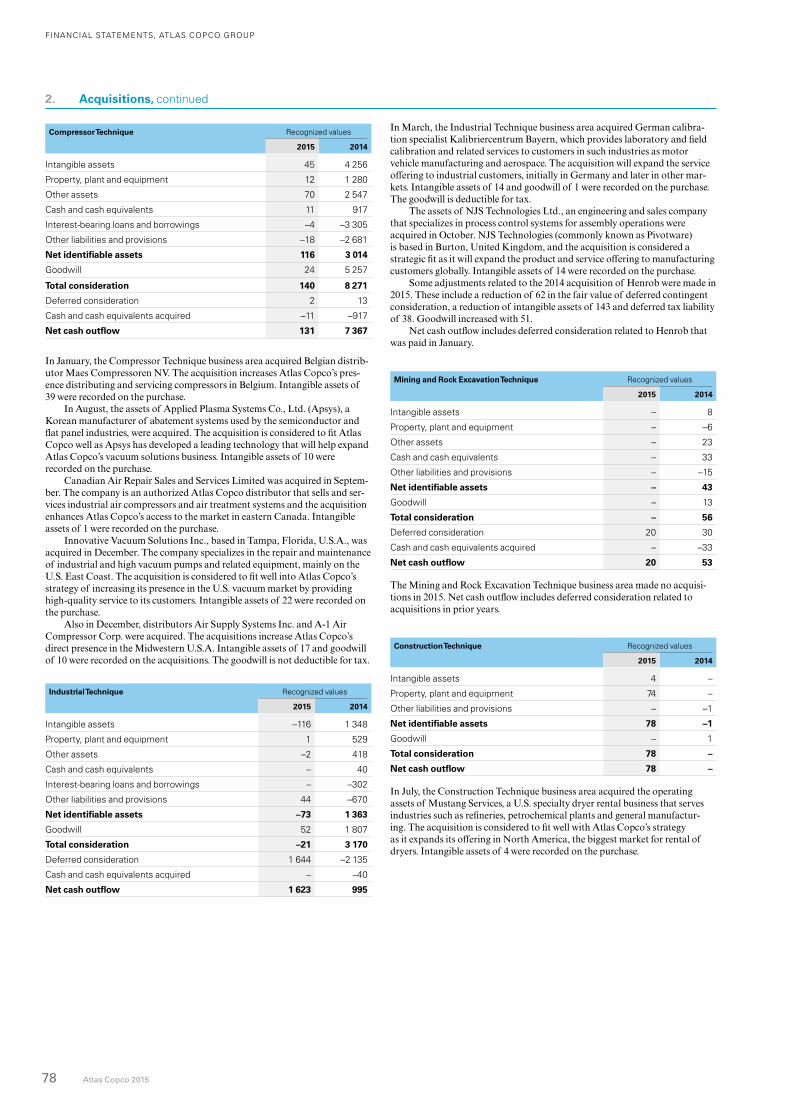
FINANCIAL STATEMENTS, ATLAS COPCO GROUP
78 Atlas Copco 2015
Compressor Technique Recognized values
2015 2014
Intangible assets 45 4 256
Property, plant and equipment 12 1 280
Other assets 70 2 547
Cash and cash equivalents 11 917
Interest-bearing loans and borrowings –4 –3 305
Other liabilities and provisions –18 –2 681
Net identifiable assets 116 3 014
Goodwill 24 5 257
Total consideration 140 8 271
Deferred consideration 2 13
Cash and cash equivalents acquired –11 –917
Net cash outflow 131 7 367
In January, the Compressor Technique business area acquired Belgian distrib-utor Maes Compressoren NV. The acquisition increases Atlas Copco’s pres-ence distributing and servicing compressors in Belgium. Intangible assets of 39 were recorded on the purchase.
In August, the assets of Applied Plasma Systems Co., Ltd. (Apsys), a Korean manufacturer of abatement systems used by the semiconductor and flat panel industries, were acquired. The acquisition is considered to fit Atlas Copco well as Apsys has developed a leading technology that will help expand Atlas Copco’s vacuum solutions business. Intangible assets of 10 were recorded on the purchase.
Canadian Air Repair Sales and Services Limited was acquired in Septem-ber. The company is an authorized Atlas Copco distributor that sells and ser-vices industrial air compressors and air treatment systems and the acquisition enhances Atlas Copco’s access to the market in eastern Canada. Intangible assets of 1 were recorded on the purchase.
Innovative Vacuum Solutions Inc., based in Tampa, Florida, U.S.A., was acquired in December. The company specializes in the repair and maintenance of industrial and high vacuum pumps and related equipment, mainly on the U.S. East Coast. The acquisition is considered to fit well into Atlas Copco’s strategy of increasing its presence in the U.S. vacuum market by providing high-quality service to its customers. Intangible assets of 22 were recorded on the purchase.
Also in December, distributors Air Supply Systems Inc. and A-1 Air Compressor Corp. were acquired. The acquisitions increase Atlas Copco’s direct presence in the Midwestern U.S.A. Intangible assets of 17 and goodwill of 10 were recorded on the acquisitions. The goodwill is not deductible for tax.
Industrial Technique Recognized values
2015 2014
Intangible assets –116 1 348
Property, plant and equipment 1 529
Other assets –2 418
Cash and cash equivalents – 40
Interest-bearing loans and borrowings – –302
Other liabilities and provisions 44 –670
Net identifiable assets –73 1 363
Goodwill 52 1 807
Total consideration –21 3 170
Deferred consideration 1 644 –2 135
Cash and cash equivalents acquired – –40
Net cash outflow 1 623 995
2. Acquisitions, continued
In March, the Industrial Technique business area acquired German calibra-tion specialist Kalibriercentrum Bayern, which provides laboratory and field calibration and related services to customers in such industries as motor vehicle manufacturing and aerospace. The acquisition will expand the service offering to industrial customers, initially in Germany and later in other mar-kets. Intangible assets of 14 and goodwill of 1 were recorded on the purchase. The goodwill is deductible for tax.
The assets of NJS Technologies Ltd., an engineering and sales company that specializes in process control systems for assembly operations were acquired in October. NJS Technologies (commonly known as Pivotware) is based in Burton, United Kingdom, and the acquisition is considered a strategic fit as it will expand the product and service offering to manufacturing customers globally. Intangible assets of 14 were recorded on the purchase.
Some adjustments related to the 2014 acquisition of Henrob were made in 2015. These include a reduction of 62 in the fair value of deferred contingent consideration, a reduction of intangible assets of 143 and deferred tax liability of 38. Goodwill increased with 51.
Net cash outflow includes deferred consideration related to Henrob that was paid in January.
Mining and Rock Excavation Technique Recognized values
2015 2014
Intangible assets – 8
Property, plant and equipment – –6
Other assets – 23
Cash and cash equivalents – 33
Other liabilities and provisions – –15
Net identifiable assets – 43
Goodwill – 13
Total consideration – 56
Deferred consideration 20 30
Cash and cash equivalents acquired – –33
Net cash outflow 20 53
The Mining and Rock Excavation Technique business area made no acquisi-tions in 2015. Net cash outflow includes deferred consideration related to acquisitions in prior years.
Construction Technique Recognized values
2015 2014
Intangible assets 4 –
Property, plant and equipment 74 –
Other liabilities and provisions – –1
Net identifiable assets 78 –1
Goodwill – 1
Total consideration 78 –
Net cash outflow 78 –
In July, the Construction Technique business area acquired the operating assets of Mustang Services, a U.S. specialty dryer rental business that serves industries such as refineries, petrochemical plants and general manufactur-ing. The acquisition is considered to fit well with Atlas Copco’s strategy as it expands its offering in North America, the biggest market for rental of dryers. Intangible assets of 4 were recorded on the purchase.
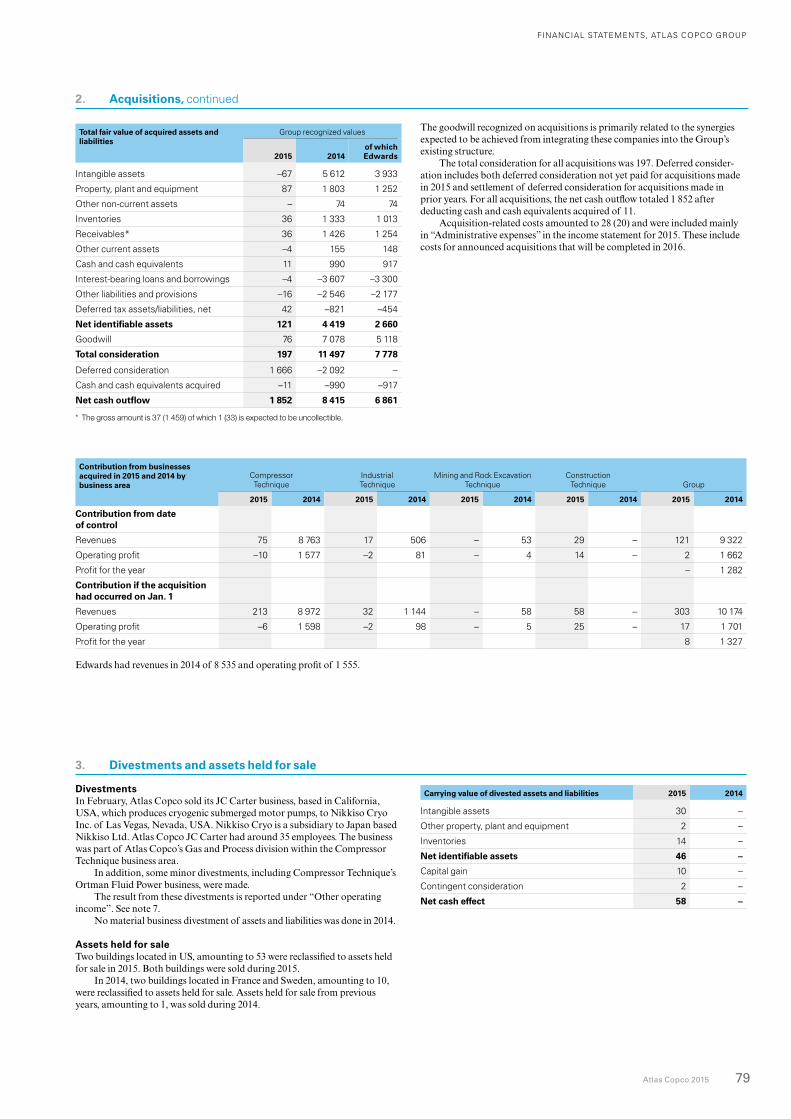
FINANCIAL STATEMENTS, ATLAS COPCO GROUP
Atlas Copco 2015 79
DivestmentsIn February, Atlas Copco sold its JC Carter business, based in California, USA, which produces cryogenic submerged motor pumps, to Nikkiso Cryo Inc. of Las Vegas, Nevada, USA. Nikkiso Cryo is a subsidiary to Japan based Nikkiso Ltd. Atlas Copco JC Carter had around 35 employees. The business was part of Atlas Copco’s Gas and Process division within the Compressor Technique business area.
In addition, some minor divestments, including Compressor Technique’s Ortman Fluid Power business, were made.
The result from these divestments is reported under “Other operating income”. See note 7.
No material business divestment of assets and liabilities was done in 2014.
Assets held for saleTwo buildings located in US, amounting to 53 were reclassified to assets held for sale in 2015. Both buildings were sold during 2015.
In 2014, two buildings located in France and Sweden, amounting to 10, were reclassified to assets held for sale. Assets held for sale from previous years, amounting to 1, was sold during 2014.
Contribution from businesses acquired in 2015 and 2014 by business area
Compressor Technique
Industrial Technique
Mining and Rock Excavation Technique
Construction Technique
Group
2015 2014 2015 2014 2015 2014 2015 2014 2015 2014
Contribution from date of control
Revenues 75 8 763 17 506 – 53 29 – 121 9 322
Operating profit –10 1 577 –2 81 – 4 14 – 2 1 662
Profit for the year – 1 282
Contribution if the acquisition had occurred on Jan. 1
Revenues 213 8 972 32 1 144 – 58 58 – 303 10 174
Operating profit –6 1 598 –2 98 – 5 25 – 17 1 701
Profit for the year 8 1 327
Edwards had revenues in 2014 of 8 535 and operating profit of 1 555.
3. Divestments and assets held for sale
Carrying value of divested assets and liabilities 2015 2014
Intangible assets 30 –
Other property, plant and equipment 2 –
Inventories 14 –
Net identifiable assets 46 –
Capital gain 10 –
Contingent consideration 2 –
Net cash effect 58 –
Total fair value of acquired assets and liabilities
Group recognized values
2015 2014of which Edwards
Intangible assets –67 5 612 3 933
Property, plant and equipment 87 1 803 1 252
Other non-current assets – 74 74
Inventories 36 1 333 1 013
Receivables* 36 1 426 1 254
Other current assets –4 155 148
Cash and cash equivalents 11 990 917
Interest-bearing loans and borrowings –4 –3 607 –3 300
Other liabilities and provisions –16 –2 546 –2 177
Deferred tax assets/liabilities, net 42 –821 –454
Net identifiable assets 121 4 419 2 660
Goodwill 76 7 078 5 118
Total consideration 197 11 497 7 778
Deferred consideration 1 666 –2 092 –
Cash and cash equivalents acquired –11 –990 –917
Net cash outflow 1 852 8 415 6 861
* The gross amount is 37 (1 459) of which 1 (33) is expected to be uncollectible.
The goodwill recognized on acquisitions is primarily related to the synergies expected to be achieved from integrating these companies into the Group’s existing structure.
The total consideration for all acquisitions was 197. Deferred consider-ation includes both deferred consideration not yet paid for acquisitions made in 2015 and settlement of deferred consideration for acquisitions made in prior years. For all acquisitions, the net cash outflow totaled 1 852 after deducting cash and cash equivalents acquired of 11.
Acquisition-related costs amounted to 28 (20) and were included mainly in “Administrative expenses” in the income statement for 2015. These include costs for announced acquisitions that will be completed in 2016.
2. Acquisitions, continued
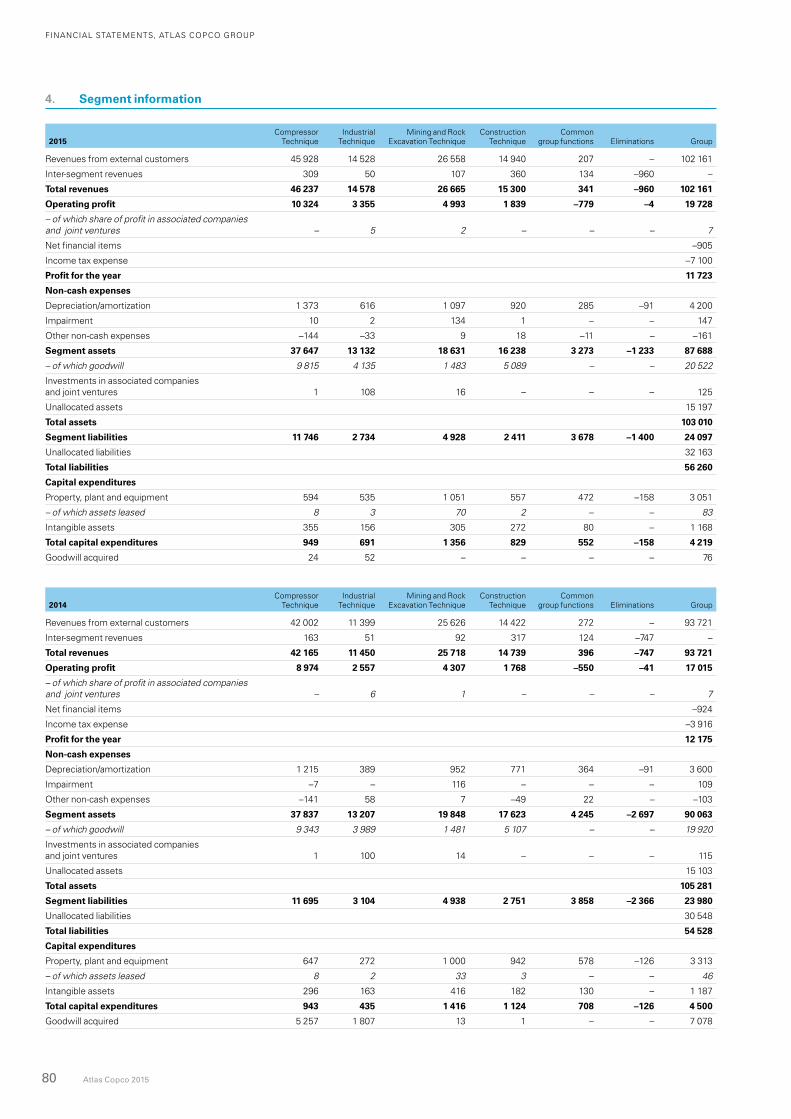
FINANCIAL STATEMENTS, ATLAS COPCO GROUP
80 Atlas Copco 2015
2015Compressor
TechniqueIndustrial
Technique Mining and Rock
Excavation TechniqueConstruction
TechniqueCommon
group functions Eliminations Group
Revenues from external customers 45 928 14 528 26 558 14 940 207 – 102 161
Inter-segment revenues 309 50 107 360 134 –960 –
Total revenues 46 237 14 578 26 665 15 300 341 –960 102 161
Operating profit 10 324 3 355 4 993 1 839 –779 –4 19 728
– of which share of profit in associated companies and joint ventures – 5 2 – – – 7
Net financial items –905
Income tax expense –7 100
Profit for the year 11 723
Non-cash expenses
Depreciation/amortization 1 373 616 1 097 920 285 –91 4 200
Impairment 10 2 134 1 – – 147
Other non-cash expenses –144 –33 9 18 –11 – –161
Segment assets 37 647 13 132 18 631 16 238 3 273 –1 233 87 688
– of which goodwill 9 815 4 135 1 483 5 089 – – 20 522
Investments in associated companies and joint ventures 1 108 16 – – – 125
Unallocated assets 15 197
Total assets 103 010
Segment liabilities 11 746 2 734 4 928 2 411 3 678 –1 400 24 097
Unallocated liabilities 32 163
Total liabilities 56 260
Capital expenditures
Property, plant and equipment 594 535 1 051 557 472 –158 3 051
– of which assets leased 8 3 70 2 – – 83
Intangible assets 355 156 305 272 80 – 1 168
Total capital expenditures 949 691 1 356 829 552 –158 4 219
Goodwill acquired 24 52 – – – – 76
2014Compressor
TechniqueIndustrial
Technique Mining and Rock
Excavation TechniqueConstruction
TechniqueCommon
group functions Eliminations Group
Revenues from external customers 42 002 11 399 25 626 14 422 272 – 93 721
Inter-segment revenues 163 51 92 317 124 –747 –
Total revenues 42 165 11 450 25 718 14 739 396 –747 93 721
Operating profit 8 974 2 557 4 307 1 768 –550 –41 17 015
– of which share of profit in associated companies and joint ventures – 6 1 – – – 7
Net financial items –924
Income tax expense –3 916
Profit for the year 12 175
Non-cash expenses
Depreciation/amortization 1 215 389 952 771 364 –91 3 600
Impairment –7 – 116 – – – 109
Other non-cash expenses –141 58 7 –49 22 – –103
Segment assets 37 837 13 207 19 848 17 623 4 245 –2 697 90 063
– of which goodwill 9 343 3 989 1 481 5 107 – – 19 920
Investments in associated companies and joint ventures 1 100 14 – – – 115
Unallocated assets 15 103
Total assets 105 281
Segment liabilities 11 695 3 104 4 938 2 751 3 858 –2 366 23 980
Unallocated liabilities 30 548
Total liabilities 54 528
Capital expenditures
Property, plant and equipment 647 272 1 000 942 578 –126 3 313
– of which assets leased 8 2 33 3 – – 46
Intangible assets 296 163 416 182 130 – 1 187
Total capital expenditures 943 435 1 416 1 124 708 –126 4 500
Goodwill acquired 5 257 1 807 13 1 – – 7 078
4. Segment information
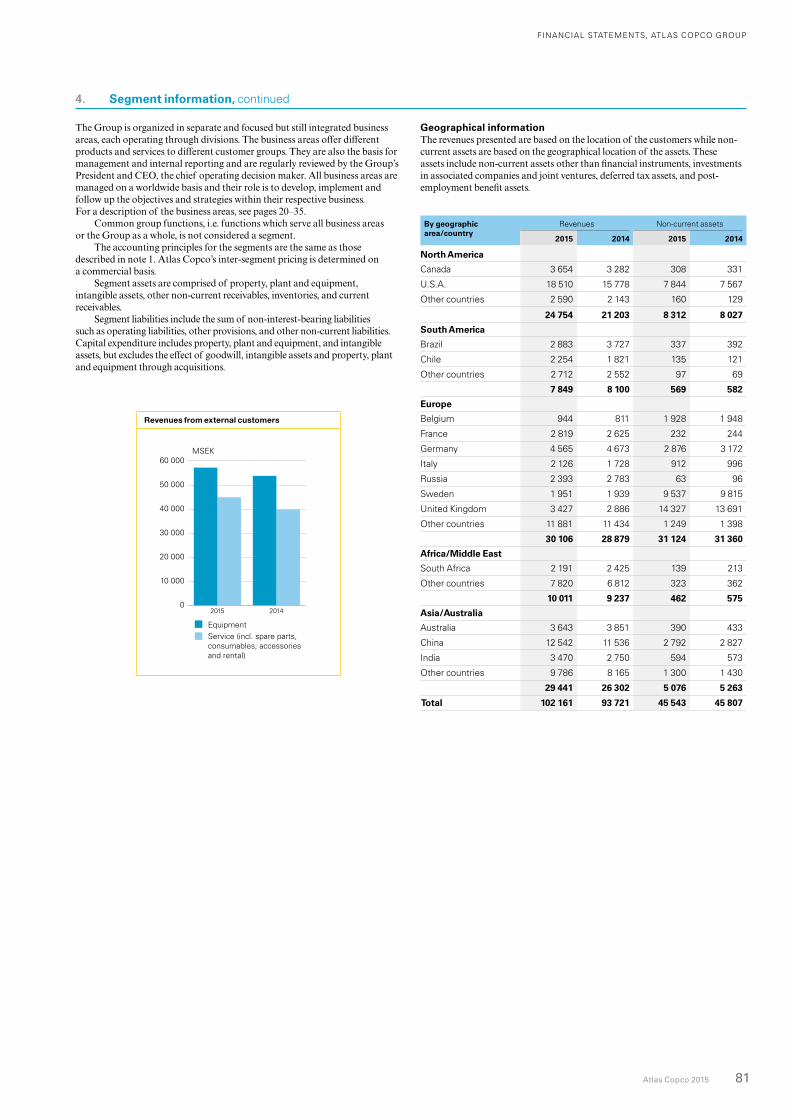
FINANCIAL STATEMENTS, ATLAS COPCO GROUP
Atlas Copco 2015 81
The Group is organized in separate and focused but still integrated business areas, each operating through divisions. The business areas offer different products and services to different customer groups. They are also the basis for management and internal reporting and are regularly reviewed by the Group’s President and CEO, the chief operating decision maker. All business areas are managed on a worldwide basis and their role is to develop, implement and follow up the objectives and strategies within their respective business. For a description of the business areas, see pages 20–35.
Common group functions, i.e. functions which serve all business areas or the Group as a whole, is not considered a segment.
The accounting principles for the segments are the same as those described in note 1. Atlas Copco’s inter-segment pricing is determined on a commercial basis.
Segment assets are comprised of property, plant and equipment, intangible assets, other non-current receivables, inventories, and current receivables.
Segment liabilities include the sum of non-interest-bearing liabilities such as operating liabilities, other provisions, and other non-current liabilities. Capital expenditure includes property, plant and equipment, and intangible assets, but excludes the effect of goodwill, intangible assets and property, plant and equipment through acquisitions.
Revenues from external customers
0
10 000
20 000
30 000
40 000
50 000
60 000
20142015
MSEK
EquipmentService (incl. spare parts, consumables, accessories and rental)
Geographical informationThe revenues presented are based on the location of the customers while non-current assets are based on the geographical location of the assets. These assets include non-current assets other than financial instruments, investments in associated companies and joint ventures, deferred tax assets, and post-employment benefit assets.
By geographic area/country
Revenues Non-current assets
2015 2014 2015 2014
North America
Canada 3 654 3 282 308 331
U.S.A. 18 510 15 778 7 844 7 567
Other countries 2 590 2 143 160 129
24 754 21 203 8 312 8 027
South America
Brazil 2 883 3 727 337 392
Chile 2 254 1 821 135 121
Other countries 2 712 2 552 97 69
7 849 8 100 569 582
Europe
Belgium 944 811 1 928 1 948
France 2 819 2 625 232 244
Germany 4 565 4 673 2 876 3 172
Italy 2 126 1 728 912 996
Russia 2 393 2 783 63 96
Sweden 1 951 1 939 9 537 9 815
United Kingdom 3 427 2 886 14 327 13 691
Other countries 11 881 11 434 1 249 1 398
30 106 28 879 31 124 31 360
Africa/Middle East
South Africa 2 191 2 425 139 213
Other countries 7 820 6 812 323 362
10 011 9 237 462 575
Asia/Australia
Australia 3 643 3 851 390 433
China 12 542 11 536 2 792 2 827
India 3 470 2 750 594 573
Other countries 9 786 8 165 1 300 1 430
29 441 26 302 5 076 5 263
Total 102 161 93 721 45 543 45 807
4. Segment information, continued
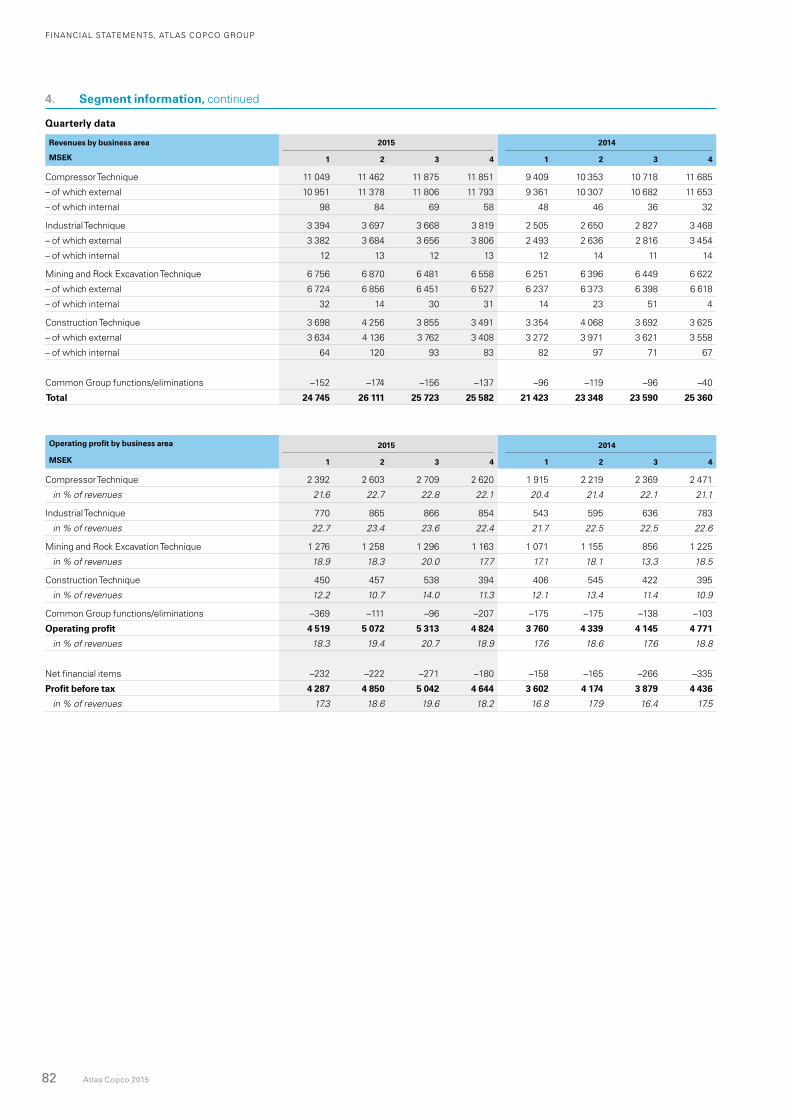
FINANCIAL STATEMENTS, ATLAS COPCO GROUP
82 Atlas Copco 2015
Quarterly data
Revenues by business area 2015 2014
MSEK 1 2 3 4 1 2 3 4
Compressor Technique 11 049 11 462 11 875 11 851 9 409 10 353 10 718 11 685
– of which external 10 951 11 378 11 806 11 793 9 361 10 307 10 682 11 653
– of which internal 98 84 69 58 48 46 36 32
Industrial Technique 3 394 3 697 3 668 3 819 2 505 2 650 2 827 3 468
– of which external 3 382 3 684 3 656 3 806 2 493 2 636 2 816 3 454
– of which internal 12 13 12 13 12 14 11 14
Mining and Rock Excavation Technique 6 756 6 870 6 481 6 558 6 251 6 396 6 449 6 622
– of which external 6 724 6 856 6 451 6 527 6 237 6 373 6 398 6 618
– of which internal 32 14 30 31 14 23 51 4
Construction Technique 3 698 4 256 3 855 3 491 3 354 4 068 3 692 3 625
– of which external 3 634 4 136 3 762 3 408 3 272 3 971 3 621 3 558
– of which internal 64 120 93 83 82 97 71 67
Common Group functions/eliminations –152 –174 –156 –137 –96 –119 –96 –40
Total 24 745 26 111 25 723 25 582 21 423 23 348 23 590 25 360
Operating profit by business area 2015 2014
MSEK 1 2 3 4 1 2 3 4
Compressor Technique 2 392 2 603 2 709 2 620 1 915 2 219 2 369 2 471
in % of revenues 21.6 22.7 22.8 22.1 20.4 21.4 22.1 21.1
Industrial Technique 770 865 866 854 543 595 636 783
in % of revenues 22.7 23.4 23.6 22.4 21.7 22.5 22.5 22.6
Mining and Rock Excavation Technique 1 276 1 258 1 296 1 163 1 071 1 155 856 1 225
in % of revenues 18.9 18.3 20.0 17.7 17.1 18.1 13.3 18.5
Construction Technique 450 457 538 394 406 545 422 395
in % of revenues 12.2 10.7 14.0 11.3 12.1 13.4 11.4 10.9
Common Group functions/eliminations –369 –111 –96 –207 –175 –175 –138 –103
Operating profit 4 519 5 072 5 313 4 824 3 760 4 339 4 145 4 771
in % of revenues 18.3 19.4 20.7 18.9 17.6 18.6 17.6 18.8
Net financial items –232 –222 –271 –180 –158 –165 –266 –335
Profit before tax 4 287 4 850 5 042 4 644 3 602 4 174 3 879 4 436
in % of revenues 17.3 18.6 19.6 18.2 16.8 17.9 16.4 17.5
4. Segment information, continued
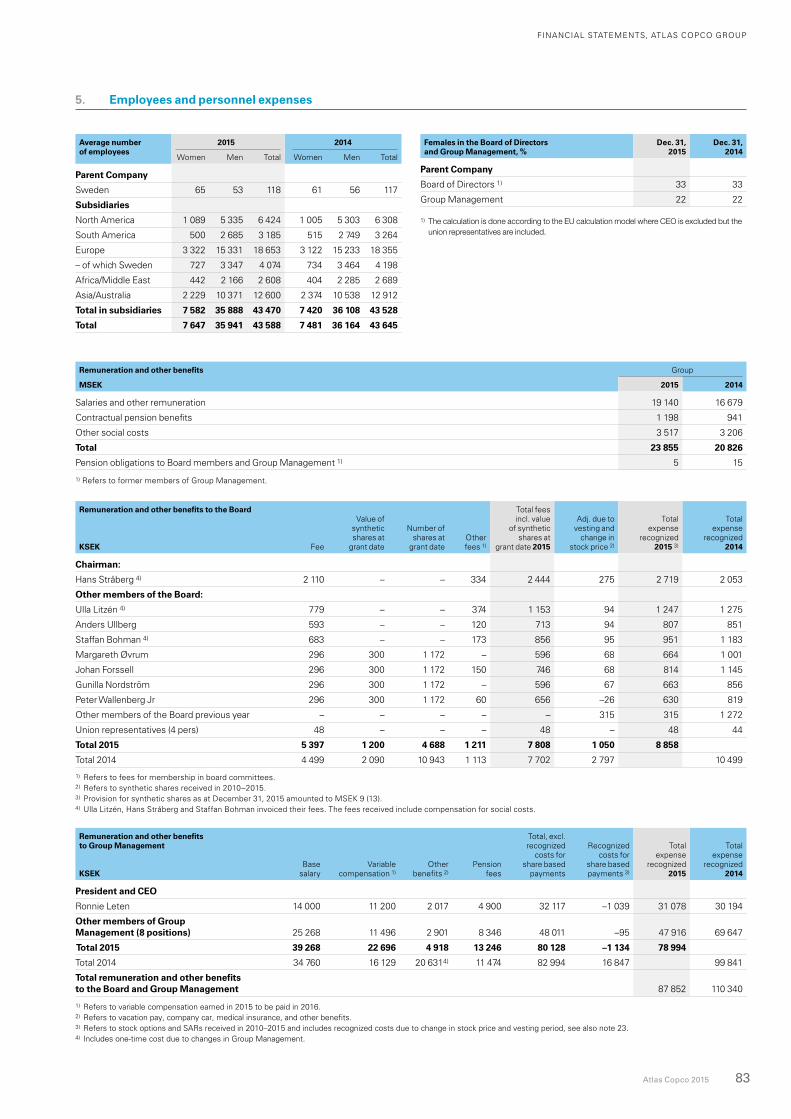
FINANCIAL STATEMENTS, ATLAS COPCO GROUP
Atlas Copco 2015 83
Females in the Board of Directors and Group Management, %
Dec. 31, 2015
Dec. 31, 2014
Parent Company
Board of Directors 1) 33 33
Group Management 22 22
1) The calculation is done according to the EU calculation model where CEO is excluded but the union representatives are included.
Average number of employees
2015 2014
Women Men Total Women Men Total
Parent Company
Sweden 65 53 118 61 56 117
Subsidiaries
North America 1 089 5 335 6 424 1 005 5 303 6 308
South America 500 2 685 3 185 515 2 749 3 264
Europe 3 322 15 331 18 653 3 122 15 233 18 355
– of which Sweden 727 3 347 4 074 734 3 464 4 198
Africa/Middle East 442 2 166 2 608 404 2 285 2 689
Asia/Australia 2 229 10 371 12 600 2 374 10 538 12 912
Total in subsidiaries 7 582 35 888 43 470 7 420 36 108 43 528
Total 7 647 35 941 43 588 7 481 36 164 43 645
Remuneration and other benefits Group
MSEK 2015 2014
Salaries and other remuneration 19 140 16 679
Contractual pension benefits 1 198 941
Other social costs 3 517 3 206
Total 23 855 20 826
Pension obligations to Board members and Group Management 1) 5 15
1) Refers to former members of Group Management.
Remuneration and other benefits to the Board
KSEK Fee
Value of synthetic shares at
grant date
Number of shares at
grant dateOther fees 1)
Total fees incl. value
of synthetic shares at
grant date 2015
Adj. due to vesting and
change in stock price 2)
Total expense
recognized 2015 3)
Total expense
recognized 2014
Chairman:
Hans Stråberg 4) 2 110 – – 334 2 444 275 2 719 2 053
Other members of the Board:
Ulla Litzén 4) 779 – – 374 1 153 94 1 247 1 275
Anders Ullberg 593 – – 120 713 94 807 851
Staffan Bohman 4) 683 – – 173 856 95 951 1 183
Margareth Øvrum 296 300 1 172 – 596 68 664 1 001
Johan Forssell 296 300 1 172 150 746 68 814 1 145
Gunilla Nordström 296 300 1 172 – 596 67 663 856
Peter Wallenberg Jr 296 300 1 172 60 656 –26 630 819
Other members of the Board previous year – – – – – 315 315 1 272
Union representatives (4 pers) 48 – – – 48 – 48 44
Total 2015 5 397 1 200 4 688 1 211 7 808 1 050 8 858
Total 2014 4 499 2 090 10 943 1 113 7 702 2 797 10 499
1) Refers to fees for membership in board committees.2) Refers to synthetic shares received in 2010–2015. 3) Provision for synthetic shares as at December 31, 2015 amounted to MSEK 9 (13).4) Ulla Litzén, Hans Stråberg and Staffan Bohman invoiced their fees. The fees received include compensation for social costs.
Remuneration and other benefits to Group Management
KSEKBase
salaryVariable
compensation 1) Other
benefits 2)Pension
fees
Total, excl. recognized
costs for share based
payments
Recognized costs for
share based payments 3)
Total expense
recognized 2015
Total expense
recognized 2014
President and CEO
Ronnie Leten 14 000 11 200 2 017 4 900 32 117 –1 039 31 078 30 194
Other members of Group Management (8 positions) 25 268 11 496 2 901 8 346 48 011 –95 47 916 69 647
Total 2015 39 268 22 696 4 918 13 246 80 128 –1 134 78 994
Total 2014 34 760 16 129 20 6314) 11 474 82 994 16 847 99 841
Total remuneration and other benefits to the Board and Group Management 87 852 110 340
1) Refers to variable compensation earned in 2015 to be paid in 2016.2) Refers to vacation pay, company car, medical insurance, and other benefits. 3) Refers to stock options and SARs received in 2010–2015 and includes recognized costs due to change in stock price and vesting period, see also note 23.4) Includes one-time cost due to changes in Group Management.
5. Employees and personnel expenses
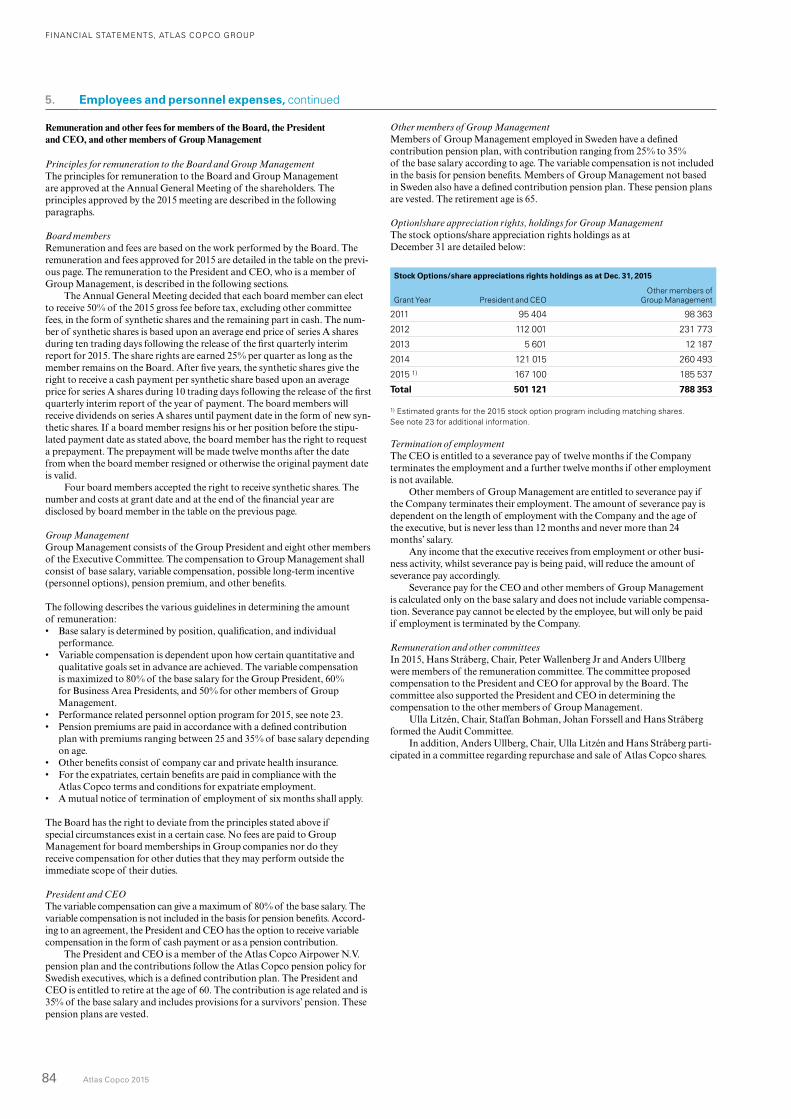
FINANCIAL STATEMENTS, ATLAS COPCO GROUP
84 Atlas Copco 2015
Remuneration and other fees for members of the Board, the President and CEO, and other members of Group Management
Principles for remuneration to the Board and Group ManagementThe principles for remuneration to the Board and Group Management are approved at the Annual General Meeting of the shareholders. The principles approved by the 2015 meeting are described in the following paragraphs.
Board membersRemuneration and fees are based on the work performed by the Board. The remuneration and fees approved for 2015 are detailed in the table on the previ-ous page. The remuneration to the President and CEO, who is a member of Group Management, is described in the following sections.
The Annual General Meeting decided that each board member can elect to receive 50% of the 2015 gross fee before tax, excluding other committee fees, in the form of synthetic shares and the remaining part in cash. The num-ber of synthetic shares is based upon an average end price of series A shares during ten trading days following the release of the first quarterly interim report for 2015. The share rights are earned 25% per quarter as long as the member remains on the Board. After five years, the synthetic shares give the right to receive a cash payment per synthetic share based upon an average price for series A shares during 10 trading days following the release of the first quarterly interim report of the year of payment. The board members will receive dividends on series A shares until payment date in the form of new syn-thetic shares. If a board member resigns his or her position before the stipu-lated payment date as stated above, the board member has the right to request a prepayment. The prepayment will be made twelve months after the date from when the board member resigned or otherwise the original payment date is valid.
Four board members accepted the right to receive synthetic shares. The number and costs at grant date and at the end of the financial year are disclosed by board member in the table on the previous page.
Group ManagementGroup Management consists of the Group President and eight other members of the Executive Committee. The compensation to Group Management shall consist of base salary, variable compensation, possible long-term incentive (personnel options), pension premium, and other benefits.
The following describes the various guidelines in determining the amount of remuneration:• Base salary is determined by position, qualification, and individual
performance. • Variable compensation is dependent upon how certain quantitative and
qualitative goals set in advance are achieved. The variable compensation is maximized to 80% of the base salary for the Group President, 60% for Business Area Presidents, and 50% for other members of Group Management.
• Performance related personnel option program for 2015, see note 23.• Pension premiums are paid in accordance with a defined contribution
plan with premiums ranging between 25 and 35% of base salary depending on age.
• Other benefits consist of company car and private health insurance.• For the expatriates, certain benefits are paid in compliance with the
Atlas Copco terms and conditions for expatriate employment. • A mutual notice of termination of employment of six months shall apply.
The Board has the right to deviate from the principles stated above if special circumstances exist in a certain case. No fees are paid to GroupManagement for board memberships in Group companies nor do theyreceive compensation for other duties that they may perform outside theimmediate scope of their duties.
President and CEOThe variable compensation can give a maximum of 80% of the base salary. The variable compensation is not included in the basis for pension benefits. Accord-ing to an agreement, the President and CEO has the option to receive variable compensation in the form of cash payment or as a pension contribution.
The President and CEO is a member of the Atlas Copco Airpower N.V. pension plan and the contributions follow the Atlas Copco pension policy for Swedish executives, which is a defined contribution plan. The President and CEO is entitled to retire at the age of 60. The contribution is age related and is 35% of the base salary and includes provisions for a survivors’ pension. These pension plans are vested.
5. Employees and personnel expenses, continued
Other members of Group ManagementMembers of Group Management employed in Sweden have a defined contribution pension plan, with contribution ranging from 25% to 35% of the base salary according to age. The variable compensation is not included in the basis for pension benefits. Members of Group Management not based in Sweden also have a defined contribution pension plan. These pension plans are vested. The retirement age is 65.
Option/share appreciation rights, holdings for Group Management The stock options/share appreciation rights holdings as at December 31 are detailed below:
Stock Options/share appreciations rights holdings as at Dec. 31, 2015
Grant Year President and CEOOther members of
Group Management
2011 95 404 98 363
2012 112 001 231 773
2013 5 601 12 187
2014 121 015 260 493
2015 1) 167 100 185 537
Total 501 121 788 353
1) Estimated grants for the 2015 stock option program including matching shares.See note 23 for additional information.
Termination of employmentThe CEO is entitled to a severance pay of twelve months if the Company terminates the employment and a further twelve months if other employment is not available.
Other members of Group Management are entitled to severance pay if the Company terminates their employment. The amount of severance pay is dependent on the length of employment with the Company and the age of the executive, but is never less than 12 months and never more than 24 months’ salary.
Any income that the executive receives from employment or other busi-ness activity, whilst severance pay is being paid, will reduce the amount of severance pay accordingly.
Severance pay for the CEO and other members of Group Management is calculated only on the base salary and does not include variable compensa-tion. Severance pay cannot be elected by the employee, but will only be paid if employment is terminated by the Company.
Remuneration and other committeesIn 2015, Hans Stråberg, Chair, Peter Wallenberg Jr and Anders Ullberg were members of the remuneration committee. The committee proposed compensation to the President and CEO for approval by the Board. The committee also supported the President and CEO in determining the compensation to the other members of Group Management.
Ulla Litzén, Chair, Staffan Bohman, Johan Forssell and Hans Stråberg formed the Audit Committee.
In addition, Anders Ullberg, Chair, Ulla Litzén and Hans Stråberg parti-cipated in a committee regarding repurchase and sale of Atlas Copco shares.
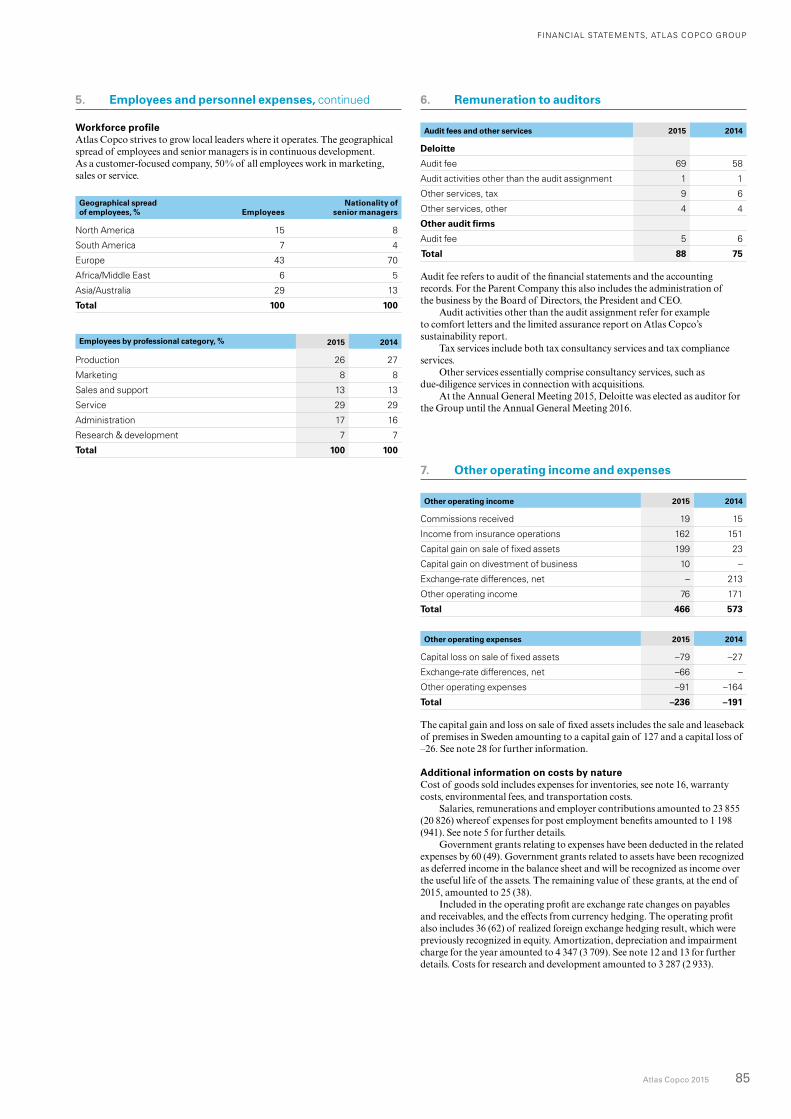
FINANCIAL STATEMENTS, ATLAS COPCO GROUP
Atlas Copco 2015 85
6. Remuneration to auditors
Audit fees and other services 2015 2014
Deloitte
Audit fee 69 58
Audit activities other than the audit assignment 1 1
Other services, tax 9 6
Other services, other 4 4
Other audit firms
Audit fee 5 6
Total 88 75
Audit fee refers to audit of the financial statements and the accounting records. For the Parent Company this also includes the administration of the business by the Board of Directors, the President and CEO.
Audit activities other than the audit assignment refer for example to comfort letters and the limited assurance report on Atlas Copco’s sustainability report.
Tax services include both tax consultancy services and tax compliance services.
Other services essentially comprise consultancy services, such as due- diligence services in connection with acquisitions.
At the Annual General Meeting 2015, Deloitte was elected as auditor for the Group until the Annual General Meeting 2016.
7. Other operating income and expenses
Other operating income 2015 2014
Commissions received 19 15
Income from insurance operations 162 151
Capital gain on sale of fixed assets 199 23
Capital gain on divestment of business 10 –
Exchange-rate differences, net – 213
Other operating income 76 171
Total 466 573
Other operating expenses 2015 2014
Capital loss on sale of fixed assets –79 –27
Exchange-rate differences, net –66 –
Other operating expenses –91 –164
Total –236 –191
The capital gain and loss on sale of fixed assets includes the sale and leaseback of premises in Sweden amounting to a capital gain of 127 and a capital loss of –26. See note 28 for further information.
Additional information on costs by natureCost of goods sold includes expenses for inventories, see note 16, warranty costs, environmental fees, and transportation costs.
Salaries, remunerations and employer contributions amounted to 23 855 (20 826) whereof expenses for post employment benefits amounted to 1 198 (941). See note 5 for further details.
Government grants relating to expenses have been deducted in the related expenses by 60 (49). Government grants related to assets have been recognized as deferred income in the balance sheet and will be recognized as income over the useful life of the assets. The remaining value of these grants, at the end of 2015, amounted to 25 (38).
Included in the operating profit are exchange rate changes on payables and receivables, and the effects from currency hedging. The operating profit also includes 36 (62) of realized foreign exchange hedging result, which were previously recognized in equity. Amortization, depreciation and impairment charge for the year amounted to 4 347 (3 709). See note 12 and 13 for further details. Costs for research and development amounted to 3 287 (2 933).
Workforce profileAtlas Copco strives to grow local leaders where it operates. The geo graphical spread of employees and senior managers is in continuous development. As a customer-focused company, 50% of all employees work in marketing, sales or service.
Geographical spread of employees, % Employees
Nationality of senior managers
North America 15 8
South America 7 4
Europe 43 70
Africa/Middle East 6 5
Asia/Australia 29 13
Total 100 100
Employees by professional category, % 2015 2014
Production 26 27
Marketing 8 8
Sales and support 13 13
Service 29 29
Administration 17 16
Research & development 7 7
Total 100 100
5. Employees and personnel expenses, continued
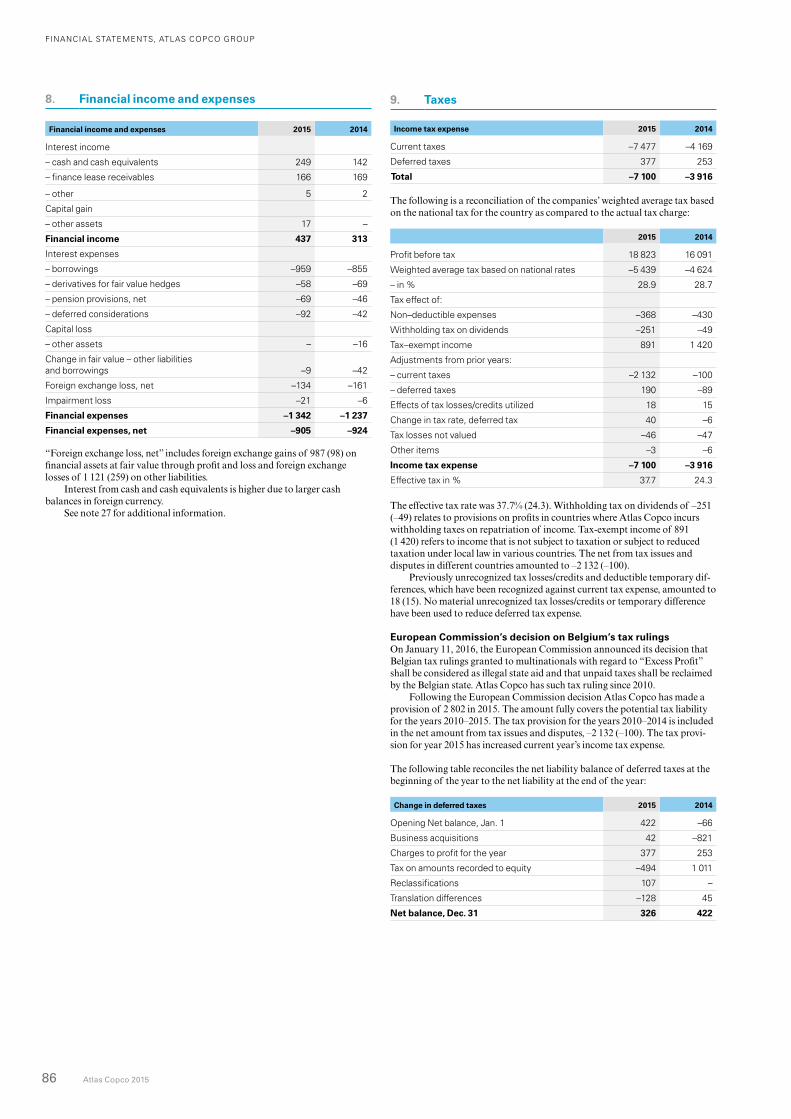
FINANCIAL STATEMENTS, ATLAS COPCO GROUP
86 Atlas Copco 2015
9. Taxes
Income tax expense 2015 2014
Current taxes –7 477 –4 169
Deferred taxes 377 253
Total –7 100 –3 916
The following is a reconciliation of the companies’ weighted average tax based on the national tax for the country as compared to the actual tax charge:
2015 2014
Profit before tax 18 823 16 091
Weighted average tax based on national rates –5 439 –4 624
– in % 28.9 28.7
Tax effect of:
Non–deductible expenses –368 –430
Withholding tax on dividends –251 –49
Tax–exempt income 891 1 420
Adjustments from prior years:
– current taxes –2 132 –100
– deferred taxes 190 –89
Effects of tax losses/credits utilized 18 15
Change in tax rate, deferred tax 40 –6
Tax losses not valued –46 –47
Other items –3 –6
Income tax expense –7 100 –3 916
Effective tax in % 37.7 24.3
The effective tax rate was 37.7% (24.3). Withholding tax on dividends of –251 (–49) relates to provisions on profits in countries where Atlas Copco incurs withholding taxes on repatriation of income. Tax-exempt income of 891 (1 420) refers to income that is not subject to taxation or subject to reduced taxation under local law in various countries. The net from tax issues and disputes in different countries amounted to –2 132 (–100).
Previously unrecognized tax losses/credits and deductible temporary dif-ferences, which have been recognized against current tax expense, amounted to 18 (15). No material unrecognized tax losses/credits or temporary difference have been used to reduce deferred tax expense.
European Commission’s decision on Belgium’s tax rulingsOn January 11, 2016, the European Commission announced its decision that Belgian tax rulings granted to multinationals with regard to “Excess Profit” shall be considered as illegal state aid and that unpaid taxes shall be reclaimed by the Belgian state. Atlas Copco has such tax ruling since 2010.
Following the European Commission decision Atlas Copco has made a provision of 2 802 in 2015. The amount fully covers the potential tax liability for the years 2010–2015. The tax provision for the years 2010–2014 is included in the net amount from tax issues and disputes, –2 132 (–100). The tax provi-sion for year 2015 has increased current year’s income tax expense.
The following table reconciles the net liability balance of deferred taxes at the beginning of the year to the net liability at the end of the year:
Change in deferred taxes 2015 2014
Opening Net balance, Jan. 1 422 –66
Business acquisitions 42 –821
Charges to profit for the year 377 253
Tax on amounts recorded to equity –494 1 011
Reclassifications 107 –
Translation differences –128 45
Net balance, Dec. 31 326 422
8. Financial income and expenses
Financial income and expenses 2015 2014
Interest income
– cash and cash equivalents 249 142
– finance lease receivables 166 169
– other 5 2
Capital gain
– other assets 17 –
Financial income 437 313
Interest expenses
– borrowings –959 –855
– derivatives for fair value hedges –58 –69
– pension provisions, net –69 –46
– deferred considerations –92 –42
Capital loss
– other assets – –16
Change in fair value – other liabilities and borrowings –9 –42
Foreign exchange loss, net –134 –161
Impairment loss –21 –6
Financial expenses –1 342 –1 237
Financial expenses, net –905 –924
“Foreign exchange loss, net” includes foreign exchange gains of 987 (98) on financial assets at fair value through profit and loss and foreign exchange losses of 1 121 (259) on other liabilities.
Interest from cash and cash equivalents is higher due to larger cash balances in foreign currency.
See note 27 for additional information.
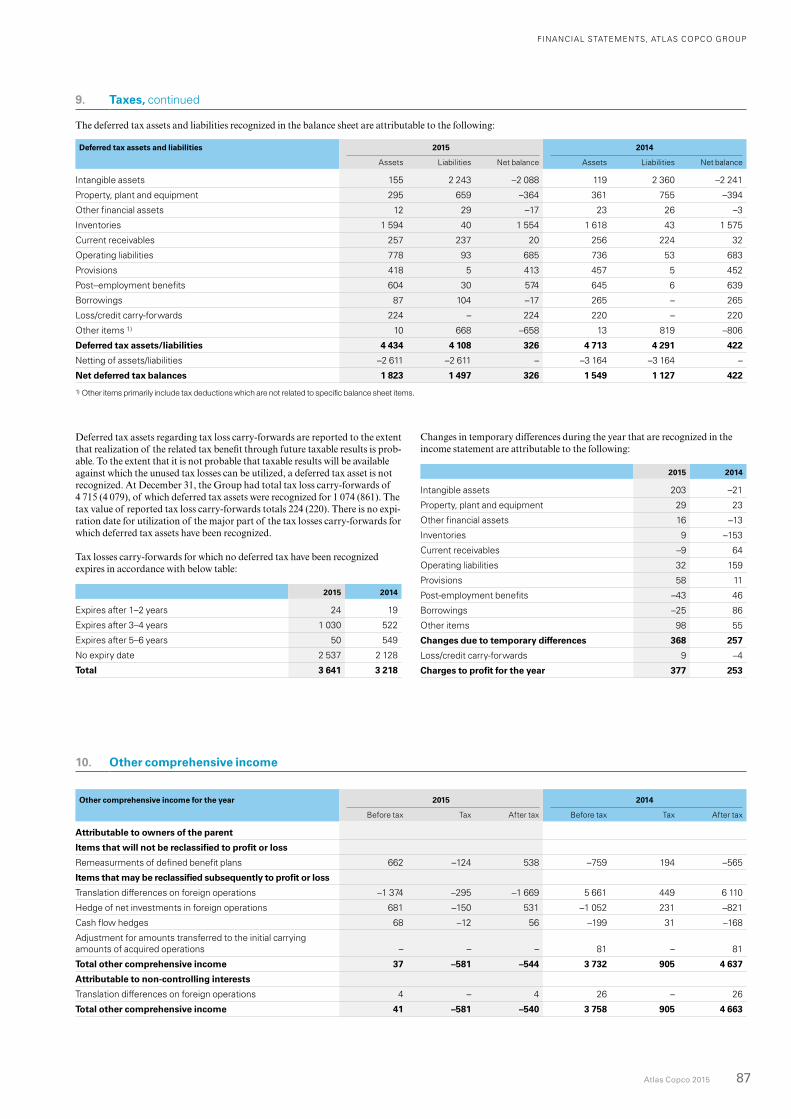
FINANCIAL STATEMENTS, ATLAS COPCO GROUP
Atlas Copco 2015 87
9. Taxes, continued
The deferred tax assets and liabilities recognized in the balance sheet are attributable to the following:
Deferred tax assets and liabilities 2015 2014
Assets Liabilities Net balance Assets Liabilities Net balance
Intangible assets 155 2 243 –2 088 119 2 360 –2 241
Property, plant and equipment 295 659 –364 361 755 –394
Other financial assets 12 29 –17 23 26 –3
Inventories 1 594 40 1 554 1 618 43 1 575
Current receivables 257 237 20 256 224 32
Operating liabilities 778 93 685 736 53 683
Provisions 418 5 413 457 5 452
Post–employment benefits 604 30 574 645 6 639
Borrowings 87 104 –17 265 – 265
Loss/credit carry-forwards 224 – 224 220 – 220
Other items 1) 10 668 –658 13 819 –806
Deferred tax assets/liabilities 4 434 4 108 326 4 713 4 291 422
Netting of assets/liabilities –2 611 –2 611 – –3 164 –3 164 –
Net deferred tax balances 1 823 1 497 326 1 549 1 127 422
1) Other items primarily include tax deductions which are not related to specific balance sheet items.
Deferred tax assets regarding tax loss carry-forwards are reported to the extent that realization of the related tax benefit through future taxable results is prob-able. To the extent that it is not probable that taxable results will be available against which the unused tax losses can be utilized, a deferred tax asset is not recognized. At December 31, the Group had total tax loss carry-forwards of 4 715 (4 079), of which deferred tax assets were recognized for 1 074 (861). The tax value of reported tax loss carry-forwards totals 224 (220). There is no expi-ration date for utilization of the major part of the tax losses carry-forwards for which deferred tax assets have been recognized.
Tax losses carry-forwards for which no deferred tax have been recognized expires in accordance with below table:
2015 2014
Expires after 1–2 years 24 19
Expires after 3–4 years 1 030 522
Expires after 5–6 years 50 549
No expiry date 2 537 2 128
Total 3 641 3 218
10. Other comprehensive income
Other comprehensive income for the year 2015 2014
Before tax Tax After tax Before tax Tax After tax
Attributable to owners of the parent
Items that will not be reclassified to profit or loss
Remeasurments of defined benefit plans 662 –124 538 –759 194 –565
Items that may be reclassified subsequently to profit or loss
Translation differences on foreign operations –1 374 –295 –1 669 5 661 449 6 110
Hedge of net investments in foreign operations 681 –150 531 –1 052 231 –821
Cash flow hedges 68 –12 56 –199 31 –168
Adjustment for amounts transferred to the initial carrying amounts of acquired operations – – – 81 – 81
Total other comprehensive income 37 –581 –544 3 732 905 4 637
Attributable to non-controlling interests
Translation differences on foreign operations 4 – 4 26 – 26
Total other comprehensive income 41 –581 –540 3 758 905 4 663
Changes in temporary differences during the year that are recognized in the income statement are attributable to the following:
2015 2014
Intangible assets 203 –21
Property, plant and equipment 29 23
Other financial assets 16 –13
Inventories 9 –153
Current receivables –9 64
Operating liabilities 32 159
Provisions 58 11
Post-employment benefits –43 46
Borrowings –25 86
Other items 98 55
Changes due to temporary differences 368 257
Loss/credit carry-forwards 9 –4
Charges to profit for the year 377 253
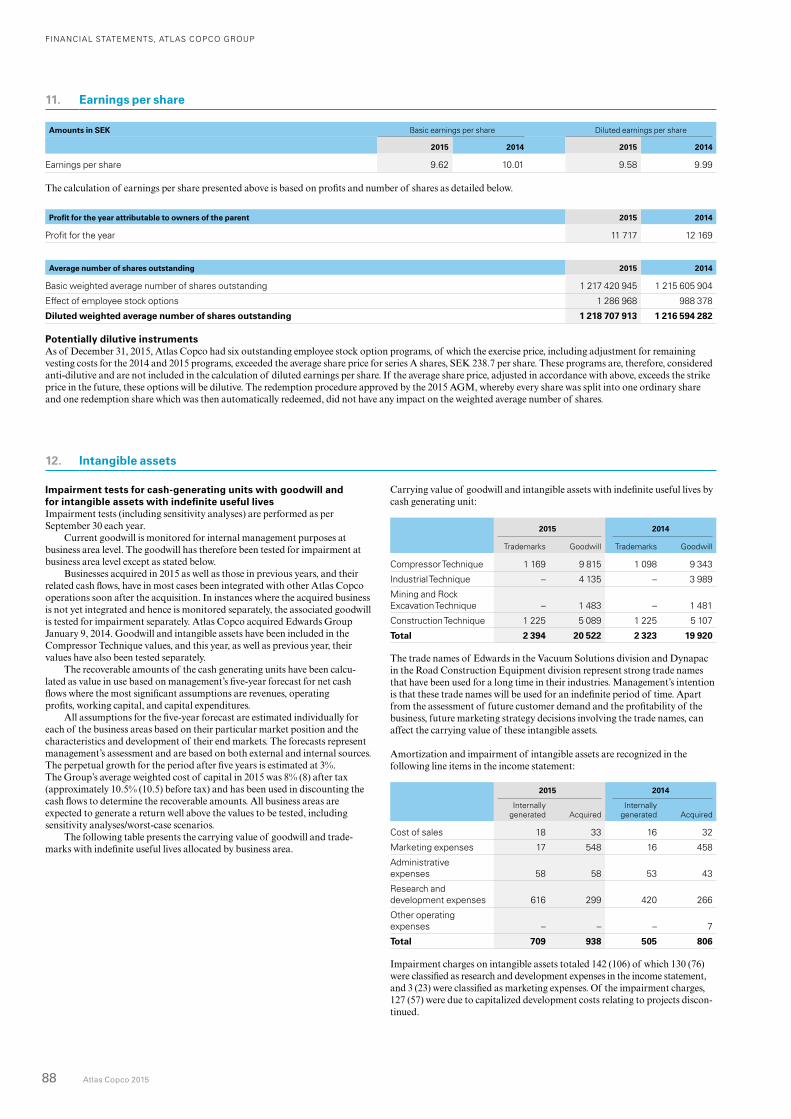
FINANCIAL STATEMENTS, ATLAS COPCO GROUP
88 Atlas Copco 2015
Impairment tests for cash-generating units with goodwill and for intangible assets with indefinite useful livesImpairment tests (including sensitivity analyses) are performed as per September 30 each year.
Current goodwill is monitored for internal management purposes at business area level. The goodwill has therefore been tested for impairment at business area level except as stated below.
Businesses acquired in 2015 as well as those in previous years, and their related cash flows, have in most cases been integrated with other Atlas Copco operations soon after the acquisition. In instances where the acquired business is not yet integrated and hence is monitored separately, the associated goodwill is tested for impairment separately. Atlas Copco acquired Edwards Group January 9, 2014. Goodwill and intangible assets have been included in the Compressor Technique values, and this year, as well as previous year, their values have also been tested separately.
The recoverable amounts of the cash generating units have been calcu-lated as value in use based on management’s five-year forecast for net cash flows where the most significant assumptions are revenues, operating profits, working capital, and capital expenditures.
All assumptions for the five-year forecast are estimated individually for each of the business areas based on their particular market position and the characteristics and development of their end markets. The forecasts represent management’s assessment and are based on both external and internal sources. The perpetual growth for the period after five years is estimated at 3%. The Group’s average weighted cost of capital in 2015 was 8% (8) after tax (approximately 10.5% (10.5) before tax) and has been used in discounting the cash flows to determine the recoverable amounts. All business areas are expected to generate a return well above the values to be tested, including sensitivity analyses/worst-case scenarios.
The following table presents the carrying value of goodwill and trade-marks with indefinite useful lives allocated by business area.
Carrying value of goodwill and intangible assets with indefinite useful lives by cash generating unit:
2015 2014
Trademarks Goodwill Trademarks Goodwill
Compressor Technique 1 169 9 815 1 098 9 343
Industrial Technique – 4 135 – 3 989
Mining and Rock Excavation Technique – 1 483 – 1 481
Construction Technique 1 225 5 089 1 225 5 107
Total 2 394 20 522 2 323 19 920
The trade names of Edwards in the Vacuum Solutions division and Dynapac in the Road Construction Equipment division represent strong trade names that have been used for a long time in their industries. Management’s intention is that these trade names will be used for an indefinite period of time. Apart from the assessment of future customer demand and the profitability of the business, future marketing strategy decisions involving the trade names, can affect the carrying value of these intangible assets.
Amortization and impairment of intangible assets are recognized in the following line items in the income statement:
2015 2014
Internally generated Acquired
Internally generated Acquired
Cost of sales 18 33 16 32
Marketing expenses 17 548 16 458
Administrative expenses 58 58 53 43
Research and development expenses 616 299 420 266
Other operating expenses – – – 7
Total 709 938 505 806
Impairment charges on intangible assets totaled 142 (106) of which 130 (76) were classified as research and development expenses in the income statement, and 3 (23) were classified as marketing expenses. Of the impairment charges, 127 (57) were due to capitalized development costs relating to projects discon-tinued.
12. Intangible assets
11. Earnings per share
Amounts in SEK Basic earnings per share Diluted earnings per share
2015 2014 2015 2014
Earnings per share 9.62 10.01 9.58 9.99
The calculation of earnings per share presented above is based on profits and number of shares as detailed below.
Profit for the year attributable to owners of the parent 2015 2014
Profit for the year 11 717 12 169
Average number of shares outstanding 2015 2014
Basic weighted average number of shares outstanding 1 217 420 945 1 215 605 904
Effect of employee stock options 1 286 968 988 378
Diluted weighted average number of shares outstanding 1 218 707 913 1 216 594 282
Potentially dilutive instruments As of December 31, 2015, Atlas Copco had six outstanding employee stock option programs, of which the exercise price, including adjustment for remaining vesting costs for the 2014 and 2015 programs, exceeded the average share price for series A shares, SEK 238.7 per share. These programs are, therefore, considered anti-dilutive and are not included in the calculation of diluted earnings per share. If the average share price, adjusted in accordance with above, exceeds the strike price in the future, these options will be dilutive. The redemption procedure approved by the 2015 AGM, whereby every share was split into one ordinary share and one redemption share which was then automatically redeemed, did not have any impact on the weighted average number of shares.
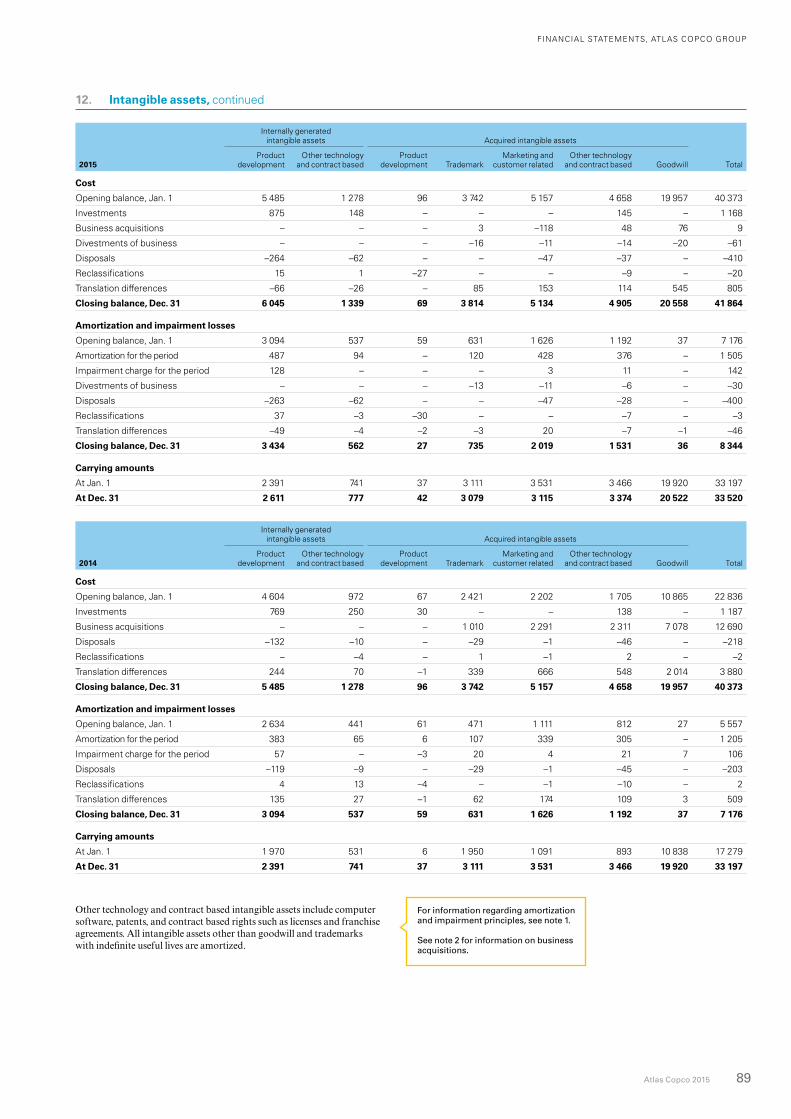
FINANCIAL STATEMENTS, ATLAS COPCO GROUP
Atlas Copco 2015 89
12. Intangible assets, continued
Internally generated intangible assets
Acquired intangible assets
2015Product
developmentOther technology
and contract basedProduct
development TrademarkMarketing and
customer relatedOther technology
and contract based Goodwill Total
Cost
Opening balance, Jan. 1 5 485 1 278 96 3 742 5 157 4 658 19 957 40 373
Investments 875 148 – – – 145 – 1 168
Business acquisitions – – – 3 –118 48 76 9
Divestments of business – – – –16 –11 –14 –20 –61
Disposals –264 –62 – – –47 –37 – –410
Reclassifications 15 1 –27 – – –9 – –20
Translation differences –66 –26 – 85 153 114 545 805
Closing balance, Dec. 31 6 045 1 339 69 3 814 5 134 4 905 20 558 41 864
Amortization and impairment losses
Opening balance, Jan. 1 3 094 537 59 631 1 626 1 192 37 7 176
Amortization for the period 487 94 – 120 428 376 – 1 505
Impairment charge for the period 128 – – – 3 11 – 142
Divestments of business – – – –13 –11 –6 – –30
Disposals –263 –62 – – –47 –28 – –400
Reclassifications 37 –3 –30 – – –7 – –3
Translation differences –49 –4 –2 –3 20 –7 –1 –46
Closing balance, Dec. 31 3 434 562 27 735 2 019 1 531 36 8 344
Carrying amounts
At Jan. 1 2 391 741 37 3 111 3 531 3 466 19 920 33 197
At Dec. 31 2 611 777 42 3 079 3 115 3 374 20 522 33 520
Internally generated intangible assets
Acquired intangible assets
2014Product
developmentOther technology
and contract basedProduct
development TrademarkMarketing and
customer relatedOther technology
and contract based Goodwill Total
Cost
Opening balance, Jan. 1 4 604 972 67 2 421 2 202 1 705 10 865 22 836
Investments 769 250 30 – – 138 – 1 187
Business acquisitions – – – 1 010 2 291 2 311 7 078 12 690
Disposals –132 –10 – –29 –1 –46 – –218
Reclassifications – –4 – 1 –1 2 – –2
Translation differences 244 70 –1 339 666 548 2 014 3 880
Closing balance, Dec. 31 5 485 1 278 96 3 742 5 157 4 658 19 957 40 373
Amortization and impairment losses
Opening balance, Jan. 1 2 634 441 61 471 1 111 812 27 5 557
Amortization for the period 383 65 6 107 339 305 – 1 205
Impairment charge for the period 57 – –3 20 4 21 7 106
Disposals –119 –9 – –29 –1 –45 – –203
Reclassifications 4 13 –4 – –1 –10 – 2
Translation differences 135 27 –1 62 174 109 3 509
Closing balance, Dec. 31 3 094 537 59 631 1 626 1 192 37 7 176
Carrying amounts
At Jan. 1 1 970 531 6 1 950 1 091 893 10 838 17 279
At Dec. 31 2 391 741 37 3 111 3 531 3 466 19 920 33 197
For information regarding amortization and impairment principles, see note 1.
See note 2 for information on business acquisitions.
Other technology and contract based intangible assets include computer software, patents, and contract based rights such as licenses and franchise agreements. All intangible assets other than goodwill and trademarks with indefinite useful lives are amortized.
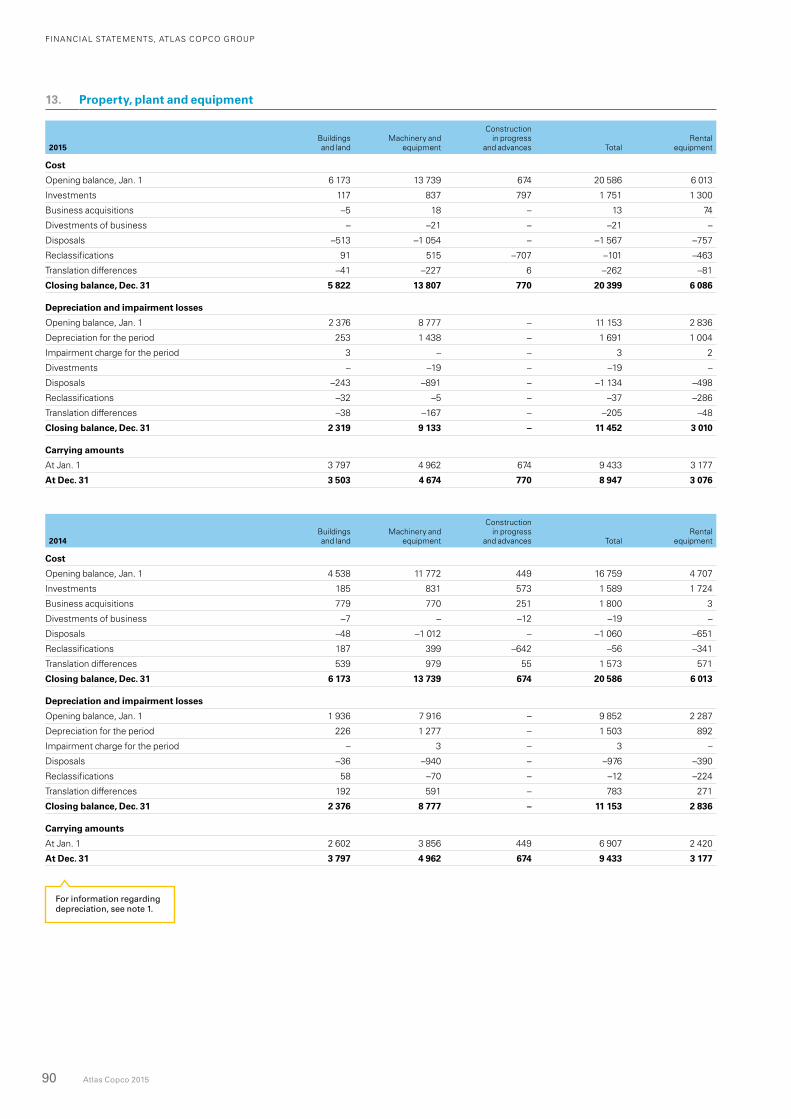
FINANCIAL STATEMENTS, ATLAS COPCO GROUP
90 Atlas Copco 2015
13. Property, plant and equipment
2015Buildings and land
Machinery and equipment
Construction in progress
and advances TotalRental
equipment
Cost
Opening balance, Jan. 1 6 173 13 739 674 20 586 6 013
Investments 117 837 797 1 751 1 300
Business acquisitions –5 18 – 13 74
Divestments of business – –21 – –21 –
Disposals –513 –1 054 – –1 567 –757
Reclassifications 91 515 –707 –101 –463
Translation differences –41 –227 6 –262 –81
Closing balance, Dec. 31 5 822 13 807 770 20 399 6 086
Depreciation and impairment losses
Opening balance, Jan. 1 2 376 8 777 – 11 153 2 836
Depreciation for the period 253 1 438 – 1 691 1 004
Impairment charge for the period 3 – – 3 2
Divestments – –19 – –19 –
Disposals –243 –891 – –1 134 –498
Reclassifications –32 –5 – –37 –286
Translation differences –38 –167 – –205 –48
Closing balance, Dec. 31 2 319 9 133 – 11 452 3 010
Carrying amounts
At Jan. 1 3 797 4 962 674 9 433 3 177
At Dec. 31 3 503 4 674 770 8 947 3 076
2014Buildings and land
Machinery and equipment
Construction in progress
and advances TotalRental
equipment
Cost
Opening balance, Jan. 1 4 538 11 772 449 16 759 4 707
Investments 185 831 573 1 589 1 724
Business acquisitions 779 770 251 1 800 3
Divestments of business –7 – –12 –19 –
Disposals –48 –1 012 – –1 060 –651
Reclassifications 187 399 –642 –56 –341
Translation differences 539 979 55 1 573 571
Closing balance, Dec. 31 6 173 13 739 674 20 586 6 013
Depreciation and impairment losses
Opening balance, Jan. 1 1 936 7 916 – 9 852 2 287
Depreciation for the period 226 1 277 – 1 503 892
Impairment charge for the period – 3 – 3 –
Disposals –36 –940 – –976 –390
Reclassifications 58 –70 – –12 –224
Translation differences 192 591 – 783 271
Closing balance, Dec. 31 2 376 8 777 – 11 153 2 836
Carrying amounts
At Jan. 1 2 602 3 856 449 6 907 2 420
At Dec. 31 3 797 4 962 674 9 433 3 177
For information regarding depreciation, see note 1.
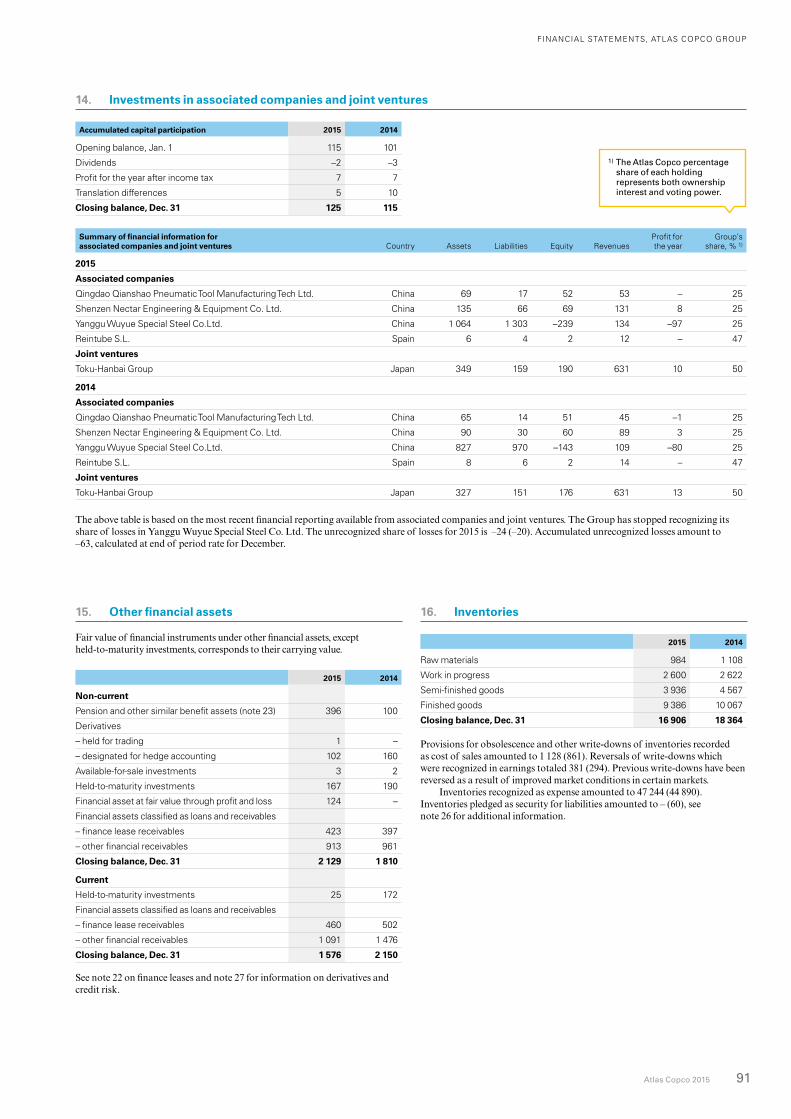
FINANCIAL STATEMENTS, ATLAS COPCO GROUP
Atlas Copco 2015 91
Accumulated capital participation 2015 2014
Opening balance, Jan. 1 115 101
Dividends –2 –3
Profit for the year after income tax 7 7
Translation differences 5 10
Closing balance, Dec. 31 125 115
Summary of financial information for associated companies and joint ventures Country Assets Liabilities Equity Revenues
Profit for the year
Group’s share, % 1)
2015
Associated companies
Qingdao Qianshao Pneumatic Tool Manufacturing Tech Ltd. China 69 17 52 53 – 25
Shenzen Nectar Engineering & Equipment Co. Ltd. China 135 66 69 131 8 25
Yanggu Wuyue Special Steel Co.Ltd. China 1 064 1 303 –239 134 –97 25
Reintube S.L. Spain 6 4 2 12 – 47
Joint ventures
Toku-Hanbai Group Japan 349 159 190 631 10 50
2014
Associated companies
Qingdao Qianshao Pneumatic Tool Manufacturing Tech Ltd. China 65 14 51 45 –1 25
Shenzen Nectar Engineering & Equipment Co. Ltd. China 90 30 60 89 3 25
Yanggu Wuyue Special Steel Co.Ltd. China 827 970 –143 109 –80 25
Reintube S.L. Spain 8 6 2 14 – 47
Joint ventures
Toku-Hanbai Group Japan 327 151 176 631 13 50
The above table is based on the most recent financial reporting available from associated companies and joint ventures. The Group has stopped recognizing its share of losses in Yanggu Wuyue Special Steel Co. Ltd. The unrecognized share of losses for 2015 is –24 (–20). Accumulated unrecognized losses amount to –63, calculated at end of period rate for December.
15. Other financial assets
Fair value of financial instruments under other financial assets, except held-to-maturity investments, corresponds to their carrying value.
2015 2014
Non-current
Pension and other similar benefit assets (note 23) 396 100
Derivatives
– held for trading 1 –
– designated for hedge accounting 102 160
Available-for-sale investments 3 2
Held-to-maturity investments 167 190
Financial asset at fair value through profit and loss 124 –
Financial assets classified as loans and receivables
– finance lease receivables 423 397
– other financial receivables 913 961
Closing balance, Dec. 31 2 129 1 810
Current
Held-to-maturity investments 25 172
Financial assets classified as loans and receivables
– finance lease receivables 460 502
– other financial receivables 1 091 1 476
Closing balance, Dec. 31 1 576 2 150
See note 22 on finance leases and note 27 for information on derivatives and credit risk.
14. Investments in associated companies and joint ventures
16. Inventories
2015 2014
Raw materials 984 1 108
Work in progress 2 600 2 622
Semi-finished goods 3 936 4 567
Finished goods 9 386 10 067
Closing balance, Dec. 31 16 906 18 364
Provisions for obsolescence and other write-downs of inventories recorded as cost of sales amounted to 1 128 (861). Reversals of write-downs which were recognized in earnings totaled 381 (294). Previous write-downs have been reversed as a result of improved market conditions in certain markets.
Inventories recognized as expense amounted to 47 244 (44 890). Inventories pledged as security for liabilities amounted to – (60), see note 26 for additional information.
1) The Atlas Copco percentage share of each holding represents both ownership interest and voting power.
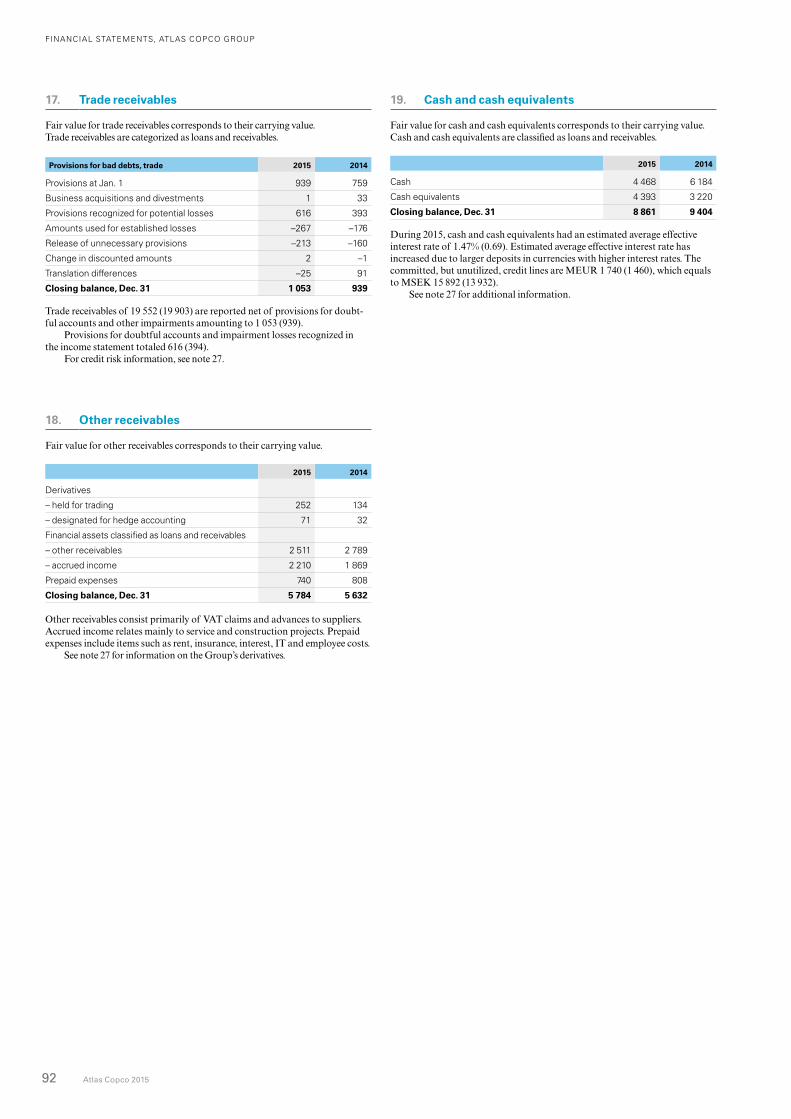
FINANCIAL STATEMENTS, ATLAS COPCO GROUP
92 Atlas Copco 2015
17. Trade receivables
Fair value for trade receivables corresponds to their carrying value. Trade receivables are categorized as loans and receivables.
Provisions for bad debts, trade 2015 2014
Provisions at Jan. 1 939 759
Business acquisitions and divestments 1 33
Provisions recognized for potential losses 616 393
Amounts used for established losses –267 –176
Release of unnecessary provisions –213 –160
Change in discounted amounts 2 –1
Translation differences –25 91
Closing balance, Dec. 31 1 053 939
Trade receivables of 19 552 (19 903) are reported net of provisions for doubt-ful accounts and other impairments amounting to 1 053 (939).
Provisions for doubtful accounts and impairment losses recognized in the income statement totaled 616 (394).
For credit risk information, see note 27.
18. Other receivables
Fair value for other receivables corresponds to their carrying value.
2015 2014
Derivatives
– held for trading 252 134
– designated for hedge accounting 71 32
Financial assets classified as loans and receivables
– other receivables 2 511 2 789
– accrued income 2 210 1 869
Prepaid expenses 740 808
Closing balance, Dec. 31 5 784 5 632
Other receivables consist primarily of VAT claims and advances to suppliers. Accrued income relates mainly to service and construction projects. Prepaid expenses include items such as rent, insurance, interest, IT and employee costs.
See note 27 for information on the Group’s derivatives.
19. Cash and cash equivalents
Fair value for cash and cash equivalents corresponds to their carrying value. Cash and cash equivalents are classified as loans and receivables.
2015 2014
Cash 4 468 6 184
Cash equivalents 4 393 3 220
Closing balance, Dec. 31 8 861 9 404
During 2015, cash and cash equivalents had an estimated average effective interest rate of 1.47% (0.69). Estimated average effective interest rate has increased due to larger deposits in currencies with higher interest rates. The committed, but unutilized, credit lines are MEUR 1 740 (1 460), which equals to MSEK 15 892 (13 932).
See note 27 for additional information.
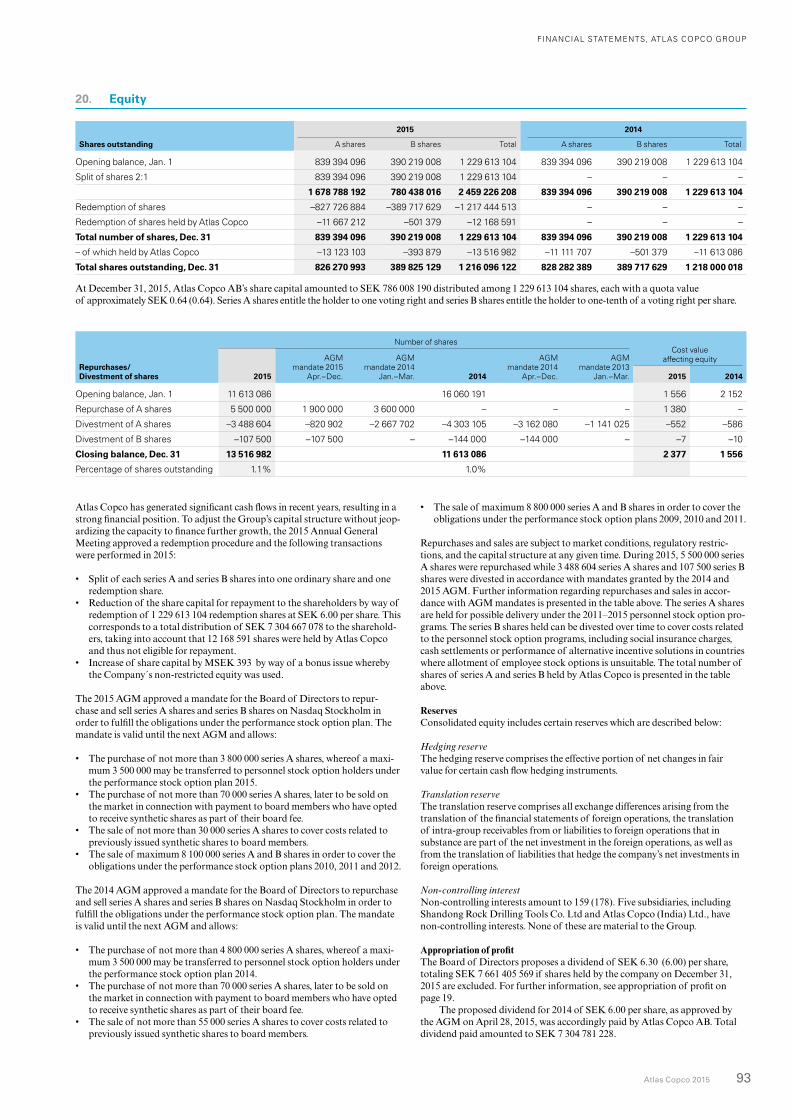
FINANCIAL STATEMENTS, ATLAS COPCO GROUP
Atlas Copco 2015 93
20. Equity
2015 2014
Shares outstanding A shares B shares Total A shares B shares Total
Opening balance, Jan. 1 839 394 096 390 219 008 1 229 613 104 839 394 096 390 219 008 1 229 613 104
Split of shares 2:1 839 394 096 390 219 008 1 229 613 104 – – –
1 678 788 192 780 438 016 2 459 226 208 839 394 096 390 219 008 1 229 613 104
Redemption of shares –827 726 884 –389 717 629 –1 217 444 513 – – –
Redemption of shares held by Atlas Copco –11 667 212 –501 379 –12 168 591 – – –
Total number of shares, Dec. 31 839 394 096 390 219 008 1 229 613 104 839 394 096 390 219 008 1 229 613 104
– of which held by Atlas Copco –13 123 103 –393 879 –13 516 982 –11 111 707 –501 379 –11 613 086
Total shares outstanding, Dec. 31 826 270 993 389 825 129 1 216 096 122 828 282 389 389 717 629 1 218 000 018
At December 31, 2015, Atlas Copco AB’s share capital amounted to SEK 786 008 190 distributed among 1 229 613 104 shares, each with a quota value of approximately SEK 0.64 (0.64). Series A shares entitle the holder to one voting right and series B shares entitle the holder to one-tenth of a voting right per share.
Atlas Copco has generated significant cash flows in recent years, resulting in a strong financial position. To adjust the Group’s capital structure without jeop-ardizing the capacity to finance further growth, the 2015 Annual General Meeting approved a redemption procedure and the following transactions were performed in 2015:
• Split of each series A and series B shares into one ordinary share and one redemption share.
• Reduction of the share capital for repayment to the shareholders by way of redemption of 1 229 613 104 redemption shares at SEK 6.00 per share. This corresponds to a total distribution of SEK 7 304 667 078 to the sharehold-ers, taking into account that 12 168 591 shares were held by Atlas Copco and thus not eligible for repayment.
• Increase of share capital by MSEK 393 by way of a bonus issue whereby the Company´s non-restricted equity was used.
The 2015 AGM approved a mandate for the Board of Directors to repur- chase and sell series A shares and series B shares on Nasdaq Stockholm in order to fulfill the obligations under the performance stock option plan. The mandate is valid until the next AGM and allows:
• The purchase of not more than 3 800 000 series A shares, whereof a maxi-mum 3 500 000 may be transferred to personnel stock option holders under the performance stock option plan 2015.
• The purchase of not more than 70 000 series A shares, later to be sold on the market in connection with payment to board members who have opted to receive synthetic shares as part of their board fee.
• The sale of not more than 30 000 series A shares to cover costs related to previously issued synthetic shares to board members.
• The sale of maximum 8 100 000 series A and B shares in order to cover the obligations under the performance stock option plans 2010, 2011 and 2012.
The 2014 AGM approved a mandate for the Board of Directors to repurchase and sell series A shares and series B shares on Nasdaq Stockholm in order to fulfill the obligations under the performance stock option plan. The mandate is valid until the next AGM and allows:
• The purchase of not more than 4 800 000 series A shares, whereof a maxi-mum 3 500 000 may be transferred to personnel stock option holders under the performance stock option plan 2014.
• The purchase of not more than 70 000 series A shares, later to be sold on the market in connection with payment to board members who have opted to receive synthetic shares as part of their board fee.
• The sale of not more than 55 000 series A shares to cover costs related to previously issued synthetic shares to board members.
• The sale of maximum 8 800 000 series A and B shares in order to cover the obligations under the performance stock option plans 2009, 2010 and 2011.
Repurchases and sales are subject to market conditions, regulatory restric-tions, and the capital structure at any given time. During 2015, 5 500 000 series A shares were repurchased while 3 488 604 series A shares and 107 500 series B shares were divested in accordance with mandates granted by the 2014 and 2015 AGM. Further information regarding repurchases and sales in accor-dance with AGM mandates is presented in the table above. The series A shares are held for possible delivery under the 2011–2015 personnel stock option pro-grams. The series B shares held can be divested over time to cover costs related to the personnel stock option programs, including social insurance charges, cash settlements or performance of alternative incentive solutions in countries where allotment of employee stock options is unsuitable. The total number of shares of series A and series B held by Atlas Copco is presented in the table above.
ReservesConsolidated equity includes certain reserves which are described below:
Hedging reserveThe hedging reserve comprises the effective portion of net changes in fair value for certain cash flow hedging instruments.
Translation reserveThe translation reserve comprises all exchange differences arising from the translation of the financial statements of foreign operations, the translation of intra-group receivables from or liabilities to foreign operations that in substance are part of the net investment in the foreign operations, as well as from the translation of liabilities that hedge the company’s net investments in foreign operations.
Non-controlling interestNon-controlling interests amount to 159 (178). Five subsidiaries, including Shandong Rock Drilling Tools Co. Ltd and Atlas Copco (India) Ltd., have non-controlling interests. None of these are material to the Group.
Appropriation of profitThe Board of Directors proposes a dividend of SEK 6.30 (6.00) per share, totaling SEK 7 661 405 569 if shares held by the company on December 31, 2015 are excluded. For further information, see appropriation of profit on page 19.
The proposed dividend for 2014 of SEK 6.00 per share, as approved by the AGM on April 28, 2015, was accordingly paid by Atlas Copco AB. Total dividend paid amounted to SEK 7 304 781 228.
Repurchases/ Divestment of shares
Number of sharesCost value
affecting equity
2015
AGM mandate 2015
Apr.–Dec.
AGM mandate 2014
Jan.–Mar. 2014
AGM mandate 2014
Apr.–Dec.
AGM mandate 2013
Jan.–Mar. 2015 2014
Opening balance, Jan. 1 11 613 086 16 060 191 1 556 2 152
Repurchase of A shares 5 500 000 1 900 000 3 600 000 – – – 1 380 –
Divestment of A shares –3 488 604 –820 902 –2 667 702 –4 303 105 –3 162 080 –1 141 025 –552 –586
Divestment of B shares –107 500 –107 500 – –144 000 –144 000 – –7 –10
Closing balance, Dec. 31 13 516 982 11 613 086 2 377 1 556
Percentage of shares outstanding 1.1% 1.0%
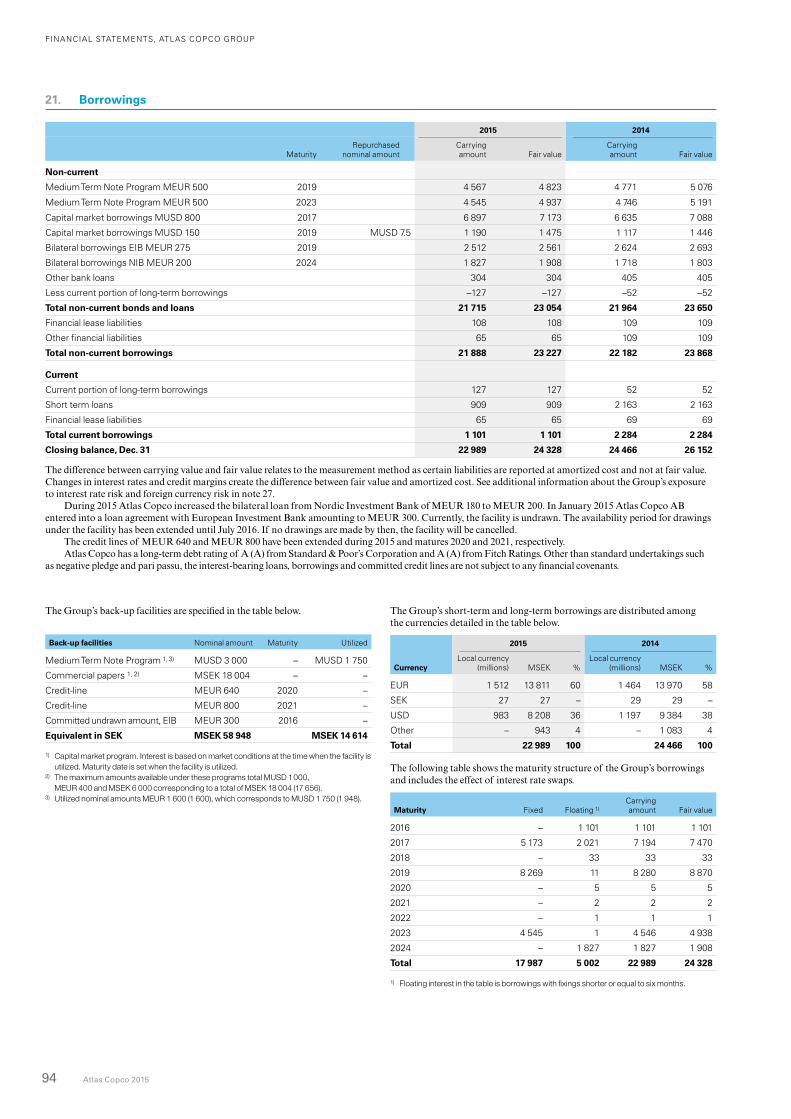
FINANCIAL STATEMENTS, ATLAS COPCO GROUP
94 Atlas Copco 2015
21. Borrowings
2015 2014
MaturityRepurchased
nominal amountCarrying amount Fair value
Carrying amount Fair value
Non-current
Medium Term Note Program MEUR 500 2019 4 567 4 823 4 771 5 076
Medium Term Note Program MEUR 500 2023 4 545 4 937 4 746 5 191
Capital market borrowings MUSD 800 2017 6 897 7 173 6 635 7 088
Capital market borrowings MUSD 150 2019 MUSD 7.5 1 190 1 475 1 117 1 446
Bilateral borrowings EIB MEUR 275 2019 2 512 2 561 2 624 2 693
Bilateral borrowings NIB MEUR 200 2024 1 827 1 908 1 718 1 803
Other bank loans 304 304 405 405
Less current portion of long-term borrowings –127 –127 –52 –52
Total non-current bonds and loans 21 715 23 054 21 964 23 650
Financial lease liabilities 108 108 109 109
Other financial liabilities 65 65 109 109
Total non-current borrowings 21 888 23 227 22 182 23 868
Current
Current portion of long-term borrowings 127 127 52 52
Short term loans 909 909 2 163 2 163
Financial lease liabilities 65 65 69 69
Total current borrowings 1 101 1 101 2 284 2 284
Closing balance, Dec. 31 22 989 24 328 24 466 26 152
The difference between carrying value and fair value relates to the measurement method as certain liabilities are reported at amortized cost and not at fair value. Changes in interest rates and credit margins create the difference between fair value and amortized cost. See additional information about the Group’s exposure to interest rate risk and foreign currency risk in note 27.
During 2015 Atlas Copco increased the bilateral loan from Nordic Investment Bank of MEUR 180 to MEUR 200. In January 2015 Atlas Copco AB entered into a loan agreement with European Investment Bank amounting to MEUR 300. Currently, the facility is undrawn. The availability period for drawings under the facility has been extended until July 2016. If no drawings are made by then, the facility will be cancelled.
The credit lines of MEUR 640 and MEUR 800 have been extended during 2015 and matures 2020 and 2021, respectively.Atlas Copco has a long-term debt rating of A (A) from Standard & Poor’s Corporation and A (A) from Fitch Ratings. Other than standard undertakings such
as negative pledge and pari passu, the interest-bearing loans, borrowings and committed credit lines are not subject to any financial covenants.
The Group’s back-up facilities are specified in the table below.
Back-up facilities Nominal amount Maturity Utilized
Medium Term Note Program 1, 3) MUSD 3 000 – MUSD 1 750
Commercial papers 1, 2) MSEK 18 004 – –
Credit-line MEUR 640 2020 –
Credit-line MEUR 800 2021 –
Committed undrawn amount, EIB MEUR 300 2016 –
Equivalent in SEK MSEK 58 948 MSEK 14 614
1) Capital market program. Interest is based on market conditions at the time when the facility is utilized. Maturity date is set when the facility is utilized.
2) The maximum amounts available under these programs total MUSD 1 000, MEUR 400 and MSEK 6 000 corresponding to a total of MSEK 18 004 (17 656).
3) Utilized nominal amounts MEUR 1 600 (1 600), which corresponds to MUSD 1 750 (1 948).
The Group’s short-term and long-term borrowings are distributed among the currencies detailed in the table below.
2015 2014
CurrencyLocal currency
(millions) MSEK %Local currency
(millions) MSEK %
EUR 1 512 13 811 60 1 464 13 970 58
SEK 27 27 – 29 29 –
USD 983 8 208 36 1 197 9 384 38
Other – 943 4 – 1 083 4
Total 22 989 100 24 466 100
The following table shows the maturity structure of the Group’s borrowings and includes the effect of interest rate swaps.
Maturity Fixed Floating 1)Carrying amount Fair value
2016 – 1 101 1 101 1 101
2017 5 173 2 021 7 194 7 470
2018 – 33 33 33
2019 8 269 11 8 280 8 870
2020 – 5 5 5
2021 – 2 2 2
2022 – 1 1 1
2023 4 545 1 4 546 4 938
2024 – 1 827 1 827 1 908
Total 17 987 5 002 22 989 24 328
1) Floating interest in the table is borrowings with fixings shorter or equal to six months.
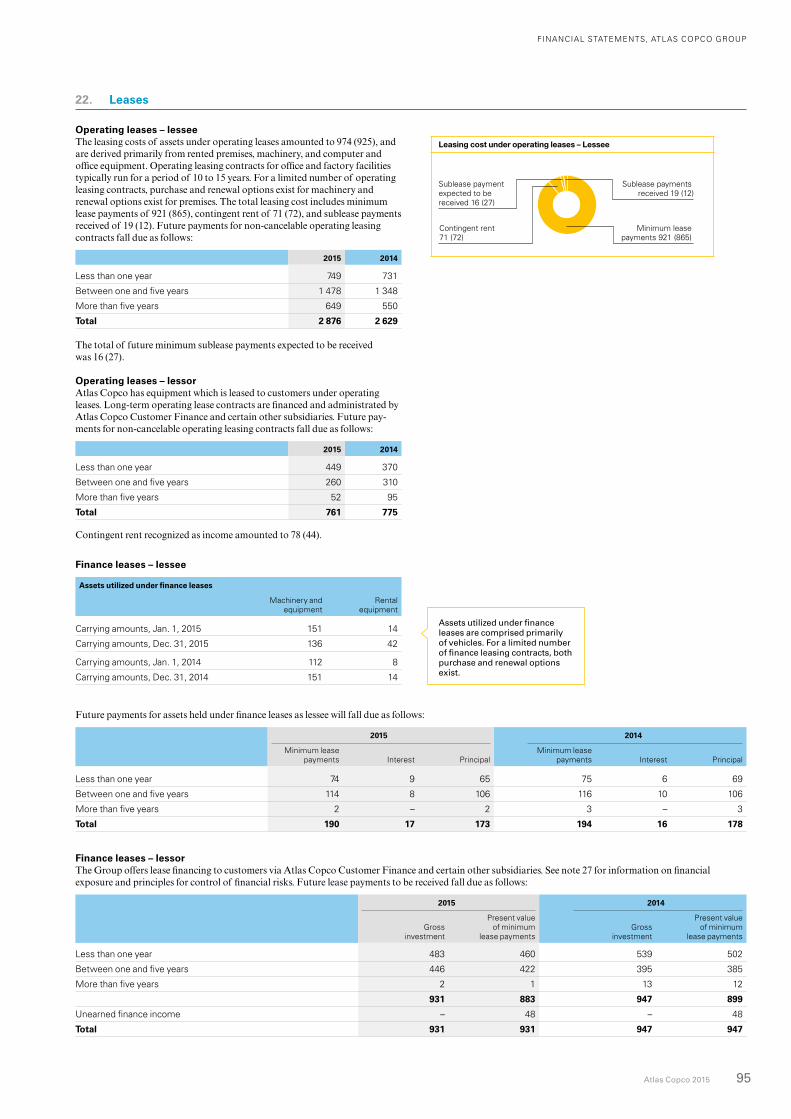
FINANCIAL STATEMENTS, ATLAS COPCO GROUP
Atlas Copco 2015 95
Operating leases – lesseeThe leasing costs of assets under operating leases amounted to 974 (925), and are derived primarily from rented premises, machinery, and computer and office equipment. Operating leasing contracts for office and factory facilities typically run for a period of 10 to 15 years. For a limited number of operating leasing contracts, purchase and renewal options exist for machinery and renewal options exist for premises. The total leasing cost includes minimum lease payments of 921 (865), contingent rent of 71 (72), and sublease payments received of 19 (12). Future payments for non-cancelable operating leasing contracts fall due as follows:
2015 2014
Less than one year 749 731
Between one and five years 1 478 1 348
More than five years 649 550
Total 2 876 2 629
The total of future minimum sublease payments expected to be received was 16 (27).
Operating leases – lessorAtlas Copco has equipment which is leased to customers under operating leases. Long-term operating lease contracts are financed and administrated by Atlas Copco Customer Finance and certain other subsidiaries. Future pay-ments for non-cancelable operating leasing contracts fall due as follows:
2015 2014
Less than one year 449 370
Between one and five years 260 310
More than five years 52 95
Total 761 775
Contingent rent recognized as income amounted to 78 (44).
Future payments for assets held under finance leases as lessee will fall due as follows:
2015 2014
Minimum lease payments Interest Principal
Minimum lease payments Interest Principal
Less than one year 74 9 65 75 6 69
Between one and five years 114 8 106 116 10 106
More than five years 2 – 2 3 – 3
Total 190 17 173 194 16 178
Finance leases – lessorThe Group offers lease financing to customers via Atlas Copco Customer Finance and certain other subsidiaries. See note 27 for information on financial exposure and principles for control of financial risks. Future lease payments to be received fall due as follows:
2015 2014
Gross investment
Present value of minimum
lease paymentsGross
investment
Present value of minimum
lease payments
Less than one year 483 460 539 502
Between one and five years 446 422 395 385
More than five years 2 1 13 12
931 883 947 899
Unearned finance income – 48 – 48
Total 931 931 947 947
Finance leases – lessee
Assets utilized under finance leases
Machinery and equipment
Rental equipment
Carrying amounts, Jan. 1, 2015 151 14
Carrying amounts, Dec. 31, 2015 136 42
Carrying amounts, Jan. 1, 2014 112 8
Carrying amounts, Dec. 31, 2014 151 14
22. Leases
Assets utilized under finance leases are comprised primarily of vehicles. For a limited number of finance leasing contracts, both purchase and renewal options exist.
Leasing cost under operating leases – Lessee
Minimum lease payments 921 (865)
Contingent rent 71 (72)
Sublease payments received 19 (12)
Sublease payment expected to be received 16 (27)
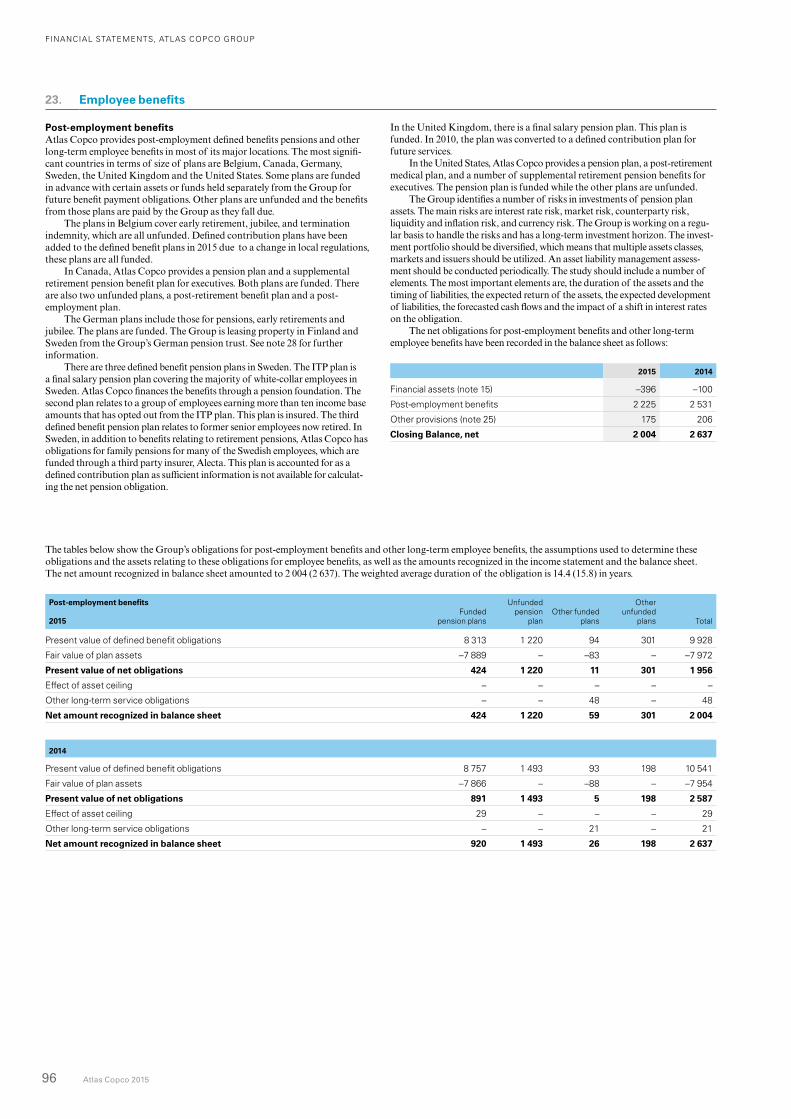
FINANCIAL STATEMENTS, ATLAS COPCO GROUP
96 Atlas Copco 2015
Post-employment benefitsAtlas Copco provides post-employment defined benefits pensions and other long-term employee benefits in most of its major locations. The most signifi-cant countries in terms of size of plans are Belgium, Canada, Germany, Sweden, the United Kingdom and the United States. Some plans are funded in advance with certain assets or funds held separately from the Group for future benefit payment obligations. Other plans are unfunded and the benefits from those plans are paid by the Group as they fall due.
The plans in Belgium cover early retirement, jubilee, and termination indemnity, which are all unfunded. Defined contribution plans have been added to the defined benefit plans in 2015 due to a change in local regulations, these plans are all funded.
In Canada, Atlas Copco provides a pension plan and a supplemental retirement pension benefit plan for executives. Both plans are funded. There are also two unfunded plans, a post-retirement benefit plan and a post-employment plan.
The German plans include those for pensions, early retirements and jubilee. The plans are funded. The Group is leasing property in Finland and Sweden from the Group’s German pension trust. See note 28 for further information.
There are three defined benefit pension plans in Sweden. The ITP plan is a final salary pension plan covering the majority of white-collar employees in Sweden. Atlas Copco finances the benefits through a pension foundation. The second plan relates to a group of employees earning more than ten income base amounts that has opted out from the ITP plan. This plan is insured. The third defined benefit pension plan relates to former senior employees now retired. In Sweden, in addition to benefits relating to retirement pensions, Atlas Copco has obligations for family pensions for many of the Swedish employees, which are funded through a third party insurer, Alecta. This plan is accounted for as a defined contribution plan as sufficient information is not available for calculat-ing the net pension obligation.
23. Employee benefits
In the United Kingdom, there is a final salary pension plan. This plan is funded. In 2010, the plan was converted to a defined contribution plan for future services.
In the United States, Atlas Copco provides a pension plan, a post-retirement medical plan, and a number of supplemental retirement pension benefits for executives. The pension plan is funded while the other plans are unfunded.
The Group identifies a number of risks in investments of pension plan assets. The main risks are interest rate risk, market risk, counterparty risk, liquidity and inflation risk, and currency risk. The Group is working on a regu-lar basis to handle the risks and has a long-term investment horizon. The invest-ment portfolio should be diversified, which means that multiple assets classes, markets and issuers should be utilized. An asset liability management assess-ment should be conducted periodically. The study should include a number of elements. The most important elements are, the duration of the assets and the timing of liabilities, the expected return of the assets, the expected development of liabilities, the forecasted cash flows and the impact of a shift in interest rates on the obligation.
The net obligations for post-employment benefits and other long-term employee benefits have been recorded in the balance sheet as follows:
2015 2014
Financial assets (note 15) –396 –100
Post-employment benefits 2 225 2 531
Other provisions (note 25) 175 206
Closing Balance, net 2 004 2 637
The tables below show the Group’s obligations for post-employment benefits and other long-term employee benefits, the assumptions used to determine these obligations and the assets relating to these obligations for employee benefits, as well as the amounts recognized in the income statement and the balance sheet. The net amount recognized in balance sheet amounted to 2 004 (2 637). The weighted average duration of the obligation is 14.4 (15.8) in years.
Post-employment benefits 2015
Funded pension plans
Unfunded pension
planOther funded
plans
Other unfunded
plans Total
Present value of defined benefit obligations 8 313 1 220 94 301 9 928
Fair value of plan assets –7 889 – –83 – –7 972
Present value of net obligations 424 1 220 11 301 1 956
Effect of asset ceiling – – – – –
Other long-term service obligations – – 48 – 48
Net amount recognized in balance sheet 424 1 220 59 301 2 004
2014
Present value of defined benefit obligations 8 757 1 493 93 198 10 541
Fair value of plan assets –7 866 – –88 – –7 954
Present value of net obligations 891 1 493 5 198 2 587
Effect of asset ceiling 29 – – – 29
Other long-term service obligations – – 21 – 21
Net amount recognized in balance sheet 920 1 493 26 198 2 637
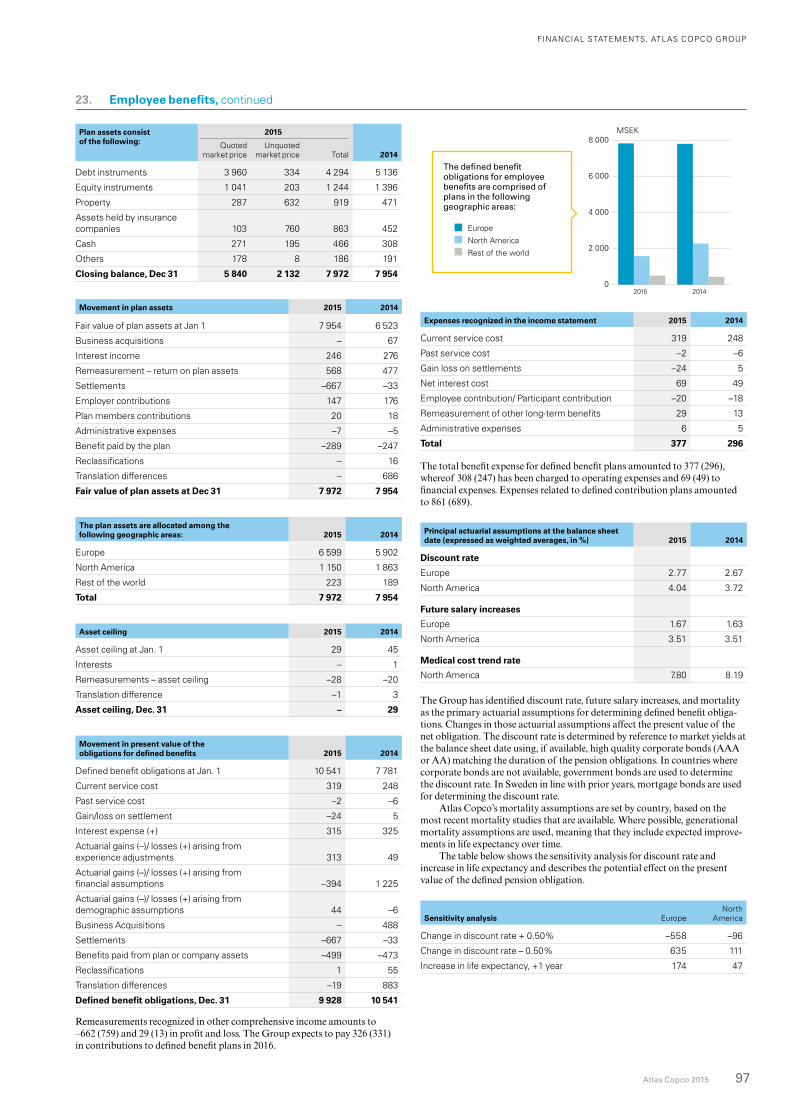
FINANCIAL STATEMENTS, ATLAS COPCO GROUP
Atlas Copco 2015 97
Plan assets consist of the following:
2015
2014Quoted
market priceUnquoted
market price Total
Debt instruments 3 960 334 4 294 5 136
Equity instruments 1 041 203 1 244 1 396
Property 287 632 919 471
Assets held by insurance companies 103 760
863
452
Cash 271 195 466 308
Others 178 8 186 191
Closing balance, Dec 31 5 840 2 132 7 972 7 954
Movement in plan assets 2015 2014
Fair value of plan assets at Jan 1 7 954 6 523
Business acquisitions – 67
Interest income 246 276
Remeasurement – return on plan assets 568 477
Settlements –667 –33
Employer contributions 147 176
Plan members contributions 20 18
Administrative expenses –7 –5
Benefit paid by the plan –289 –247
Reclassifications – 16
Translation differences – 686
Fair value of plan assets at Dec 31 7 972 7 954
The plan assets are allocated among the following geographic areas: 2015 2014
Europe 6 599 5 902
North America 1 150 1 863
Rest of the world 223 189
Total 7 972 7 954
Asset ceiling 2015 2014
Asset ceiling at Jan. 1 29 45
Interests – 1
Remeasurements – asset ceiling –28 –20
Translation difference –1 3
Asset ceiling, Dec. 31 – 29
Movement in present value of the obligations for defined benefits 2015 2014
Defined benefit obligations at Jan. 1 10 541 7 781
Current service cost 319 248
Past service cost –2 –6
Gain/loss on settlement –24 5
Interest expense (+) 315 325
Actuarial gains (–)/ losses (+) arising from experience adjustments 313 49
Actuarial gains (–)/ losses (+) arising from financial assumptions –394 1 225
Actuarial gains (–)/ losses (+) arising from demographic assumptions 44 –6
Business Acquisitions – 488
Settlements –667 –33
Benefits paid from plan or company assets –499 –473
Reclassifications 1 55
Translation differences –19 883
Defined benefit obligations, Dec. 31 9 928 10 541
Remeasurements recognized in other comprehensive income amounts to –662 (759) and 29 (13) in profit and loss. The Group expects to pay 326 (331) in contributions to defined benefit plans in 2016.
Expenses recognized in the income statement 2015 2014
Current service cost 319 248
Past service cost –2 –6
Gain loss on settlements –24 5
Net interest cost 69 49
Employee contribution/ Participant contribution –20 –18
Remeasurement of other long-term benefits 29 13
Administrative expenses 6 5
Total 377 296
The total benefit expense for defined benefit plans amounted to 377 (296), whereof 308 (247) has been charged to operating expenses and 69 (49) to financial expenses. Expenses related to defined contribution plans amounted to 861 (689).
Principal actuarial assumptions at the balance sheet date (expressed as weighted averages, in %) 2015 2014
Discount rate
Europe 2.77 2.67
North America 4.04 3.72
Future salary increases
Europe 1.67 1.63
North America 3.51 3.51
Medical cost trend rate
North America 7.80 8.19
The Group has identified discount rate, future salary increases, and mortality as the primary actuarial assumptions for determining defined benefit obliga-tions. Changes in those actuarial assumptions affect the present value of the net obligation. The discount rate is determined by reference to market yields at the balance sheet date using, if available, high quality corporate bonds (AAA or AA) matching the duration of the pension obligations. In countries where corporate bonds are not available, government bonds are used to determine the discount rate. In Sweden in line with prior years, mortgage bonds are used for determining the discount rate.
Atlas Copco’s mortality assumptions are set by country, based on the most recent mortality studies that are available. Where possible, generational mortality assumptions are used, meaning that they include expected improve-ments in life expectancy over time.
The table below shows the sensitivity analysis for discount rate and increase in life expectancy and describes the potential effect on the present value of the defined pension obligation.
Sensitivity analysis EuropeNorth
America
Change in discount rate + 0.50% –558 –96
Change in discount rate – 0.50% 635 111
Increase in life expectancy, +1 year 174 47
0
2 000
4 000
6 000
8 000
20142015
MSEK
Europe
North America
Rest of the world
The defined benefit obligations for employee benefits are comprised of plans in the following geographic areas:
23. Employee benefits, continued
0
2 000
4 000
6 000
8 000
20142015
MSEK
Europe
North America
Rest of the world
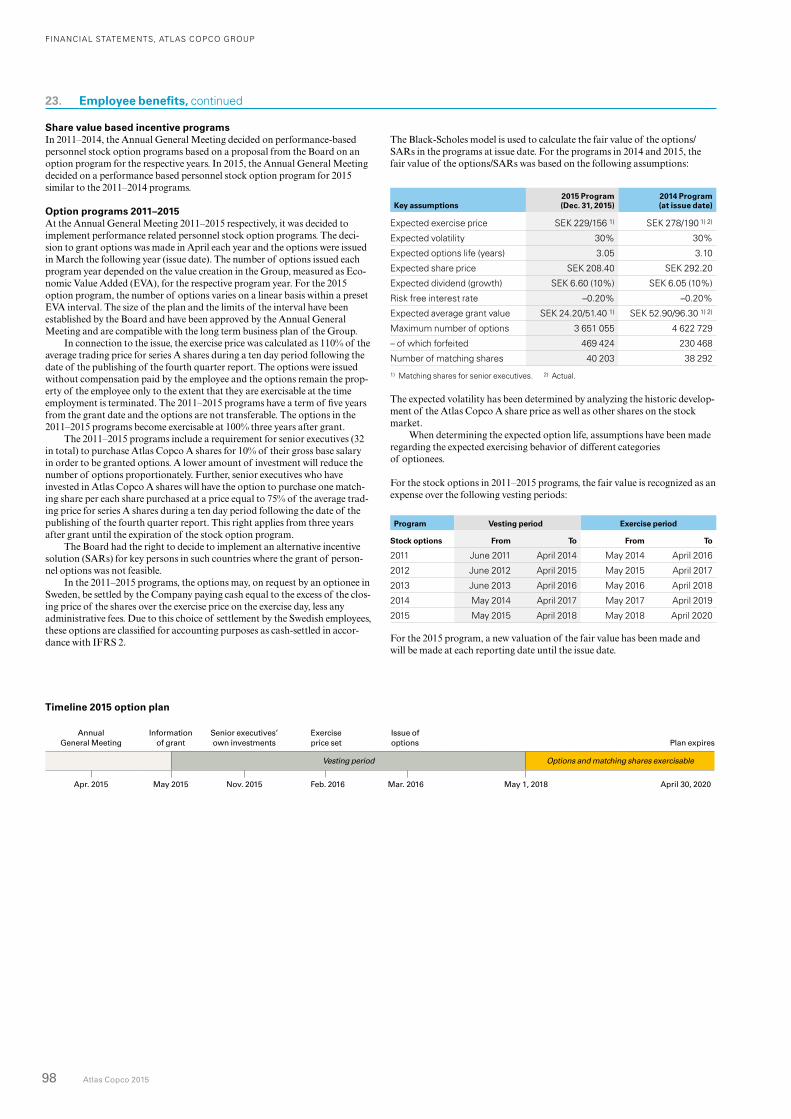
FINANCIAL STATEMENTS, ATLAS COPCO GROUP
98 Atlas Copco 2015
Share value based incentive programsIn 2011–2014, the Annual General Meeting decided on performance-based personnel stock option programs based on a proposal from the Board on an option program for the respective years. In 2015, the Annual General Meeting decided on a performance based personnel stock option program for 2015 similar to the 2011–2014 programs.
Option programs 2011–2015At the Annual General Meeting 2011–2015 respectively, it was decided to implement performance related personnel stock option programs. The deci-sion to grant options was made in April each year and the options were issued in March the following year (issue date). The number of options issued each program year depended on the value creation in the Group, measured as Eco-nomic Value Added (EVA), for the respective program year. For the 2015 option program, the number of options varies on a linear basis within a preset EVA interval. The size of the plan and the limits of the interval have been established by the Board and have been approved by the Annual General Meeting and are compatible with the long term business plan of the Group.
In connection to the issue, the exercise price was calculated as 110% of the average trading price for series A shares during a ten day period following the date of the publishing of the fourth quarter report. The options were issued without compensation paid by the employee and the options remain the prop-erty of the employee only to the extent that they are exercisable at the time employment is terminated. The 2011–2015 programs have a term of five years from the grant date and the options are not transferable. The options in the 2011–2015 programs become exercisable at 100% three years after grant.
The 2011–2015 programs include a requirement for senior executives (32 in total) to purchase Atlas Copco A shares for 10% of their gross base salary in order to be granted options. A lower amount of investment will reduce the number of options proportionately. Further, senior executives who have invested in Atlas Copco A shares will have the option to purchase one match-ing share per each share purchased at a price equal to 75% of the average trad-ing price for series A shares during a ten day period following the date of the publishing of the fourth quarter report. This right applies from three years after grant until the expiration of the stock option program.
The Board had the right to decide to implement an alternative incentive solution (SARs) for key persons in such countries where the grant of person-nel options was not feasible.
In the 2011–2015 programs, the options may, on request by an optionee in Sweden, be settled by the Company paying cash equal to the excess of the clos-ing price of the shares over the exercise price on the exercise day, less any administrative fees. Due to this choice of settlement by the Swedish employees, these options are classified for accounting purposes as cash-settled in accor-dance with IFRS 2.
The Black-Scholes model is used to calculate the fair value of the options/SARs in the programs at issue date. For the programs in 2014 and 2015, the fair value of the options/SARs was based on the following assumptions:
Key assumptions2015 Program(Dec. 31, 2015)
2014 Program(at issue date)
Expected exercise price SEK 229/156 1) SEK 278/190 1) 2)
Expected volatility 30% 30%
Expected options life (years) 3.05 3.10
Expected share price SEK 208.40 SEK 292.20
Expected dividend (growth) SEK 6.60 (10%) SEK 6.05 (10%)
Risk free interest rate –0.20% –0.20%
Expected average grant value SEK 24.20/51.40 1) SEK 52.90/96.30 1) 2)
Maximum number of options 3 651 055 4 622 729
– of which forfeited 469 424 230 468
Number of matching shares 40 203 38 292
1) Matching shares for senior executives. 2) Actual.
The expected volatility has been determined by analyzing the historic develop-ment of the Atlas Copco A share price as well as other shares on the stock market.
When determining the expected option life, assumptions have been made regarding the expected exercising behavior of different categories of optionees.
For the stock options in 2011–2015 programs, the fair value is recognized as an expense over the following vesting periods:
Program Vesting period Exercise period
Stock options From To From To
2011 June 2011 April 2014 May 2014 April 2016
2012 June 2012 April 2015 May 2015 April 2017
2013 June 2013 April 2016 May 2016 April 2018
2014 May 2014 April 2017 May 2017 April 2019
2015 May 2015 April 2018 May 2018 April 2020
For the 2015 program, a new valuation of the fair value has been made and will be made at each reporting date until the issue date.
Timeline 2015 option plan
Annual General Meeting
Information of grant
Senior executives’own investments
Exercise price set
Issue of options Plan expires
Vesting period Options and matching shares exercisable
Apr. 2015 May 2015 Nov. 2015 Feb. 2016 Mar. 2016 May 1, 2018 April 30, 2020
23. Employee benefits, continued
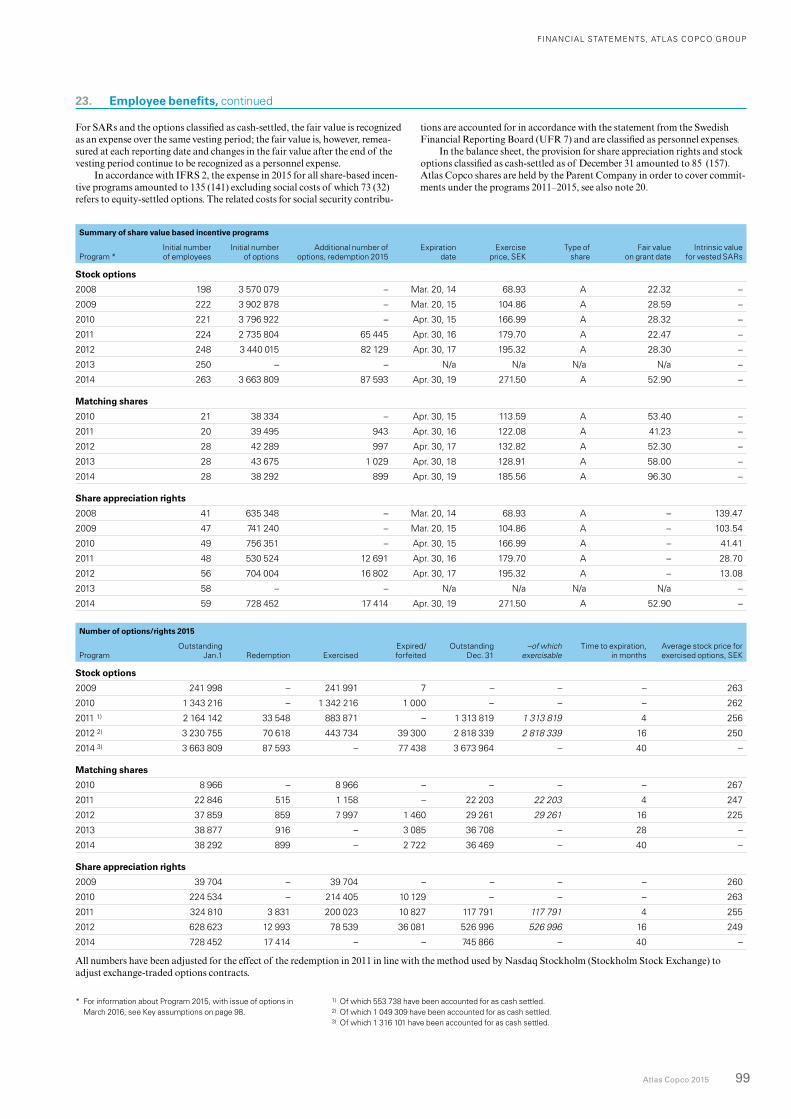
FINANCIAL STATEMENTS, ATLAS COPCO GROUP
Atlas Copco 2015 99
For SARs and the options classified as cash-settled, the fair value is recognized as an expense over the same vesting period; the fair value is, however, remea-sured at each reporting date and changes in the fair value after the end of the vesting period continue to be recognized as a personnel expense.
In accordance with IFRS 2, the expense in 2015 for all share-based incen-tive programs amounted to 135 (141) excluding social costs of which 73 (32) refers to equity-settled options. The related costs for social security contribu-
tions are accounted for in accordance with the statement from the Swedish Financial Reporting Board (UFR 7) and are classified as personnel expenses.
In the balance sheet, the provision for share appreciation rights and stock options classified as cash-settled as of December 31 amounted to 85 (157). Atlas Copco shares are held by the Parent Company in order to cover commit-ments under the programs 2011–2015, see also note 20.
Summary of share value based incentive programs
Program *Initial number of employees
Initial number of options
Additional number of options, redemption 2015
Expiration date
Exercise price, SEK
Type of share
Fair value on grant date
Intrinsic value for vested SARs
Stock options
2008 198 3 570 079 – Mar. 20, 14 68.93 A 22.32 –
2009 222 3 902 878 – Mar. 20, 15 104.86 A 28.59 –
2010 221 3 796 922 – Apr. 30, 15 166.99 A 28.32 –
2011 224 2 735 804 65 445 Apr. 30, 16 179.70 A 22.47 –
2012 248 3 440 015 82 129 Apr. 30, 17 195.32 A 28.30 –
2013 250 – – N/a N/a N/a N/a –
2014 263 3 663 809 87 593 Apr. 30, 19 271.50 A 52.90 –
Matching shares
2010 21 38 334 – Apr. 30, 15 113.59 A 53.40 –
2011 20 39 495 943 Apr. 30, 16 122.08 A 41.23 –
2012 28 42 289 997 Apr. 30, 17 132.82 A 52.30 –
2013 28 43 675 1 029 Apr. 30, 18 128.91 A 58.00 –
2014 28 38 292 899 Apr. 30, 19 185.56 A 96.30 –
Share appreciation rights
2008 41 635 348 – Mar. 20, 14 68.93 A – 139.47
2009 47 741 240 – Mar. 20, 15 104.86 A – 103.54
2010 49 756 351 – Apr. 30, 15 166.99 A – 41.41
2011 48 530 524 12 691 Apr. 30, 16 179.70 A – 28.70
2012 56 704 004 16 802 Apr. 30, 17 195.32 A – 13.08
2013 58 – – N/a N/a N/a N/a –
2014 59 728 452 17 414 Apr. 30, 19 271.50 A 52.90 –
Number of options/rights 2015
ProgramOutstanding
Jan.1 Redemption ExercisedExpired/ forfeited
Outstanding Dec. 31
–of which exercisable
Time to expiration, in months
Average stock price for exercised options, SEK
Stock options
2009 241 998 – 241 991 7 – – – 263
2010 1 343 216 – 1 342 216 1 000 – – – 262
2011 1) 2 164 142 33 548 883 871 – 1 313 819 1 313 819 4 256
2012 2) 3 230 755 70 618 443 734 39 300 2 818 339 2 818 339 16 250
2014 3) 3 663 809 87 593 – 77 438 3 673 964 – 40 –
Matching shares
2010 8 966 – 8 966 – – – – 267
2011 22 846 515 1 158 – 22 203 22 203 4 247
2012 37 859 859 7 997 1 460 29 261 29 261 16 225
2013 38 877 916 – 3 085 36 708 – 28 –
2014 38 292 899 – 2 722 36 469 – 40 –
Share appreciation rights
2009 39 704 – 39 704 – – – – 260
2010 224 534 – 214 405 10 129 – – – 263
2011 324 810 3 831 200 023 10 827 117 791 117 791 4 255
2012 628 623 12 993 78 539 36 081 526 996 526 996 16 249
2014 728 452 17 414 – – 745 866 – 40 –
All numbers have been adjusted for the effect of the redemption in 2011 in line with the method used by Nasdaq Stockholm (Stockholm Stock Exchange) to adjust exchange-traded options contracts.
23. Employee benefits, continued
1) Of which 553 738 have been accounted for as cash settled. 2) Of which 1 049 309 have been accounted for as cash settled. 3) Of which 1 316 101 have been accounted for as cash settled.
* For information about Program 2015, with issue of options in March 2016, see Key assumptions on page 98.
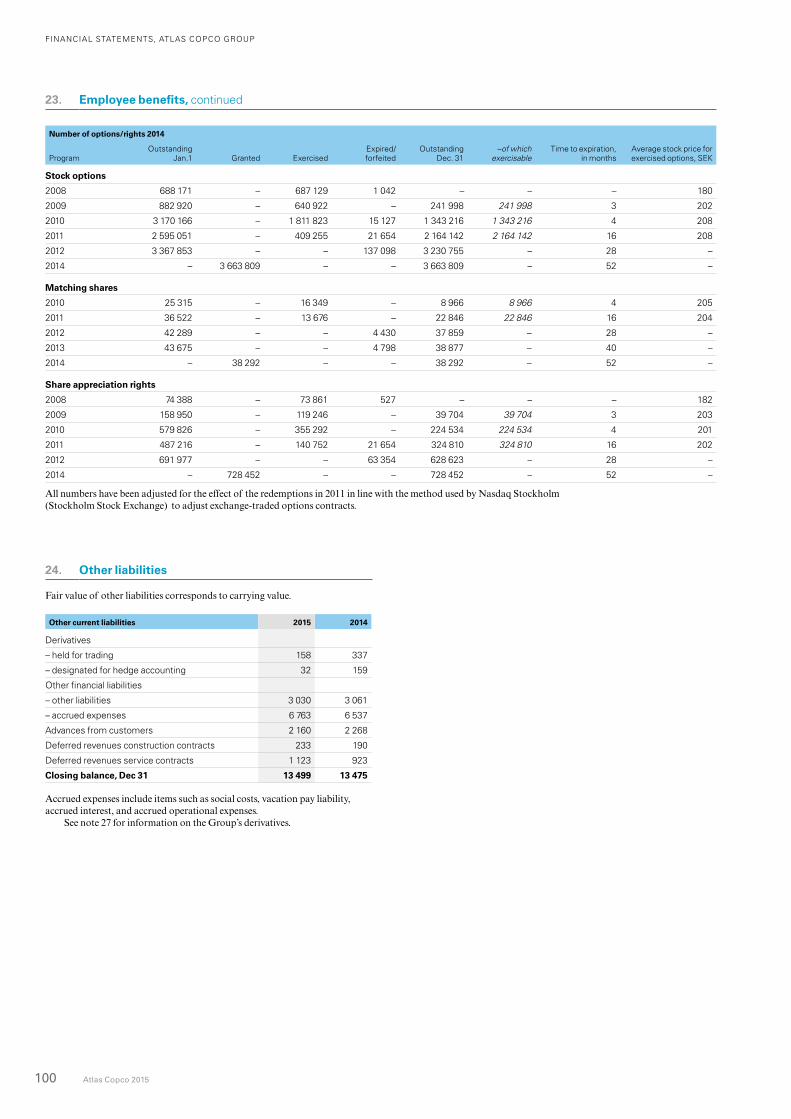
100 Atlas Copco 2015
FINANCIAL STATEMENTS, ATLAS COPCO GROUP
23. Employee benefits, continued
24. Other liabilities
Fair value of other liabilities corresponds to carrying value.
Other current liabilities 2015 2014
Derivatives
– held for trading 158 337
– designated for hedge accounting 32 159
Other financial liabilities
– other liabilities 3 030 3 061
– accrued expenses 6 763 6 537
Advances from customers 2 160 2 268
Deferred revenues construction contracts 233 190
Deferred revenues service contracts 1 123 923
Closing balance, Dec 31 13 499 13 475
Accrued expenses include items such as social costs, vacation pay liability, accrued interest, and accrued operational expenses.
See note 27 for information on the Group’s derivatives.
Number of options/rights 2014
ProgramOutstanding
Jan.1 Granted ExercisedExpired/ forfeited
Outstanding Dec. 31
–of which exercisable
Time to expiration, in months
Average stock price for exercised options, SEK
Stock options
2008 688 171 – 687 129 1 042 – – – 180
2009 882 920 – 640 922 – 241 998 241 998 3 202
2010 3 170 166 – 1 811 823 15 127 1 343 216 1 343 216 4 208
2011 2 595 051 – 409 255 21 654 2 164 142 2 164 142 16 208
2012 3 367 853 – – 137 098 3 230 755 – 28 –
2014 – 3 663 809 – – 3 663 809 – 52 –
Matching shares
2010 25 315 – 16 349 – 8 966 8 966 4 205
2011 36 522 – 13 676 – 22 846 22 846 16 204
2012 42 289 – – 4 430 37 859 – 28 –
2013 43 675 – – 4 798 38 877 – 40 –
2014 – 38 292 – – 38 292 – 52 –
Share appreciation rights
2008 74 388 – 73 861 527 – – – 182
2009 158 950 – 119 246 – 39 704 39 704 3 203
2010 579 826 – 355 292 – 224 534 224 534 4 201
2011 487 216 – 140 752 21 654 324 810 324 810 16 202
2012 691 977 – – 63 354 628 623 – 28 –
2014 – 728 452 – – 728 452 – 52 –
All numbers have been adjusted for the effect of the redemptions in 2011 in line with the method used by Nasdaq Stockholm (Stockholm Stock Exchange) to adjust exchange-traded options contracts.
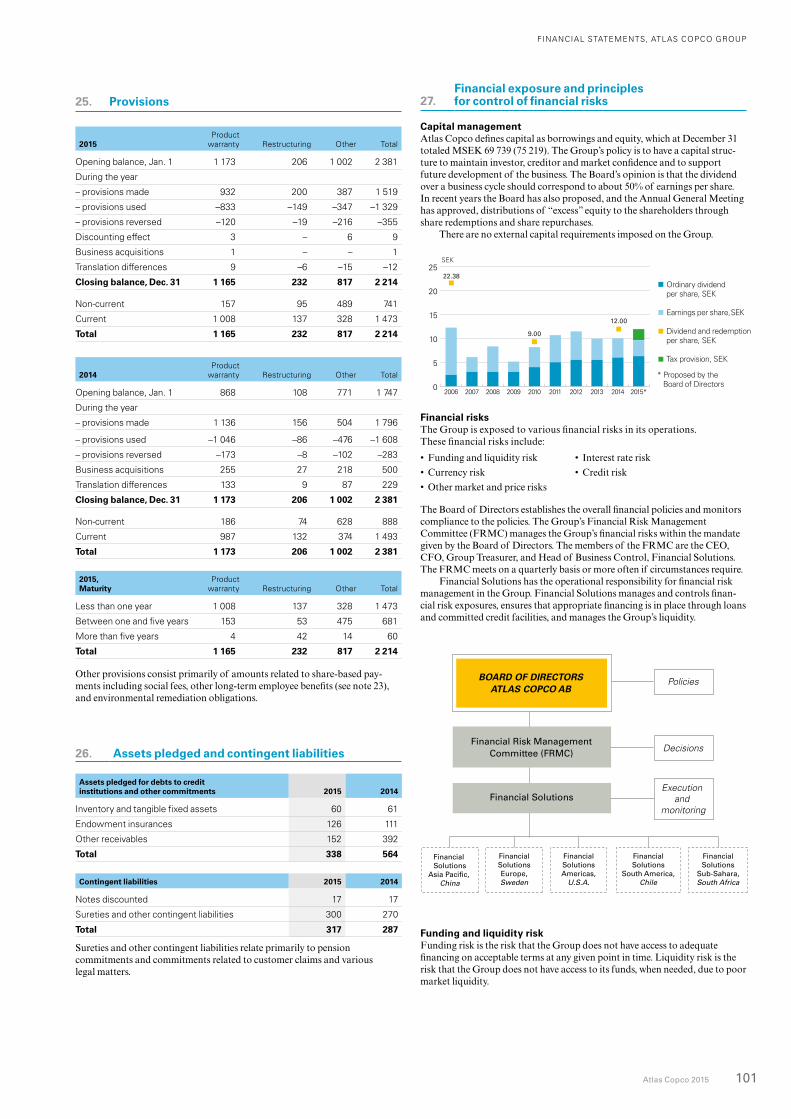
FINANCIAL STATEMENTS, ATLAS COPCO GROUP
Atlas Copco 2015 101
2015Product
warranty Restructuring Other Total
Opening balance, Jan. 1 1 173 206 1 002 2 381
During the year
– provisions made 932 200 387 1 519
– provisions used –833 –149 –347 –1 329
– provisions reversed –120 –19 –216 –355
Discounting effect 3 – 6 9
Business acquisitions 1 – – 1
Translation differences 9 –6 –15 –12
Closing balance, Dec. 31 1 165 232 817 2 214
Non-current 157 95 489 741
Current 1 008 137 328 1 473
Total 1 165 232 817 2 214
2014Product
warranty Restructuring Other Total
Opening balance, Jan. 1 868 108 771 1 747
During the year
– provisions made 1 136 156 504 1 796
– provisions used –1 046 –86 –476 –1 608
– provisions reversed –173 –8 –102 –283
Business acquisitions 255 27 218 500
Translation differences 133 9 87 229
Closing balance, Dec. 31 1 173 206 1 002 2 381
Non-current 186 74 628 888
Current 987 132 374 1 493
Total 1 173 206 1 002 2 381
2015, Maturity
Product warranty Restructuring Other Total
Less than one year 1 008 137 328 1 473
Between one and five years 153 53 475 681
More than five years 4 42 14 60
Total 1 165 232 817 2 214
Other provisions consist primarily of amounts related to share-based pay-ments including social fees, other long-term employee benefits (see note 23), and environmental remediation obligations.
26. Assets pledged and contingent liabilities
Assets pledged for debts to credit institutions and other commitments 2015 2014
Inventory and tangible fixed assets 60 61
Endowment insurances 126 111
Other receivables 152 392
Total 338 564
Contingent liabilities 2015 2014
Notes discounted 17 17
Sureties and other contingent liabilities 300 270
Total 317 287
Sureties and other contingent liabilities relate primarily to pension commitments and commitments related to customer claims and various legal matters.
27.Financial exposure and principles for control of financial risks
Capital managementAtlas Copco defines capital as borrowings and equity, which at December 31 totaled MSEK 69 739 (75 219). The Group’s policy is to have a capital struc-ture to maintain investor, creditor and market confidence and to support future development of the business. The Board’s opinion is that the dividend over a business cycle should correspond to about 50% of earnings per share. In recent years the Board has also proposed, and the Annual General Meeting has approved, distributions of “excess” equity to the shareholders through share redemptions and share repurchases.
There are no external capital requirements imposed on the Group.
SEK
0
5
10
15
20
25
2015*201420132012201120102009200820072006
22.38
9.00
12.00
Ordinary dividend per share, SEK
Earnings per share, SEK
Dividend and redemption per share, SEK
Tax provision, SEK
* Proposed by the Board of Directors
Financial risksThe Group is exposed to various financial risks in its operations. These financial risks include:
• Funding and liquidity risk • Interest rate risk
• Currency risk • Credit risk
• Other market and price risks
The Board of Directors establishes the overall financial policies and monitors compliance to the policies. The Group’s Financial Risk Management Committee (FRMC) manages the Group’s financial risks within the mandate given by the Board of Directors. The members of the FRMC are the CEO, CFO, Group Treasurer, and Head of Business Control, Financial Solutions. The FRMC meets on a quarterly basis or more often if circumstances require.
Financial Solutions has the operational responsibility for financial risk management in the Group. Financial Solutions manages and controls finan-cial risk exposures, ensures that appropriate financing is in place through loans and committed credit facilities, and manages the Group’s liquidity.
Financial Solutions
Financial Risk Management Committee (FRMC)
BOARD OF DIRECTORS ATLAS COPCO AB
Financial Solutions
Asia Pacific, China
Policies
Decisions
Execution and
monitoring
Financial Solutions Americas,
U.S.A.
Financial Solutions
Sub-Sahara, South Africa
Financial Solutions Europe, Sweden
Financial Solutions
South America, Chile
Funding and liquidity riskFunding risk is the risk that the Group does not have access to adequate financing on acceptable terms at any given point in time. Liquidity risk is the risk that the Group does not have access to its funds, when needed, due to poor market liquidity.
25. Provisions
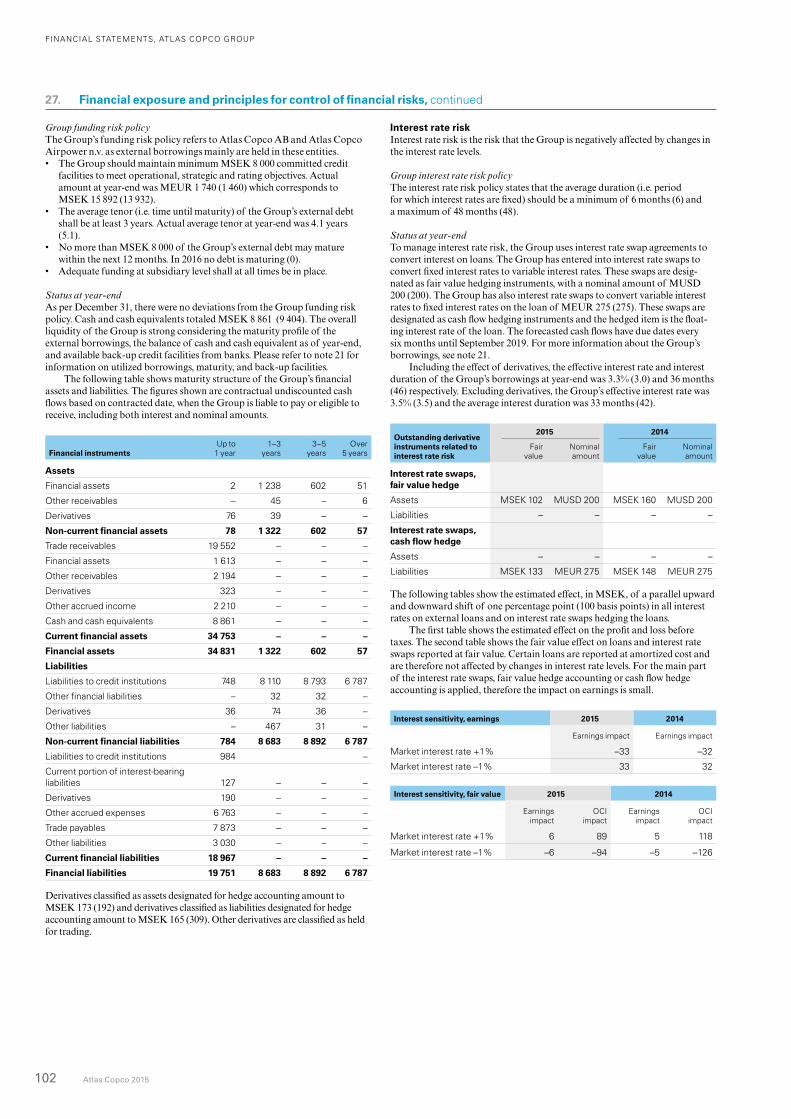
FINANCIAL STATEMENTS, ATLAS COPCO GROUP
102 Atlas Copco 2015
Group funding risk policy The Group’s funding risk policy refers to Atlas Copco AB and Atlas Copco Airpower n.v. as external borrowings mainly are held in these entities.• The Group should maintain minimum MSEK 8 000 committed credit
facilities to meet operational, strategic and rating objectives. Actual amount at year-end was MEUR 1 740 (1 460) which corresponds to MSEK 15 892 (13 932).
• The average tenor (i.e. time until maturity) of the Group’s external debt shall be at least 3 years. Actual average tenor at year-end was 4.1 years (5.1).
• No more than MSEK 8 000 of the Group’s external debt may mature within the next 12 months. In 2016 no debt is maturing (0).
• Adequate funding at subsidiary level shall at all times be in place.
Status at year-endAs per December 31, there were no deviations from the Group funding risk policy. Cash and cash equivalents totaled MSEK 8 861 (9 404). The overall liquidity of the Group is strong considering the maturity profile of the external borrowings, the balance of cash and cash equivalent as of year-end, and available back-up credit facilities from banks. Please refer to note 21 for information on utilized borrowings, maturity, and back-up facilities.
The following table shows maturity structure of the Group’s financial assets and liabilities. The figures shown are contractual undiscounted cash flows based on contracted date, when the Group is liable to pay or eligible to receive, including both interest and nominal amounts.
Financial instruments Up to
1 year1–3
years3–5
yearsOver
5 years
Assets
Financial assets 2 1 238 602 51
Other receivables – 45 – 6
Derivatives 76 39 – –
Non-current financial assets 78 1 322 602 57
Trade receivables 19 552 – – –
Financial assets 1 613 – – –
Other receivables 2 194 – – –
Derivatives 323 – – –
Other accrued income 2 210 – – –
Cash and cash equivalents 8 861 – – –
Current financial assets 34 753 – – –
Financial assets 34 831 1 322 602 57
Liabilities
Liabilities to credit institutions 748 8 110 8 793 6 787
Other financial liabilities – 32 32 –
Derivatives 36 74 36 –
Other liabilities – 467 31 –
Non-current financial liabilities 784 8 683 8 892 6 787
Liabilities to credit institutions 984 –
Current portion of interest-bearing liabilities 127 – – –
Derivatives 190 – – –
Other accrued expenses 6 763 – – –
Trade payables 7 873 – – –
Other liabilities 3 030 – – –
Current financial liabilities 18 967 – – –
Financial liabilities 19 751 8 683 8 892 6 787
Derivatives classified as assets designated for hedge accounting amount to MSEK 173 (192) and derivatives classified as liabilities designated for hedge accounting amount to MSEK 165 (309). Other derivatives are classified as held for trading.
Interest rate riskInterest rate risk is the risk that the Group is negatively affected by changes in the interest rate levels.
Group interest rate risk policyThe interest rate risk policy states that the average duration (i.e. period for which interest rates are fixed) should be a minimum of 6 months (6) and a maximum of 48 months (48).
Status at year-end To manage interest rate risk, the Group uses interest rate swap agreements to convert interest on loans. The Group has entered into interest rate swaps to convert fixed interest rates to variable interest rates. These swaps are desig-nated as fair value hedging instruments, with a nominal amount of MUSD 200 (200). The Group has also interest rate swaps to convert variable interest rates to fixed interest rates on the loan of MEUR 275 (275). These swaps are designated as cash flow hedging instruments and the hedged item is the float-ing interest rate of the loan. The forecasted cash flows have due dates every six months until September 2019. For more information about the Group’s borrowings, see note 21.
Including the effect of derivatives, the effective interest rate and interest duration of the Group’s borrowings at year-end was 3.3% (3.0) and 36 months (46) respectively. Excluding derivatives, the Group’s effective interest rate was 3.5% (3.5) and the average interest duration was 33 months (42).
Outstanding derivative instruments related to interest rate risk
2015 2014
Fair value
Nominal amount
Fair value
Nominal amount
Interest rate swaps, fair value hedge
Assets MSEK 102 MUSD 200 MSEK 160 MUSD 200
Liabilities – – – –
Interest rate swaps, cash flow hedge
Assets – – – –
Liabilities MSEK 133 MEUR 275 MSEK 148 MEUR 275
The following tables show the estimated effect, in MSEK, of a parallel upward and downward shift of one percentage point (100 basis points) in all interest rates on external loans and on interest rate swaps hedging the loans.
The first table shows the estimated effect on the profit and loss before taxes. The second table shows the fair value effect on loans and interest rate swaps reported at fair value. Certain loans are reported at amortized cost and are therefore not affected by changes in interest rate levels. For the main part of the interest rate swaps, fair value hedge accounting or cash flow hedge accounting is applied, therefore the impact on earnings is small.
Interest sensitivity, earnings 2015 2014
Earnings impact Earnings impact
Market interest rate +1% –33 –32
Market interest rate –1% 33 32
Interest sensitivity, fair value 2015 2014
Earnings impact
OCI impact
Earnings impact
OCI impact
Market interest rate +1% 6 89 5 118
Market interest rate –1% –6 –94 –5 –126
27. Financial exposure and principles for control of financial risks, continued
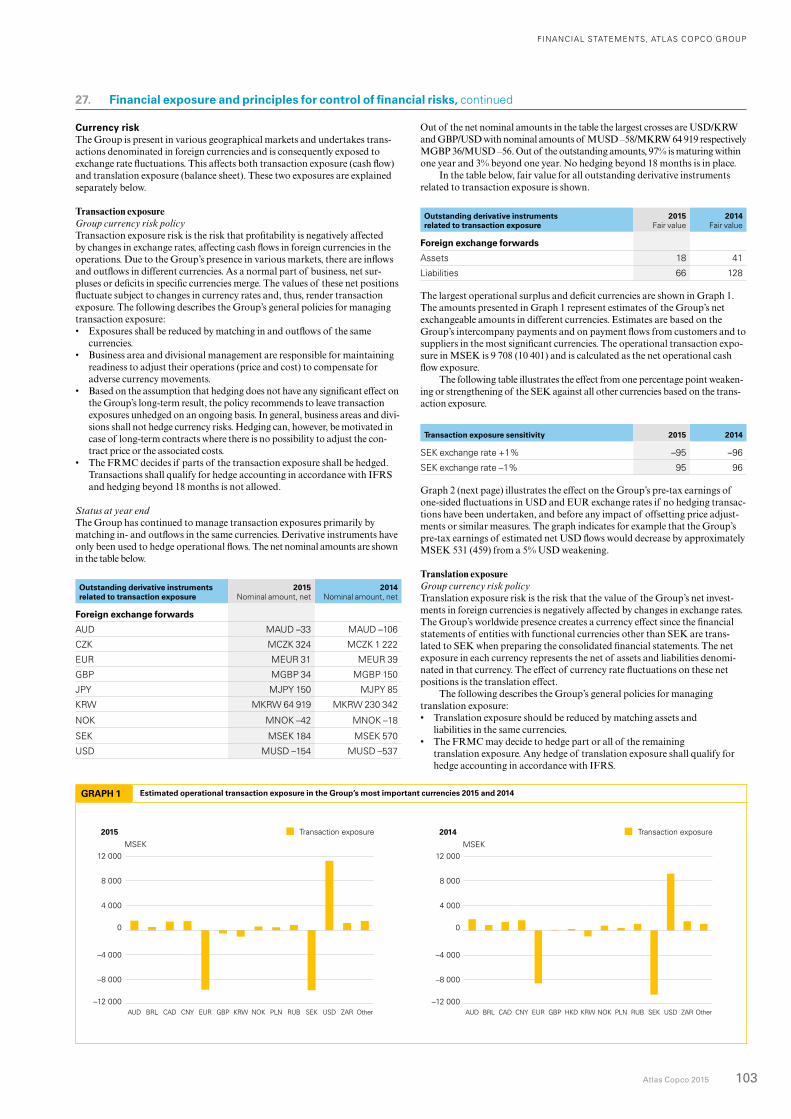
FINANCIAL STATEMENTS, ATLAS COPCO GROUP
Atlas Copco 2015 103
27. Financial exposure and principles for control of financial risks, continued
GRAPH 1 Estimated operational transaction exposure in the Group’s most important currencies 2015 and 2014
–12 000
–8 000
–4 000
0
4 000
8 000
12 000
OtherZARUSDSEKRUBPLNNOKKRWGBPEURCNYCADBRLAUD
MSEK
Transaction exposure2015
–12 000
–8 000
–4 000
0
4 000
8 000
12 000
OtherZARUSDSEKRUBPLNNOKKRWHKDGBPEURCNYCADBRLAUD
MSEK
Transaction exposure2014
–12 000
–8 000
–4 000
0
4 000
8 000
12 000
OtherZARUSDSEKRUBPLNNOKKRWGBPEURCNYCADBRLAUD
MSEK
Transaction exposure2015
–12 000
–8 000
–4 000
0
4 000
8 000
12 000
OtherZARUSDSEKRUBPLNNOKKRWHKDGBPEURCNYCADBRLAUD
MSEK
Transaction exposure2014
Currency riskThe Group is present in various geographical markets and undertakes trans-actions denominated in foreign currencies and is consequently exposed to exchange rate fluctuations. This affects both transaction exposure (cash flow) and translation exposure (balance sheet). These two exposures are explained separately below.
Transaction exposureGroup currency risk policyTransaction exposure risk is the risk that profitability is negatively affected by changes in exchange rates, affecting cash flows in foreign currencies in the operations. Due to the Group’s presence in various markets, there are inflows and outflows in different currencies. As a normal part of business, net sur-pluses or deficits in specific currencies merge. The values of these net positions fluctuate subject to changes in currency rates and, thus, render transaction exposure. The following describes the Group’s general policies for managing transaction exposure:• Exposures shall be reduced by matching in and outflows of the same
currencies.• Business area and divisional management are responsible for maintaining
readiness to adjust their operations (price and cost) to compensate for adverse currency movements.
• Based on the assumption that hedging does not have any significant effect on the Group’s long-term result, the policy recommends to leave transaction exposures unhedged on an ongoing basis. In general, business areas and divi-sions shall not hedge currency risks. Hedging can, however, be motivated in case of long-term contracts where there is no possibility to adjust the con-tract price or the associated costs.
• The FRMC decides if parts of the transaction exposure shall be hedged. Transactions shall qualify for hedge accounting in accordance with IFRS and hedging beyond 18 months is not allowed.
Status at year endThe Group has continued to manage transaction exposures primarily by matching in- and outflows in the same currencies. Derivative instruments have only been used to hedge operational flows. The net nominal amounts are shown in the table below.
Outstanding derivative instruments related to transaction exposure
2015Nominal amount, net
2014Nominal amount, net
Foreign exchange forwards
AUD MAUD –33 MAUD –106
CZK MCZK 324 MCZK 1 222
EUR MEUR 31 MEUR 39
GBP MGBP 34 MGBP 150
JPY MJPY 150 MJPY 85
KRW MKRW 64 919 MKRW 230 342
NOK MNOK –42 MNOK –18
SEK MSEK 184 MSEK 570
USD MUSD –154 MUSD –537
Out of the net nominal amounts in the table the largest crosses are USD/KRW and GBP/USD with nominal amounts of MUSD –58/MKRW 64 919 respectively MGBP 36/MUSD –56. Out of the outstanding amounts, 97% is maturing within one year and 3% beyond one year. No hedging beyond 18 months is in place.
In the table below, fair value for all outstanding derivative instruments related to transaction exposure is shown.
Outstanding derivative instruments related to transaction exposure
2015Fair value
2014Fair value
Foreign exchange forwards
Assets 18 41
Liabilities 66 128
The largest operational surplus and deficit currencies are shown in Graph 1. The amounts presented in Graph 1 represent estimates of the Group’s net exchangeable amounts in different currencies. Estimates are based on the Group’s intercompany payments and on payment flows from customers and to suppliers in the most significant currencies. The operational transaction expo-sure in MSEK is 9 708 (10 401) and is calculated as the net operational cash flow exposure.
The following table illustrates the effect from one percentage point weaken-ing or strengthening of the SEK against all other currencies based on the trans-action exposure.
Transaction exposure sensitivity 2015 2014
SEK exchange rate +1% –95 –96
SEK exchange rate –1% 95 96
Graph 2 (next page) illustrates the effect on the Group’s pre-tax earnings of one-sided fluctuations in USD and EUR exchange rates if no hedging transac-tions have been undertaken, and before any impact of offsetting price adjust-ments or similar measures. The graph indicates for example that the Group’s pre-tax earnings of estimated net USD flows would decrease by approximately MSEK 531 (459) from a 5% USD weakening.
Translation exposureGroup currency risk policyTranslation exposure risk is the risk that the value of the Group’s net invest-ments in foreign currencies is negatively affected by changes in exchange rates. The Group’s worldwide presence creates a currency effect since the financial statements of entities with functional currencies other than SEK are trans-lated to SEK when preparing the consolidated financial statements. The net exposure in each currency represents the net of assets and liabilities denomi-nated in that currency. The effect of currency rate fluctuations on these net positions is the translation effect.
The following describes the Group’s general policies for managing translation exposure:• Translation exposure should be reduced by matching assets and
liabilities in the same currencies.• The FRMC may decide to hedge part or all of the remaining
trans lation exposure. Any hedge of translation exposure shall qualify for hedge accounting in accordance with IFRS.
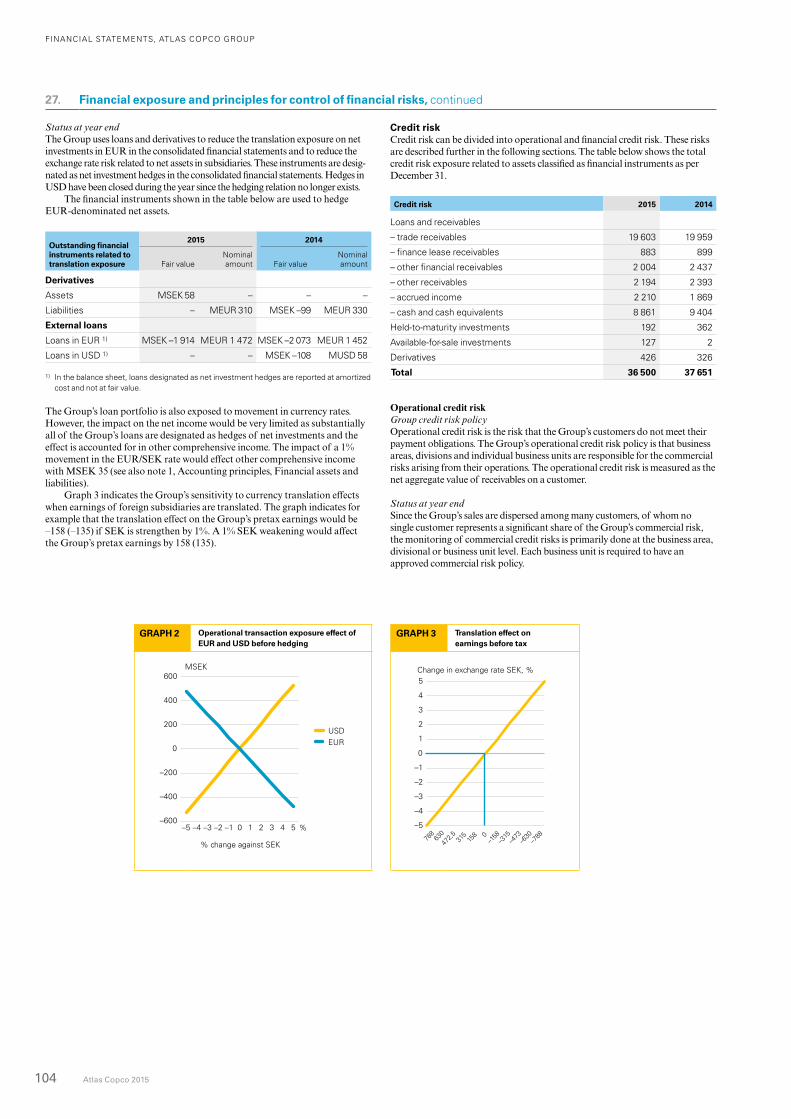
FINANCIAL STATEMENTS, ATLAS COPCO GROUP
104 Atlas Copco 2015
27. Financial exposure and principles for control of financial risks, continued
GRAPH 2 Operational transaction exposure effect of EUR and USD before hedging
–600
–400
–200
0
200
400
600
543210–1–2–3–4–5
MSEK
%
USD
% change against SEK
EUR
–350–300–250–200–150–100–50
050
100150200250300350
543210–1–2–3–4–5
MSEK
%
USD % change againstall other currenciesEUR
GRAPH 3 Translation effect on earnings before tax
–5
–4
–3
–2
–1
0
1
2
3
4
5
–788
–630
–473
–315
–1580
158
315
472,563
078
8
Change in exchange rate SEK, %
Change in profit, MSEK
555
444
333
222
1110
–111
–222
–333
–444
–555
Change in exchange rate SEK, %
Change in profit, MSEK
–5
–4
–3
–2
–1
0
1
2
3
4
5
550
440
330
220
1100
–110
–220
–330
–440
–550
Status at year endThe Group uses loans and derivatives to reduce the translation exposure on net investments in EUR in the consolidated financial statements and to reduce the exchange rate risk related to net assets in subsidiaries. These instruments are desig-nated as net investment hedges in the consolidated financial statements. Hedges in USD have been closed during the year since the hedging relation no longer exists.
The financial instruments shown in the table below are used to hedge EUR-denominated net assets.
Outstanding financial instruments related to translation exposure
2015 2014
Fair valueNominal amount Fair value
Nominal amount
Derivatives Assets MSEK 58 – – –
Liabilities – MEUR 310 MSEK –99 MEUR 330
External loans
Loans in EUR 1) MSEK –1 914 MEUR 1 472 MSEK –2 073 MEUR 1 452
Loans in USD 1) – – MSEK –108 MUSD 58
1) In the balance sheet, loans designated as net investment hedges are reported at amortized cost and not at fair value.
The Group’s loan portfolio is also exposed to movement in currency rates. However, the impact on the net income would be very limited as substantially all of the Group’s loans are designated as hedges of net investments and the effect is accounted for in other comprehensive income. The impact of a 1% movement in the EUR/SEK rate would effect other comprehensive income with MSEK 35 (see also note 1, Accounting principles, Financial assets and liabilities).
Graph 3 indicates the Group’s sensitivity to currency translation effects when earnings of foreign subsidiaries are translated. The graph indicates for example that the translation effect on the Group’s pretax earnings would be –158 (–135) if SEK is strengthen by 1%. A 1% SEK weakening would affect the Group’s pretax earnings by 158 (135).
Credit riskCredit risk can be divided into operational and financial credit risk. These risks are described further in the following sections. The table below shows the total credit risk exposure related to assets classified as financial instruments as per December 31.
Credit risk 2015 2014
Loans and receivables
– trade receivables 19 603 19 959
– finance lease receivables 883 899
– other financial receivables 2 004 2 437
– other receivables 2 194 2 393
– accrued income 2 210 1 869
– cash and cash equivalents 8 861 9 404
Held-to-maturity investments 192 362
Available-for-sale investments 127 2
Derivatives 426 326
Total 36 500 37 651
Operational credit riskGroup credit risk policyOperational credit risk is the risk that the Group’s customers do not meet their payment obligations. The Group’s operational credit risk policy is that business areas, divisions and individual business units are responsible for the commercial risks arising from their operations. The operational credit risk is measured as the net aggregate value of receivables on a customer.
Status at year end Since the Group’s sales are dispersed among many customers, of whom no single customer represents a significant share of the Group’s commercial risk, the monitoring of commercial credit risks is primarily done at the business area, divisional or business unit level. Each business unit is required to have an approved commercial risk policy.
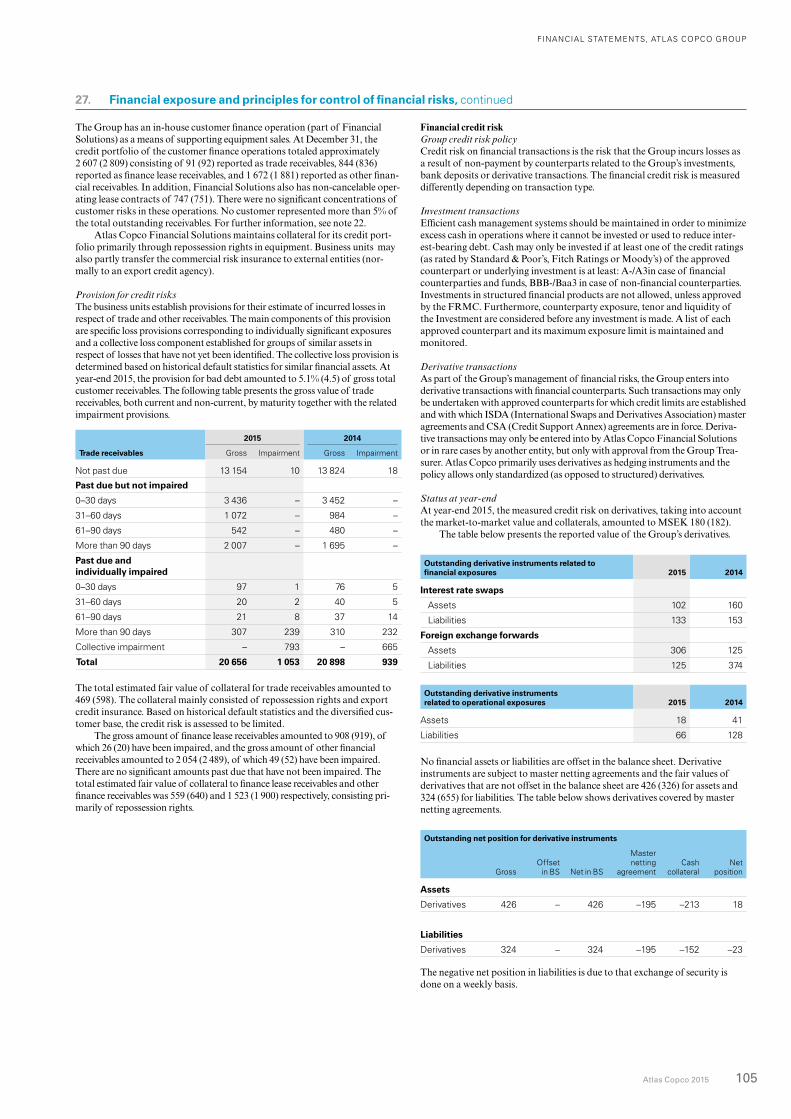
FINANCIAL STATEMENTS, ATLAS COPCO GROUP
Atlas Copco 2015 105
27. Financial exposure and principles for control of financial risks, continued
The Group has an in-house customer finance operation (part of Financial Solutions) as a means of supporting equipment sales. At December 31, the credit portfolio of the customer finance operations totaled approximately 2 607 (2 809) consisting of 91 (92) reported as trade receivables, 844 (836) reported as finance lease receivables, and 1 672 (1 881) reported as other finan-cial receivables. In addition, Financial Solutions also has non-cancelable oper-ating lease contracts of 747 (751). There were no significant concentrations of customer risks in these operations. No customer represented more than 5% of the total outstanding receivables. For further information, see note 22.
Atlas Copco Financial Solutions maintains collateral for its credit port-folio primarily through repossession rights in equipment. Business units may also partly transfer the commercial risk insurance to external entities (nor-mally to an export credit agency).
Provision for credit risksThe business units establish provisions for their estimate of incurred losses in respect of trade and other receivables. The main components of this provision are specific loss provisions corresponding to individually significant exposures and a collective loss component established for groups of similar assets in respect of losses that have not yet been identified. The collective loss provision is determined based on historical default statistics for similar financial assets. At year-end 2015, the provision for bad debt amounted to 5.1% (4.5) of gross total customer receivables. The following table presents the gross value of trade receivables, both current and non-current, by maturity together with the related impairment provisions.
2015 2014
Trade receivables Gross Impairment Gross Impairment
Not past due 13 154 10 13 824 18
Past due but not impaired
0–30 days 3 436 – 3 452 –
31–60 days 1 072 – 984 –
61–90 days 542 – 480 –
More than 90 days 2 007 – 1 695 –
Past due and individually impaired
0–30 days 97 1 76 5
31–60 days 20 2 40 5
61–90 days 21 8 37 14
More than 90 days 307 239 310 232
Collective impairment – 793 – 665
Total 20 656 1 053 20 898 939
The total estimated fair value of collateral for trade receivables amounted to 469 (598). The collateral mainly consisted of repossession rights and export credit insurance. Based on historical default statistics and the diversified cus-tomer base, the credit risk is assessed to be limited.
The gross amount of finance lease receivables amounted to 908 (919), of which 26 (20) have been impaired, and the gross amount of other financial receivables amounted to 2 054 (2 489), of which 49 (52) have been impaired. There are no significant amounts past due that have not been impaired. The total estimated fair value of collateral to finance lease receivables and other finance receivables was 559 (640) and 1 523 (1 900) respectively, consisting pri-marily of repossession rights.
Financial credit riskGroup credit risk policyCredit risk on financial transactions is the risk that the Group incurs losses as a result of non-payment by counterparts related to the Group’s investments, bank deposits or derivative transactions. The financial credit risk is measured differently depending on transaction type.
Investment transactionsEfficient cash management systems should be maintained in order to minimize excess cash in operations where it cannot be invested or used to reduce inter-est-bearing debt. Cash may only be invested if at least one of the credit ratings (as rated by Standard & Poor’s, Fitch Ratings or Moody’s) of the approved counterpart or underlying investment is at least: A-/A3in case of financial counterparties and funds, BBB-/Baa3 in case of non-financial counterparties. Investments in structured financial products are not allowed, unless approved by the FRMC. Furthermore, counterparty exposure, tenor and liquidity of the Investment are considered before any investment is made. A list of each approved counterpart and its maximum exposure limit is maintained and monitored.
Derivative transactionsAs part of the Group’s management of financial risks, the Group enters into derivative transactions with financial counterparts. Such transactions may only be undertaken with approved counterparts for which credit limits are established and with which ISDA (International Swaps and Derivatives Association) master agreements and CSA (Credit Support Annex) agreements are in force. Deriva-tive transactions may only be entered into by Atlas Copco Financial Solutions or in rare cases by another entity, but only with approval from the Group Trea-surer. Atlas Copco primarily uses derivatives as hedging instruments and the policy allows only standardized (as opposed to structured) derivatives.
Status at year-endAt year-end 2015, the measured credit risk on derivatives, taking into account the market-to-market value and collaterals, amounted to MSEK 180 (182).
The table below presents the reported value of the Group’s derivatives.
Outstanding derivative instruments related to financial exposures 2015 2014
Interest rate swaps
Assets 102 160
Liabilities 133 153
Foreign exchange forwards
Assets 306 125
Liabilities 125 374
Outstanding derivative instruments related to operational exposures 2015 2014
Assets 18 41
Liabilities 66 128
No financial assets or liabilities are offset in the balance sheet. Derivative instruments are subject to master netting agreements and the fair values of derivatives that are not offset in the balance sheet are 426 (326) for assets and 324 (655) for liabilities. The table below shows derivatives covered by master netting agreements.
Outstanding net position for derivative instruments
GrossOffset
in BS Net in BS
Master netting
agreementCash
collateralNet
position
Assets
Derivatives 426 – 426 –195 –213 18
Liabilities
Derivatives 324 – 324 –195 –152 –23
The negative net position in liabilities is due to that exchange of security is done on a weekly basis.
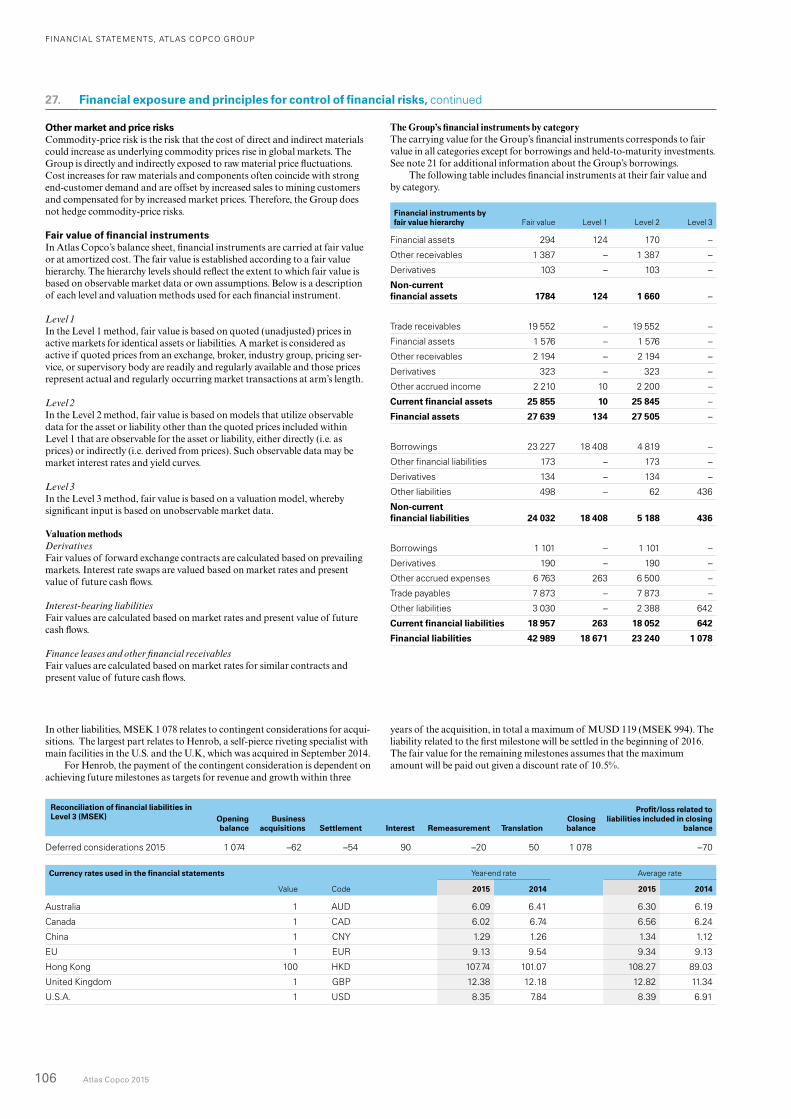
FINANCIAL STATEMENTS, ATLAS COPCO GROUP
106 Atlas Copco 2015
Currency rates used in the financial statements Year-end rate Average rate
Value Code 2015 2014 2015 2014
Australia 1 AUD 6.09 6.41 6.30 6.19
Canada 1 CAD 6.02 6.74 6.56 6.24
China 1 CNY 1.29 1.26 1.34 1.12
EU 1 EUR 9.13 9.54 9.34 9.13
Hong Kong 100 HKD 107.74 101.07 108.27 89.03
United Kingdom 1 GBP 12.38 12.18 12.82 11.34
U.S.A. 1 USD 8.35 7.84 8.39 6.91
27. Financial exposure and principles for control of financial risks, continued
Reconciliation of financial liabilities in Level 3 (MSEK) Opening
balance Business
acquisitions Settlement Interest Remeasurement TranslationClosing balance
Profit/loss related to liabilities included in closing
balance
Deferred considerations 2015 1 074 –62 –54 90 –20 50 1 078 –70
In other liabilities, MSEK 1 078 relates to contingent considerations for acqui-sitions. The largest part relates to Henrob, a self-pierce riveting specialist with main facilities in the U.S. and the U.K, which was acquired in September 2014.
For Henrob, the payment of the contingent consideration is dependent on achieving future milestones as targets for revenue and growth within three
years of the acquisition, in total a maximum of MUSD 119 (MSEK 994). The liability related to the first milestone will be settled in the beginning of 2016. The fair value for the remaining milestones assumes that the maximum amount will be paid out given a discount rate of 10.5%.
Other market and price risksCommodity-price risk is the risk that the cost of direct and indirect materials could increase as underlying commodity prices rise in global markets. The Group is directly and indirectly exposed to raw material price fluctuations. Cost increases for raw materials and components often coincide with strong end-customer demand and are offset by increased sales to mining customers and compensated for by increased market prices. Therefore, the Group does not hedge commodity-price risks.
Fair value of financial instrumentsIn Atlas Copco’s balance sheet, financial instruments are carried at fair value or at amortized cost. The fair value is established according to a fair value hierarchy. The hierarchy levels should reflect the extent to which fair value is based on observable market data or own assumptions. Below is a description of each level and valuation methods used for each financial instrument.
Level 1In the Level 1 method, fair value is based on quoted (unadjusted) prices in active markets for identical assets or liabilities. A market is considered as active if quoted prices from an exchange, broker, industry group, pricing ser-vice, or supervisory body are readily and regularly available and those prices represent actual and regularly occurring market transactions at arm’s length.
Level 2In the Level 2 method, fair value is based on models that utilize observable data for the asset or liability other than the quoted prices included within Level 1 that are observable for the asset or liability, either directly (i.e. as prices) or indirectly (i.e. derived from prices). Such observable data may be market interest rates and yield curves.
Level 3In the Level 3 method, fair value is based on a valuation model, whereby significant input is based on unobservable market data.
Valuation methodsDerivativesFair values of forward exchange contracts are calculated based on pre vailing markets. Interest rate swaps are valued based on market rates and present value of future cash flows.
Interest-bearing liabilitiesFair values are calculated based on market rates and present value of future cash flows.
Finance leases and other financial receivablesFair values are calculated based on market rates for similar contracts and present value of future cash flows.
The Group’s financial instruments by categoryThe carrying value for the Group’s financial instruments corresponds to fair value in all categories except for borrowings and held-to-maturity investments. See note 21 for additional information about the Group’s borrowings.
The following table includes financial instruments at their fair value and by category.
Financial instruments by fair value hierarchy Fair value Level 1 Level 2 Level 3
Financial assets 294 124 170 –
Other receivables 1 387 – 1 387 –
Derivatives 103 – 103 –
Non-current financial assets 1784 124 1 660 –
Trade receivables 19 552 – 19 552 –
Financial assets 1 576 – 1 576 –
Other receivables 2 194 – 2 194 –
Derivatives 323 – 323 –
Other accrued income 2 210 10 2 200 –
Current financial assets 25 855 10 25 845 –
Financial assets 27 639 134 27 505 –
Borrowings 23 227 18 408 4 819 –
Other financial liabilities 173 – 173 –
Derivatives 134 – 134 –
Other liabilities 498 – 62 436
Non-current financial liabilities 24 032 18 408 5 188 436
Borrowings 1 101 – 1 101 –
Derivatives 190 – 190 –
Other accrued expenses 6 763 263 6 500 –
Trade payables 7 873 – 7 873 –
Other liabilities 3 030 – 2 388 642
Current financial liabilities 18 957 263 18 052 642
Financial liabilities 42 989 18 671 23 240 1 078
FINANCIAL STATEMENTS, ATLAS COPCO GROUP
Atlas Copco 2015 107
Relationships The Group has related party relationships with the Company’s largest share-holder, its associates, joint ventures and with its Board members and Group Management. The Company’s largest shareholder, Investor AB, controls approximately 22% of the voting rights in Atlas Copco.
The subsidiaries that are directly owned by the Parent Company are pre-sented in note A21 to the financial statements of the Parent Company. Hold-ing companies and operating subsidiaries are listed in note A22. Information about associated companies and joint ventures is found in note 14. Informa-tion about Board members and Group Management is presented on pages 60–63.
In 2015 premises in Sweden have been sold to and leased back from the Group’s German pension trust for a consideration of 420 resulting in a net gain of 101. The lease term for the premises varies between 6 and 15 years. The consideration and the lease payments are on market terms.
Transactions and outstanding balancesThe Group has not had any transactions with Investor AB during the year, otherthan dividends declared and redemption of shares and has no outstandingbalances with Investor AB.
Investor AB has controlling or significant influence in companies with which Atlas Copco may have transactions within the normal course of business. Any such transactions are made on commercial terms.
Transactions with associated companies and joint venturesThe Group sold various products and purchased goods through certain associated companies and joint ventures on terms generally similar to those prevailing with unrelated parties.
The following table summarizes the Group’s related party transactions with its associates and joint ventures:
2015 2014
Revenues 22 46
Goods purchased 164 104
Service purchased 35 29
At Dec, 31:
Trade receivables 3 1
Trade payables 18 4
Other liabilities 1 –
Other interest-bearing liabilities 16 17
Guarantees – 10
Compensation to key management personnelCompensation to the Board and to Group Management is disclosed in note 5.
28. Related parties 29. Subsequent events
On January 12 Atlas Copco, completed the acquisition of Varisco, an Italian pump manufacturer with a global sales network. Varisco had revenues in 2014 of MEUR 30 (MSEK 270) and employs about 135 people. Founded in 1932, Varisco is known around the world for the design and manufacture of high-quality pumps used by a wide range of customers. The pumps are typically used to remove unwanted water or other liquids in the construction, mining, and oil and gas industries; they are also used in industrial process plants and for emergency services in case of floods.
On March 2, Atlas Copco completed the acquisition of FIAC, an Italian manufacturer of piston compressors and related equipment with a global sales network. FIAC has about 400 employees and offers a broad range of piston compressors, air treatment products, and spare parts. Founded in 1977, FIAC has production sites in Italy, China and Brazil, and sells into more than 110 countries. It had revenues in 2014 of about MEUR 70 (MSEK 640).
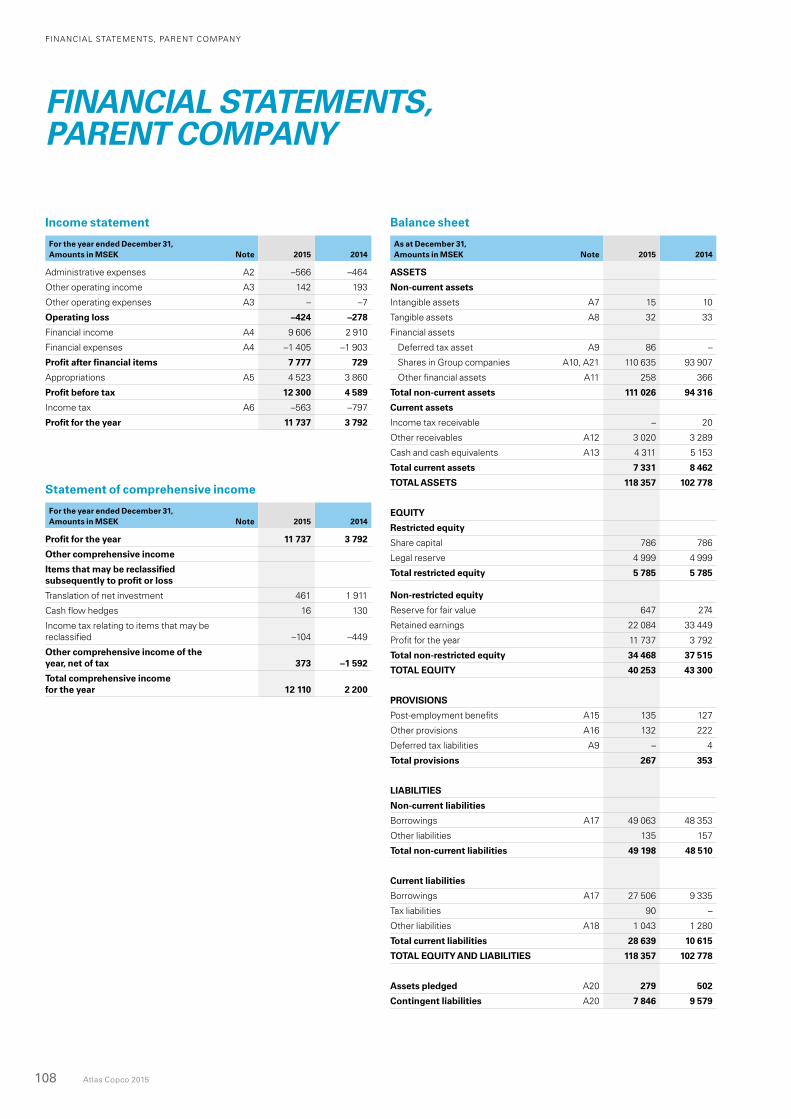
FINANCIAL STATEMENTS, PARENT COMPANY
108 Atlas Copco 2015
FINANCIAL STATEMENTS, PARENT COMPANY
Income statement
For the year ended December 31, Amounts in MSEK Note 2015 2014
Administrative expenses A2 –566 –464
Other operating income A3 142 193
Other operating expenses A3 – –7
Operating loss –424 –278
Financial income A4 9 606 2 910
Financial expenses A4 –1 405 –1 903
Profit after financial items 7 777 729
Appropriations A5 4 523 3 860
Profit before tax 12 300 4 589
Income tax A6 –563 –797
Profit for the year 11 737 3 792
Statement of comprehensive income
For the year ended December 31, Amounts in MSEK Note 2015 2014
Profit for the year 11 737 3 792
Other comprehensive income
Items that may be reclassified subsequently to profit or loss
Translation of net investment 461 1 911
Cash flow hedges 16 130
Income tax relating to items that may be reclassified –104 –449
Other comprehensive income of the year, net of tax 373 –1 592
Total comprehensive income for the year 12 110 2 200
Balance sheet
As at December 31, Amounts in MSEK Note 2015 2014
ASSETS
Non-current assets
Intangible assets A7 15 10
Tangible assets A8 32 33
Financial assets
Deferred tax asset A9 86 –
Shares in Group companies A10, A21 110 635 93 907
Other financial assets A11 258 366
Total non-current assets 111 026 94 316
Current assets
Income tax receivable – 20
Other receivables A12 3 020 3 289
Cash and cash equivalents A13 4 311 5 153
Total current assets 7 331 8 462
TOTAL ASSETS 118 357 102 778
EQUITY
Restricted equity
Share capital 786 786
Legal reserve 4 999 4 999
Total restricted equity 5 785 5 785
Non-restricted equity
Reserve for fair value 647 274
Retained earnings 22 084 33 449
Profit for the year 11 737 3 792
Total non-restricted equity 34 468 37 515
TOTAL EQUITY 40 253 43 300
PROVISIONS
Post-employment benefits A15 135 127
Other provisions A16 132 222
Deferred tax liabilities A9 – 4
Total provisions 267 353
LIABILITIES
Non-current liabilities
Borrowings A17 49 063 48 353
Other liabilities 135 157
Total non-current liabilities 49 198 48 510
Current liabilities
Borrowings A17 27 506 9 335
Tax liabilities 90 –
Other liabilities A18 1 043 1 280
Total current liabilities 28 639 10 615
TOTAL EQUITY AND LIABILITIES 118 357 102 778
Assets pledged A20 279 502
Contingent liabilities A20 7 846 9 579
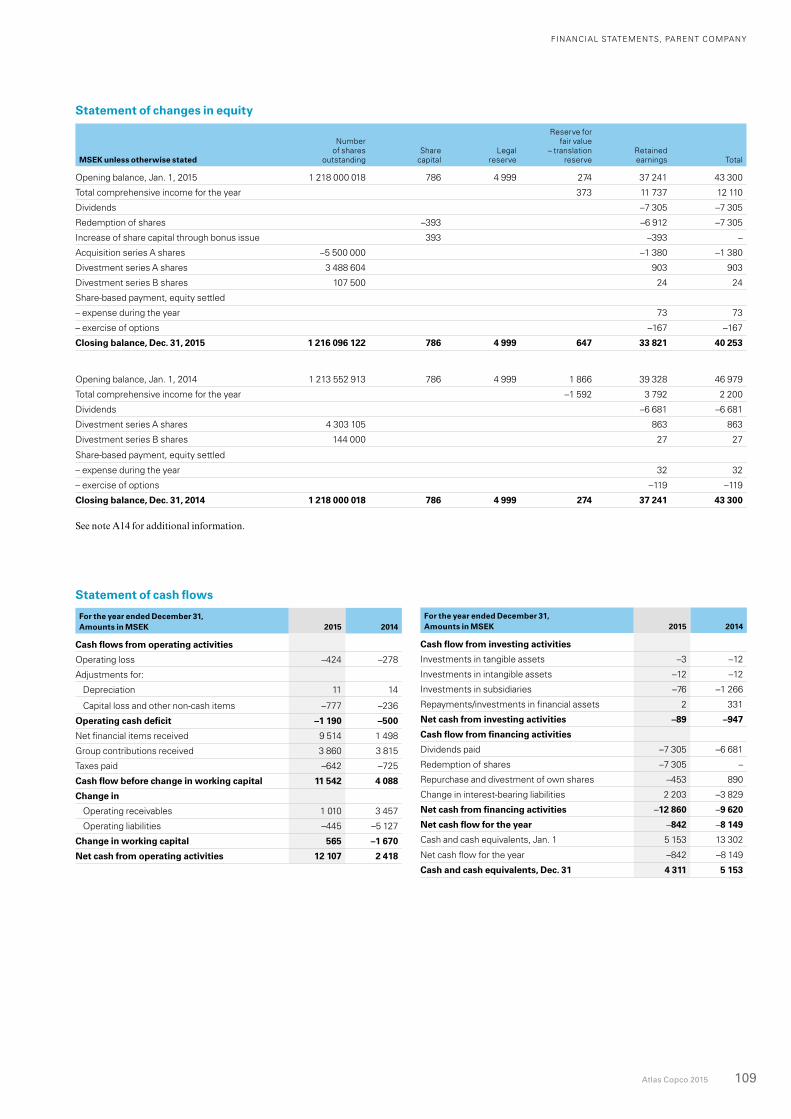
FINANCIAL STATEMENTS, PARENT COMPANY
Atlas Copco 2015 109
Statement of changes in equity
MSEK unless otherwise stated
Number of shares
outstandingShare
capitalLegal
reserve
Reserve for fair value
– translation reserve
Retained earnings Total
Opening balance, Jan. 1, 2015 1 218 000 018 786 4 999 274 37 241 43 300
Total comprehensive income for the year 373 11 737 12 110
Dividends –7 305 –7 305
Redemption of shares –393 –6 912 –7 305
Increase of share capital through bonus issue 393 –393 –
Acquisition series A shares –5 500 000 –1 380 –1 380
Divestment series A shares 3 488 604 903 903
Divestment series B shares 107 500 24 24
Share-based payment, equity settled
– expense during the year 73 73
– exercise of options –167 –167
Closing balance, Dec. 31, 2015 1 216 096 122 786 4 999 647 33 821 40 253
Opening balance, Jan. 1, 2014 1 213 552 913 786 4 999 1 866 39 328 46 979
Total comprehensive income for the year –1 592 3 792 2 200
Dividends –6 681 –6 681
Divestment series A shares 4 303 105 863 863
Divestment series B shares 144 000 27 27
Share-based payment, equity settled
– expense during the year 32 32
– exercise of options –119 –119
Closing balance, Dec. 31, 2014 1 218 000 018 786 4 999 274 37 241 43 300
See note A14 for additional information.
Statement of cash flows
For the year ended December 31, Amounts in MSEK 2015 2014
Cash flows from operating activities
Operating loss –424 –278
Adjustments for:
Depreciation 11 14
Capital loss and other non-cash items –777 –236
Operating cash deficit –1 190 –500
Net financial items received 9 514 1 498
Group contributions received 3 860 3 815
Taxes paid –642 –725
Cash flow before change in working capital 11 542 4 088
Change in
Operating receivables 1 010 3 457
Operating liabilities –445 –5 127
Change in working capital 565 –1 670
Net cash from operating activities 12 107 2 418
For the year ended December 31, Amounts in MSEK 2015 2014
Cash flow from investing activities
Investments in tangible assets –3 –12
Investments in intangible assets –12 –12
Investments in subsidiaries –76 –1 266
Repayments/investments in financial assets 2 331
Net cash from investing activities –89 –947
Cash flow from financing activities
Dividends paid –7 305 –6 681
Redemption of shares –7 305 –
Repurchase and divestment of own shares –453 890
Change in interest-bearing liabilities 2 203 –3 829
Net cash from financing activities –12 860 –9 620
Net cash flow for the year –842 –8 149
Cash and cash equivalents, Jan. 1 5 153 13 302
Net cash flow for the year –842 –8 149
Cash and cash equivalents, Dec. 31 4 311 5 153
FINANCIAL STATEMENTS, PARENT COMPANY
110 Atlas Copco 2015
NOTES TO THE PARENT COMPANY FINANCIAL STATEMENTS MSEK unless otherwise stated
A1. Significant accounting principles
Atlas Copco AB is the ultimate Parent Company of the Atlas Copco Group and is headquartered in Nacka, Sweden. Its operations include administrative functions, holding company functions as well as part of Financial Solutions.
The financial statements of Atlas Copco AB have been prepared in accor-dance with the Swedish Annual Accounts Act and the recommendation RFR 2, “Accounting for Legal Entities”, hereafter referred to as “RFR 2”, issued by the Swedish Financial Reporting Board. In accordance with RFR 2, parent companies that issue consolidated financial statements according to Interna-tional Financial Reporting Standards (IFRS), as endorsed by the European Union, shall present their financial statements in accordance with IFRS, to the extent these accounting principles comply with the Swedish Annual Accounts Act and may use exemptions from IFRS provided by RFR 2 due to Swedish accounting or tax legislation.
The financial statements are presented in Swedish kronor (SEK), rounded to the nearest million. The parent company’s accounting principles have been consistently applied to all periods presented unless otherwise stated. The financial statements are prepared using the same accounting principles as described in note 1 to the Group’s consolidated financial statements, except for those disclosed in the following sections.
For discussion regarding accounting estimates and judgments, see page 76.
SubsidiariesParticipations in subsidiaries are accounted for by the Parent Company at historical cost. The carrying amounts of participations in subsidiaries are reviewed for impairment in accordance with IAS 36, Impairment of Assets. See the Group’s accounting policies, Impairment of financial assets, for fur-ther details.
Transaction costs incurred in connection with a business combination are accounted for by the Parent Company as part of the acquisition costs and are not expensed.
Lease contractsAll lease contracts entered into by the Parent Company are accounted for as operating leases.
Employee benefits Defined benefit plansDefined benefit plans are not accounted for in accordance with IAS 19. In the Parent Company defined benefit plans are accounted for according to the Swedish law regarding pensions, ”Tryggandelagen” and regulations issued by the Swedish Financial Supervisory Board. The primary differences as com-pared to IAS 19 are the way discount rates are fixed, that the calculation of defined benefit obligations is based on current salary levels, without consider-ation of future salary increases and that all actuarial gains and losses are included in profit or loss as they occur.
Share-based paymentsThe share-based payments that the Parent Company has granted to employees in the Parent Company are accounted for using the same principle as described in note 1 in the Group’s consolidated financial statements.
The share-based payments that the Parent Company has granted to employees in subsidiaries are not accounted for as an employee expense in the Parent Company, but are recognized against Shares in Group companies. This vesting cost is accrued over the same period as in the Group and with a corre-sponding increase in equity for equity-settled programs and as a change in liabilities for cash-settled programs.
Financial guaranteesFinancial guarantees issued by the Parent Company for the benefit of subsid-iaries are not valued at fair value. They are reported as contingent liabilities, unless it becomes probable that the guarantees will lead to payments. In such case, provisions will be recorded.
Hedge accounting Interest-bearing liabilities denominated in other currencies than SEK, used to hedge currency exposure from investments in shares of foreign subsidiaries are not translated using the foreign exchange rates on the balance sheet date, but measured based on the exchange rate the day that the hedging relation was established.
Derivatives used to hedge investments in shares in foreign subsidiaries are recognized at fair value and changes therein are recognized in profit or loss. The corresponding fair value change on shares in subsidiaries is recognized in profit or loss.
Group and shareholders’ contributions In Sweden, Group contributions are deductible for tax purposes but share-holders’ contributions are not. Group contributions are recognized as appro-priations in the income statement. Shareholders’ contributions are recognized as an increase of Shares in Group companies and tested for impairment.
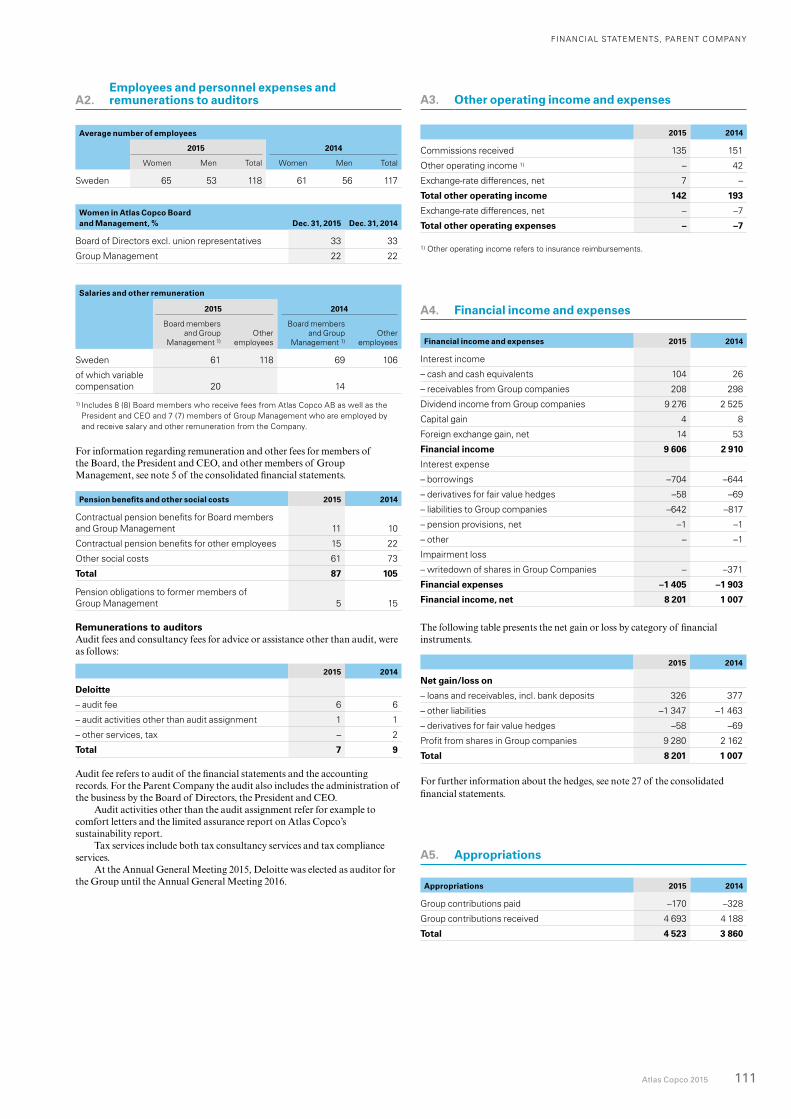
FINANCIAL STATEMENTS, PARENT COMPANY
Atlas Copco 2015 111
A2. Employees and personnel expenses and remunerations to auditors
Average number of employees
2015 2014
Women Men Total Women Men Total
Sweden 65 53 118 61 56 117
Women in Atlas Copco Board and Management, % Dec. 31, 2015 Dec. 31, 2014
Board of Directors excl. union representatives 33 33
Group Management 22 22
Salaries and other remuneration
2015 2014
Board members and Group
Management 1)Other
employees
Board members and Group
Management 1)Other
employees
Sweden 61 118 69 106
of which variable compensation 20 14
1) Includes 8 (8) Board members who receive fees from Atlas Copco AB as well as the President and CEO and 7 (7) members of Group Management who are employed by and receive salary and other remuneration from the Company.
For information regarding remuneration and other fees for members of the Board, the President and CEO, and other members of Group Management, see note 5 of the consolidated financial statements.
Pension benefits and other social costs 2015 2014
Contractual pension benefits for Board members and Group Management 11 10
Contractual pension benefits for other employees 15 22
Other social costs 61 73
Total 87 105
Pension obligations to former members of Group Management 5 15
Remunerations to auditorsAudit fees and consultancy fees for advice or assistance other than audit, were as follows:
2015 2014
Deloitte
– audit fee 6 6
– audit activities other than audit assignment 1 1
– other services, tax – 2
Total 7 9
Audit fee refers to audit of the financial statements and the accounting records. For the Parent Company the audit also includes the administration of the business by the Board of Directors, the President and CEO.
Audit activities other than the audit assignment refer for example to comfort letters and the limited assurance report on Atlas Copco’ssustainability report.
Tax services include both tax consultancy services and tax compliance services.
At the Annual General Meeting 2015, Deloitte was elected as auditor for the Group until the Annual General Meeting 2016.
A4. Financial income and expenses
Financial income and expenses 2015 2014
Interest income
– cash and cash equivalents 104 26
– receivables from Group companies 208 298
Dividend income from Group companies 9 276 2 525
Capital gain 4 8
Foreign exchange gain, net 14 53
Financial income 9 606 2 910
Interest expense
– borrowings –704 –644
– derivatives for fair value hedges –58 –69
– liabilities to Group companies –642 –817
– pension provisions, net –1 –1
– other – –1
Impairment loss
– writedown of shares in Group Companies – –371
Financial expenses –1 405 –1 903
Financial income, net 8 201 1 007
The following table presents the net gain or loss by category of financial instruments.
2015 2014
Net gain/loss on
– loans and receivables, incl. bank deposits 326 377
– other liabilities –1 347 –1 463
– derivatives for fair value hedges –58 –69
Profit from shares in Group companies 9 280 2 162
Total 8 201 1 007
For further information about the hedges, see note 27 of the consolidated financial statements.
A5. Appropriations
Appropriations 2015 2014
Group contributions paid –170 –328
Group contributions received 4 693 4 188
Total 4 523 3 860
A3. Other operating income and expenses
2015 2014
Commissions received 135 151
Other operating income 1) – 42
Exchange-rate differences, net 7 –
Total other operating income 142 193
Exchange-rate differences, net – –7
Total other operating expenses – –7
1) Other operating income refers to insurance reimbursements.
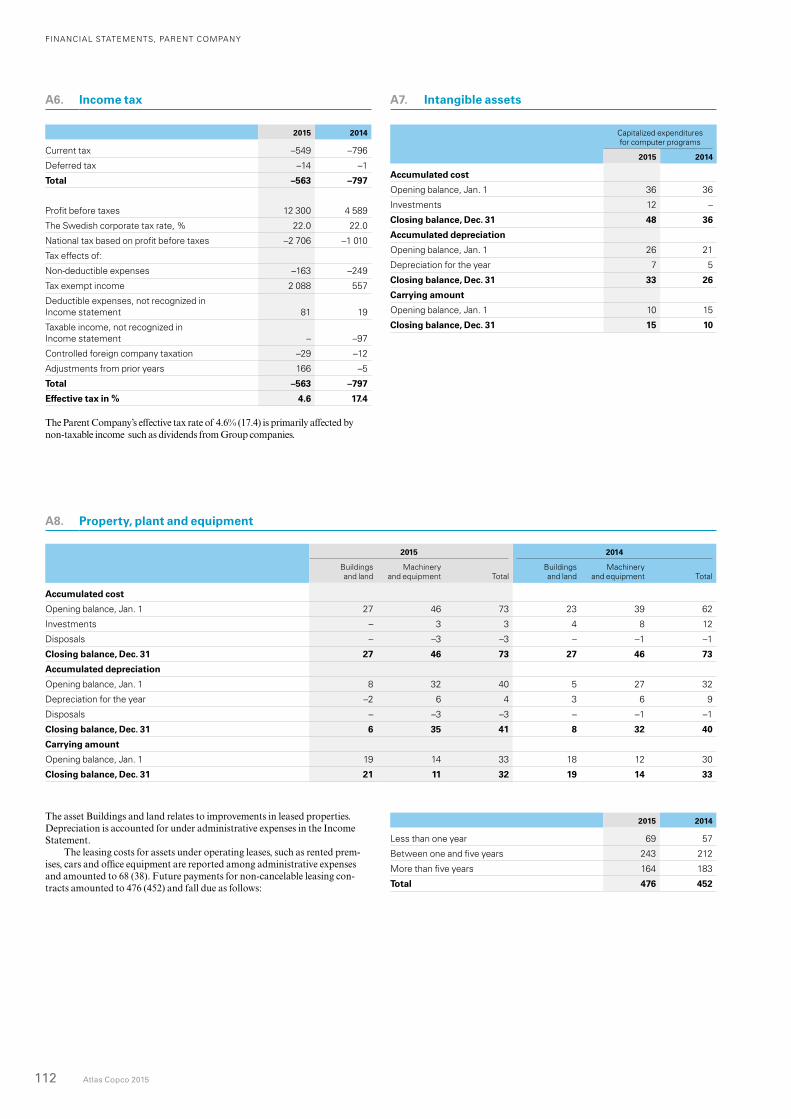
FINANCIAL STATEMENTS, PARENT COMPANY
112 Atlas Copco 2015
2015 2014
Less than one year 69 57
Between one and five years 243 212
More than five years 164 183
Total 476 452
The asset Buildings and land relates to improvements in leased properties. Depreciation is accounted for under administrative expenses in the Income Statement.
The leasing costs for assets under operating leases, such as rented prem-ises, cars and office equipment are reported among administrative expenses and amounted to 68 (38). Future payments for non-cancelable leasing con-tracts amounted to 476 (452) and fall due as follows:
A8. Property, plant and equipment
2015 2014
Buildings and land
Machinery and equipment Total
Buildings and land
Machinery and equipment Total
Accumulated cost
Opening balance, Jan. 1 27 46 73 23 39 62
Investments – 3 3 4 8 12
Disposals – –3 –3 – –1 –1
Closing balance, Dec. 31 27 46 73 27 46 73
Accumulated depreciation
Opening balance, Jan. 1 8 32 40 5 27 32
Depreciation for the year –2 6 4 3 6 9
Disposals – –3 –3 – –1 –1
Closing balance, Dec. 31 6 35 41 8 32 40
Carrying amount
Opening balance, Jan. 1 19 14 33 18 12 30
Closing balance, Dec. 31 21 11 32 19 14 33
A6. Income tax
2015 2014
Current tax –549 –796
Deferred tax –14 –1
Total –563 –797
Profit before taxes 12 300 4 589
The Swedish corporate tax rate, % 22.0 22.0
National tax based on profit before taxes –2 706 –1 010
Tax effects of:
Non-deductible expenses –163 –249
Tax exempt income 2 088 557
Deductible expenses, not recognized in Income statement 81 19
Taxable income, not recognized in Income statement – –97
Controlled foreign company taxation –29 –12
Adjustments from prior years 166 –5
Total –563 –797
Effective tax in % 4.6 17.4
The Parent Company’s effective tax rate of 4.6% (17.4) is primarily affected by non-taxable income such as dividends from Group companies.
A7. Intangible assets
Capitalized expenditures for computer programs
2015 2014
Accumulated cost
Opening balance, Jan. 1 36 36
Investments 12 –
Closing balance, Dec. 31 48 36
Accumulated depreciation
Opening balance, Jan. 1 26 21
Depreciation for the year 7 5
Closing balance, Dec. 31 33 26
Carrying amount
Opening balance, Jan. 1 10 15
Closing balance, Dec. 31 15 10
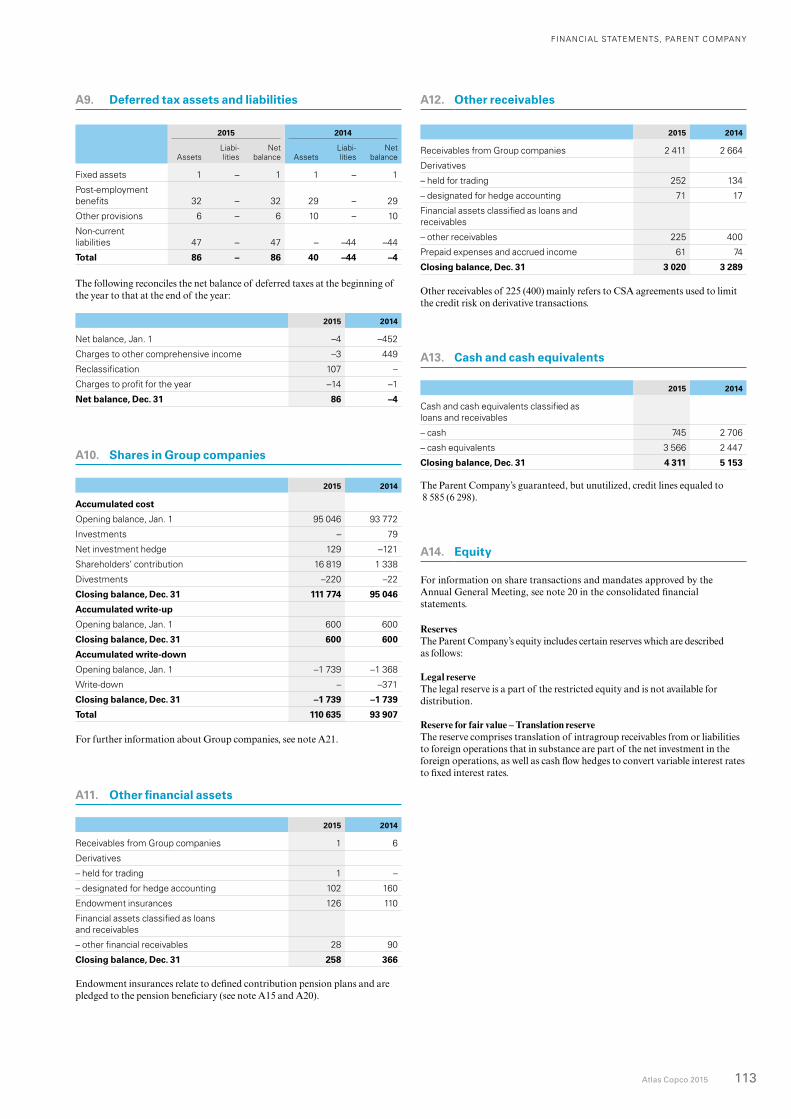
FINANCIAL STATEMENTS, PARENT COMPANY
Atlas Copco 2015 113
A9. Deferred tax assets and liabilities
2015 2014
AssetsLiabi- lities
Net balance Assets
Liabi- lities
Net balance
Fixed assets 1 – 1 1 – 1
Post-employment benefits 32 – 32 29 – 29
Other provisions 6 – 6 10 – 10
Non-current liabilities 47 – 47 – –44 –44
Total 86 – 86 40 –44 –4
The following reconciles the net balance of deferred taxes at the beginning of the year to that at the end of the year:
2015 2014
Net balance, Jan. 1 –4 –452
Charges to other comprehensive income –3 449
Reclassification 107 –
Charges to profit for the year –14 –1
Net balance, Dec. 31 86 –4
A10. Shares in Group companies
2015 2014
Accumulated cost
Opening balance, Jan. 1 95 046 93 772
Investments – 79
Net investment hedge 129 –121
Shareholders’ contribution 16 819 1 338
Divestments –220 –22
Closing balance, Dec. 31 111 774 95 046
Accumulated write-up
Opening balance, Jan. 1 600 600
Closing balance, Dec. 31 600 600
Accumulated write-down
Opening balance, Jan. 1 –1 739 –1 368
Write-down – –371
Closing balance, Dec. 31 –1 739 –1 739
Total 110 635 93 907
For further information about Group companies, see note A21.
A11. Other financial assets
2015 2014
Receivables from Group companies 1 6
Derivatives
– held for trading 1 –
– designated for hedge accounting 102 160
Endowment insurances 126 110
Financial assets classified as loans and receivables
– other financial receivables 28 90
Closing balance, Dec. 31 258 366
Endowment insurances relate to defined contribution pension plans and are pledged to the pension beneficiary (see note A15 and A20).
A12. Other receivables
2015 2014
Receivables from Group companies 2 411 2 664
Derivatives
– held for trading 252 134
– designated for hedge accounting 71 17
Financial assets classified as loans and receivables
– other receivables 225 400
Prepaid expenses and accrued income 61 74
Closing balance, Dec. 31 3 020 3 289
Other receivables of 225 (400) mainly refers to CSA agreements used to limit the credit risk on derivative transactions.
A13. Cash and cash equivalents
2015 2014
Cash and cash equivalents classified as loans and receivables
– cash 745 2 706
– cash equivalents 3 566 2 447
Closing balance, Dec. 31 4 311 5 153 The Parent Company’s guaranteed, but unutilized, credit lines equaled to 8 585 (6 298).
A14. Equity
For information on share transactions and mandates approved by the Annual General Meeting, see note 20 in the consolidated financial statements.
ReservesThe Parent Company’s equity includes certain reserves which are described as follows:
Legal reserveThe legal reserve is a part of the restricted equity and is not available for distribution.
Reserve for fair value – Translation reserveThe reserve comprises translation of intragroup receivables from or liabilities to foreign operations that in substance are part of the net investment in the foreign operations, as well as cash flow hedges to convert variable interest rates to fixed interest rates.
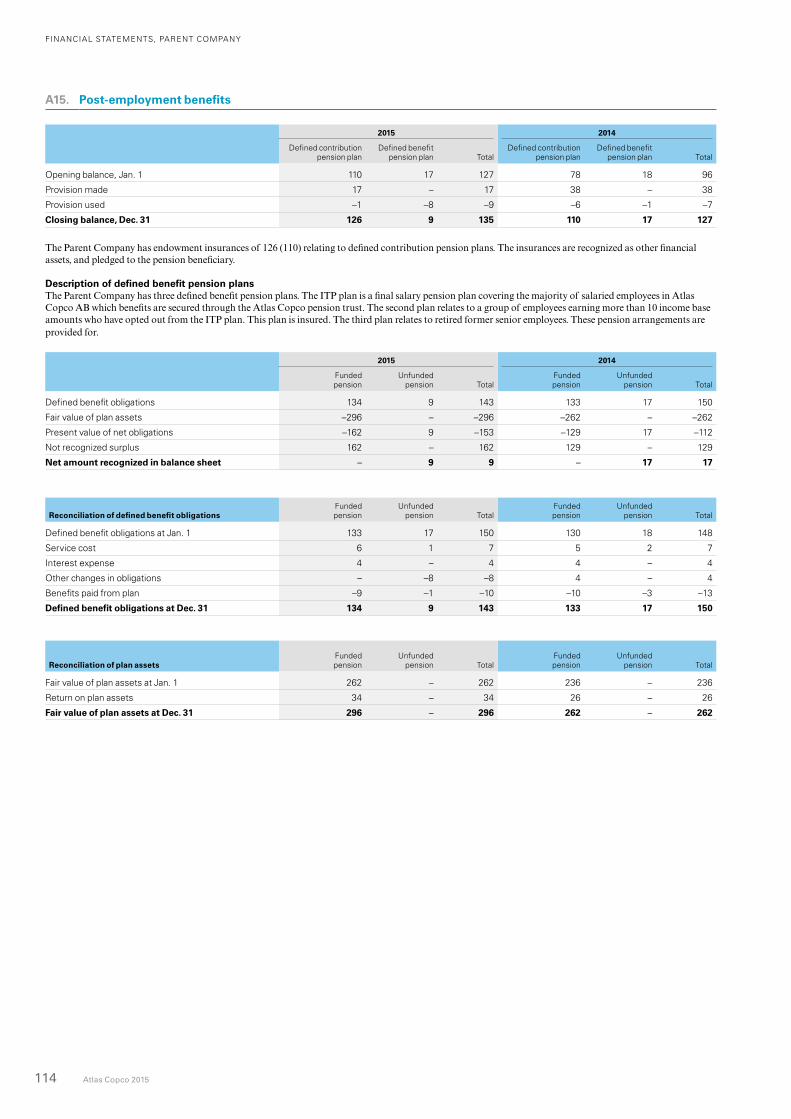
FINANCIAL STATEMENTS, PARENT COMPANY
114 Atlas Copco 2015
A15. Post-employment benefits
2015 2014
Defined contribution pension plan
Defined benefit pension plan Total
Defined contribution pension plan
Defined benefit pension plan Total
Opening balance, Jan. 1 110 17 127 78 18 96
Provision made 17 – 17 38 – 38
Provision used –1 –8 –9 –6 –1 –7
Closing balance, Dec. 31 126 9 135 110 17 127
The Parent Company has endowment insurances of 126 (110) relating to defined contribution pension plans. The insurances are recognized as other financial assets, and pledged to the pension beneficiary.
Description of defined benefit pension plansThe Parent Company has three defined benefit pension plans. The ITP plan is a final salary pension plan covering the majority of salaried employees in Atlas Copco AB which benefits are secured through the Atlas Copco pension trust. The second plan relates to a group of employees earning more than 10 income base amounts who have opted out from the ITP plan. This plan is insured. The third plan relates to retired former senior employees. These pension arrangements are provided for.
2015 2014
Funded pension
Unfunded pension Total
Funded pension
Unfunded pension Total
Defined benefit obligations 134 9 143 133 17 150
Fair value of plan assets –296 – –296 –262 – –262
Present value of net obligations –162 9 –153 –129 17 –112
Not recognized surplus 162 – 162 129 – 129
Net amount recognized in balance sheet – 9 9 – 17 17
Reconciliation of defined benefit obligationsFunded pension
Unfunded pension Total
Funded pension
Unfunded pension Total
Defined benefit obligations at Jan. 1 133 17 150 130 18 148
Service cost 6 1 7 5 2 7
Interest expense 4 – 4 4 – 4
Other changes in obligations – –8 –8 4 – 4
Benefits paid from plan –9 –1 –10 –10 –3 –13
Defined benefit obligations at Dec. 31 134 9 143 133 17 150
Reconciliation of plan assetsFunded pension
Unfunded pension Total
Funded pension
Unfunded pension Total
Fair value of plan assets at Jan. 1 262 – 262 236 – 236
Return on plan assets 34 – 34 26 – 26
Fair value of plan assets at Dec. 31 296 – 296 262 – 262
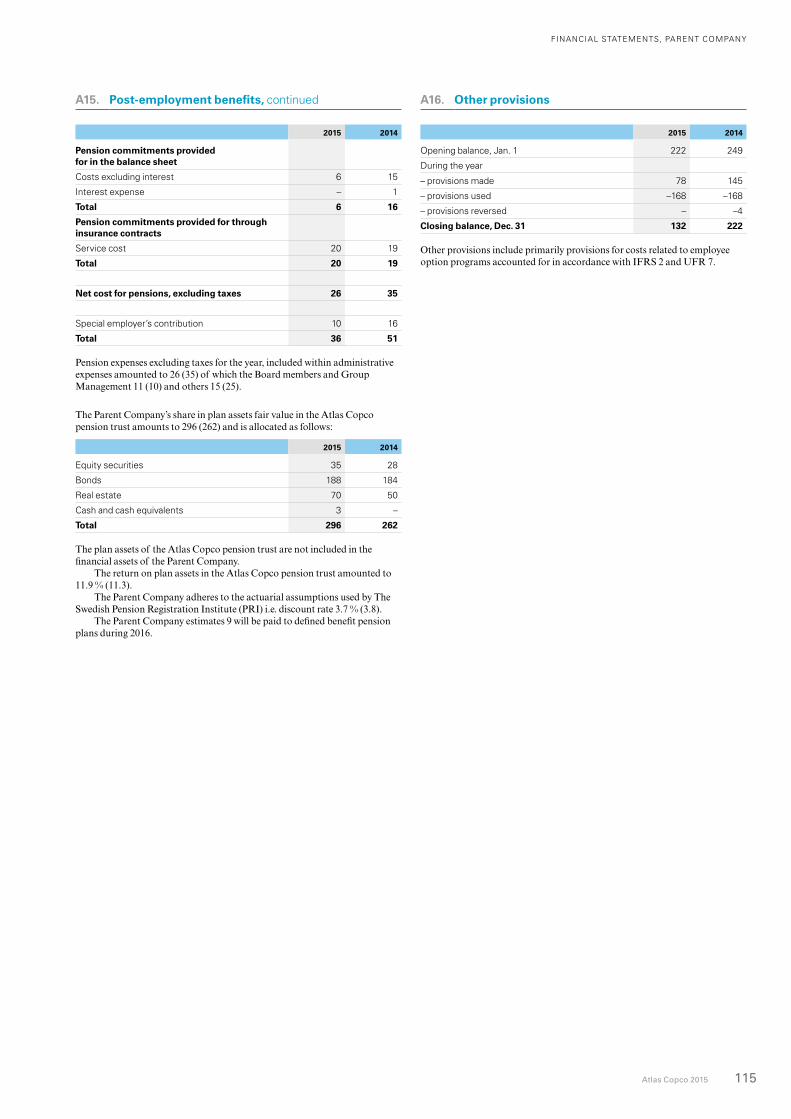
FINANCIAL STATEMENTS, PARENT COMPANY
Atlas Copco 2015 115
A16. Other provisions
2015 2014
Opening balance, Jan. 1 222 249
During the year
– provisions made 78 145
– provisions used –168 –168
– provisions reversed – –4
Closing balance, Dec. 31 132 222
Other provisions include primarily provisions for costs related to employee option programs accounted for in accordance with IFRS 2 and UFR 7.
A15. Post-employment benefits, continued
2015 2014
Pension commitments provided for in the balance sheet
Costs excluding interest 6 15
Interest expense – 1
Total 6 16
Pension commitments provided for through insurance contracts
Service cost 20 19
Total 20 19
Net cost for pensions, excluding taxes 26 35
Special employer’s contribution 10 16
Total 36 51
Pension expenses excluding taxes for the year, included within administrative expenses amounted to 26 (35) of which the Board members and Group Management 11 (10) and others 15 (25).
The Parent Company’s share in plan assets fair value in the Atlas Copco pension trust amounts to 296 (262) and is allocated as follows:
2015 2014
Equity securities 35 28
Bonds 188 184
Real estate 70 50
Cash and cash equivalents 3 –
Total 296 262
The plan assets of the Atlas Copco pension trust are not included in the financial assets of the Parent Company.
The return on plan assets in the Atlas Copco pension trust amounted to 11.9 % (11.3).
The Parent Company adheres to the actuarial assumptions used by The Swedish Pension Registration Institute (PRI) i.e. discount rate 3.7 % (3.8).
The Parent Company estimates 9 will be paid to defined benefit pension plans during 2016.
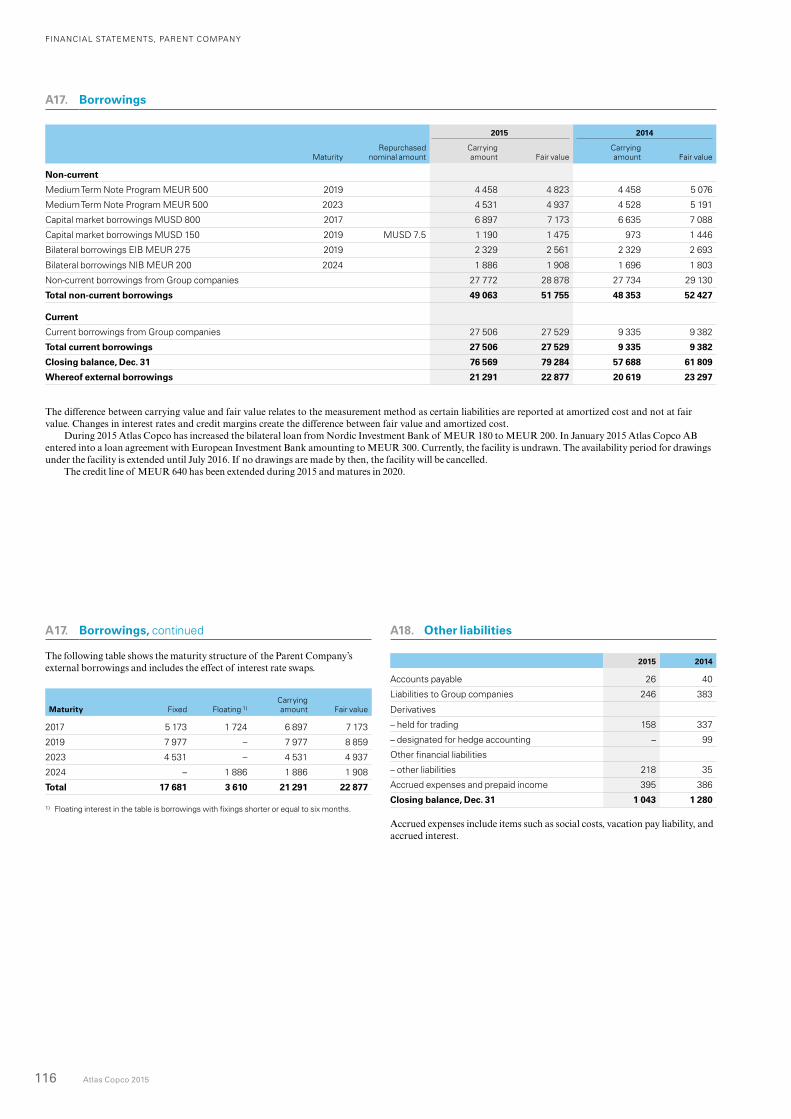
FINANCIAL STATEMENTS, PARENT COMPANY
116 Atlas Copco 2015
A17. Borrowings
2015 2014
MaturityRepurchased
nominal amountCarrying amount Fair value
Carrying amount Fair value
Non-current
Medium Term Note Program MEUR 500 2019 4 458 4 823 4 458 5 076
Medium Term Note Program MEUR 500 2023 4 531 4 937 4 528 5 191
Capital market borrowings MUSD 800 2017 6 897 7 173 6 635 7 088
Capital market borrowings MUSD 150 2019 MUSD 7.5 1 190 1 475 973 1 446
Bilateral borrowings EIB MEUR 275 2019 2 329 2 561 2 329 2 693
Bilateral borrowings NIB MEUR 200 2024 1 886 1 908 1 696 1 803
Non-current borrowings from Group companies 27 772 28 878 27 734 29 130
Total non-current borrowings 49 063 51 755 48 353 52 427
Current
Current borrowings from Group companies 27 506 27 529 9 335 9 382
Total current borrowings 27 506 27 529 9 335 9 382
Closing balance, Dec. 31 76 569 79 284 57 688 61 809
Whereof external borrowings 21 291 22 877 20 619 23 297
The difference between carrying value and fair value relates to the measurement method as certain liabilities are reported at amortized cost and not at fair value. Changes in interest rates and credit margins create the difference between fair value and amortized cost.
During 2015 Atlas Copco has increased the bilateral loan from Nordic Investment Bank of MEUR 180 to MEUR 200. In January 2015 Atlas Copco AB entered into a loan agreement with European Investment Bank amounting to MEUR 300. Currently, the facility is undrawn. The availability period for drawings under the facility is extended until July 2016. If no drawings are made by then, the facility will be cancelled.
The credit line of MEUR 640 has been extended during 2015 and matures in 2020.
A17. Borrowings, continued
The following table shows the maturity structure of the Parent Company’s external borrowings and includes the effect of interest rate swaps.
Maturity Fixed Floating 1)
Carrying amount Fair value
2017 5 173 1 724 6 897 7 173
2019 7 977 – 7 977 8 859
2023 4 531 – 4 531 4 937
2024 – 1 886 1 886 1 908
Total 17 681 3 610 21 291 22 877
1) Floating interest in the table is borrowings with fixings shorter or equal to six months.
A18. Other liabilities
2015 2014
Accounts payable 26 40
Liabilities to Group companies 246 383
Derivatives
– held for trading 158 337
– designated for hedge accounting – 99
Other financial liabilities
– other liabilities 218 35
Accrued expenses and prepaid income 395 386
Closing balance, Dec. 31 1 043 1 280
Accrued expenses include items such as social costs, vacation pay liability, and accrued interest.
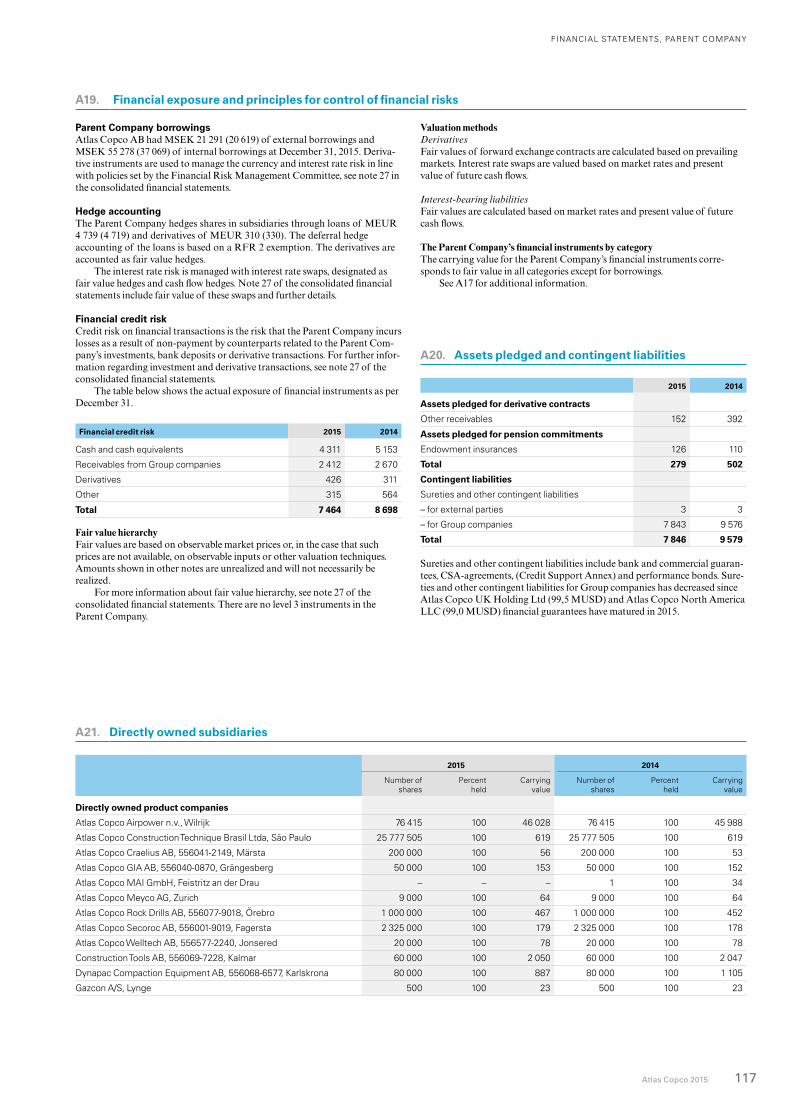
FINANCIAL STATEMENTS, PARENT COMPANY
Atlas Copco 2015 117
Parent Company borrowingsAtlas Copco AB had MSEK 21 291 (20 619) of external borrowings and MSEK 55 278 (37 069) of internal borrowings at December 31, 2015. Deriva-tive instruments are used to manage the currency and interest rate risk in line with policies set by the Financial Risk Management Committee, see note 27 in the consolidated financial statements.
Hedge accountingThe Parent Company hedges shares in subsidiaries through loans of MEUR 4 739 (4 719) and derivatives of MEUR 310 (330). The deferral hedge accounting of the loans is based on a RFR 2 exemption. The derivatives are accounted as fair value hedges.
The interest rate risk is managed with interest rate swaps, designated as fair value hedges and cash flow hedges. Note 27 of the consolidated financial statements include fair value of these swaps and further details.
Financial credit riskCredit risk on financial transactions is the risk that the Parent Company incurs losses as a result of non-payment by counterparts related to the Parent Com-pany’s investments, bank deposits or derivative transactions. For further infor-mation regarding investment and derivative transactions, see note 27 of the consolidated financial statements.
The table below shows the actual exposure of financial instruments as per December 31.
Financial credit risk 2015 2014
Cash and cash equivalents 4 311 5 153
Receivables from Group companies 2 412 2 670
Derivatives 426 311
Other 315 564
Total 7 464 8 698
Fair value hierarchyFair values are based on observable market prices or, in the case that such prices are not available, on observable inputs or other valuation techniques. Amounts shown in other notes are unrealized and will not necessarily be realized.
For more information about fair value hierarchy, see note 27 of the consolidated financial statements. There are no level 3 instruments in the Parent Company.
A20. Assets pledged and contingent liabilities
2015 2014
Assets pledged for derivative contracts
Other receivables 152 392
Assets pledged for pension commitments
Endowment insurances 126 110
Total 279 502
Contingent liabilities
Sureties and other contingent liabilities
– for external parties 3 3
– for Group companies 7 843 9 576
Total 7 846 9 579
Sureties and other contingent liabilities include bank and commercial guaran-tees, CSA-agreements, (Credit Support Annex) and performance bonds. Sure-ties and other contingent liabilities for Group companies has decreased since Atlas Copco UK Holding Ltd (99,5 MUSD) and Atlas Copco North America LLC (99,0 MUSD) financial guarantees have matured in 2015.
Valuation methodsDerivativesFair values of forward exchange contracts are calculated based on pre vailing markets. Interest rate swaps are valued based on market rates and present value of future cash flows.
Interest-bearing liabilitiesFair values are calculated based on market rates and present value of future cash flows.
The Parent Company’s financial instruments by categoryThe carrying value for the Parent Company’s financial instruments corre-sponds to fair value in all categories except for borrowings.
See A17 for additional information.
A21. Directly owned subsidiaries
2015 2014
Number of shares
Percent held
Carrying value
Number of shares
Percent held
Carrying value
Directly owned product companies
Atlas Copco Airpower n.v., Wilrijk 76 415 100 46 028 76 415 100 45 988
Atlas Copco Construction Technique Brasil Ltda, São Paulo 25 777 505 100 619 25 777 505 100 619
Atlas Copco Craelius AB, 556041-2149, Märsta 200 000 100 56 200 000 100 53
Atlas Copco GIA AB, 556040-0870, Grängesberg 50 000 100 153 50 000 100 152
Atlas Copco MAI GmbH, Feistritz an der Drau – – – 1 100 34
Atlas Copco Meyco AG, Zurich 9 000 100 64 9 000 100 64
Atlas Copco Rock Drills AB, 556077-9018, Örebro 1 000 000 100 467 1 000 000 100 452
Atlas Copco Secoroc AB, 556001-9019, Fagersta 2 325 000 100 179 2 325 000 100 178
Atlas Copco Welltech AB, 556577-2240, Jonsered 20 000 100 78 20 000 100 78
Construction Tools AB, 556069-7228, Kalmar 60 000 100 2 050 60 000 100 2 047
Dynapac Compaction Equipment AB, 556068-6577, Karlskrona 80 000 100 887 80 000 100 1 105
Gazcon A/S, Lynge 500 100 23 500 100 23
A19. Financial exposure and principles for control of financial risks
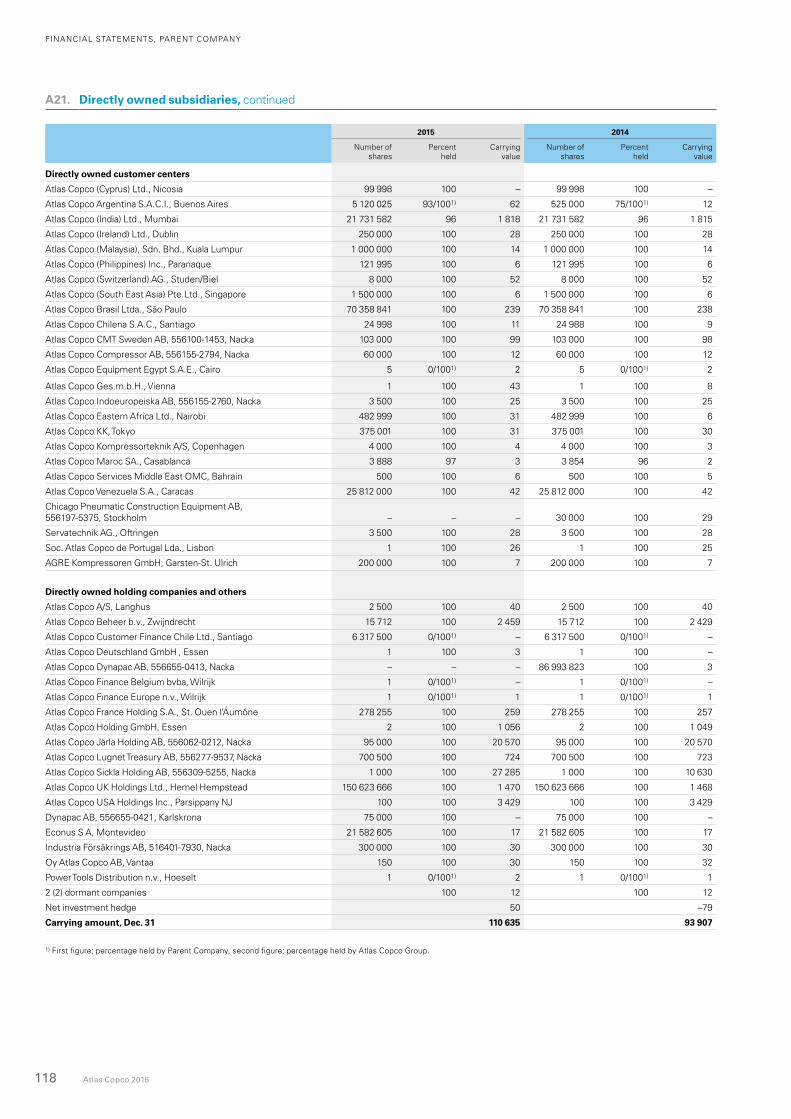
FINANCIAL STATEMENTS, PARENT COMPANY
118 Atlas Copco 2015
2015 2014
Number of shares
Percent held
Carrying value
Number of shares
Percent held
Carrying value
Directly owned customer centers
Atlas Copco (Cyprus) Ltd., Nicosia 99 998 100 – 99 998 100 –
Atlas Copco Argentina S.A.C.I., Buenos Aires 5 120 025 93/1001) 62 525 000 75/1001) 12
Atlas Copco (India) Ltd., Mumbai 21 731 582 96 1 818 21 731 582 96 1 815
Atlas Copco (Ireland) Ltd., Dublin 250 000 100 28 250 000 100 28
Atlas Copco (Malaysia), Sdn. Bhd., Kuala Lumpur 1 000 000 100 14 1 000 000 100 14
Atlas Copco (Philippines) Inc., Paranaque 121 995 100 6 121 995 100 6
Atlas Copco (Switzerland) AG., Studen/Biel 8 000 100 52 8 000 100 52
Atlas Copco (South East Asia) Pte.Ltd., Singapore 1 500 000 100 6 1 500 000 100 6
Atlas Copco Brasil Ltda., São Paulo 70 358 841 100 239 70 358 841 100 238
Atlas Copco Chilena S.A.C., Santiago 24 998 100 11 24 988 100 9
Atlas Copco CMT Sweden AB, 556100-1453, Nacka 103 000 100 99 103 000 100 98
Atlas Copco Compressor AB, 556155-2794, Nacka 60 000 100 12 60 000 100 12
Atlas Copco Equipment Egypt S.A.E., Cairo 5 0/1001) 2 5 0/1001) 2
Atlas Copco Ges.m.b.H., Vienna 1 100 43 1 100 8
Atlas Copco Indoeuropeiska AB, 556155-2760, Nacka 3 500 100 25 3 500 100 25
Atlas Copco Eastern Africa Ltd., Nairobi 482 999 100 31 482 999 100 6
Atlas Copco KK, Tokyo 375 001 100 31 375 001 100 30
Atlas Copco Kompressorteknik A/S, Copenhagen 4 000 100 4 4 000 100 3
Atlas Copco Maroc SA., Casablanca 3 888 97 3 3 854 96 2
Atlas Copco Services Middle East OMC, Bahrain 500 100 6 500 100 5
Atlas Copco Venezuela S.A., Caracas 25 812 000 100 42 25 812 000 100 42
Chicago Pneumatic Construction Equipment AB, 556197-5375, Stockholm – – – 30 000 100 29
Servatechnik AG., Oftringen 3 500 100 28 3 500 100 28
Soc. Atlas Copco de Portugal Lda., Lisbon 1 100 26 1 100 25
AGRE Kompressoren GmbH, Garsten-St. Ulrich 200 000 100 7 200 000 100 7
Directly owned holding companies and others
Atlas Copco A/S, Langhus 2 500 100 40 2 500 100 40
Atlas Copco Beheer b.v., Zwijndrecht 15 712 100 2 459 15 712 100 2 429
Atlas Copco Customer Finance Chile Ltd., Santiago 6 317 500 0/1001) – 6 317 500 0/1001) –
Atlas Copco Deutschland GmbH , Essen 1 100 3 1 100 –
Atlas Copco Dynapac AB, 556655-0413, Nacka – – – 86 993 823 100 3
Atlas Copco Finance Belgium bvba, Wilrijk 1 0/1001) – 1 0/1001) –
Atlas Copco Finance Europe n.v., Wilrijk 1 0/1001) 1 1 0/1001) 1
Atlas Copco France Holding S.A., St. Ouen l’Áumône 278 255 100 259 278 255 100 257
Atlas Copco Holding GmbH, Essen 2 100 1 056 2 100 1 049
Atlas Copco Järla Holding AB, 556062-0212, Nacka 95 000 100 20 570 95 000 100 20 570
Atlas Copco Lugnet Treasury AB, 556277-9537, Nacka 700 500 100 724 700 500 100 723
Atlas Copco Sickla Holding AB, 556309-5255, Nacka 1 000 100 27 285 1 000 100 10 630
Atlas Copco UK Holdings Ltd., Hemel Hempstead 150 623 666 100 1 470 150 623 666 100 1 468
Atlas Copco USA Holdings Inc., Parsippany NJ 100 100 3 429 100 100 3 429
Dynapac AB, 556655-0421, Karlskrona 75 000 100 – 75 000 100 –
Econus S A, Montevideo 21 582 605 100 17 21 582 605 100 17
Industria Försäkrings AB, 516401-7930, Nacka 300 000 100 30 300 000 100 30
Oy Atlas Copco AB, Vantaa 150 100 30 150 100 32
Power Tools Distribution n.v., Hoeselt 1 0/1001) 2 1 0/1001) 1
2 (2) dormant companies 100 12 100 12
Net investment hedge 50 –79
Carrying amount, Dec. 31 110 635 93 907
1) First figure; percentage held by Parent Company, second figure; percentage held by Atlas Copco Group.
A21. Directly owned subsidiaries, continued
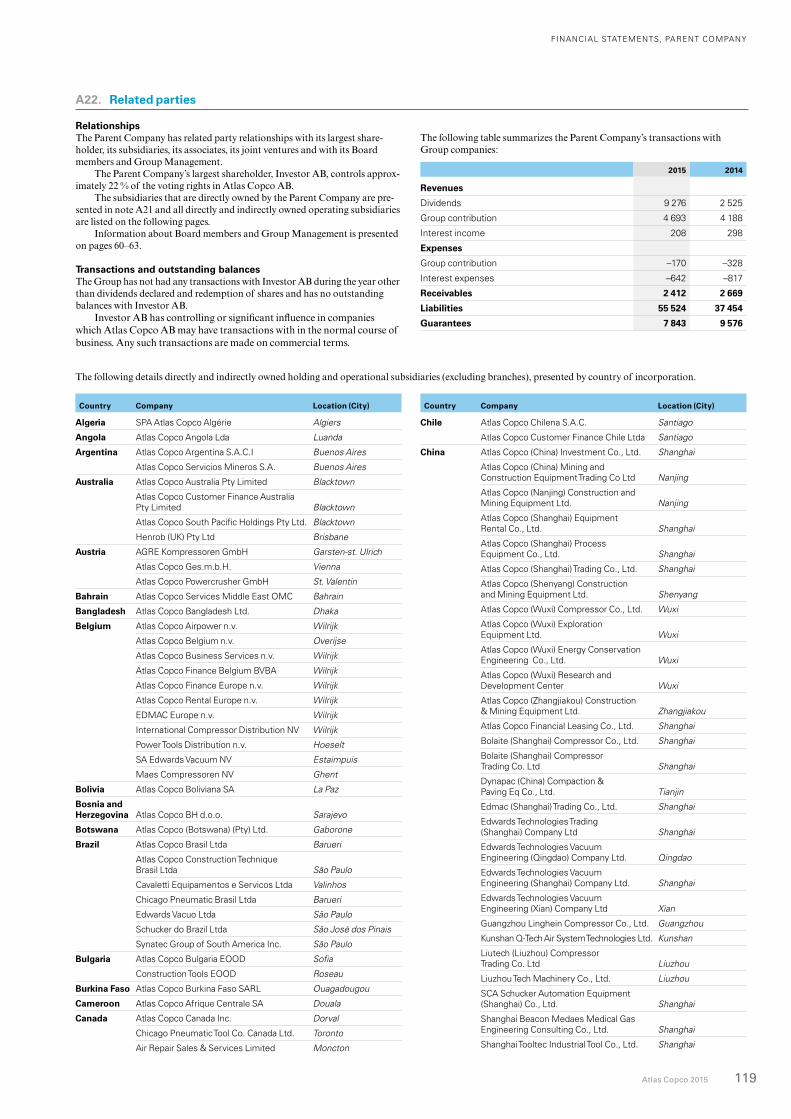
FINANCIAL STATEMENTS, PARENT COMPANY
Atlas Copco 2015 119
A22. Related parties
RelationshipsThe Parent Company has related party relationships with its largest share-holder, its subsidiaries, its associates, its joint ventures and with its Board members and Group Management.
The Parent Company’s largest shareholder, Investor AB, controls approx-imately 22 % of the voting rights in Atlas Copco AB.
The subsidiaries that are directly owned by the Parent Company are pre-sented in note A21 and all directly and indirectly owned operating subsidiaries are listed on the following pages.
Information about Board members and Group Management is presented on pages 60–63. Transactions and outstanding balancesThe Group has not had any transactions with Investor AB during the year other than dividends declared and redemption of shares and has no outstanding balances with Investor AB.
Investor AB has controlling or significant influence in companies which Atlas Copco AB may have transactions with in the normal course of business. Any such transactions are made on com mercial terms.
The following details directly and indirectly owned holding and operational subsidiaries (excluding branches), presented by country of incorporation.
Country Company Location (City) Country Company Location (City)
Algeria SPA Atlas Copco Algérie Algiers
Angola Atlas Copco Angola Lda Luanda
Argentina Atlas Copco Argentina S.A.C.I Buenos Aires
Atlas Copco Servicios Mineros S.A. Buenos Aires
Australia Atlas Copco Australia Pty Limited Blacktown
Atlas Copco Customer Finance Australia Pty Limited Blacktown
Atlas Copco South Pacific Holdings Pty Ltd. Blacktown
Henrob (UK) Pty Ltd Brisbane
Austria AGRE Kompressoren GmbH Garsten-st. Ulrich
Atlas Copco Ges.m.b.H. Vienna
Atlas Copco Powercrusher GmbH St. Valentin
Bahrain Atlas Copco Services Middle East OMC Bahrain
Bangladesh Atlas Copco Bangladesh Ltd. Dhaka
Belgium Atlas Copco Airpower n.v. Wilrijk
Atlas Copco Belgium n.v. Overijse
Atlas Copco Business Services n.v. Wilrijk
Atlas Copco Finance Belgium BVBA Wilrijk
Atlas Copco Finance Europe n.v. Wilrijk
Atlas Copco Rental Europe n.v. Wilrijk
EDMAC Europe n.v. Wilrijk
International Compressor Distribution NV Wilrijk
Power Tools Distribution n.v. Hoeselt
SA Edwards Vacuum NV Estaimpuis
Maes Compressoren NV Ghent
Bolivia Atlas Copco Boliviana SA La Paz
Bosnia and Herzegovina Atlas Copco BH d.o.o. Sarajevo
Botswana Atlas Copco (Botswana) (Pty) Ltd. Gaborone
Brazil Atlas Copco Brasil Ltda Barueri
Atlas Copco Construction Technique Brasil Ltda São Paulo
Cavaletti Equipamentos e Servicos Ltda Valinhos
Chicago Pneumatic Brasil Ltda Barueri
Edwards Vacuo Ltda São Paulo
Schucker do Brazil Ltda São José dos Pinais
Synatec Group of South America Inc. São Paulo
Bulgaria Atlas Copco Bulgaria EOOD Sofia
Construction Tools EOOD Roseau
Burkina Faso Atlas Copco Burkina Faso SARL Ouagadougou
Cameroon Atlas Copco Afrique Centrale SA Douala
Canada Atlas Copco Canada Inc. Dorval
Chicago Pneumatic Tool Co. Canada Ltd. Toronto
Air Repair Sales & Services Limited Moncton
Chile Atlas Copco Chilena S.A.C. Santiago
Atlas Copco Customer Finance Chile Ltda Santiago
China Atlas Copco (China) Investment Co., Ltd. Shanghai
Atlas Copco (China) Mining and Construction Equipment Trading Co Ltd Nanjing
Atlas Copco (Nanjing) Construction and Mining Equipment Ltd. Nanjing
Atlas Copco (Shanghai) Equipment Rental Co., Ltd. Shanghai
Atlas Copco (Shanghai) Process Equipment Co., Ltd. Shanghai
Atlas Copco (Shanghai) Trading Co., Ltd. Shanghai
Atlas Copco (Shenyang) Construction and Mining Equipment Ltd. Shenyang
Atlas Copco (Wuxi) Compressor Co., Ltd. Wuxi
Atlas Copco (Wuxi) Exploration Equipment Ltd. Wuxi
Atlas Copco (Wuxi) Energy Conservation Engineering Co., Ltd. Wuxi
Atlas Copco (Wuxi) Research and Development Center Wuxi
Atlas Copco (Zhangjiakou) Construction & Mining Equipment Ltd. Zhangjiakou
Atlas Copco Financial Leasing Co., Ltd. Shanghai
Bolaite (Shanghai) Compressor Co., Ltd. Shanghai
Bolaite (Shanghai) Compressor Trading Co. Ltd Shanghai
Dynapac (China) Compaction & Paving Eq Co., Ltd. Tianjin
Edmac (Shanghai) Trading Co., Ltd. Shanghai
Edwards Technologies Trading (Shanghai) Company Ltd Shanghai
Edwards Technologies Vacuum Engineering (Qingdao) Company Ltd. Qingdao
Edwards Technologies Vacuum Engineering (Shanghai) Company Ltd. Shanghai
Edwards Technologies Vacuum Engineering (Xian) Company Ltd Xian
Guangzhou Linghein Compressor Co., Ltd. Guangzhou
Kunshan Q-Tech Air System Technologies Ltd. Kunshan
Liutech (Liuzhou) Compressor Trading Co. Ltd Liuzhou
Liuzhou Tech Machinery Co., Ltd. Liuzhou
SCA Schucker Automation Equipment (Shanghai) Co., Ltd. Shanghai
Shanghai Beacon Medaes Medical Gas Engineering Consulting Co., Ltd. Shanghai
Shanghai Tooltec Industrial Tool Co., Ltd. Shanghai
The following table summarizes the Parent Company’s transactions with Group companies:
2015 2014
Revenues
Dividends 9 276 2 525
Group contribution 4 693 4 188
Interest income 208 298
Expenses
Group contribution –170 –328
Interest expenses –642 –817
Receivables 2 412 2 669
Liabilities 55 524 37 454
Guarantees 7 843 9 576
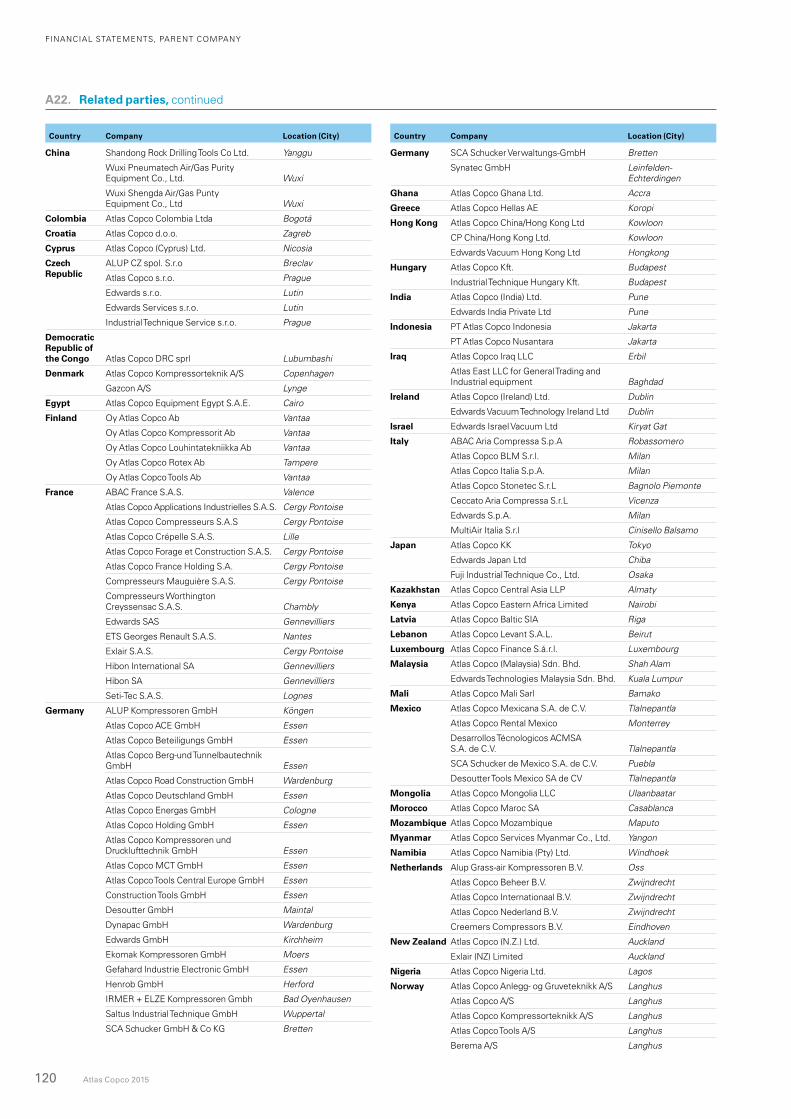
FINANCIAL STATEMENTS, PARENT COMPANY
120 Atlas Copco 2015
A22. Related parties, continued
China Shandong Rock Drilling Tools Co Ltd. Yanggu
Wuxi Pneumatech Air/Gas Purity Equipment Co., Ltd. Wuxi
Wuxi Shengda Air/Gas Punty Equipment Co., Ltd Wuxi
Colombia Atlas Copco Colombia Ltda Bogotá
Croatia Atlas Copco d.o.o. Zagreb
Cyprus Atlas Copco (Cyprus) Ltd. Nicosia
Czech ALUP CZ spol. S.r.o BreclavRepublic Atlas Copco s.r.o. Prague
Edwards s.r.o. Lutin
Edwards Services s.r.o. Lutin
Industrial Technique Service s.r.o. Prague
Democratic Republic of the Congo Atlas Copco DRC sprl Lubumbashi
Denmark Atlas Copco Kompressorteknik A/S Copenhagen
Gazcon A/S Lynge
Egypt Atlas Copco Equipment Egypt S.A.E. Cairo
Finland Oy Atlas Copco Ab Vantaa
Oy Atlas Copco Kompressorit Ab Vantaa
Oy Atlas Copco Louhintatekniikka Ab Vantaa
Oy Atlas Copco Rotex Ab Tampere
Oy Atlas Copco Tools Ab Vantaa
France ABAC France S.A.S. Valence
Atlas Copco Applications Industrielles S.A.S. Cergy Pontoise
Atlas Copco Compresseurs S.A.S Cergy Pontoise
Atlas Copco Crépelle S.A.S. Lille
Atlas Copco Forage et Construction S.A.S. Cergy Pontoise
Atlas Copco France Holding S.A. Cergy Pontoise
Compresseurs Mauguière S.A.S. Cergy Pontoise
Compresseurs Worthington Creyssensac S.A.S. Chambly
Edwards SAS Gennevilliers
ETS Georges Renault S.A.S. Nantes
Exlair S.A.S. Cergy Pontoise
Hibon International SA Gennevilliers
Hibon SA Gennevilliers
Seti-Tec S.A.S. Lognes
Germany ALUP Kompressoren GmbH Köngen
Atlas Copco ACE GmbH Essen
Atlas Copco Beteiligungs GmbH Essen
Atlas Copco Berg-und Tunnelbautechnik GmbH Essen
Atlas Copco Road Construction GmbH Wardenburg
Atlas Copco Deutschland GmbH Essen
Atlas Copco Energas GmbH Cologne
Atlas Copco Holding GmbH Essen
Atlas Copco Kompressoren und Drucklufttechnik GmbH Essen
Atlas Copco MCT GmbH Essen
Atlas Copco Tools Central Europe GmbH Essen
Construction Tools GmbH Essen
Desoutter GmbH Maintal
Dynapac GmbH Wardenburg
Edwards GmbH Kirchheim
Ekomak Kompressoren GmbH Moers
Gefahard Industrie Electronic GmbH Essen
Henrob GmbH Herford
IRMER + ELZE Kompressoren Gmbh Bad Oyenhausen
Saltus Industrial Technique GmbH Wuppertal
SCA Schucker GmbH & Co KG Bretten
Germany SCA Schucker Verwaltungs-GmbH Bretten
Synatec GmbH Leinfelden- Echterdingen
Ghana Atlas Copco Ghana Ltd. Accra
Greece Atlas Copco Hellas AE Koropi
Hong Kong Atlas Copco China/Hong Kong Ltd Kowloon
CP China/Hong Kong Ltd. Kowloon
Edwards Vacuum Hong Kong Ltd Hongkong
Hungary Atlas Copco Kft. Budapest
Industrial Technique Hungary Kft. Budapest
India Atlas Copco (India) Ltd. Pune
Edwards India Private Ltd Pune
Indonesia PT Atlas Copco Indonesia Jakarta
PT Atlas Copco Nusantara Jakarta
Iraq Atlas Copco Iraq LLC Erbil
Atlas East LLC for General Trading and Industrial equipment Baghdad
Ireland Atlas Copco (Ireland) Ltd. Dublin
Edwards Vacuum Technology Ireland Ltd Dublin
Israel Edwards Israel Vacuum Ltd Kiryat Gat
Italy ABAC Aria Compressa S.p.A Robassomero
Atlas Copco BLM S.r.l. Milan
Atlas Copco Italia S.p.A. Milan
Atlas Copco Stonetec S.r.L Bagnolo Piemonte
Ceccato Aria Compressa S.r.L Vicenza
Edwards S.p.A. Milan
MultiAir Italia S.r.l Cinisello Balsamo
Japan Atlas Copco KK Tokyo
Edwards Japan Ltd Chiba
Fuji Industrial Technique Co., Ltd. Osaka
Kazakhstan Atlas Copco Central Asia LLP Almaty
Kenya Atlas Copco Eastern Africa Limited Nairobi
Latvia Atlas Copco Baltic SIA Riga
Lebanon Atlas Copco Levant S.A.L. Beirut
Luxembourg Atlas Copco Finance S.á.r.l. Luxembourg
Malaysia Atlas Copco (Malaysia) Sdn. Bhd. Shah Alam
Edwards Technologies Malaysia Sdn. Bhd. Kuala Lumpur
Mali Atlas Copco Mali Sarl Bamako
Mexico Atlas Copco Mexicana S.A. de C.V. Tlalnepantla
Atlas Copco Rental Mexico Monterrey
Desarrollos Técnologicos ACMSA S.A. de C.V. Tlalnepantla
SCA Schucker de Mexico S.A. de C.V. Puebla
Desoutter Tools Mexico SA de CV Tlalnepantla
Mongolia Atlas Copco Mongolia LLC Ulaanbaatar
Morocco Atlas Copco Maroc SA Casablanca
Mozambique Atlas Copco Mozambique Maputo
Myanmar Atlas Copco Services Myanmar Co., Ltd. Yangon
Namibia Atlas Copco Namibia (Pty) Ltd. Windhoek
Netherlands Alup Grass-air Kompressoren B.V. Oss
Atlas Copco Beheer B.V. Zwijndrecht
Atlas Copco Internationaal B.V. Zwijndrecht
Atlas Copco Nederland B.V. Zwijndrecht
Creemers Compressors B.V. Eindhoven
New Zealand Atlas Copco (N.Z.) Ltd. Auckland
Exlair (NZ) Limited Auckland
Nigeria Atlas Copco Nigeria Ltd. Lagos
Norway Atlas Copco Anlegg- og Gruveteknikk A/S Langhus
Atlas Copco A/S Langhus
Atlas Copco Kompressorteknikk A/S Langhus
Atlas Copco Tools A/S Langhus
Berema A/S Langhus
Country Company Location (City) Country Company Location (City)
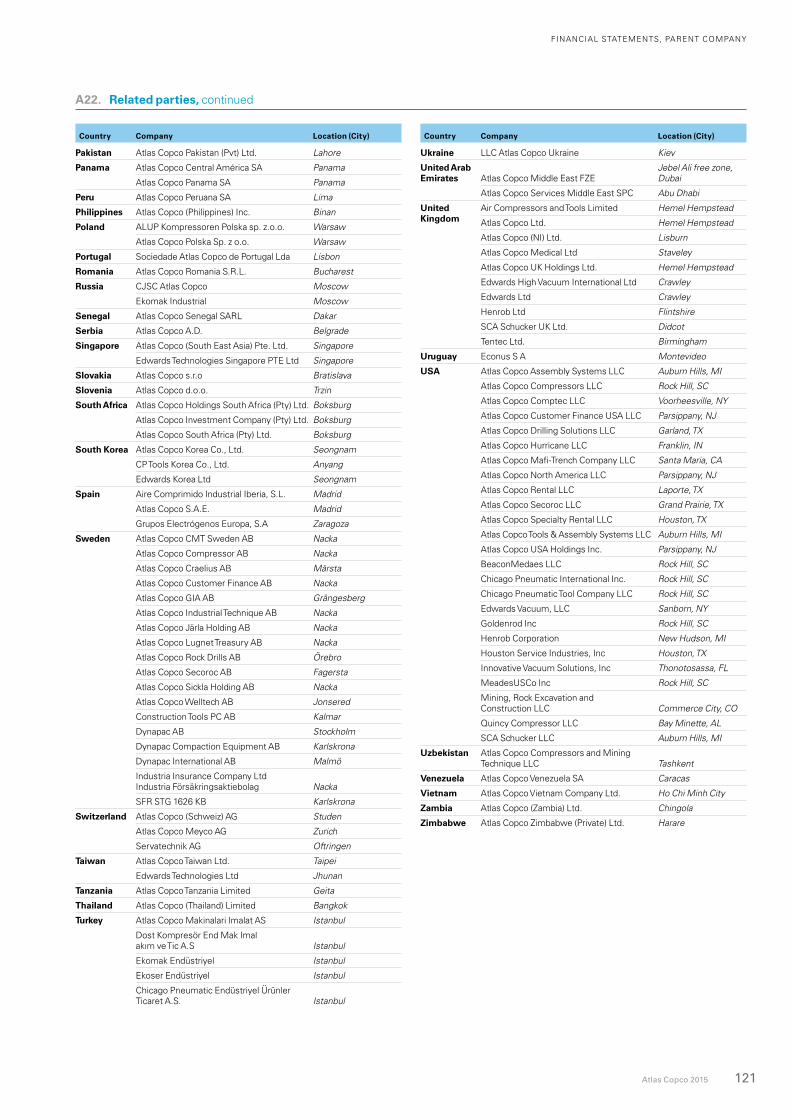
FINANCIAL STATEMENTS, PARENT COMPANY
Atlas Copco 2015 121
Pakistan Atlas Copco Pakistan (Pvt) Ltd. Lahore
Panama Atlas Copco Central América SA Panama
Atlas Copco Panama SA Panama
Peru Atlas Copco Peruana SA Lima
Philippines Atlas Copco (Philippines) Inc. Binan
Poland ALUP Kompressoren Polska sp. z.o.o. Warsaw
Atlas Copco Polska Sp. z o.o. Warsaw
Portugal Sociedade Atlas Copco de Portugal Lda Lisbon
Romania Atlas Copco Romania S.R.L. Bucharest
Russia CJSC Atlas Copco Moscow
Ekomak Industrial Moscow
Senegal Atlas Copco Senegal SARL Dakar
Serbia Atlas Copco A.D. Belgrade
Singapore Atlas Copco (South East Asia) Pte. Ltd. Singapore
Edwards Technologies Singapore PTE Ltd Singapore
Slovakia Atlas Copco s.r.o Bratislava
Slovenia Atlas Copco d.o.o. Trzin
South Africa Atlas Copco Holdings South Africa (Pty) Ltd. Boksburg
Atlas Copco Investment Company (Pty) Ltd. Boksburg
Atlas Copco South Africa (Pty) Ltd. Boksburg
South Korea Atlas Copco Korea Co., Ltd. Seongnam
CP Tools Korea Co., Ltd. Anyang
Edwards Korea Ltd Seongnam
Spain Aire Comprimido Industrial Iberia, S.L. Madrid
Atlas Copco S.A.E. Madrid
Grupos Electrógenos Europa, S.A Zaragoza
Sweden Atlas Copco CMT Sweden AB Nacka
Atlas Copco Compressor AB Nacka
Atlas Copco Craelius AB Märsta
Atlas Copco Customer Finance AB Nacka
Atlas Copco GIA AB Grängesberg
Atlas Copco Industrial Technique AB Nacka
Atlas Copco Järla Holding AB Nacka
Atlas Copco Lugnet Treasury AB Nacka
Atlas Copco Rock Drills AB Örebro
Atlas Copco Secoroc AB Fagersta
Atlas Copco Sickla Holding AB Nacka
Atlas Copco Welltech AB Jonsered
Construction Tools PC AB Kalmar
Dynapac AB Stockholm
Dynapac Compaction Equipment AB Karlskrona
Dynapac International AB Malmö
Industria Insurance Company Ltd Industria Försäkringsaktiebolag Nacka
SFR STG 1626 KB Karlskrona
Switzerland Atlas Copco (Schweiz) AG Studen
Atlas Copco Meyco AG Zurich
Servatechnik AG Oftringen
Taiwan Atlas Copco Taiwan Ltd. Taipei
Edwards Technologies Ltd Jhunan
Tanzania Atlas Copco Tanzania Limited Geita
Thailand Atlas Copco (Thailand) Limited Bangkok
Turkey Atlas Copco Makinalari Imalat AS Istanbul
Dost Kompresör End Mak Imal akım ve Tic A.S Istanbul
Ekomak Endüstriyel Istanbul
Ekoser Endüstriyel Istanbul
Chicago Pneumatic Endüstriyel Ürünler Ticaret A.S. Istanbul
Ukraine LLC Atlas Copco Ukraine Kiev
United Arab Emirates Atlas Copco Middle East FZE
Jebel Ali free zone, Dubai
Atlas Copco Services Middle East SPC Abu Dhabi
United Air Compressors and Tools Limited Hemel HempsteadKingdom Atlas Copco Ltd. Hemel Hempstead
Atlas Copco (NI) Ltd. Lisburn
Atlas Copco Medical Ltd Staveley
Atlas Copco UK Holdings Ltd. Hemel Hempstead
Edwards High Vacuum International Ltd Crawley
Edwards Ltd Crawley
Henrob Ltd Flintshire
SCA Schucker UK Ltd. Didcot
Tentec Ltd. Birmingham
Uruguay Econus S A Montevideo
USA Atlas Copco Assembly Systems LLC Auburn Hills, MI
Atlas Copco Compressors LLC Rock Hill, SC
Atlas Copco Comptec LLC Voorheesville, NY
Atlas Copco Customer Finance USA LLC Parsippany, NJ
Atlas Copco Drilling Solutions LLC Garland, TX
Atlas Copco Hurricane LLC Franklin, IN
Atlas Copco Mafi-Trench Company LLC Santa Maria, CA
Atlas Copco North America LLC Parsippany, NJ
Atlas Copco Rental LLC Laporte, TX
Atlas Copco Secoroc LLC Grand Prairie, TX
Atlas Copco Specialty Rental LLC Houston, TX
Atlas Copco Tools & Assembly Systems LLC Auburn Hills, MI
Atlas Copco USA Holdings Inc. Parsippany, NJ
BeaconMedaes LLC Rock Hill, SC
Chicago Pneumatic International Inc. Rock Hill, SC
Chicago Pneumatic Tool Company LLC Rock Hill, SC
Edwards Vacuum, LLC Sanborn, NY
Goldenrod Inc Rock Hill, SC
Henrob Corporation New Hudson, MI
Houston Service Industries, Inc Houston, TX
Innovative Vacuum Solutions, Inc Thonotosassa, FL
MeadesUSCo Inc Rock Hill, SC
Mining, Rock Excavation and Construction LLC Commerce City, CO
Quincy Compressor LLC Bay Minette, AL
SCA Schucker LLC Auburn Hills, MI
Uzbekistan Atlas Copco Compressors and Mining Technique LLC Tashkent
Venezuela Atlas Copco Venezuela SA Caracas
Vietnam Atlas Copco Vietnam Company Ltd. Ho Chi Minh City
Zambia Atlas Copco (Zambia) Ltd. Chingola
Zimbabwe Atlas Copco Zimbabwe (Private) Ltd. Harare
Country Company Location (City) Country Company Location (City)
A22. Related parties, continued
122 Atlas Copco 2015
The Parent Company financial statements have been prepared in accordance with generally accepted accounting principles in Sweden and the consolidated financial statements have been prepared in accordance with International Accounting Standards as prescribed by the European Parliament and the Regulation (EC) No 1606/2002 dated July 19, 2002 on the application of International Accounting Standards. The Parent Company financial statements and the consolidated financial statements give a true and fair view of the Parent Company’s and the Group’s financial position and results of operations.
The administration report for the Group and Parent Company provides a true and fair overview of the development of the Group’s and Parent Company’s business activities, financial position and results of operations as well as the significant risks and uncertainties which the Parent Company and its subsidiaries are exposed to.
Our audit report was submitted on March 4, 2016Deloitte AB
Jan BerntssonAuthorized Public Accountant
Atlas Copco AB is required to publish information included in this annual report in accordance with the Swedish Securities Market Act. The information was made public on March 10, 2016.
Margareth Øvrum Johan Forssell Gunilla Nordström Peter Wallenberg Jr
Board member Board member Board member Board member
Bengt Lindgren Mikael Bergstedt
Union representative Union representative
Ulla Litzén Anders Ullberg Staffan Bohman
Board member Board member Board member
Hans Stråberg Ronnie Leten
Chair President and CEO
SIGNATURES OF THE BOARD OF DIRECTORS
Nacka, March 4, 2016
Atlas Copco 2015 123
AUDIT REPORT
To the annual meeting of the shareholders of Atlas Copco ABCorporate identity number 556014-2720
Report on the annual accounts and consolidated accounts We have audited the annual accounts and consolidated accounts of Atlas Copco AB for the financial year 2015, except for the corporate governance report on pages 56-65. The annual accounts and consolidated accounts of the company are included in the printed version of this document on pages 14–47 and 56–122.
Responsibilities of the Board of Directors and the President for the annual accounts and consolidated accountsThe Board of Directors and the President are responsible for the preparation and fair presentation of these annual accounts in accordance with the Annual Accounts Act and of the consolidated accounts in accordance with Interna-tional Financial Reporting Standards, as adopted by the EU, and the Annual Accounts Act, and for such internal control as the Board of Directors and the President determine is necessary to enable the preparation of annual accounts and consolidated accounts that are free from material misstatement, whether due to fraud or error.
Auditor’s responsibilityOur responsibility is to express an opinion on these annual accounts and con-solidated accounts based on our audit. We conducted our audit in accordance with International Standards on Auditing and generally accepted auditing standards in Sweden. Those standards require that we comply with ethical requirements and plan and perform the audit to obtain reasonable assurance about whether the annual accounts and consolidated accounts are free from material misstatement.
An audit involves performing procedures to obtain audit evidence about the amounts and disclosures in the annual accounts and consolidated accounts. The procedures selected depend on the auditor’s judgment, includ-ing the assessment of the risks of material misstatement of the annual accounts and consolidated accounts, whether due to fraud or error. In making those risk assessments, the auditor considers internal control relevant to the company’s preparation and fair presentation of the annual accounts and con-solidated accounts in order to design audit procedures that are appropriate in the circumstances, but not for the purpose of expressing an opinion on the effectiveness of the company’s internal control. An audit also includes evaluat-ing the appropriateness of accounting policies used and the reasonableness of accounting estimates made by the Board of Directors and the President, as well as evaluating the overall presentation of the annual accounts and consoli-dated accounts.
We believe that the audit evidence we have obtained is sufficient and appropriate to provide a basis for our audit opinions.
OpinionsIn our opinion, the annual accounts have been prepared in accordance with the Annual Accounts Act and present fairly, in all material respects, the finan-cial position of the parent company as of 31 December 2015 and of its finan-cial performance and its cash flows for the year then ended in accordance with the Annual Accounts Act. The consolidated accounts have been prepared in accordance with the Annual Accounts Act and present fairly, in all material respects, the financial position of the group as of 31 December 2015 and of its financial performance and cash flows for the year then ended in accordance with International Financial Reporting Standards, as adopted by the EU, and
the Annual Accounts Act. Our opinions do not cover the corporate gover-nance report on pages 56–65. The statutory administration report is consistent with the other parts of the annual accounts and consolidated accounts.
We therefore recommend that the annual meeting of shareholders adopt the income statement and balance sheet for the parent company and the group.
Report on other legal and regulatory requirements In addition to our audit of the annual accounts and consolidated accounts, we have also audited the proposed appropriations of the company’s profit or loss and the administration of the Board of Directors and the President of Atlas Copco AB for the financial year 2015. We have also conducted a statutory examination of the corporate governance report.
Responsibilities of the Board of Directors and the PresidentThe Board of Directors is responsible for the proposal for appropriations of the company’s profit or loss, and the Board of Directors and the President are responsible for administration under the Companies Act and that the corpo-rate governance report has been prepared in accordance with the Annual Accounts Act.
Auditor’s responsibilityOur responsibility is to express an opinion with reasonable assurance on the proposed appropriations of the company’s profit or loss and on the adminis-tration based on our audit. We conducted the audit in accordance with gener-ally accepted auditing standards in Sweden.
As a basis for our opinion on the Board of Directors’ proposed appropria-tions of the company’s profit or loss, we examined the Board of Directors’ rea-soned statement and a selection of supporting evidence in order to be able to assess whether the proposal is in accordance with the Companies Act.
As a basis for our opinion concerning discharge from liability, in addition to our audit of the annual accounts and consolidated accounts, we examined significant decisions, actions taken and circumstances of the company in order to determine whether any member of the Board of Directors or the President is liable to the company. We also examined whether any member of the Board of Directors or the President has, in any other way, acted in contravention of the Companies Act, the Annual Accounts Act or the Articles of Association.
We believe that the audit evidence we have obtained is sufficient and appropriate to provide a basis for our opinions.
Furthermore, we have read the corporate governance report and based on that reading and our knowledge of the company and the group we believe that we have a sufficient basis for our opinions. This means that our statutory examination of the corporate governance report is different and substantially less in scope than an audit conducted in accordance with International Stan-dards on Auditing and generally accepted auditing standards in Sweden.
OpinionsWe recommend to the annual meeting of shareholders that the profit be appro-priated in accordance with the proposal in the statutory administration report and that the members of the Board of Directors and the President be dis-charged from liability for the financial year.
A corporate governance report has been prepared, and its statutory con-tent is consistent with the other parts of the annual accounts and consolidated accounts.
Nacka, March 4, 2016
Deloitte AB
Jan BerntssonAuthorized Public Accountant
124 Atlas Copco 2015
FINANCIAL DEFINITIONS
Average number of shares outstandingThe weighted average number of shares outstanding before or after dilution. Shares held by Atlas Copco are not included in the number of shares outstanding. The dilutive effects arise from the stock options that are settled in shares or that at the employees’ choice can be settled in shares or cash in the share based incentive programs. The stock options have a dilutive effect when the average share price during the period exceeds the exercise price of the options.
Capital employed Average total assets less non-interest-bearing liabilities/provisions. Capital employed for the business areas excludes cash, tax liabilities and tax receivables.
Capital employed turnover ratio Revenues divided by average capital employed.
Capital turnover ratio Revenues divided by average total assets.
Debt/equity ratioNet indebtedness in relation to equity, including non-controlling interests.
Dividend yieldDividend divided by the average share price quoted.
Earnings per share Profit for the period attributable to owners of the parent divided by the average number of shares outstanding.
EBITDA – Earnings Before Interest, Taxes, Depreciation and AmortizationOperating profit plus depreciation, impairment and amortization.
EBITDA marginEBITDA as a percentage of revenues.
Equity/assets ratioEquity including non-controlling interests, as a percentage of total assets.
Equity per shareEquity including non-controlling interests divided by the average number of shares outstanding.
Interest coverage ratio Profit before tax plus interest paid and foreign exchange differences divided by interest paid and foreign exchange differences.
Net cash flowChange in cash and cash equivalents excluding currency exchange rate effects.
Net debt/EBITDA ratioNet indebtedness in relation to EBITDA.
Net indebtedness/net cash positionBorrowings plus post-employment benefits minus cash and cash equivalents and other current financial assets, adjusted for the fair value of interest rate swaps.
Net interest expenseInterest expense less interest income.
Operating cash flowCash flow from operations and cash flow from investments, excluding company acquisitions/divestments.
Operating profitRevenues less all costs related to operations, but excluding net financial items and income tax expense.
Operating profit marginOperating profit as a percentage of revenues.
Profit marginProfit before tax as a percentage of revenues.
Return on capital employed (ROCE)Profit before tax plus interest paid and foreign exchange differences (for business areas: operating profit) as a percentage of capital employed.
Return on equityProfit for the period, attributable to owners of the parent as a percentage of average equity, excluding non-controlling interests.
Weighted average cost of capital (WACC)
interest-bearing liabilities x i + market capitalization x r
interest-bearing liabilities + market capitalization
i: An estimated average risk-free interest rate of 4% plus a premium of 0.5%. An estimated standard tax rate has been applied.
r: An estimated average risk-free interest rate of 4% plus an equity risk premium of 5%.
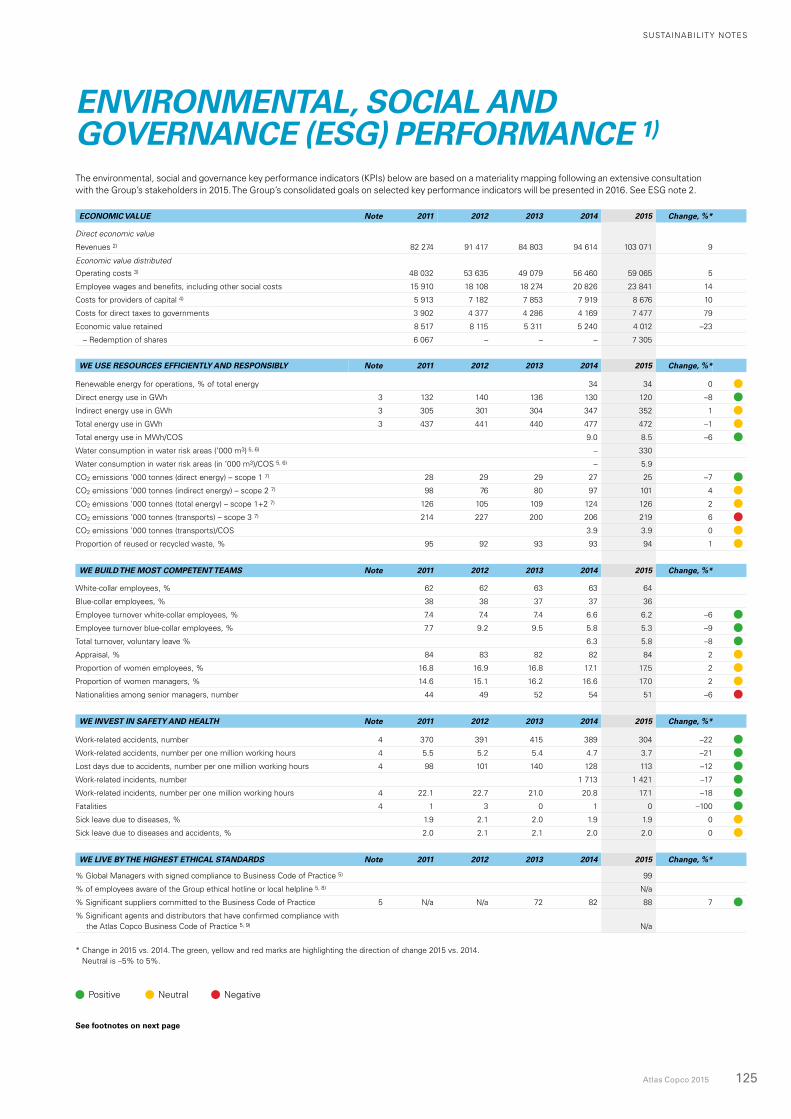
SUSTAINABILITY NOTES
Atlas Copco 2015 125
ENVIRONMENTAL, SOCIAL AND GOVERNANCE (ESG) PERFORMANCE 1)
ECONOMIC VALUE Note 2011 2012 2013 2014 2015 Change, %*
Direct economic value
Revenues 2) 82 274 91 417 84 803 94 614 103 071 9
Economic value distributed
Operating costs 3) 48 032 53 635 49 079 56 460 59 065 5
Employee wages and benefits, including other social costs 15 910 18 108 18 274 20 826 23 841 14
Costs for providers of capital 4) 5 913 7 182 7 853 7 919 8 676 10
Costs for direct taxes to governments 3 902 4 377 4 286 4 169 7 477 79
Economic value retained 8 517 8 115 5 311 5 240 4 012 –23
– Redemption of shares 6 067 – – – 7 305
WE USE RESOURCES EFFICIENTLY AND RESPONSIBLY Note 2011 2012 2013 2014 2015 Change, %*
Renewable energy for operations, % of total energy 34 34 0
Direct energy use in GWh 3 132 140 136 130 120 –8
Indirect energy use in GWh 3 305 301 304 347 352 1
Total energy use in GWh 3 437 441 440 477 472 –1
Total energy use in MWh/COS 9.0 8.5 –6
Water consumption in water risk areas (’000 m3) 5, 6) – 330
Water consumption in water risk areas (in ’000 m3)/COS 5, 6) – 5.9
CO2 emissions ’000 tonnes (direct energy) – scope 1 7) 28 29 29 27 25 –7
CO2 emissions ’000 tonnes (indirect energy) – scope 2 7) 98 76 80 97 101 4
CO2 emissions ’000 tonnes (total energy) – scope 1+2 7) 126 105 109 124 126 2
CO2 emissions ’000 tonnes (transports) – scope 3 7) 214 227 200 206 219 6
CO2 emissions ’000 tonnes (transports)/COS 3.9 3.9 0
Proportion of reused or recycled waste, % 95 92 93 93 94 1
WE BUILD THE MOST COMPETENT TEAMS Note 2011 2012 2013 2014 2015 Change, %*
White-collar employees, % 62 62 63 63 64
Blue-collar employees, % 38 38 37 37 36
Employee turnover white-collar employees, % 7.4 7.4 7.4 6.6 6.2 –6
Employee turnover blue-collar employees, % 7.7 9.2 9.5 5.8 5.3 –9
Total turnover, voluntary leave % 6.3 5.8 –8
Appraisal, % 84 83 82 82 84 2
Proportion of women employees, % 16.8 16.9 16.8 17.1 17.5 2
Proportion of women managers, % 14.6 15.1 16.2 16.6 17.0 2
Nationalities among senior managers, number 44 49 52 54 51 –6
WE INVEST IN SAFETY AND HEALTH Note 2011 2012 2013 2014 2015 Change, %*
Work-related accidents, number 4 370 391 415 389 304 –22
Work-related accidents, number per one million working hours 4 5.5 5.2 5.4 4.7 3.7 –21
Lost days due to accidents, number per one million working hours 4 98 101 140 128 113 –12
Work-related incidents, number 1 713 1 421 –17
Work-related incidents, number per one million working hours 4 22.1 22.7 21.0 20.8 17.1 –18
Fatalities 4 1 3 0 1 0 –100
Sick leave due to diseases, % 1.9 2.1 2.0 1.9 1.9 0
Sick leave due to diseases and accidents, % 2.0 2.1 2.1 2.0 2.0 0
WE LIVE BY THE HIGHEST ETHICAL STANDARDS Note 2011 2012 2013 2014 2015 Change, %*
% Global Managers with signed compliance to Business Code of Practice 5) 99
% of employees aware of the Group ethical hotline or local helpline 5, 8) N/a
% Significant suppliers committed to the Business Code of Practice 5 N/a N/a 72 82 88 7
% Significant agents and distributors that have confirmed compliance with the Atlas Copco Business Code of Practice 5, 9) N/a
* Change in 2015 vs. 2014. The green, yellow and red marks are highlighting the direction of change 2015 vs. 2014. Neutral is –5% to 5%.
Positive Neutral Negative
See footnotes on next page
The environmental, social and governance key performance indicators (KPIs) below are based on a materiality mapping following an extensive consultation with the Group’s stakeholders in 2015. The Group’s consolidated goals on selected key performance indicators will be presented in 2016. See ESG note 2.
SUSTAINABILITY NOTES
126 Atlas Copco 2015
1) Calculations according to GRI G4 Guidelines, www.globalreporting.org. The environmental, social and governance information has been subject to external assurance in 2012, 2013, 2014 and 2015. This can to some extent influence comparisons between these years´ and previous years´ performance.
2) Revenues include revenues, other operating income, financial income, profit from divested companies and share of profit in associated companies.3) Operating costs include cost of sales, marketing expenses, administration expenses, research and development expenses, other operating expenses,
deducted for employee wages and benefits. COS when presented in relation to sustainability information refers to cost of sales at standard cost.4) Costs for providers of capital include financial costs and dividend, but exclude redemption of shares and repurchase of own shares. 5) Materiality mapping has resulted in changes in the Group’s KPIs. See ESG note 2 for further details. 6) Water risk mapping was carried out using the WBCSD water risk tool and water risk maps generated by Verisk Maplecroft.7) Standardized conversion factors published by the Greenhouse Gas Protocol Initiative and International Energy Agency are used to calculate CO2 emissions,
see www.ghgprotocol.org and www.iea.org. 8) To be collected biennially, starting 2016, with a new question the Group’s employee survey Insight.9) To begin with implementation in select high risk markets in first phase.
NOTES TO THE ENVIRONMENTAL, SOCIAL AND GOVERNANCE (ESG) PERFORMANCE
Since 2001, the report has been prepared yearly in accordance with the Global Reporting Initiative (GRI) guidelines. This is the first report that follows the G4 Core guidelines. The most recent sustainability report was published in March 2015 as part of the annual report 2014.
This report is also Atlas Copco’s Communication on Progress (COP), a report on performance in relation to the UN Global Compact’s ten principles. It can be found at www.atlascopcogroup.com/investor-relations and on UN Global Compact’s website at unglobalcompact.org/cop.
Atlas Copco adheres to the following internationally recognized voluntary standards and principles:• UN Global Compact. As a signatory to the UN Global Compact since
2008, a strategic policy initiative for businesses that are committed to align-ing their operations and strategies with ten universally accepted principles in the areas of human rights, labor, environment and anti-corruption.
• Global Reporting Initiative’s (GRI) Sustainability Reporting Guidelines. The guidelines (G4) include an internationally recognized set of indicators for economic, environmental and social aspects of business performance that enables stakeholders to compare companies’ performance. Atlas Copco’s reporting according to the reporting principles and guidance, including required disclosures, can be found at www.atlascopcogroup.com/investor-relations.
Data collection and reportingThe sustainability report and the corporate governance report are integrated in the 2015 annual report. Sustainability information in the annual report is primarily presented on pages 10–13, 40–53 and 125–131, and in the GRI Compliance Index. Reported facts and figures have been verified in accor-dance with Atlas Copco’s procedures for internal control. Data collection is integrated into the Group reporting consolidation systems and collected on a quarterly basis. Reported values are normally not corrected retroactively, but when a restatement of historically reported numbers is done this can be due to a change of calculation method or scope. Environmental data covers produc-tion units and distribution centers. Business partner data covers production units and employee data covers all operations. Responsibility for reporting rests with the General Manager of each company. Data is reported at local operating unit level, aggregated to division/business area and Group level. Data verification is performed at each level before submitting to external auditors for verification.
The reporting of greenhouse gas emissions is done in accordance with the GHG Protocol (ghgprotocol.org) and the International Energy Agency (iea.org). The Group is a member of the Swedish Network for Transport and Environment (NTM) and closely follows its recommendations, which may impact the reporting guideline of CO2 emissions from transport.
ScopeThe annual report includes information regarding all three aspects of the Group’s strategy i.e. where Atlas Copco has a significant economic, environ-mental and social impact. The report covers Atlas Copco’s operations for the fiscal year 2015, unless otherwise stated. Operations divested during the year are excluded; units that were acquired are included. This may at times cause major changes in reported performance. Limitations and reporting principles are explained in the relevant section of the report. For the reporting period
of 2015 all publicly disclosed sustainability information can be found in the publication Atlas Copco’s annual report 2015, except for the GRI Compliance Index, which is available on the Atlas Copco website, www.atlascopcogroup.com/investor-relations.
Atlas Copco’s annual report 2015 includes a general overview of the Group’s environmental situation in accordance with the requirements of Swedish legislation regarding environmental information in the Administra-tion Report. In addition, environmental and social information has been integrated into the annual report where appropriate in order to provide a more complete picture of the Group. In addition, Atlas Copco reports with reference to the content elements and guiding principles of the Inaugural Integrated Reporting Framework developed by the International Integrated Reporting Council.
The reason for integrating the sustainability information in the annual report is to provide investors and stakeholders with a relatively complete and easily accessible overview of the Atlas Copco Group’s most important activi-ties contributing to sustainable development and increasing shareholder value.
Materiality impact on reportingThe GRI core indicators reported and analyzed are those that are understood to be material to the Atlas Copco Group and its stakeholders, and which facil-itate benchmarking with other companies in a broader sense. The contents of Atlas Copco’s Annual Report 2015 are based on the GRI G4’s Principles for Defining Report Content, and are guided by stakeholder inclusiveness, the Group’s sustainability context, materiality and completeness. Key issues are identified through extensive consultation with the Group’s stakeholders. The material aspects identified in this report include, but are not limited to, the GRI G4 indicators and aspects. The Group’s materiality process also guides the disclosure for the Group’s UN Global Compact Communication on Prog-ress and Atlas Copco’s work with the UN Sustainable Development Goals. A GRI G4 and UNGC COP compliance index accompanies this Annual Report and can be found online. For more information about how the materiality analysis was conducted, visit www.atlascopcogroup.com/sustainability.
Stakeholder dialogueAs a global Group, it’s vital for Atlas Copco to ensure accountability for its actual and potential impact on its stakeholders. In discussions with for exam-ple NGO’s, GO’s and other influencers, it takes advice and/or learns from lis-tening to their views. In 2015, one formal stakeholder dialogue was conducted with major shareholders, with the participation of members of Group man-agement. The focus of the meeting was to review Atlas Copco’s sustainability performance and discuss its approach to business in complex markets. The presentation is available at www.atlascopcogroup.com/sustainability. Other stakeholder dialogues are conducted at different levels in the Group. Major issues are collected and form the basis for development of strategic responses to challenges.
Review/auditAtlas Copco has self-declared the report to be in accordance to GRI G4 Core, The report covers Standard Disclosures, all Disclosures on Management Approach and at least one indicator per material aspect, in accordance to the GRI G4 guidelines. The annual report has been reviewed and approved by
Footnotes to page 125
1. Reporting principles of the environmental, social and governance performance
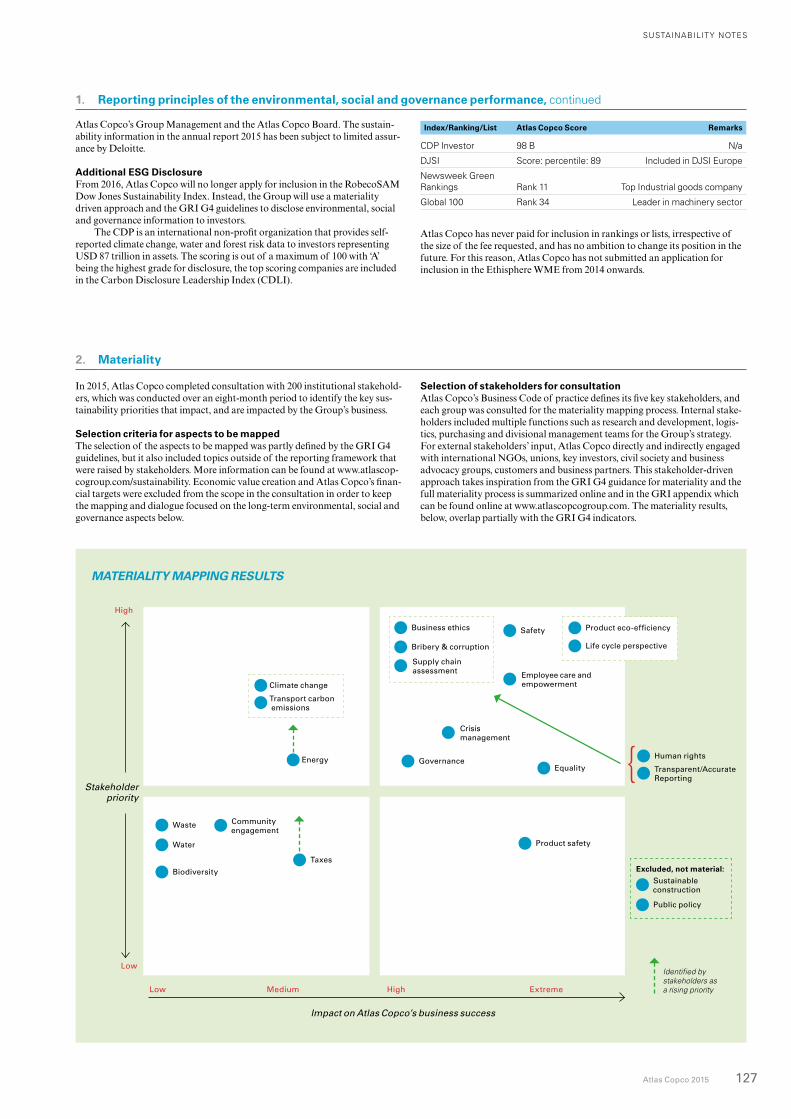
High
Low
Low
Stakeholder priority
Impact on Atlas Copco’s business success
Medium High Extreme
SUSTAINABILITY NOTES
Atlas Copco 2015 127
Atlas Copco’s Group Management and the Atlas Copco Board. The sustain-ability information in the annual report 2015 has been subject to limited assur-ance by Deloitte.
Additional ESG DisclosureFrom 2016, Atlas Copco will no longer apply for inclusion in the RobecoSAM Dow Jones Sustainability Index. Instead, the Group will use a materiality driven approach and the GRI G4 guidelines to disclose environmental, social and governance information to investors.
The CDP is an international non-profit organization that provides self-reported climate change, water and forest risk data to investors representing USD 87 trillion in assets. The scoring is out of a maximum of 100 with ‘A’ being the highest grade for disclosure, the top scoring companies are included in the Carbon Disclosure Leadership Index (CDLI).
In 2015, Atlas Copco completed consultation with 200 institutional stakehold-ers, which was conducted over an eight-month period to identify the key sus-tainability priorities that impact, and are impacted by the Group’s business.
Selection criteria for aspects to be mapped The selection of the aspects to be mapped was partly defined by the GRI G4 guidelines, but it also included topics outside of the reporting framework that were raised by stakeholders. More information can be found at www.atlascop-cogroup.com/sustainability. Economic value creation and Atlas Copco’s finan-cial targets were excluded from the scope in the consultation in order to keep the mapping and dialogue focused on the long-term environmental, social and governance aspects below.
Index/Ranking/List Atlas Copco Score Remarks
CDP Investor 98 B N/a
DJSI Score: percentile: 89 Included in DJSI Europe
Newsweek Green Rankings Rank 11 Top Industrial goods company
Global 100 Rank 34 Leader in machinery sector
Atlas Copco has never paid for inclusion in rankings or lists, irrespective of the size of the fee requested, and has no ambition to change its position in the future. For this reason, Atlas Copco has not submitted an application for inclusion in the Ethisphere WME from 2014 onwards.
1. Reporting principles of the environmental, social and governance performance, continued
2. Materiality
Selection of stakeholders for consultationAtlas Copco’s Business Code of practice defines its five key stakeholders, and each group was consulted for the materiality mapping process. Internal stake-holders included multiple functions such as research and development, logis-tics, purchasing and divisional management teams for the Group’s strategy. For external stakeholders’ input, Atlas Copco directly and indirectly engaged with international NGOs, unions, key investors, civil society and business advocacy groups, customers and business partners. This stakeholder-driven approach takes inspiration from the GRI G4 guidance for materiality and the full materiality process is summarized online and in the GRI appendix which can be found online at www.atlascopcogroup.com. The materiality results, below, overlap partially with the GRI G4 indicators.
MATERIALITY MAPPING RESULTS
Climate change
Transport carbon emissions
Energy
Waste
Water
Biodiversity
Community engagement
Taxes
Business ethics
Supply chain assessment
Bribery & corruption
Safety Product eco-efficiency
Life cycle perspective
Employee care and empowerment
Crisis management
Governance Equality
Human rights
Transparent/Accurate Reporting
Product safety
Sustainable construction
Excluded, not material:
Public policy
Identified by stakeholders as a rising priority
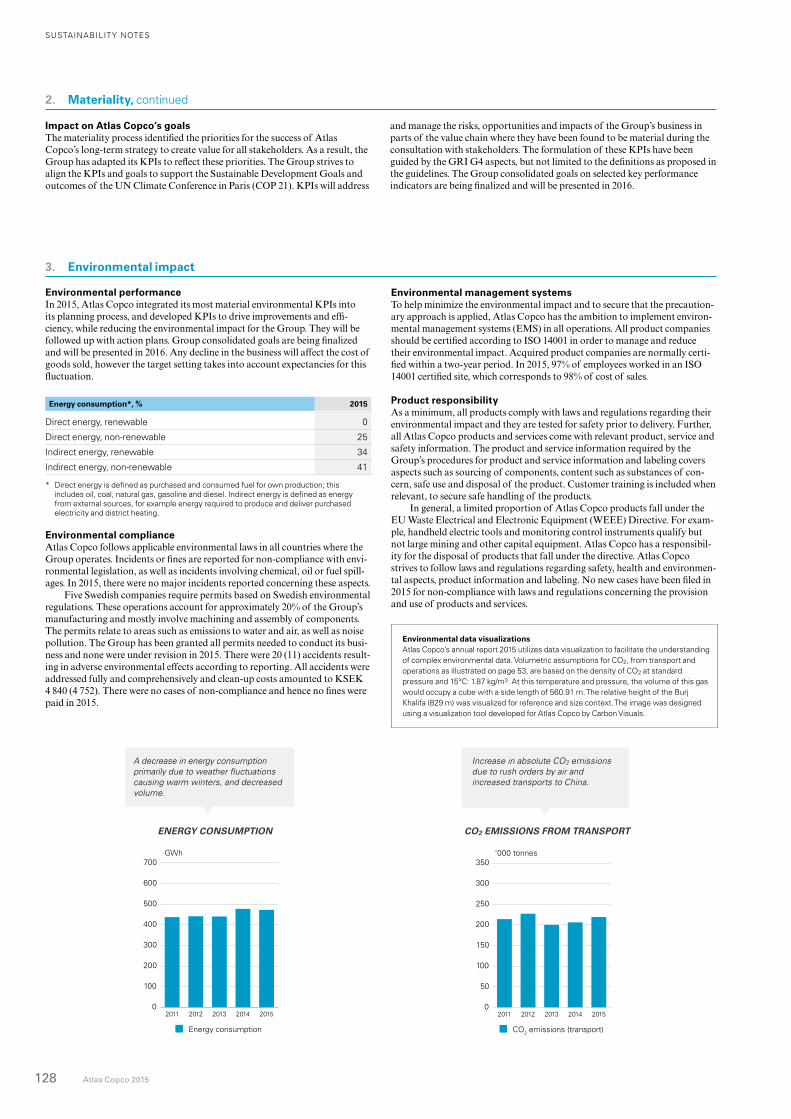
SUSTAINABILITY NOTES
128 Atlas Copco 2015
3. Environmental impact
Environmental performanceIn 2015, Atlas Copco integrated its most material environmental KPIs into its planning process, and developed KPIs to drive improvements and effi-ciency, while reducing the environmental impact for the Group. They will be followed up with action plans. Group consolidated goals are being finalized and will be presented in 2016. Any decline in the business will affect the cost of goods sold, however the target setting takes into account expectancies for this fluctuation.
Energy consumption*, % 2015
Direct energy, renewable 0
Direct energy, non-renewable 25
Indirect energy, renewable 34
Indirect energy, non-renewable 41
* Direct energy is defined as purchased and consumed fuel for own production; this includes oil, coal, natural gas, gasoline and diesel. Indirect energy is defined as energy from external sources, for example energy required to produce and deliver purchased electricity and district heating.
Environmental complianceAtlas Copco follows applicable environmental laws in all countries where the Group operates. Incidents or fines are reported for non-compliance with envi-ronmental legislation, as well as incidents involving chemical, oil or fuel spill-ages. In 2015, there were no major incidents reported concerning these aspects.
Five Swedish companies require permits based on Swedish environmental regulations. These operations account for approximately 20% of the Group’s manufacturing and mostly involve machining and assembly of components. The permits relate to areas such as emissions to water and air, as well as noise pollution. The Group has been granted all permits needed to conduct its busi-ness and none were under revision in 2015. There were 20 (11) accidents result-ing in adverse environmental effects according to reporting. All accidents were addressed fully and comprehensively and clean-up costs amounted to KSEK 4 840 (4 752). There were no cases of non-compliance and hence no fines were paid in 2015.
Environmental management systemsTo help minimize the environmental impact and to secure that the precaution-ary approach is applied, Atlas Copco has the ambition to implement environ-mental management systems (EMS) in all operations. All product companies should be certified according to ISO 14001 in order to manage and reduce their environmental impact. Acquired product companies are normally certi-fied within a two-year period. In 2015, 97% of employees worked in an ISO 14001 certified site, which corresponds to 98% of cost of sales.
Product responsibilityAs a minimum, all products comply with laws and regulations regarding their environmental impact and they are tested for safety prior to delivery. Further, all Atlas Copco products and services come with relevant product, service and safety information. The product and service information required by the Group’s procedures for product and service information and labeling covers aspects such as sourcing of components, content such as substances of con-cern, safe use and disposal of the product. Customer training is included when relevant, to secure safe handling of the products.
In general, a limited proportion of Atlas Copco products fall under the EU Waste Electrical and Electronic Equipment (WEEE) Directive. For exam-ple, handheld electric tools and monitoring control instruments qualify but not large mining and other capital equipment. Atlas Copco has a responsibil-ity for the disposal of products that fall under the directive. Atlas Copco strives to follow laws and regulations regarding safety, health and environmen-tal aspects, product information and labeling. No new cases have been filed in 2015 for non-compliance with laws and regulations concerning the provision and use of products and services.
Environmental data visualizations Atlas Copco’s annual report 2015 utilizes data visualization to facilitate the understanding of complex environmental data. Volumetric assumptions for CO2, from transport and operations as illustrated on page 53, are based on the density of CO2 at standard pressure and 15°C: 1.87 kg/m3. At this temperature and pressure, the volume of this gas would occupy a cube with a side length of 560.91 m. The relative height of the Burj Khalifa (829 m) was visualized for reference and size context. The image was designed using a visualization tool developed for Atlas Copco by Carbon Visuals.
0
50
100
150
200
250
300
350
20152014201320122011
’000 tonnes
CO2 emissions (transport)
CO2 EMISSIONS FROM TRANSPORT
0
100
200
300
400
500
600
700
20152014201320122011
GWh
Energy consumption
ENERGY CONSUMPTION
A decrease in energy consumption primarily due to weather fluctuations causing warm winters, and decreased volume.
Increase in absolute CO2 emissions due to rush orders by air and increased transports to China.
2. Materiality, continued
Impact on Atlas Copco’s goalsThe materiality process identified the priorities for the success of Atlas Copco’s long-term strategy to create value for all stakeholders. As a result, the Group has adapted its KPIs to reflect these priorities. The Group strives to align the KPIs and goals to support the Sustainable Development Goals and outcomes of the UN Climate Conference in Paris (COP 21). KPIs will address
and manage the risks, opportunities and impacts of the Group’s business in parts of the value chain where they have been found to be material during the consultation with stakeholders. The formulation of these KPIs have been guided by the GRI G4 aspects, but not limited to the definitions as proposed in the guidelines. The Group consolidated goals on selected key performance indicators are being finalized and will be presented in 2016.
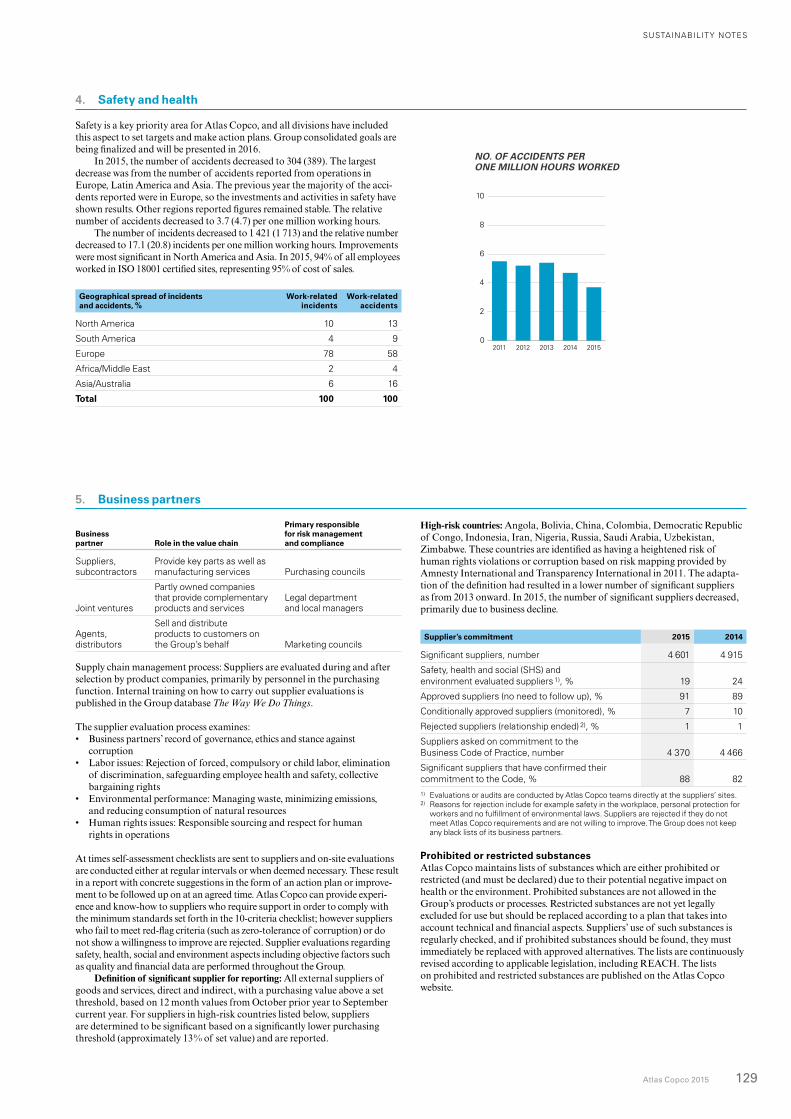
SUSTAINABILITY NOTES
Atlas Copco 2015 129
0
2
4
6
8
10
20152014201320122011
Target: Reduce by 23% by 2018
NO. OF ACCIDENTS PER ONE MILLION HOURS WORKED
4. Safety and health
Safety is a key priority area for Atlas Copco, and all divisions have included this aspect to set targets and make action plans. Group consolidated goals are being finalized and will be presented in 2016.
In 2015, the number of accidents decreased to 304 (389). The largest decrease was from the number of accidents reported from operations in Europe, Latin America and Asia. The previous year the majority of the acci-dents reported were in Europe, so the investments and activities in safety have shown results. Other regions reported figures remained stable. The relative number of accidents decreased to 3.7 (4.7) per one million working hours.
The number of incidents decreased to 1 421 (1 713) and the relative number decreased to 17.1 (20.8) incidents per one million working hours. Improvements were most significant in North America and Asia. In 2015, 94% of all employees worked in ISO 18001 certified sites, representing 95% of cost of sales.
Geographical spread of incidents and accidents, %
Work-related incidents
Work-related accidents
North America 10 13
South America 4 9
Europe 78 58
Africa/Middle East 2 4
Asia/Australia 6 16
Total 100 100
High-risk countries: Angola, Bolivia, China, Colombia, Democratic Republic of Congo, Indonesia, Iran, Nigeria, Russia, Saudi Arabia, Uzbekistan, Zimbabwe. These countries are identified as having a heightened risk of human rights violations or corruption based on risk mapping provided by Amnesty International and Transparency International in 2011. The adapta-tion of the definition had resulted in a lower number of significant suppliers as from 2013 onward. In 2015, the number of significant suppliers decreased, primarily due to business decline.
Supplier’s commitment 2015 2014
Significant suppliers, number 4 601 4 915
Safety, health and social (SHS) and environment evaluated suppliers 1), % 19 24
Approved suppliers (no need to follow up), % 91 89
Conditionally approved suppliers (monitored), % 7 10
Rejected suppliers (relationship ended) 2), % 1 1
Suppliers asked on commitment to the Business Code of Practice, number 4 370 4 466
Significant suppliers that have confirmed their commitment to the Code, % 88 821) Evaluations or audits are conducted by Atlas Copco teams directly at the suppliers’ sites. 2) Reasons for rejection include for example safety in the workplace, personal protection for
workers and no fulfillment of environmental laws. Suppliers are rejected if they do not meet Atlas Copco requirements and are not willing to improve. The Group does not keep any black lists of its business partners.
Prohibited or restricted substances Atlas Copco maintains lists of substances which are either prohibited or restricted (and must be declared) due to their potential negative impact on health or the environment. Prohibited substances are not allowed in the Group’s products or processes. Restricted substances are not yet legally excluded for use but should be replaced according to a plan that takes into account technical and financial aspects. Suppliers’ use of such substances is regularly checked, and if prohibited substances should be found, they must immediately be replaced with approved alternatives. The lists are continuously revised according to applicable legislation, including REACH. The lists on prohibited and restricted substances are published on the Atlas Copco website.
5. Business partners
Business partner Role in the value chain
Primary responsible for risk management and compliance
Suppliers, subcontractors
Provide key parts as well as manufacturing services Purchasing councils
Joint ventures
Partly owned companies that provide complementary products and services
Legal department and local managers
Agents, distributors
Sell and distribute products to customers on the Group’s behalf Marketing councils
Supply chain management process: Suppliers are evaluated during and after selection by product companies, primarily by personnel in the purchasing function. Internal training on how to carry out supplier evaluations is published in the Group database The Way We Do Things. The supplier evaluation process examines:• Business partners’ record of governance, ethics and stance against
corruption• Labor issues: Rejection of forced, compulsory or child labor, elimination
of discrimination, safeguarding employee health and safety, collective bargaining rights
• Environmental performance: Managing waste, minimizing emissions, and reducing consumption of natural resources
• Human rights issues: Responsible sourcing and respect for human rights in operations
At times self-assessment checklists are sent to suppliers and on-site evaluations are conducted either at regular intervals or when deemed necessary. These result in a report with concrete suggestions in the form of an action plan or improve-ment to be followed up on at an agreed time. Atlas Copco can provide experi-ence and know-how to suppliers who require support in order to comply with the minimum standards set forth in the 10-criteria checklist; however suppliers who fail to meet red-flag criteria (such as zero-tolerance of corruption) or do not show a willingness to improve are rejected. Supplier evaluations regarding safety, health, social and environment aspects including objective factors such as quality and financial data are performed throughout the Group.
Definition of significant supplier for reporting: All external suppliers of goods and services, direct and indirect, with a purchasing value above a set threshold, based on 12 month values from October prior year to September current year. For suppliers in high-risk countries listed below, suppliers are determined to be significant based on a significantly lower purchasing threshold (approximately 13% of set value) and are reported.
SUSTAINABILITY NOTES
130 Atlas Copco 2015
ISSUES ACTIVITIES IN 2015 PLANNED FOR 2016
Potential distribution (indirect sales) of Atlas Copco products in conflict-affected regions: specifically Myanmar*
Human rights focused due diligence was carried out, by internal experts, together with the regional management team. Stakeholders representing Atlas Copco’s distributor network, customers, independent experts, NGOs advocating for civil rights, ILO, and Swedish governmental authorities were consulted during the process.
Compliance board and regional managers to continue to monitor sales and service process.
*Status regarding Sudan remains unchanged from 2013
7. Human rights
Commitment to human rightsAtlas Copco’s central guiding policy is the Business Code of Practice which was updated in 2012 to support the United Nations International Bill of Human Rights. Atlas Copco is also a signatory of the UN Global Compact and is committed to working with the ten universally accepted principles in the areas of human rights, labor, environment and anti-corruption. The Atlas Copco Business Code of Practice also supports the International Labour Organization Declaration on Fundamental Principles and Rights at Work, as well as the OECD’s Guidelines for Multinational Enterprises. In 2011, Atlas Copco took on the commitment to protect, respect and provide access to remedy with regards to human rights as proposed in the UN Guiding Principles on Business and Human Rights. In accordance with requirements of the framework, Atlas Copco has:
• Human rights due diligence: An ongoing process to identify, prevent, mitigate and account for the human rights impacts related to Atlas Copco’s business or business relations.
Atlas Copco’s human rights approachWorking with human rights is a continuous process of learning, development and implementation. Atlas Copco strives to work with issues within its scope across the value chain. Atlas Copco does not view human rights as an isolated issue, but rather a cross-connected issue which can be impacted by working with corruption and environmental issues according to the Business Code of Practice. Human rights related issues are monitored by the Compliance board, which contains two members of Group Management. The Compliance board addresses issues such as training needs, impact assessment and the action points related to the implementation of the UN Guiding Principles. The Group strives to work with its commitment to the UN Guiding Principles across the value chain, covering procurement, human resources, sales, market-ing and other business processes. Atlas Copco has started to report according to the UN Guiding Principles Reporting Framework. Further details can be found in the society and employee sections of the report and the supplemen-tary content of this report.
Atlas Copco’s human rights statementThe Business Code of Practice is the central policy document, based on which Atlas Copco has a public human rights statement. Atlas Copco’s human rights statement is available publicly on the Group website, and has been approved by Group Management after internal and external consultation. The draft was reviewed by external, independent human rights experts for comments and feedback, which were incorporated into the final draft of the statement. Atlas Copco’s commitment covers all individuals and groups who may be impacted by its activities or through its business relationships. It is available to all employees through the Group’s intranet, and also through business and human rights trainings. Business partners are referred to the human rights statement during business negotiations and also during trainings. Human rights issues are raised in the Annual Stakeholder Dialogue, which is open to all external stakeholders such as workers in the company’s value chain, trade unions, communities, customers, NGOs and governmental authorities.
According to the human rights statement, the Atlas Copco hotline can be used to report perceived human rights violations and in cases where the stakeholder(s) or employee(s) are not satisfied with the solution provided by the ethical hotline, Atlas Copco will provide for mediation at the Stockholm Chamber of Commerce Arbitration Institute. There were no changes to the Group’s human rights policy during 2015.
Integrating the rights of children, women and special vulnerable groupsAtlas Copco strives to be inclusive in its human rights work to ensure that the rights of vulnerable groups such as children or minorities are covered by policies and processes. The Group works to integrate this into the broader human rights approach, and assesses the direct and indirect impacts the business can have on relevant groups.
6. Governance
Atlas Copco’s hotline is the Group’s whistleblower function of the Business Code of Practice. The Group is positive to receiving reports through the hotline since it provides the possibility to act on potential misconduct to the Business Code of Practice. During the year the hotline has been promoted globally among employees and business partners.
Reported potential violations, number 2015
Fraud 3
Labor relations 25
Corruption 9
Discrimination 2
Other (personal, organizational issues) 8
Total 47
Eleven cases are still under investigation, of which five are related to corruption, and six to labor relations or other concerns. Cases of fraud and corruption were substantiated in two cases and led to personal consequences such as dismissal or changes in procedures to prevent future occurrences.
The alleged cases of discrimination was not substantiated and closed after investigation. There have been no other instances of anti-competitive behavior brought to the attention of Group Management. No fines related to the hotline have been paid during the year.
SUSTAINABILITY NOTES
Atlas Copco 2015 131
8. Taxes
Atlas Copco strives to be a good and reliable corporate citizen, observing the spirit as well as the letter of the laws of the countries in which the Group operates. The Group recognizes the key role that tax plays in the area of advancing economic development and also considers it vital to combat corruption and support environmentally sound business practices in order to create the most value for society. Atlas Copco acts in accordance with all applicable laws and are at all times guided by relevant international standards, chiefly the OECD and UN guidelines. Atlas Copco believes in good corporate practice in the area of tax management, balancing the interests of various stakeholders, including customers, investors and the governments and communities in the countries in which the Group operates. Key stake holders have identified taxes as a rising priority during 2015. See note 9 of the con-solidated financial statements for the details of taxes paid, reported according to the international financial reporting standards.
Opinion on disclosing tax by countryAtlas Copco has been in dialogue with investors, NGOs and peers regarding the disclosure of tax paid per country. At present there is no international standard for reporting taxes paid by country and therefore the resulting data is not comparable between different companies. Atlas Copco is not opposed to reporting tax paid by country if guidelines are broadened to apply to all companies in the industry so that the data is comparable and can be analyzed fairly.
Presence in countries classified as tax havensAtlas Copco has companies in over 90 countries. Sometimes these companies are in countries that can be classified as tax havens, such as Panama. However, the reason for Atlas Copco’s presence in these markets is that the Group has customers with ongoing projects, such as expanding the Panama Canal.
7. Human rights, continued
Review of action points from previous yearIn the previous annual report, Atlas Copco set forth several action points that were addressed throughout 2015. Group Management approved the guide-lines focused on conflict-affected regions, and this was spread to the organiza-tion via the Group’s central information database, The Way We Do Things. The Group has taken measures to ensure that no future sales go to projects which may make it complicit in the violation of international law, with a special attention to occupied or non-self governing territories.
Atlas Copco explored public-private partnerships on a local and Group level, in order to support the implementation of the UN Guiding Principles and to increase leverage to respect human rights. In 2014, Atlas Copco joined the Swedish Leadership for Sustainable Development, a business network run by the Swedish International Development Cooperation, to strengthen its approach on environment, human rights and anti-corruption. The Group also participated in cross-industry dialogues in order to share best practices and tools from the implementation process, as well as learning points from the roll out of the Group’s Business & Human Rights approach.
Atlas Copco continues to be in dialogue with the EIRIS Conflict Risk Net-work, with regards to indirect sales to Sudan and is classified as “Substantial Action”. This means investors following the targeted Sudan legislative model do not need to take divestment measures. The Group will continue its humani-tarian efforts is Sudan through Water for All projects.
Conflict mineralsAtlas Copco is a supplier to customers required to report on the Dodd Frank Act, section 1502 in the United States. In 2015, all business areas continued working with the standard template developed in joint collabora-tion by the Electronic Industry Citizenship Coalition (EICC) and the Global e-Sustainability Initiative (GeSI) to map the minerals and sourcing processes used by tier 1 suppliers. In order to safeguard the quality of the supplier engagement and the due diligence, Atlas Copco did not add additional supplier tiers into the scope of the investigation in 2015.
9. Product energy efficiency
The energy efficiency calculations for the products detailed in the report were based on estimates provided by Atlas Copco’s research and development departments.
Power Focus 6000: Energy measurments for the previous model, Power Focus 4000 indicated that the controller used 20.6 W in standby mode and 22.2 W in active mode. In the same test conditions, the Power Focus 6000 was found to consume 19.4 W in standby mode, which shows an increase in energy effi-ciency by 6% when the controller is in this mode.
LT5005/LT6005 Rammer: The previous model of the construction tool consumed fuel at the rate of 1.2 L/hour under test conditions. Under the same conditions and the same application, the new model consumes fuel at 0.9 L/hour, making it 25% more energy efficient.
HRD100 Rock Drill: This equipment was initially developed for narrow reef mining in general, and for ultra-deep mining in particular, through a collabo-ration with a South African customer. The test installation is TuaTona, which is one of the deepest mines in the world. The primary customer installations are gold and platinum mines in South Africa. As a comparision, a conven-tional drill like the BBC 34 would be connected to a compressor (XAMS 287) to provide it with the necessary compressed air. The XAMS 287 can accom-modate three BBC 34 drills and provide each drill with an average of 43 kW of energy input. The HRD100 runs on 9kW due to systemic efficiency and under these conditions it is 35 % more efficient. However, in the ultra deep mining where pressure drops and leakages are common for the comparative fixed installation, the HRD100 is ten times as efficient or more.
SUSTAINABILITY NOTES
132 Atlas Copco 2015
IntroductionWe have been engaged by the Board of Directors of the President of Atlas Copco AB to undertake a limited assurance engagement of the Atlas Copco AB´s Sustainability Report for the year 2015. The Company has defined the scope of the Sustainability Report on page 126.
Responsibilities of the Board of Directors and the Executive Man-agement for the Sustainability ReportThe Board of Directors and the Executive Management are responsible for the preparation of the Sustainability Report in accordance with the applicable criteria, as explained on page 126 in the Sustainability Report, and are the parts of the Sustainability Reporting Guidelines (published by The Global Reporting Initiative (GRI)) which are applicable to the Sustainability Report, as well as the accounting and calculation principles that the Company has developed. This responsibility also includes the internal control relevant to the preparation of a Sustainability Report that is free from material misstate-ments, whether due to fraud or error.
Responsibilities of the auditor Our responsibility is to express a conclusion on the Sustainability Report based on the limited assurance procedures we have performed.
We conducted our limited assurance engagement in accordance with RevR 6 Assurance of Sustainability Reports issued by FAR. A limited assurance engagement consists of making inquiries, primarily of persons
AUDITOR’S LIMITED ASSURANCE REPORT ON ATLAS COPCO AB’S SUSTAINABILITY REPORT
Nacka, March 4, 2016Deloitte AB
Jan Berntsson Didrik Roos Authorized Public Accountant Authorized Public Accountant
responsible for the preparation of the Sustainability Report, and applying ana-lytical and other limited assurance procedures. The procedures performed in a limited assurance engagement vary in nature from, and are less in extent than for, a reasonable assurance engagement conducted in accordance with IAASB’s Standards on Auditing and other generally accepted auditing stan-dards in Sweden. The firm applies ISQC 1 (International Standard on Quality Control) and accordingly maintains a comprehensive system of quality con-trol including documented policies and procedures regarding compliance with ethical requirements, professional standards and applicable legal and regula-tory requirements. The procedures performed consequently do not enable us to obtain assurance that we would become aware of all significant matters that might be identified in a reasonable assurance engagement. Accordingly, we do not express a reasonable assurance conclusion.
Our procedures are based on the criteria defined by the Board of Directors and the Executive Management as described above. We consider these criteria suitable for the preparation of the Sustainability Report.
We believe that the evidence we have obtained is sufficient and appropriate to provide a basis for our conclusion below.
ConclusionBased on the limited assurance procedures we have performed, nothing has come to our attention that causes us to believe that the Sustainability Report, is not prepared, in all material respects, in accordance with the criteria defined by the Board of Directors and Executive Management.
This is the translation of the auditor’s report in Swedish.
To Atlas Copco AB
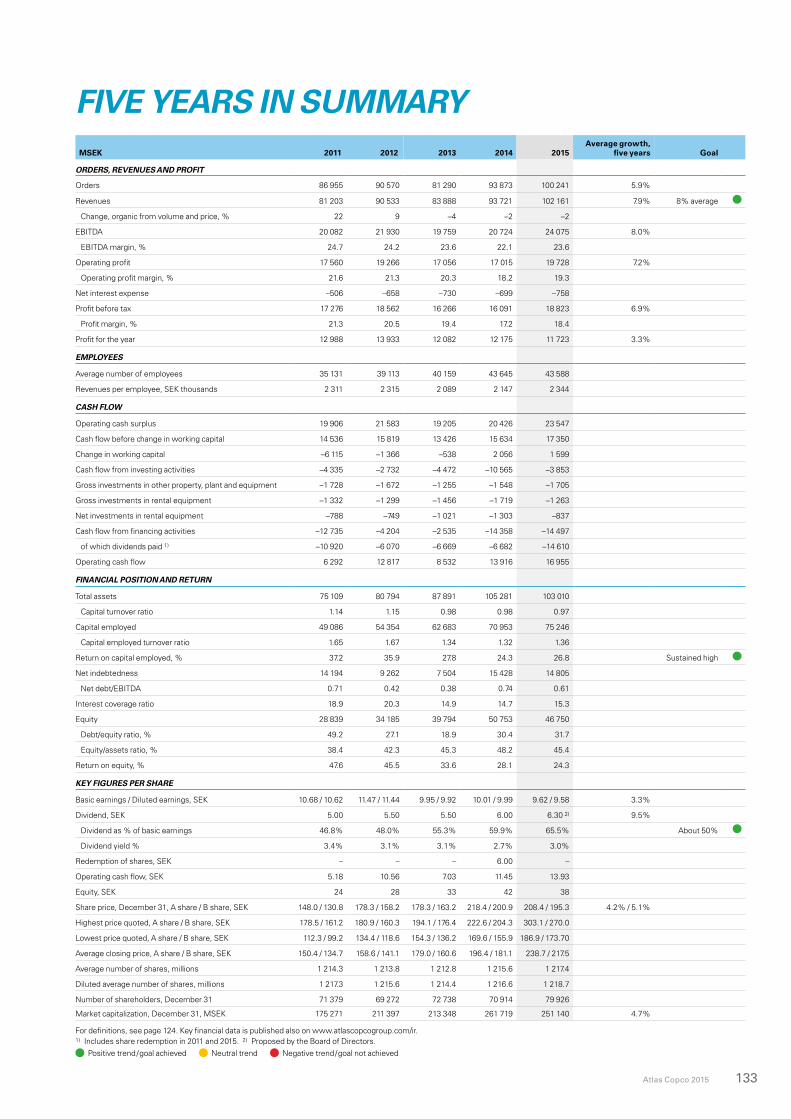
Atlas Copco 2015 133
FIVE YEARS IN SUMMARY MSEK 2011 2012 2013 2014 2015
Average growth, five years Goal
ORDERS, REVENUES AND PROFIT
Orders 86 955 90 570 81 290 93 873 100 241 5.9%
Revenues 81 203 90 533 83 888 93 721 102 161 7.9% 8% average
Change, organic from volume and price, % 22 9 –4 –2 –2
EBITDA 20 082 21 930 19 759 20 724 24 075 8.0%
EBITDA margin, % 24.7 24.2 23.6 22.1 23.6
Operating profit 17 560 19 266 17 056 17 015 19 728 7.2%
Operating profit margin, % 21.6 21.3 20.3 18.2 19.3
Net interest expense –506 –658 –730 –699 –758
Profit before tax 17 276 18 562 16 266 16 091 18 823 6.9%
Profit margin, % 21.3 20.5 19.4 17.2 18.4
Profit for the year 12 988 13 933 12 082 12 175 11 723 3.3%
EMPLOYEES
Average number of employees 35 131 39 113 40 159 43 645 43 588
Revenues per employee, SEK thousands 2 311 2 315 2 089 2 147 2 344
CASH FLOW
Operating cash surplus 19 906 21 583 19 205 20 426 23 547
Cash flow before change in working capital 14 536 15 819 13 426 15 634 17 350
Change in working capital –6 115 –1 366 –538 2 056 1 599
Cash flow from investing activities –4 335 –2 732 –4 472 –10 565 –3 853
Gross investments in other property, plant and equipment –1 728 –1 672 –1 255 –1 548 –1 705
Gross investments in rental equipment –1 332 –1 299 –1 456 –1 719 –1 263
Net investments in rental equipment –788 –749 –1 021 –1 303 –837
Cash flow from financing activities –12 735 –4 204 –2 535 –14 358 –14 497
of which dividends paid 1) –10 920 –6 070 –6 669 –6 682 –14 610
Operating cash flow 6 292 12 817 8 532 13 916 16 955
FINANCIAL POSITION AND RETURN
Total assets 75 109 80 794 87 891 105 281 103 010
Capital turnover ratio 1.14 1.15 0.98 0.98 0.97
Capital employed 49 086 54 354 62 683 70 953 75 246
Capital employed turnover ratio 1.65 1.67 1.34 1.32 1.36
Return on capital employed, % 37.2 35.9 27.8 24.3 26.8 Sustained high
Net indebtedness 14 194 9 262 7 504 15 428 14 805
Net debt/EBITDA 0.71 0.42 0.38 0.74 0.61
Interest coverage ratio 18.9 20.3 14.9 14.7 15.3
Equity 28 839 34 185 39 794 50 753 46 750
Debt/equity ratio, % 49.2 27.1 18.9 30.4 31.7
Equity/assets ratio, % 38.4 42.3 45.3 48.2 45.4
Return on equity, % 47.6 45.5 33.6 28.1 24.3
KEY FIGURES PER SHARE
Basic earnings / Diluted earnings, SEK 10.68 / 10.62 11.47 / 11.44 9.95 / 9.92 10.01 / 9.99 9.62 / 9.58 3.3%
Dividend, SEK 5.00 5.50 5.50 6.00 6.30 2) 9.5%
Dividend as % of basic earnings 46.8% 48.0% 55.3% 59.9% 65.5% About 50%
Dividend yield % 3.4% 3.1% 3.1% 2.7% 3.0%
Redemption of shares, SEK – – – 6.00 –
Operating cash flow, SEK 5.18 10.56 7.03 11.45 13.93
Equity, SEK 24 28 33 42 38
Share price, December 31, A share / B share, SEK 148.0 / 130.8 178.3 / 158.2 178.3 / 163.2 218.4 / 200.9 208.4 / 195.3 4.2% / 5.1%
Highest price quoted, A share / B share, SEK 178.5 / 161.2 180.9 / 160.3 194.1 / 176.4 222.6 / 204.3 303.1 / 270.0
Lowest price quoted, A share / B share, SEK 112.3 / 99.2 134.4 / 118.6 154.3 / 136.2 169.6 / 155.9 186.9 / 173.70
Average closing price, A share / B share, SEK 150.4 / 134.7 158.6 / 141.1 179.0 / 160.6 196.4 / 181.1 238.7 / 217.5
Average number of shares, millions 1 214.3 1 213.8 1 212.8 1 215.6 1 217.4
Diluted average number of shares, millions 1 217.3 1 215.6 1 214.4 1 216.6 1 218.7
Number of shareholders, December 31 71 379 69 272 72 738 70 914 79 926
Market capitalization, December 31, MSEK 175 271 211 397 213 348 261 719 251 140 4.7%
For definitions, see page 124. Key financial data is published also on www.atlascopcogroup.com/ir.1) Includes share redemption in 2011 and 2015. 2) Proposed by the Board of Directors.
Positive trend/goal achieved Neutral trend Negative trend/goal not achieved
9853 8333 01
COMMITTED TO SUSTAINABLE PRODUCTIVITY
We stand by our responsibilities towards our customers, towards the environment and the people around us. We make performance stand the test of time. This is what we call – Sustainable Productivity.
Atlas Copco AB (publ) SE-105 23 Stockholm, Sweden Phone: +46 8 743 80 00 Reg.no: 556014-2720 www.atlascopcogroup.com


![Atlas Copco (India) Limited · 3. Atlas Copco International B.V. ACO0101339 4. Atlas Copco AB ACO0101595, ACO0101097, A 0005191 and 10177354 5. Atlas Copco [I] Ltd Charitable Foundation](https://static.documents.pub/doc/80x56/5ec4197bfe534e04f779e397/atlas-copco-india-limited-3-atlas-copco-international-bv-aco0101339-4-atlas.jpg)


