46
ATLAS COPCO GROUP Atlas Copco Capital Markets Day 2015 Ronnie Leten, President and CEO Hans Ola Meyer, CFO

ATLAS COPCO GROUP
Atlas Copco Capital Markets Day 2015
Ronnie Leten, President and CEO
Hans Ola Meyer, CFO

ATLAS COPCO
A world leading provider of sustainable
productivity solutions
Consistent strategy
Agile and resilient operations
Strong global service business
Strong cash generation and value creation
Group Presentation
Atlas Copco Capital Markets Day 2015
2

1. Facts in Brief
2. Vacuum Solutions
- Status update
3. Innovation
4. Service
5. Summary
1. Business development
2. Global trends
3. Strategy and priorities
4. Agility and resilience
5. Summary
AGENDA
Group Presentation
Atlas Copco Capital Markets Day 2015
3
BUSINESS DEVELOPMENT
Group Presentation
Atlas Copco Capital Markets Day 2015
4
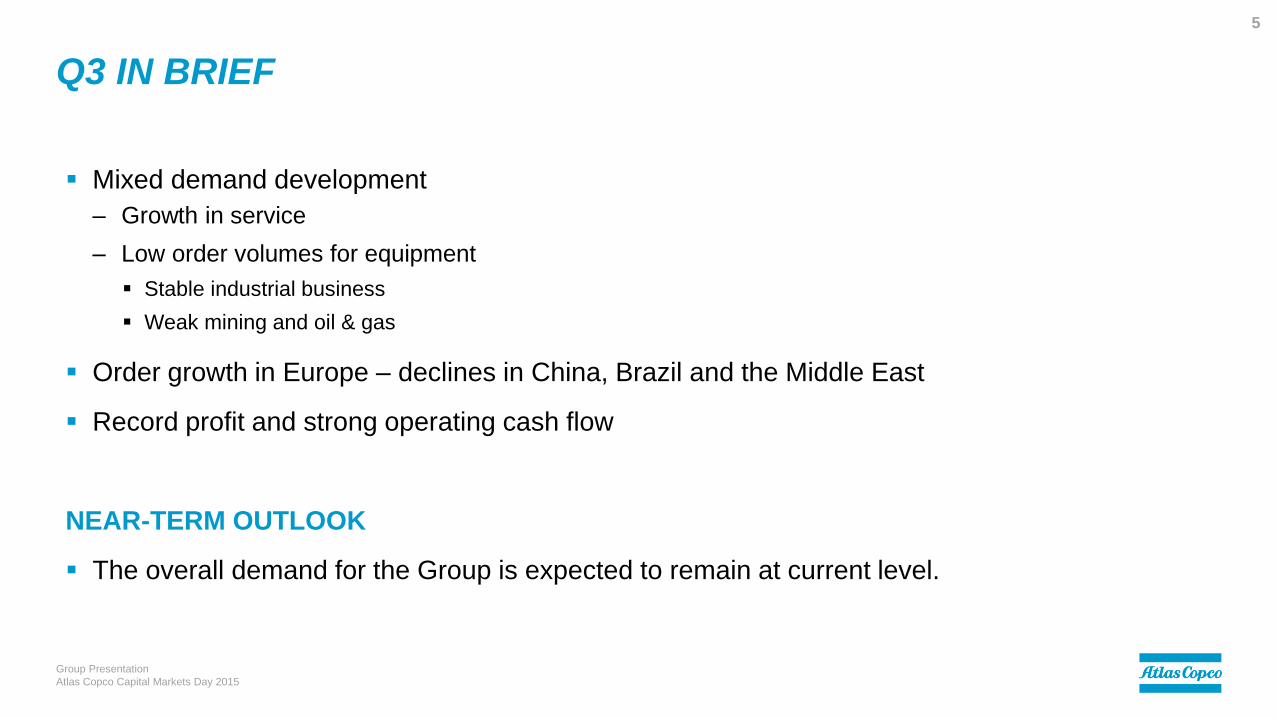
Q3 IN BRIEF
Mixed demand development
– Growth in service
– Low order volumes for equipment
Stable industrial business
Weak mining and oil & gas
Order growth in Europe – declines in China, Brazil and the Middle East
Record profit and strong operating cash flow
NEAR-TERM OUTLOOK
The overall demand for the Group is expected to remain at current level.
Group Presentation
Atlas Copco Capital Markets Day 2015
5

ORDERS RECEIVED - LOCAL CURRENCY
Group Presentation
Atlas Copco Capital Markets Day 2015
6
Atlas Copco Group
100 -1 -3
24 -3 -7
8 -13 -17
30 +5 +7
10 -3 -18
25 -1 +2
3 -13 -20September 2015
A Share of orders received, year-to-date, %
B Year-to-date vs. previous year, %
C Last 3 months vs. previous year, %
MSEK 2015 2014 % 2015 2014 %
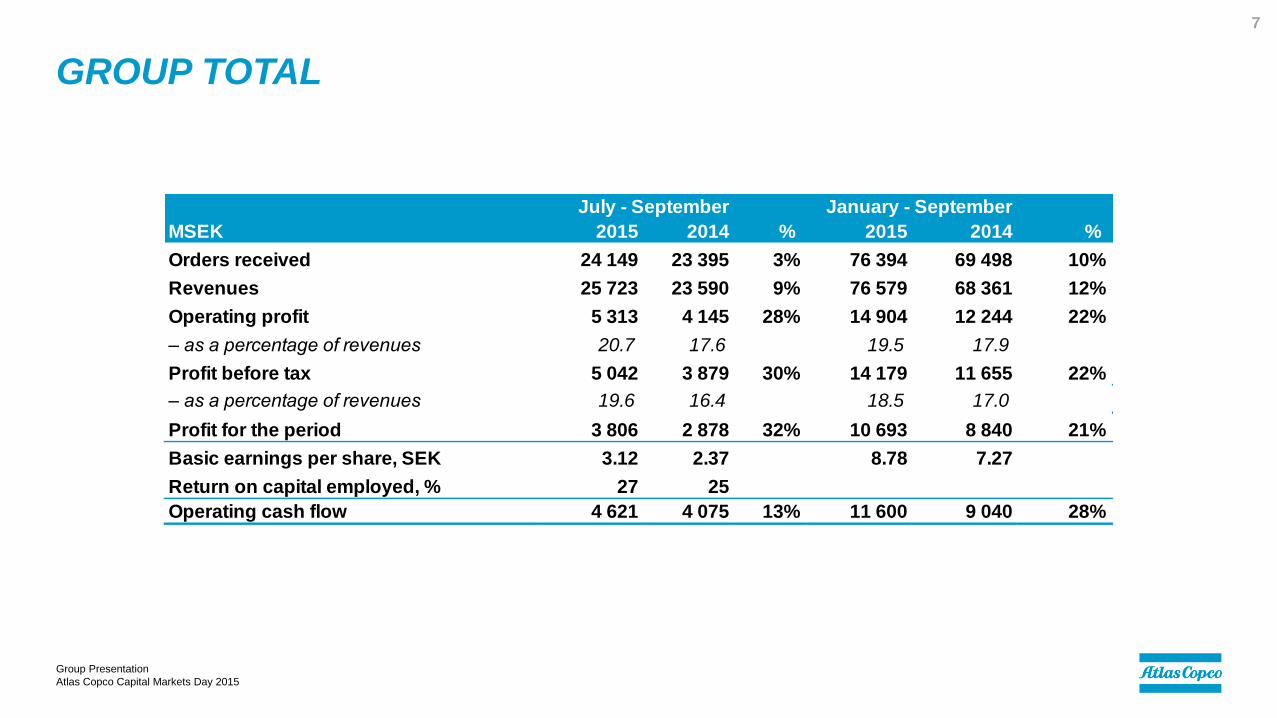
Orders received 24 149 23 395 3% 76 394 69 498 10%
Revenues 25 723 23 590 9% 76 579 68 361 12%
Operating profit 5 313 4 145 28% 14 904 12 244 22%
– as a percentage of revenues 20.7 17.6 19.5 17.9
Profit before tax 5 042 3 879 30% 14 179 11 655 22%
– as a percentage of revenues 19.6 16.4 18.5 17.0
Profit for the period 3 806 2 878 32% 10 693 8 840 21%
Basic earnings per share, SEK 3.12 2.37 8.78 7.27
Return on capital employed, % 27 25
Operating cash flow 4 621 4 075 13% 11 600 9 040 28%
July - September January - September
GROUP TOTAL
Group Presentation
Atlas Copco Capital Markets Day 2015
7

ORDERS RECEIVED BY CUSTOMER CATEGORY
Manufacturing25%
Process industry
11%
Mining28%
Construction24%
Other 12%
2010MSEK 75 178
Manufacturing34%
Process industry
14%
Mining20%
Construction19%
Other13%
September 2015MSEK 100 769
Group Presentation
Atlas Copco Capital Markets Day 2015
8
36%
52% 48%39%
12 month figures.

REVENUES BY BUSINESS AREA
Compressor Technique
43%
Industrial Technique
9%
Mining and Rock
Excavation Technique
32%
Construction Technique
16%
2010MSEK 69 875
Compressor Technique
45%
Industrial Technique
14%
Mining and Rock
Excavation Technique
26%
Construction Technique
15%
September 2015MSEK 101 939
Group Presentation
Atlas Copco Capital Markets Day 2015
9
12 month figures.
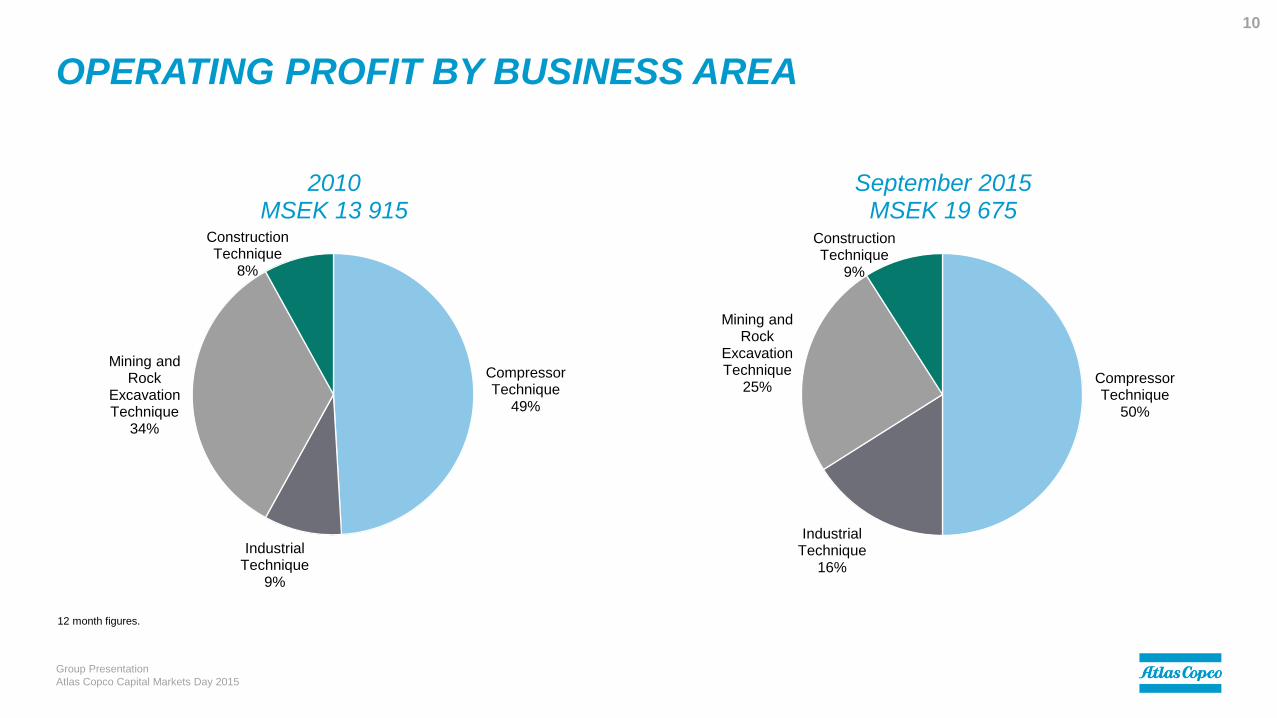
OPERATING PROFIT BY BUSINESS AREA
Compressor Technique
49%
Industrial Technique
9%
Mining and Rock
Excavation Technique
34%
Construction Technique
8%
2010MSEK 13 915
Compressor Technique
50%
Industrial Technique
16%
Mining and Rock
Excavation Technique
25%
Construction Technique
9%
September 2015MSEK 19 675
Group Presentation
Atlas Copco Capital Markets Day 2015
10
12 month figures.

ORGANIC GROWTH
- 15
- 10
- 5
0
5
10
15
20
25
30
35
2011 2012 2013 2014 2015 YTD
Growth % - Total Growth % - Total organic
- 15
- 10
- 5
0
5
10
15
20
25
30
35
Q111
Q211
Q311
Q411
Q112
Q212
Q312
Q412
Q113
Q213
Q313
Q413
Q114
Q214
Q314
Q414
Q115
Q215
Q315
Growth % - Equipment organic Growth % - Service organic
Growth % - Consumables organic
Group Presentation
Atlas Copco Capital Markets Day 2015
11
Revenues

GLOBAL TRENDS
Group Presentation
Atlas Copco Capital Markets Day 2015
12
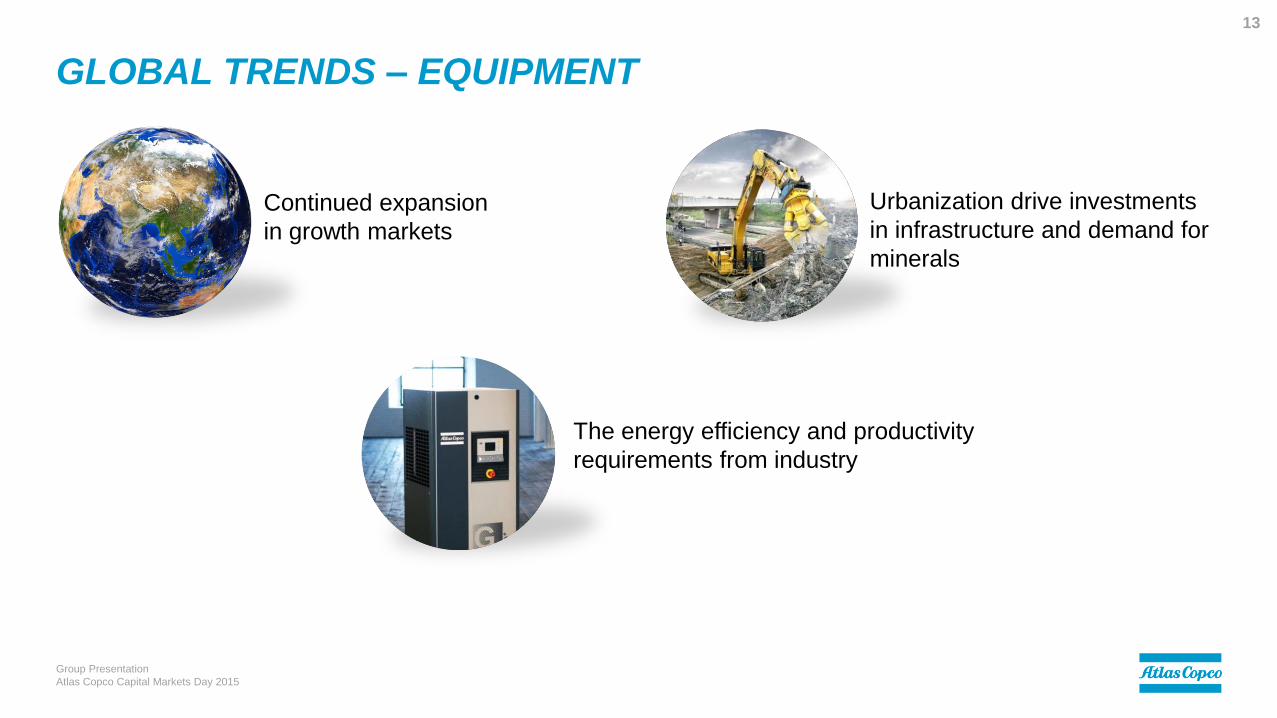
GLOBAL TRENDS – EQUIPMENT
Group Presentation
Atlas Copco Capital Markets Day 2015
13
Urbanization drive investments
in infrastructure and demand for
minerals
The energy efficiency and productivity
requirements from industry
Continued expansion
in growth markets

GLOBAL TRENDS – SERVICE
Group Presentation
Atlas Copco Capital Markets Day 2015
14
Customers focus
on core activity
Connectivity
Expansion of
installed base
The energy efficiency and
productivity requirements
from industry
STRATEGY AND PRIORITIES
Sustainable profitable growth
Group Presentation
Atlas Copco Capital Markets Day 2015
15

WHY SHOULD ATLAS COPCO SUCCEED TO GROW?
Market leader with strong portfolio of businesses
and products
Commitment to innovation
Strong service offering
Acquisition potential
Top organization, world-class people, top execution
Group Presentation
Atlas Copco Capital Markets Day 2015
16
8% growth
High ROCE

WHY SHOULD ATLAS COPCO DELIVER HIGH ROCE?
Standardization and efficient flow
Asset light operations
Variable cost structure
Strong service business
Group Presentation
Atlas Copco Capital Markets Day 2015
17
8% growth
High ROCE
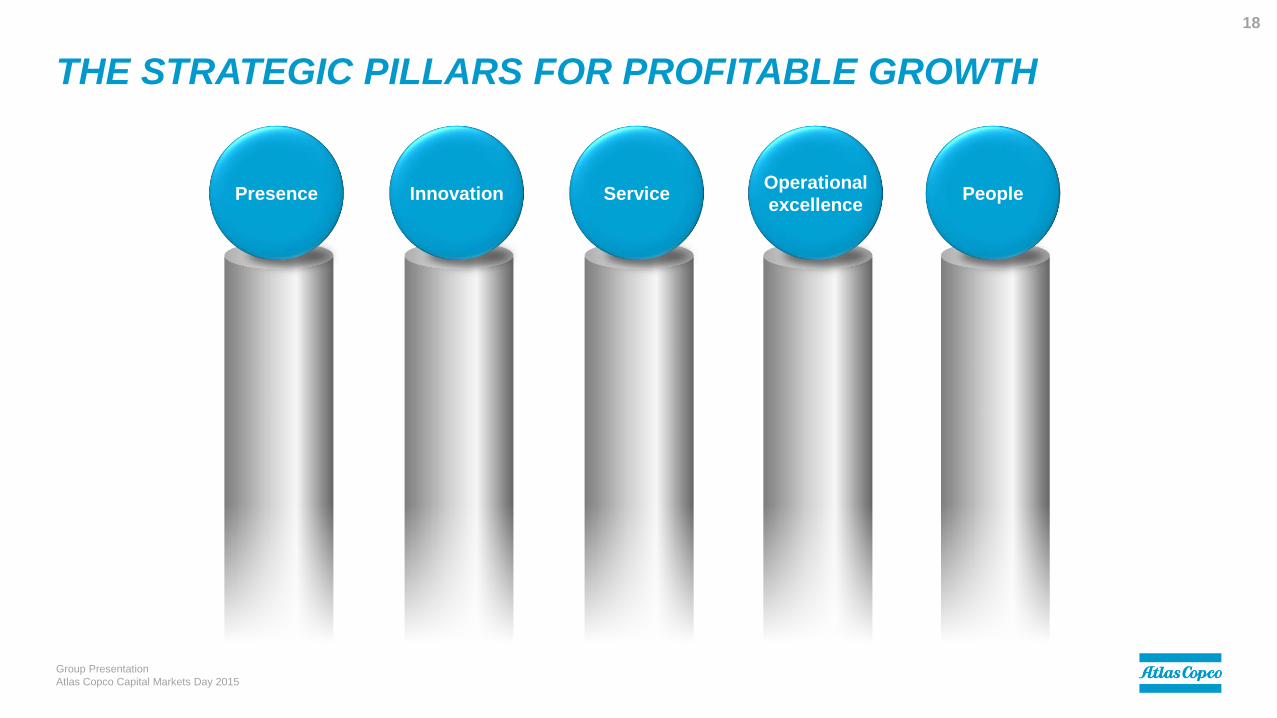
THE STRATEGIC PILLARS FOR PROFITABLE GROWTH
Group Presentation
Atlas Copco Capital Markets Day 2015
18
PeoplePresence Innovation ServiceOperational
excellence

PRIORITIES TO SUSTAIN PROFITABLE GROWTH
Group Presentation
Atlas Copco Capital Markets Day 2015
19
WE LIVE BY THE
HIGHEST ETHICAL
STANDARDS
WE INVEST IN
SAFETY AND
WELL-BEING
WE USE RESOURCES
RESPONSIBLY
AND EFFICIENTLY
WE BUILD THE
MOST COMPETENT
TEAMS
WE INNOVATE FOR
SUSTAINABLE
PRODUCTIVITY

Group Presentation
Atlas Copco Capital Markets Day 2015
20
SUSTAINABLE PROFITABLE GROWTH
PeoplePresence Innovation ServiceOperational
Excellence
8% growth
High ROCE

INCREASE PRESENCE IN FAST GROWING ECONOMIES
…AND STRENGTHEN IN MATURE MARKETS
Direct presence
Develop local competence
Create high brand awareness
Group Presentation
Atlas Copco Capital Markets Day 2015
21
Presence

ACQUISITION STRATEGY
Acquisitions are primarily made in, or very close to, the already existing core businesses.
All acquired businesses are expected to make a positive contribution to economic value added.
Characteristics
Group Presentation
Atlas Copco Capital Markets Day 2015
22
Presence
Industry-to-industry
Geographically spread customer base
Leadership in niche markets
Differentiated core technology
Strong base of business partners
Healthy service potential
Leveraging...
Application knowledge
Efficient manufacturing and product
development processes
Capacity to swiftly market products and
services globally
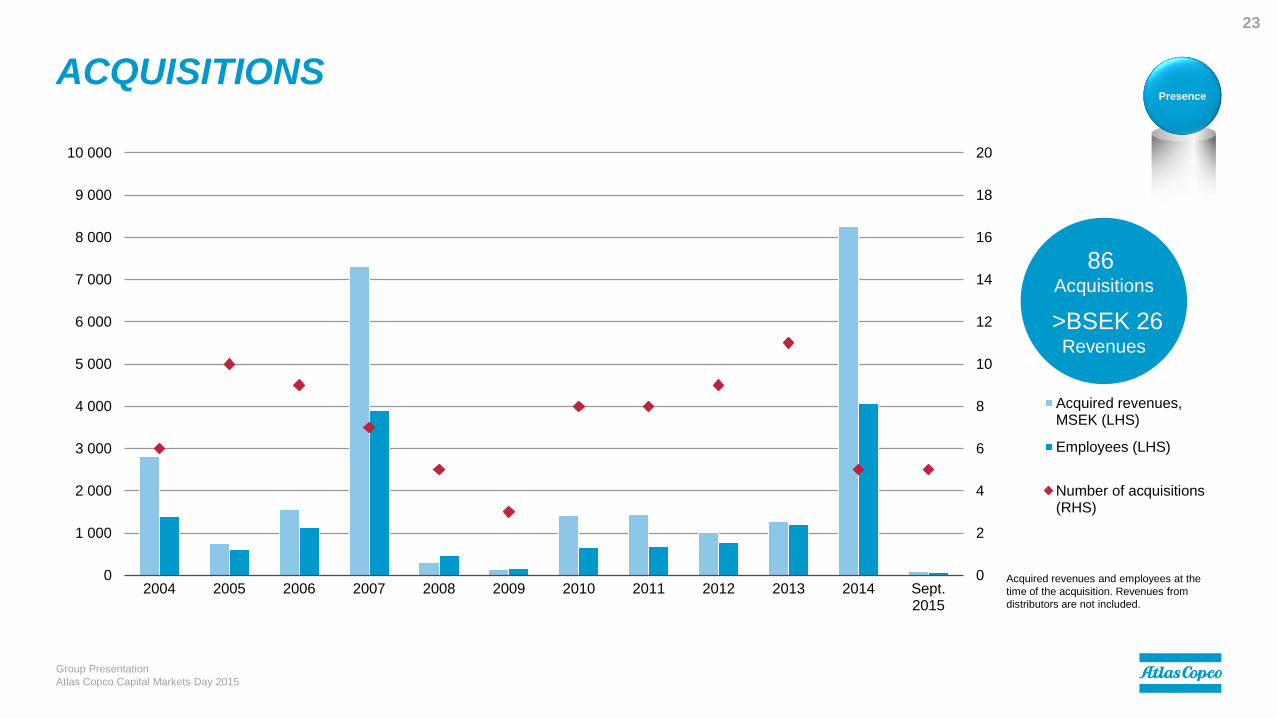
ACQUISITIONS
0
2
4
6
8
10
12
14
16
18
20
0
1 000
2 000
3 000
4 000
5 000
6 000
7 000
8 000
9 000
10 000
2004 2005 2006 2007 2008 2009 2010 2011 2012 2013 2014 Sept.2015
Acquired revenues,MSEK (LHS)
Employees (LHS)
Number of acquisitions(RHS)
Group Presentation
Atlas Copco Capital Markets Day 2015
23
Acquired revenues and employees at the
time of the acquisition. Revenues from
distributors are not included.
Presence
86 Acquisitions
>BSEK 26Revenues

Innovation
WHY DRIVE FOR INNOVATION?
Creates sustainable customer productivity
Reduces life cycle cost
– Drives energy efficiency
– Increase safety
Drives organic growth
Supports/drives profitability
– Pricing power
– Cost savings
0,0%
0,5%
1,0%
1,5%
2,0%
2,5%
3,0%
3,5%
4,0%
0
500
1 000
1 500
2 000
2 500
3 000
3 500
4 000
2007 2008 2009 2010 2011 2012 2013 2014 Sept.2015
Research and development expenses, including capitalized expenditures, MSEK
Total as % of revenues
Group Presentation
Atlas Copco Capital Markets Day 2015
24

INNOVATION
Group Presentation
Atlas Copco Capital Markets Day 2015
25
Compressor Technique 2011 – 2015 Innovation
INNOVATION
Group Presentation
Atlas Copco Capital Markets Day 2015
26
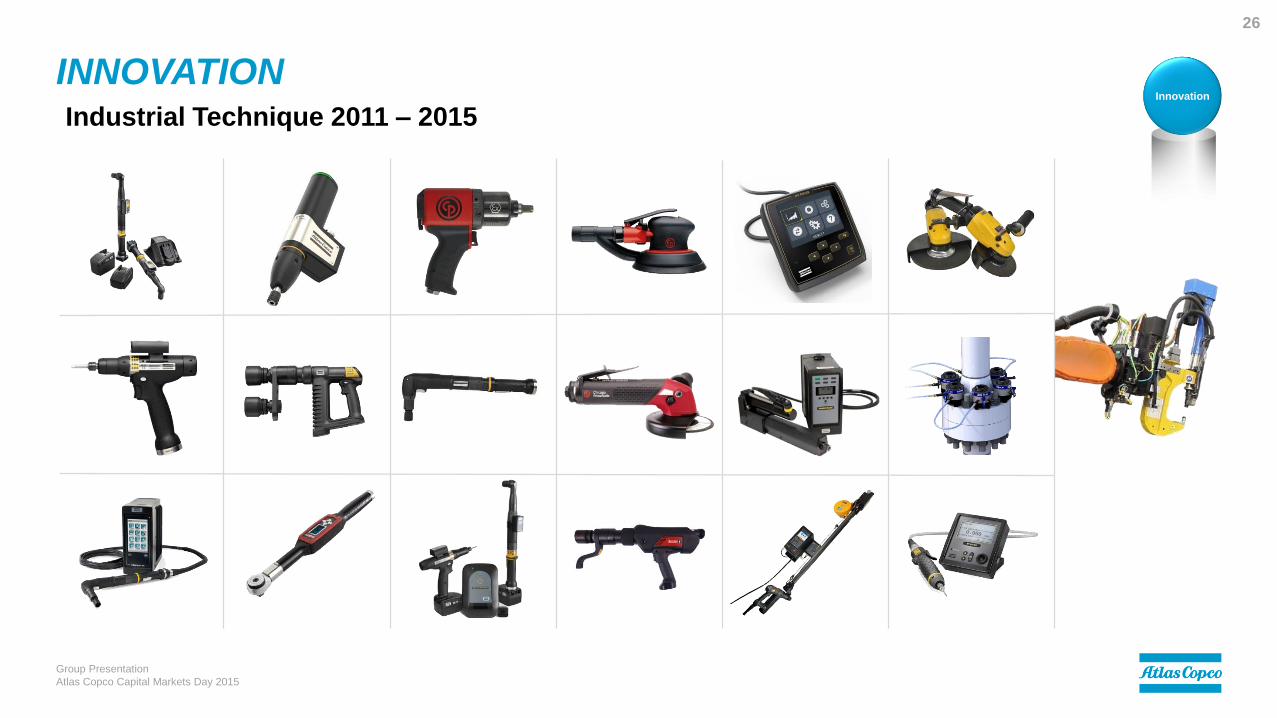
Industrial Technique 2011 – 2015 Innovation

INNOVATION
Group Presentation
Atlas Copco Capital Markets Day 2015
27
Mining and Rock Excavation Technique 2011 – 2015 Innovation
INNOVATION
Group Presentation
Atlas Copco Capital Markets Day 2015
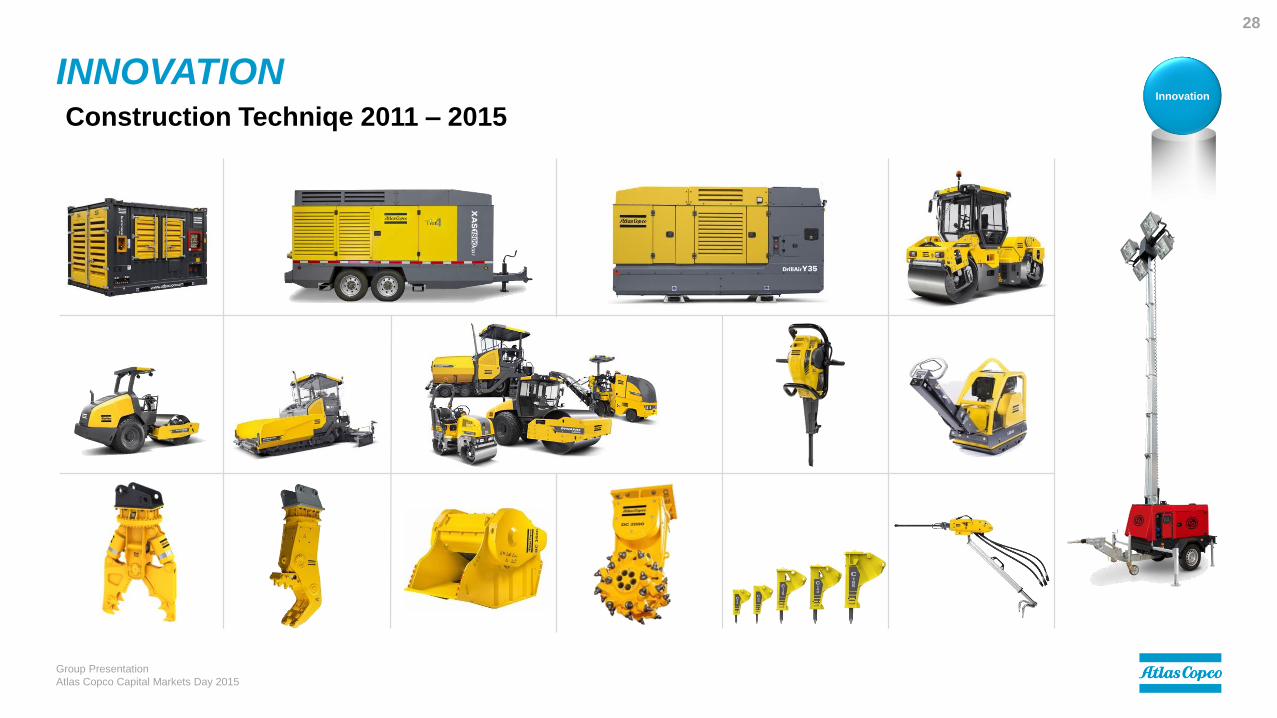
28
Construction Techniqe 2011 – 2015 Innovation
0%
10%
20%
30%
40%
50%
60%
0
10 000
20 000
30 000
40 000
50 000
60 000
2004 2005 2006 2007 2008 2009 2010 2011 2012 2013 2014 Sept. 2015
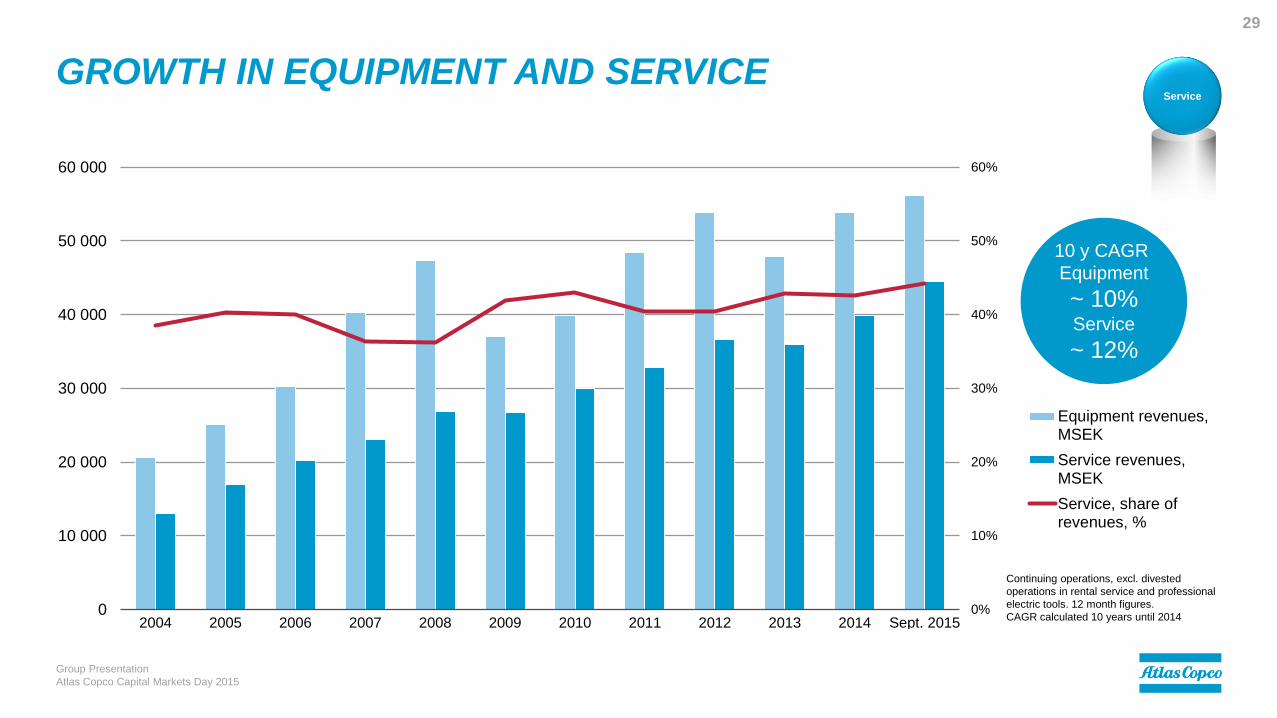
Equipment revenues,MSEK
Service revenues,MSEK
Service, share ofrevenues, %
Group Presentation
Atlas Copco Capital Markets Day 2015
29
Service
Continuing operations, excl. divested
operations in rental service and professional
electric tools. 12 month figures.
CAGR calculated 10 years until 2014
10 y CAGR
Equipment
~ 10%Service
~ 12%
GROWTH IN EQUIPMENT AND SERVICE
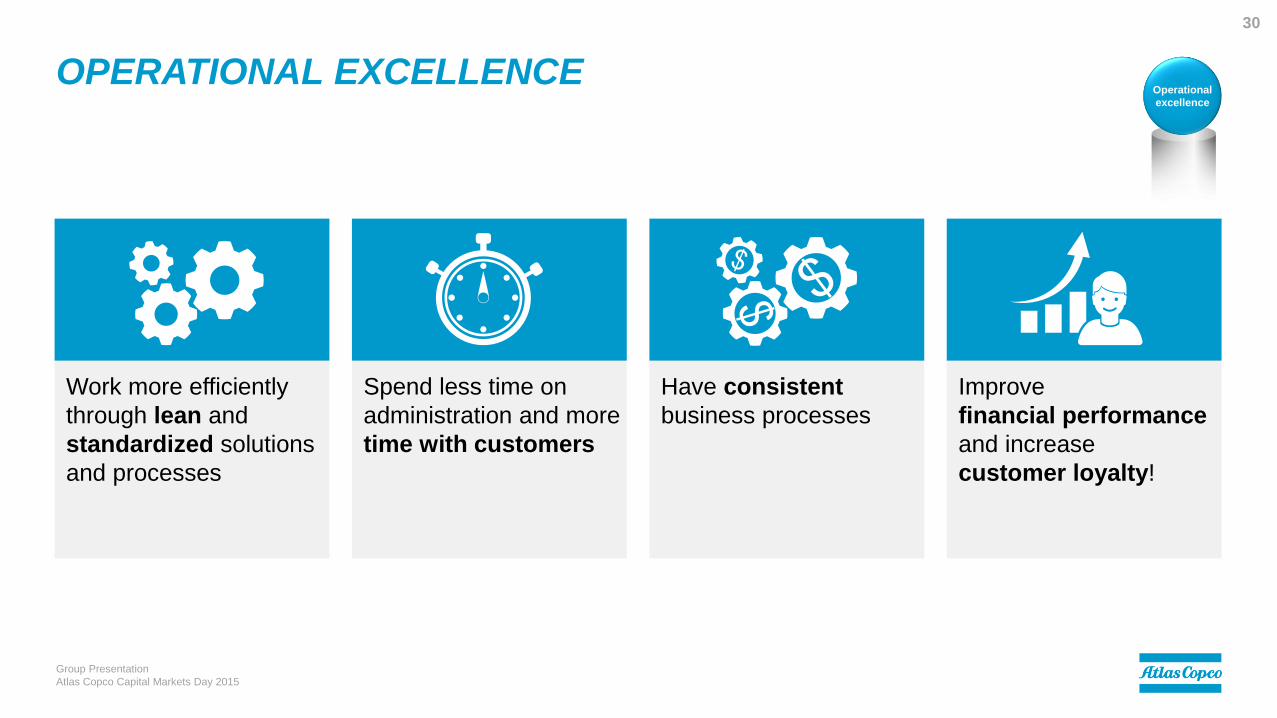
OPERATIONAL EXCELLENCE
Group Presentation
Atlas Copco Capital Markets Day 2015
30
Work more efficiently
through lean and
standardized solutions
and processes
Spend less time on
administration and more
time with customers
Have consistent
business processes
Improve
financial performance
and increase
customer loyalty!
Operational
excellence

PEOPLE
Results-driven and committed culture
Time to competence
Diversity
Attract and retain talent
Group Presentation
Atlas Copco Capital Markets Day 2015
31
People

CULTURE, VALUES AND BUSINESS PRINCIPLES
Group Presentation
Atlas Copco Capital Markets Day 2015
32
“We grow loyal
and experienced
local leaders in
all countries”
People
AGILITY AND RESILIENCE
Group Presentation
Atlas Copco Capital Markets Day 2015
33

AGILE AND RESILIENT OPERATIONS
Group Presentation
Atlas Copco Capital Markets Day 2015
34
Volu
me / P
rofits
Deteriorating business climate
Reduce variable costs
Working capital reduction
Improving business climate
Add variable costs
Working capital increase
Small incremental
investments
Variable cost structure and asset light operations
Stable service business
Continuous investments in innovation
Competent and committed employees
Resilience
Agile
operational
set-up

- 800
- 600
- 400
- 200
0
200
2005 2006 2007 2008 2009 2010 2011 2012 2013 2014 Sept.2015
Restructuring costs,MSEK
-2,0%
-1,5%
-1,0%
-0,5%
0,0%
0,5%
in % of revenues
RESTRUCTURING WITHOUT RESTRUCTURING COSTS
Group Presentation
Atlas Copco Capital Markets Day 2015
35
Reported restructuring costs,
including impairments.
12 months figures
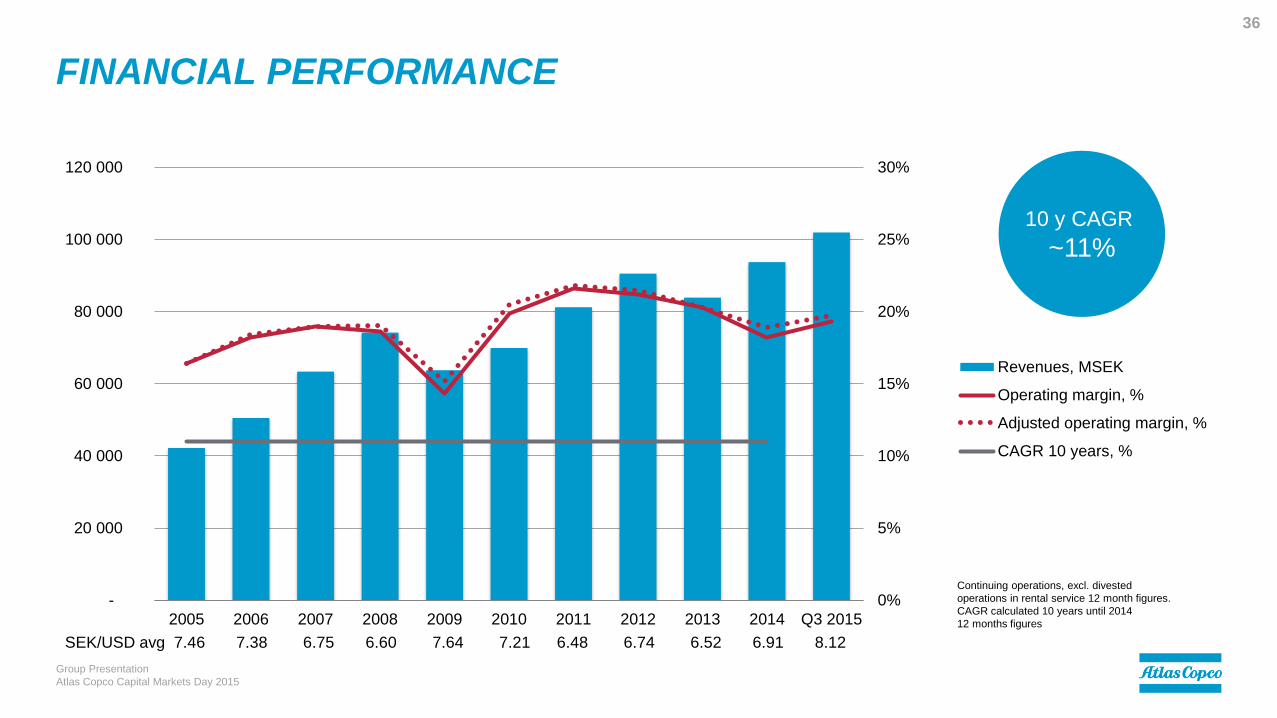
FINANCIAL PERFORMANCE
0%
5%
10%
15%
20%
25%
30%
-
20 000
40 000
60 000
80 000
100 000
120 000
2005 2006 2007 2008 2009 2010 2011 2012 2013 2014 Q3 2015
Revenues, MSEK
Operating margin, %
Adjusted operating margin, %
CAGR 10 years, %
Group Presentation
Atlas Copco Capital Markets Day 2015
36
Continuing operations, excl. divested
operations in rental service 12 month figures.
CAGR calculated 10 years until 2014
12 months figures
10 y CAGR
~11%
SEK/USD avg 7.46 7.38 6.75 6.60 7.64 7.21 6.48 6.74 6.52 6.91 8.12

Q4 94 - Q3 96 Q4 97 - Q3 99 Q2 00 - Q1 02 Q4 07 - Q3 09 Q1 12 – Q4 13
10.2%10.6%
12.6%13.2%
13.4%
12.7%
19.7%
15.9%
20.7%19.5%
20.7%
0%
5%
10%
15%
20%
25%
94
Q4
95
Q4
96
Q4
97
Q4
98
Q4
99
Q4
00
Q4
01
Q4
02
Q4
03
Q4
04
Q4
05
Q4
06
Q4
07
Q4
08
Q4
09
Q4
10
Q4
11
Q4
12
Q4
13
Q4
14
Q4
Operating margin, %
14%
-1%
3%
-3%
8%
-3%
14%
-18%
7%
-5% -4%-3%
-20%
-10%
0%
10%
20%
Average volume change in the period, %
RESILIENCE
Larger share of service
Lean foot-print – asset light
Decentralized Group
Group Presentation
Atlas Copco Capital Markets Day 2015
37
In periods of volume declines
Average volume change. Quarterly reported
operating margin, excluding Rental Service

0
5 000
10 000
15 000
20 000
25 000
2005 2006 2007 2008 2009 2010 2011 2012 2013 2014 Sept.2015
Average property, plantand equipment, MSEK
Average net workingcapital, MSEK
0%
10%
20%
30%
40%
50%
in % of revenues
in % of revenues
ASSET LIGHT
Group Presentation
Atlas Copco Capital Markets Day 2015
38
Average working capital and property,
plant and equipment Including
discontinued operations.

0%
50%
100%
150%
200%
0
5 000
10 000
15 000
20 000
2005 2006 2007 2008 2009 2010 2011 2012 2013 2014 Sept.2015
Profit for the period,MSEK (continuingoperations)
Operating cash flow,MSEK
Cash conversion, %
Group Presentation
Atlas Copco Capital Markets Day 2015
39
CASH GENERATION
Cash conversion=operating cash flow / net
profit from continuing operations.
Operating cash flow adjusted from 2012 for
cash flows from currency hedges of loans
12 months figures
10 year cash
conversion
89%
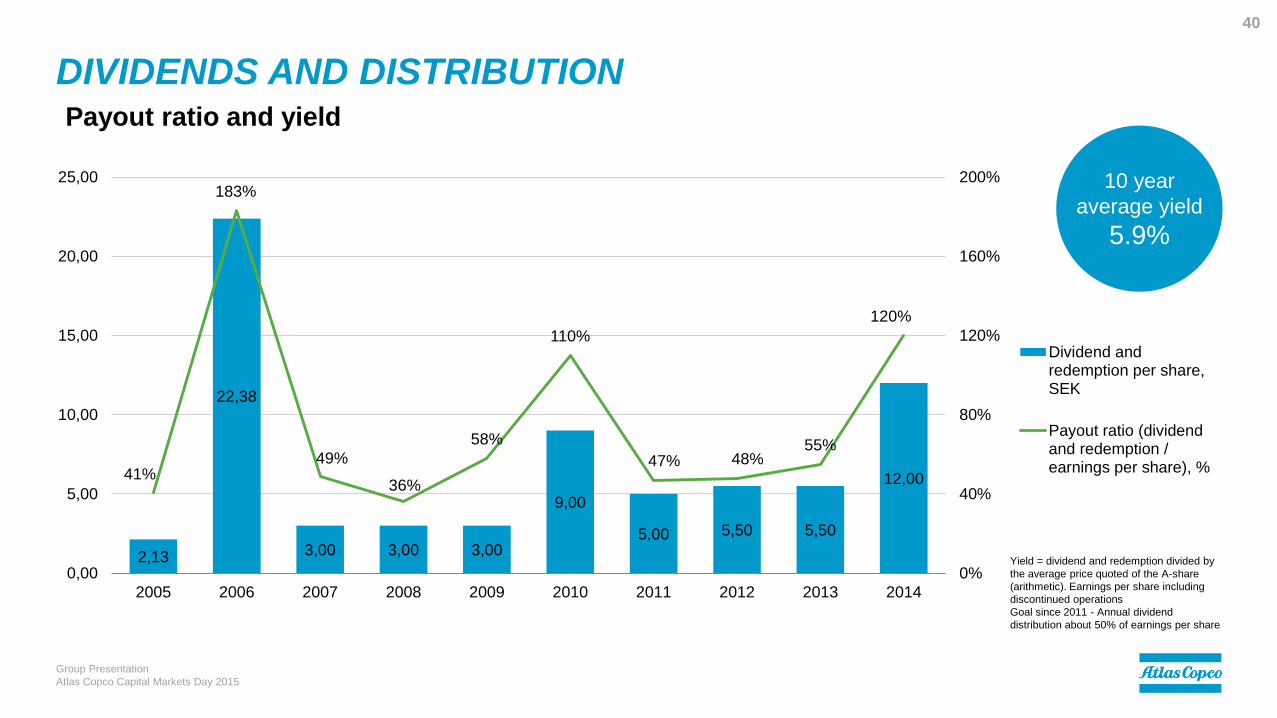
DIVIDENDS AND DISTRIBUTION
2,13
22,38
3,00 3,00 3,00
9,00
5,00 5,50 5,50
12,0041%
183%
49%
36%
58%
110%
47% 48%55%
120%
0%
40%
80%
120%
160%
200%
0,00
5,00
10,00
15,00
20,00
25,00
2005 2006 2007 2008 2009 2010 2011 2012 2013 2014
Dividend andredemption per share,SEK
Payout ratio (dividendand redemption /earnings per share), %
Group Presentation
Atlas Copco Capital Markets Day 2015
40
Payout ratio and yield
10 year
average yield
5.9%
Yield = dividend and redemption divided by
the average price quoted of the A-share
(arithmetic). Earnings per share including
discontinued operations
Goal since 2011 - Annual dividend
distribution about 50% of earnings per share

CAPITAL STRUCTURE
Group Presentation
Atlas Copco Capital Markets Day 2015
41
Net Debt*/EBITDA
* Net Debt adjusted for the fair value of interest rate swaps
-1,5
-1,0
-0,5
0,0
0,5
1,0
1,5
2,0
2005 2006 2007 2008 2009 2010 2011 2012 2013 2014 2015 Q3
Net Debt/EBITDA
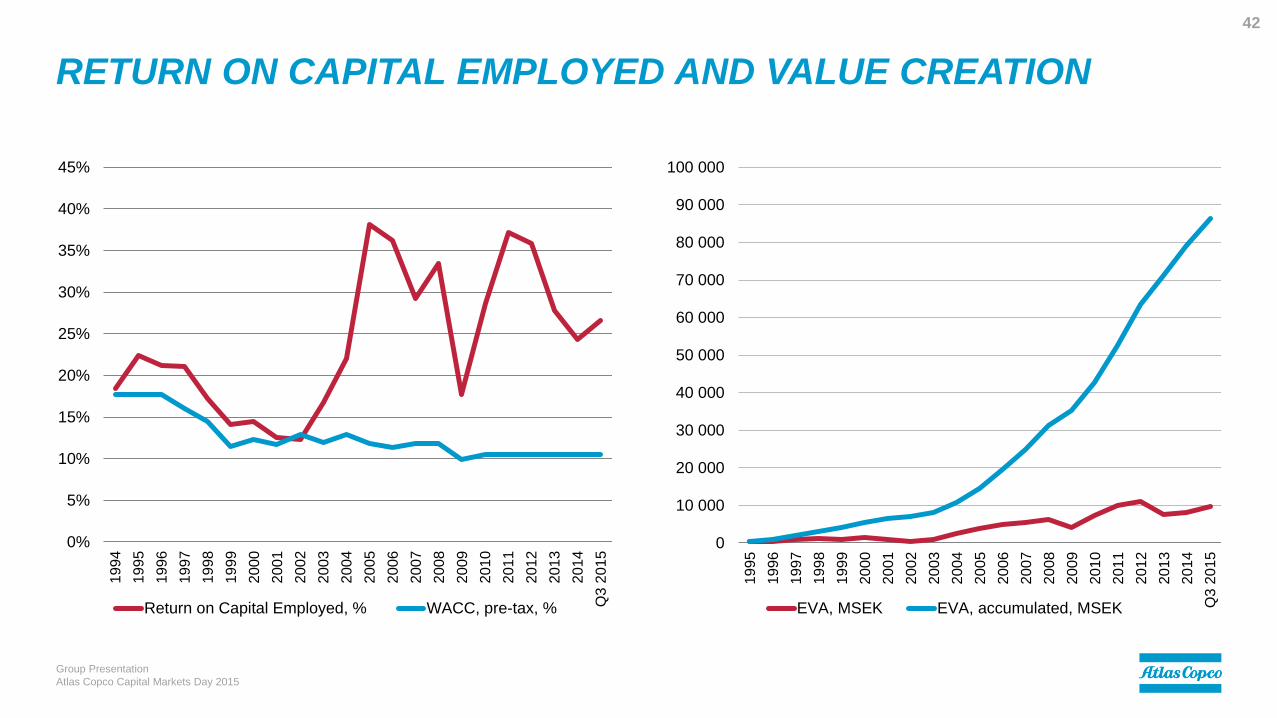
RETURN ON CAPITAL EMPLOYED AND VALUE CREATION
0%
5%
10%
15%
20%
25%
30%
35%
40%
45%
1994
1995
1996
1997
1998
1999
2000
2001
2002
2003
2004
2005
2006
2007
2008
2009
2010
2011
2012
2013
2014
Q3
20
15
Return on Capital Employed, % WACC, pre-tax, %
0
10 000
20 000
30 000
40 000
50 000
60 000
70 000
80 000
90 000
100 000
1995
1996
1997
1998
1999
2000
2001
2002
2003
2004
2005
2006
2007
2008
2009
2010
2011
2012
2013
2014
Q3
20
15
EVA, MSEK EVA, accumulated, MSEK
Group Presentation
Atlas Copco Capital Markets Day 2015
42

SUMMARY
A world leading provider of sustainable
productivity solutions
Agile and resilient operations
Strong global service business
Consistent strategy
Strong cash generation and value creation
Fit for more
Group Presentation
Atlas Copco Capital Markets Day 2015
43

COMMITTED TO
SUSTAINABLE PRODUCTIVITY.
Group Presentation
Atlas Copco Capital Markets Day 2015
44

CAUTIONARY STATEMENT
“Some statements herein are forward-looking and the actual outcome could be materially
different. In addition to the factors explicitly commented upon, the actual outcome could be
materially and adversely affected by other factors such as the effect of economic conditions,
exchange-rate and interest-rate movements, political risks, the impact of competing products
and their pricing, product development, commercialization and technological difficulties, supply
disturbances, and major customer credit losses.”
Group Presentation
Atlas Copco Capital Markets Day 2015
46


