17
Description 2019-20 2018-19 Inflation 8.6% 11.4% Policy Rates 7.0% 13.3% ATLAS HONDA LIMITED Financial Year Ended March 31, 2020 Corporate Briefing Session - 2020
Description 2019-20 2018-19
Inflation 8.6% 11.4%
Policy Rates 7.0% 13.3%
ATLAS HONDA LIMITED
Financial Year Ended
March 31, 2020
Corporate Briefing
Session - 2020

REMEMBERING OUR LEGEND
• October 20, 2019 will be remembered as a sad
day in Atlas History.
• He was a Visionary person with unique business
acumen.
• One of the most Successful first generation
entrepreneurs of Pakistan.
• His Collaboration with Honda Motor has paved
the way for establishment of the Auto Industry in
Pakistan.
• He managed to build enduring joint ventures
with world-renowned foreign companies.
• Mr. Shirazi was highly respected as a patriot,
industrialist, author and philanthropist, in
recognition of his services he was decorated
with Sitara-e-Essar and Sitara-e-Imtiaz by
Government of Pakistan.
• We will continue to draw inspiration from his
extraordinary life and be guided by his principles
of the ATLAS WAY

S.NO AGENDA ITEM
1. ABOUT THE COMPANY
2. ECONOMY AND INDUSTRY
3. FINANCIAL PERFORMANCE
4. SUSTAINABILITY HIGHLIGHTS
5. QUESTIONS AND ANSWERS
RIDE THROUGH THE SESSION

1. About the Company
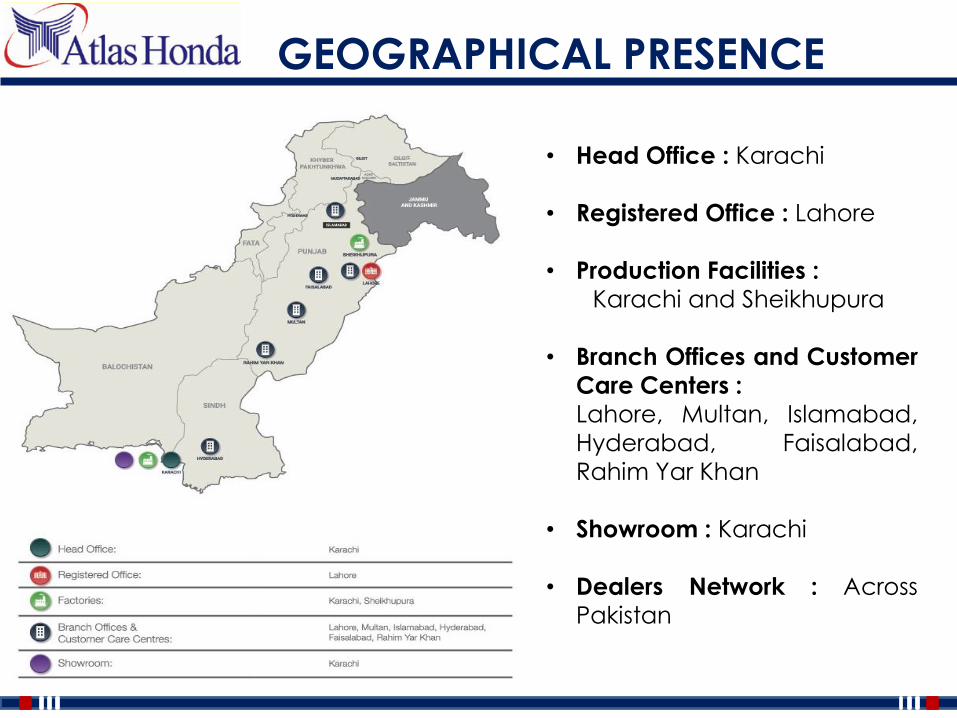
GEOGRAPHICAL PRESENCE
• Head Office : Karachi
• Registered Office : Lahore
• Production Facilities :
Karachi and Sheikhupura
• Branch Offices and Customer
Care Centers :
Lahore, Multan, Islamabad,
Hyderabad, Faisalabad,
Rahim Yar Khan
• Showroom : Karachi
• Dealers Network : Across
Pakistan

MANUFACTURING FACILITIES
KARACHI (KHI)SHEIKUPURA (SKP)
・Start Operation:May-1979
・Capacity: 1.2M/Year
・Start Operation:Sep-1965
・Capacity: 0.15M/Year

2. Economy and Industry
141.29
147.85
159.50 159.60
156.90 156.35
155.64
155.35
154.86
154.50
154.64
154.48
166.10
160.25
163.00
140.00
145.00
150.00
155.00
160.00
165.00
170.00 USD PKR111.40
108.29
107.86
108.83
106.26
108.08
107.96
109.46
108.72
108.33 107.94
107.45
107.30 107.80
107.99
106.00
107.00
108.00
109.00
110.00
111.00
112.00 USD JPY
8.3%
8.4%
8.0%8.4%
10.5%
11.4%
11.0%
12.7%
12.6%
14.6%
12.4%
10.2%
8.5%8.2%
8.6%
7.0%
8.0%
9.0%
10.0%
11.0%
12.0%
13.0%
14.0%
15.0%
CPI Inflation
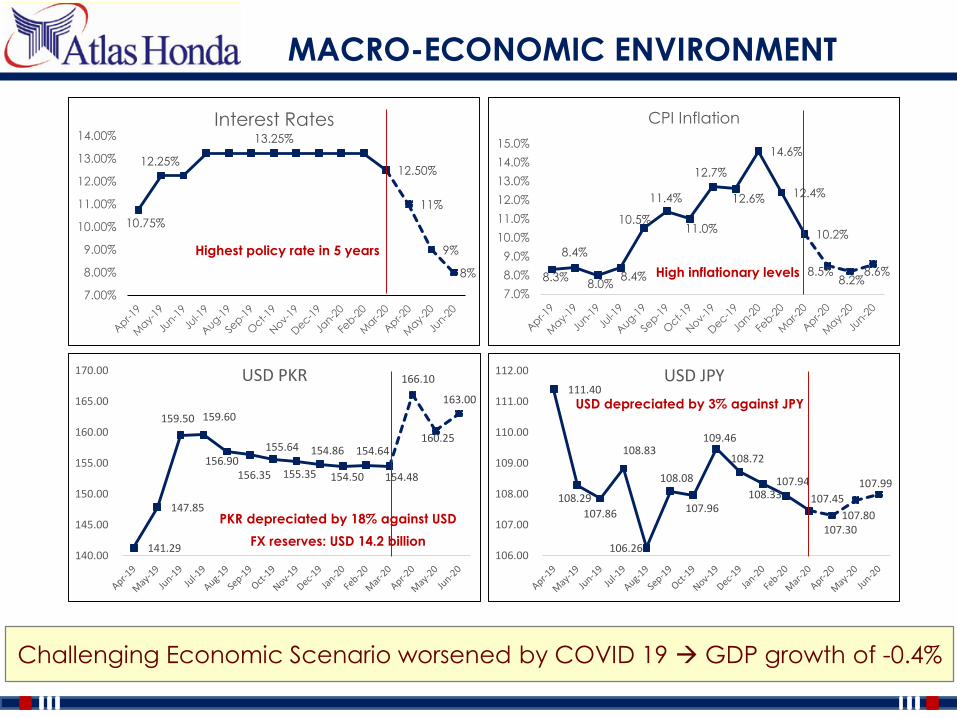
MACRO-ECONOMIC ENVIRONMENT
Description 2019-20 2018-19
PKR USD 166.75 140.70
PKR JPY 1.53 1.27 High inflationary levels
10.75%
12.25%
13.25%
12.50%
11%
9%
8%
7.00%
8.00%
9.00%
10.00%
11.00%
12.00%
13.00%
14.00%Interest Rates
PKR depreciated by 18% against USD
FX reserves: USD 14.2 billion
Highest policy rate in 5 years
USD depreciated by 3% against JPY
Challenging Economic Scenario worsened by COVID 19 GDP growth of -0.4%

SegmentsApr’19 – Mar’20
Sales nos.
Apr’18 – Mar’19
Sales nos.
Year on Year
Change
Cars 132,601 215,774 39%
LCVs, Vans & Jeeps 5,106 8,878 42%
Pick-Ups 15,825 27,159 42%
Tractors 36,176 56,369 36%
Trucks 3,848 5,828 34%
Buses 752 968 22%
Three Wheeler 48,811 62,757 22%
Motor Cycle 1,579,601 1,776,928 11%
Grand Total 1,822,720 2,154,661 15%
AUTO-INDUSTRY PERFORMANCE
Source : PAMA
Overall Industry took the burnt of Economic Challenges volume down by 15%
Source: PAMA
3. Company Performance
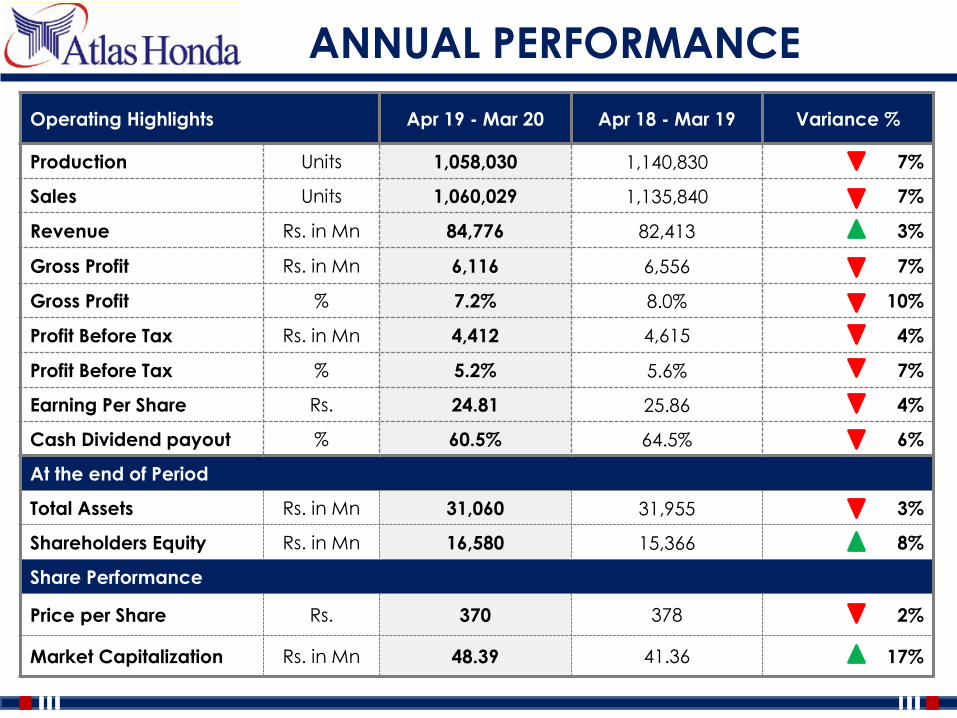
Operating Highlights Apr 19 - Mar 20 Apr 18 - Mar 19 Variance %
Production Units 1,058,030 1,140,830 7%
Sales Units 1,060,029 1,135,840 7%
Revenue Rs. in Mn 84,776 82,413 3%
Gross Profit Rs. in Mn 6,116 6,556 7%
Gross Profit % 7.2% 8.0% 10%
Profit Before Tax Rs. in Mn 4,412 4,615 4%
Profit Before Tax % 5.2% 5.6% 7%
Earning Per Share Rs. 24.81 25.86 4%
Cash Dividend payout % 60.5% 64.5% 6%
At the end of Period
Total Assets Rs. in Mn 31,060 31,955 3%
Shareholders Equity Rs. in Mn 16,580 15,366 8%
Share Performance
Price per Share Rs. 370 378 2%
Market Capitalization Rs. in Mn 48.39 41.36 17%
ANNUAL PERFORMANCE

QUARTERLY ANALYSIS

SIX YEARS AT A GLANCE
45
,77
2
55
,02
2
64
,53
4
77
,47
9
82
,41
3
84
,77
6
0
20,000
40,000
60,000
80,000
100,000
2015 2016 2017 2018 2019 2020
Sales
2,3
51
3,0
02
3,7
52 4
,664
3,2
09
3,0
78
0
1,000
2,000
3,000
4,000
5,000
2015 2016 2017 2018 2019 2020
Profit After Tax
4,9
83
5,8
18
6,9
62
7,9
76
8,9
51
10
,04
1
1,000
2,000
3,000
4,000
5,000
6,000
7,000
8,000
9,000
10,000
11,000
2015 2016 2017 2018 2019 2020
Property, Plant & Equipment
9,2
39
11
,00
2
13
,25
8
16
,00
1
15
,36
6
16
,58
0
0
2,000
4,000
6,000
8,000
10,000
12,000
14,000
16,000
18,000
2015 2016 2017 2018 2019 2020
Equity
5,7
70
8,5
85
11,4
86 1
4,8
66
15,5
93
13,3
23
0
4,000
8,000
12,000
16,000
2015 2016 2017 2018 2019 2020
Current Liabilities
15
,78
2
20
,36
9
25,6
43 31,8
27
31,9
55
31
,06
0
0
7,000
14,000
21,000
28,000
35,000
2015 2016 2017 2018 2019 2020
Total Assets
Rs. in Million
PROFIT & LOSS
Rs. in Million
Rs. in Million
Rs. in Million
Rs. in Million
Rs. in Million
BALANCE SHEET

4. Sustainability Highlights

SUSTAINABILITY HIGHLIGHTS
Rs. 46.2 million donated
Award by NFEH for CSR Report
5,976 Hours spent on Employee Training
39,000
Customers served with free services
4% reduction in water consumption (per bike)
9% Reduction in effluents and waste per bike
578 women trained for bike riding
1st prize in Punjab Horticulture Society
15,672 students attended
safety lectures
QUESTIONS AND ANSWERS

THANK YOU


