NOAA Technical Memorandum OAR PMEL-121 ATLAS Module Temperature Bias Due to Solar Heating P.N. A’Hearn 1 , H.P. Freitag 2 and M.J. McPhaden 2 1 Joint Institute for the Study of the Atmosphere and Ocean (JISAO) University of Washington Box 351640 Seattle, WA 98195 2 Pacific Marine Environmental Laboratory 7600 Sand Point Way NE Seattle, WA 98115 October 2002 Contribution 2486 from NOAA/Pacific Marine Environmental Laboratory Contribution 939 from the Joint Institute for the Study of the Atmosphere and Ocean (JISAO)
Transcript
NOAA Technical Memorandum OAR PMEL-121
ATLAS Module Temperature Bias Due to Solar
Heating
P.N. A’Hearn1, H.P. Freitag2 and M.J. McPhaden2
1Joint Institute for the Study of the Atmosphere and Ocean (JISAO)University of WashingtonBox 351640Seattle, WA 98195
2Pacific Marine Environmental Laboratory7600 Sand Point Way NESeattle, WA 98115
October 2002
Contribution 2486 from NOAA/Pacific Marine Environmental LaboratoryContribution 939 from the Joint Institute for the Study of the Atmosphereand Ocean (JISAO)
NOTICE
Mention of a commercial company or product does not constitute an endorsement byNOAA/OAR. Use of information from this publication concerning proprietary productsor the tests of such products for publicity or advertising purposes is not authorized.
Contribution No. 2486 from NOAA/Pacific Marine Environmental LaboratoryContribution 939 from the Joint Institute for the Study of the Atmosphere and Ocean (JISAO)
For sale by the National Technical Information Service, 5285 Port Royal RoadSpringfield, VA 22161
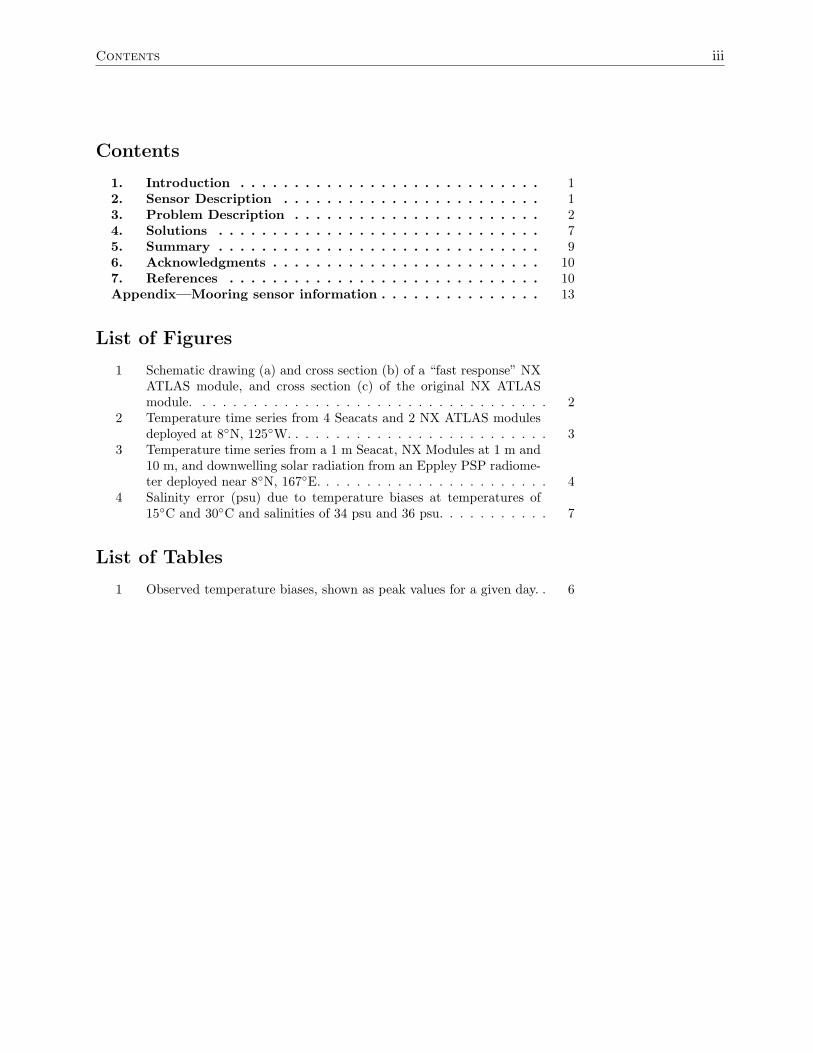
1 Schematic drawing (a) and cross section (b) of a “fast response” NXATLAS module, and cross section (c) of the original NX ATLASmodule. . . . . . . . . . . . . . . . . . . . . . . . . . . . . . . . . . . 2
2 Temperature time series from 4 Seacats and 2 NX ATLAS modulesdeployed at 8◦N, 125◦W. . . . . . . . . . . . . . . . . . . . . . . . . . 3
3 Temperature time series from a 1 m Seacat, NX Modules at 1 m and10 m, and downwelling solar radiation from an Eppley PSP radiome-ter deployed near 8◦N, 167◦E. . . . . . . . . . . . . . . . . . . . . . . 4
4 Salinity error (psu) due to temperature biases at temperatures of15◦C and 30◦C and salinities of 34 psu and 36 psu. . . . . . . . . . . 7
List of Tables
1 Observed temperature biases, shown as peak values for a given day. . 6
iv Contents
ATLAS Module Temperature Bias Due to Solar Heating
P.N. A’Hearn1, H.P. Freitag2 and M.J. McPhaden2
Abstract. Some near-surface temperature measurements from NextGeneration AutonomousTemperature Line Acquisition Systems (NX ATLAS) moorings between 1996 and 2001 have beenfound to be at times biased by solar heating. The bias is maximum near the sea surface around noonlocal time and has been observed at depths down to 75 m. Sea surface temperature sensors mountedimmediately beneath the buoy at 1 m are not exposed to direct sunlight and thus not subject tosimilar solar heating. The bias is estimated to have a typical maximum of about 0.13◦C at 20 m,the depth of the shallowest sensor on most moorings. Temperature sensors at 5 m and 10 m on somespecially instrumented moorings may have larger biases. Modifications to the instrumentation anddeployment procedures have reduced solar heating bias to 0.01◦C or less. These improvements werefirst introduced in April 2000 and have been used on all moorings deployed since January 2001. Therecovery of potentially biased instrumentation was completed in December 2001. A list of when andwhere data may be biased is given in the appendix.
1. Introduction
NX ATLAS moorings were developed by NOAA’s Pacific Marine Environ-mental Laboratory (PMEL) to measure meteorological and oceanographicparameters in tropical latitudes. These moorings were developed in the mid-1990s and were first deployed in 1996 as part of the Tropical Atmosphere-Ocean (TAO) array (McPhaden et al., 1998). They gradually replaced theoriginal Standard ATLAS moorings in the array and occupied all locationsby the end of 2001. NX ATLAS moorings have also been deployed in thePilot Research Moored Array in the Tropical Atlantic (PIRATA) since itsinception in 1997 (Servain et al., 1998) and at other sites in the South ChinaSea and the North Pacific. Triangle Trans-Ocean Buoy Network (TRITON)moorings (http://www.jamstec.go.jp/jamstec/TRITON/), which replacedTAO moorings west of 165◦E in late 2000, are maintained by the Japan Ma-rine Science and Technology Center (JAMSTEC), and make measurementssimilar to those made by NX ATLAS moorings, using commercially availableinstruments. TRITON instrumentation is not discussed in this report.
It was discovered in 1998 that subsurface temperature measurementsfrom NX ATLAS systems could be biased toward higher temperatures whenexposed to sunlight. In this paper we describe the problem, and presentsolutions that have been developed to address it.
2. Sensor Description
NX ATLAS moorings use self-contained, internally recording subsurfacesensor modules designed by PMEL’s Engineering Development Division torecord water properties. Each module can be configured to measure tempera-
1Joint Institute for the Study of the Atmosphere and Ocean (JISAO), University ofWashington, Box 351640, Seattle, WA 98195
2NOAA/Pacific Marine Environmental Laboratory, 7600 Sand Point Way NE, Seattle,WA 98115
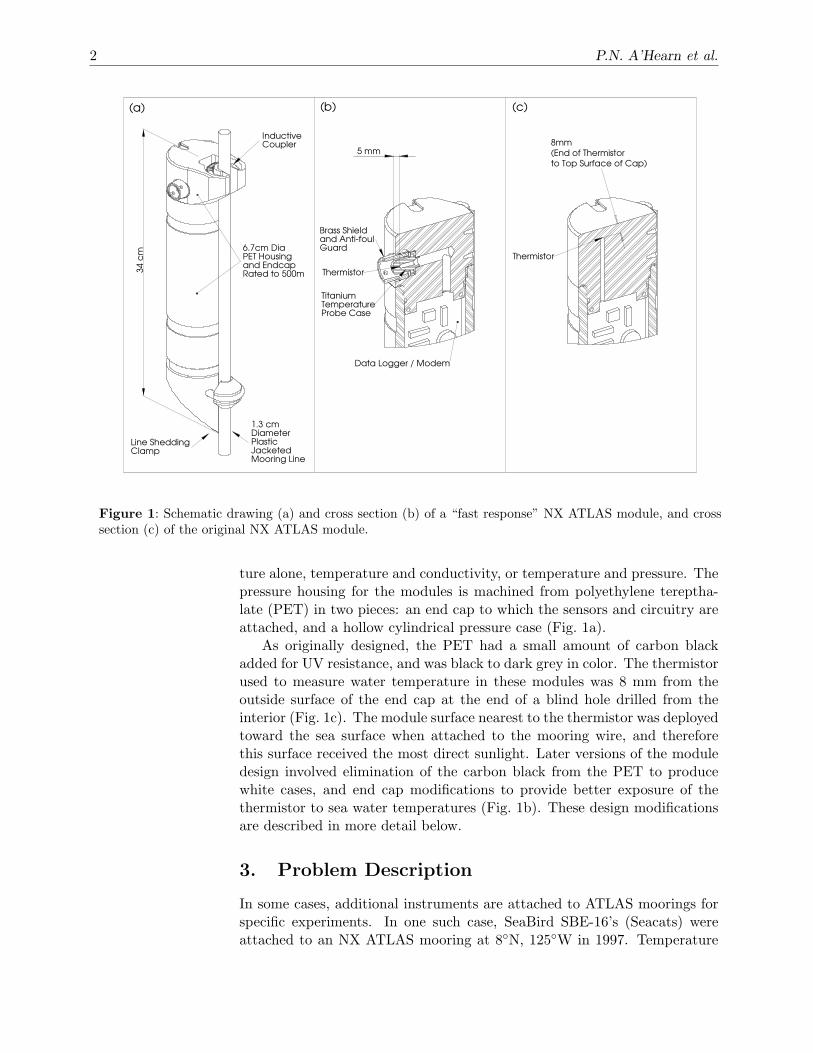
Figure 1: Schematic drawing (a) and cross section (b) of a “fast response” NX ATLAS module, and crosssection (c) of the original NX ATLAS module.
ture alone, temperature and conductivity, or temperature and pressure. Thepressure housing for the modules is machined from polyethylene tereptha-late (PET) in two pieces: an end cap to which the sensors and circuitry areattached, and a hollow cylindrical pressure case (Fig. 1a).
As originally designed, the PET had a small amount of carbon blackadded for UV resistance, and was black to dark grey in color. The thermistorused to measure water temperature in these modules was 8 mm from theoutside surface of the end cap at the end of a blind hole drilled from theinterior (Fig. 1c). The module surface nearest to the thermistor was deployedtoward the sea surface when attached to the mooring wire, and thereforethis surface received the most direct sunlight. Later versions of the moduledesign involved elimination of the carbon black from the PET to producewhite cases, and end cap modifications to provide better exposure of thethermistor to sea water temperatures (Fig. 1b). These design modificationsare described in more detail below.
3. Problem Description
In some cases, additional instruments are attached to ATLAS moorings forspecific experiments. In one such case, SeaBird SBE-16’s (Seacats) wereattached to an NX ATLAS mooring at 8◦N, 125◦W in 1997. Temperature
ATLAS Module Temperature Bias 3
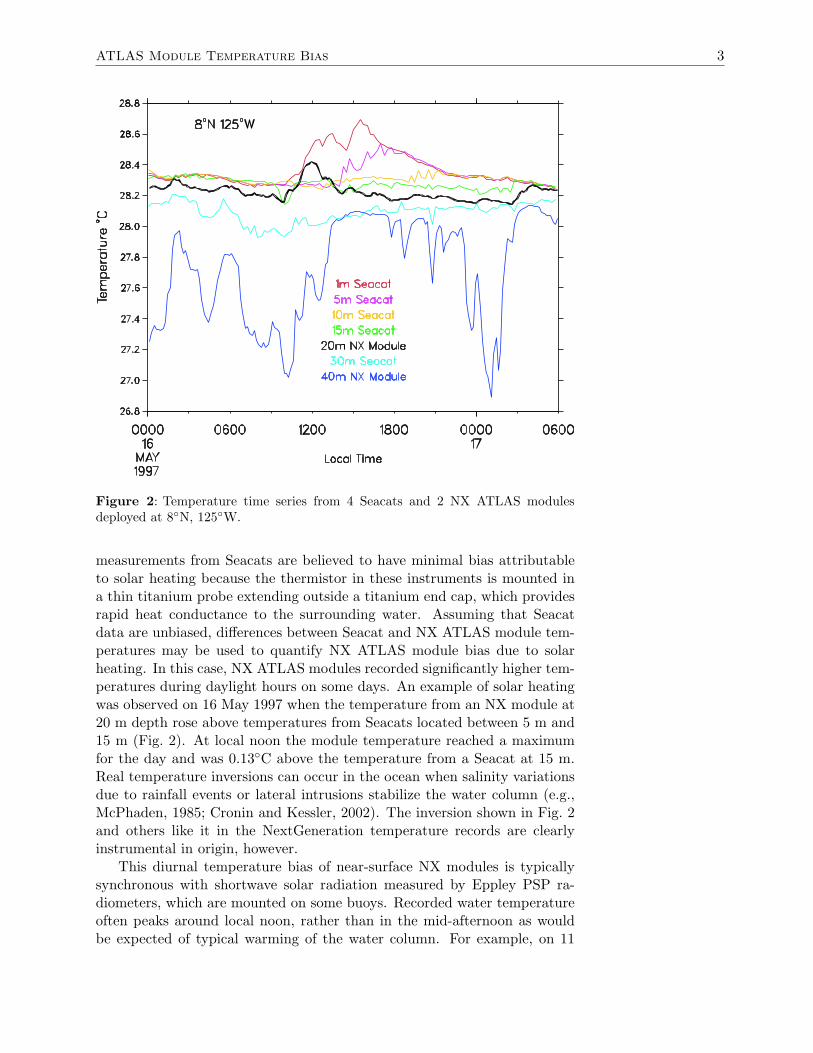
Figure 2: Temperature time series from 4 Seacats and 2 NX ATLAS modulesdeployed at 8◦N, 125◦W.
measurements from Seacats are believed to have minimal bias attributableto solar heating because the thermistor in these instruments is mounted ina thin titanium probe extending outside a titanium end cap, which providesrapid heat conductance to the surrounding water. Assuming that Seacatdata are unbiased, differences between Seacat and NX ATLAS module tem-peratures may be used to quantify NX ATLAS module bias due to solarheating. In this case, NX ATLAS modules recorded significantly higher tem-peratures during daylight hours on some days. An example of solar heatingwas observed on 16 May 1997 when the temperature from an NX module at20 m depth rose above temperatures from Seacats located between 5 m and15 m (Fig. 2). At local noon the module temperature reached a maximumfor the day and was 0.13◦C above the temperature from a Seacat at 15 m.Real temperature inversions can occur in the ocean when salinity variationsdue to rainfall events or lateral intrusions stabilize the water column (e.g.,McPhaden, 1985; Cronin and Kessler, 2002). The inversion shown in Fig. 2and others like it in the NextGeneration temperature records are clearlyinstrumental in origin, however.
This diurnal temperature bias of near-surface NX modules is typicallysynchronous with shortwave solar radiation measured by Eppley PSP ra-diometers, which are mounted on some buoys. Recorded water temperatureoften peaks around local noon, rather than in the mid-afternoon as wouldbe expected of typical warming of the water column. For example, on 11
4 P.N. A’Hearn et al.
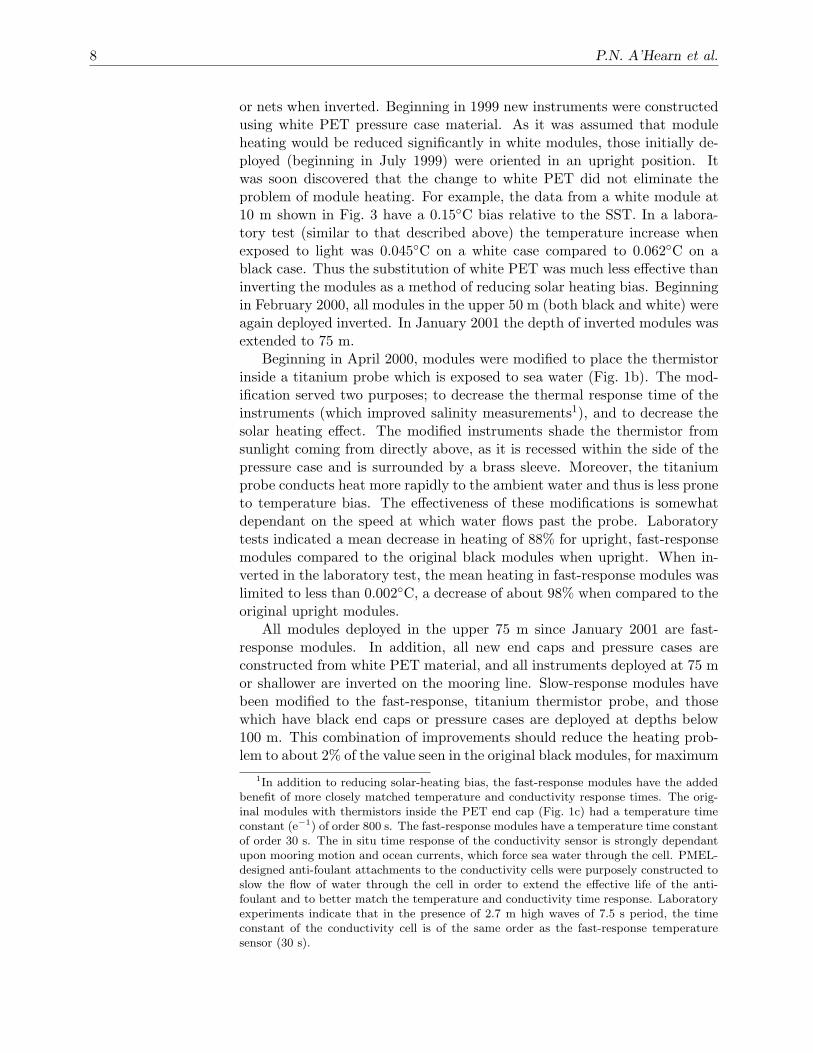
Figure 3: Temperature time series from a 1 m Seacat, NX Modules at 1 m and10 m, and downwelling solar radiation from an Eppley PSP radiometer deployednear 8◦N, 167◦E.
August 1999 near 8◦N, 167◦E, the Sea Surface Temperature (SST) nominallymeasured at 1 m depth was highest around 1500 LMT. SST measurementsare presumably unbiased due to shading by the surface buoy (see below). Incontrast, the temperature from an NX module at 10 m began rising abovethe 1 m temperature at sunrise (0600 LMT, as indicated by the PSP) andreached a maximum bias of 0.15◦C at 1100 LMT (Fig. 3). After 1100 LMTthe 10 m temperature was less than that at 1 m. Nevertheless, some solar-heating bias undoubtedly remained (given the observed solar radiation), al-though it was smaller than the temperature gradient between 1 m and 10 m.Temperature bias similar to this has been observed at many sites in bothTAO and PIRATA arrays at depths as great as 75 m.
The dip in 10 m temperature at noon (Fig. 3) is a feature commonly ob-served in other near-surface NX module time series biased by solar heatingand is thought to be due to the buoy shading the module when the sun is di-rectly overhead. Module SST measurements are not thought to be stronglyaffected by solar heating, as the instrument is mounted directly underneaththe surface float, and is shaded from direct sunlight throughout the day.Differences between module SST and co-located Seacat measurements sup-port this idea, in that they do not show diurnal bias similar to that observeddeeper in the water column (Fig. 3). SST differences between the Seacat andATLAS module are due to differences in sensor time constants and small-
ATLAS Module Temperature Bias 5
scale temperature differences over the finite vertical distance (about 0.1 m)between instruments.
To estimate the relative heating of NX modules from sunlight, we ap-ply tropical Pacific chlorophyll values (Strutton and Chavez, 2000) to thechlorophyll/light-attenuation relationship of Morel (1988), yielding light at-tenuation coefficients (KPAR) for the tropical Pacific in the range 0.03 to0.09 m−1, typically being around 0.06 m−1. Typical noon peak irradiancefor cloudless days as measured from TAO array buoys instrumented with Ep-pley PSP radiometers is around 1100 W m−2, approximately half of which(550 W m−2) is in the visible frequency band (Siegel et al., 1995; Mobley,1994). Visible light, rather than ultraviolet or infrared, which are attenuatedstrongly in seawater, is assumed to be the source of the heating. Assuminga worst-case scenario of low chlorophyll levels (KPAR = 0.03 m−1), a seasurface albedo of 0.03 (typical of tropical, clear-sky conditions near noon,Payne, 1972), no shadowing by the surface buoy, and only downwelling light,the upper bounds on solar radiation would be approximately 400 W m−2 at10 m and 120 W m−2 at 50 m. The upward facing surface of the instrumentpressure case has an area of 3.56 × 10⁻³ m2. Assuming complete absorptionof incoming light by the instrument, an upper bound for the estimate ofradiant flux into the top of the instrument from solar radiation could be asmuch as 1.4 W at 10 m.
Modeling the measured temperature increase caused by this flux is rela-tively complicated and was not done for this study. We can however observeits effects, as illustrated by examples of peak temperature biases in the tablebelow. Biases are typically largest around noon when the sun is near itszenith. They are generally lower in the morning and afternoon, and absentat night.
Table 1 lists peak bias for a number of modules, typically estimated bydaytime comparison with measurements from a module 20 to 25 m deeper orshallower (but possibly still upwardly biased) for which nighttime tempera-tures indicated both modules were in a well-mixed layer. At shallow depths(where irradiance is greater) the water column typically heats up during theday. No attempt was made to account for such a vertical temperature gra-dient, as it is impossible to accurately separate solar heating of the modulefrom actual increases in water temperature. Thus the heating bias could beoverestimated or underestimated in some cases. The observed temperaturebiases listed in Table 1 are meant to give an idea of the range of values,but should not be considered uniformly applicable, as the bias is dependanton many factors such as cloudiness, sea surface albedo, solar elevation, andwater clarity. As expected, the larger biases were nearest the surface. Onthe majority of ATLAS moorings the uppermost modules are placed at 20 mor 25 m. The largest bias observed from a 20 m black module was 0.13◦C.Therefore, we conclude that 0.13◦C represents a realistic upper bound onheating bias for modules typically deployed within the TAO and PIRATAmooring arrays. At depths of 50 m and below the observed bias in someinstances approached the accuracy of the instrument, namely 0.01◦C.
In a few special cases, modules have been placed shallower than 20 m.These include current meter moorings along the equator in the Pacific at
6 P.N. A’Hearn et al.
Table 1: Observed temperature biases, shown as peak values for a given day.
Location Depth TemperatureMooring Name (Latitude Longitude) (m) Bias
110◦W, 140◦W, 170◦W, and 165◦E; two moorings deployed for about 6 weeksin the summer of 1999 near Kwajalein Island as part of the KWAJEX exper-iment (data from which are shown in Fig. 3); moorings deployed since fall of1999 along 95◦W for the Eastern Pacific Investigation of Climate Processes(EPIC); and three moorings deployed in the North Pacific between fall 1998and summer 2000. The largest observed bias listed in Table 1 (0.42◦C) fromthese shallower-than-normal modules was from a white module placed at5 m on an EPIC mooring.
Daily averaged temperature, as reported in real-time data or derivedfrom internally stored RAM data, will have a slight positive bias when thisproblem is present. Modeling the heating bias as the positive half of a sinewave for half the day produces a conservative upper bound on the dailymean bias of a factor of π−1, or about one third, the daytime maximum.Thus heating bias of daily averaged temperature would be limited to about0.04◦C at typical module depths, and about 0.14◦C for the shallower modulesdeployed in the special cases described above.
For NX ATLAS modules equipped with SeaBird conductivity cells, tem-perature bias will affect salinity measurements. Assuming that water withinthe conductivity cell is not significantly above ambient temperature, theerror produced in the conductivity measurement from applying the biasedthermistor temperature is insignificant (3.25 × 10⁻⁶ mS cm−1 ◦C−1, basedupon SeaBird calibration equations). However, salinity calculated using atemperature higher than that in the conductivity cell will be substantiallybiased downwards. At 30◦C and 34 psu, a salinity error of –0.07 psu wouldresult from a temperature bias of +0.1◦C (Fig. 4). As for temperatures, dailyaveraged salinity bias would be roughly one third of the maximum daytimesalinity bias.
Figure 4: Salinity error (psu) due to temperature biases at temperatures of 15◦Cand 30◦C and salinities of 34 psu and 36 psu.
4. Solutions
In response to this problem, near-surface (upper 50 m), black modules wereattached on some moorings in an inverted, “top down” configuration begin-ning in September 1998. This reduced the heating of the end cap immedi-ately surrounding the thermistor by orienting it away from direct sunlight.The quantitative effect of this change is difficult to calculate exactly, sinceit depends on several unknowns such as the thermal behavior of the entirepressure case, and irradiance as a function of direction. An empirical es-timate of the effect of inverting the modules was obtained through PMELlaboratory tests. Incident radiation of order 120 W m−2 (as measured by aBiospherical Instruments QSP-200 radiometer) was produced by two 500 Wfloodlamps over a constant-temperature water bath. Mean temperature in-creases of 0.077◦C were observed in upright modules exposed to the light,while mean increases in inverted modules were limited to 0.003◦C. If sim-ilar results occur in the field, then mounting the instruments upside downshould reduce the heating problem by approximately 96%. In this simpletest, neither the lighting nor water flow in the bath were strictly uniform,therefore the results should be considered approximate.
While providing a rather simple solution to the module heating problem,inversion of the modules was not considered to be completely satisfactory,because the modules were more susceptible to being caught on fishing line
8 P.N. A’Hearn et al.
or nets when inverted. Beginning in 1999 new instruments were constructedusing white PET pressure case material. As it was assumed that moduleheating would be reduced significantly in white modules, those initially de-ployed (beginning in July 1999) were oriented in an upright position. Itwas soon discovered that the change to white PET did not eliminate theproblem of module heating. For example, the data from a white module at10 m shown in Fig. 3 have a 0.15◦C bias relative to the SST. In a labora-tory test (similar to that described above) the temperature increase whenexposed to light was 0.045◦C on a white case compared to 0.062◦C on ablack case. Thus the substitution of white PET was much less effective thaninverting the modules as a method of reducing solar heating bias. Beginningin February 2000, all modules in the upper 50 m (both black and white) wereagain deployed inverted. In January 2001 the depth of inverted modules wasextended to 75 m.
Beginning in April 2000, modules were modified to place the thermistorinside a titanium probe which is exposed to sea water (Fig. 1b). The mod-ification served two purposes; to decrease the thermal response time of theinstruments (which improved salinity measurements1), and to decrease thesolar heating effect. The modified instruments shade the thermistor fromsunlight coming from directly above, as it is recessed within the side of thepressure case and is surrounded by a brass sleeve. Moreover, the titaniumprobe conducts heat more rapidly to the ambient water and thus is less proneto temperature bias. The effectiveness of these modifications is somewhatdependant on the speed at which water flows past the probe. Laboratorytests indicated a mean decrease in heating of 88% for upright, fast-responsemodules compared to the original black modules when upright. When in-verted in the laboratory test, the mean heating in fast-response modules waslimited to less than 0.002◦C, a decrease of about 98% when compared to theoriginal upright modules.
All modules deployed in the upper 75 m since January 2001 are fast-response modules. In addition, all new end caps and pressure cases areconstructed from white PET material, and all instruments deployed at 75 mor shallower are inverted on the mooring line. Slow-response modules havebeen modified to the fast-response, titanium thermistor probe, and thosewhich have black end caps or pressure cases are deployed at depths below100 m. This combination of improvements should reduce the heating prob-lem to about 2% of the value seen in the original black modules, for maximum
1In addition to reducing solar-heating bias, the fast-response modules have the addedbenefit of more closely matched temperature and conductivity response times. The orig-inal modules with thermistors inside the PET end cap (Fig. 1c) had a temperature timeconstant (e−1) of order 800 s. The fast-response modules have a temperature time constantof order 30 s. The in situ time response of the conductivity sensor is strongly dependantupon mooring motion and ocean currents, which force sea water through the cell. PMEL-designed anti-foulant attachments to the conductivity cells were purposely constructed toslow the flow of water through the cell in order to extend the effective life of the anti-foulant and to better match the temperature and conductivity time response. Laboratoryexperiments indicate that in the presence of 2.7 m high waves of 7.5 s period, the timeconstant of the conductivity cell is of the same order as the fast-response temperaturesensor (30 s).
ATLAS Module Temperature Bias 9
daytime biases of ∼0.01◦C or less for modules deployed at 5 m or deeper inthe water column.
5. Summary
Measurements of high-resolution (10-min sample rate), near-surface temper-ature on NX ATLAS buoys deployed at standard depths (20 m and deeper)in the TAO and PIRATA Arrays may have positive daytime biases up to0.13◦C due to solar heating. These modules were first introduced into theTAO Array in 1996. The magnitude of the problem is proportional to inci-dent solar radiation, and therefore greatest at shallow depths (but not SSTmeasurements due to shading by the buoy), under clear skies, and in clearwater conditions. Efforts to reduce the bias were begun in September 1998by inverting the module orientation. Later improvements included changingto white case material and improving the thermistor mounting system. In-struments deployed in 2001 and thereafter are of the modified type. Solarheating, while potentially present in these new modules, should be less than0.010◦C, which is the accuracy of the instrument.
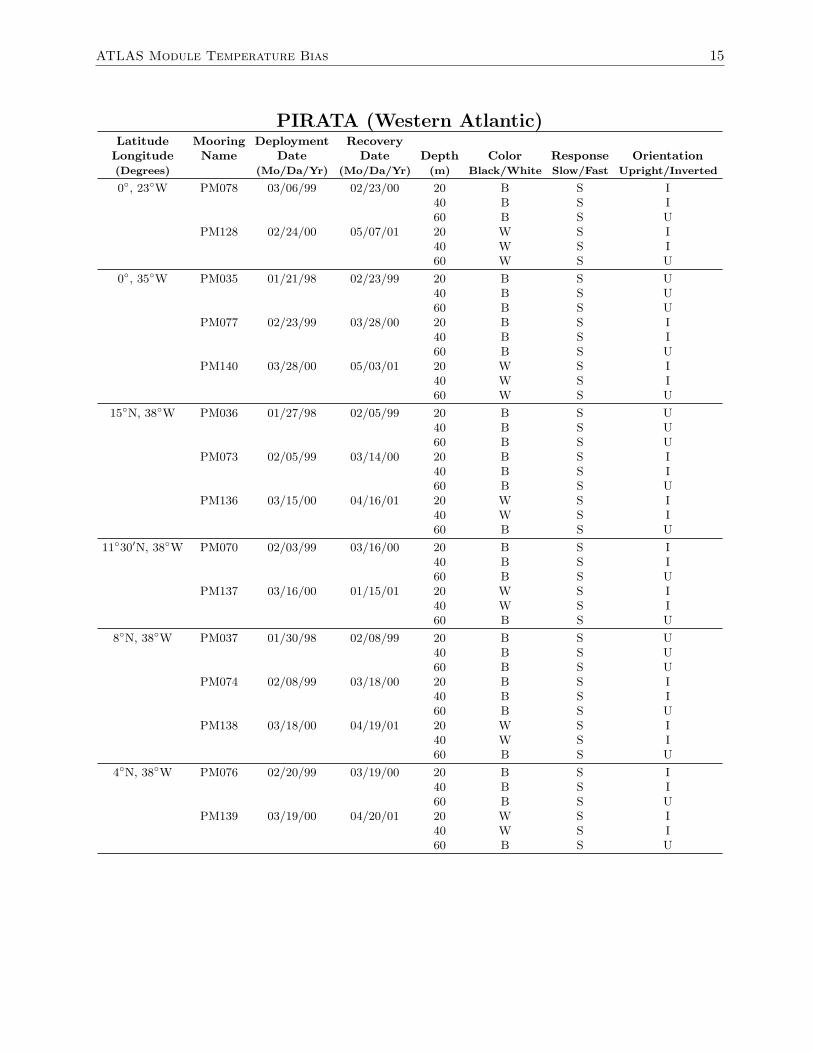
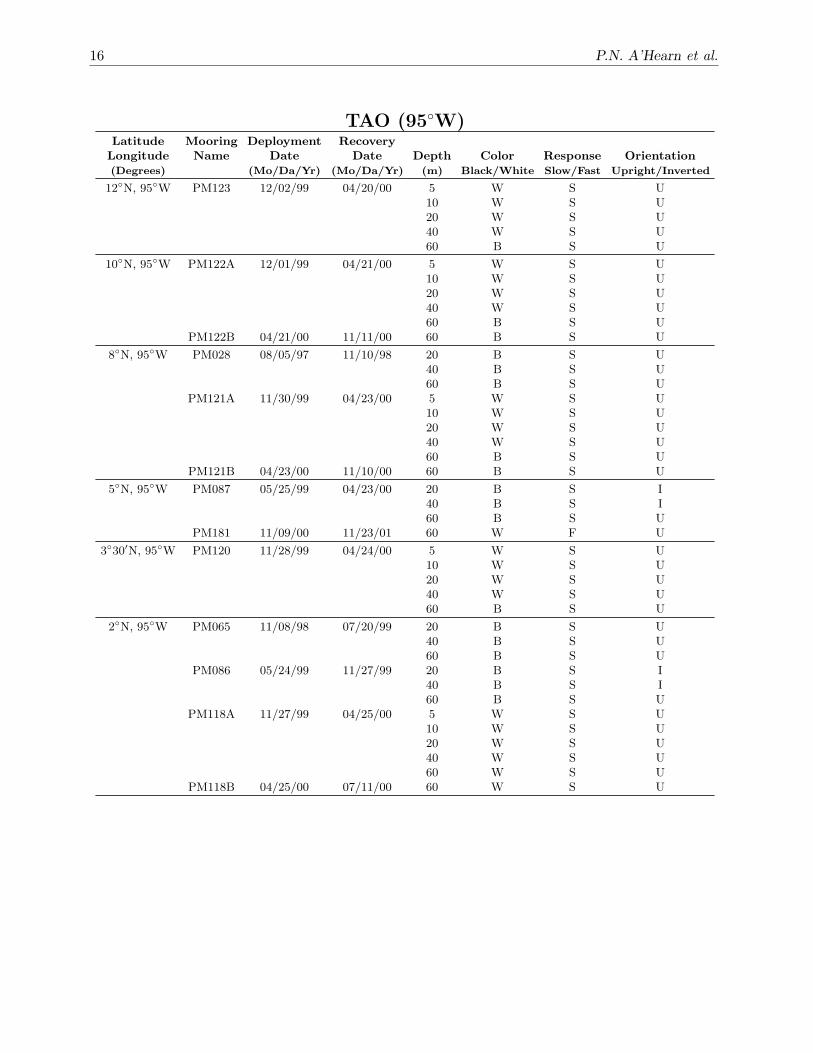
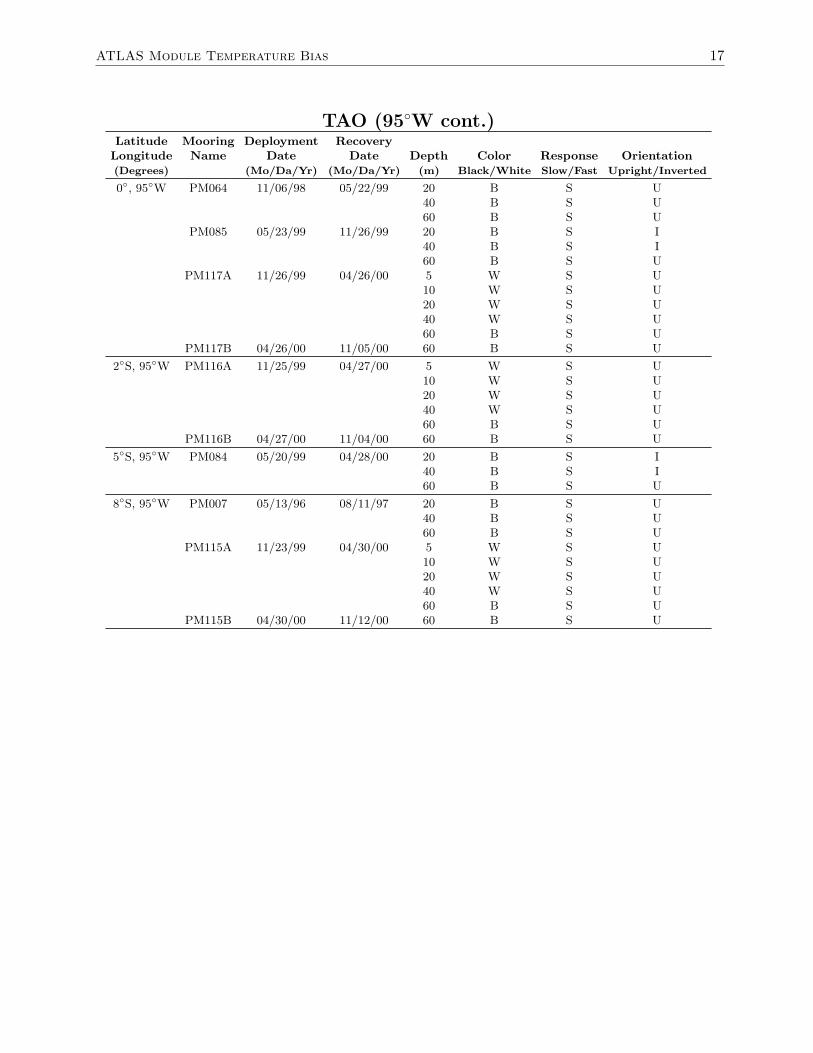
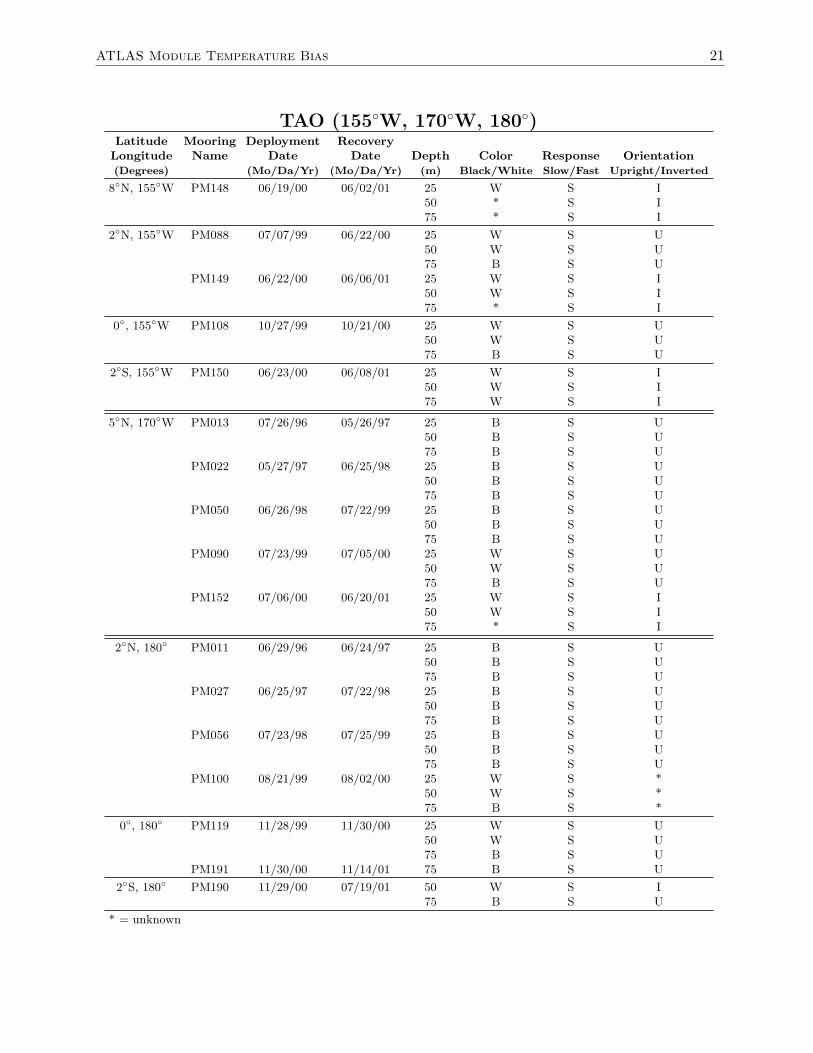
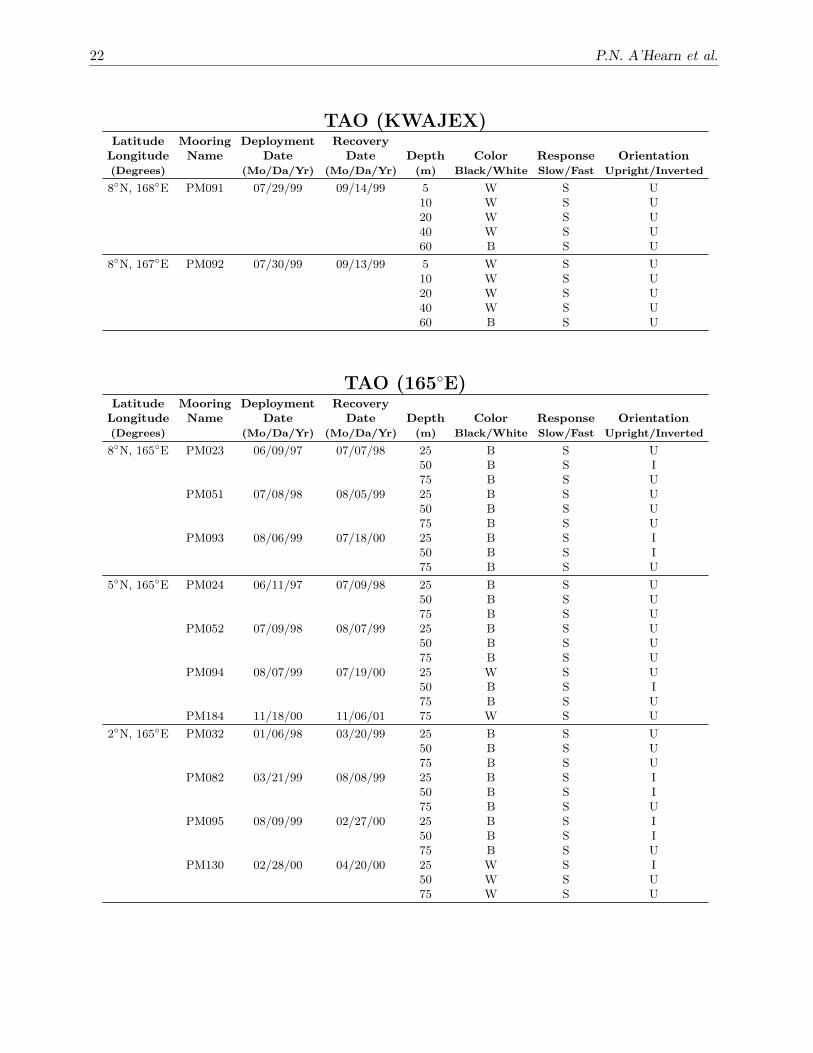
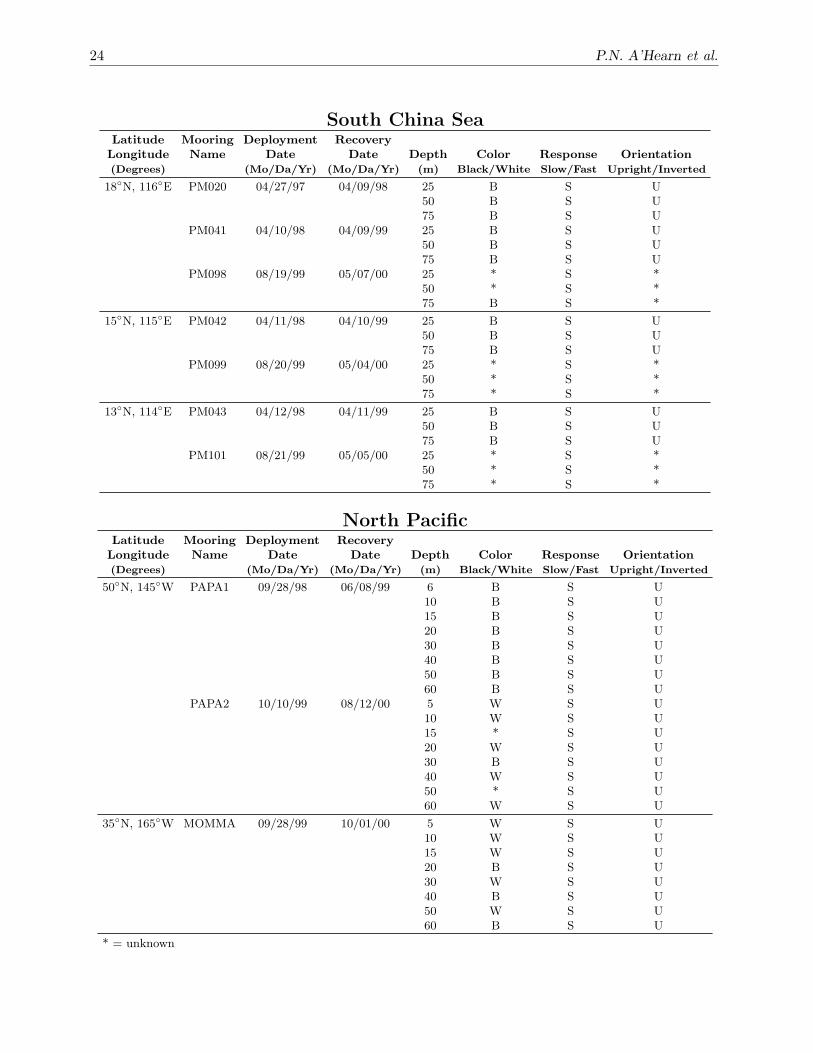
No corrections have been made to NX ATLAS data which are potentiallybiased due to solar heating. For standard deployment depths, data from NXATLAS moorings deployed before 1999 have the greatest potential for solarheating bias. Between July 1999 and April 2000, upright modules weredeployed at some mooring sites shallower than the 20 m standard depth,during which period a worst case bias of 0.42◦C was observed. Thereafter, allmodules in the upper 50 m (later 75 m) were inverted. Details on the color,orientation, and time response of near-surface modules deployed before theintroduction of inverted, fast-response modules are listed in the appendix.
General criteria for determining the potential for data biased by solarheating are:
1. Near surface modules were biased more than deeper modules.
2. Black, slow-response, upward modules were most biased.
3. Black modules were biased more than white modules.
4. Upright modules were biased more than inverted modules.
5. Fast response, inverted modules (of either color) are the least biased.
Laboratory tests indicated the following reductions in the bias relativeto the original black, slow response, upwardly oriented modules:
White, fast-response, inverted modules are not included in the appendix,as they represent the present ATLAS configuration and are considered to
10 P.N. A’Hearn et al.
be effectively unbiased. Black, fast-response, inverted modules are likewiseomitted from the appendix, as it is assumed their performance is similar ifnot equal to white, fast-response, inverted modules, and better than black,slow-response, inverted modules which had a 96% reduction in bias. Black,slow-response, inverted modules are included in the appendix because theyare not the type and orientation of module used at present, although theyhave substantially less bias than upright modules.
Due to the diurnal nature of the solar bias, daily mean bias values fromNX modules should be about one third the peak bias observed in the 10-mindata. For the bulk of TAO and PIRATA moorings, with the first subsurfacetemperature module located at 20 m depth, this bias should be about 0.04◦Cor less. On specially instrumented moorings with modules placed between5 m and 10 m, daily mean biases could be as large as 0.13◦C.
Standard ATLAS moorings, used from the inception of the array in 1984until retired in 2001, reported daily means only. Temperature sensors onthese moorings were constructed of grey (rather than black) plastic and thethermistors were not near the upper surface of the instrument or in directcontact with the case. Thus, bias due to solar heating is expected to beless than that of NX modules and the potential bias due to solar heatingin Standard ATLAS daily-mean measurements would be substantially lowerthan their accuracy of 0.09◦C (Freitag et al., 1994).
6. Acknowledgments
We would like to thank Chris Meinig, Engineering Development Division Leader atPMEL, for the design and development of improvements to the NX temperaturemodules. Also, special thanks to Meghan Cronin for comments on an earlier ver-sion of this report. This work was supported by NOAA’s Office of Oceanic andAtmospheric Research, and by the Joint Institute for the Study of the Atmosphereand Ocean (JISAO under NOAA Cooperative Agreement No. NA17RJ11232, Con-tribution #939. This is PMEL Contribution #2486.
7. References
Cronin, M.F., and W.S. Kessler (2002): Seasonal and interannual modulation ofmixed layer variability at 0◦, 110◦W. Deep-Sea Res., 49(1), 1–7.
Freitag, H.P., Y. Feng, L.J. Mangum, M.P. McPhaden, J. Neander, and L.D. Strat-ton (1994): Calibration procedures and instrumental accuracy estimates ofTAO temperature, relative humidity and radiation measurements. NOAA Tech.Memo. ERL PMEL-104, 32 pp.
McPhaden, M.J. (1985): Fine-structure variability observed in CTD measurementsfrom the central equatorial Pacific. J. Geophys. Res., 90, 11,726–11,740.
McPhaden, M.J., A.J. Busalacchi, R. Cheney, J.R. Donguy, K.S. Gage, D. Halpern,M. Ji, P. Julian, G. Meyers, G.T. Mitchum, P.P. Niiler, J. Picaut, R.W.Reynolds, N. Smith, and K. Takeuchi (1998): The Tropical Ocean-Global At-mosphere (TOGA) observing system: A decade of progress. J. Geophys. Res.,103, 14,169–14,240.
Mobley, C.D. (1994): Light and Water; Radiative Transfer in Natural Waters.Academic Press, 592 pp.
ATLAS Module Temperature Bias 11
Morel, A. (1988): Optical modeling of the upper ocean in relation to its biogenouscontent (Case I Waters). J. Geophys. Res, 93, 10,749–10,768.
Payne, R.E. (1972): Albedo of the sea surface. J. Atmos. Sci., 29, 959–970.Servain, J., A.J. Busalacchi, M.J. McPhaden, A.D. Moura, G. Reverdin, M. Vianna,
and S.E. Zebiak (1998): A Pilot Research Moored Array in the Tropical Atlantic(PIRATA). Bull. Am. Meteorol. Soc., 79, 2019–2031.
Siegel, D.A., J.C. Ohlmann, L. Washburn, R.R. Bidigare, C.T. Nosee, E. Fields,and Y. Zhou (1995): Solar radiation, phytoplankton pigments, and the radiantheating of the equatorial Pacific warm pool. J. Geophys. Res., 100(C3), 4485–4891.
Strutton, P.G., and F.P. Chavez (2000): Primary productivity in the equatorialPacific during the 1997–98 El Nino. J. Geophys. Res, 105, 26,089–26,101.