51
ATLAS Searches for VV and Vγ Resonances Chris Malena Delitzsch University of Arizona On behalf of the ATLAS Collaboration Phenomenology 2017 Symposium 8-10 May 2017

ATLAS Searches for VV and Vγ Resonances
Chris Malena DelitzschUniversity of Arizona
On behalf of the ATLAS Collaboration
Phenomenology 2017 Symposium
8-10 May 2017
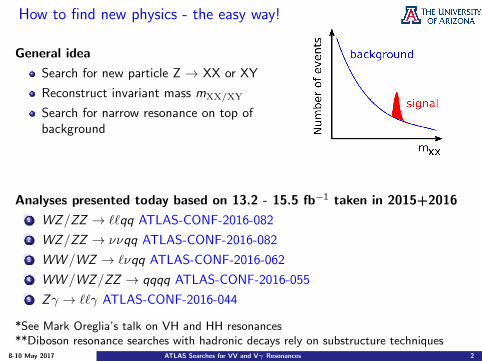
How to find new physics - the easy way!
General idea
Search for new particle Z → XX or XY
Reconstruct invariant mass mXX/XY
Search for narrow resonance on top ofbackground
Analyses presented today based on 13.2 - 15.5 fb−1 taken in 2015+2016
1 WZ/ZZ → ``qq ATLAS-CONF-2016-082
2 WZ/ZZ → ννqq ATLAS-CONF-2016-082
3 WW /WZ → `νqq ATLAS-CONF-2016-062
4 WW /WZ/ZZ → qqqq ATLAS-CONF-2016-055
5 Zγ → ``γ ATLAS-CONF-2016-044
*See Mark Oreglia’s talk on VH and HH resonances**Diboson resonance searches with hadronic decays rely on substructure techniques
8-10 May 2017 ATLAS Searches for VV and Vγ Resonances 2
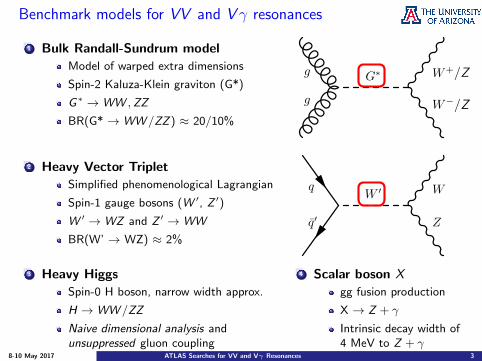
Benchmark models for VV and V γ resonances
1 Bulk Randall-Sundrum model
Model of warped extra dimensions
Spin-2 Kaluza-Klein graviton (G*)
G∗ →WW ,ZZ
BR(G* →WW /ZZ) ≈ 20/10%
g
g
G∗
W−
W+
q
q̄�
W �
Z
W
1
/Z
/Z
2 Heavy Vector Triplet
Simplified phenomenological Lagrangian
Spin-1 gauge bosons (W ′, Z ′)
W ′ →WZ and Z ′ →WW
BR(W’ → WZ) ≈ 2%
g
g
G∗
W−
W+
q
q̄�
W �
Z
W
1
3 Heavy Higgs
Spin-0 H boson, narrow width approx.
H →WW /ZZ
Naive dimensional analysis andunsuppressed gluon coupling
4 Scalar boson X
gg fusion production
X → Z + γ
Intrinsic decay width of4 MeV to Z + γ
8-10 May 2017 ATLAS Searches for VV and Vγ Resonances 3
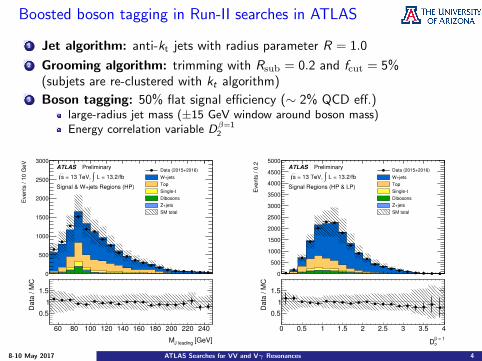
Boosted boson tagging in Run-II searches in ATLAS
1 Jet algorithm: anti-kt jets with radius parameter R = 1.0
2 Grooming algorithm: trimming with Rsub = 0.2 and fcut = 5%(subjets are re-clustered with kt algorithm)
3 Boson tagging: 50% flat signal efficiency (∼ 2% QCD eff.)large-radius jet mass (±15 GeV window around boson mass)Energy correlation variable Dβ=1
2
Eve
nts
/ 1
0 G
eV
0
500
1000
1500
2000
2500
3000ATLAS Preliminary
L = 13.2/fb∫ = 13 TeV, s
Signal & W+jets Regions (HP)
Data (2015+2016)
W+jets
Top
Singlet
Dibosons
Z+jets
SM total
[GeV]J leadingM
60 80 100 120 140 160 180 200 220 240
Data
/ M
C
0.5
1
1.5
Eve
nts
/ 0
.2
0
500
1000
1500
2000
2500
3000
3500
4000
4500
5000ATLAS Preliminary
L = 13.2/fb∫ = 13 TeV, s
Signal Regions (HP & LP)
Data (2015+2016)
W+jets
Top
Singlet
Dibosons
Z+jets
SM total
= 1β2
D
0 0.5 1 1.5 2 2.5 3 3.5 4
Data
/ M
C
0.5
1
1.5
8-10 May 2017 ATLAS Searches for VV and Vγ Resonances 4
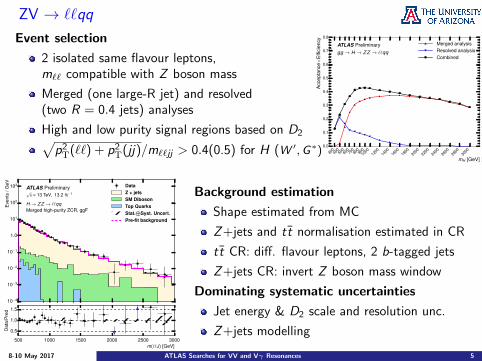
ZV → ``qq
Event selection
2 isolated same flavour leptons,m`` compatible with Z boson mass
Merged (one large-R jet) and resolved(two R = 0.4 jets) analyses
High and low purity signal regions based on D2√p2T(``) + p2T(jj)/m``jj > 0.4(0.5) for H (W ′,G∗) 30
040
050
060
070
080
090
010
0012
0014
0016
0018
0020
0022
0024
0026
0028
0030
00
mH [GeV]
0.0
0.1
0.2
0.3
0.4
0.5
0.6
0.7
0.8
Acc
epta
nce×
Effi
cien
cy
ATLAS Preliminarygg → H → ZZ → ``qq
Merged analysisResolved analysisCombined
10−4
10−3
10−2
10−1
1.0
101
102
103
Eve
nts
/GeV
ATLAS Preliminary√
s = 13 TeV, 13.2 fb−1
H → ZZ → ``qqMerged high-purity ZCR, ggF
DataZ + jetsSM DibosonTop QuarksStat.
⊕Syst. Uncert.
Pre-fit background
500 1000 1500 2000 2500 3000m(``J) [GeV]
0.5
1.0
1.5
Dat
a/P
red
Background estimation
Shape estimated from MC
Z+jets and tt̄ normalisation estimated in CR
tt̄ CR: diff. flavour leptons, 2 b-tagged jets
Z+jets CR: invert Z boson mass window
Dominating systematic uncertainties
Jet energy & D2 scale and resolution unc.
Z+jets modelling
8-10 May 2017 ATLAS Searches for VV and Vγ Resonances 5
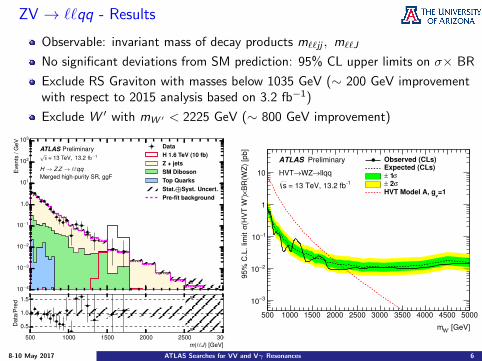
ZV → ``qq - Results
Observable: invariant mass of decay products m``jj , m``J
No significant deviations from SM prediction: 95% CL upper limits on σ× BR
Exclude RS Graviton with masses below 1035 GeV (∼ 200 GeV improvementwith respect to 2015 analysis based on 3.2 fb−1)
Exclude W ′ with mW ′ < 2225 GeV (∼ 800 GeV improvement)
10−4
10−3
10−2
10−1
1.0
101
102
103
Eve
nts
/GeV
ATLAS Preliminary√
s = 13 TeV, 13.2 fb−1
H → ZZ → ``qqMerged high-purity SR, ggF
DataH 1.6 TeV (10 fb)Z + jetsSM DibosonTop QuarksStat.
⊕Syst. Uncert.
Pre-fit background
500 1000 1500 2000 2500 3000m(``J) [GeV]
0.5
1.0
1.5
Dat
a/P
red
[GeV]W’
m
500 1000 1500 2000 2500 3000 3500 4000 4500 5000
BR
(WZ
) [p
b]
×(H
VT
W’)
σ 9
5%
C.L
. lim
it
3−10
2−10
1−10
1
10
Observed (CLs)Expected (CLs)
σ 1±
σ 2±
=1v
HVT Model A, g
llqq→WZ→HVT
PreliminaryATLAS
1 = 13 TeV, 13.2 fbs
8-10 May 2017 ATLAS Searches for VV and Vγ Resonances 6
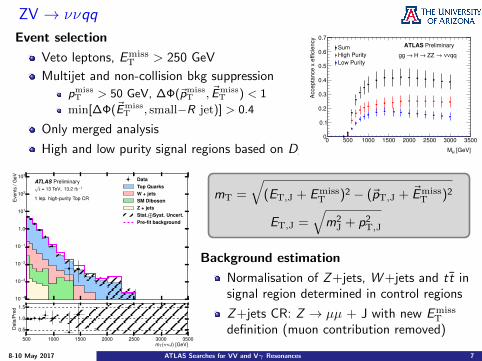
ZV → ννqq
Event selection
Veto leptons, EmissT > 250 GeV
Multijet and non-collision bkg suppression
pmissT > 50 GeV, ∆Φ(~pmiss
T , ~EmissT ) < 1
min[∆Φ(~EmissT , small−R jet)] > 0.4
Only merged analysis
High and low purity signal regions based on D2 [GeV]HM
0 500 1000 1500 2000 2500 3000 3500
Acce
pta
nce
x e
ffic
ien
cy
0
0.1
0.2
0.3
0.4
0.5
0.6
0.7
Sum
High Purity
Low Purity
ATLAS Preliminary
qqνν → ZZ → H →gg
10−4
10−3
10−2
10−1
1.0
101
102
103
Eve
nts
/GeV
ATLAS Preliminary√
s = 13 TeV, 13.2 fb−1
1 lep. high-purity Top CR
DataTop QuarksW + jetsSM DibosonZ + jetsStat.
⊕Syst. Uncert.
Pre-fit background
500 1000 1500 2000 2500 3000 3500mT (ννJ) [GeV]
0.5
1.0
1.5
Dat
a/P
red
mT =
√(ET,J + Emiss
T )2 − (~pT,J + ~EmissT )2
ET,J =√m2
J + p2T,J
Background estimation
Normalisation of Z+jets, W+jets and tt̄ insignal region determined in control regions
Z+jets CR: Z → µµ + J with new EmissT
definition (muon contribution removed)
8-10 May 2017 ATLAS Searches for VV and Vγ Resonances 7
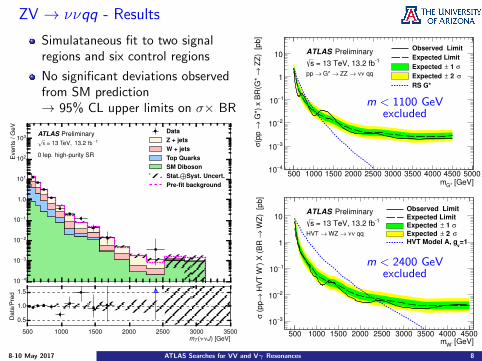
ZV → ννqq - Results
Simulataneous fit to two signalregions and six control regions
No significant deviations observedfrom SM prediction→ 95% CL upper limits on σ× BR
10−4
10−3
10−2
10−1
1.0
101
102
103
Eve
nts
/GeV
ATLAS Preliminary√
s = 13 TeV, 13.2 fb−1
0 lep. high-purity SR
DataZ + jetsW + jetsTop QuarksSM DibosonStat.
⊕Syst. Uncert.
Pre-fit background
500 1000 1500 2000 2500 3000 3500mT (ννJ) [GeV]
0.5
1.0
1.5
Dat
a/P
red
[GeV]G*m500 1000 1500 2000 2500 3000 3500 4000 4500 5000
ZZ
) [pb]
→ G
*) x
BR
(G*
→(p
p
σ
4−10
3−10
2−10
1−10
1
10 ATLAS Preliminary1 = 13 TeV, 13.2 fbs
qqνν → ZZ → G* →pp
Observed Limit
Expected Limit
σ 1 ±Expected
σ 2 ±Expected
RS G*
m < 1100 GeVexcluded
[GeV]W’
m500 1000 1500 2000 2500 3000 3500 4000 4500
WZ
) [pb]
→ H
VT
W’) X
(B
R
→ (
pp
σ 3−10
2−10
1−10
1
10ATLAS Preliminary
1 = 13 TeV, 13.2 fbs
qqνν → WZ →HVT
Observed Limit
Expected Limitσ 1 ±Expected
σ 2 ±Expected =1
vHVT Model A, g
m < 2400 GeVexcluded
8-10 May 2017 ATLAS Searches for VV and Vγ Resonances 8
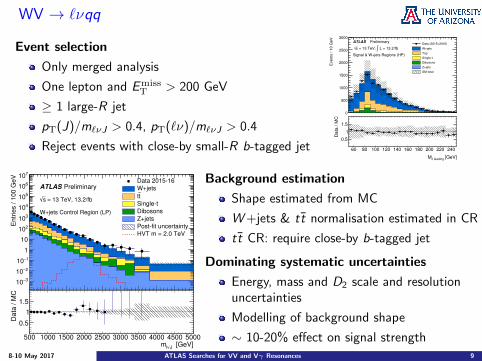
WV → `νqq
Event selection
Only merged analysis
One lepton and EmissT > 200 GeV
≥ 1 large-R jet
pT(J)/m`νJ > 0.4, pT(`ν)/m`νJ > 0.4
Reject events with close-by small-R b-tagged jet
Eve
nts
/ 1
0 G
eV
0
500
1000
1500
2000
2500
3000ATLAS Preliminary
L = 13.2/fb∫ = 13 TeV, s
Signal & W+jets Regions (HP)
Data (2015+2016)
W+jets
Top
Singlet
Dibosons
Z+jets
SM total
[GeV]J leadingM
60 80 100 120 140 160 180 200 220 240
Data
/ M
C
0.5
1
1.5
500 1000 1500 2000 2500 3000 3500 4000 4500 5000
En
trie
s /
10
0 G
eV
3−10
2−10
1−10
1
10
210
310
410
510
610
710Data 201516
W+jets
tt
Singlet
Dibosons
Z+jets
Postfit uncertainty
HVT m = 2.0 TeV
PreliminaryATLAS
= 13 TeV, 13.2/fbs
W+jets Control Region (LP)
[GeV]Jνlm500 1000 1500 2000 2500 3000 3500 4000 4500 5000
Da
ta /
MC
0.5
1
1.5
Background estimation
Shape estimated from MC
W+jets & tt̄ normalisation estimated in CR
tt̄ CR: require close-by b-tagged jet
Dominating systematic uncertainties
Energy, mass and D2 scale and resolutionuncertainties
Modelling of background shape
∼ 10-20% effect on signal strength8-10 May 2017 ATLAS Searches for VV and Vγ Resonances 9
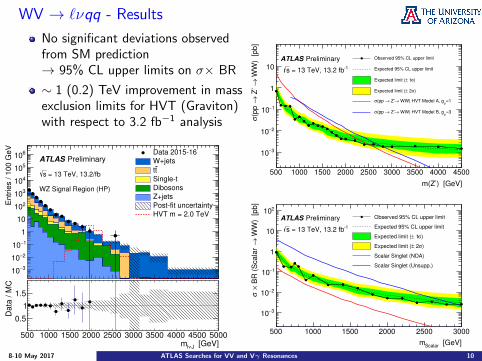
WV → `νqq - Results
No significant deviations observedfrom SM prediction→ 95% CL upper limits on σ× BR
∼ 1 (0.2) TeV improvement in massexclusion limits for HVT (Graviton)with respect to 3.2 fb−1 analysis
500 1000 1500 2000 2500 3000 3500 4000 4500 5000
Entr
ies / 1
00 G
eV
3−10
2−10
1−10
1
10
210
310
410
510
610 Data 201516
W+jets
tt
Singlet
Dibosons
Z+jets
Postfit uncertainty
HVT m = 2.0 TeV
PreliminaryATLAS
= 13 TeV, 13.2/fbs
WZ Signal Region (HP)
[GeV]Jνlm500 1000 1500 2000 2500 3000 3500 4000 4500 5000
Data
/ M
C
0.5
1
1.5
m(Z’) [GeV]
500 1000 1500 2000 2500 3000 3500 4000 4500
WW
) [pb]
→ Z
’ →
(pp
σ
3−10
2−10
1−10
1
10
Observed 95% CL upper limit
Expected 95% CL upper limit
)σ 1±Expected limit (
)σ 2±Expected limit (
=1V
WW) HVT Model A, g→ Z’→(pp σ
=3V
WW) HVT Model B, g→ Z’→(pp σ
PreliminaryATLAS
1 = 13 TeV, 13.2 fbs
[GeV]Scalarm
500 1000 1500 2000 2500 3000
WW
) [pb]
→ B
R (
Scala
r ×
σ
3−10
2−10
1−10
1
10
210Observed 95% CL upper limit
Expected 95% CL upper limit
)σ 1±Expected limit (
)σ 2±Expected limit (
Scalar Singlet (NDA)
Scalar Singlet (Unsupp.)
PreliminaryATLAS
1 = 13 TeV, 13.2 fbs
8-10 May 2017 ATLAS Searches for VV and Vγ Resonances 10

VV→JJ
Event selection
Require two large-R boson-tagged jets
Additional criteria on number of tracksghost-associated to ungroomed jet: ntrk
Efficiency of ntrk measured in V+jets data
Overlap between WW ,WZ ,ZZ selection|
12y∆|
Even
ts /
2.00
200
400
600
800
1000
1200Data
Multi-jet MC = 1500 GeVW’m
PreliminaryATLAS-1 = 13 TeV, 15.5 fbs
WZ→HVT W’
trk Leading jet N
0 20 40 60
Dat
a/M
C
0.51
1.5
1.5 2 2.5 3 3.5
Eve
nts
/ 0.1
TeV
1
10
210
310
410
510
610ATLAS Preliminary
-1 = 13 TeV, 15.5 fbs
High sideband mass VR
Data 2015+2016
Fit bkg estimation
Fit exp. stats error
[TeV]JJM1.5 2 2.5 3 3.5
Pul
l
2−0
2
Dominating background: QCD dijets
Background parameterised by:
dn
dx= p1(1− x)p2+ξp3xp3 , x = mjj/
√s
p1: normalisation, p2, p3 dimensionlessshape parameters, ξ constant
Binned maximum-likelihood fitperformed to data to estimate bkg
8-10 May 2017 ATLAS Searches for VV and Vγ Resonances 11

VV→JJ - Results
1 1.5 2 2.5 3 3.5
Eve
nts
/ 0.1
TeV
1−10
1
10
210
310
410ATLAS Preliminary
-1 = 13 TeV, 15.5 fbs
WW selection
Data 2015+2016
Fit bkg estimation
HVT Model A m=1.5 TeV
HVT Model A m=2.4 TeV
Fit exp. stats error
[TeV]JJM1 1.5 2 2.5 3 3.5
Pul
l
2−0
2
1 1.5 2 2.5 3 3.5
Eve
nts
/ 0.1
TeV
1−10
1
10
210
310
410ATLAS Preliminary
-1 = 13 TeV, 15.5 fbs
ZZ selection
Data 2015+2016Fit bkg estimationG* m=1.5 TeVG* m=2.4 TeV * 10Fit exp. stats error
[TeV]JJM1 1.5 2 2.5 3 3.5
Pul
l
2−0
2
No significant deviations from SMprediction observed→ 95% CL upper limits on σ× BR
For gV = 1 (3), exclude
1.2 < mZ ′ < 1.8 (1.9) TeV1.2 < mW ′ < 1.9 (3.0) TeVNo sensitivity to excludegravitons with studied parameters
[GeV]Z'm1500 2000 2500 3000
WW
) [fb
]→
BR
(Z'
×Z
'+X
)→
(pp
σ
1
10
210
310ATLAS Preliminary
-1 = 13 TeV, 15.5 fbsObserved 95% CLExpected 95% CL
σ 1±σ 2±
= 1v
Model A, g = 3
vModel B, g
8-10 May 2017 ATLAS Searches for VV and Vγ Resonances 12

V γ → ``γ
Event selectionZ-boson candidate:
2 opposite-sign, same-flavour leptons within ± 15 GeV of Z-boson mass
Choose photon with highest pTX mass resolution improvement by kinematic Z-boson mass constraint fit
Two categories based on lepton flavour
[GeV]γZm
750 800 850
]-1
[GeV
γZ
1/N
dN
/dm
0
0.01
0.02
0.03
0.04
0.05
0.06
0.07
0.08 Simulation PreliminaryATLASγ Z→ X →gg
= 800 GeV Xm = 13 TeVs
-e+ e→Z-µ+µ →Z
Signal and background modelling:
Signal: double-sided Crystal Ball function
Bkg: non-resonant production of aprompt photon & Z boson, Z+jets(smoothly falling background)
Bkg parameterised with:
dn
dx= N (1− xk)p1xp2, x = mZγ/
√s
8-10 May 2017 ATLAS Searches for VV and Vγ Resonances 13

V γ → ``γ - Results
[GeV]γZm
210×3 210×4 310 310×2
Eve
nts
/ 20.
0 G
eV
3−10
2−10
1−10
1
10
210
310
410
data
bbackground,
-µ+µ, -e+ e→Z, γZ→X→pp
-1 = 13 TeV, 13.3 fbs
PreliminaryATLAS
[GeV]γZm210×3 310 310×2
data
- b
40−20−0
2040
[GeV]Xm
210×3 310 310×2 310×3
Loca
l p-v
alue
4−10
3−10
2−10
1−10
1 PreliminaryATLAS
σ+1
σ+2
σ+3
-µ+µ, -e+ e→Z, γZ→X→pp-1 = 13 TeV, 13.3 fbs
Selected 306 (485) candidates forZ → e+e−/µ+µ−
No significant deviations from bkgprediction→ 95% CL upper limits on σ× BR
Results dominated by stat. uncert.
[GeV]X m
210×3 310 310×2 310×3
)[fb
]γ
Z→
BR
(X× σ
95%
CL
limit
on
1
10
210
310Observed
Expected
σ 1±σ 2±
PreliminaryATLAS-µ+µ, -e+e→, ZγZ→X→pp
-1 = 13 TeV, 13.3 fbs
8-10 May 2017 ATLAS Searches for VV and Vγ Resonances 14

Summary
The diboson and Z + γ final state provides a direct key to new physics beyondthe Standard Model
The diboson resonance searches rely on using jet substructure techniques toreconstruct boosted hadronically decaying W /Z bosons (challenging whengoing to higher transverse momenta)
No significant deviation from background expectation observed at 13 TeV→ set upper limits on cross-section × BR for benchmark models
The increased luminosity allowed to improve the exclusion limits of thebenchmark models significantly with respect to previous analyses
Analyses using the full 2015+2016 dataset will allow to extend the mass reachof these searches even further
8-10 May 2017 ATLAS Searches for VV and Vγ Resonances 15

Backup
8-10 May 2017 ATLAS Searches for VV and Vγ Resonances 16
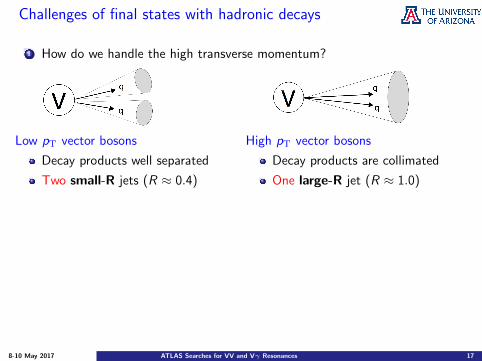
Challenges of final states with hadronic decays
1 How do we handle the high transverse momentum?
2 How can we handle the high pile-up?
Jet mass depends on pile-up and mass resolution diminishes with 〈µ〉Grooming techniques remove soft gluon radiation and pile-up effectsTrimming: remove subjets of size Rsubjet if psubjet
T < fcut × plarge−RT
3 How can we suppress the enormous QCD dijet background?
σdijet � σBSM → use internal structure of large-R jet
Low pT vector bosons
Decay products well separated
Two small-R jets (R ≈ 0.4)
High pT vector bosons
Decay products are collimated
One large-R jet (R ≈ 1.0)
8-10 May 2017 ATLAS Searches for VV and Vγ Resonances 17

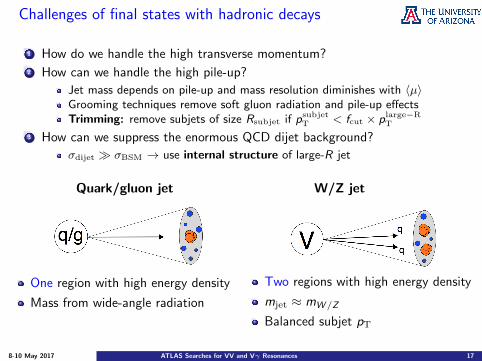
Challenges of final states with hadronic decays
1 How do we handle the high transverse momentum?2 How can we handle the high pile-up?
Jet mass depends on pile-up and mass resolution diminishes with 〈µ〉Grooming techniques remove soft gluon radiation and pile-up effectsTrimming: remove subjets of size Rsubjet if psubjet
T < fcut × plarge−RT
3 How can we suppress the enormous QCD dijet background?
σdijet � σBSM → use internal structure of large-R jet
Jet mass [GeV]
0 100 200 300 400 500
Nor
mal
ised
0
0.02
0.04
0.06
0.08
0.1
0.12
0.14
= 80⟩µ⟨
= 140⟩µ⟨
= 200⟩µ⟨
ATLAS Simulation Preliminary R=1.0 jetstanti-k
No jet grooming, no jet pileup correction < 1000 GeV
T | < 2.0, 750 < pη|
t t→ = 14 TeV, Z' s
trimming−−−−−→
Jet mass [GeV]
0 100 200 300 400 500
Nor
mal
ised
0
0.02
0.04
0.06
0.08
0.1
0.12
0.14
0.16
0.18
0.2
= 80⟩µ⟨
= 140⟩µ⟨
= 200⟩µ⟨
ATLAS Simulation Preliminary R=1.0 jetstanti-k
Trimmed, no jet pileup correction < 1000 GeV
T | < 2.0, 750 < pη|
t t→ = 14 TeV, Z' s
8-10 May 2017 ATLAS Searches for VV and Vγ Resonances 17
Challenges of final states with hadronic decays
1 How do we handle the high transverse momentum?2 How can we handle the high pile-up?
Jet mass depends on pile-up and mass resolution diminishes with 〈µ〉Grooming techniques remove soft gluon radiation and pile-up effectsTrimming: remove subjets of size Rsubjet if psubjet
T < fcut × plarge−RT
3 How can we suppress the enormous QCD dijet background?
σdijet � σBSM → use internal structure of large-R jet
Quark/gluon jet W/Z jet
One region with high energy density
Mass from wide-angle radiation
Two regions with high energy density
mjet ≈ mW/Z
Balanced subjet pT
8-10 May 2017 ATLAS Searches for VV and Vγ Resonances 17

Energy correlation variables
Energy correlation D2
Dβ2 =
E 3CF1(β)
E 3CF2(β)
× ECF3(β)
N-point energy correlation function
ECF1(β) =∑
i∈JpTi , ECF2(β) =
∑
i<j∈JpTipTj (∆Rij)
β,
ECF3(β) =∑
i<j<k∈JpTipTjpTk
(∆Rij∆Rik∆Rjk)β ,
=1)β(
2D
0 0.5 1 1.5 2 2.5 3 3.5 4 4.5 5
No
rma
lise
d E
ntr
ies
0.02
0.04
0.06
0.08
0.1
0.12
0.14
0.16
0.18
0.2
0.22 ATLAS Simulation
=8 TeVs
|<1.2Truthη|
< 500 GeVTruth
T350 < p
M Cut
R=1.0 jetst
antik
=0.2)sub
=5%,Rcut
Trimmed (f
WZ)→Wjets (in W’
Multijets (leading jet)
= 50% G & T W
∈
0 0.5 1 1.5 2 2.5 3 3.5 4
Events
/ 0
.2
0
1000
2000
3000
4000
5000ATLAS
1=8 TeV, 20.3 fbs
R=1.0 jetst
antik
=0.2)sub
=5%,Rcut
Trimmed (f
> 200 GeVT
| < 1.2, pη|
Data (W) (POWHEG+Pythia)tt
Single Top (W) (nonW) (POWHEG+Pythia)tt
Single Top (nonW)W+jets
Z+jets
DibosonQCD Multijet
Uncertainty (Stat. Only)Uncertainty (Stat.+Syst.)
=1)β(
2D
0 0.5 1 1.5 2 2.5 3 3.5 4
Data
/MC
0.6
0.8
1
1.2
1.4 0 0.5 1 1.5 2 2.5 3 3.5 4
Events
/ 0
.2
0
200
400
600
800
1000
1200
1400
1600
1800
2000ATLAS
1=8 TeV, 20.3 fbs
R=1.0 jetst
antik
=0.2)sub
=5%,Rcut
Trimmed (f
> 200 GeVT
| < 1.2, pη|
Mass Cut
Data (W) (POWHEG+Pythia)tt
Single Top (W) (nonW) (POWHEG+Pythia)tt
Single Top (nonW)W+jets
Z+jets
DibosonQCD Multijet
Uncertainty (Stat. Only)Uncertainty (Stat.+Syst.)
=1)β(
2D
0 0.5 1 1.5 2 2.5 3 3.5 4
Data
/MC
0.6
0.8
1
1.2
1.4
8-10 May 2017 ATLAS Searches for VV and Vγ Resonances 18
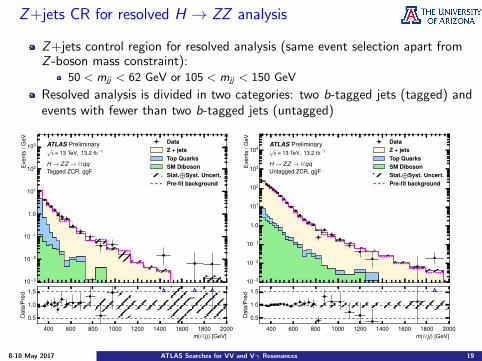
Z+jets CR for resolved H → ZZ analysis
Z+jets control region for resolved analysis (same event selection apart fromZ -boson mass constraint):
50 < mjj < 62 GeV or 105 < mjj < 150 GeV
Resolved analysis is divided in two categories: two b-tagged jets (tagged) andevents with fewer than two b-tagged jets (untagged)
10−3
10−2
10−1
1.0
101
102
103
Eve
nts
/GeV
ATLAS Preliminary√
s = 13 TeV, 13.2 fb−1
H → ZZ → ``qqTagged ZCR, ggF
DataZ + jetsTop QuarksSM DibosonStat.
⊕Syst. Uncert.
Pre-fit background
400 600 800 1000 1200 1400 1600 1800 2000m(``j j) [GeV]
0.5
1.0
1.5
Dat
a/P
red
10−3
10−2
10−1
1.0
101
102
103
104
Eve
nts
/GeV
ATLAS Preliminary√
s = 13 TeV, 13.2 fb−1
H → ZZ → ``qqUntagged ZCR, ggF
DataZ + jetsTop QuarksSM DibosonStat.
⊕Syst. Uncert.
Pre-fit background
400 600 800 1000 1200 1400 1600 1800 2000m(``j j) [GeV]
0.5
1.0
1.5
Dat
a/P
red
8-10 May 2017 ATLAS Searches for VV and Vγ Resonances 19
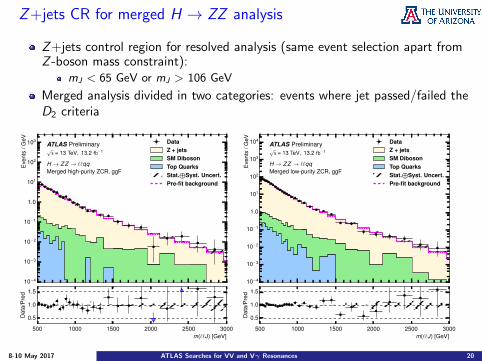
Z+jets CR for merged H → ZZ analysis
Z+jets control region for resolved analysis (same event selection apart fromZ -boson mass constraint):
mJ < 65 GeV or mJ > 106 GeV
Merged analysis divided in two categories: events where jet passed/failed theD2 criteria
10−4
10−3
10−2
10−1
1.0
101
102
103
Eve
nts
/GeV
ATLAS Preliminary√
s = 13 TeV, 13.2 fb−1
H → ZZ → ``qqMerged high-purity ZCR, ggF
DataZ + jetsSM DibosonTop QuarksStat.
⊕Syst. Uncert.
Pre-fit background
500 1000 1500 2000 2500 3000m(``J) [GeV]
0.5
1.0
1.5
Dat
a/P
red
10−4
10−3
10−2
10−1
1.0
101
102
103
104
Eve
nts
/GeV
ATLAS Preliminary√
s = 13 TeV, 13.2 fb−1
H → ZZ → ``qqMerged low-purity ZCR, ggF
DataZ + jetsSM DibosonTop QuarksStat.
⊕Syst. Uncert.
Pre-fit background
500 1000 1500 2000 2500 3000m(``J) [GeV]
0.5
1.0
1.5
Dat
a/P
red
8-10 May 2017 ATLAS Searches for VV and Vγ Resonances 20
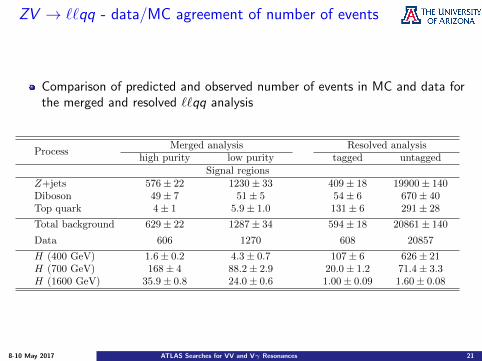
ZV → ``qq - data/MC agreement of number of events
Comparison of predicted and observed number of events in MC and data forthe merged and resolved ``qq analysis
ProcessMerged analysis Resolved analysis
high purity low purity tagged untaggedSignal regions
Z+jets 576± 22 1230± 33 409± 18 19900± 140Diboson 49± 7 51± 5 54± 6 670± 40Top quark 4± 1 5.9± 1.0 131± 6 291± 28
Total background 629± 22 1287± 34 594± 18 20861± 140
Data 606 1270 608 20857
H (400 GeV) 1.6± 0.2 4.3± 0.7 107± 6 626± 21H (700 GeV) 168± 4 88.2± 2.9 20.0± 1.2 71.4± 3.3H (1600 GeV) 35.9± 0.8 24.0± 0.6 1.00± 0.09 1.60± 0.08
8-10 May 2017 ATLAS Searches for VV and Vγ Resonances 21
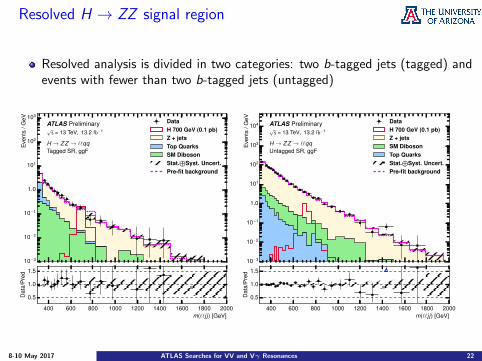
Resolved H → ZZ signal region
Resolved analysis is divided in two categories: two b-tagged jets (tagged) andevents with fewer than two b-tagged jets (untagged)
10−3
10−2
10−1
1.0
101
102
103
Eve
nts
/GeV
ATLAS Preliminary√
s = 13 TeV, 13.2 fb−1
H → ZZ → ``qqTagged SR, ggF
DataH 700 GeV (0.1 pb)Z + jetsTop QuarksSM DibosonStat.
⊕Syst. Uncert.
Pre-fit background
400 600 800 1000 1200 1400 1600 1800 2000m(``j j) [GeV]
0.5
1.0
1.5
Dat
a/P
red
10−3
10−2
10−1
1.0
101
102
103
104
Eve
nts
/GeV
ATLAS Preliminary√
s = 13 TeV, 13.2 fb−1
H → ZZ → ``qqUntagged SR, ggF
DataH 700 GeV (0.1 pb)Z + jetsSM DibosonTop QuarksStat.
⊕Syst. Uncert.
Pre-fit background
400 600 800 1000 1200 1400 1600 1800 2000m(``j j) [GeV]
0.5
1.0
1.5
Dat
a/P
red
8-10 May 2017 ATLAS Searches for VV and Vγ Resonances 22
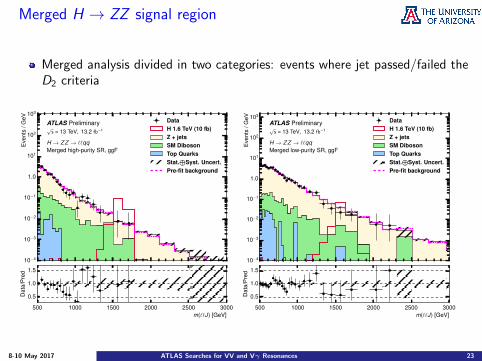
Merged H → ZZ signal region
Merged analysis divided in two categories: events where jet passed/failed theD2 criteria
10−4
10−3
10−2
10−1
1.0
101
102
103
Eve
nts
/GeV
ATLAS Preliminary√
s = 13 TeV, 13.2 fb−1
H → ZZ → ``qqMerged high-purity SR, ggF
DataH 1.6 TeV (10 fb)Z + jetsSM DibosonTop QuarksStat.
⊕Syst. Uncert.
Pre-fit background
500 1000 1500 2000 2500 3000m(``J) [GeV]
0.5
1.0
1.5
Dat
a/P
red
10−4
10−3
10−2
10−1
1.0
101
102
103
Eve
nts
/GeV
ATLAS Preliminary√
s = 13 TeV, 13.2 fb−1
H → ZZ → ``qqMerged low-purity SR, ggF
DataH 1.6 TeV (10 fb)Z + jetsSM DibosonTop QuarksStat.
⊕Syst. Uncert.
Pre-fit background
500 1000 1500 2000 2500 3000m(``J) [GeV]
0.5
1.0
1.5
Dat
a/P
red
8-10 May 2017 ATLAS Searches for VV and Vγ Resonances 23
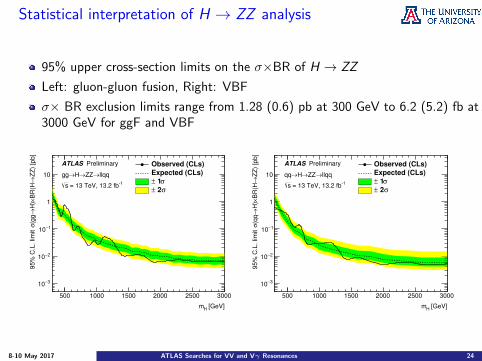
Statistical interpretation of H → ZZ analysis
95% upper cross-section limits on the σ×BR of H → ZZ
Left: gluon-gluon fusion, Right: VBF
σ× BR exclusion limits range from 1.28 (0.6) pb at 300 GeV to 6.2 (5.2) fb at3000 GeV for ggF and VBF
[GeV]H
m
500 1000 1500 2000 2500 3000
ZZ
) [p
b]
→B
R(H
×H
)→
(gg
σ 9
5%
C.L
. lim
it
3−10
2−10
1−10
1
10
Observed (CLs)
Expected (CLs)
σ 1±
σ 2±
llqq→ZZ→H→gg
PreliminaryATLAS
1 = 13 TeV, 13.2 fbs
[GeV]H
m
500 1000 1500 2000 2500 3000
ZZ
) [p
b]
→B
R(H
×H
)→
σ 9
5%
C.L
. lim
it
3−10
2−10
1−10
1
10
Observed (CLs)
Expected (CLs)
σ 1±
σ 2±
llqq→ZZ→H→qq
PreliminaryATLAS
1 = 13 TeV, 13.2 fbs
8-10 May 2017 ATLAS Searches for VV and Vγ Resonances 24
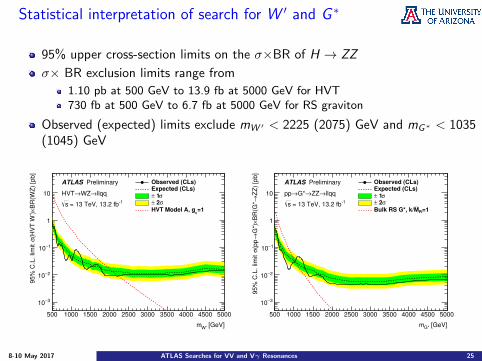
Statistical interpretation of search for W ′ and G ∗
95% upper cross-section limits on the σ×BR of H → ZZ
σ× BR exclusion limits range from
1.10 pb at 500 GeV to 13.9 fb at 5000 GeV for HVT730 fb at 500 GeV to 6.7 fb at 5000 GeV for RS graviton
Observed (expected) limits exclude mW ′ < 2225 (2075) GeV and mG∗ < 1035(1045) GeV
[GeV]W’
m
500 1000 1500 2000 2500 3000 3500 4000 4500 5000
BR
(WZ
) [p
b]
×(H
VT
W’)
σ 9
5%
C.L
. lim
it
3−10
2−10
1−10
1
10
Observed (CLs)Expected (CLs)
σ 1±
σ 2±
=1v
HVT Model A, g
llqq→WZ→HVT
PreliminaryATLAS
1 = 13 TeV, 13.2 fbs
[GeV]G* m
500 1000 1500 2000 2500 3000 3500 4000 4500 5000
ZZ
) [p
b]
→B
R(G
*×
G*)
→(p
pσ
95
% C
.L.
limit
3−10
2−10
1−10
1
10
Observed (CLs)Expected (CLs)
σ 1±
σ 2±
=1PIMBulk RS G*, k/
llqq→ZZ→G*→pp
PreliminaryATLAS
1 = 13 TeV, 13.2 fbs
8-10 May 2017 ATLAS Searches for VV and Vγ Resonances 25

Z+jets CR for ZV → ννqq analysis
Z → µµ + jets eventsLarge-R jet required to be outside of Z -mass window (mJ < 65 or mJ > 106GeV)Merged analysis divided in two categories: events where jet passed/failed theD2 criteriaModified definition of Emiss
T used (without muon contribution)
10−4
10−3
10−2
10−1
1.0
101
102
103
Eve
nts
/GeV
ATLAS Preliminary√
s = 13 TeV, 13.2 fb−1
2 lep. high-purity ZCR
DataZ + jetsSM DibosonTop QuarksStat.
⊕Syst. Uncert.
Pre-fit background
500 1000 1500 2000 2500 3000 3500mT (ννJ) [GeV]
0.5
1.0
1.5
Dat
a/P
red
10−4
10−3
10−2
10−1
1.0
101
102
103
Eve
nts
/GeV
ATLAS Preliminary√
s = 13 TeV, 13.2 fb−1
2 lep. low-purity ZCR
DataZ + jetsSM DibosonTop QuarksStat.
⊕Syst. Uncert.
Pre-fit background
500 1000 1500 2000 2500 3000 3500mT (ννJ) [GeV]
0.5
1.0
1.5
Dat
a/P
red
8-10 May 2017 ATLAS Searches for VV and Vγ Resonances 26
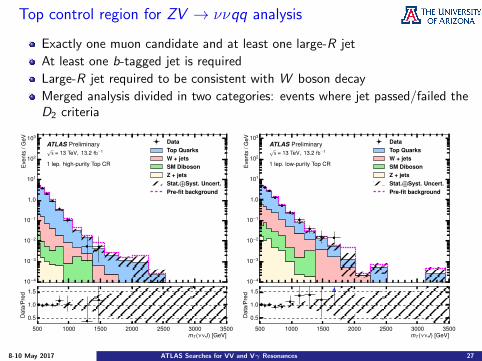
Top control region for ZV → ννqq analysis
Exactly one muon candidate and at least one large-R jet
At least one b-tagged jet is required
Large-R jet required to be consistent with W boson decay
Merged analysis divided in two categories: events where jet passed/failed theD2 criteria
10−4
10−3
10−2
10−1
1.0
101
102
103
Eve
nts
/GeV
ATLAS Preliminary√
s = 13 TeV, 13.2 fb−1
1 lep. high-purity Top CR
DataTop QuarksW + jetsSM DibosonZ + jetsStat.
⊕Syst. Uncert.
Pre-fit background
500 1000 1500 2000 2500 3000 3500mT (ννJ) [GeV]
0.5
1.0
1.5
Dat
a/P
red
10−4
10−3
10−2
10−1
1.0
101
102
103
Eve
nts
/GeV
ATLAS Preliminary√
s = 13 TeV, 13.2 fb−1
1 lep. low-purity Top CR
DataTop QuarksW + jetsSM DibosonZ + jetsStat.
⊕Syst. Uncert.
Pre-fit background
500 1000 1500 2000 2500 3000 3500mT (ννJ) [GeV]
0.5
1.0
1.5
Dat
a/P
red
8-10 May 2017 ATLAS Searches for VV and Vγ Resonances 27

W+jets CR for ZV → ννqq analysis
Exactly one muon candidate and at least one large-R jet
At least one b-tagged jet is required
Large-R jet required to be outside of W boson mass window
Merged analysis divided in two categories: events where jet passed/failed theD2 criteria
10−4
10−3
10−2
10−1
1.0
101
102
103
Eve
nts
/GeV
ATLAS Preliminary√
s = 13 TeV, 13.2 fb−1
1 lep. high-purity WCR
DataW + jetsTop QuarksSM DibosonZ + jetsStat.
⊕Syst. Uncert.
Pre-fit background
500 1000 1500 2000 2500 3000 3500mT (ννJ) [GeV]
0.5
1.0
1.5
Dat
a/P
red
10−4
10−3
10−2
10−1
1.0
101
102
103
104
Eve
nts
/GeV
ATLAS Preliminary√
s = 13 TeV, 13.2 fb−1
1 lep. low-purity WCR
DataW + jetsTop QuarksSM DibosonZ + jetsStat.
⊕Syst. Uncert.
Pre-fit background
500 1000 1500 2000 2500 3000 3500mT (ννJ) [GeV]
0.5
1.0
1.5
Dat
a/P
red
8-10 May 2017 ATLAS Searches for VV and Vγ Resonances 28

ZV → ννqq - data/MC agreement of number of events
Comparison of predicted and observed number of events in MC and data forthe high and low purity signal region of the ννqq analysis
ProcessMerged analysis
high-purity low-purityZ+jets 1251 ± 56 3130 ± 79W+jets 881 ± 45 2092 ± 75Diboson 202 ± 14 227 ± 10tt̄ + single top 557 ± 85 610 ± 100
Total background 2891± 50 6059 ± 76
Data 2859 6044
H (1600 GeV) 63.7 ± 1.9 46.2 ± 1.4
8-10 May 2017 ATLAS Searches for VV and Vγ Resonances 29
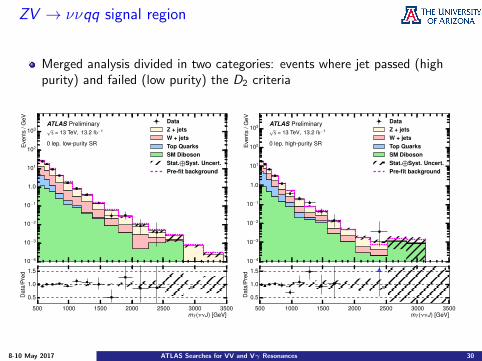
ZV → ννqq signal region
Merged analysis divided in two categories: events where jet passed (highpurity) and failed (low purity) the D2 criteria
10−4
10−3
10−2
10−1
1.0
101
102
103
Eve
nts
/GeV
ATLAS Preliminary√
s = 13 TeV, 13.2 fb−1
0 lep. low-purity SR
DataZ + jetsW + jetsTop QuarksSM DibosonStat.
⊕Syst. Uncert.
Pre-fit background
500 1000 1500 2000 2500 3000 3500mT (ννJ) [GeV]
0.5
1.0
1.5
Dat
a/P
red
10−4
10−3
10−2
10−1
1.0
101
102
103
Eve
nts
/GeV
ATLAS Preliminary√
s = 13 TeV, 13.2 fb−1
0 lep. high-purity SR
DataZ + jetsW + jetsTop QuarksSM DibosonStat.
⊕Syst. Uncert.
Pre-fit background
500 1000 1500 2000 2500 3000 3500mT (ννJ) [GeV]
0.5
1.0
1.5
Dat
a/P
red
8-10 May 2017 ATLAS Searches for VV and Vγ Resonances 30
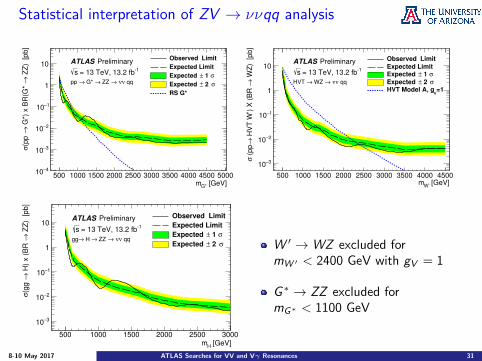
Statistical interpretation of ZV → ννqq analysis
[GeV]G*m500 1000 1500 2000 2500 3000 3500 4000 4500 5000
ZZ
) [
pb
]→
G*)
x B
R(G
* →
(pp
σ
4−10
3−10
2−10
1−10
1
10 ATLAS Preliminary1 = 13 TeV, 13.2 fbs
qqνν → ZZ → G* →pp
Observed Limit
Expected Limit
σ 1 ±Expected
σ 2 ±Expected
RS G*
[GeV]W’
m500 1000 1500 2000 2500 3000 3500 4000 4500
WZ
) [
pb
]→
HV
T W
’) X
(B
R
→ (
pp
σ 3−10
2−10
1−10
1
10ATLAS Preliminary
1 = 13 TeV, 13.2 fbs
qqνν → WZ →HVT
Observed Limit
Expected Limitσ 1 ±Expected
σ 2 ±Expected =1
vHVT Model A, g
[GeV]H
m500 1000 1500 2000 2500 3000
ZZ
) [
pb
]→
H)
x (
BR
→
(gg
σ
3−10
2−10
1−10
1
10ATLAS Preliminary
1 = 13 TeV, 13.2 fbs
qqνν → ZZ → H →gg
Observed Limit
Expected Limit
σ 1 ±Expected
σ 2 ±Expected W ′ →WZ excluded formW ′ < 2400 GeV with gV = 1
G∗ → ZZ excluded formG∗ < 1100 GeV
8-10 May 2017 ATLAS Searches for VV and Vγ Resonances 31

WV → `νqq - data/MC agreement of number of events
Event selection criteria for the signal region and W+jets and tt̄ control region
Selection SR: HP (LP) W CR: HP (LP) tt̄ CR: HP (LP)
W → `ν selection
Number of signal leptons 1Number of vetoed leptons 0Number of vetoed leptons 0
EmissT > 100GeV
pT(`ν) > 200GeV
W/Z → J selectionNumber of large-R jets ≥ 1
Passing the D(β=1)2 cut yes (no) yes (no) yes (no)∣∣mW/Z −mJ
∣∣ < 15 GeV > 15 GeV < 15 GeV
Topology cutspT(`ν)/mWV > 0.4pT(J)/mWV
Top-quark veto Number of b-tagged jets 0 ≥ 1
8-10 May 2017 ATLAS Searches for VV and Vγ Resonances 32

W+jets CR for WV → `νqq analysis
Mass of large-R jet required to be outside of 15 GeV window around mW
Zero b-tagged jets
Merged analysis divided in two categories: events where jet passed (highpurity) and failed (low purity) the D2 criteria
500 1000 1500 2000 2500 3000 3500 4000 4500 5000
En
trie
s /
10
0 G
eV
3−10
2−10
1−10
1
10
210
310
410
510
610 Data 201516
W+jets
tt
Singlet
Dibosons
Z+jets
Postfit uncertainty
HVT m = 2.0 TeV
PreliminaryATLAS
= 13 TeV, 13.2/fbs
W+jets Control Region (HP)
[GeV]Jνlm500 1000 1500 2000 2500 3000 3500 4000 4500 5000
Data
/ M
C
0.5
1
1.5
500 1000 1500 2000 2500 3000 3500 4000 4500 5000
En
trie
s /
10
0 G
eV
3−10
2−10
1−10
1
10
210
310
410
510
610
710Data 201516
W+jets
tt
Singlet
Dibosons
Z+jets
Postfit uncertainty
HVT m = 2.0 TeV
PreliminaryATLAS
= 13 TeV, 13.2/fbs
W+jets Control Region (LP)
[GeV]Jνlm500 1000 1500 2000 2500 3000 3500 4000 4500 5000
Data
/ M
C
0.5
1
1.5
8-10 May 2017 ATLAS Searches for VV and Vγ Resonances 33
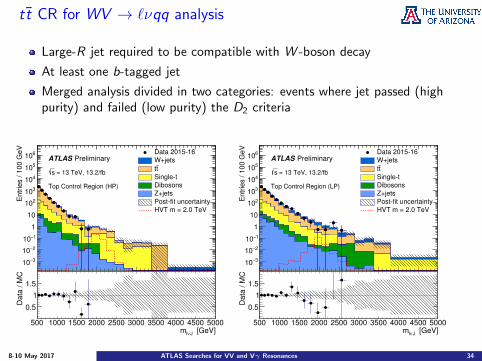
tt̄ CR for WV → `νqq analysis
Large-R jet required to be compatible with W -boson decay
At least one b-tagged jet
Merged analysis divided in two categories: events where jet passed (highpurity) and failed (low purity) the D2 criteria
500 1000 1500 2000 2500 3000 3500 4000 4500 5000
En
trie
s /
10
0 G
eV
3−10
2−10
1−10
1
10
210
310
410
510
610Data 201516
W+jets
tt
Singlet
Dibosons
Z+jets
Postfit uncertainty
HVT m = 2.0 TeV
PreliminaryATLAS
= 13 TeV, 13.2/fbs
Top Control Region (HP)
[GeV]Jνlm500 1000 1500 2000 2500 3000 3500 4000 4500 5000
Data
/ M
C
0.5
1
1.5
500 1000 1500 2000 2500 3000 3500 4000 4500 5000
En
trie
s /
10
0 G
eV
3−10
2−10
1−10
1
10
210
310
410
510
610Data 201516
W+jets
tt
Singlet
Dibosons
Z+jets
Postfit uncertainty
HVT m = 2.0 TeV
PreliminaryATLAS
= 13 TeV, 13.2/fbs
Top Control Region (LP)
[GeV]Jνlm500 1000 1500 2000 2500 3000 3500 4000 4500 5000
Data
/ M
C
0.5
1
1.5
8-10 May 2017 ATLAS Searches for VV and Vγ Resonances 34
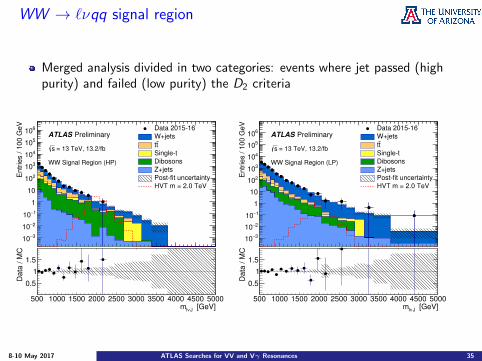
WW → `νqq signal region
Merged analysis divided in two categories: events where jet passed (highpurity) and failed (low purity) the D2 criteria
500 1000 1500 2000 2500 3000 3500 4000 4500 5000
En
trie
s /
10
0 G
eV
3−10
2−10
1−10
1
10
210
310
410
510
610 Data 201516
W+jets
tt
Singlet
Dibosons
Z+jets
Postfit uncertainty
HVT m = 2.0 TeV
PreliminaryATLAS
= 13 TeV, 13.2/fbs
WW Signal Region (HP)
[GeV]Jνlm500 1000 1500 2000 2500 3000 3500 4000 4500 5000
Data
/ M
C
0.5
1
1.5
500 1000 1500 2000 2500 3000 3500 4000 4500 5000
En
trie
s /
10
0 G
eV
3−10
2−10
1−10
1
10
210
310
410
510
610Data 201516
W+jets
tt
Singlet
Dibosons
Z+jets
Postfit uncertainty
HVT m = 2.0 TeV
PreliminaryATLAS
= 13 TeV, 13.2/fbs
WW Signal Region (LP)
[GeV]Jνlm500 1000 1500 2000 2500 3000 3500 4000 4500 5000
Data
/ M
C
0.5
1
1.5
8-10 May 2017 ATLAS Searches for VV and Vγ Resonances 35
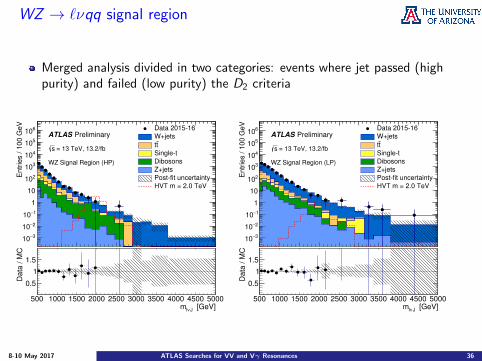
WZ → `νqq signal region
Merged analysis divided in two categories: events where jet passed (highpurity) and failed (low purity) the D2 criteria
500 1000 1500 2000 2500 3000 3500 4000 4500 5000
En
trie
s /
10
0 G
eV
3−10
2−10
1−10
1
10
210
310
410
510
610 Data 201516
W+jets
tt
Singlet
Dibosons
Z+jets
Postfit uncertainty
HVT m = 2.0 TeV
PreliminaryATLAS
= 13 TeV, 13.2/fbs
WZ Signal Region (HP)
[GeV]Jνlm500 1000 1500 2000 2500 3000 3500 4000 4500 5000
Data
/ M
C
0.5
1
1.5
500 1000 1500 2000 2500 3000 3500 4000 4500 5000
En
trie
s /
10
0 G
eV
3−10
2−10
1−10
1
10
210
310
410
510
610Data 201516
W+jets
tt
Singlet
Dibosons
Z+jets
Postfit uncertainty
HVT m = 2.0 TeV
PreliminaryATLAS
= 13 TeV, 13.2/fbs
WZ Signal Region (LP)
[GeV]Jνlm500 1000 1500 2000 2500 3000 3500 4000 4500 5000
Data
/ M
C
0.5
1
1.5
8-10 May 2017 ATLAS Searches for VV and Vγ Resonances 36

WW → `νqq - data/MC agreement of number of events
Comparison of predicted and observed number of events in MC and data forthe WW signal and control regions `νqq analysis
WW signal region W+jets control region tt̄ control regionHigh-purity category
W+jets 1810 ± 63 3182 ± 65 215 ± 12tt̄ 654 ± 50 1020 ± 33 2940 ± 70Single-t 163 ± 14 200 ± 15 322 ± 23Z+jets 18.0 ± 3.8 53 ± 6 12 ± 2Diboson 192 ± 31 70 ± 11 19.0 ± 3.8Total SM 2830 ± 80 4530 ± 80 3500 ± 80Data 2822 ± 53 4534 ± 67 3509 ± 59
Low-purity categoryW+jets 5630 ± 94 7320 ± 110 706 ± 37tt̄ 730 ± 50 1410 ± 47 3100 ± 89Single-t 178 ± 14 290 ± 22 420 ± 31Z+jets 66.6 ± 4.8 134.1 ± 7.7 17.7 ± 2.8Dibosons 215 ± 34 150 ± 23 22 ± 4Total SM 6820 ± 80 9310 ± 125 4260 ± 120Data 6849 ± 83 9276 ± 96 4270 ± 65
8-10 May 2017 ATLAS Searches for VV and Vγ Resonances 37
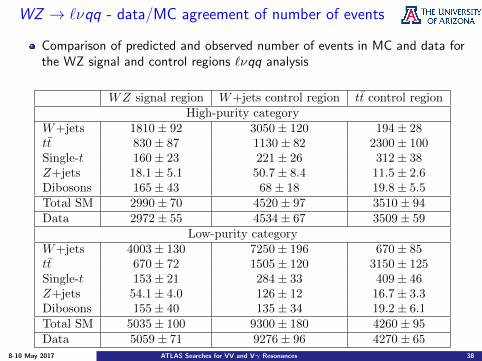
WZ → `νqq - data/MC agreement of number of events
Comparison of predicted and observed number of events in MC and data forthe WZ signal and control regions `νqq analysis
WZ signal region W+jets control region tt̄ control regionHigh-purity category
W+jets 1810 ± 92 3050 ± 120 194 ± 28tt̄ 830 ± 87 1130 ± 82 2300 ± 100Single-t 160 ± 23 221 ± 26 312 ± 38Z+jets 18.1 ± 5.1 50.7 ± 8.4 11.5 ± 2.6Dibosons 165 ± 43 68 ± 18 19.8 ± 5.5Total SM 2990 ± 70 4520 ± 97 3510 ± 94Data 2972 ± 55 4534 ± 67 3509 ± 59
Low-purity categoryW+jets 4003 ± 130 7250 ± 196 670 ± 85tt̄ 670 ± 72 1505 ± 120 3150 ± 125Single-t 153 ± 21 284 ± 33 409 ± 46Z+jets 54.1 ± 4.0 126 ± 12 16.7 ± 3.3Dibosons 155 ± 40 135 ± 34 19.2 ± 6.1Total SM 5035 ± 100 9300 ± 180 4260 ± 95Data 5059 ± 71 9276 ± 96 4270 ± 65
8-10 May 2017 ATLAS Searches for VV and Vγ Resonances 38
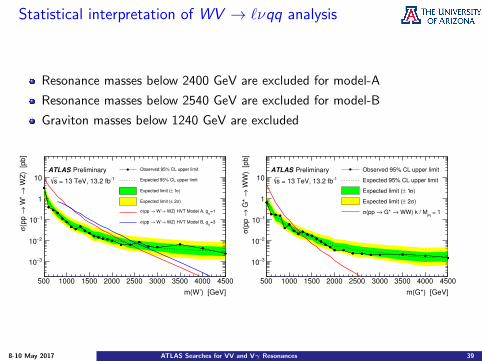
Statistical interpretation of WV → `νqq analysis
Resonance masses below 2400 GeV are excluded for model-A
Resonance masses below 2540 GeV are excluded for model-B
Graviton masses below 1240 GeV are excluded
m(W’) [GeV]
500 1000 1500 2000 2500 3000 3500 4000 4500
WZ
) [
pb
]→
W’
→(p
p
σ
3−10
2−10
1−10
1
10
Observed 95% CL upper limit
Expected 95% CL upper limit
)σ 1±Expected limit (
)σ 2±Expected limit (
=1V
WZ) HVT Model A, g→ W’→(pp σ
=3V
WZ) HVT Model B, g→ W’→(pp σ
PreliminaryATLAS
1 = 13 TeV, 13.2 fbs
m(G*) [GeV]
500 1000 1500 2000 2500 3000 3500 4000 4500
WW
) [
pb
]→
G*
→(p
p
σ
3−10
2−10
1−10
1
10
Observed 95% CL upper limit
Expected 95% CL upper limit
)σ 1±Expected limit (
)σ 2±Expected limit (
= 1Pl
WW) k / M→ G* →(pp σ
PreliminaryATLAS
1 = 13 TeV, 13.2 fbs
8-10 May 2017 ATLAS Searches for VV and Vγ Resonances 39

Number of ghost-associated tracks ntrk
Study the jet mass distribution in enriched W /Z+jets events
D2 criteria applied to select jets and ntrk varied
Scale factor of 1.06 → 6% systematic uncertainty on ntrk
Improvement of 20-30% of expected sensitivity
Eve
nts
/ 5 G
eV
0
1000
2000
3000
4000
5000
6000
7000
8000
9000
-1=13 TeV, 15.5 fbs
<30trkN
ATLAS Preliminary
DataMulti-jet MCW+jets MCZ+jets MCFitted s+bFitted bkd.
[GeV]Jm40 60 80 100 120 140 160 180 200 220 240
Dat
a-fit
0500
1000 450±Signal=6599
trk N
0 10 20 30 40 50 60 70 80 90
Fra
ctio
n of
W/Z
eve
nts
/ tra
ck
0
0.01
0.02
0.03
0.04
0.05
Data
W/Z MC
W/Z reweighted
ATLAS Preliminary
-1=13 TeV, 15.5 fbs
8-10 May 2017 ATLAS Searches for VV and Vγ Resonances 40

Rapidity difference
Rapidity difference is used to suppress QCD dijet background (t-channelproduction)
Discriminating power changes with pT
10% window around mW ′ mass
|12
y∆|
Even
ts /
0.15
20
40
60
80
100
120310×
Data
Multi-jet MC = 1500 GeVW’m
PreliminaryATLAS-1 = 13 TeV, 15.5 fbs
WZ→HVT W’
|12 y∆ | 0 1 2 3
Dat
a/M
C
0.51
1.5 |12
y∆|
Even
ts /
0.15
2
4
6
8
10
12
14
16
18310×
Data
Multi-jet MC = 2400 GeVW’m
PreliminaryATLAS-1 = 13 TeV, 15.5 fbs
WZ→HVT W’
|12 y∆ | 0 1 2 3
Dat
a/M
C
0.51
1.5
8-10 May 2017 ATLAS Searches for VV and Vγ Resonances 41
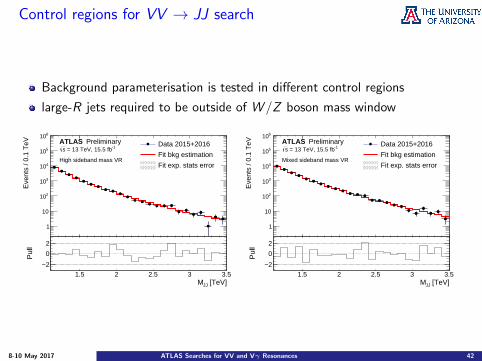
Control regions for VV → JJ search
Background parameterisation is tested in different control regions
large-R jets required to be outside of W /Z boson mass window
1.5 2 2.5 3 3.5
Eve
nts
/ 0.1
TeV
1
10
210
310
410
510
610ATLAS Preliminary
-1 = 13 TeV, 15.5 fbs
High sideband mass VR
Data 2015+2016
Fit bkg estimation
Fit exp. stats error
[TeV]JJM1.5 2 2.5 3 3.5
Pul
l
2−0
21.5 2 2.5 3 3.5
Eve
nts
/ 0.1
TeV
1
10
210
310
410
510
610ATLAS Preliminary
-1 = 13 TeV, 15.5 fbs
Mixed sideband mass VR
Data 2015+2016
Fit bkg estimation
Fit exp. stats error
[TeV]JJM1.5 2 2.5 3 3.5
Pul
l
2−0
2
8-10 May 2017 ATLAS Searches for VV and Vγ Resonances 42
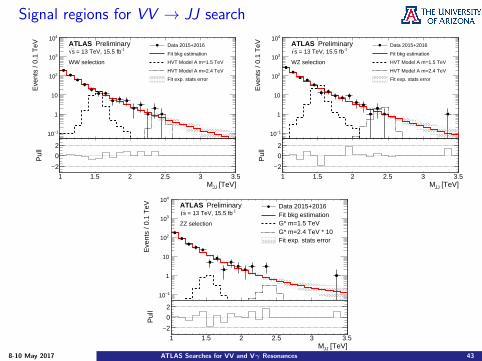
Signal regions for VV → JJ search
1 1.5 2 2.5 3 3.5
Eve
nts
/ 0.1
TeV
1−10
1
10
210
310
410ATLAS Preliminary
-1 = 13 TeV, 15.5 fbs
WW selection
Data 2015+2016
Fit bkg estimation
HVT Model A m=1.5 TeV
HVT Model A m=2.4 TeV
Fit exp. stats error
[TeV]JJM1 1.5 2 2.5 3 3.5
Pul
l
2−0
21 1.5 2 2.5 3 3.5
Eve
nts
/ 0.1
TeV
1−10
1
10
210
310
410ATLAS Preliminary
-1 = 13 TeV, 15.5 fbs
WZ selection
Data 2015+2016
Fit bkg estimation
HVT Model A m=1.5 TeV
HVT Model A m=2.4 TeV
Fit exp. stats error
[TeV]JJM1 1.5 2 2.5 3 3.5
Pul
l
2−0
2
1 1.5 2 2.5 3 3.5
Eve
nts
/ 0.1
TeV
1−10
1
10
210
310
410ATLAS Preliminary
-1 = 13 TeV, 15.5 fbs
ZZ selection
Data 2015+2016Fit bkg estimationG* m=1.5 TeVG* m=2.4 TeV * 10Fit exp. stats error
[TeV]JJM1 1.5 2 2.5 3 3.5
Pul
l
2−0
2
8-10 May 2017 ATLAS Searches for VV and Vγ Resonances 43
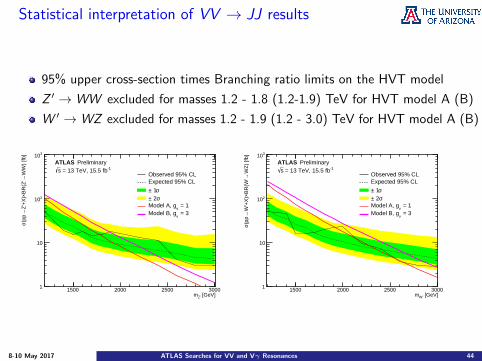
Statistical interpretation of VV → JJ results
95% upper cross-section times Branching ratio limits on the HVT model
Z ′ →WW excluded for masses 1.2 - 1.8 (1.2-1.9) TeV for HVT model A (B)
W ′ →WZ excluded for masses 1.2 - 1.9 (1.2 - 3.0) TeV for HVT model A (B)
[GeV]Z'm1500 2000 2500 3000
WW
) [fb
]→
BR
(Z'
×Z
'+X
)→
(pp
σ
1
10
210
310ATLAS Preliminary
-1 = 13 TeV, 15.5 fbsObserved 95% CLExpected 95% CL
σ 1±σ 2±
= 1v
Model A, g = 3
vModel B, g
[GeV]W'm1500 2000 2500 3000
WZ
) [fb
]→
BR
(W'
×W
'+X
)→
(pp
σ
1
10
210
310ATLAS Preliminary
-1 = 13 TeV, 15.5 fbsObserved 95% CLExpected 95% CL
σ 1±σ 2±
= 1v
Model A, g = 3
vModel B, g
8-10 May 2017 ATLAS Searches for VV and Vγ Resonances 44
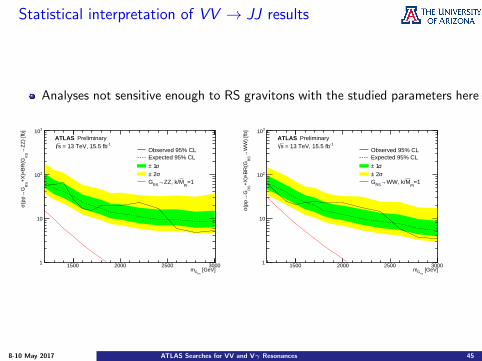
Statistical interpretation of VV → JJ results
Analyses not sensitive enough to RS gravitons with the studied parameters here
[GeV]RS
Gm1500 2000 2500 3000
ZZ
) [fb
]→
RS
BR
(G×
+X
)R
SG
→(p
pσ
1
10
210
310ATLAS Preliminary
-1 = 13 TeV, 15.5 fbsObserved 95% CLExpected 95% CL
σ 1±σ 2±
=1Pl
MZZ, k/→RSG
[GeV]RS
Gm1500 2000 2500 3000
WW
) [fb
]→
RS
BR
(G×
+X
)R
SG
→(p
pσ
1
10
210
310ATLAS Preliminary
-1 = 13 TeV, 15.5 fbsObserved 95% CLExpected 95% CL
σ 1±σ 2±
=1Pl
MWW, k/→RSG
8-10 May 2017 ATLAS Searches for VV and Vγ Resonances 45
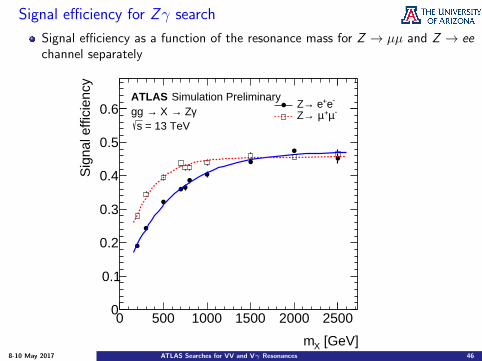
Signal efficiency for Zγ search
Signal efficiency as a function of the resonance mass for Z → µµ and Z → eechannel separately
[GeV]Xm
0 500 1000 1500 2000 2500
Sig
nal e
ffici
ency
0
0.1
0.2
0.3
0.4
0.5
0.6 Simulation PreliminaryATLAS
γ Z→ X →gg = 13 TeVs
-e+ e→Z-µ+µ →Z
8-10 May 2017 ATLAS Searches for VV and Vγ Resonances 46
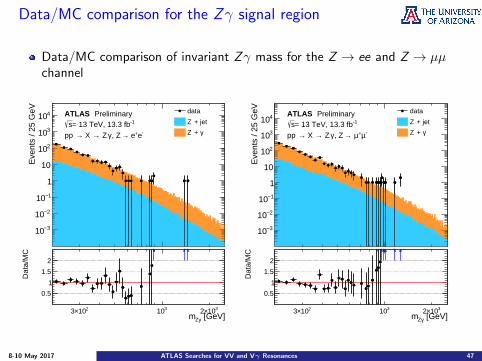
Data/MC comparison for the Zγ signal region
Data/MC comparison of invariant Zγ mass for the Z → ee and Z → µµchannel
(GeV)γllM
310
Eve
nts
/ 25
GeV
3−10
2−10
1−10
1
10
210
310
410data
+ jetZ
γ + Z
PreliminaryATLAS-1= 13 TeV, 13.3 fbs
-e+ e→Z, γZ → X → pp
[GeV]γZm210×3 310 310×2
Dat
a/M
C
0.5
1
1.5
2 (GeV)γllM
310E
vent
s / 2
5 G
eV
3−10
2−10
1−10
1
10
210
310
410data
+ jetZ
γ + Z
PreliminaryATLAS-1= 13 TeV, 13.3 fbs
-µ+µ →Z, γZ → X → pp
[GeV]γZm210×3 310 310×2
Dat
a/M
C
0.5
1
1.5
2
8-10 May 2017 ATLAS Searches for VV and Vγ Resonances 47
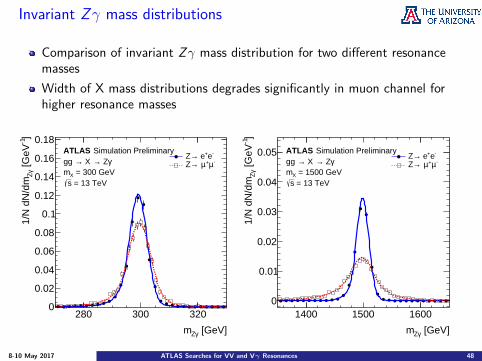
Invariant Zγ mass distributions
Comparison of invariant Zγ mass distribution for two different resonancemasses
Width of X mass distributions degrades significantly in muon channel forhigher resonance masses
[GeV]γZm
280 300 320
]-1
[GeV
γZ
1/N
dN
/dm
0
0.02
0.04
0.06
0.08
0.1
0.12
0.14
0.16
0.18 Simulation PreliminaryATLAS
γ Z→ X →gg = 300 GeV Xm = 13 TeVs
-e+ e→Z-µ+µ →Z
[GeV]γZm
1400 1500 1600
]-1
[GeV
γZ
1/N
dN
/dm
0
0.01
0.02
0.03
0.04
0.05 Simulation PreliminaryATLASγ Z→ X →gg
= 1500 GeV Xm = 13 TeVs
-e+ e→Z-µ+µ →Z
8-10 May 2017 ATLAS Searches for VV and Vγ Resonances 48

Background parameterisation
Background parameterisation for the Z → ee and Z → µµ channel separately
[GeV]γZm
310
Eve
nts
/ 20.
0 G
eV
3−10
2−10
1−10
1
10
210
310
data
bbackground,
- e+ e→Z, γZ→X→pp
-1 = 13 TeV, 13.3 fbs
PreliminaryATLAS
[GeV]γZm210×3 310 310×2
data
- b
10−0
10 [GeV]γZm
310
Eve
nts
/ 20.
0 G
eV
3−10
2−10
1−10
1
10
210
310
410
data
bbackground,
-µ +µ →Z, γZ→X→pp
-1 = 13 TeV, 13.3 fbs
PreliminaryATLAS
[GeV]γZm210×3 310 310×2
data
- b
20−0
20
8-10 May 2017 ATLAS Searches for VV and Vγ Resonances 49


