GLOBE ® 2014 Introduction - 1 Atmosphere Protocols Learning Activities Appendix Welcome Introduction Introduction Atmosphere Scientists are investigating the atmosphere. They want to understand and predict: Weather (the air temperature, rain, snow, relative humidity, cloud conditions, and atmospheric pressure and the coming and going of storms); Climate (the average and extreme conditions of the atmosphere); Energy Budget (Land-Atmosphere interactions); and Atmospheric Composition (the trace gases and particles in the air). Each of these characteristics of the atmosphere affects us and our environment. What we wear and what we can do outside today depend on weather. Is it raining? Snowing? Sunny? Cold? How we build our homes and schools, what crops we grow, what animals and plants naturally live around us all depend on climate. Does rain come mainly in winter or summer or every day? Do we get frost or snow? How long do dry spells last? The composition of the atmosphere affects how our air looks and feels and how far we can see. On days when clouds don’t completely cover the sky, does the sky look blue or milky? Does it ever have a brown tint? Do sunsets have lots of red color? All these are dependent on the composition of our air. GLOBE scientists want several types of atmosphere data from schools to help in their investigations. As a GLOBE student, you can do research on the atmosphere, too. You can investigate your local weather, climate, and atmospheric composition and how these vary from place to place, season to season, and year to year. You will learn more about the air around you.
Transcript
GLOBE® 2014 Introduction - 1 Atmosphere
Protocols
Learning ActivitiesA
ppendixW
elcome
IntroductionIntroduction Atmosphere
Scientists are investigating the atmosphere. They want to understand and predict:
Weather (the air temperature, rain, snow, relative humidity, cloud conditions, and atmospheric pressure and the coming and going of storms);
Climate (the average and extreme conditions of the atmosphere);
Energy Budget (Land-Atmosphere interactions); and
Atmospheric Composition (the trace gases and particles in the air).
Each of these characteristics of the atmosphere affects us and our environment. What we wear and what we can do outside today depend on weather. Is it raining? Snowing? Sunny? Cold?
How we build our homes and schools, what crops we grow, what animals and plants
naturally live around us all depend on climate. Does rain come mainly in winter or summer or every day? Do we get frost or snow? How long do dry spells last?
The composition of the atmosphere affects how our air looks and feels and how far we can see. On days when clouds don’t completely cover the sky, does the sky look blue or milky? Does it ever have a brown tint? Do sunsets have lots of red color? All these are dependent on the composition of our air.
GLOBE scientists want several types of atmosphere data from schools to help in their investigations. As a GLOBE student, you can do research on the atmosphere, too. You can investigate your local weather, climate, and atmospheric composition and how these vary from place to place, season to season, and year to year. You will learn more about the air around you.
GLOBE® 2014 Introduction - 2 Atmosphere
Why Investigate the Atmosphere?We humans may live on land, but we live and move and breathe in the atmosphere. The atmosphere gives us the oxygen we breathe and carries off the carbon dioxide we exhale. The atmosphere filters out most harmful forms of sunlight and traps outgoing heat from Earth’s surface. The atmosphere transports energy from the equator to the poles making the whole planet more liveable and brings the moisture evaporated from lakes and oceans to the dry land so that we have water to drink and to sustain our agriculture. We are creatures of the atmosphere and depend on its temperature, structure, composition and the moisture it carries.
WeatherOn a day-to-day basis, we want to know many things about the weather we will encounter today. For example, we might like to know what the air temperature will be and whether it will rain so we can decide what type of clothes to wear; whether we need to take an umbrella with us when we go outside; or if we need to wear a hat and sunscreen to protect us from the sun’s ultraviolet rays. We want to be sure the air we breathe is good for us. We want warnings so that we may protect ourselves and our property from severe storms.
ClimateWe also want information about the atmosphere on a longer term basis. Farmers need to know if their crops will get enough rain. Ski resorts need to know if enough snow will fall. Insurance underwriters for areas struck by hurricanes would like to know how many hurricanes to expect in a given year and how strong they will be when they make landfall. Nearly everyone would like to know what the weather is going to be not only tomorrow or the next day, but next week, and what the climate will be six months, a year, or even ten years from now! People have long said, “Everyone complains about the weather, but no one does anything about it.” Today, scientists are working hard to understand and predict the full range of atmospheric phenomena, from storms to ozone. Atmospheric scientists study not
only what is going on with the atmosphere today, but why it was a certain way in the past and what it will be like in the future. While controlling the weather is generally beyond human ability, the collective effects of human activity influence weather, climate, and atmospheric composition. Scientific understanding of the atmosphere and the ability to forecast its future state grows through the application of fundamental laws and extensive observations. Since we care about the atmosphere on scales ranging from the individual farm to the entire globe and on timescales from a few minutes in severe storms to decades for the climate, vast quantities of data are needed.
Scientists Need GLOBE DataPeople often think that scientists know what is happening in all parts of the world, but this is far from true. There are many regions where scientists have only the most general understanding of environmental factors such as air temperature and precipitation. Even in regions where there seems to be an abundance of data, scientists still do not know how much precipitation and temperature vary over relatively short distances. Official weather monitoring stations have contributed much data for a century or more in some locations while satellite technology has given us pictures of large areas every 30 minutes and global images at least twice daily for decades. Some areas have special monitors of atmospheric gases, and increasingly, airports monitor winds, not only at the ground, but up to heights of several kilometers. Despite all these wonderful efforts, there are gaps in coverage. The atmosphere varies significantly within these gaps, and GLOBE student measurements can improve the coverage for many types of observations. Atmospheric conditions have an important impact on the types of plants and animals that live in a certain area, and even on the kind of soil that forms there. The measurements that students take for the GLOBE Atmosphere Investigation are important to scientists who study weather, climate, land cover, phenology, ecology, biology, hydrology, and soil.
GLOBE® 2014 Introduction - 3 Atmosphere
Protocols
Learning ActivitiesA
ppendixW
elcome
Introduction
and then to fall with height to roughly 80 km (the mesosphere). Above this height, in the thermosphere, the density of the air is so reduced that many different phenomena begin to be important. At these heights, absorption of x-rays and extreme ultraviolet light from the sun ionizes the gases of the atmosphere and heats the air. The ions are affected by Earth’s magnetic field and also by the solar wind. At great distances from the planet’s surface, the atmosphere trails off into the interplanetary medium. The density of the atmosphere decreases until it is the same as that of interplanetary space. There are differences in the atmosphere at different latitudes as well as different heights. The intensity of sunlight at Earth’s surface varies with latitude. Sunlight is most intense in the tropics and least intense near the poles. The tropics are heated more than the poles, and the atmosphere along with the oceans transport heat from the equator toward the poles. The result is a large scale circulation of the atmosphere which is described in the Earth As A System chapter.Through the motion of the atmosphere, all the different places on Earth are connected together on timescales of hours to days to months. Changes in one part of the world result in changes in other areas.
The Big PictureThe Nature of the AtmosphereEarth’s atmosphere is a thin layer of gases composed of about 78% nitrogen, 21% oxygen, and 1% other gases (including argon, water vapor, carbon dioxide, and ozone). There are also solid and liquid particles called aerosols suspended in this layer. The atmosphere is held to the planet by gravity with the result that atmospheric pressure and density decrease with height above Earth’s surface. See Figure AT-I-1. Temperature also varies with height in the atmosphere (Figure AT-I-2), but in a more complex way than pressure and density. About half the sunlight shining on Earth passes all the way through the atmosphere and warms the surface. The warm ground then heats the air at the surface. Temperature generally decreases to heights of 8 to 15 km, depending on latitude. This defines the lower atmosphere or troposphere where most weather happens. Ultraviolet sunlight is absorbed by oxygen to form the ozone layer and is also absorbed by ozone itself. This absorption warms the middle atmosphere, causing the temperature to rise with height from the top of the lower atmosphere to 50 km (the stratosphere) Figure AT-I-1 Figure AT-I-2
90.0
80.0
70.0
60.0
50.0
40.0
30.0
20.0
10.0
0.0
Alti
tude
(km
)
Density (kg/m3)
Density
Pressure (mb)
Pressure
0.00001 0.0001 0.001 0.01 0.1 1 10
0.001 0.01 0.1 1 10 100 1000
90.0
85.0
80.0
75.0
70.0
65.0
60.0
55.0
50.0
45.0
40.0
35.0
30.0
25.0
20.0
15.0
10.0
5.0
0.0
Alti
tude
(km
)
Temperature (˚C)
Thermosphere
Mesosphere
Stratosphere
Troposphere
-100 -80 -60 -40 -20 0 20
GLOBE® 2014 Introduction - 4 Atmosphere
Weather and Climate, the Atmosphere Over TimeWeather and climate are not the same. By weather we mean what is happening in the atmosphere today, tomorrow, or even next week. By climate we mean weather averages, variability, and extremes over time. For example, in a certain city the current temperature may be 25˚ C; this is weather. If instead we were to look at the weather records for the past 30 years, we might find that the average temperature in that city on that particular day is 18˚ C (this is climate). We also might find that over this 30-year period the temperature in this city has ranged from as high as 30˚ C to as low as 12˚ C on that particular day. Therefore, the present temperature of 25˚ C is not unusual.When we study the history of Earth’s climate, we notice that temperature and precipitation in any given region vary over time and that the composition of the atmosphere has changed. For example, images from certain satellites show that great rivers used to run through the Egyptian Desert. We also know that thousands of years ago, glaciers were present in places like New York City where today air conditioning is routinely used to cope with summer heat. If Earth was so different in the past, can we predict what might happen in the future? Predicting climate is a major goal of Earth Science today.
GLOBE MeasurementsWhat Measurements Are Taken?Different GLOBE measurements are useful in investigating weather, climate, and atmospheric composition.
Weather Cloud Cover and TypeContrail Cover and TypeBarometric PressureRelative HumidityWater VaporPrecipitationMaximum, Minimum, and Current
TemperaturesSurface TemperatureWind speed and direction (if you have
automated equipment)Climate
Cloud Cover and TypeContrail Cover and TypeAerosol Optical ThicknessRelative HumidityPrecipitationWater VaporMaximum, Minimum, and Current
TemperaturesSurface TemperatureWind speed and direction (if you have
gas that helps control temperatures in the lower atmosphere and on Earth’s surface. Although the presence of water vapor near Earth’s surface is easily discernible in the form of clouds and relative humidity, there are still many questions about atmospheric water vapor. Using a handheld GLOBE/GIFTS water vapor instrument to measure the intensity of the sunlight reaching the surface in specific wavelengths, GLOBE students and scientists can determine the amount of atmospheric water vapor present. Despite its importance, the global distribution and temporal variability of water vapor is not well known. Therefore, student measurements will be useful to scientists as they work to learn more about atmospheric water vapor.
Relative HumidityThe amount of water vapor in the air compared to the maximum amount of water vapor air at the same temperature and pressure can hold is referred to as relative humidity and is expressed as a percentage. Satellites can sense the amount of water in the atmosphere, but generally these measurements are averages over large regions (>10s of kilometers). Humidity may vary over much a smaller distances. Using either a sling psychrometer or a digital hygrometer to measure relative humidity, GLOBE students can expand the total set of humidity data and help scientists to gain a better understanding of its variations on small scales.
PrecipitationRain and snow vary significantly over distances less than 10 km. In order to understand the local, regional, and global water cycles, we must know how much precipitation falls at many different locations around the world. Student observations using rain gauges and snow boards help provide improved sampling of rain and snow amounts and support improved understanding of weather and climate.In addition to measuring the amount of precipitation, GLOBE students measure the pH of rain and melted snow. Knowing the pH of precipitation that falls in a particular area is often essential to understanding the pH of the soil and water bodies in that area. Student pH measurements establish a local basis for tracking changes in the input of acidity to the
Individual MeasurementsCloud Cover and TypeClouds play an important role in Earth’s weather and climate. Clouds also obscure (block out) the ground when the Earth is viewed from space. Therefore, satellites cannot observe the ground when it is cloudy and that can affect many scientific investigations, such as surface temperature.
Contrail Cover and TypeWhen a jet aircraft passes through a portion of the atmosphere having just the right combination of moisture and temperature it will form a linear cloud. These are known as contrails, or condensation trails. In some areas, jet traffic is causing a noticeable increase in cloudiness, which may affect both weather and climate. As part of the GLOBE Cloud Protocols, students use their eyes to determine the percentage of the sky that contrail’s cover. They also count the contrails and categorize them into three types as given in the protocol. By quantifying the contrails present in the sky, students provide critical information needed to study how much of an affect these contrails are actually having on the weather that we experience.
Aerosol Optical ThicknessSmall airborne liquid and solid particles, called aerosols, in the atmosphere affect whether the sky looks blue or milky, clear or hazy. They also influence the amount of sunlight that reaches Earth’s surface. Using a sun photometer and a voltmeter to measure the intensity of sunlight reaching the surface, GLOBE students and scientists can determine aerosol amounts (aerosol optical thickness). Satellites infer this property of the atmosphere using remote sensing, while ground-based observations provide direct measurements to determine aerosol concentration. These two types of data complement one another, and student measurements can add greatly to the few ground-based professional monitoring stations currently collecting aerosol data.
Water VaporWater vapor in the atmosphere varies considerably in time and from place to place. These variations are related to both weather and climate. Clouds are formed from water vapor. Water vapor is the primary greenhouse
environment and can help scientists better map the fate of atmospheric chemicals.
TemperatureAir temperature varies throughout the day in response to direct solar heating and from day to day as weather systems move around the globe. Average air temperature also changes with the seasons. Scientists want to know both the extremes of temperature and the average temperature for time periods ranging from 24 hours to a month, a year, or longer. GLOBE students measure maximum and minimum temperatures for a 24-hour period beginning and ending within one hour of local solar noon. Scientists studying the climate of our planet are interested in finding out if the temperature at different places is changing, and if so, what patterns can be seen in these changes. Local temperature measurements, such as those taken by GLOBE students, aid scientists in answering these and other important questions regarding Earth’s climate. Human settlement combined with variations in elevation and distance from water bodies produce local variations in temperature and GLOBE schools provide valuable detail for understanding changes even if there are official weather stations nearby. There are a variety of options for measuring air temperature. The preferred method is to use a digital multi-day max/min thermometer as described in the Digital Multi-Day Max/Min/Current Air and Soil Temperatures Protocol. This thermometer logs six days of maximum and minimum temperature data and has a soil probe that allows you to also collect soil temperatures. A U-shaped liquid-filled or digital single-day max/min thermometer can also be used as described in the Max/Min/Current Air Temperature Protocol, and must be read and reset everyday in order to obtain a continuous temperature record. Additionally, automated devises that log data may be utilized as described in the Automated Soil and Air Temperature Monitoring Protocol and Automated Weather Station Protocols that are available in the electronic version of the Teacher’s Guide.
Surface TemperatureDescribed scientifically, surface temperature is the radiating temperature of the ground surface. Knowledge of surface temperatures
is key to studying the energy cycle – the transfer of heat in your surrounding environment. The transfer of heat between the different components of the environment occurs at their boundaries, and surface temperature measurements provide the temperatures at these boundaries. Therefore, measurements of surface temperature help to relate air, soil, and water temperatures and contribute critically to the study of the energy cycle. Students can take surface temperature readings using a hand-held Infrared Thermometer (IRT). Measurements of surface temperatures are essential for climate studies, comparison with satellite data and to improve the understanding of the global energy balance.
Surface OzoneOzone (O3) is a highly reactive gas present in the air around us. Knowing the amount of ozone in the air is important for understanding the chemistry of the atmosphere and its effect on the health of plants and animals, including us. Ozone concentrations are measured in units of parts per billion (ppb) and can vary over small spatial scales. Local measurements are required for scientists to track these local variations in ozone concentrations in the atmosphere. GLOBE scientists have developed a straightforward technique for students to measure ozone at their schools by exposing chemically treated strips to the air and measure their change in color with a hand-held reader. These student observations complement and extend the limited number of ozone monitoring stations currently in existence.
Where are measurements taken?Atmosphere measurements are taken at the Atmosphere Study Site. This site is usually located on school grounds and should be within easy walking distance of your classroom so that students can take data daily in a minimum of time. Generally, the more open the site the better. Significant obstructions should be avoided, including trees and buildings near the instruments.If your school does not have a suitable ground level location for safe, permanent installation of atmosphere instruments, use of roof sites and automated equipment can be considered. However, roof sites are not suitable for the
Surface Temperature Protocol! Consult the protocols in this chapter for more guidance.
When are measurements taken?The GLOBE atmosphere measurements should be taken on a daily basis, at specific times of day. See Figure AT-I-3. Taking daily measurements at the same time of day, allows easier comparison of measurements over the year and around the world. For GLOBE, many atmospheric observations should be made within one hour of local solar noon, and readings of daily total precipitation and maximum and minimum temperature are only acceptable if they are made within this 2-hour time period. Each of these measurements covers a roughly 24-hour period beginning within one hour of local solar noon on one day and continuing to within one hour of local solar noon on the next day. See Table AT-I-1.Cloud and contrail observations, relative humidity readings, surface temperature, and current temperature measurements are also taken within one hour of local solar noon, but these observations can be reported for other times of day as well. The digital multi-day max/min thermometer may be read at any time provided that it was reset within one hour of local solar noon.
Automated measurements are collected continuously at 15-minute intervals. This enables useful measurement of wind speed.Local solar noon is the key time for taking GLOBE atmosphere measurements. See the section on how to calculate solar noon. Does this mean that only classes that meet at that time can participate? No! Because these measurements do not require much time to take, students from classes that meet earlier or later in the day can be assigned to take measurements during their lunch break or during a mid-day recess.
Solar NoonSolar noon is the term used by GLOBE for the time when the sun appears to have reached its highest point in the sky during the day. An astronomer, for example, would refer to the same time as local apparent noon. Solar noon generally is not the same as noon on your clock. The time of local solar noon depends on your location within your time zone, the time of year, and whether or not daylight savings time is in effect. Solar noon does occur, however, half-way between sunrise and sunset when the sun crosses the horizon. It is the point during the day when shadows are the shortest.
Figure AT-I-3
The Range of Times of Day for Taking a Complete Setof Daily Atmosphere Observations
AerosolWater VaporPressureCurrent Temp.Clouds and ContrailsRelative HumiditySurface Temperature
SolarNoon
Mid-morning
Mid-afternoon
Max/Min/Current TemperaturePrecipitationClouds and ContrailsExpose Ozone StripWind DirectionRelative HumiditySurface Temperature
Ozone ReadingWind DirectionClouds and ContrailsCurrent TemperatureRelative HumiditySurface Temperature
An easy way to determine local solar noon is to find a newspaper from your town or one nearby that gives times of sunrise and sunset and to calculate the average of these times. First, convert both times to 24-hour clock times by adding 12 to any p.m. times, then add the two times and divide by two. This is the time of solar noon. See Table AT-I-2.
How many students should be involved?
Measurement Taken within one hour Other times measurements of local solar noon may be taken Cloud Cover and Type Yes Required in support of aerosols, water vapor, Contrail Cover and surface temperature, ozone, and water Type transparency measurements; additional times are acceptable
Aerosols Variable. Ideal time When the sun is at least 30˚ above the horizon Water Vapor varies with location or at local solar noon when the sun doesn’t and season reach 30˚ above the horizon; additional times are acceptable
Relative Humidity Yes for the Additional times are acceptable. Required in psychrometer; the support of aerosols, water vapor, and ozone. digital hygrometer reading may be reported up to one hour later at the same time as the ozone measurement
Precipitation Yes No
Current Temperature Yes Required for comparison with soil temperature measurements and in support of aerosols, water vapor, ozone, and relative humidity measurements; additional times are acceptable
Surface Temperature Not required Important for comparisons with soil and current temperature measurements
Maximum and Yes No Minimum Temperature
Barometric Pressure Not required Within one hour of aerosols and water vapor measurements if they are taken; otherwise as convenient
Ozone The observation is Other one-hour periods are acceptable started at this time in addition to the near-noon measurement and completed one hour later
Table AT-I-1
A single student can take any of the atmosphere measurements. However, it is a good idea to have a small group of students take readings so they can check each other. It also helps to have a partner to write down readings as they are made. Aerosols and water vapor measurements are difficult for one person to take alone. GLOBE recommends teams of 3 students as ideal for taking most
GLOBE® 2014 Introduction - 9 Atmosphere
Protocols
Learning ActivitiesA
ppendixW
elcome
Introduction
Table AT-I-2
Example:Sunrise (am or 24-hour clock are the same)
Sunset
Sunset (24-hour clock)
Sunrise + Sunset
Equivalent (so that the number of hours is even)
Divide by 2
Local Solar Noon (roundedto the nearest minute
1
7:02 a.m. 6:58 a.m. 7:03 a.m. 6:32 a.m.
5:43 p.m. 5:46 p.m. 8:09 p.m. 5:03 p.m.
17:43 17:46 20:09 17:0324 hr 45 min 23 hr 104 min 27 hr 12 min 23 hr 35 min
12 hr 22.5 min 12 hr 22 min 13 hr 36 min 11 hr 47.5 min
12:23 p.m. 12:22 p.m.1:36 p.m. or 13:36 11:48 a.m.
(unchanged) 24 hr 44 min 26 hr 72 min 22 hr 95 min
2 3 4
Note that this is an example of doing arithmetic in base 60.
sky is covered by clouds. As your students get used to these observations, they will begin to recognize the more subtle distinctions in cloud types.
How long does it take to do the measurements?The amount of time required to take the atmosphere measurements wi l l vary depending on the location of your Atmosphere Study Site(s), how many students are on the team taking the data, student age and familiarity with the measurements, and the actual conditions encountered on a given day. See Table AT-I-3.
Getting Started You and your students can investigate the atmosphere at your own study site and cooperate with scientists and other students to monitor the global environment. The atmosphere is one critical component of the global environment, and you can help compile a global database of atmospheric measurements that will aid in the long-term understanding of how the atmosphere is changing.Keep a permanent record of your GLOBE data at your school. The atmospheric data that students gather should not only be submitted to the GLOBE data server, but should also be recorded permanently in the GLOBE Data Log for the school. A notebook of the Data Sheets filled in by the students can serve
measurements. Many observations can either be taken by the group as a whole, or can be taken individually and then compared. If the readings are taken individually, the group must remember to empty the rain gauge and reset the thermometer only when all students are finished. Ideally, pH measurements are taken by three different groups of students using three different samples of rain or melted snow. In all cases, taking three measurements is expected. These three results are averaged and compared as part of data quality control. Rotating groups through the class (or classes) on a periodic basis will give all students an opportunity to participate. Having multiple groups take precipitation or maximum and minimum temperature measurements at different times on the same day is discouraged because it opens the door to confusion in emptying the rain gauge, resetting the 1-day maximum/minimum thermometer, and reporting the data. The estimates of cloud type, cloud cover, contrail type, and contrail cover are subjective measurements, so the more students involved in this task, the better. Each student should take his or her own readings; then, students should come to an agreement as a group. Do not be surprised if your students initially have difficulty with these estimates. Even seasoned weather observers debate which type of cloud they are seeing, or exactly how much of the
GLOBE® 2014 Introduction - 10 Atmosphere
this purpose. See the Implementation Guide chapter for a description of the Data Log and its importance. Students should take pride in the fact that they are contributing to a long-term atmospheric data set at their school.As your local data set grows, you should engage students in looking at their data. Each protocol of this chapter includes a Looking At the Data section, which outlines how to judge whether the data are reasonable and describes what scientists look for in data of this type. Most of them also contain a sample student investigation using data from the protocol. Review these sections for ideas on how to use GLOBE data for student learning about weather.You and your students can approach the study of the atmosphere in many different ways, but three major themes that can be studied using the measurements you take in GLOBE are: weather, climate, and atmospheric composition. The sections below describe how the GLOBE Atmosphere Protocols contribute to an understanding of each of these areas that may be part of your curriculum.
WeatherPerhaps your students study weather. If so, their GLOBE work can become an integral part of this learning. By “weather” we mean the current condition and short-term changes in the atmosphere. Students may be familiar with weather reports and forecasts, and you could introduce the GLOBE protocols by asking them to explain what they think “weather” means. They will probably mention things like the temperature, whether it’s raining or snowing, whether it’s cloudy, whether it’s windy and the direction of the wind. Some students may also mention barometric pressure, cloud types, and humidity. All of these are aspects of what meteorologists mean by “weather,” and all can be measured in GLOBE. Thus, by doing GLOBE measurements, your students can begin to measure, monitor, study, track and forecast the weather.
Table AT-I-3 Measurement Approximate Time required (in minutes)
Cloud and contrail cover and type 10
Aerosols including 15 - 30 supporting measurements
Water Vapor including 15 - 30 supporting measurements
Aerosols and water vapor 20 - 40 combined including supporting measurements
Relative Humidity 5 - 10
Precipitation 5 - 10
Precipitation pH using meter including calibration 10
Handling of snow samples in the classroom 5 for snow or snow pack water equivalent
Snow water equivalent 5 once the snow has melted
1-day maximum, minimum, 5 and current temperature
Multi-day max/min/current 5 - 10 air and soil temperature
Surface temperature including 10 - 20 supporting measurements
Ozone deploying the strip 10 and taking supporting measurements
Ozone reading the strip and taking supporting 10 - 15 measurements
Entire set of local solar noon measurements: clouds and contrails, relative humidity, 15 - 25 precipitation amount and pH, max/min/current temperature, surface temperature, and deploying the ozone strip*
*Taking aerosols or water vapor with this set should only add 5-10 minutes each.
GLOBE® 2014 Introduction - 11 Atmosphere
Protocols
Learning ActivitiesA
ppendixW
elcome
Introduction
Here is a suggested sequence for introducing GLOBE measurements through the study of weather.
1. Cloud and contrail measurements are the easiest place to start. They require only a cloud chart and the human eye. Two learning activities are good to do before beginning the actual cloud cover and cloud type protocols:
•Observing, Describing, and Identifying Clouds
• Estimating Cloud Cover: A Simulation
2. In order to submit your cloud cover and cloud type observations, you need to define an Atmosphere Study Site and submit site definition data to GLOBE. You may want do this before you set up the instrument shelter, so that if you experience delays in getting your shelter set up, you can still define your site and submit your cloud data.
3. You also can begin taking aerosols, water vapor, relative humidity, surface temperature, and barometric pressure readings without having the instrument shelter.
4. Current temperature measurements can also be taken without the instrument shelter. When you are able to install the instrument shelter you will be able to take and submit daily maximum and minimum air temperature measurements.
5. Taking and submitting liquid precipitation measurements requires the installation of a rain gauge on a post, but you can measure snow depth, liquid equivalent, and pH without the installation of the rain gauge.
6. If you use certain automated weather stations, you can add wind speed and direction to your set of GLOBE data following these protocols.
7. You must check the calibrations of your instruments (thermometers, barometer or altimeter, sling psychrometer) before you begin.
Try your hand at forecasting. One interesting way for students to use the data they collect is to try to make weather forecasts using their own data and to compare their forecasts to
those of professional meteorologists. Who is more accurate? What data are most helpful in making a prediction? What additional data do the professionals use that are not available to students? There are many interesting questions that can be pursued.
Climate Climate is another major topic that your students may study and that can be explored using GLOBE measurements and data. “Climate” is the long-term trend of the atmosphere and other variable aspects of the environment. There is an old saying, “Climate is what you expect. Weather is what you get.” Climate refers to averages and extremes of temperature, clouds, precipitation, relative humidity and their annual patterns.Through looking at GLOBE data from their own school and from other sites around the world, students can begin to gain an appreciation for climate patterns and what causes them. They can notice seasonal trends, variations based on latitude, and variations based on proximity to large bodies of water. By using the GLOBE student data archive, students can compare the climate of their school, nearby schools, and schools in widely varying spots around the globe.Students can take it as a challenge to build a long-term database that describes the climate of their locality. Most newspapers publish monthly summaries of the weather and compare them to climatic expectations. If not, then consult the meteorologist at your local airport or radio/TV station. These climatologies can provide the basis for interesting discussions of what is “normal” for your locale. Has it been a wetter than normal month? Hotter? Cooler? Cloudier? Using their GLOBE data and local climatic information, students can begin to answer these questions and think about how their climate may be changing.To study climate your students will use the same atmosphere protocols as for weather, except they need not measure or look up barometric pressure. Routine measurements of daily amounts of precipitation and maximum and minimum air temperatures are critical for climate study. Measurements of soil temperature and moisture and of phenology are also important in studying climate. The
temperature of water bodies and when they are dry or frozen are also useful. Students can think about and debate which of the GLOBE measurements are most important for describing the climate. In order to study climate using GLOBE measurements, you will want your students to access data from other schools using the GLOBE Web site. GLOBE provides graphing tools online and the ability to download a school’s data as a table that can be imported into other data analysis programs such as a spreadsheet.
Atmospheric CompositionPerhaps your students study the composition of the atmosphere. They can use three of the GLOBE Atmosphere Protocols – Aerosols, Water Vapor and Surface Ozone – to enhance their study. These can also be considered aspects of the weather and climate. Aerosols and water vapor affect visibility and the passage of sunlight and heat through the atmosphere while ozone levels have short and long term effects on plant and animal life and long term effects on all materials exposed to the atmosphere.These protocols can be carried out without the installation of any permanent equipment, so even if you cannot install an instrument shelter and a rain gauge, you can still do these three measurements. However, for the Surface Ozone Protocol you will need to measure cloud and contrail cover and type, wind direction, and current temperature (using the alternative protocol that does not require the instrument shelter). For the Aerosols and Water Vapor Protocols you will need to record cloud and contrail cover and type, relative humidity, and current temperature, and may measure barometric pressure or obtain values from other sources or from GLOBE.
Getting ReadyTo prepare yourself to lead students through an atmosphere investigation using GLOBE, read the introductory sections of the Atmosphere chapter of the GLOBE Teacher’s Guide. Familiarize yourself with the scientific background information provided. Then take a look at the sections What Measurements are Taken. Decide which theme or set of
questions your students should pursue and which measurements are appropriate for their study. Think about how to introduce GLOBE to your students as an opportunity for them to participate with scientists and other students in monitoring the global environment, and think about what projects and analyses your students can accomplish as they approach the atmosphere through the lens of weather, climate, or atmospheric composition. If age appropriate, copy and distribute to students the section of the chapter entitled Why Investigate the Atmosphere in order to give them an understanding of why each measurement is scientifically important. Discuss the importance of both a global and a detailed local database to understand the environment and how they can contribute to this by submitting consistent accurate data to GLOBE. Engage the students in asking questions they can answer through taking and looking at data.Review the specific protocols and plan which measurements your students will take. Feel free to start with an easily sustained level of effort that supports your educational objectives and then expand.Obtain the instruments you will need and calibrate them if necessary. Set up your instrument shelter and rain gauge if you will be measuring maximum and minimum temperature and liquid precipitation. Make photocopies of all the Data Sheets and field guides that students will need.Prepare a notebook to serve as your school’s Data Book.Then, begin doing the GLOBE Atmosphere Investigation!
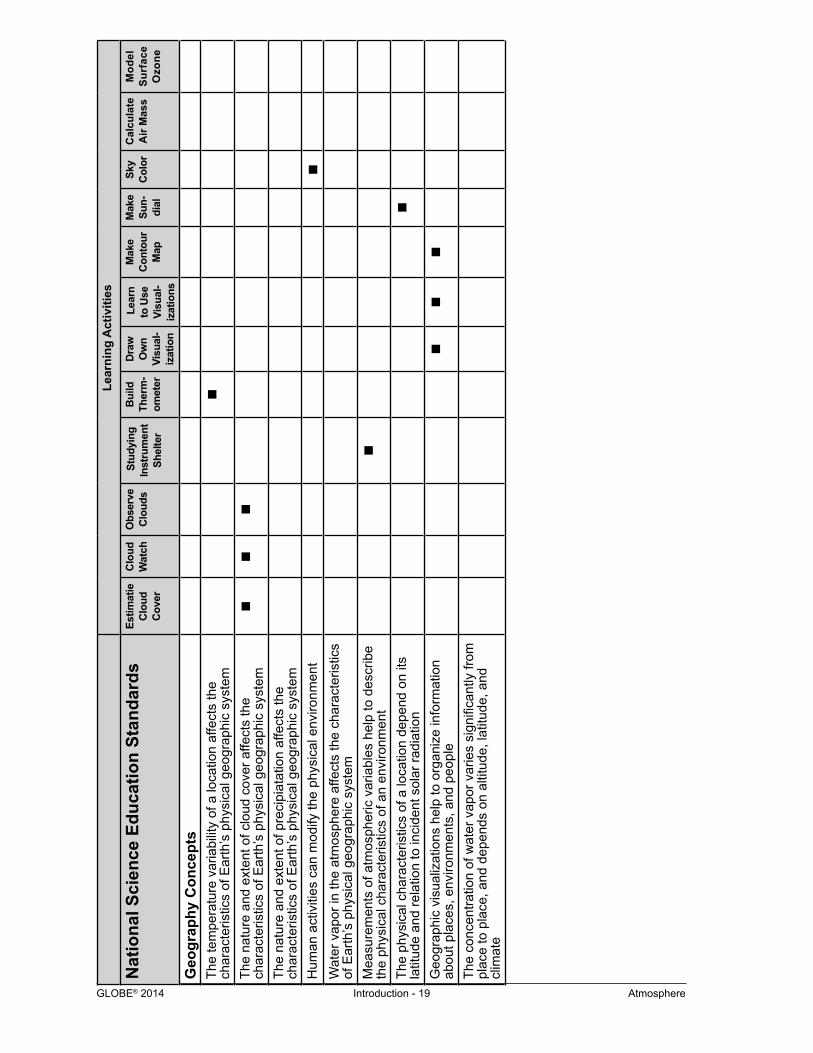
Educational ObjectivesStudents participating in the activities presented in this chapter should gain scientific inquiry abilities and understanding of a number of scientific concepts. These abilities include the use of a variety of specific instruments and techniques to take measurements and analyze the resulting data along with general approaches to inquiry. The Scientific Inquiry Abilities listed in the grey box are based on the assumption that the teacher has completed the protocol including the Looking At the Data section. If this section is not used, not all of the Inquiry Abilities will be covered. The Science Concepts included are outlined in the United States National Science Education Standards as recommended by the US National Research Council and include those for Earth and Space Science and Physical Science. The Geography Concepts are taken from the National Geography Standards prepared by the National Education Standards Project. Additional Enrichment Concepts specific to the atmosphere measurements have been included as well. The gray box at the beginning of each protocol or learning activity gives the key scientific concepts and scientific inquiry abilities covered. The following tables provide a summary indicating which concepts and abilities are covered in which protocols or learning activities.