118
AT271_SL3G_E0 Atoll 2.7.1 1 THE UMTS HSPA MODULE
| Date post: | 26-Oct-2014 |
| Category: |
Documents |
| Upload: | denis-antonio-sequeira |
| View: | 142 times |
| Download: | 4 times |
AT271_SL3G_E0
Atoll 2.7.1
1
THE UMTS HSPA MODULE
AT271_SL3G_E0
Atoll 2.7.1
2
1. UMTS, HSDPA and HSUPA Concepts
2. 3G Workflow in Atoll
3. Modelling a UMTS HSPA Network
4. UMTS, HSDPA and HSUPA Predictions
5. Monte-Carlo Based Simulation
6. Neighbour Allocation
7. Scrambling Codes Planning
8. GSM/TDMA – UMTS Co-planning
9. Using Drive Tests
1. UMTS, HSDPA and HSUPA Concepts
2. 3G Workflow in Atoll
3. Modelling a UMTS HSPA Network
4. UMTS, HSDPA and HSUPA Predictions
5. Monte-Carlo Based Simulation
6. Neighbour Allocation
7. Scrambling Codes Planning
8. GSM/TDMA – UMTS Co-planning
9. Using Drive Tests
TRAINING PROGRAM
AT271_SL3G_E0
Atoll 2.7.1
3
1. UMTS, HSDPA AND HSUPA CONCEPTS
UMTS CONCEPTS
HSDPA CONCEPTS
HSUPA CONCEPTS
1.
UM
TS
, H
SD
PA
AN
D H
SU
PA
CO
NC
EP
TS
AT271_SL3G_E0
Atoll 2.7.1
4
UMTS CONCEPTS (1)
THE UMTS PLANNING CHALLENGE
Multiservice + multi-rate + high-rate
Wideband
Code division multiple access technique– All terminals share the same frequency
Mutual degradation of radio links defeated by sophisticated power control
Coverage linked to traffic & services– Cell breathing
REALISTIC UMTS PLANNING REQUIRES SIMULATION OF TRAFFIC AND POWER CONTROL!
1.
UM
TS
, H
SD
PA
AN
D H
SU
PA
CO
NC
EP
TS
AT271_SL3G_E0
Atoll 2.7.1
5
UMTS CONCEPTS (2)
CPICH - COMMON PILOT CHANNEL
CPICH power equivalent to BCCH carrier power in gsm
Always on air
Approx. 5%..20% of the total carrier power – 1..4 watts of 20W (30..36dBm of 43dBm)
Pilot quality
– Ec/Io parameter
Ec: Energy per chip (pilot signal)
Io: Downlink total noise spectral density
– Measured by mobile to find its best server and active set1.
UM
TS
, H
SD
PA
AN
D H
SU
PA
CO
NC
EP
TS
AT271_SL3G_E0
Atoll 2.7.1
6
UMTS CONCEPTS (3)
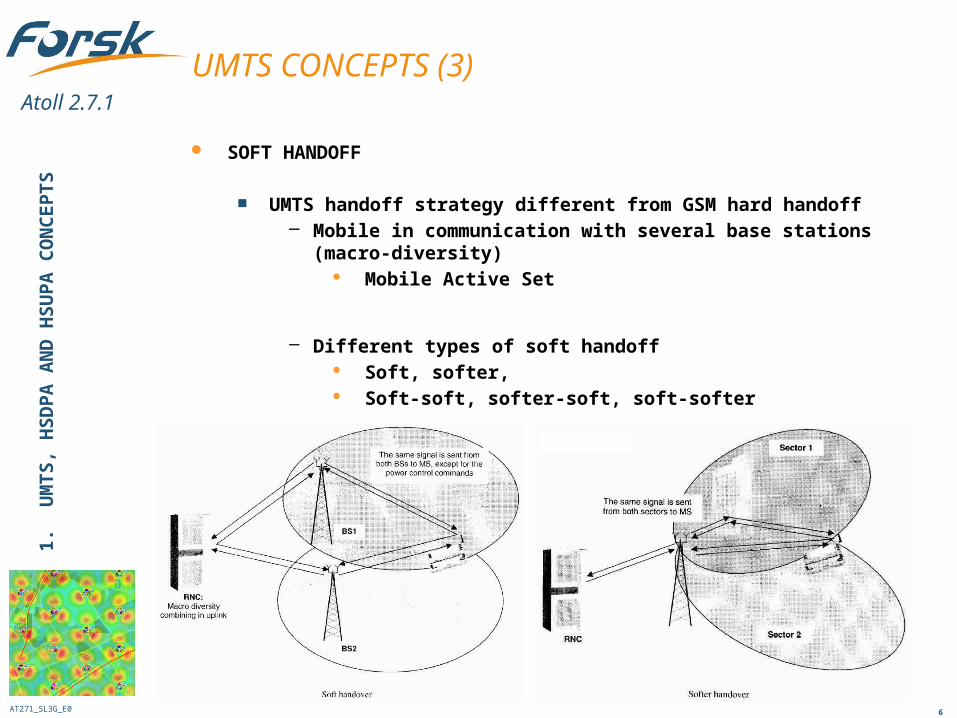
SOFT HANDOFF
UMTS handoff strategy different from GSM hard handoff– Mobile in communication with several base stations (macro-
diversity) Mobile Active Set
– Different types of soft handoff Soft, softer, Soft-soft, softer-soft, soft-softer
1.
UM
TS
, H
SD
PA
AN
D H
SU
PA
CO
NC
EP
TS
AT271_SL3G_E0
Atoll 2.7.1
7
UMTS CONCEPTS (4)
ACTIVE SET
Set of transmitters connected to mobile
Active set determination
– Best pilot (server) Minimum Ec/Io : Pilot quality threshold Highest Ec/Io
– Admission of other transmitters in Active Set Handover margin : Active Set threshold Ec/Io within a margin of best server
1.
UM
TS
, H
SD
PA
AN
D H
SU
PA
CO
NC
EP
TS
AT271_SL3G_E0
Atoll 2.7.1
8
UMTS CONCEPTS (5)
WCDMA RECEPTION PARAMETER
"Energy per bit" is the generic radio reception requirement
Eb / Nt = ( C / R ) / ( I / W )
Eb :Energy of one bit ( Ws/ kb that is to say J / kb)
Nt : Total noise density ( W / MHz )
R : Nominal rate of the service (kbps)
W : spreading width (MHz)
C : Carrier power (W)
I : Power of interfering carriers + thermal noise (W)
Eb / Nt = ( C / I ) . ( W / R )
C / I : Interference ratio used in GSM/TDMA planning (W / W)
W / R : Processing gain
1.
UM
TS
, H
SD
PA
AN
D H
SU
PA
CO
NC
EP
TS
AT271_SL3G_E0
Atoll 2.7.1
9
UMTS CONCEPTS (6)
POWER CONTROL
Power control on traffic channel
Objectives– Solve near-far-problem of CDMA in the uplink – Limit overall interference to maximize capacity– Ensure good reception for a maximum number of mobiles – Power control yields a network-wide compromise!
Means– Mobile power adjustment for uplink– Base station power adjustment for downlink– UMTS power control is fast!
Main results– Transmitter load conditions
DL Power used UL Load factor = Interference / Total noise
1.
UM
TS
, H
SD
PA
AN
D H
SU
PA
CO
NC
EP
TS
AT271_SL3G_E0
Atoll 2.7.1
10
HSDPA CONCEPTS (1)
HSDPA (High Speed Downlink Packet Access) IS A 3GPP RELEASE 5 FEATURE FOR UMTS
Designed for data service applications Aimed to provide, for the downlink, significant reduced delays and peak
rates up to 8-10 Mbps Fully Release 99 backward compatible Can co-exist on the same RF carrier with R99 UMTS traffic
TECHNICAL ASPECTS
New physical channels (modelled in Atoll) Fast link adaptation (modelled in Atoll) Fast retransmission mechanism Fast scheduling at Node B (modelled in Atoll)1.
U
MT
S,
HS
DP
A A
ND
HS
UP
A C
ON
CE
PT
S
AT271_SL3G_E0
Atoll 2.7.1
11
HSDPA CONCEPTS (2)
NEW TRANSPORT AND PHYSICAL CHANNELS ON THE DOWNLINK
HS-DSCH (High Speed Downlink Shared Channel): Transport channel– HS-PDSCH (High Speed Physical Downlink Shared Channel):
Associated physical channel– Carries user data– Both time and codes shared between users– Within each 2 ms transmission time interval (TTI), a constant
spreading factor of 16 is used with a maximum of 15 parallel codes 2 to 4 users can share the code resources with the same TTI
– Always associated to a R99 DCH (Dedicated Channel)
HS-SCCH (High Speed Shared Control Channel)– Carries information to decode HS-DSCH (Modulation, Transport block
size,…)– Spreading factor = 128
1.
UM
TS
, H
SD
PA
AN
D H
SU
PA
CO
NC
EP
TS
AT271_SL3G_E0
Atoll 2.7.1
12
HSDPA CONCEPTS (3)
NEW PHYSICAL CHANNEL ON THE UPLINK
HS-DPCCH (High Speed Dedicated Physical Control Channel)– Indicates the Channel Quality Indicator (CQI) used for fast link
adaptation– Carries the acknowledgement signal for retransmission process– Spreading factor = 256
FAST LINK ADAPTATION INSTEAD OF POWER CONTROL
The HS-DSCH is transmitted at constant power over a TTI Adaptive DL data rate by changing:
– The modulation scheme– The coding– The number of codes
Based on:– The reported CQI– UE (User Equipment) category
1.
UM
TS
, H
SD
PA
AN
D H
SU
PA
CO
NC
EP
TS
AT271_SL3G_E0
Atoll 2.7.1
13
HSDPA CONCEPTS (4)
FAST SCHEDULING AT NODE B
The scheduler chooses the data that will be transmitted in the next TTI– It sorts the users to be served
Different scheduling techniques– Max CQI: resource is allocated to the UE with the best radio
propagation conditions– Round Robin: every user is served in a sequential way– Proportional fair: resource is allocated to the UE with the highest
instantaneous relative channel quality
NO SOFT HANDOVER ON DL
The mobile has only one link from its best-server1.
UM
TS
, H
SD
PA
AN
D H
SU
PA
CO
NC
EP
TS
AT271_SL3G_E0
Atoll 2.7.1
14
HSDPA CONCEPTS (5)
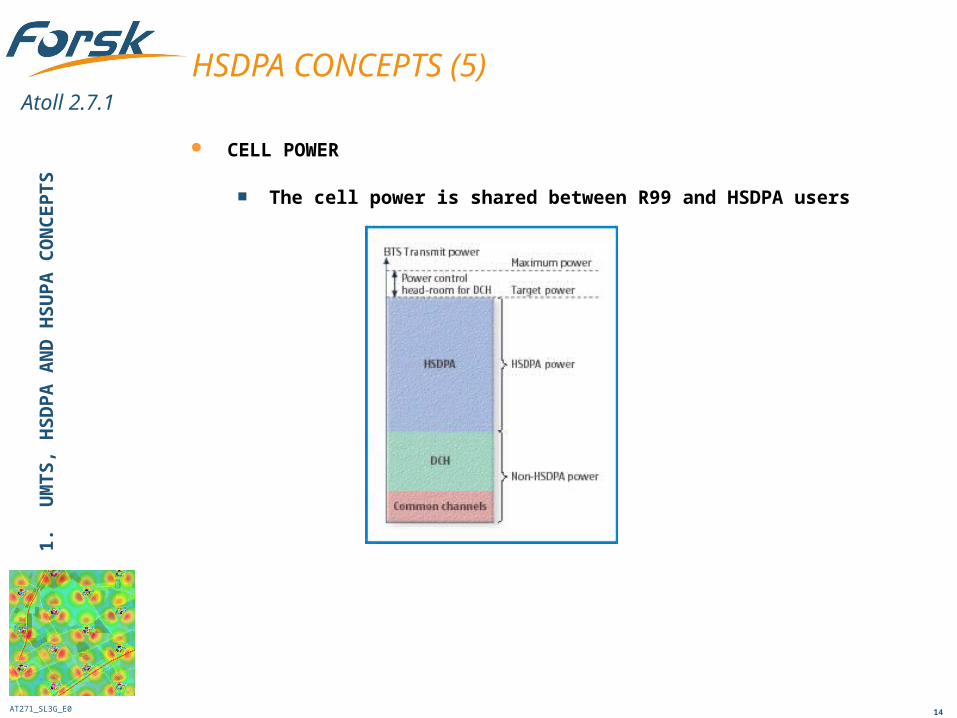
CELL POWER
The cell power is shared between R99 and HSDPA users
Two strategies possible for the HSDPA power allocation:– Static allocation the HSDPA power is a fixed part of the cell
power– Dynamic allocation the HSDPA power is the remaining cell
power after serving R99 users
1.
UM
TS
, H
SD
PA
AN
D H
SU
PA
CO
NC
EP
TS
AT271_SL3G_E0
Atoll 2.7.1
15
HSUPA CONCEPTS (1)
HSUPA (High Speed Uplink Packet Access) IS A 3GPP RELEASE 6 FEATURE FOR UMTS
Designed for data service applications Aimed to provide, for the uplink, peak rates up to 3- 4 Mbps Fully Release 99 backward compatible Can co-exist on the same RF carrier with R99 UMTS traffic
TECHNICAL ASPECTS
New transport and physical channels (modelled in Atoll) Fast retransmission mechanism (modelled in Atoll) Fast scheduling at Node B (modelled in Atoll)
1.
UM
TS
, H
SD
PA
AN
D H
SU
PA
CO
NC
EP
TS
AT271_SL3G_E0
Atoll 2.7.1
16
HSUPA CONCEPTS (2)
NEW TRANSPORT AND PHYSICAL CHANNELS ON THE UPLINK
E-DCH (Enhanced Dedicated Channel): Transport channel– E-DPDCH (Enhanced Dedicated Physical Data Channel): Associated
physical channel– Carries user data– Dedicated channel: each UE has its own dedicated E-DCH– Always associated to a R99 DCH (Dedicated Channel)– Supports OVSF: SF2 - SF256
E-DPCCH (Enhanced Dedicated Physical Control Channel)– Transmits all the necessary information about the E-DPDCH in order to
decode the data channel transmission– Also carries “Happy bit” information to indicate if the user is content
with the current data rate– Spreading factor = 256
1.
UM
TS
, H
SD
PA
AN
D H
SU
PA
CO
NC
EP
TS
AT271_SL3G_E0
Atoll 2.7.1
17
HSUPA CONCEPTS (3)
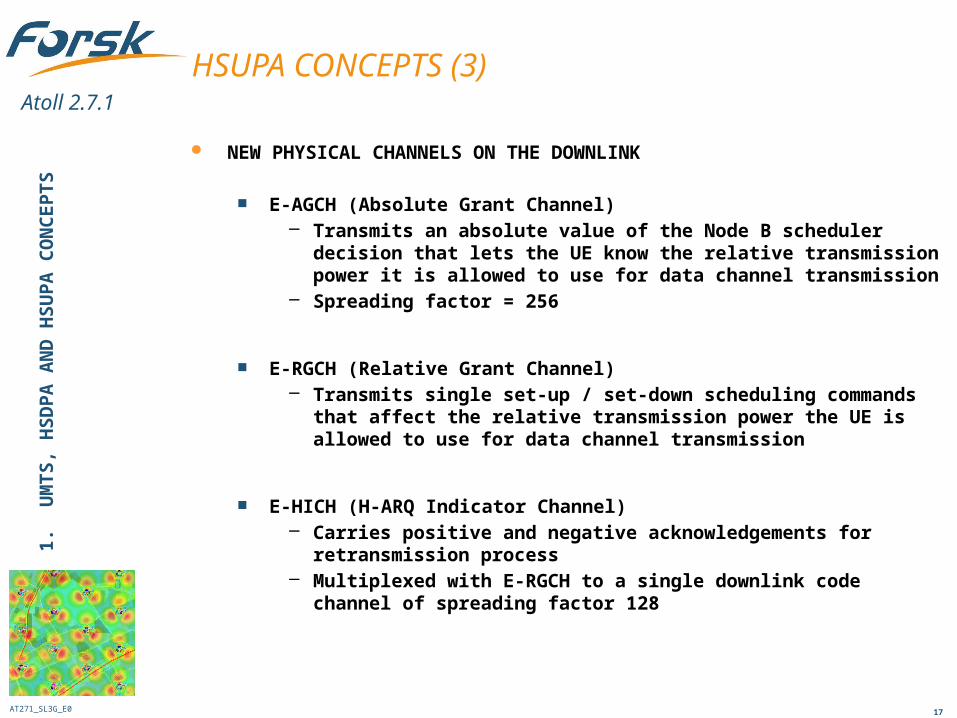
NEW PHYSICAL CHANNELS ON THE DOWNLINK
E-AGCH (Absolute Grant Channel)– Transmits an absolute value of the Node B scheduler decision that lets
the UE know the relative transmission power it is allowed to use for data channel transmission
– Spreading factor = 256
E-RGCH (Relative Grant Channel)– Transmits single set-up / set-down scheduling commands that affect
the relative transmission power the UE is allowed to use for data channel transmission
E-HICH (H-ARQ Indicator Channel)– Carries positive and negative acknowledgements for retransmission
process– Multiplexed with E-RGCH to a single downlink code channel of
spreading factor 128
1.
UM
TS
, H
SD
PA
AN
D H
SU
PA
CO
NC
EP
TS
AT271_SL3G_E0
Atoll 2.7.1
18
HSUPA CONCEPTS (4)
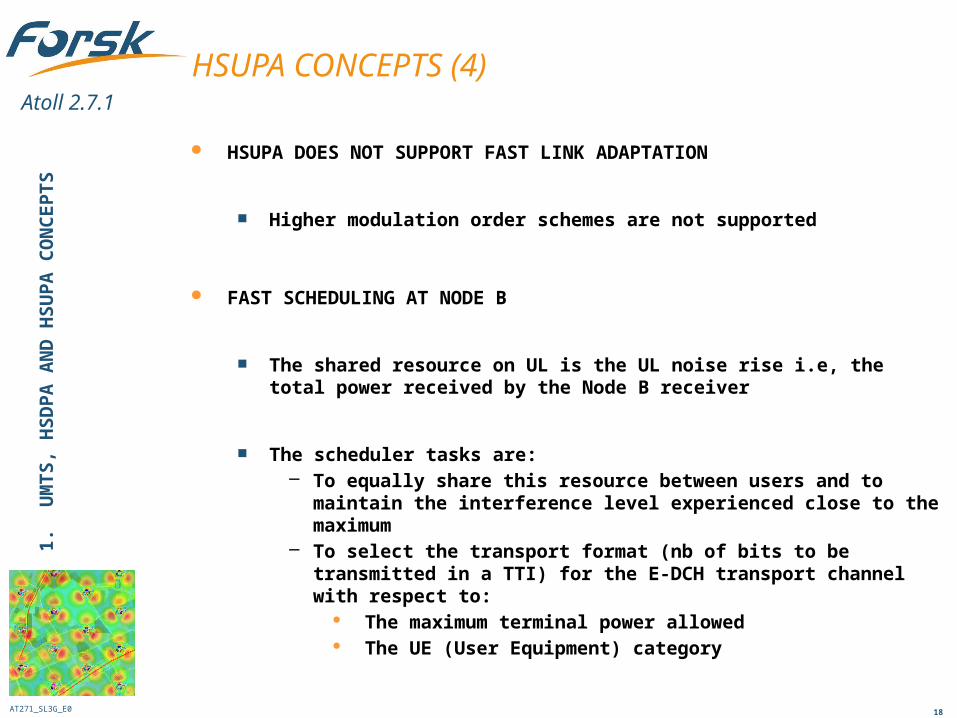
HSUPA DOES NOT SUPPORT FAST LINK ADAPTATION
Higher modulation order schemes are not supported
FAST SCHEDULING AT NODE B
The shared resource on UL is the UL noise rise i.e, the total power received by the Node B receiver
The scheduler tasks are:– To equally share this resource between users and to maintain the
interference level experienced close to the maximum– To select the transport format (nb of bits to be transmitted in a TTI) for
the E-DCH transport channel with respect to: The maximum terminal power allowed The UE (User Equipment) category
SOFT HANDOVER IS SUPPORTED
1.
UM
TS
, H
SD
PA
AN
D H
SU
PA
CO
NC
EP
TS
AT271_SL3G_E0
Atoll 2.7.1
19
DCH, HS-DSCH AND E-DCH COMPARISON
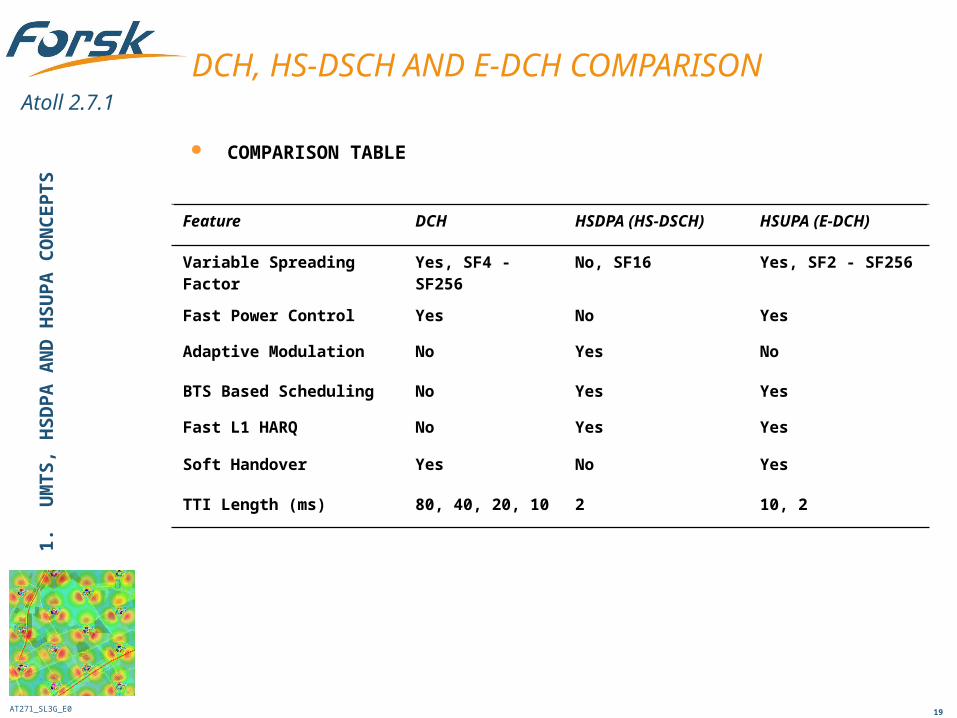
COMPARISON TABLE
1.
UM
TS
, H
SD
PA
AN
D H
SU
PA
CO
NC
EP
TS
Feature DCH HSDPA (HS-DSCH) HSUPA (E-DCH)
Variable Spreading Factor Yes, SF4 - SF256 No, SF16 Yes, SF2 - SF256
Fast Power Control Yes No Yes
Adaptive Modulation No Yes No
BTS Based Scheduling No Yes Yes
Fast L1 HARQ No Yes Yes
Soft Handover Yes No Yes
TTI Length (ms) 80, 40, 20, 10 2 10, 2
AT271_SL3G_E0
Atoll 2.7.1
20
1. UMTS, HSDPA and HSUPA Concepts
2. 3G Workflow in Atoll
3. Modelling a UMTS HSPA Network
4. UMTS, HSDPA and HSUPA Predictions
5. Monte-Carlo Based Simulation
6. Neighbour Allocation
7. Scrambling Codes Planning
8. GSM/TDMA – UMTS Co-planning
9. Using Drive Tests
1. UMTS, HSDPA and HSUPA Concepts
2. 3G Workflow in Atoll
3. Modelling a UMTS HSPA Network
4. UMTS, HSDPA and HSUPA Predictions
5. Monte-Carlo Based Simulation
6. Neighbour Allocation
7. Scrambling Codes Planning
8. GSM/TDMA – UMTS Co-planning
9. Using Drive Tests
TRAINING PROGRAM
AT271_SL3G_E0
Atoll 2.7.1
21
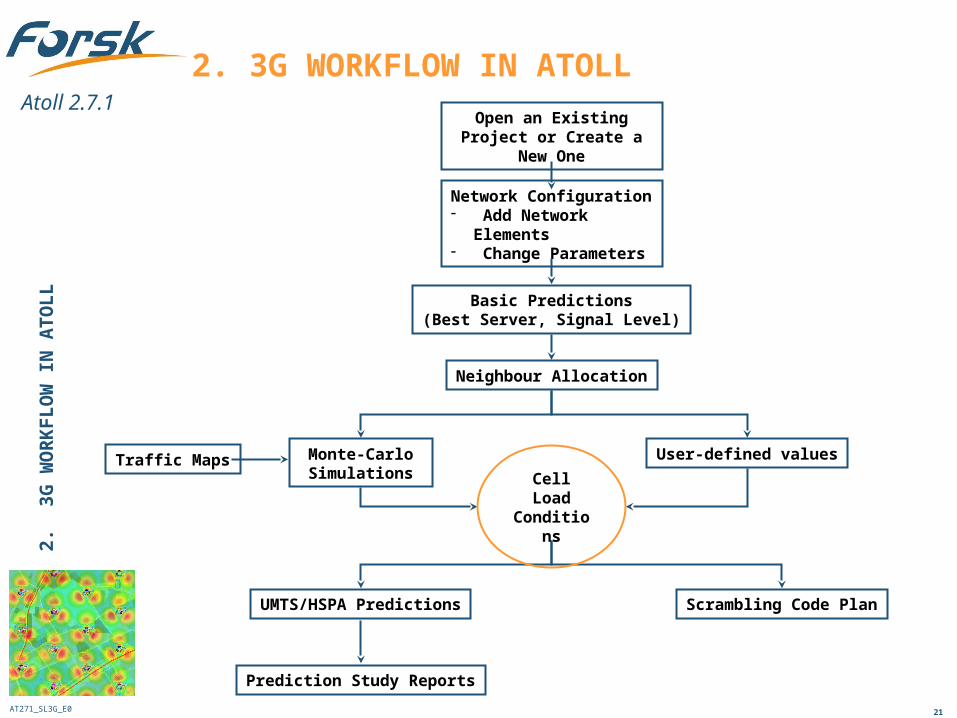
2. 3G WORKFLOW IN ATOLL2.
3G
WO
RK
FL
OW
IN
AT
OL
L
Traffic Maps
Open an Existing Project or Create a New One
Network Configuration- Add Network Elements- Change Parameters
User-defined values
Scrambling Code Plan
Prediction Study Reports
Basic Predictions(Best Server, Signal Level)
Monte-Carlo Simulations
UMTS/HSPA Predictions
Cell Load Conditions
Neighbour Allocation
AT271_SL3G_E0
Atoll 2.7.1
22
1. UMTS, HSDPA and HSUPA Concepts
2. 3G Workflow in Atoll
3. Modelling a UMTS HSPA Network
4. UMTS, HSDPA and HSUPA Predictions
5. Monte-Carlo Based Simulation
6. Neighbour Allocation
7. Scrambling Codes Planning
8. GSM/TDMA – UMTS Co-planning
9. Using Drive Tests
1. UMTS, HSDPA and HSUPA Concepts
2. 3G Workflow in Atoll
3. Modelling a UMTS HSPA Network
4. UMTS, HSDPA and HSUPA Predictions
5. Monte-Carlo Based Simulation
6. Neighbour Allocation
7. Scrambling Codes Planning
8. GSM/TDMA – UMTS Co-planning
9. Using Drive Tests
TRAINING PROGRAM
AT271_SL3G_E0
Atoll 2.7.1
23
3. MODELLING A UMTS HSPA NETWORK
SITE PARAMETERS
TRANSMITTER PARAMETERS
CELL PARAMETERS
3.
MO
DE
LL
ING
A U
MT
S H
SP
A N
ET
WO
RK
AT271_SL3G_E0
Atoll 2.7.1
24
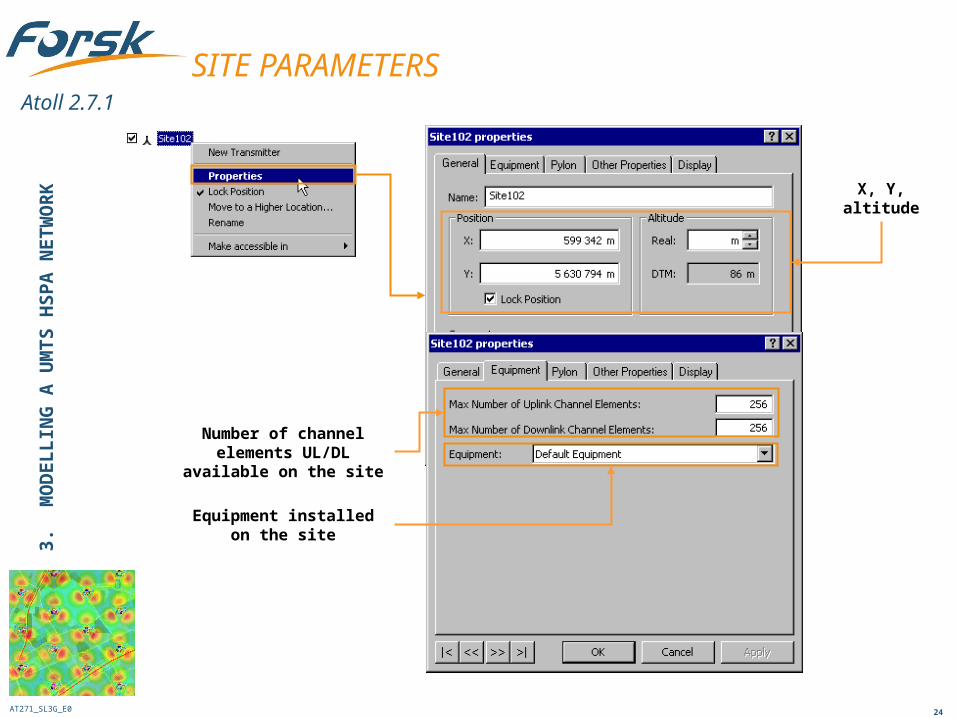
SITE PARAMETERS
X, Y, altitude
Number of channel elements UL/DL available
on the site
Equipment installed on the site
3.
MO
DE
LL
ING
A U
MT
S H
SP
A N
ET
WO
RK
AT271_SL3G_E0
Atoll 2.7.1
25
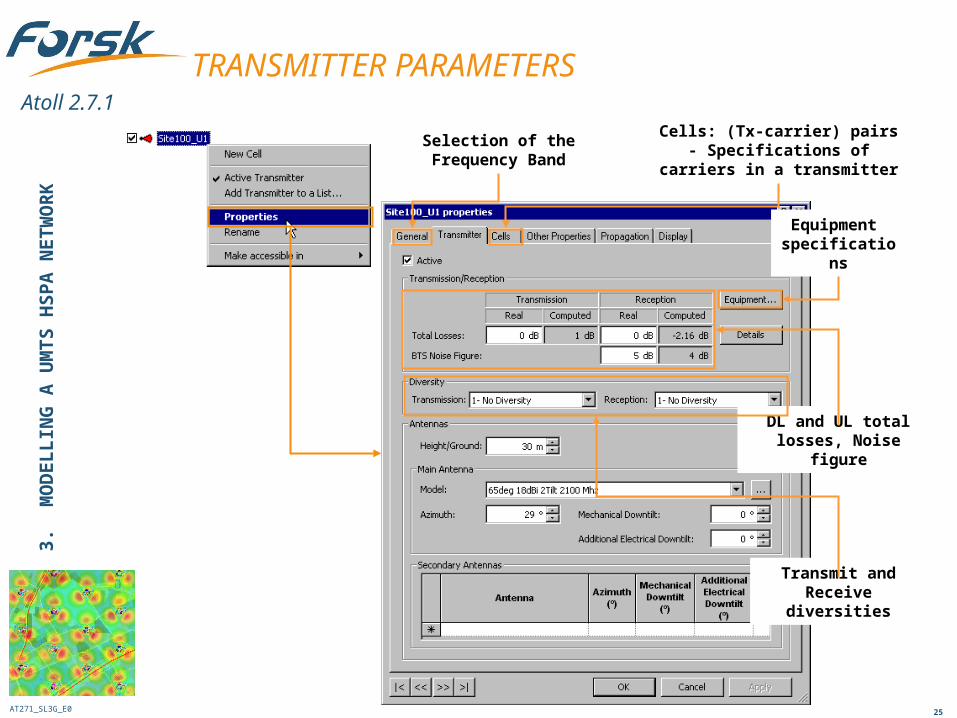
TRANSMITTER PARAMETERS
Equipment specifications
DL and UL total losses, Noise figure
Transmit and Receive diversities
Cells: (Tx-carrier) pairs- Specifications of carriers in a
transmitter
Selection of the Frequency Band
3.
MO
DE
LL
ING
A U
MT
S H
SP
A N
ET
WO
RK
AT271_SL3G_E0
Atoll 2.7.1
26
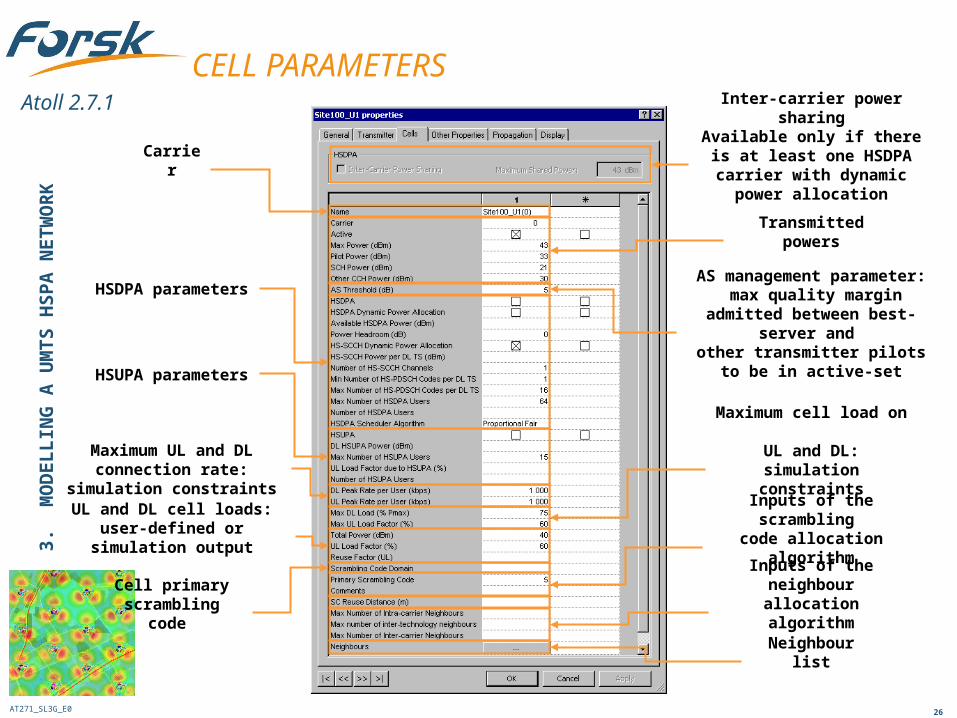
CELL PARAMETERS
Inputs of the scrambling code allocation algorithm
Maximum cell load on UL and DL: simulation
constraints
AS management parameter: max quality margin admitted
between best-server and other transmitter pilots to be in
active-set
Cell primary scrambling code
UL and DL cell loads: user-defined or simulation output
HSDPA parameters
Carrier
Transmitted powers
Inputs of the neighbour allocation algorithm
Neighbour list
Maximum UL and DL connection rate: simulation
constraints
HSUPA parameters
Inter-carrier power sharingAvailable only if there is at
least one HSDPA carrier with dynamic power allocation
3.
MO
DE
LL
ING
A U
MT
S H
SP
A N
ET
WO
RK
AT271_SL3G_E0
Atoll 2.7.1
27
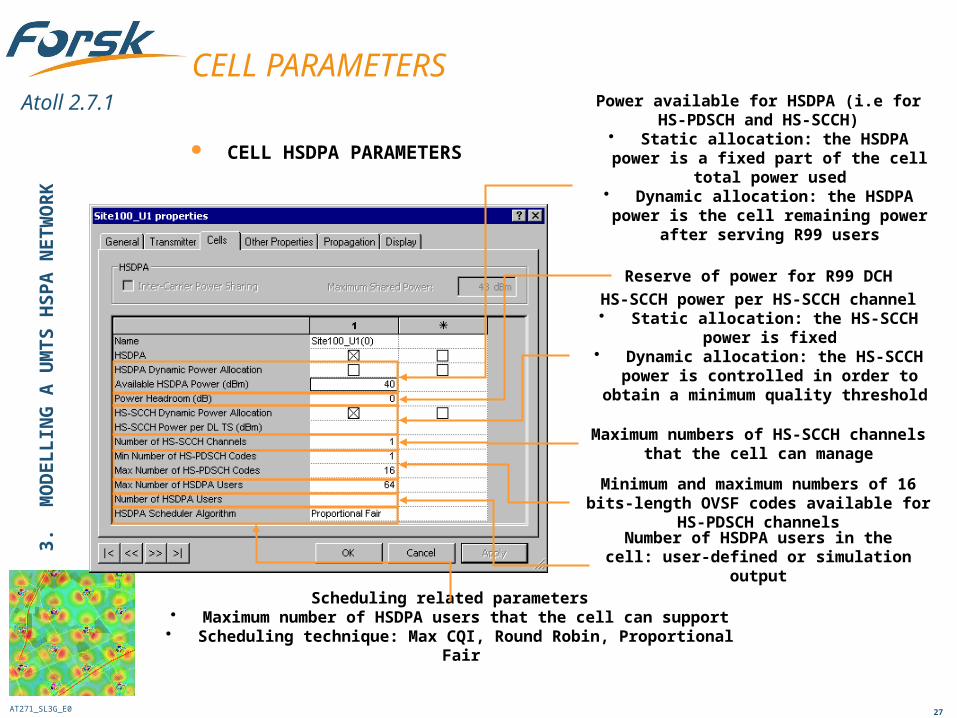
CELL HSDPA PARAMETERS
CELL PARAMETERS
Minimum and maximum numbers of 16 bits-length OVSF codes available for HS-PDSCH
channels
HS-SCCH power per HS-SCCH channel• Static allocation: the HS-SCCH power is
fixed• Dynamic allocation: the HS-SCCH power is
controlled in order to obtain a minimum quality threshold
Scheduling related parameters• Maximum number of HSDPA users that the cell can support
• Scheduling technique: Max CQI, Round Robin, Proportional Fair
Maximum numbers of HS-SCCH channels that the cell can manage
Power available for HSDPA (i.e for HS-PDSCH and HS-SCCH)
• Static allocation: the HSDPA power is a fixed part of the cell total power used
• Dynamic allocation: the HSDPA power is the cell remaining power after serving R99
users
Reserve of power for R99 DCH
Number of HSDPA users in the cell: user-defined or simulation output
3.
MO
DE
LL
ING
A U
MT
S H
SP
A N
ET
WO
RK
AT271_SL3G_E0
Atoll 2.7.1
28
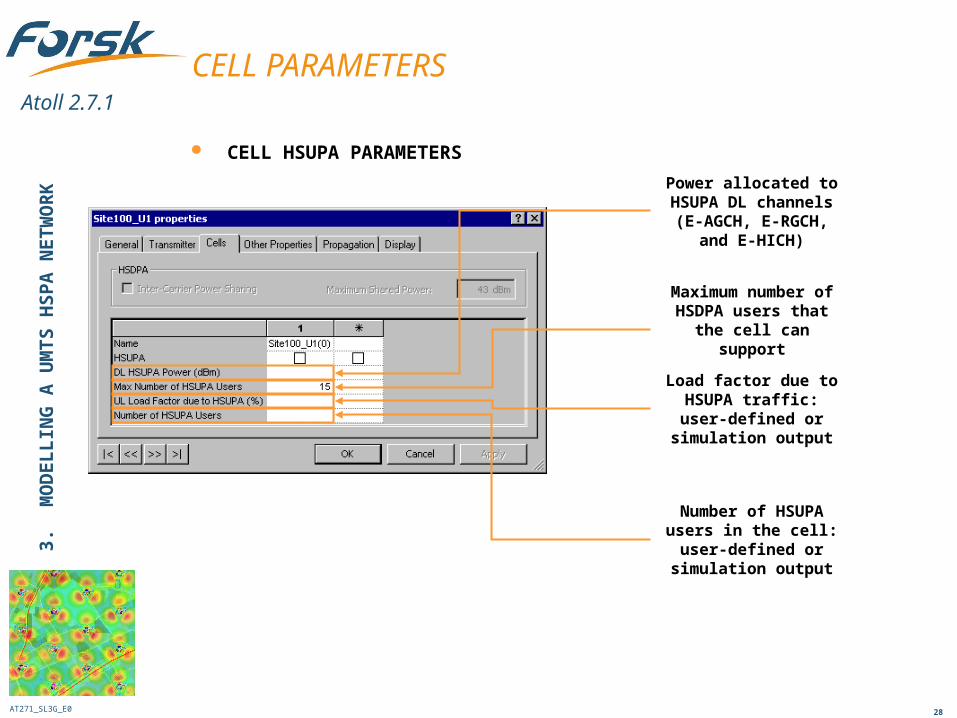
CELL PARAMETERS
CELL HSUPA PARAMETERS
Number of HSUPA users in the cell: user-defined or simulation
output
Maximum number of HSDPA users that the
cell can support
Power allocated to HSUPA DL channels (E-AGCH, E-RGCH, and E-
HICH)
Load factor due to HSUPA traffic: user-
defined or simulation output
3.
MO
DE
LL
ING
A U
MT
S H
SP
A N
ET
WO
RK
AT271_SL3G_E0
Atoll 2.7.1
29
1. UMTS, HSDPA and HSUPA Concepts
2. 3G Workflow in Atoll
3. Modelling a UMTS HSPA Network
4. UMTS, HSDPA and HSUPA Predictions
5. Monte-Carlo Based Simulation
6. Neighbour Allocation
7. Scrambling Codes Planning
8. GSM/TDMA – UMTS Co-planning
9. Using Drive Tests
1. UMTS, HSDPA and HSUPA Concepts
2. 3G Workflow in Atoll
3. Modelling a UMTS HSPA Network
4. UMTS, HSDPA and HSUPA Predictions
5. Monte-Carlo Based Simulation
6. Neighbour Allocation
7. Scrambling Codes Planning
8. GSM/TDMA – UMTS Co-planning
9. Using Drive Tests
TRAINING PROGRAM
AT271_SL3G_E0
Atoll 2.7.1
30
4. UMTS, HSDPA AND HSUPA PREDICTIONS
AVAILABLE PREDICTIONS
UMTS PREDICTIONS
HSDPA PREDICTION
HSUPA PREDICTION
4.
UM
TS
, H
SD
PA
AN
D H
SU
PA
PR
ED
ICT
ION
S
AT271_SL3G_E0
Atoll 2.7.1
31
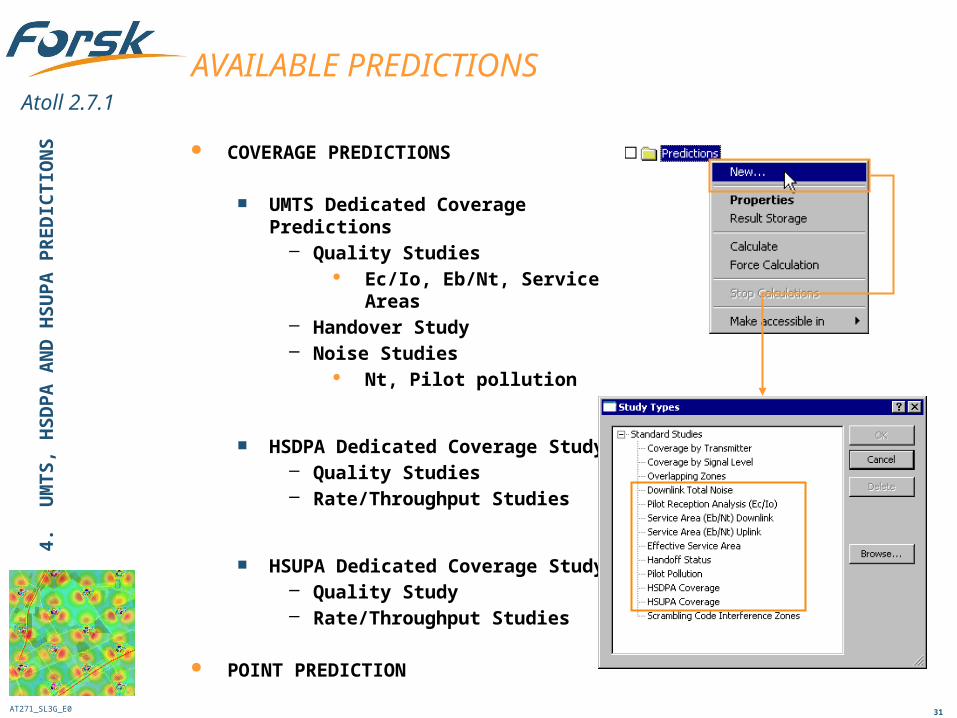
AVAILABLE PREDICTIONS
COVERAGE PREDICTIONS
UMTS Dedicated Coverage Predictions– Quality Studies
Ec/Io, Eb/Nt, Service Areas– Handover Study– Noise Studies
Nt, Pilot pollution
HSDPA Dedicated Coverage Study– Quality Studies– Rate/Throughput Studies
HSUPA Dedicated Coverage Study– Quality Study– Rate/Throughput Studies
POINT PREDICTION
4.
UM
TS
, H
SD
PA
AN
D H
SU
PA
PR
ED
ICT
ION
S
AT271_SL3G_E0
Atoll 2.7.1
32
PRINCIPLES OF UMTS PREDICTIONS
UMTS PREDICTIONS ARE CALCULATED FOR
Given load conditions– UL Load Factor– DL Power Used
A non-interfering user with– A service– A mobility– A terminal type
4.
UM
TS
, H
SD
PA
AN
D H
SU
PA
PR
ED
ICT
ION
S
AT271_SL3G_E0
Atoll 2.7.1
33
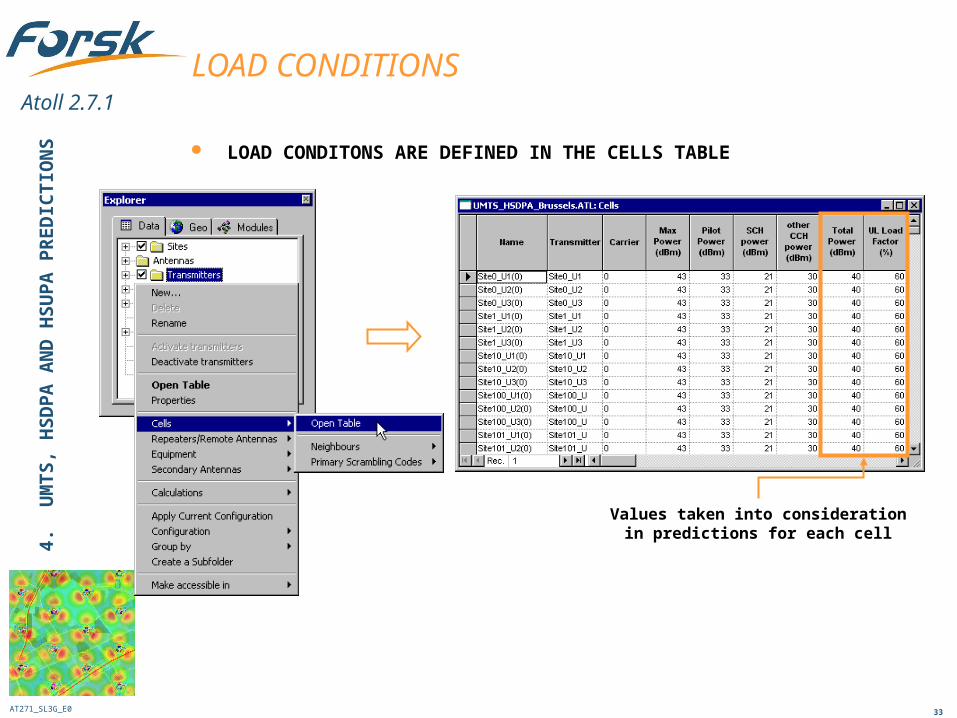
LOAD CONDITIONS
LOAD CONDITONS ARE DEFINED IN THE CELLS TABLE
Values taken into consideration in predictions for each cell
4.
UM
TS
, H
SD
PA
AN
D H
SU
PA
PR
ED
ICT
ION
S
AT271_SL3G_E0
Atoll 2.7.1
34
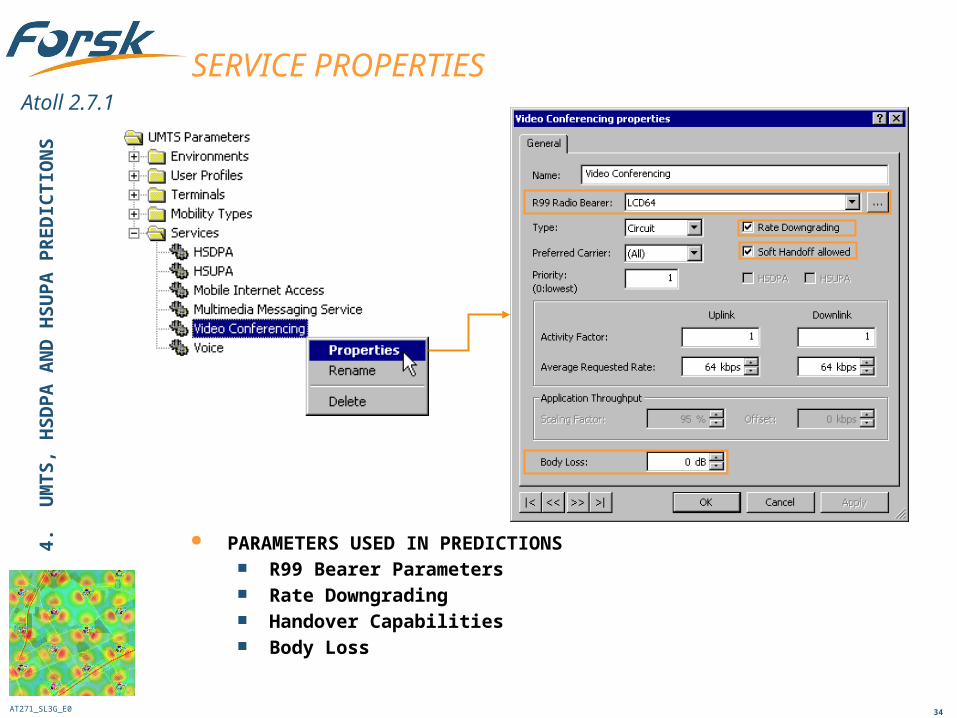
PARAMETERS USED IN PREDICTIONS R99 Bearer Parameters Rate Downgrading Handover Capabilities Body Loss
SERVICE PROPERTIES4.
U
MT
S,
HS
DP
A A
ND
HS
UP
A P
RE
DIC
TIO
NS
AT271_SL3G_E0
Atoll 2.7.1
35
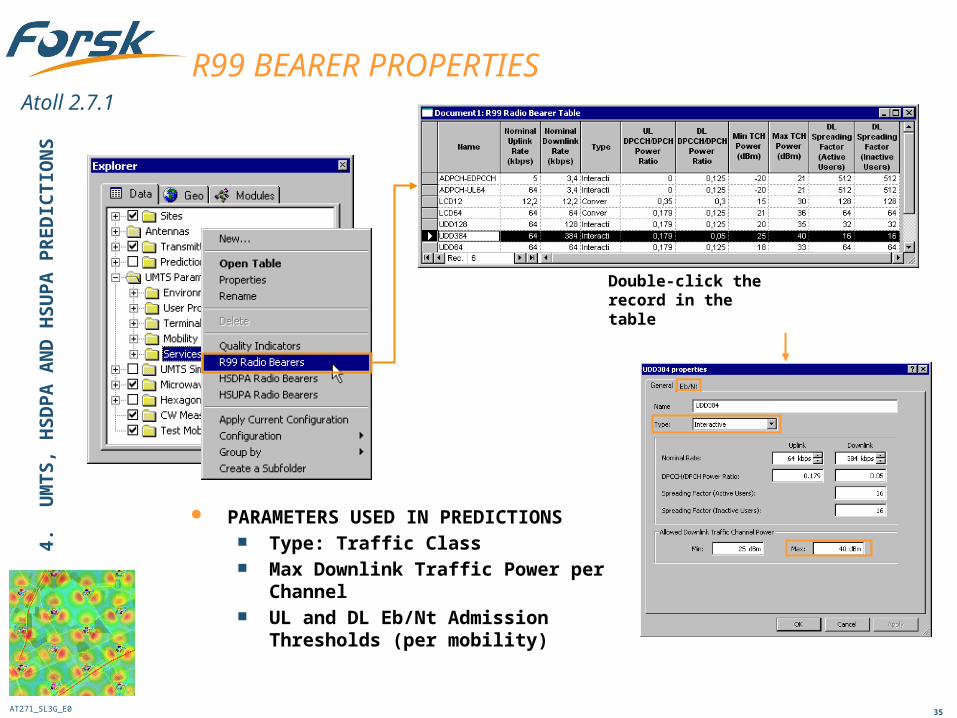
PARAMETERS USED IN PREDICTIONS Type: Traffic Class Max Downlink Traffic Power per Channel UL and DL Eb/Nt Admission Thresholds
(per mobility)
R99 BEARER PROPERTIES4.
U
MT
S,
HS
DP
A A
ND
HS
UP
A P
RE
DIC
TIO
NS
Double-click the record in the table
AT271_SL3G_E0
Atoll 2.7.1
36
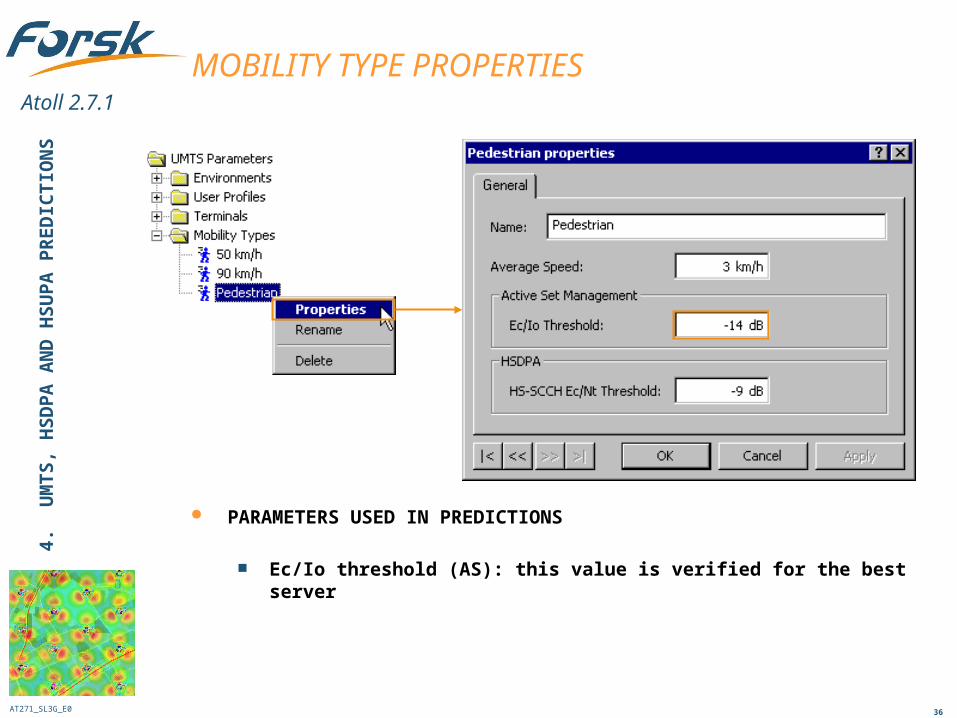
PARAMETERS USED IN PREDICTIONS
Ec/Io threshold (AS): this value is verified for the best server
MOBILITY TYPE PROPERTIES4.
U
MT
S,
HS
DP
A A
ND
HS
UP
A P
RE
DIC
TIO
NS
AT271_SL3G_E0
Atoll 2.7.1
37
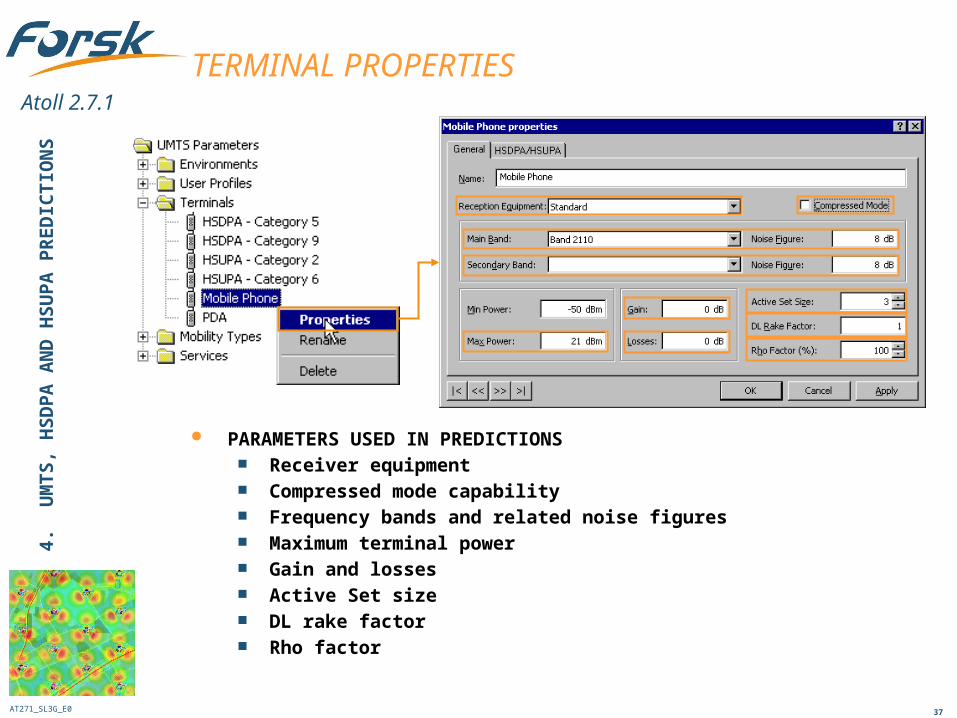
PARAMETERS USED IN PREDICTIONS Receiver equipment Compressed mode capability Frequency bands and related noise figures Maximum terminal power Gain and losses Active Set size DL rake factor Rho factor
TERMINAL PROPERTIES4.
U
MT
S,
HS
DP
A A
ND
HS
UP
A P
RE
DIC
TIO
NS
AT271_SL3G_E0
Atoll 2.7.1
38
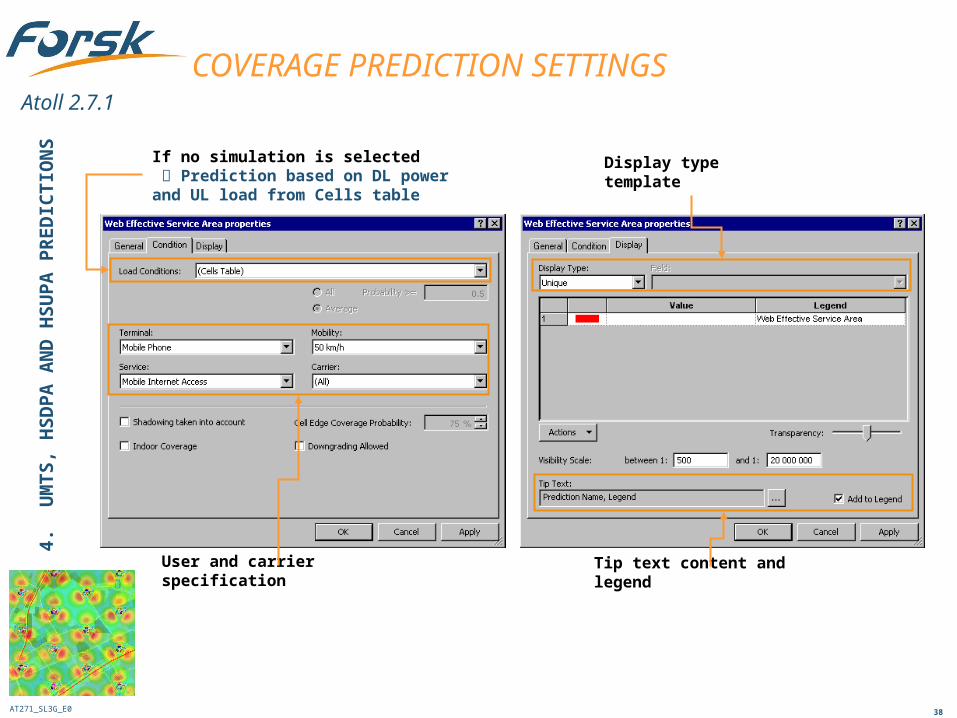
COVERAGE PREDICTION SETTINGS
User and carrier specification
If no simulation is selected Prediction based on DL power and UL load from Cells table
Display type template
Tip text content and legend
4.
UM
TS
, H
SD
PA
AN
D H
SU
PA
PR
ED
ICT
ION
S
AT271_SL3G_E0
Atoll 2.7.1
39
DISPLAY OPTIONS FOR UMTS COVERAGE PREDICTIONS
4.
UM
TS
, H
SD
PA
AN
D H
SU
PA
PR
ED
ICT
ION
S
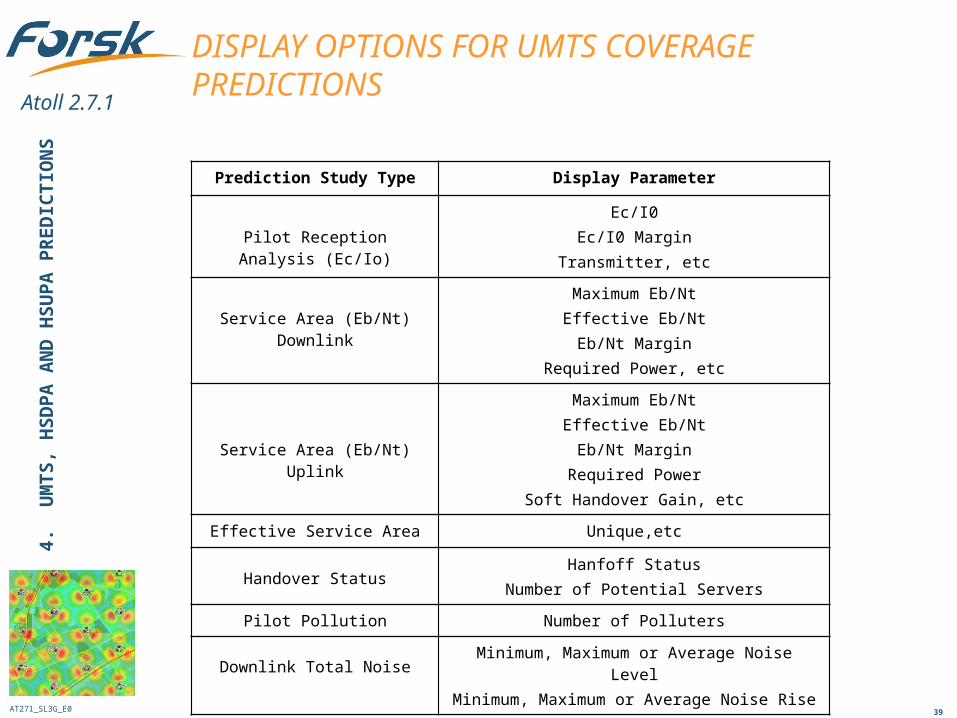
Prediction Study Type Display Parameter
Pilot Reception Analysis (Ec/Io)Ec/I0
Ec/I0 MarginTransmitter, etc
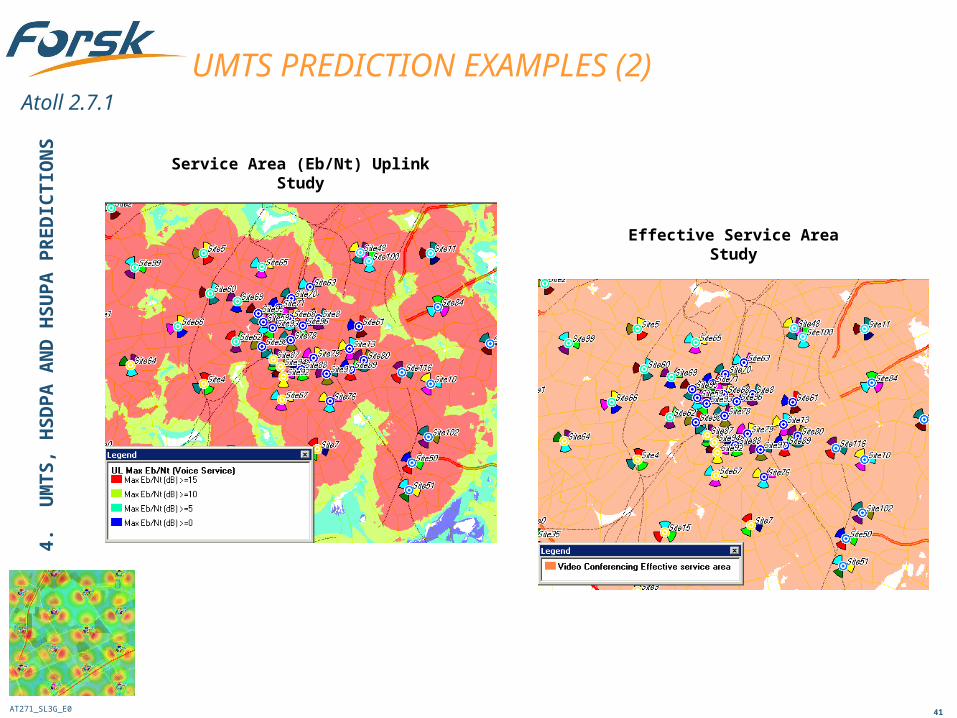
Service Area (Eb/Nt) DownlinkMaximum Eb/NtEffective Eb/NtEb/Nt Margin
Required Power, etc
Service Area (Eb/Nt) Uplink
Maximum Eb/NtEffective Eb/NtEb/Nt Margin
Required PowerSoft Handover Gain, etc
Effective Service Area Unique,etc
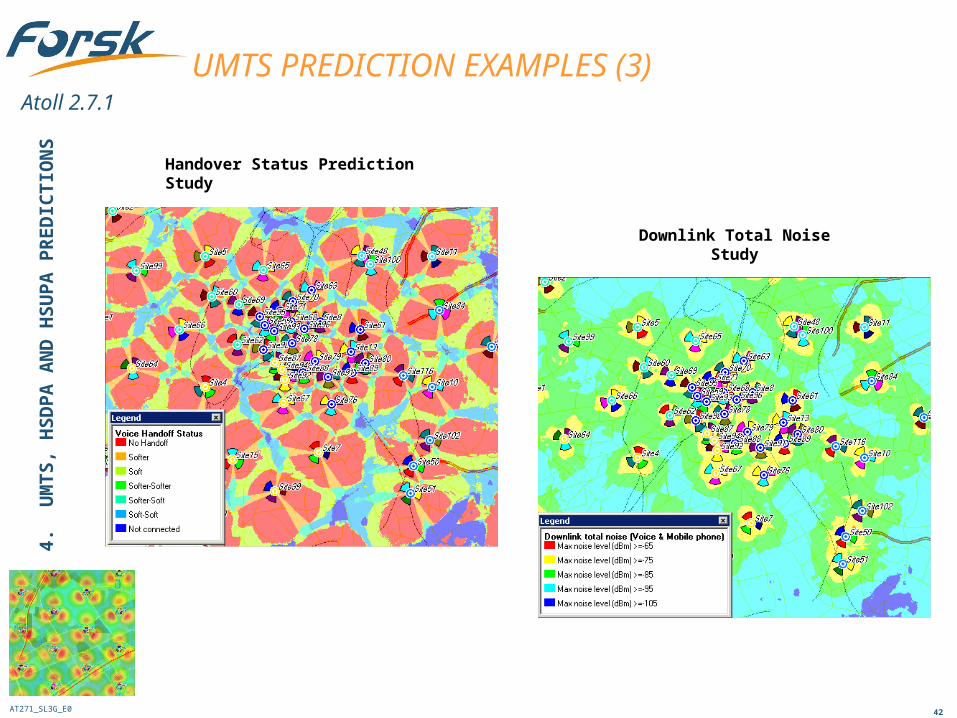
Handover StatusHanfoff Status
Number of Potential Servers
Pilot Pollution Number of Polluters
Downlink Total NoiseMinimum, Maximum or Average Noise LevelMinimum, Maximum or Average Noise Rise
AT271_SL3G_E0
Atoll 2.7.1
40
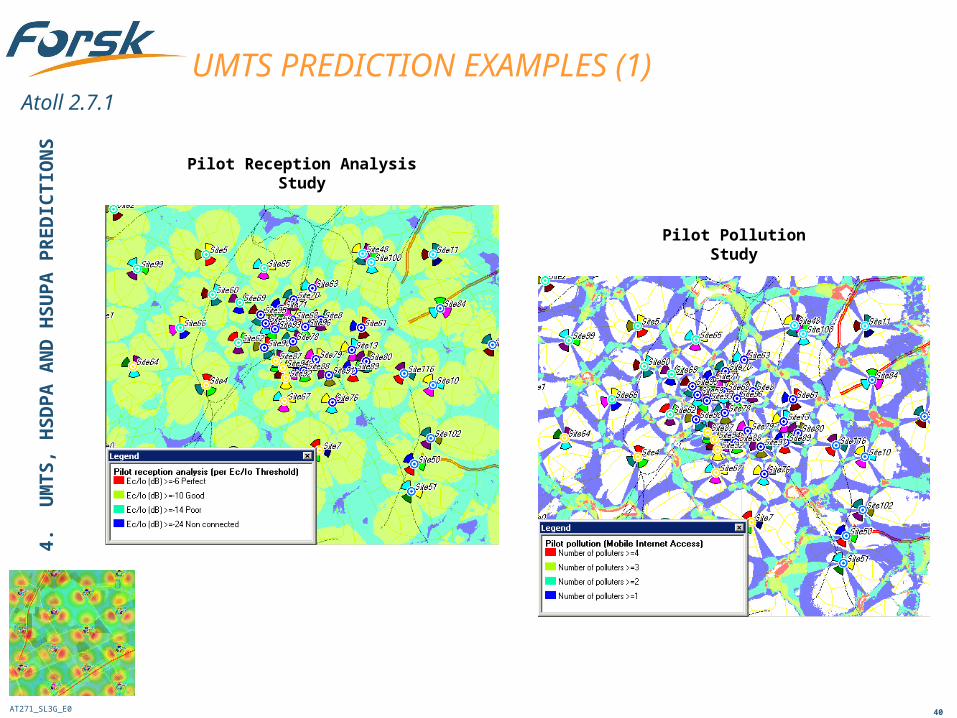
UMTS PREDICTION EXAMPLES (1)
Pilot Reception Analysis Study
Pilot Pollution Study
4.
UM
TS
, H
SD
PA
AN
D H
SU
PA
PR
ED
ICT
ION
S
AT271_SL3G_E0
Atoll 2.7.1
41
UMTS PREDICTION EXAMPLES (2)
Effective Service Area Study
Service Area (Eb/Nt) Uplink Study
4.
UM
TS
, H
SD
PA
AN
D H
SU
PA
PR
ED
ICT
ION
S
AT271_SL3G_E0
Atoll 2.7.1
42
UMTS PREDICTION EXAMPLES (3)
Handover Status Prediction Study
Downlink Total Noise Study
4.
UM
TS
, H
SD
PA
AN
D H
SU
PA
PR
ED
ICT
ION
S
AT271_SL3G_E0
Atoll 2.7.1
43
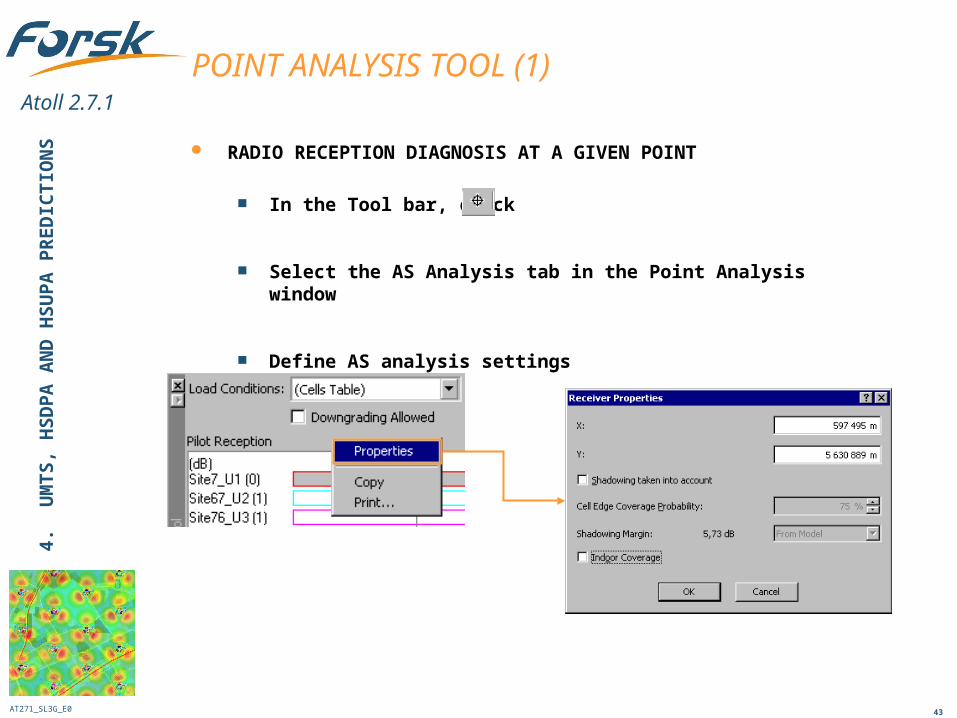
POINT ANALYSIS TOOL (1)
RADIO RECEPTION DIAGNOSIS AT A GIVEN POINT
In the Tool bar, click
Select the AS Analysis tab in the Point Analysis window
Define AS analysis settings
4.
UM
TS
, H
SD
PA
AN
D H
SU
PA
PR
ED
ICT
ION
S
AT271_SL3G_E0
Atoll 2.7.1
44
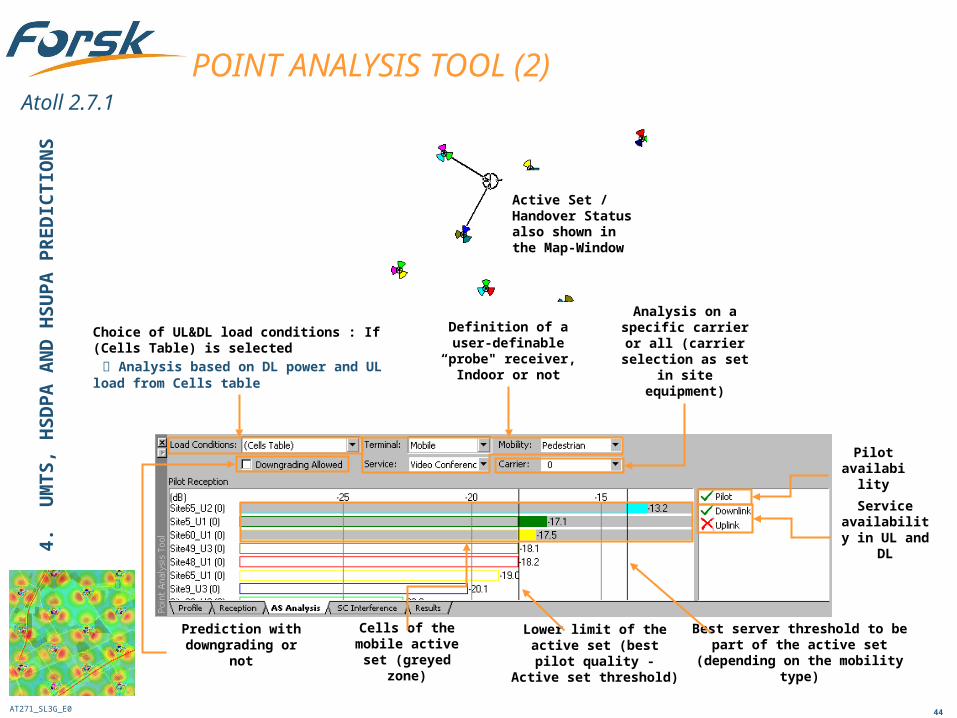
POINT ANALYSIS TOOL (2)
Active Set / Handover Status also shown in the Map-Window
4.
UM
TS
, H
SD
PA
AN
D H
SU
PA
PR
ED
ICT
ION
S
Choice of UL&DL load conditions : If (Cells Table) is selected
Analysis based on DL power and UL load from Cells table
Definition of a user-definable “probe"
receiver, Indoor or not
Analysis on a specific carrier or
all (carrier selection as set in site equipment)
Service availability in
UL and DL
Cells of the mobile active set (greyed
zone)
Prediction with downgrading or not
Best server threshold to be part of the active set (depending on the
mobility type)
Lower limit of the active set (best pilot quality - Active set threshold)
Pilot availability
AT271_SL3G_E0
Atoll 2.7.1
45
PRINCIPLES OF HSDPA PREDICTIONS
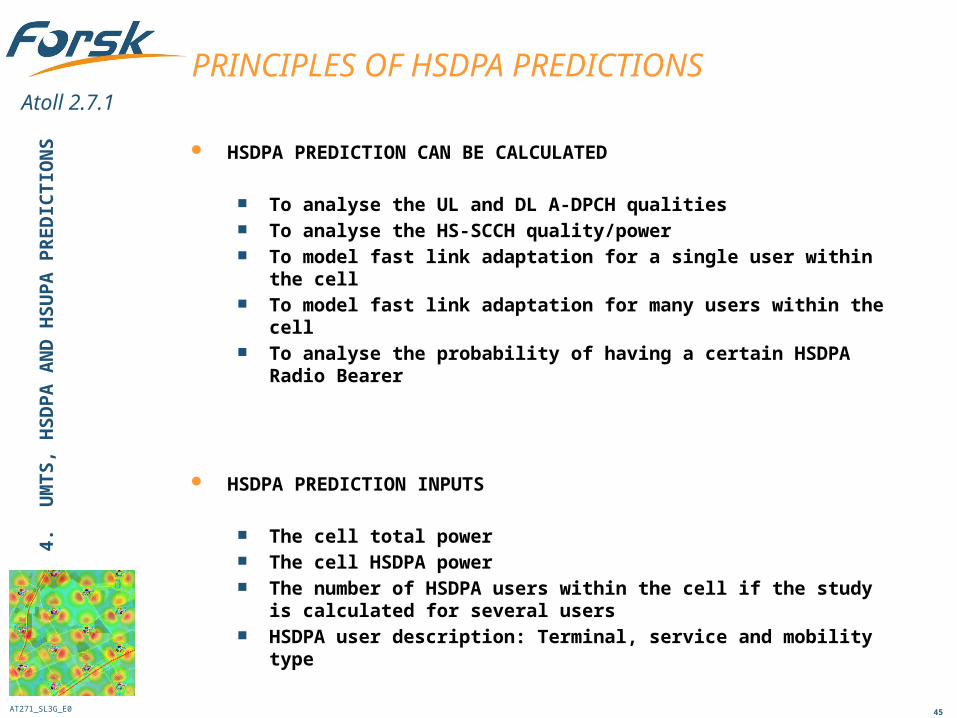
HSDPA PREDICTION CAN BE CALCULATED
To analyse the UL and DL A-DPCH qualities To analyse the HS-SCCH quality/power To model fast link adaptation for a single user within the cell To model fast link adaptation for many users within the cell To analyse the probability of having a certain HSDPA Radio Bearer
HSDPA PREDICTION INPUTS
The cell total power The cell HSDPA power The number of HSDPA users within the cell if the study is calculated for
several users HSDPA user description: Terminal, service and mobility type4.
U
MT
S,
HS
DP
A A
ND
HS
UP
A P
RE
DIC
TIO
NS
AT271_SL3G_E0
Atoll 2.7.1
46
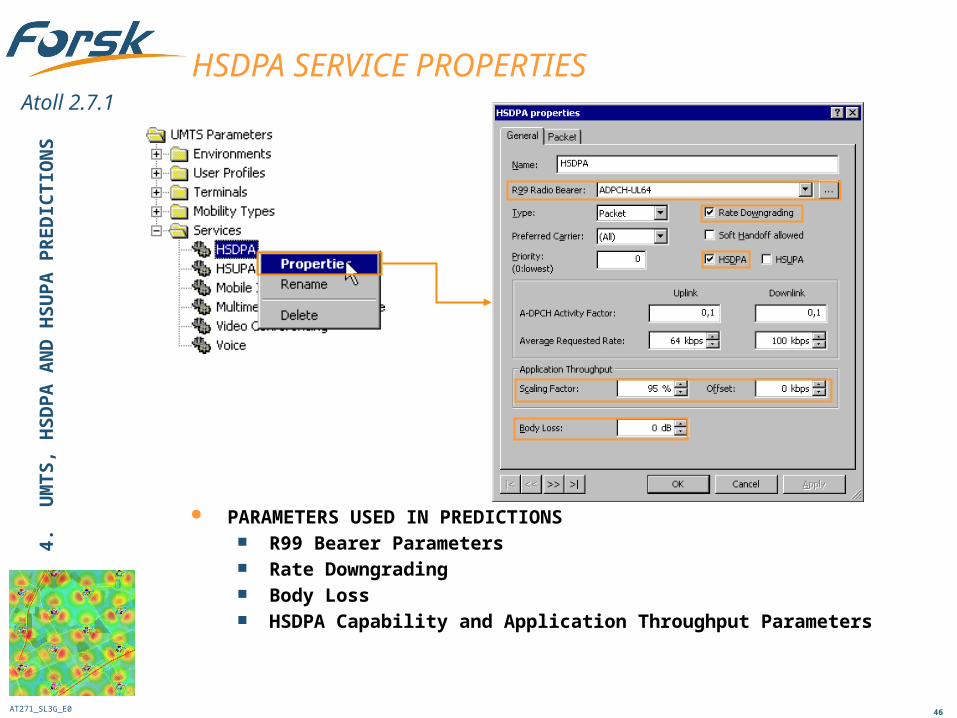
PARAMETERS USED IN PREDICTIONS R99 Bearer Parameters Rate Downgrading Body Loss HSDPA Capability and Application Throughput Parameters
HSDPA SERVICE PROPERTIES4.
U
MT
S,
HS
DP
A A
ND
HS
UP
A P
RE
DIC
TIO
NS
AT271_SL3G_E0
Atoll 2.7.1
47
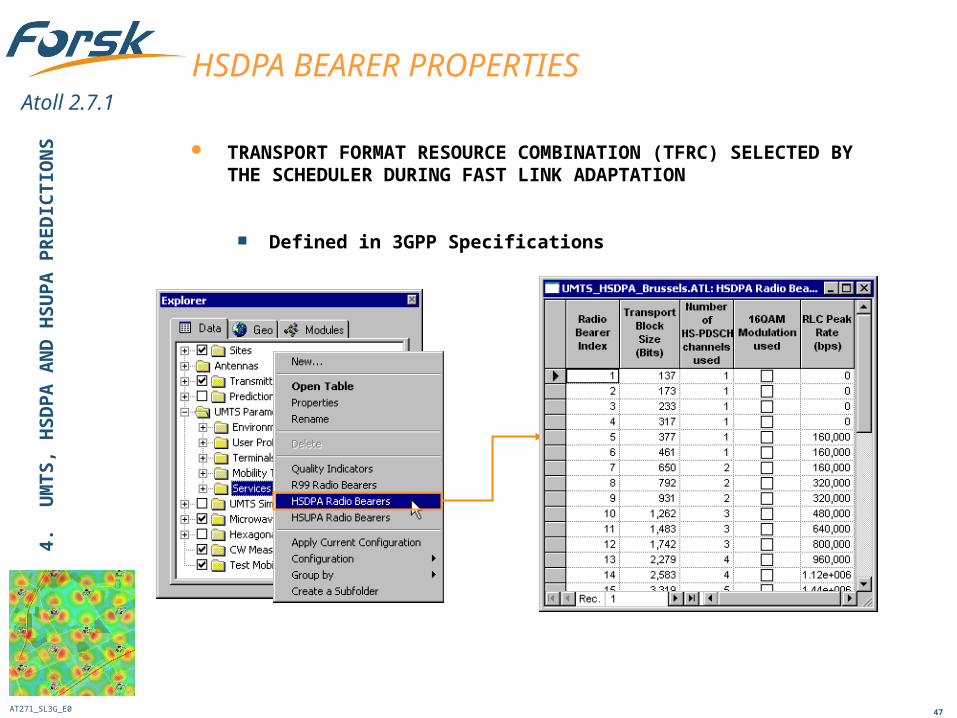
TRANSPORT FORMAT RESOURCE COMBINATION (TFRC) SELECTED BY THE SCHEDULER DURING FAST LINK ADAPTATION
Defined in 3GPP Specifications
HSDPA BEARER PROPERTIES4.
U
MT
S,
HS
DP
A A
ND
HS
UP
A P
RE
DIC
TIO
NS
AT271_SL3G_E0
Atoll 2.7.1
48
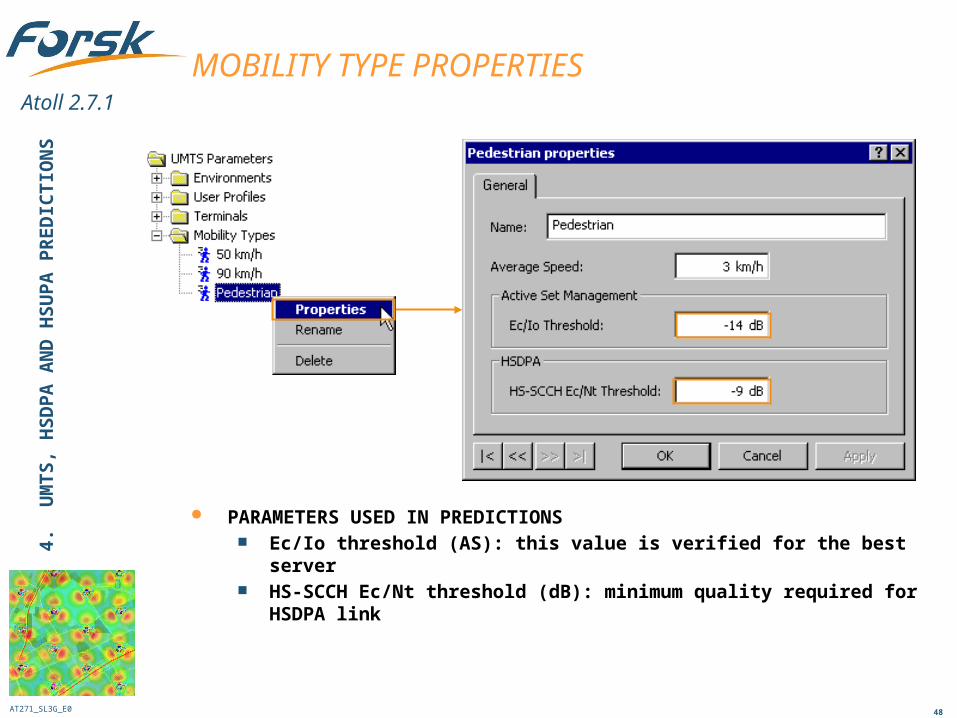
PARAMETERS USED IN PREDICTIONS Ec/Io threshold (AS): this value is verified for the best server HS-SCCH Ec/Nt threshold (dB): minimum quality required for HSDPA link
MOBILITY TYPE PROPERTIES4.
U
MT
S,
HS
DP
A A
ND
HS
UP
A P
RE
DIC
TIO
NS
AT271_SL3G_E0
Atoll 2.7.1
49
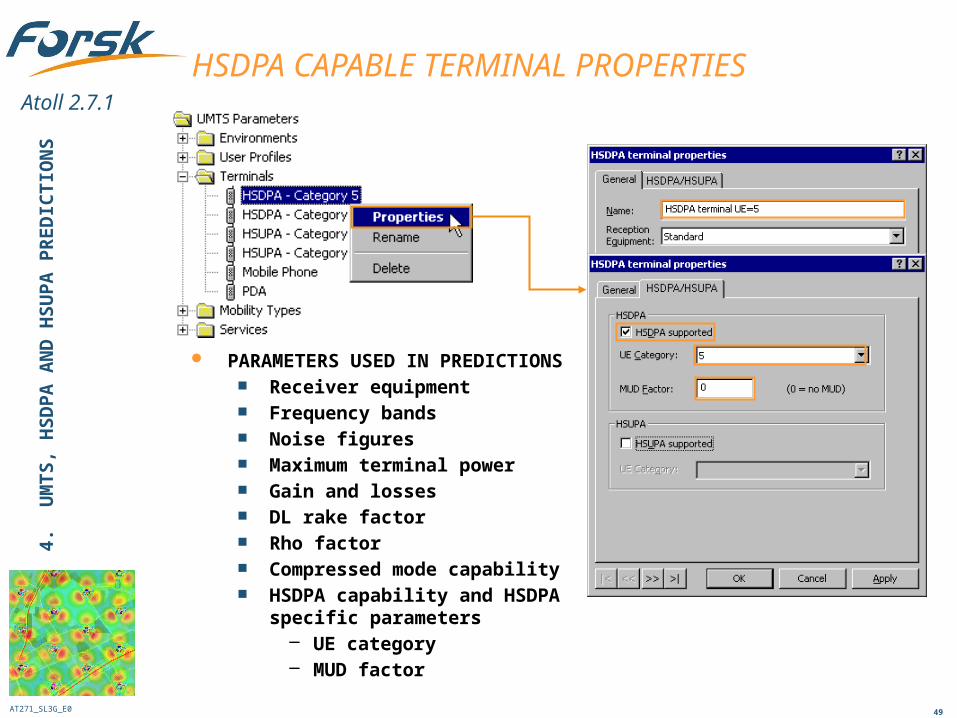
PARAMETERS USED IN PREDICTIONS Receiver equipment Frequency bands Noise figures Maximum terminal power Gain and losses DL rake factor Rho factor Compressed mode capability HSDPA capability and HSDPA
specific parameters– UE category– MUD factor
HSDPA CAPABLE TERMINAL PROPERTIES4.
U
MT
S,
HS
DP
A A
ND
HS
UP
A P
RE
DIC
TIO
NS
AT271_SL3G_E0
Atoll 2.7.1
50
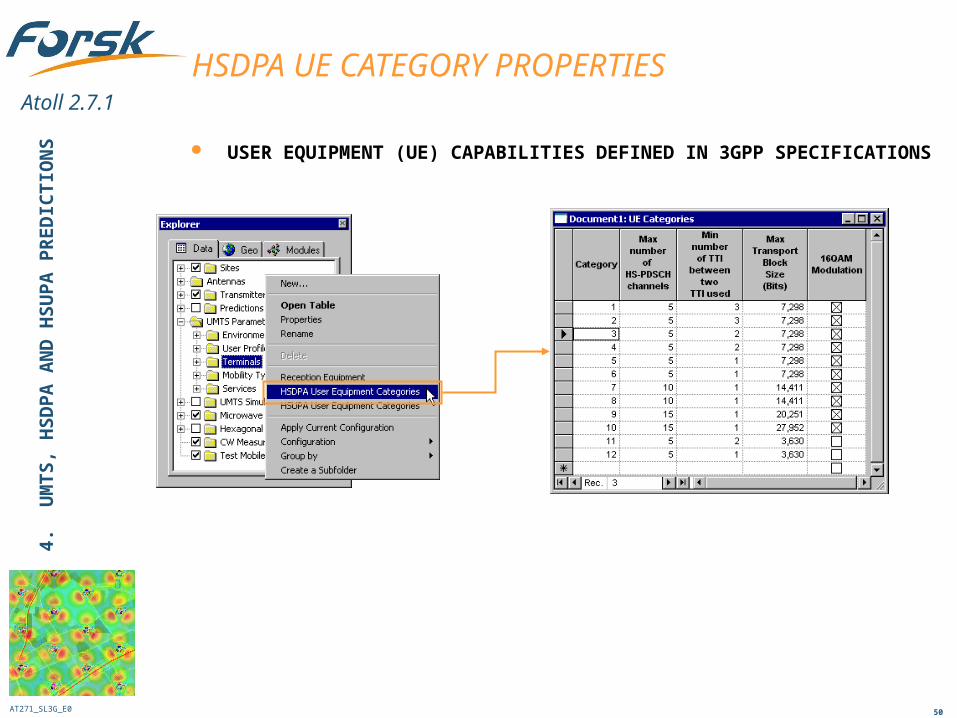
HSDPA UE CATEGORY PROPERTIES
USER EQUIPMENT (UE) CAPABILITIES DEFINED IN 3GPP SPECIFICATIONS
4.
UM
TS
, H
SD
PA
AN
D H
SU
PA
PR
ED
ICT
ION
S
AT271_SL3G_E0
Atoll 2.7.1
51
DISPLAY OPTIONS FOR HSDPA PREDICTIONS4.
U
MT
S,
HS
DP
A A
ND
HS
UP
A P
RE
DIC
TIO
NS
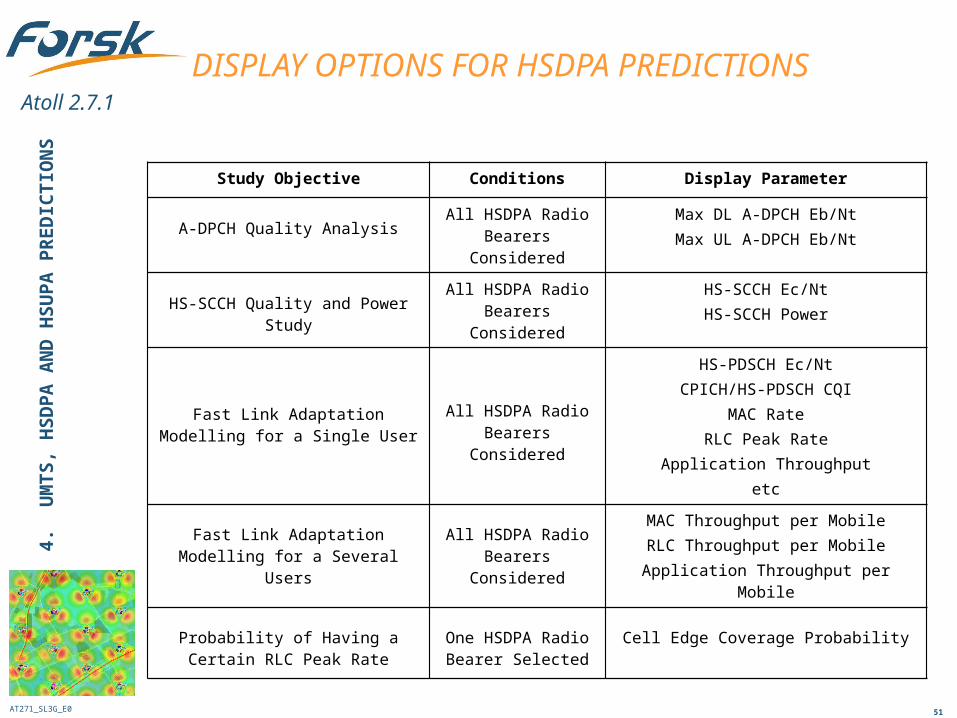
Study Objective Conditions Display Parameter
A-DPCH Quality AnalysisAll HSDPA Radio
Bearers ConsideredMax DL A-DPCH Eb/NtMax UL A-DPCH Eb/Nt
HS-SCCH Quality and Power StudyAll HSDPA Radio
Bearers ConsideredHS-SCCH Ec/NtHS-SCCH Power
Fast Link Adaptation Modelling for a Single User
All HSDPA Radio Bearers Considered
HS-PDSCH Ec/NtCPICH/HS-PDSCH CQI
MAC RateRLC Peak Rate
Application Throughputetc
Fast Link Adaptation Modelling for a Several Users
All HSDPA Radio Bearers Considered
MAC Throughput per MobileRLC Throughput per Mobile
Application Throughput per Mobile
Probability of Having a Certain RLC Peak Rate
One HSDPA Radio Bearer Selected
Cell Edge Coverage Probability
AT271_SL3G_E0
Atoll 2.7.1
52
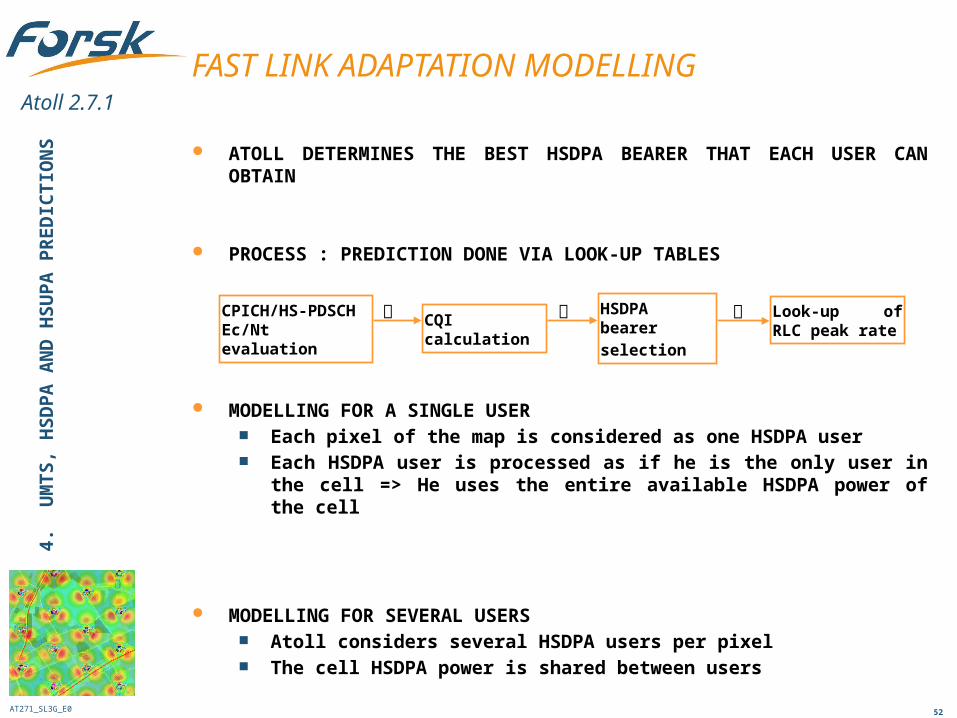
FAST LINK ADAPTATION MODELLING
ATOLL DETERMINES THE BEST HSDPA BEARER THAT EACH USER CAN OBTAIN
PROCESS : PREDICTION DONE VIA LOOK-UP TABLES
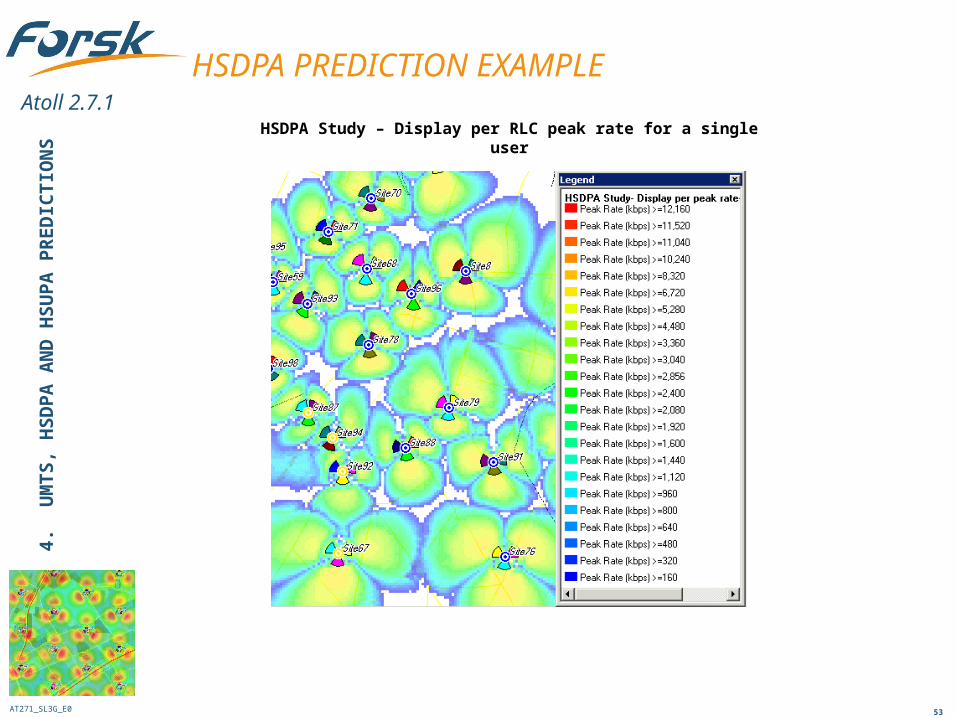
MODELLING FOR A SINGLE USER Each pixel of the map is considered as one HSDPA user Each HSDPA user is processed as if he is the only user in the cell => He
uses the entire available HSDPA power of the cell
MODELLING FOR SEVERAL USERS Atoll considers several HSDPA users per pixel The cell HSDPA power is shared between users
CQI calculationHSDPA bearer
selectionLook-up of RLC peak rate
CPICH/HS-PDSCH Ec/Nt evaluation
4.
UM
TS
, H
SD
PA
AN
D H
SU
PA
PR
ED
ICT
ION
S
AT271_SL3G_E0
Atoll 2.7.1
53
HSDPA PREDICTION EXAMPLE
HSDPA Study – Display per RLC peak rate for a single user
4.
UM
TS
, H
SD
PA
AN
D H
SU
PA
PR
ED
ICT
ION
S
AT271_SL3G_E0
Atoll 2.7.1
54
PRINCIPLES OF HSUPA PREDICTIONS
HSUPA PREDICTION CAN BE CALCULATED TO ANALYSE The power required by the terminal The required E-DPDCH quality The rates and throughputs
HSUPA PREDICTION INPUTS The cell UL load factor The cell UL load factor due to HSUPA The cell UL reuse factor The maximum cell UL load factor The number of HSUPA users within the cell if the study is calculated for
several users HSUPA user description: Terminal, service and mobility type
TWO CALCULATION OPTIONS HSUPA resources are dedicated to a single user HSUPA resources are shared by several users
4.
UM
TS
, H
SD
PA
AN
D H
SU
PA
PR
ED
ICT
ION
S
AT271_SL3G_E0
Atoll 2.7.1
55
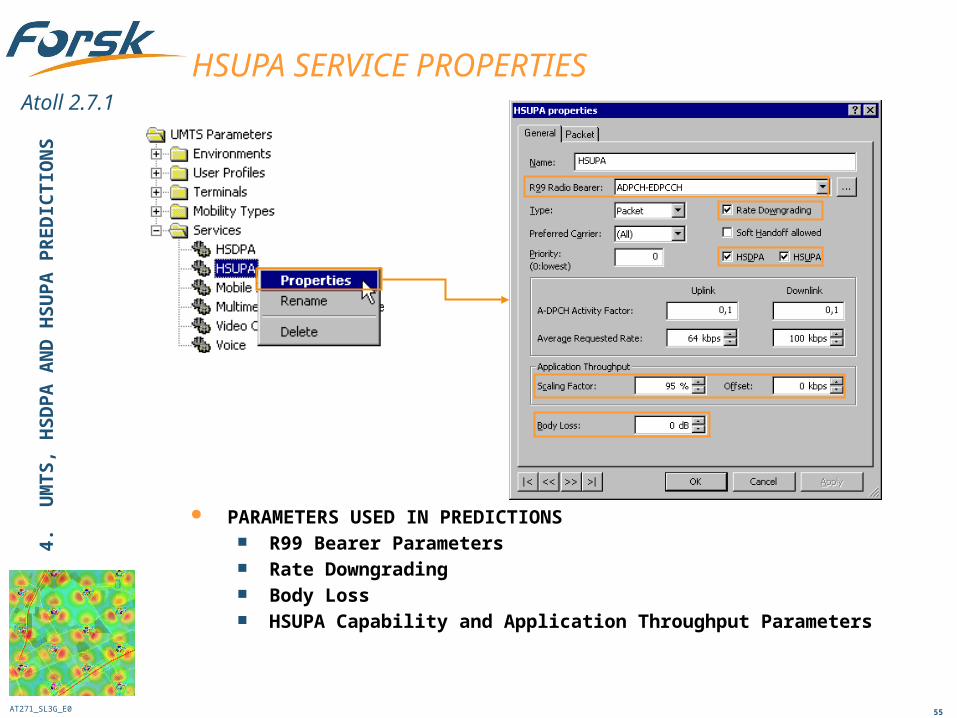
PARAMETERS USED IN PREDICTIONS R99 Bearer Parameters Rate Downgrading Body Loss HSUPA Capability and Application Throughput Parameters
HSUPA SERVICE PROPERTIES4.
U
MT
S,
HS
DP
A A
ND
HS
UP
A P
RE
DIC
TIO
NS
AT271_SL3G_E0
Atoll 2.7.1
56
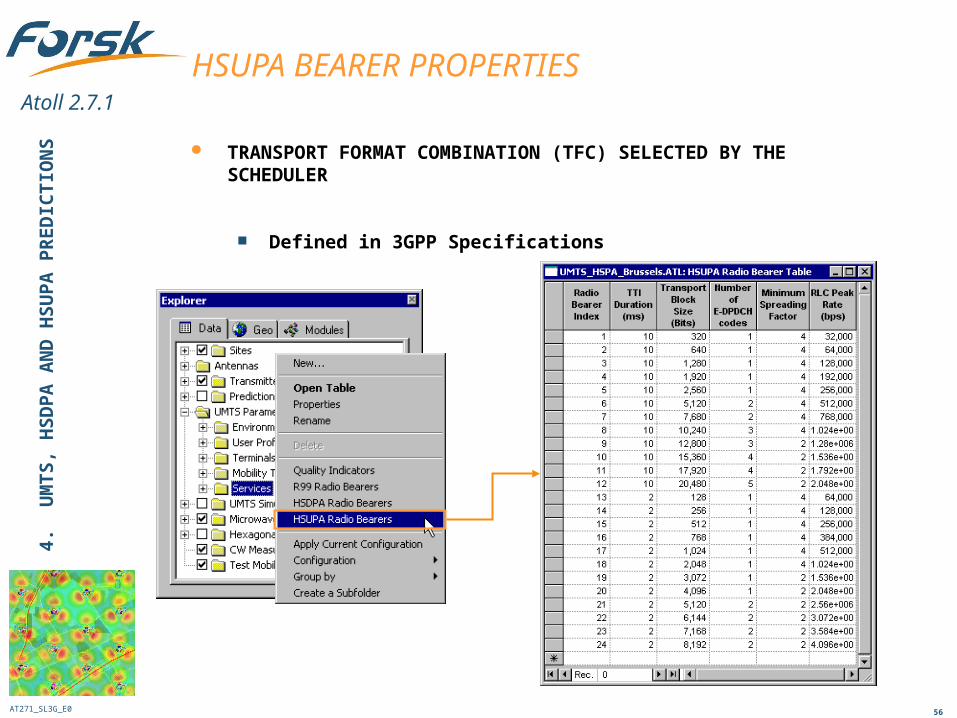
TRANSPORT FORMAT COMBINATION (TFC) SELECTED BY THE SCHEDULER
Defined in 3GPP Specifications
HSUPA BEARER PROPERTIES4.
U
MT
S,
HS
DP
A A
ND
HS
UP
A P
RE
DIC
TIO
NS
AT271_SL3G_E0
Atoll 2.7.1
57
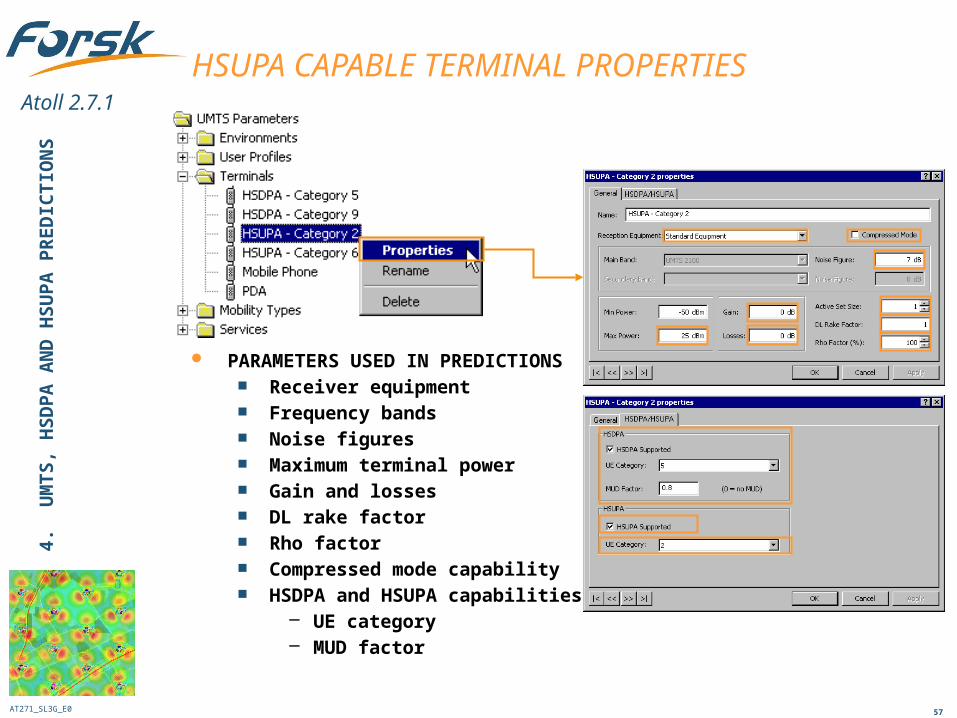
PARAMETERS USED IN PREDICTIONS Receiver equipment Frequency bands Noise figures Maximum terminal power Gain and losses DL rake factor Rho factor Compressed mode capability HSDPA and HSUPA capabilities
– UE category– MUD factor
HSUPA CAPABLE TERMINAL PROPERTIES4.
U
MT
S,
HS
DP
A A
ND
HS
UP
A P
RE
DIC
TIO
NS
AT271_SL3G_E0
Atoll 2.7.1
58
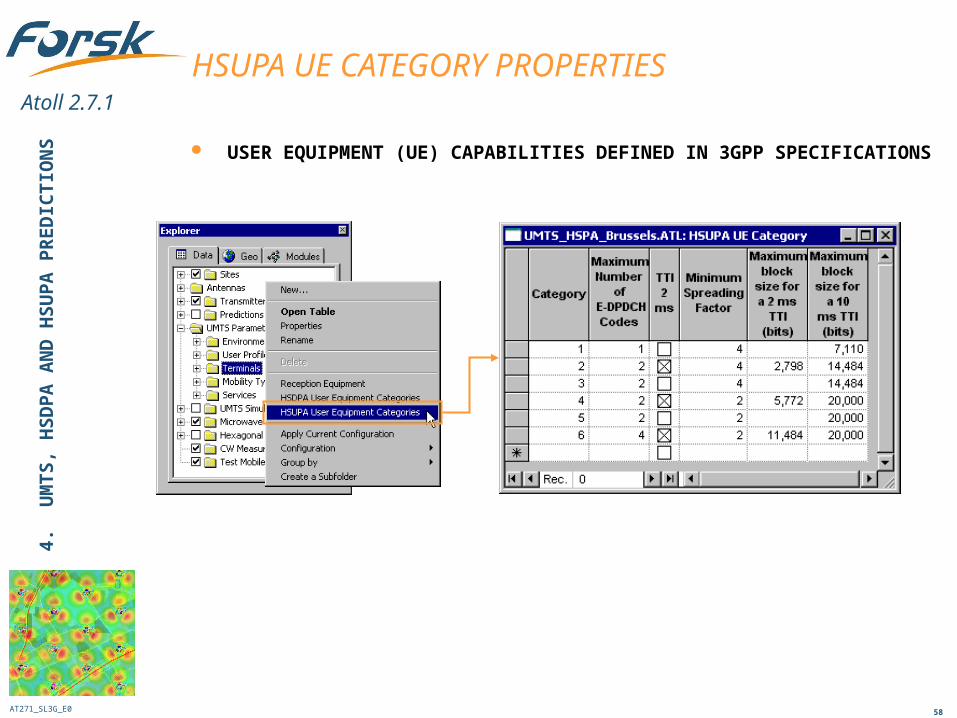
HSUPA UE CATEGORY PROPERTIES
USER EQUIPMENT (UE) CAPABILITIES DEFINED IN 3GPP SPECIFICATIONS
4.
UM
TS
, H
SD
PA
AN
D H
SU
PA
PR
ED
ICT
ION
S
AT271_SL3G_E0
Atoll 2.7.1
59
DISPLAY OPTIONS FOR HSUPA PREDICTIONS
ON EACH PIXEL, YOU CAN DISPLAY
The E-DPDCH Ec/Nt required to otain the HSUPA bearer
The terminal power required to obtain the HSUPA bearer
The RLC peak rate that the HSUPA bearer can provide
The minimum RLC throughput that the HSUPA bearer can provide
The application throughput that the HSUPA bearer can provide
Etc.
4.
UM
TS
, H
SD
PA
AN
D H
SU
PA
PR
ED
ICT
ION
S
AT271_SL3G_E0
Atoll 2.7.1
60
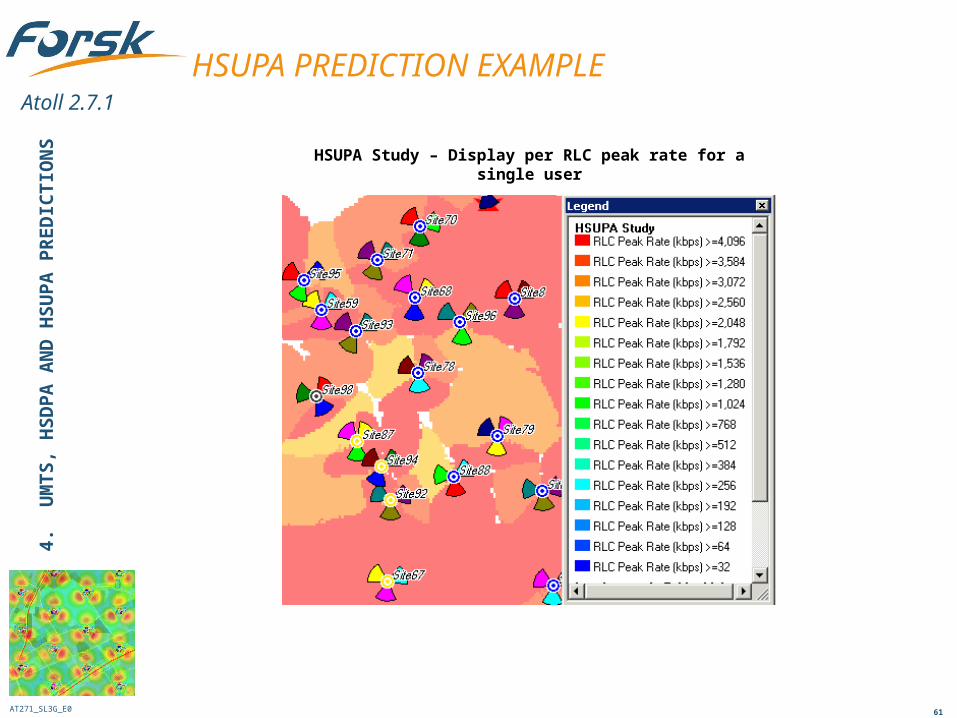
NOISE RISE SCHEDULING MODELLING
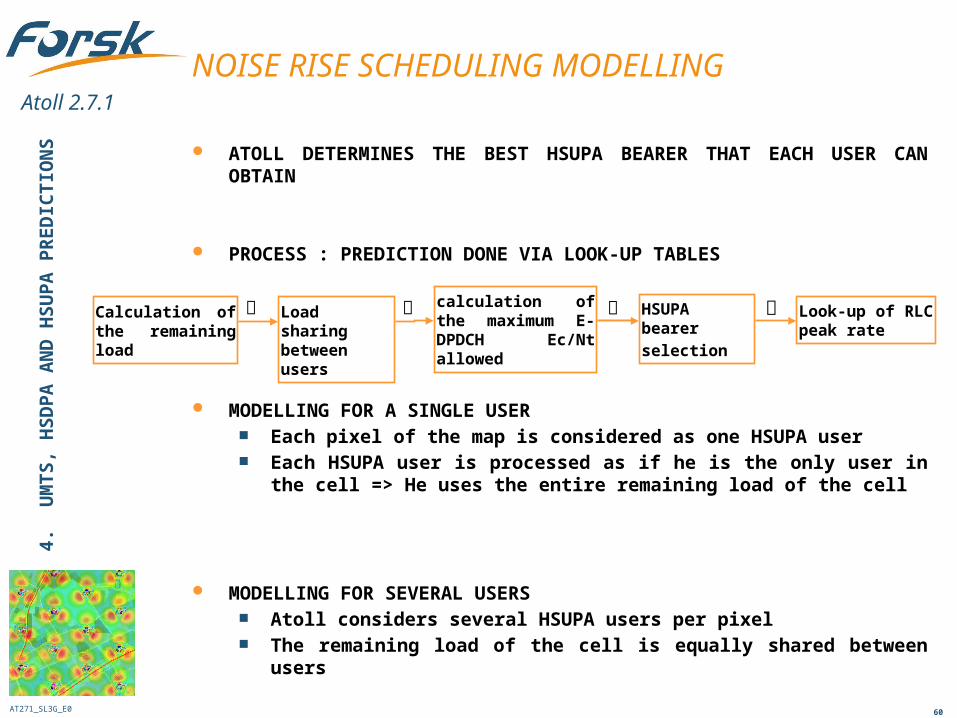
ATOLL DETERMINES THE BEST HSUPA BEARER THAT EACH USER CAN OBTAIN
PROCESS : PREDICTION DONE VIA LOOK-UP TABLES
MODELLING FOR A SINGLE USER Each pixel of the map is considered as one HSUPA user Each HSUPA user is processed as if he is the only user in the cell => He
uses the entire remaining load of the cell
MODELLING FOR SEVERAL USERS Atoll considers several HSUPA users per pixel The remaining load of the cell is equally shared between users
Load sharing between users
HSUPA bearer
selectionLook-up of RLC peak rate
Calculation of the remaining load
calculation of the maximum E-DPDCH Ec/Nt allowed
4.
UM
TS
, H
SD
PA
AN
D H
SU
PA
PR
ED
ICT
ION
S
AT271_SL3G_E0
Atoll 2.7.1
61
HSUPA PREDICTION EXAMPLE
HSUPA Study – Display per RLC peak rate for a single user
4.
UM
TS
, H
SD
PA
AN
D H
SU
PA
PR
ED
ICT
ION
S
AT271_SL3G_E0
Atoll 2.7.1
62
1. UMTS, HSDPA and HSUPA Concepts
2. 3G Workflow in Atoll
3. Modelling a UMTS HSPA Network
4. UMTS, HSDPA and HSUPA Predictions
5. Monte-Carlo Based Simulation
6. Neighbour Allocation
7. Scrambling Codes Planning
8. GSM/TDMA – UMTS Co-planning
9. Using Drive Tests
1. UMTS, HSDPA and HSUPA Concepts
2. 3G Workflow in Atoll
3. Modelling a UMTS HSPA Network
4. UMTS, HSDPA and HSUPA Predictions
5. Monte-Carlo Based Simulation
6. Neighbour Allocation
7. Scrambling Codes Planning
8. GSM/TDMA – UMTS Co-planning
9. Using Drive Tests
TRAINING PROGRAM
AT271_SL3G_E0
Atoll 2.7.1
63
5. MONTE-CARLO BASED SIMULATION
SIMULATION PROCESS
SIMULATION CREATION
SIMULATION RESULTS
ANALYSIS OF SIMULATIONS
5.
MO
NT
E-C
AR
LO
BA
SE
D S
IMU
LA
TIO
N
AT271_SL3G_E0
Atoll 2.7.1
64
SIMULATION PROCESS
WHAT’S A SIMULATION IN ATOLL? Distribution of users at a given moment (= Snapshot)
PURPOSE Simulate network regulation mechanisms for a user distribution
– Uplink and downlink power control on R99 bearers– Fast link adaptation in order to select HSDPA bearers– Noise rise scheduling in order to select HSUPA bearers
Obtaining network parameters– Mobile: active set, required power, etc– Cell: total DL power, UL load, etc
THREE STEPS1. Obtaining a realistic user distribution
2. Modelling network power control, fast link adaptation and noise rise scheduling
3. Calculating network parameters– Dimensioning information
5.
MO
NT
E-C
AR
LO
BA
SE
D S
IMU
LA
TIO
N
AT271_SL3G_E0
Atoll 2.7.1
65
SIMULATION PROCESS
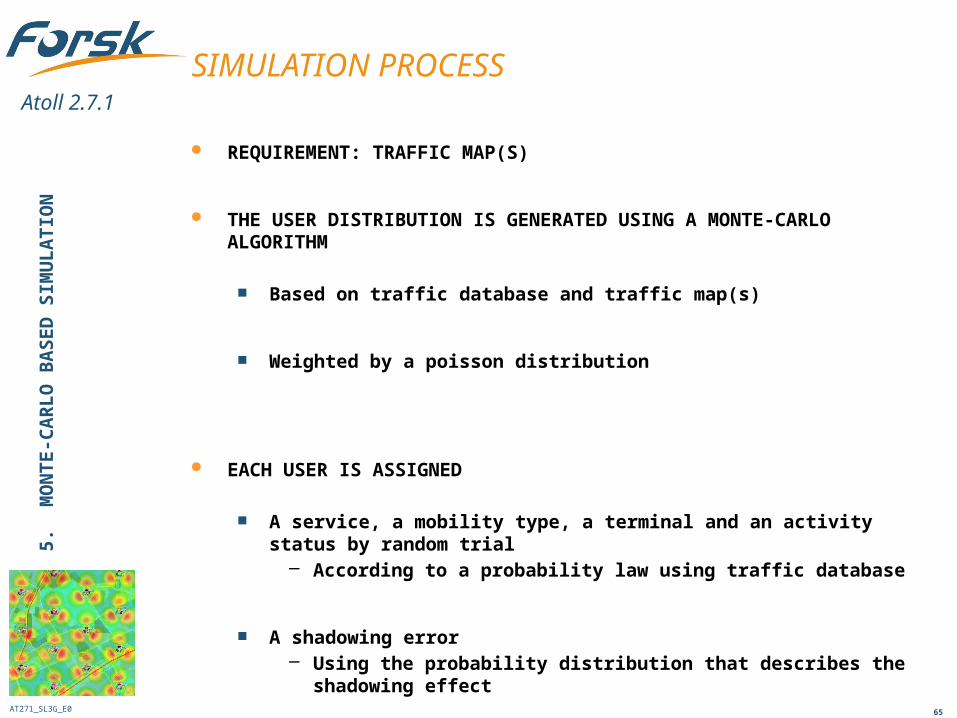
REQUIREMENT: TRAFFIC MAP(S)
THE USER DISTRIBUTION IS GENERATED USING A MONTE-CARLO ALGORITHM
Based on traffic database and traffic map(s)
Weighted by a poisson distribution
EACH USER IS ASSIGNED
A service, a mobility type, a terminal and an activity status by random trial– According to a probability law using traffic database
A shadowing error– Using the probability distribution that describes the shadowing effect
A geographic position in the traffic zone by random trial– According to the clutter weighting and indoor ratio
5.
MO
NT
E-C
AR
LO
BA
SE
D S
IMU
LA
TIO
N
AT271_SL3G_E0
Atoll 2.7.1
66
SIMULATION PROCESS
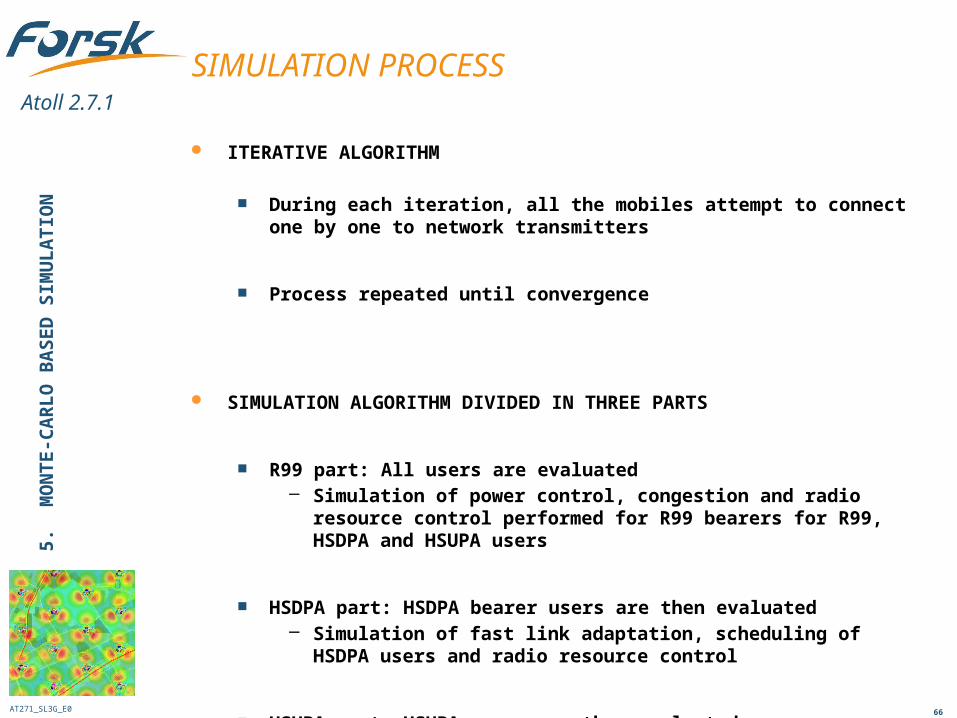
ITERATIVE ALGORITHM
During each iteration, all the mobiles attempt to connect one by one to network transmitters
Process repeated until convergence
SIMULATION ALGORITHM DIVIDED IN THREE PARTS
R99 part: All users are evaluated– Simulation of power control, congestion and radio resource control
performed for R99 bearers for R99, HSDPA and HSUPA users
HSDPA part: HSDPA bearer users are then evaluated– Simulation of fast link adaptation, scheduling of HSDPA users and
radio resource control
HSUPA part: HSUPA users are then evaluated– Simulation of noise rise scheduling and radio resource control of
HSUPA users
5.
MO
NT
E-C
AR
LO
BA
SE
D S
IMU
LA
TIO
N
AT271_SL3G_E0
Atoll 2.7.1
67
SIMULATION CREATION5.
M
ON
TE
-CA
RL
O B
AS
ED
SIM
UL
AT
ION
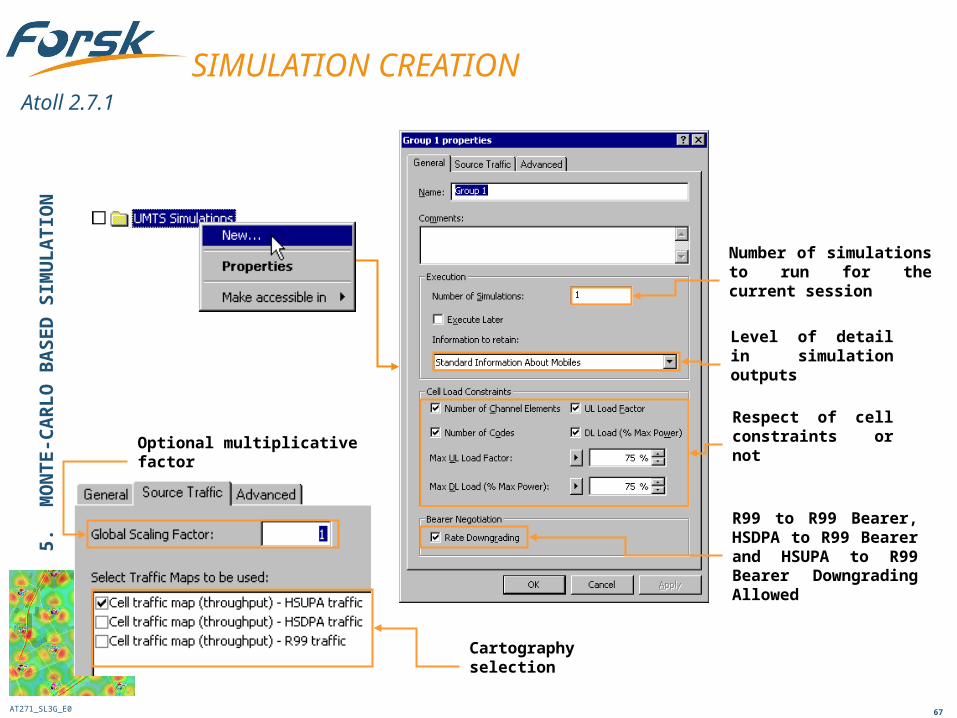
Number of simulations to run for the current session
Respect of cell constraints or not
Level of detail in simulation outputs
R99 to R99 Bearer, HSDPA to R99 Bearer and HSUPA to R99 Bearer Downgrading Allowed
Optional multiplicative factor
Cartography selection
AT271_SL3G_E0
Atoll 2.7.1
68
SIMULATION RESULTS (1)
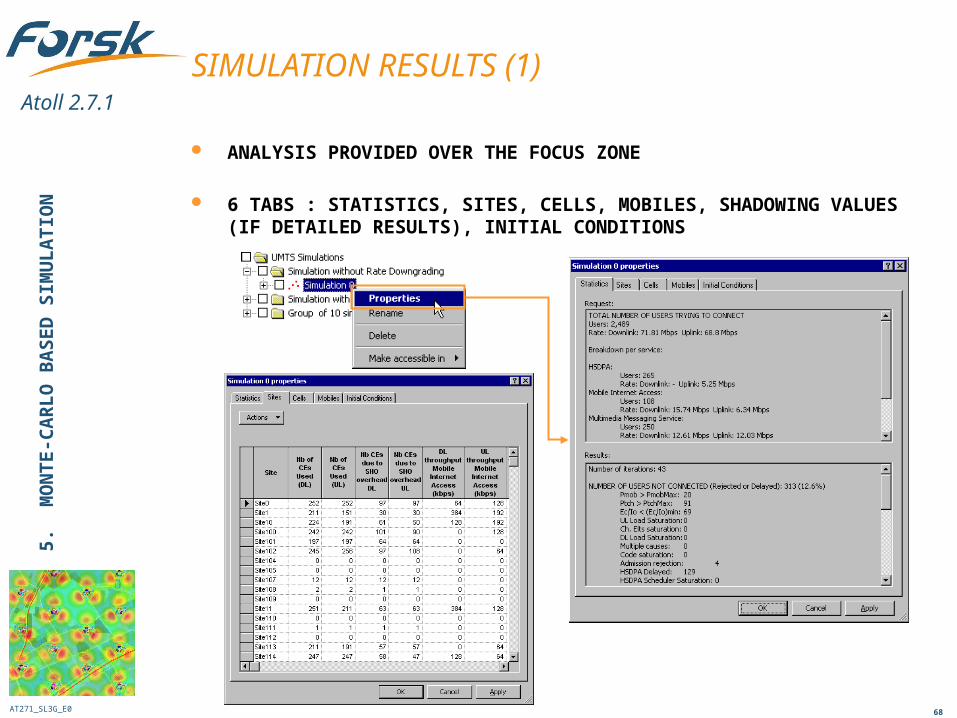
ANALYSIS PROVIDED OVER THE FOCUS ZONE
6 TABS : STATISTICS, SITES, CELLS, MOBILES, SHADOWING VALUES (IF DETAILED RESULTS), INITIAL CONDITIONS
5.
MO
NT
E-C
AR
LO
BA
SE
D S
IMU
LA
TIO
N
AT271_SL3G_E0
Atoll 2.7.1
69
SIMULATION RESULTS (2)5.
M
ON
TE
-CA
RL
O B
AS
ED
SIM
UL
AT
ION
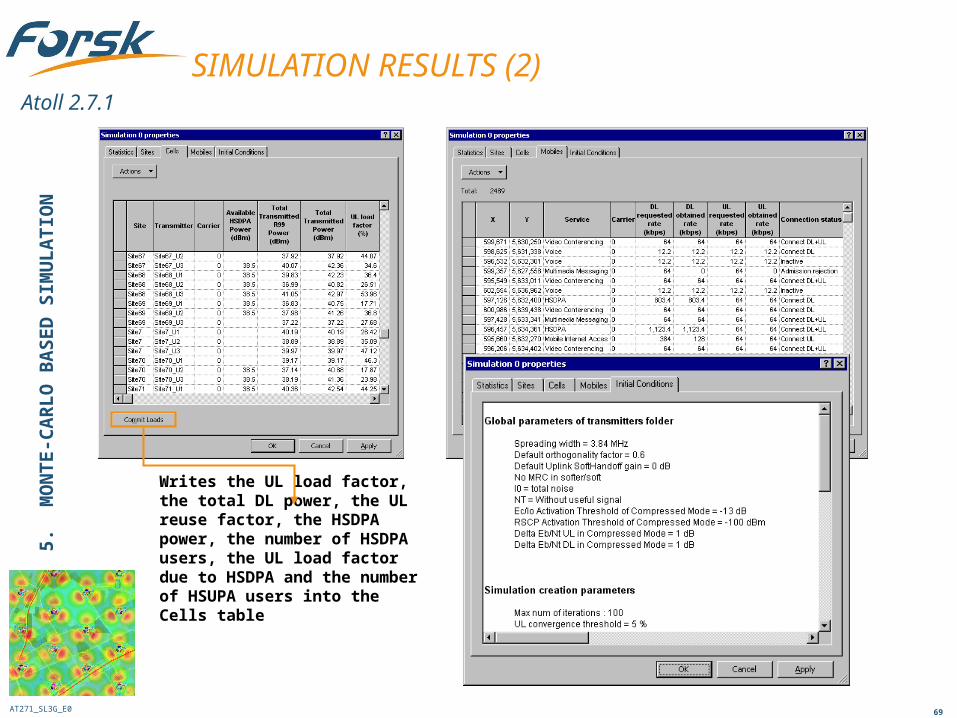
Writes the UL load factor, the total DL power, the UL reuse factor, the HSDPA power, the number of HSDPA users, the UL load factor due to HSDPA and the number of HSUPA users into the Cells table
AT271_SL3G_E0
Atoll 2.7.1
70
SIMULATION RESULTS (3)5.
M
ON
TE
-CA
RL
O B
AS
ED
SIM
UL
AT
ION
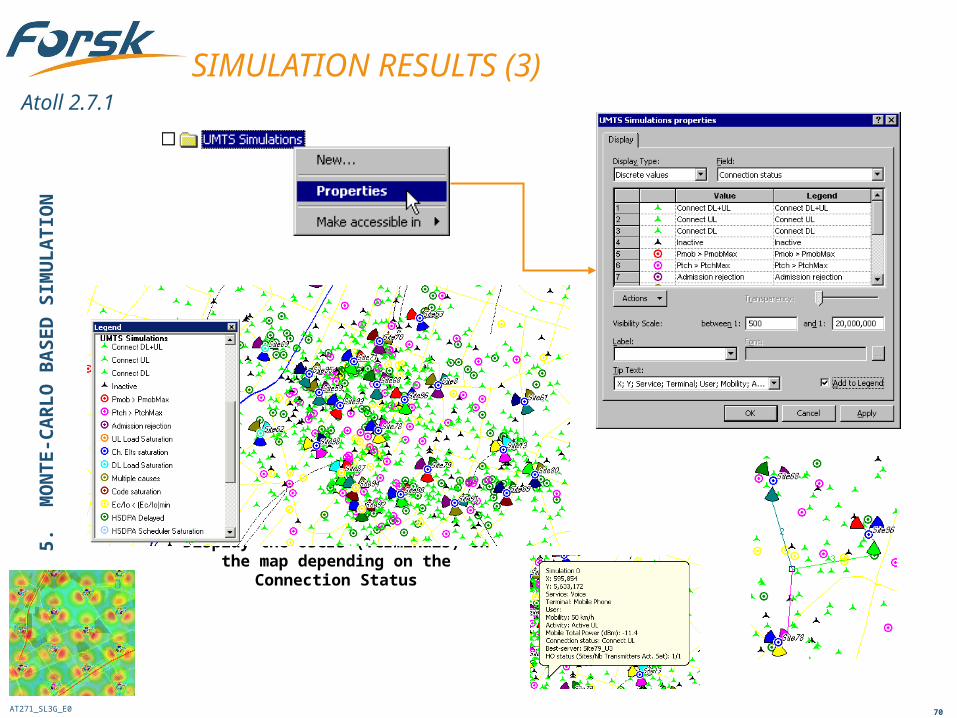
Display the Users (Terminals) on the map depending on the Connection Status
AT271_SL3G_E0
Atoll 2.7.1
71
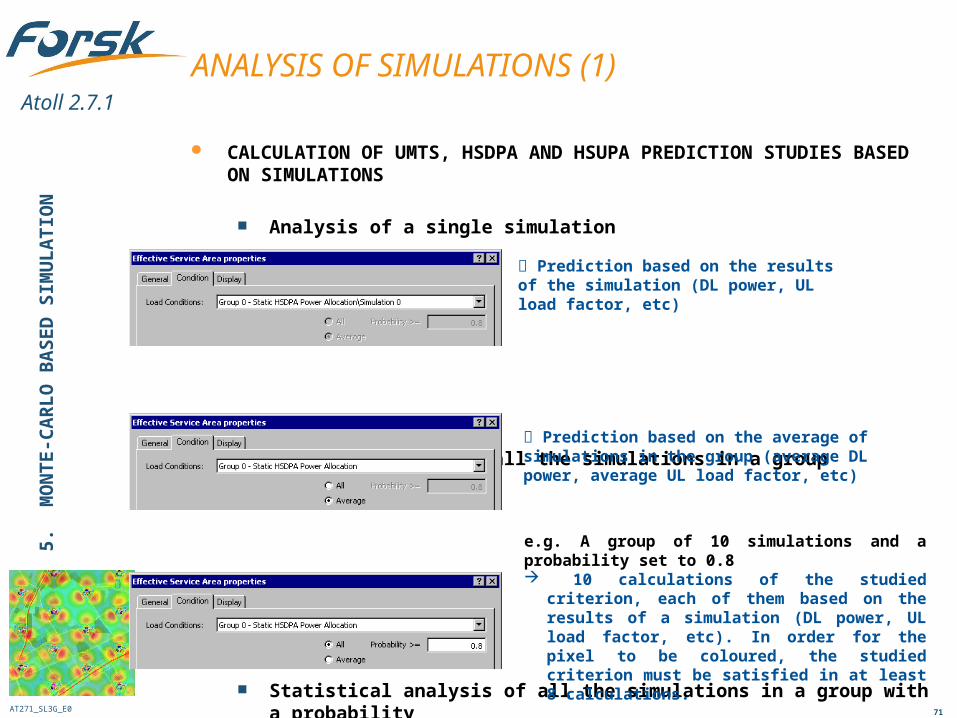
CALCULATION OF UMTS, HSDPA AND HSUPA PREDICTION STUDIES BASED ON SIMULATIONS
Analysis of a single simulation
Average analysis of all the simulations in a group
Statistical analysis of all the simulations in a group with a probability
ANALYSIS OF SIMULATIONS (1)5.
M
ON
TE
-CA
RL
O B
AS
ED
SIM
UL
AT
ION
Prediction based on the results of the simulation (DL power, UL load factor, etc)
Prediction based on the average of simulations in the group (average DL power, average UL load factor, etc)
e.g. A group of 10 simulations and a probability set to 0.8 10 calculations of the studied criterion, each of
them based on the results of a simulation (DL power, UL load factor, etc). In order for the pixel to be coloured, the studied criterion must be satisfied in at least 8 calculations.
AT271_SL3G_E0
Atoll 2.7.1
72
ANALYSIS OF SIMULATIONS (2)5.
M
ON
TE
-CA
RL
O B
AS
ED
SIM
UL
AT
ION
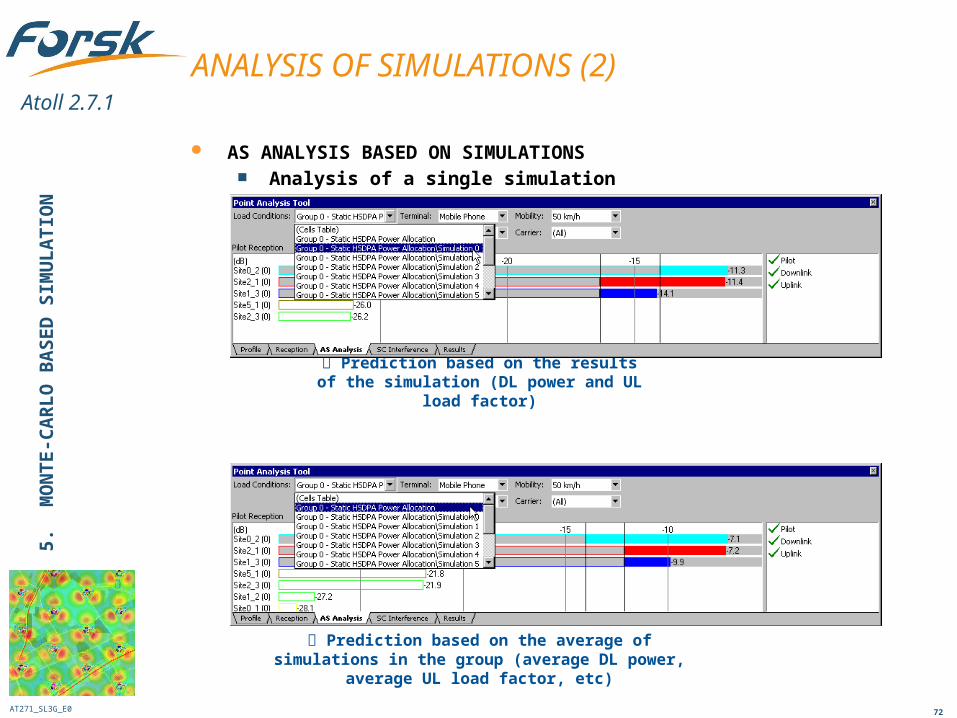
AS ANALYSIS BASED ON SIMULATIONS Analysis of a single simulation
Average analysis of all the simulations in a group
Prediction based on the results of the simulation (DL power and UL load factor)
Prediction based on the average of simulations in the group (average DL power, average UL load factor, etc)
AT271_SL3G_E0
Atoll 2.7.1
73
1. UMTS, HSDPA and HSUPA Concepts
2. 3G Workflow in Atoll
3. Modelling a UMTS HSPA Network
4. UMTS, HSDPA and HSUPA Predictions
5. Monte-Carlo Based Simulation
6. Neighbour Allocation
7. Scrambling Codes Planning
8. GSM/TDMA – UMTS Co-planning
9. Using Drive Tests
1. UMTS, HSDPA and HSUPA Concepts
2. 3G Workflow in Atoll
3. Modelling a UMTS HSPA Network
4. UMTS, HSDPA and HSUPA Predictions
5. Monte-Carlo Based Simulation
6. Neighbour Allocation
7. Scrambling Codes Planning
8. GSM/TDMA – UMTS Co-planning
9. Using Drive Tests
TRAINING PROGRAM
AT271_SL3G_E0
Atoll 2.7.1
74
6. NEIGHBOUR ALLOCATION
IMPORTING EXISTING NEIGHBOUR RELATIONSHIPS
NEIGHBOUR AUTOMATIC ALLOCATION
NEIGHBOUR GRAPHICAL DISPLAY
MODIFYING NEIGHBOUR RELATIONSHIPS MANUALLY
EXPORTING NEIGHBOUR RELATIONSHIPS
6.
NE
IGH
BO
UR
AL
LO
CA
TIO
N
AT271_SL3G_E0
Atoll 2.7.1
75
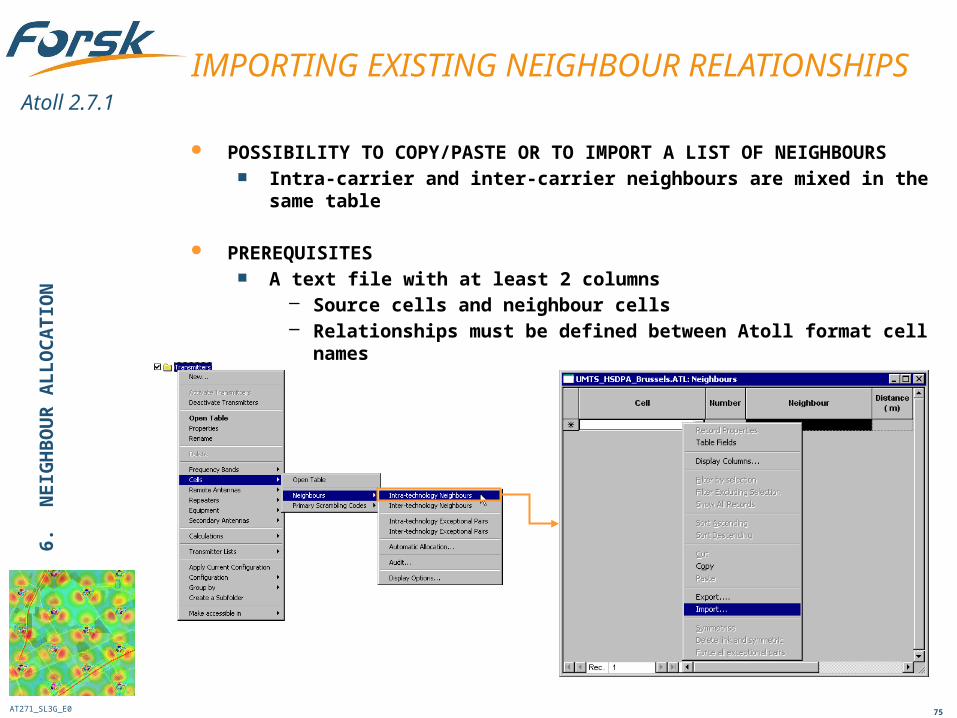
POSSIBILITY TO COPY/PASTE OR TO IMPORT A LIST OF NEIGHBOURS Intra-carrier and inter-carrier neighbours are mixed in the same table
PREREQUISITES A text file with at least 2 columns
– Source cells and neighbour cells– Relationships must be defined between Atoll format cell names
IMPORTING EXISTING NEIGHBOUR RELATIONSHIPS
6.
NE
IGH
BO
UR
AL
LO
CA
TIO
N
AT271_SL3G_E0
Atoll 2.7.1
76
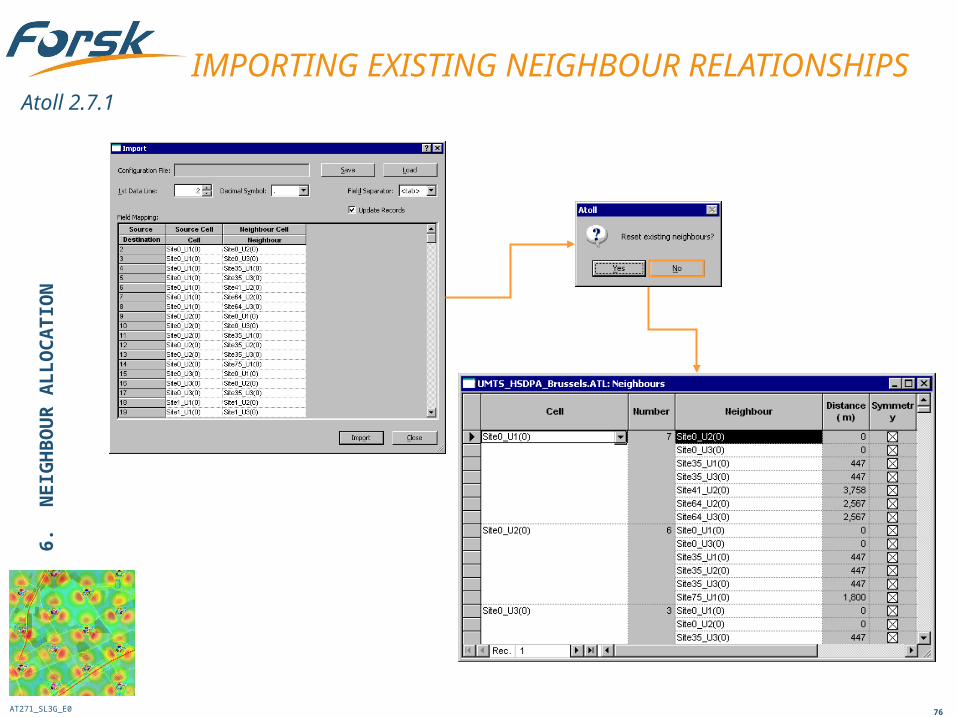
IMPORTING EXISTING NEIGHBOUR RELATIONSHIPS
6.
NE
IGH
BO
UR
AL
LO
CA
TIO
N
AT271_SL3G_E0
Atoll 2.7.1
77
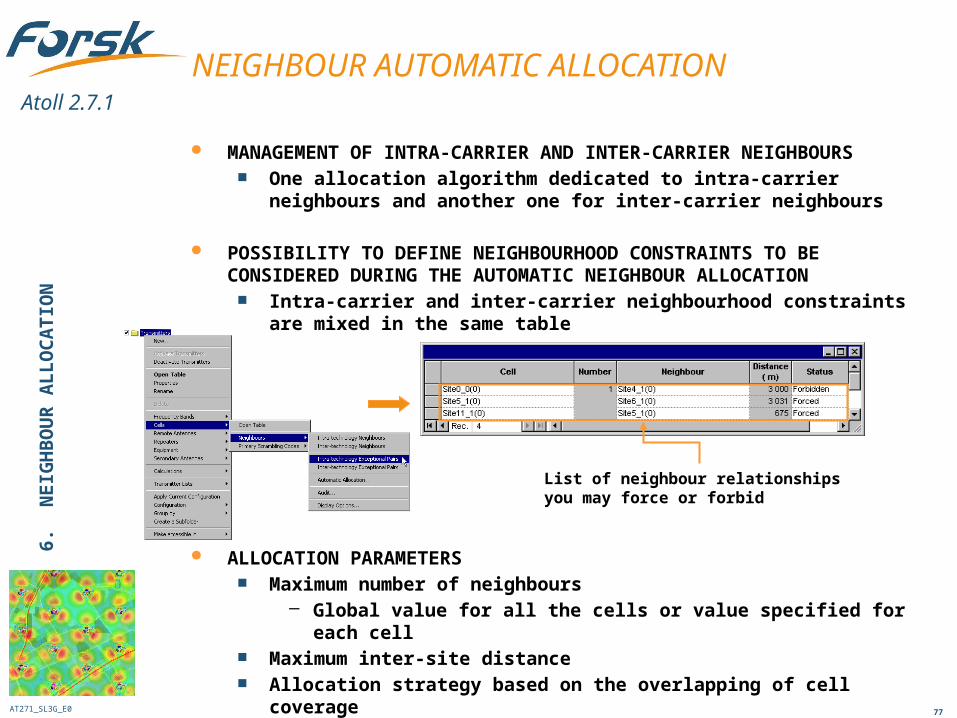
MANAGEMENT OF INTRA-CARRIER AND INTER-CARRIER NEIGHBOURS One allocation algorithm dedicated to intra-carrier neighbours and another
one for inter-carrier neighbours
POSSIBILITY TO DEFINE NEIGHBOURHOOD CONSTRAINTS TO BE CONSIDERED DURING THE AUTOMATIC NEIGHBOUR ALLOCATION
Intra-carrier and inter-carrier neighbourhood constraints are mixed in the same table
ALLOCATION PARAMETERS Maximum number of neighbours
– Global value for all the cells or value specified for each cell Maximum inter-site distance Allocation strategy based on the overlapping of cell coverage
List of neighbour relationships you may force or forbid
NEIGHBOUR AUTOMATIC ALLOCATION6.
N
EIG
HB
OU
R A
LL
OC
AT
ION
AT271_SL3G_E0
Atoll 2.7.1
78
NEIGHBOUR AUTOMATIC ALLOCATION
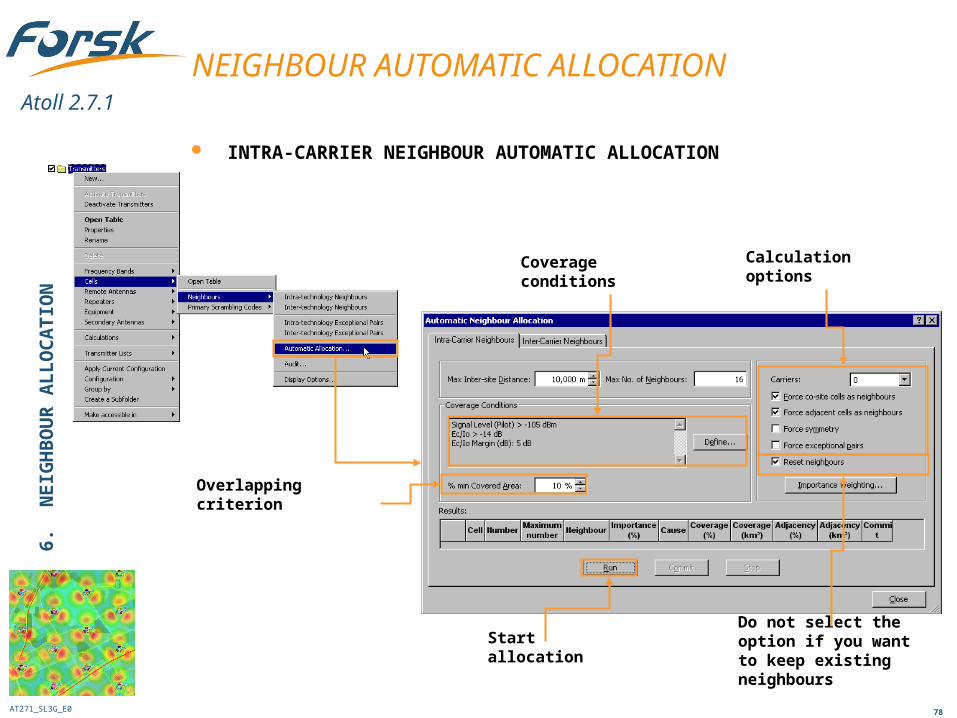
INTRA-CARRIER NEIGHBOUR AUTOMATIC ALLOCATION
6.
NE
IGH
BO
UR
AL
LO
CA
TIO
N
Coverage conditions
Overlapping criterion
Calculation options
Do not select the option if you want to keep existing neighbours
Start allocation
AT271_SL3G_E0
Atoll 2.7.1
79
NEIGHBOUR AUTOMATIC ALLOCATION
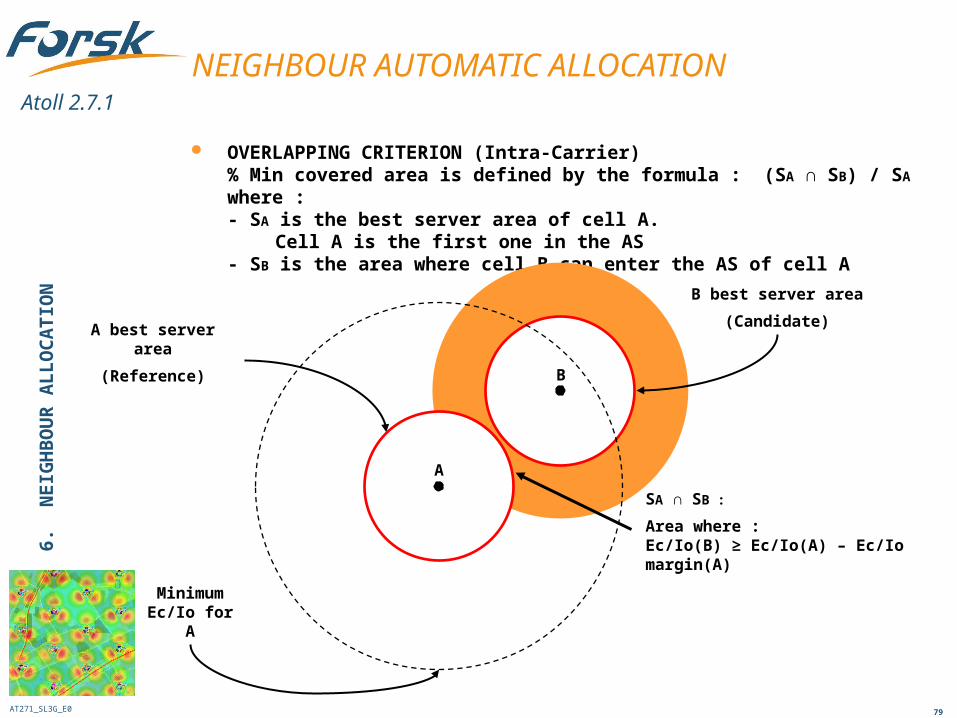
OVERLAPPING CRITERION (Intra-Carrier) % Min covered area is defined by the formula : (SA ∩ SB) / SA where :- SA is the best server area of cell A.
Cell A is the first one in the AS- SB is the area where cell B can enter the AS of cell A
B best server area
(Candidate)
A best server area
(Reference) B
Minimum Ec/Io for A
A
SA ∩ SB :
Area where :Ec/Io(B) ≥ Ec/Io(A) – Ec/Io margin(A)
6.
NE
IGH
BO
UR
AL
LO
CA
TIO
N
AT271_SL3G_E0
Atoll 2.7.1
80
NEIGHBOUR AUTOMATIC ALLOCATION
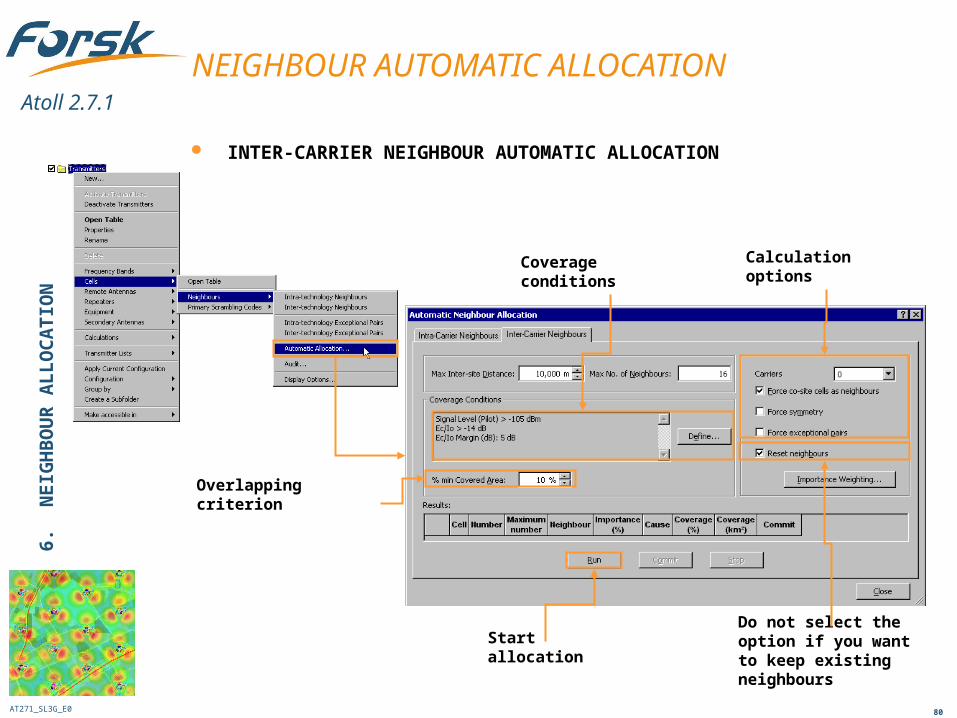
INTER-CARRIER NEIGHBOUR AUTOMATIC ALLOCATION
6.
NE
IGH
BO
UR
AL
LO
CA
TIO
N
Coverage conditions
Overlapping criterion
Calculation options
Do not select the option if you want to keep existing neighbours
Start allocation
AT271_SL3G_E0
Atoll 2.7.1
81
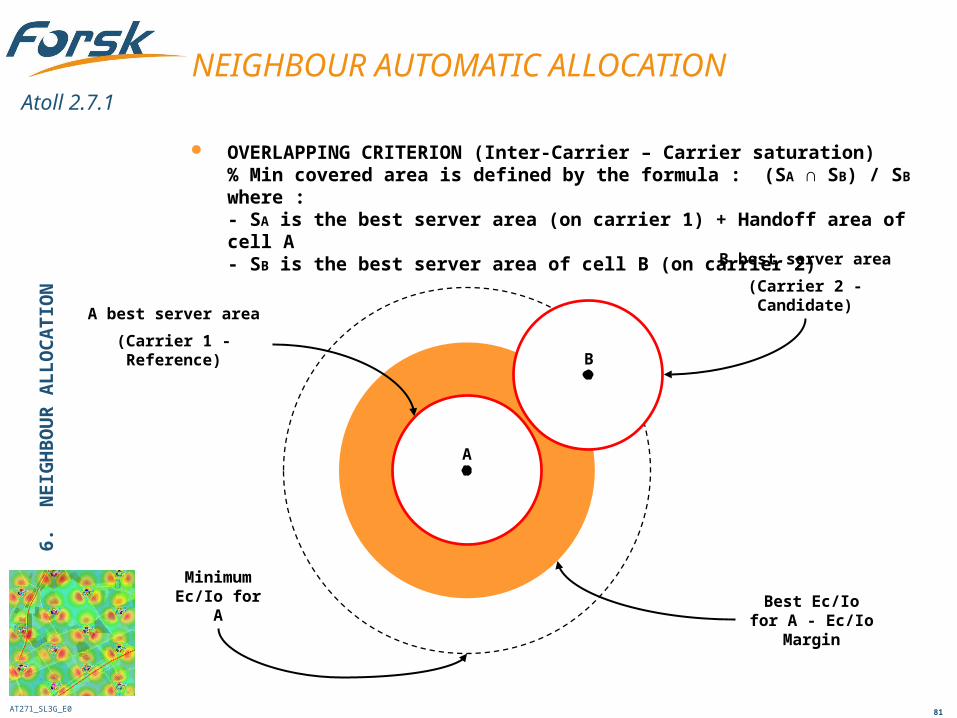
NEIGHBOUR AUTOMATIC ALLOCATION
OVERLAPPING CRITERION (Inter-Carrier – Carrier saturation) % Min covered area is defined by the formula : (SA ∩ SB) / SB where :- SA is the best server area (on carrier 1) + Handoff area of cell A- SB is the best server area of cell B (on carrier 2)
B best server area
(Carrier 2 - Candidate)
A best server area
(Carrier 1 - Reference) B
Minimum Ec/Io for A Best Ec/Io for A -
Ec/Io Margin
A
6.
NE
IGH
BO
UR
AL
LO
CA
TIO
N
AT271_SL3G_E0
Atoll 2.7.1
82
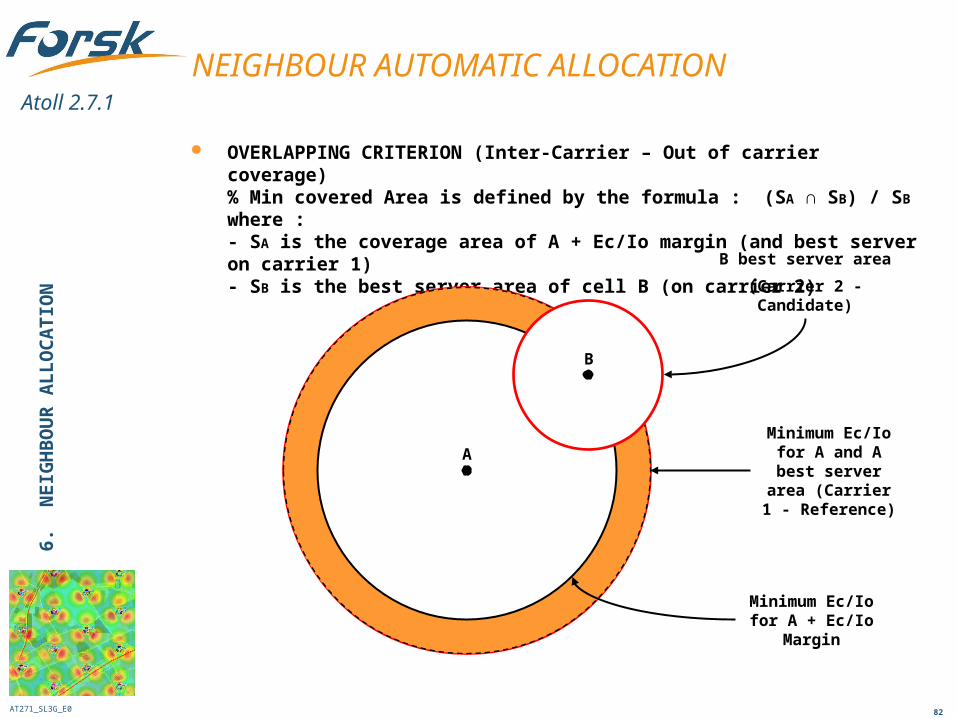
NEIGHBOUR AUTOMATIC ALLOCATION
OVERLAPPING CRITERION (Inter-Carrier – Out of carrier coverage) % Min covered Area is defined by the formula : (SA ∩ SB) / SB where :- SA is the coverage area of A + Ec/Io margin (and best server on carrier 1)- SB is the best server area of cell B (on carrier 2)
B best server area
(Carrier 2 - Candidate)
B
Minimum Ec/Io for A and A best
server area (Carrier 1 - Reference)
Minimum Ec/Io for A + Ec/Io
Margin
A
6.
NE
IGH
BO
UR
AL
LO
CA
TIO
N
AT271_SL3G_E0
Atoll 2.7.1
83
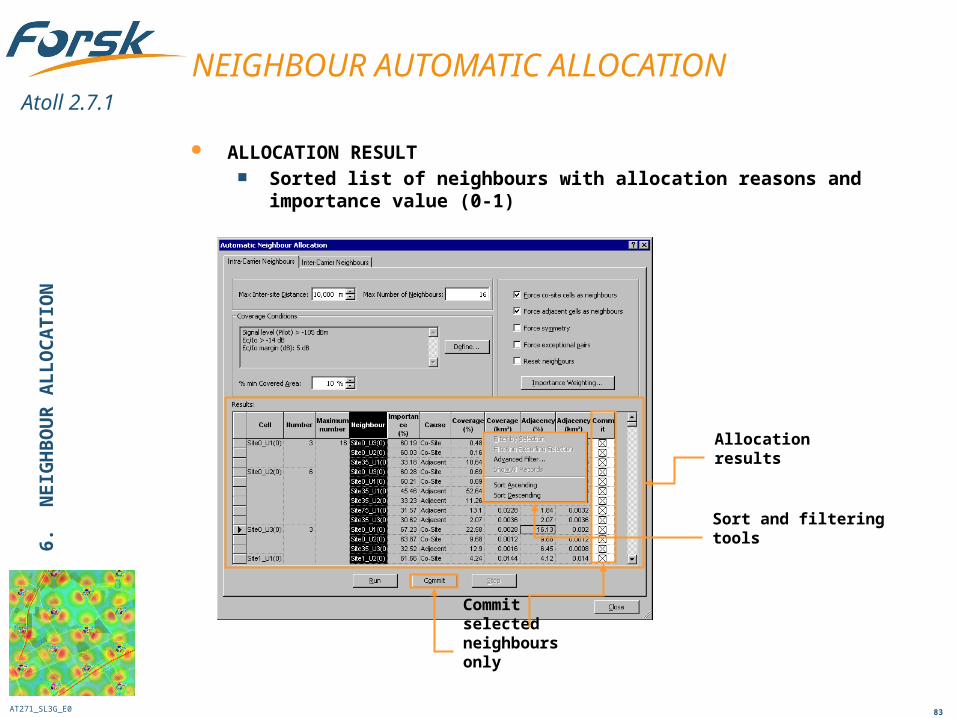
NEIGHBOUR AUTOMATIC ALLOCATION
ALLOCATION RESULT Sorted list of neighbours with allocation reasons and importance value
(0-1)
6.
NE
IGH
BO
UR
AL
LO
CA
TIO
N
Commit selected neighbours only
Allocation results
Sort and filtering tools
AT271_SL3G_E0
Atoll 2.7.1
84
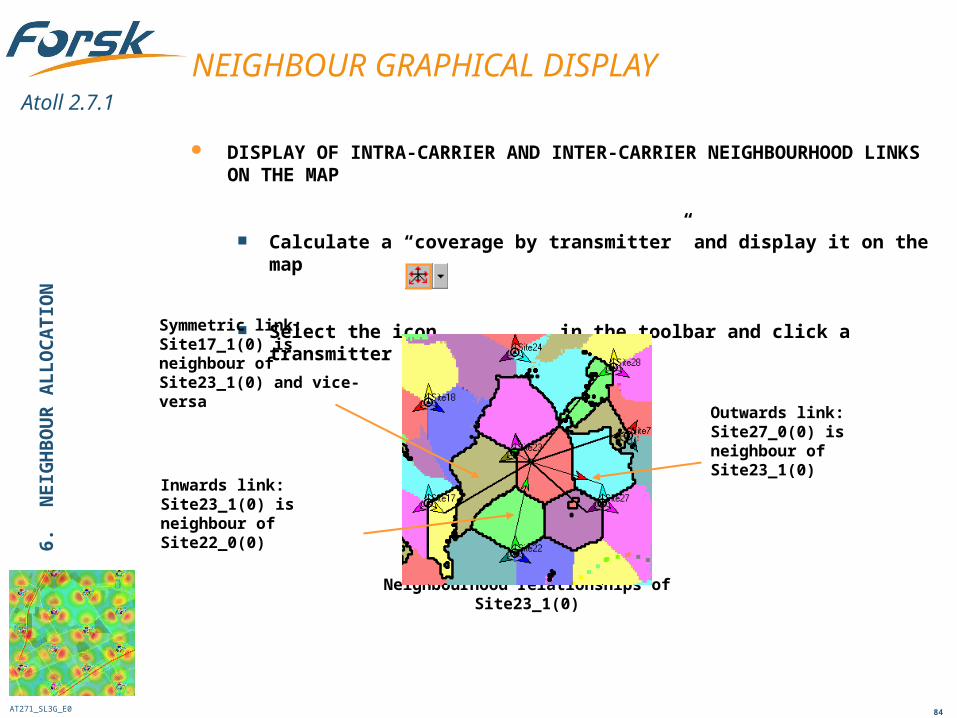
NEIGHBOUR GRAPHICAL DISPLAY
DISPLAY OF INTRA-CARRIER AND INTER-CARRIER NEIGHBOURHOOD LINKS ON THE MAP
Calculate a “coverage by transmitter” and display it on the map
Select the icon in the toolbar and click a transmitter on the map
Inwards link: Site23_1(0) is neighbour of Site22_0(0)
Symmetric link: Site17_1(0) is neighbour of Site23_1(0) and vice-versa
Outwards link: Site27_0(0) is neighbour of Site23_1(0)
Neighbourhood relationships of Site23_1(0)
6.
NE
IGH
BO
UR
AL
LO
CA
TIO
N
AT271_SL3G_E0
Atoll 2.7.1
85
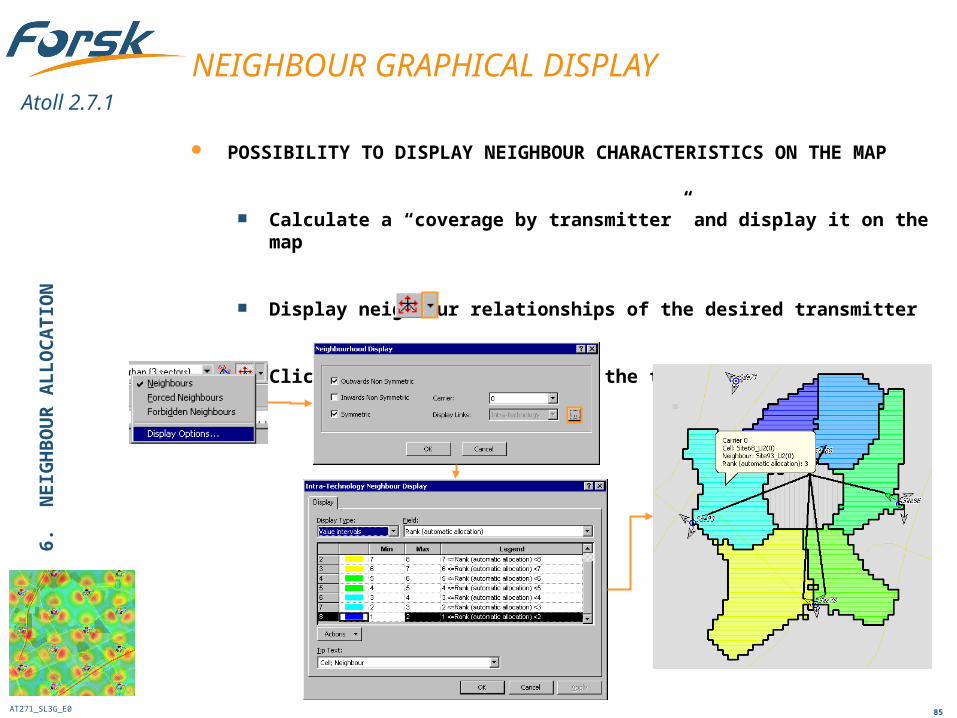
NEIGHBOUR GRAPHICAL DISPLAY
POSSIBILITY TO DISPLAY NEIGHBOUR CHARACTERISTICS ON THE MAP
Calculate a “coverage by transmitter” and display it on the map
Display neighbour relationships of the desired transmitter
Click the icon from the toolbar
6.
NE
IGH
BO
UR
AL
LO
CA
TIO
N
AT271_SL3G_E0
Atoll 2.7.1
86
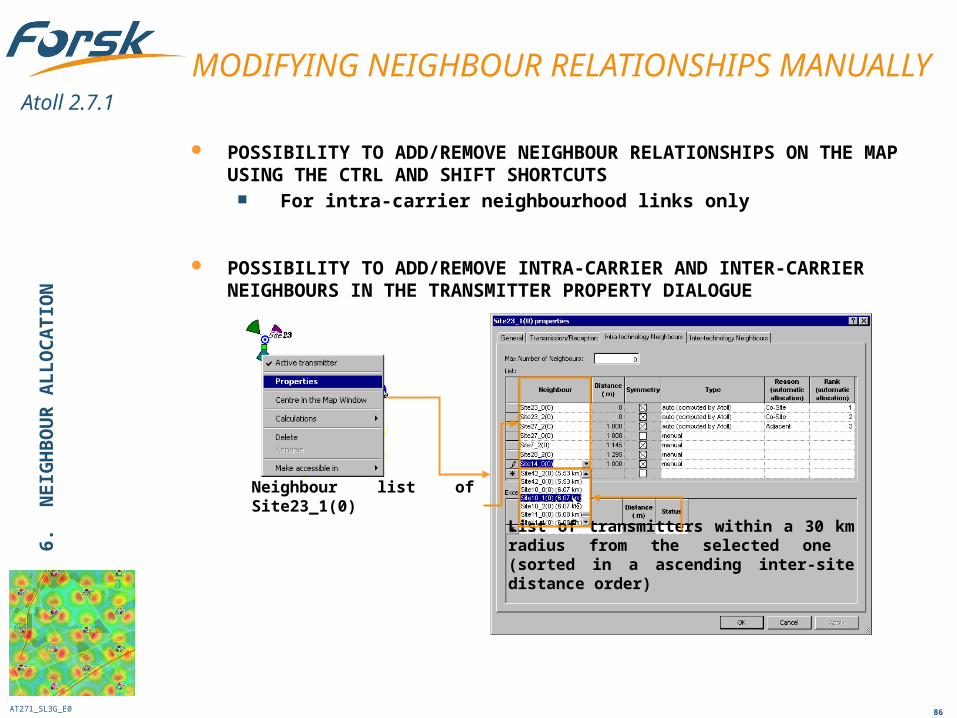
POSSIBILITY TO ADD/REMOVE NEIGHBOUR RELATIONSHIPS ON THE MAP USING THE CTRL AND SHIFT SHORTCUTS
For intra-carrier neighbourhood links only
POSSIBILITY TO ADD/REMOVE INTRA-CARRIER AND INTER-CARRIER NEIGHBOURS IN THE TRANSMITTER PROPERTY DIALOGUE
MODIFYING NEIGHBOUR RELATIONSHIPS MANUALLY
6.
NE
IGH
BO
UR
AL
LO
CA
TIO
N
List of transmitters within a 30 km radius from the selected one (sorted in a ascending inter-site distance order)
Neighbour list of Site23_1(0)
AT271_SL3G_E0
Atoll 2.7.1
87
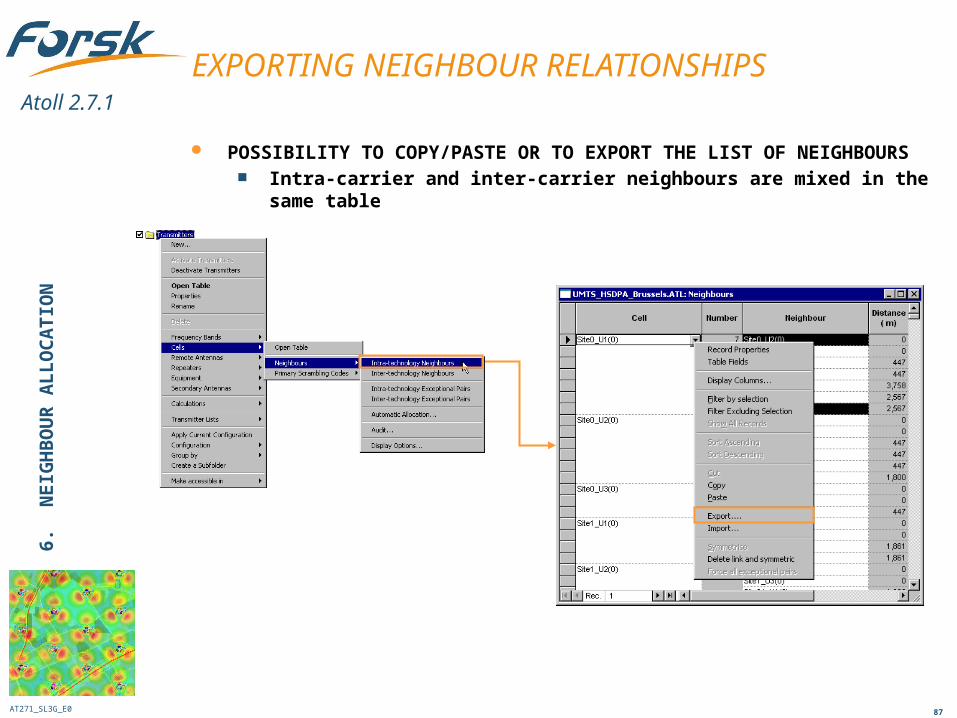
EXPORTING NEIGHBOUR RELATIONSHIPS
POSSIBILITY TO COPY/PASTE OR TO EXPORT THE LIST OF NEIGHBOURS Intra-carrier and inter-carrier neighbours are mixed in the same table
6.
NE
IGH
BO
UR
AL
LO
CA
TIO
N
AT271_SL3G_E0
Atoll 2.7.1
88
1. UMTS, HSDPA and HSUPA Concepts
2. 3G Workflow in Atoll
3. Modelling a UMTS HSPA Network
4. UMTS, HSDPA and HSUPA Predictions
5. Monte-Carlo Based Simulation
6. Neighbour Allocation
7. Scrambling Codes Planning
8. GSM/TDMA – UMTS Co-planning
9. Using Drive Tests
1. UMTS, HSDPA and HSUPA Concepts
2. 3G Workflow in Atoll
3. Modelling a UMTS HSPA Network
4. UMTS, HSDPA and HSUPA Predictions
5. Monte-Carlo Based Simulation
6. Neighbour Allocation
7. Scrambling Codes Planning
8. GSM/TDMA – UMTS Co-planning
9. Using Drive Tests
TRAINING PROGRAM
AT271_SL3G_E0
Atoll 2.7.1
89
7. SCRAMBLING CODE PLANNING
GENERAL SETTINGS
AUTOMATIC ALLOCATION
SCRAMBLING CODE SEARCH TOOL
SCRAMBLING CODE HISTOGRAMS
SCRAMBLING CODE INTERFERENCE ZONE PREDICTION
7.
SC
RA
MB
LIN
G C
OD
E P
LA
NN
ING
AT271_SL3G_E0
Atoll 2.7.1
90
GENERAL SETTINGS
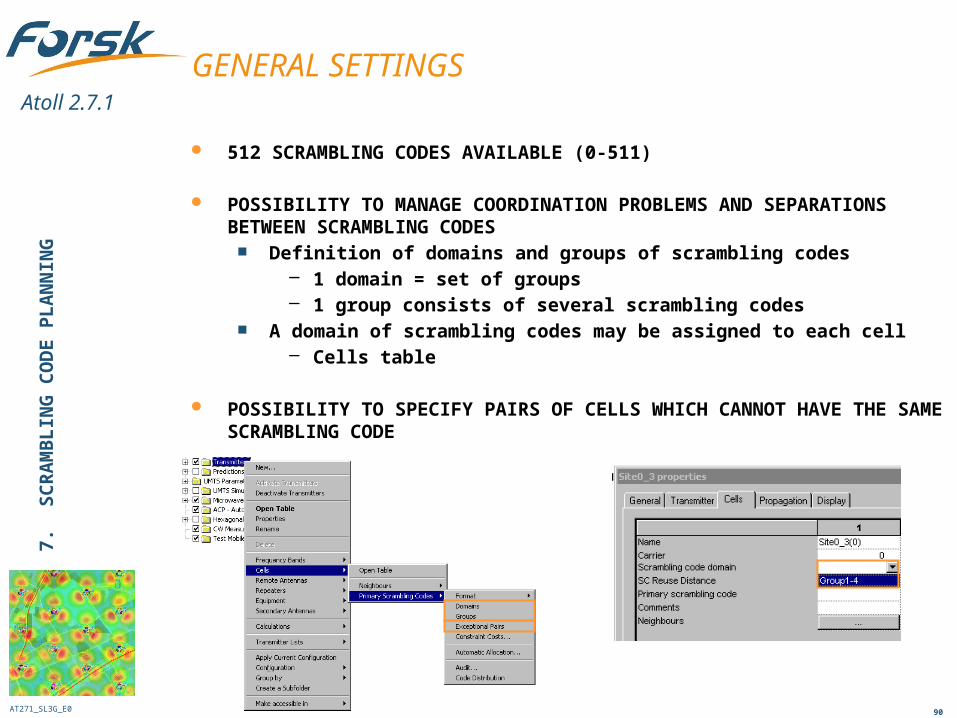
512 SCRAMBLING CODES AVAILABLE (0-511)
POSSIBILITY TO MANAGE COORDINATION PROBLEMS AND SEPARATIONS BETWEEN SCRAMBLING CODES
Definition of domains and groups of scrambling codes– 1 domain = set of groups– 1 group consists of several scrambling codes
A domain of scrambling codes may be assigned to each cell – Cells table
POSSIBILITY TO SPECIFY PAIRS OF CELLS WHICH CANNOT HAVE THE SAME SCRAMBLING CODE
7.
SC
RA
MB
LIN
G C
OD
E P
LA
NN
ING
AT271_SL3G_E0
Atoll 2.7.1
91
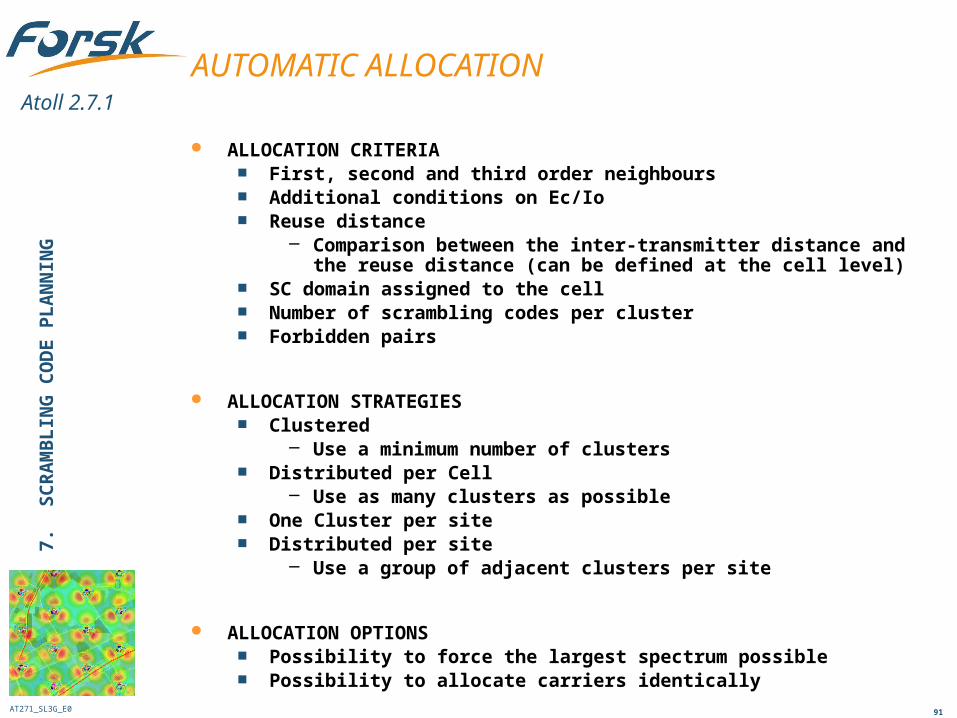
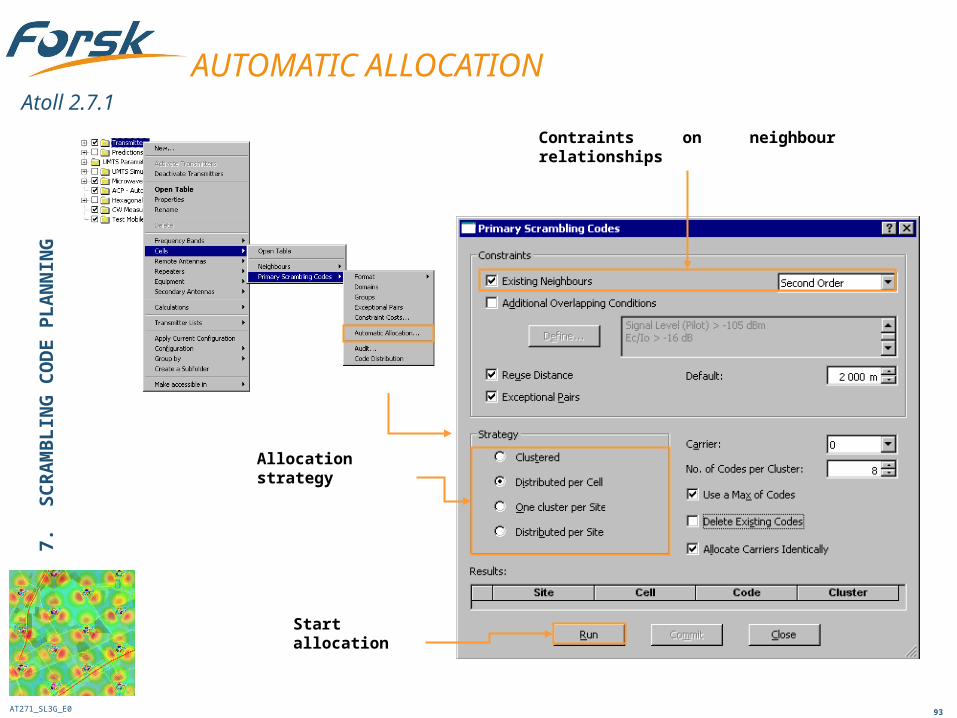
ALLOCATION CRITERIA First, second and third order neighbours Additional conditions on Ec/Io Reuse distance
– Comparison between the inter-transmitter distance and the reuse distance (can be defined at the cell level)
SC domain assigned to the cell Number of scrambling codes per cluster Forbidden pairs
ALLOCATION STRATEGIES Clustered
– Use a minimum number of clusters Distributed per Cell
– Use as many clusters as possible One Cluster per site Distributed per site
– Use a group of adjacent clusters per site
ALLOCATION OPTIONS Possibility to force the largest spectrum possible Possibility to allocate carriers identically
AUTOMATIC ALLOCATION7.
S
CR
AM
BL
ING
CO
DE
PL
AN
NIN
G
AT271_SL3G_E0
Atoll 2.7.1
92
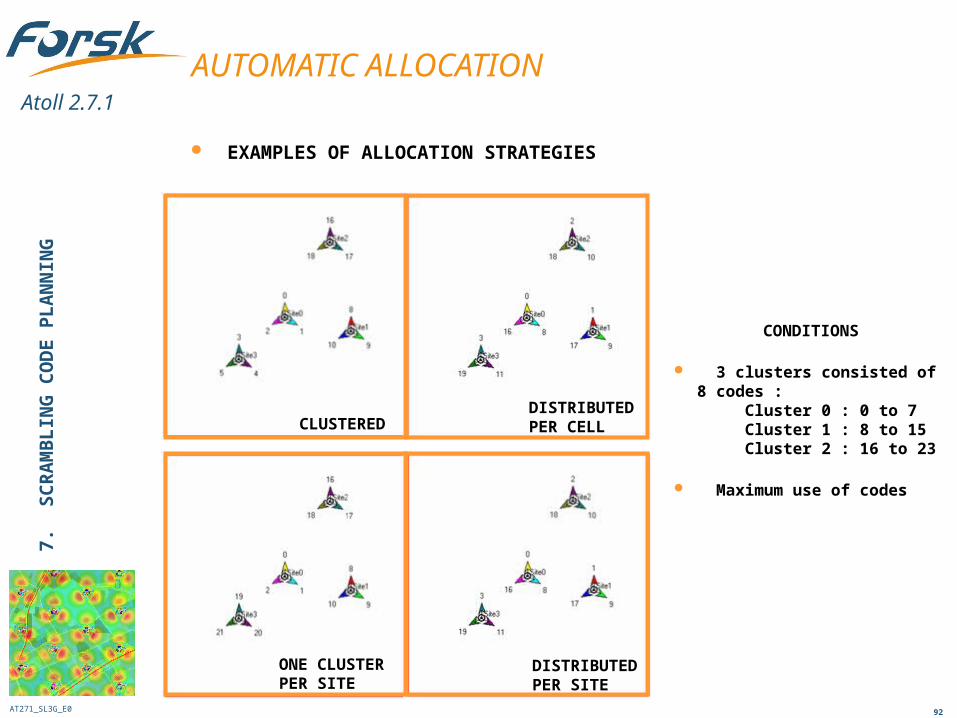
EXAMPLES OF ALLOCATION STRATEGIES
AUTOMATIC ALLOCATION7.
S
CR
AM
BL
ING
CO
DE
PL
AN
NIN
G
CLUSTEREDDISTRIBUTED PER CELL
ONE CLUSTER PER SITE
DISTRIBUTED PER SITE
CONDITIONS
3 clusters consisted of 8 codes : Cluster 0 : 0 to 7 Cluster 1 : 8 to 15 Cluster 2 : 16 to 23
Maximum use of codes
AT271_SL3G_E0
Atoll 2.7.1
93
AUTOMATIC ALLOCATION7.
S
CR
AM
BL
ING
CO
DE
PL
AN
NIN
G
Allocation strategy
Start allocation
Contraints on neighbour relationships
AT271_SL3G_E0
Atoll 2.7.1
94
AUTOMATIC ALLOCATION7.
S
CR
AM
BL
ING
CO
DE
PL
AN
NIN
G
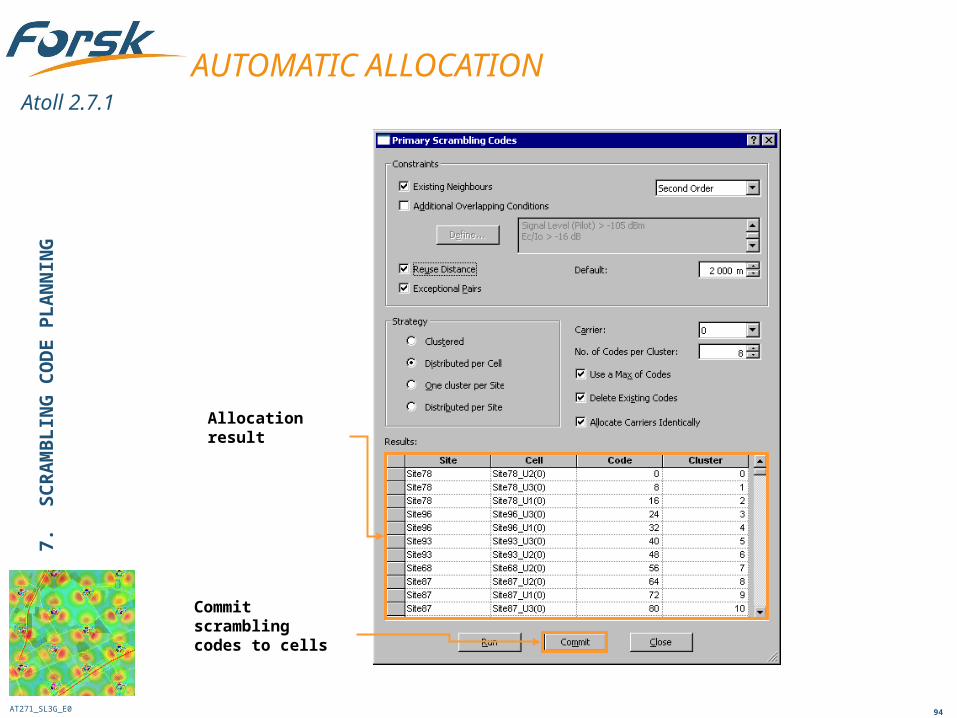
Commit scrambling codes to cells
Allocation result
AT271_SL3G_E0
Atoll 2.7.1
95
SCRAMBLING CODE SEARCH TOOL
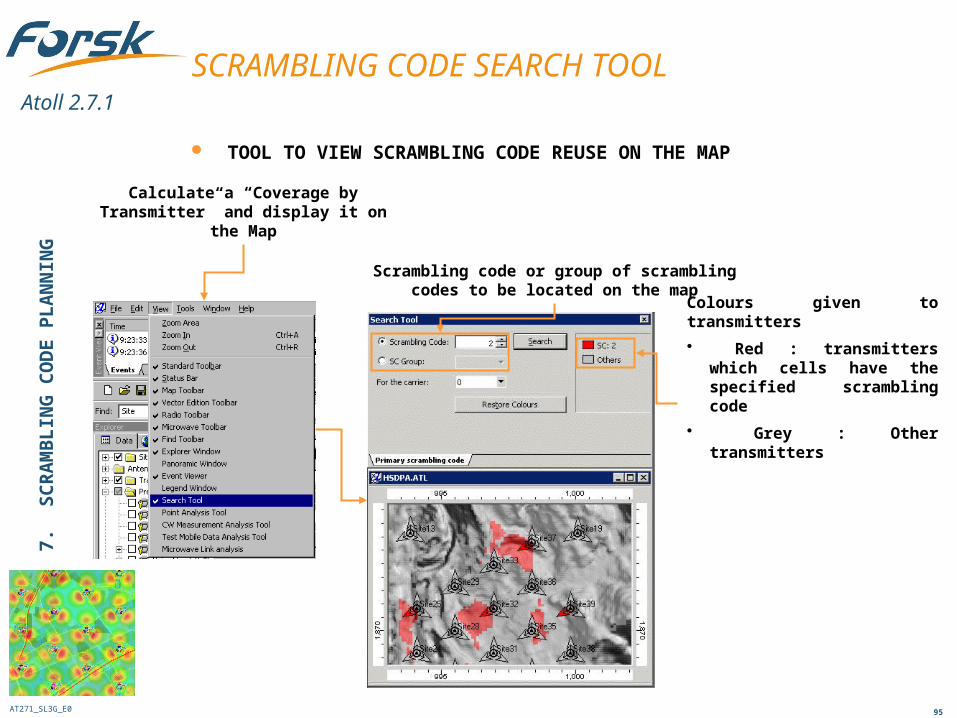
TOOL TO VIEW SCRAMBLING CODE REUSE ON THE MAP
7.
SC
RA
MB
LIN
G C
OD
E P
LA
NN
ING
Calculate a “Coverage by Transmitter” and display it on the Map
Colours given to transmitters
• Red : transmitters which cells have the specified scrambling code
• Grey : Other transmitters
Scrambling code or group of scrambling codes to be located on the map
AT271_SL3G_E0
Atoll 2.7.1
96
SCRAMBLING CODE HISTOGRAMS
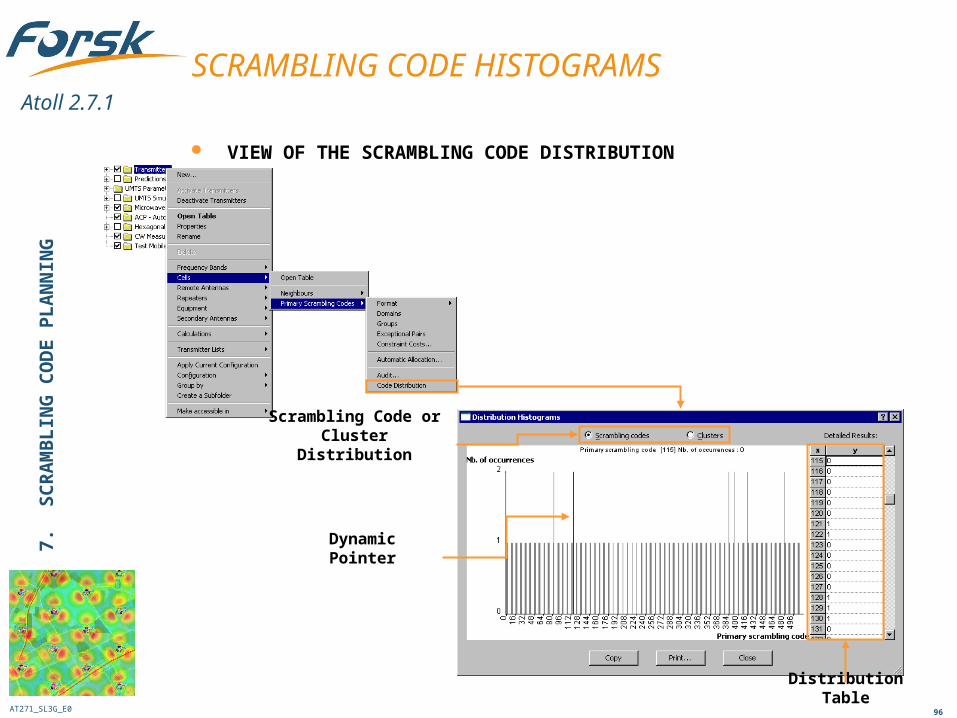
VIEW OF THE SCRAMBLING CODE DISTRIBUTION
7.
SC
RA
MB
LIN
G C
OD
E P
LA
NN
ING
Scrambling Code or Cluster Distribution
Distribution Table
Dynamic Pointer
AT271_SL3G_E0
Atoll 2.7.1
97
SCRAMBLING CODE INTERFERENCE ZONE PREDICTION
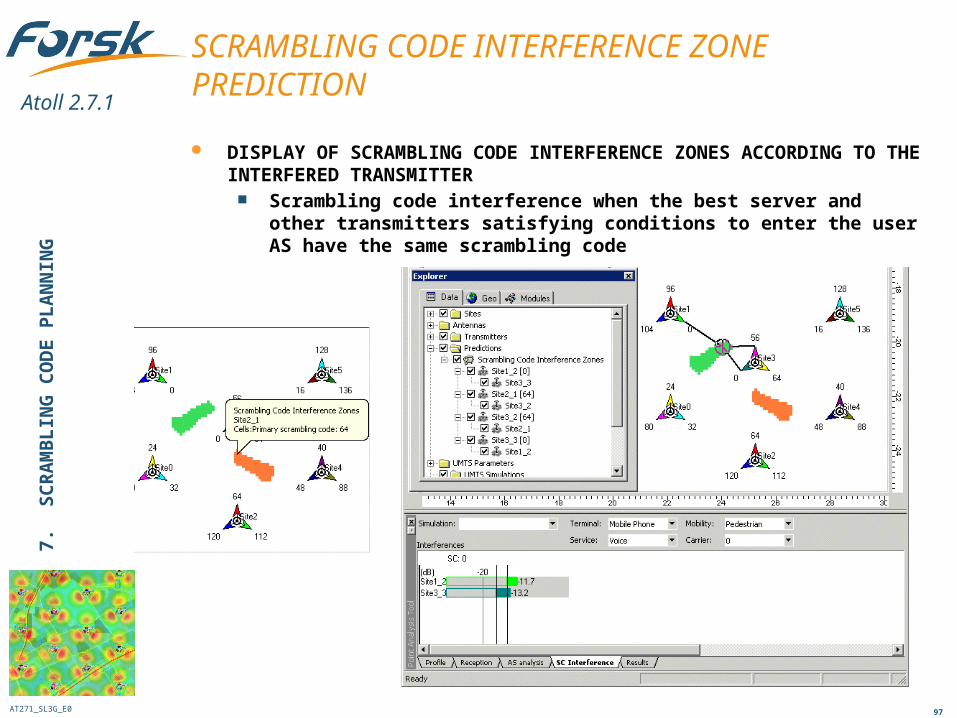
DISPLAY OF SCRAMBLING CODE INTERFERENCE ZONES ACCORDING TO THE INTERFERED TRANSMITTER
Scrambling code interference when the best server and other transmitters satisfying conditions to enter the user AS have the same scrambling code
7.
SC
RA
MB
LIN
G C
OD
E P
LA
NN
ING
AT271_SL3G_E0
Atoll 2.7.1
98
1. UMTS, HSDPA and HSUPA Concepts
2. 3G Workflow in Atoll
3. Modelling a UMTS HSPA Network
4. UMTS, HSDPA and HSUPA Predictions
5. Monte-Carlo Based Simulation
6. Neighbour Allocation
7. Scrambling Codes Planning
8. GSM/TDMA – UMTS Co-planning
9. Using Drive Tests
1. UMTS, HSDPA and HSUPA Concepts
2. 3G Workflow in Atoll
3. Modelling a UMTS HSPA Network
4. UMTS, HSDPA and HSUPA Predictions
5. Monte-Carlo Based Simulation
6. Neighbour Allocation
7. Scrambling Codes Planning
8. GSM/TDMA – UMTS Co-planning
9. Using Drive Tests
TRAINING PROGRAM
AT271_SL3G_E0
Atoll 2.7.1
99
8. GSM/TDMA-UMTS CO-PLANNING
LINKING GSM AND UMTS PROJECTS
CREATING A UMTS TRANSMITTER FROM A GSM ONE
IMPORTING EXISTING NEIGHBOUR RELATIONSHIPS
NEIGHBOUR AUTOMATIC ALLOCATION
NEIGHBOUR GRAPHICAL DISPLAY
MODIFYING NEIGHBOUR RELATIONSHIPS MANUALLY8.
GS
M/T
DM
A-U
MT
S C
O-P
LA
NN
ING
AT271_SL3G_E0
Atoll 2.7.1
100
LINKING GSM AND UMTS PROJECTS
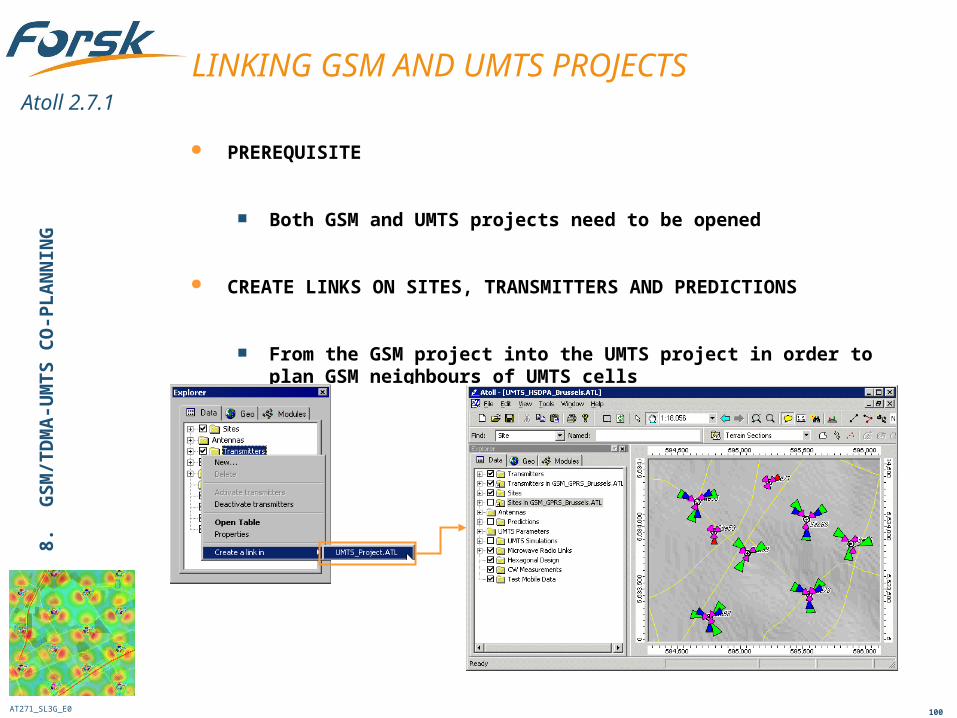
PREREQUISITE
Both GSM and UMTS projects need to be opened
CREATE LINKS ON SITES, TRANSMITTERS AND PREDICTIONS
From the GSM project into the UMTS project in order to plan GSM neighbours of UMTS cells
8.
GS
M/T
DM
A-U
MT
S C
O-P
LA
NN
ING
AT271_SL3G_E0
Atoll 2.7.1
101
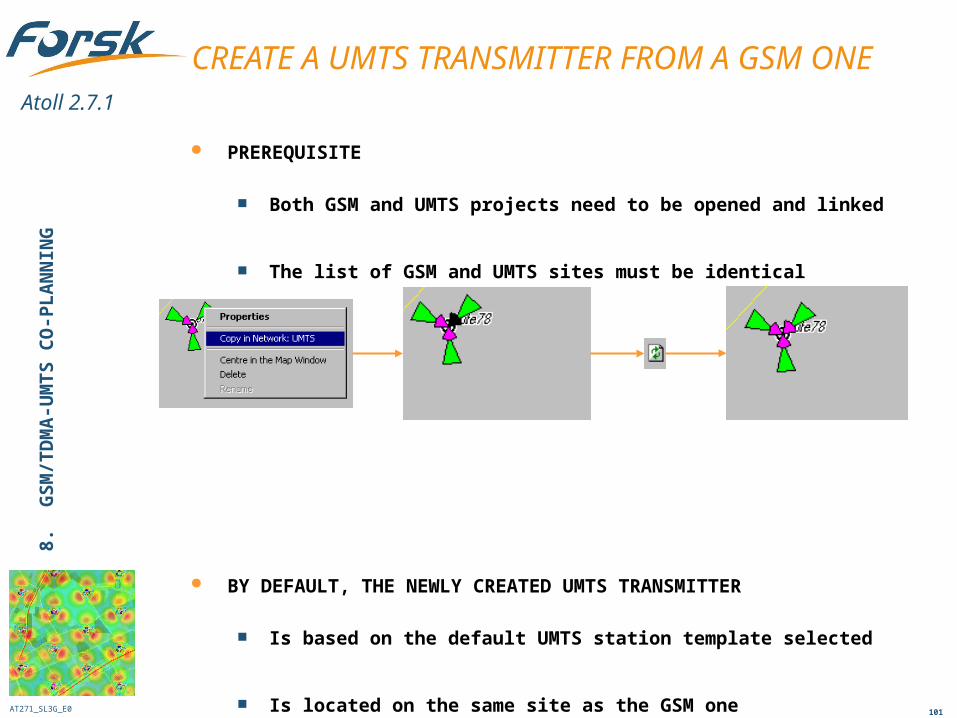
CREATE A UMTS TRANSMITTER FROM A GSM ONE
PREREQUISITE
Both GSM and UMTS projects need to be opened and linked
The list of GSM and UMTS sites must be identical
BY DEFAULT, THE NEWLY CREATED UMTS TRANSMITTER
Is based on the default UMTS station template selected
Is located on the same site as the GSM one
Has same antenna height, azimuth and mechanical tilt (these can then be adjusted if desired)
8.
GS
M/T
DM
A-U
MT
S C
O-P
LA
NN
ING

AT271_SL3G_E0
Atoll 2.7.1
102
POSSIBILITY TO COPY/PASTE OR TO IMPORT A LIST OF NEIGHBOURS IN THE INTER-TECHNOLOGY NEIGHBOURS TABLE
PREREQUISITE A text file with at least 2 columns
– Source cells and neighbour cells– Relationships must be defined between Atoll format cell names
IMPORTING EXISTING NEIGHBOUR RELATIONSHIPS
8.
GS
M/T
DM
A-U
MT
S C
O-P
LA
NN
ING
AT271_SL3G_E0
Atoll 2.7.1
103
NEIGHBOUR AUTOMATIC ALLOCATION
PREREQUISITE Existing link on the Transmitters folder of the GSM .atl document into the
UMTS .atl document
POSSIBILITY TO DEFINE NEIGHBOURHOOD CONSTRAINTS TO BE CONSIDERED DURING THE AUTOMATIC NEIGHBOUR ALLOCATION (INTER-TECHNOLOGY EXCEPTIONAL PAIRS)
ALLOCATION PARAMETERS Maximum number of neighbours
– Global value for all the cells or value specified for each cell Maximum inter-site distance 2 allocation strategies
– Based on distance– Based on overlapping of GSM and UMTS cell coverage
8.
GS
M/T
DM
A-U
MT
S C
O-P
LA
NN
ING
AT271_SL3G_E0
Atoll 2.7.1
104
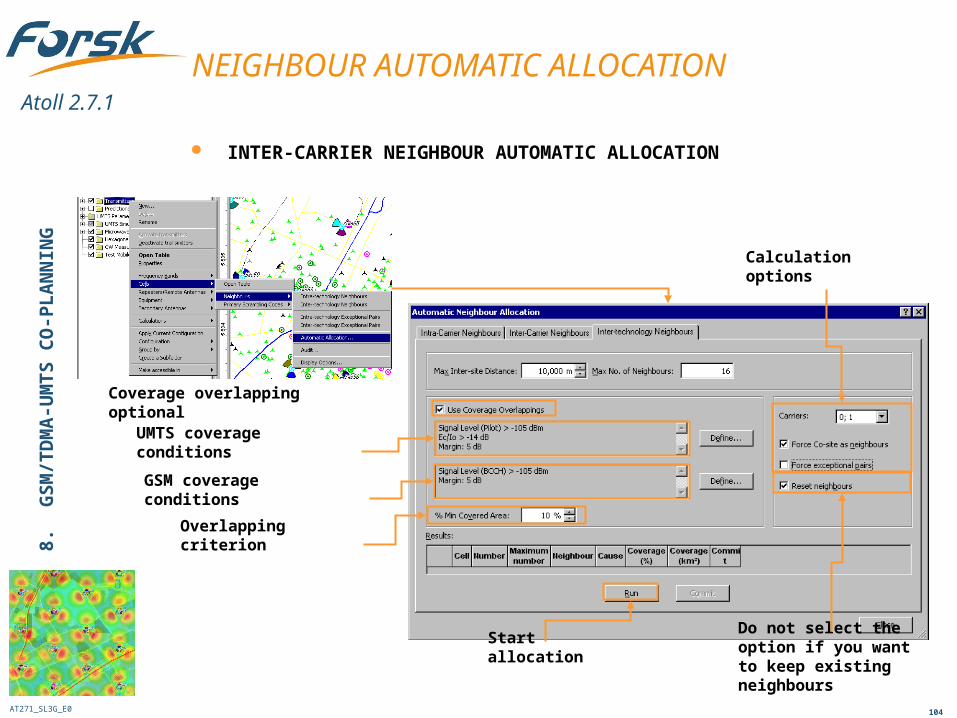
NEIGHBOUR AUTOMATIC ALLOCATION
INTER-CARRIER NEIGHBOUR AUTOMATIC ALLOCATION
UMTS coverage conditions
Overlapping criterion
Calculation options
Do not select the option if you want to keep existing neighbours
Start allocation
GSM coverage conditions
Coverage overlapping optional
8.
GS
M/T
DM
A-U
MT
S C
O-P
LA
NN
ING
AT271_SL3G_E0
Atoll 2.7.1
105
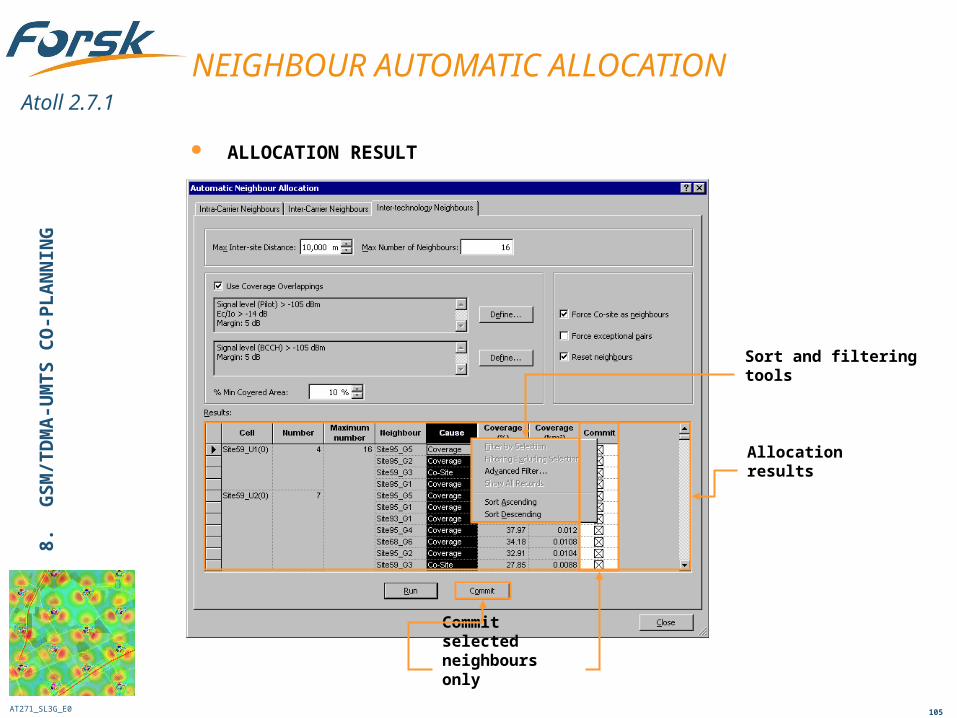
NEIGHBOUR AUTOMATIC ALLOCATION
ALLOCATION RESULT
Sort and filtering tools
Commit selected neighbours only
Allocation results
8.
GS
M/T
DM
A-U
MT
S C
O-P
LA
NN
ING
AT271_SL3G_E0
Atoll 2.7.1
106
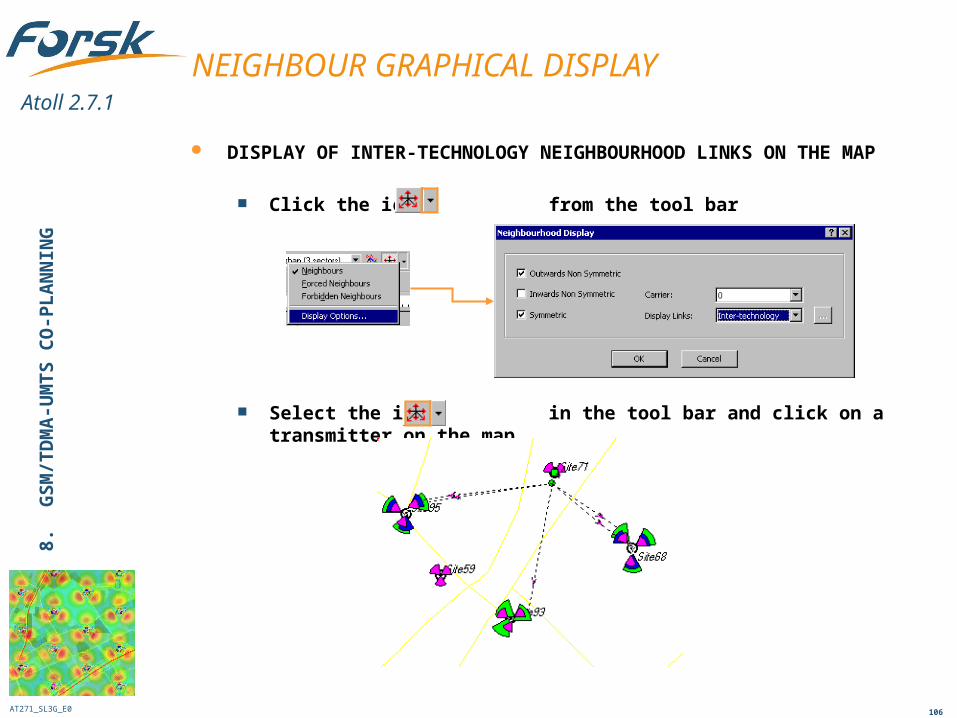
DISPLAY OF INTER-TECHNOLOGY NEIGHBOURHOOD LINKS ON THE MAP
Click the icon from the tool bar
Select the icon in the tool bar and click on a transmitter on the map
NEIGHBOUR GRAPHICAL DISPLAY8.
G
SM
/TD
MA
-UM
TS
CO
-PL
AN
NIN
G
AT271_SL3G_E0
Atoll 2.7.1
107
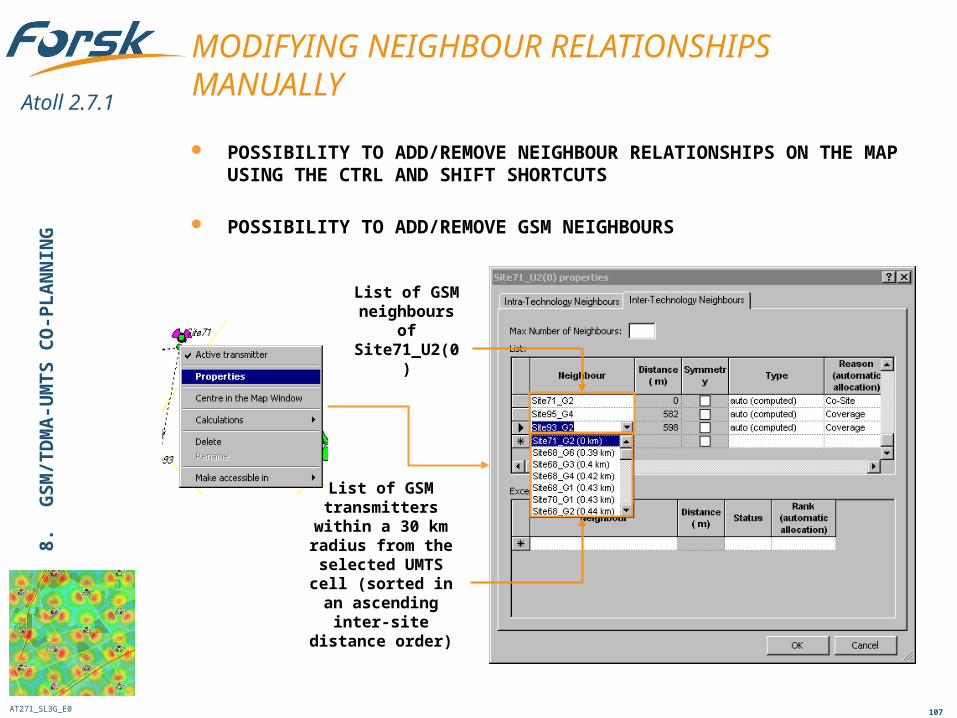
POSSIBILITY TO ADD/REMOVE NEIGHBOUR RELATIONSHIPS ON THE MAP USING THE CTRL AND SHIFT SHORTCUTS
POSSIBILITY TO ADD/REMOVE GSM NEIGHBOURS
MODIFYING NEIGHBOUR RELATIONSHIPS MANUALLY
8.
GS
M/T
DM
A-U
MT
S C
O-P
LA
NN
ING
List of GSM transmitters within a
30 km radius from the selected UMTS cell (sorted in an
ascending inter-site distance order)
List of GSM neighbours of Site71_U2(0)

AT271_SL3G_E0
Atoll 2.7.1
108
1. UMTS, HSDPA and HSUPA Concepts
2. 3G Workflow in Atoll
3. Modelling a UMTS HSPA Network
4. UMTS, HSDPA and HSUPA Predictions
5. Monte-Carlo Based Simulation
6. Neighbour Allocation
7. Scrambling Codes Planning
8. GSM/TDMA – UMTS Co-planning
9. Using Drive Tests
1. UMTS, HSDPA and HSUPA Concepts
2. 3G Workflow in Atoll
3. Modelling a UMTS HSPA Network
4. UMTS, HSDPA and HSUPA Predictions
5. Monte-Carlo Based Simulation
6. Neighbour Allocation
7. Scrambling Codes Planning
8. GSM/TDMA – UMTS Co-planning
9. Using Drive Tests
TRAINING PROGRAM
AT271_SL3G_E0
Atoll 2.7.1
109
9. USING DRIVE TESTS
IMPORT OF TEST MOBILE DATA PATH
DRIVE TEST MANAGEMENT
DRIVE TEST GRAPHIC ANALYSIS
9. U
SIN
G D
RIV
E T
ES
TS
AT271_SL3G_E0
Atoll 2.7.1
110
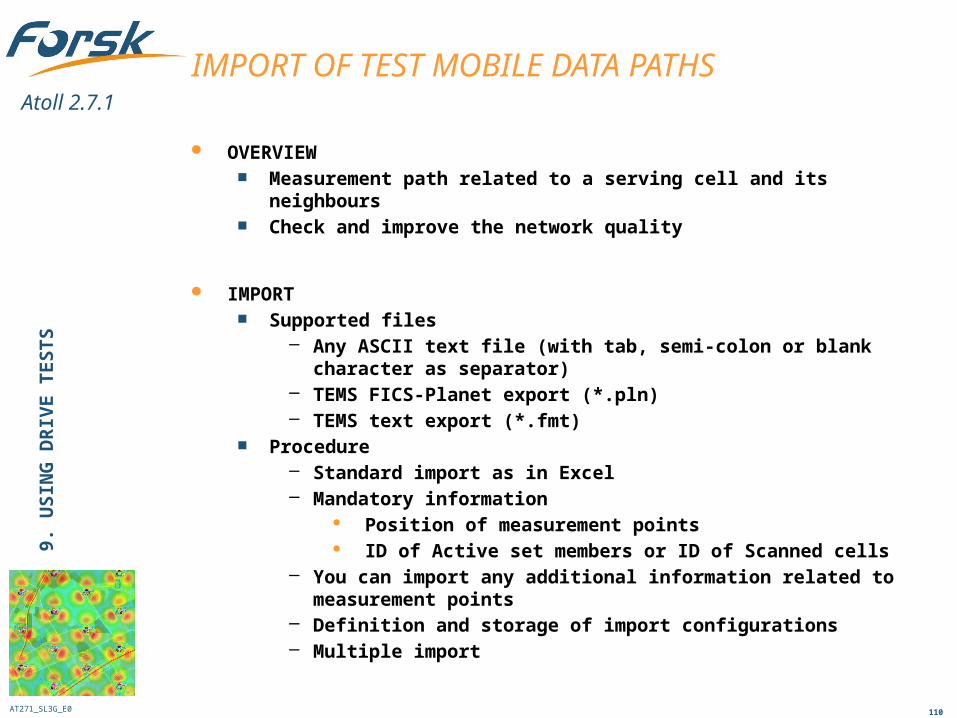
IMPORT OF TEST MOBILE DATA PATHS
OVERVIEW Measurement path related to a serving cell and its neighbours Check and improve the network quality
IMPORT Supported files
– Any ASCII text file (with tab, semi-colon or blank character as separator)
– TEMS FICS-Planet export (*.pln)– TEMS text export (*.fmt)
Procedure– Standard import as in Excel– Mandatory information
Position of measurement points ID of Active set members or ID of Scanned cells
– You can import any additional information related to measurement points
– Definition and storage of import configurations– Multiple import
9. U
SIN
G D
RIV
E T
ES
TS
AT271_SL3G_E0
Atoll 2.7.1
111
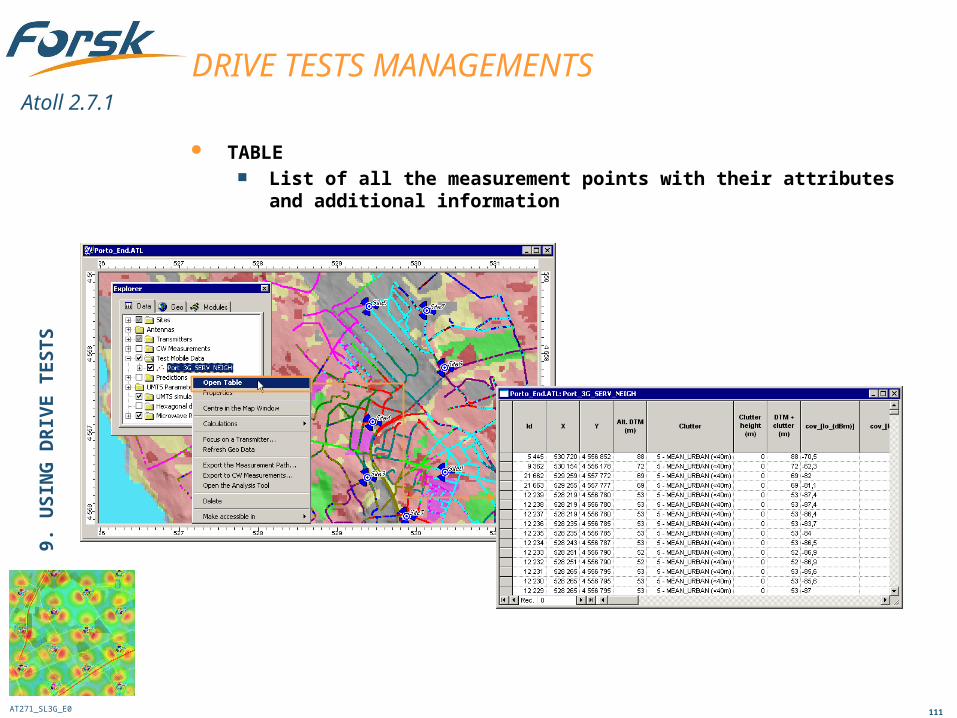
TABLE List of all the measurement points with their attributes and additional
information
Standard content management and tools (filters, copy-paste, etc...)
9. U
SIN
G D
RIV
E T
ES
TS
DRIVE TESTS MANAGEMENTS
AT271_SL3G_E0
Atoll 2.7.1
112
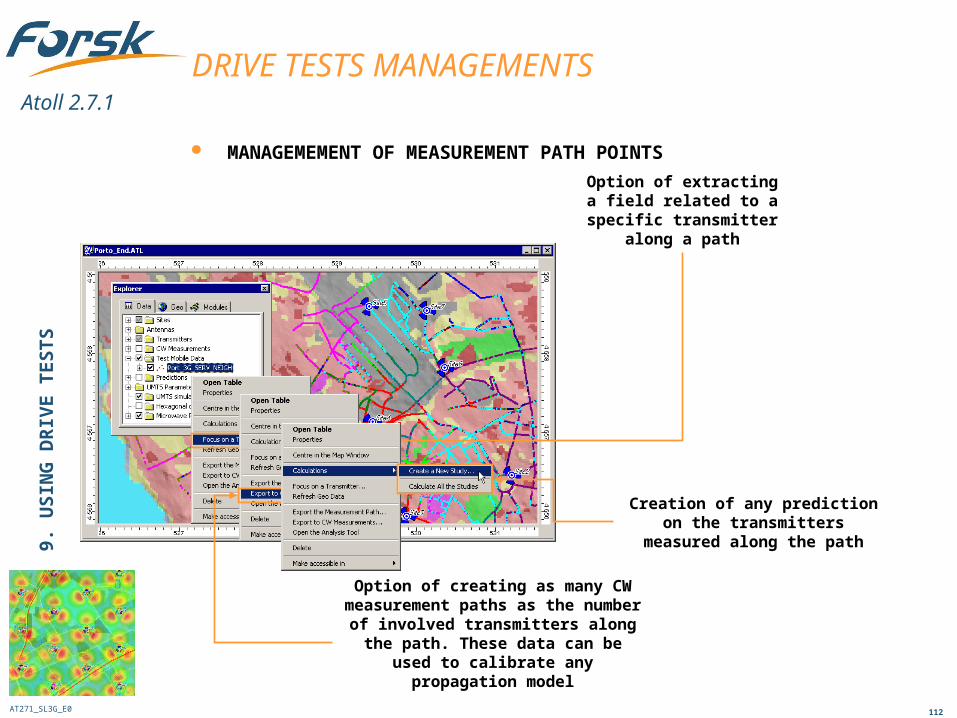
MANAGEMEMENT OF MEASUREMENT PATH POINTS
9. U
SIN
G D
RIV
E T
ES
TS
DRIVE TESTS MANAGEMENTS
Option of extracting a field related to a specific transmitter along a path
Option of creating as many CW measurement paths as the number of involved transmitters along the path. These data can be used to calibrate
any propagation model
Creation of any prediction on the transmitters measured along the
path
AT271_SL3G_E0
Atoll 2.7.1
113
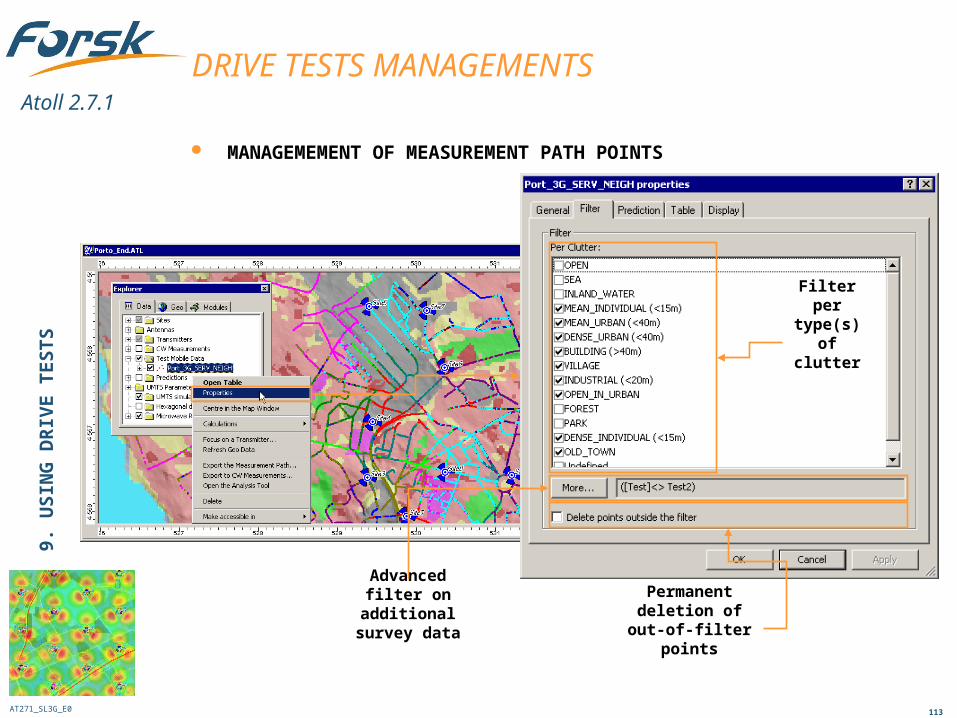
MANAGEMEMENT OF MEASUREMENT PATH POINTS
9. U
SIN
G D
RIV
E T
ES
TS
DRIVE TESTS MANAGEMENTS
Filter per type(s)
of clutter
Advanced filter on additional survey data
Permanent deletion of out-of-filter points
AT271_SL3G_E0
Atoll 2.7.1
114
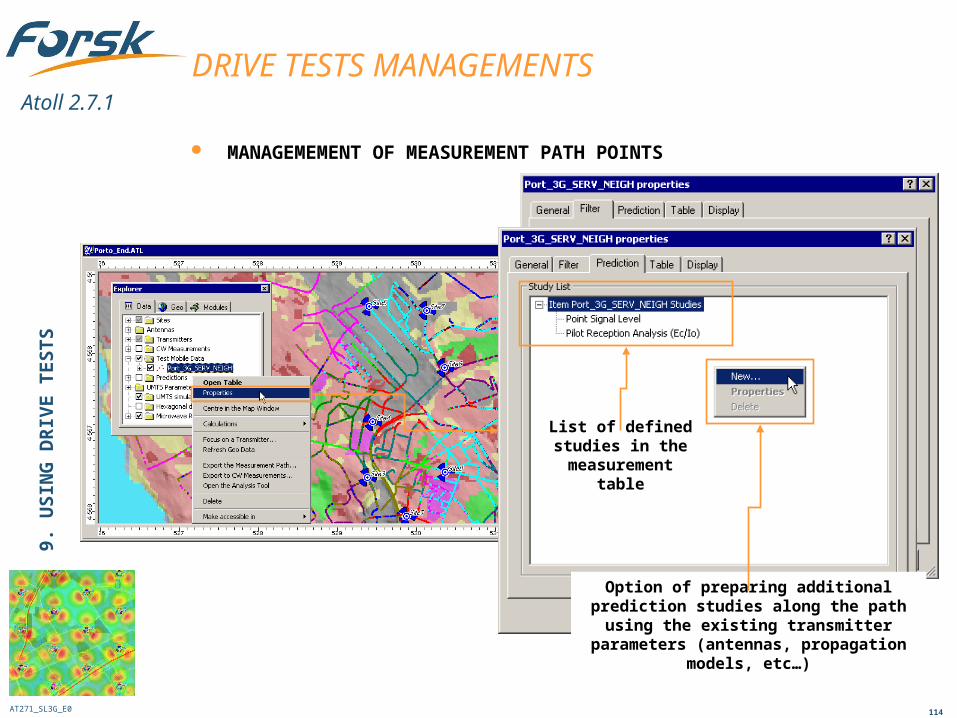
MANAGEMEMENT OF MEASUREMENT PATH POINTS
9. U
SIN
G D
RIV
E T
ES
TS
DRIVE TESTS MANAGEMENTS
Option of preparing additional prediction studies along the path using the existing
transmitter parameters (antennas, propagation models, etc…)
List of defined studies in the
measurement table
AT271_SL3G_E0
Atoll 2.7.1
115
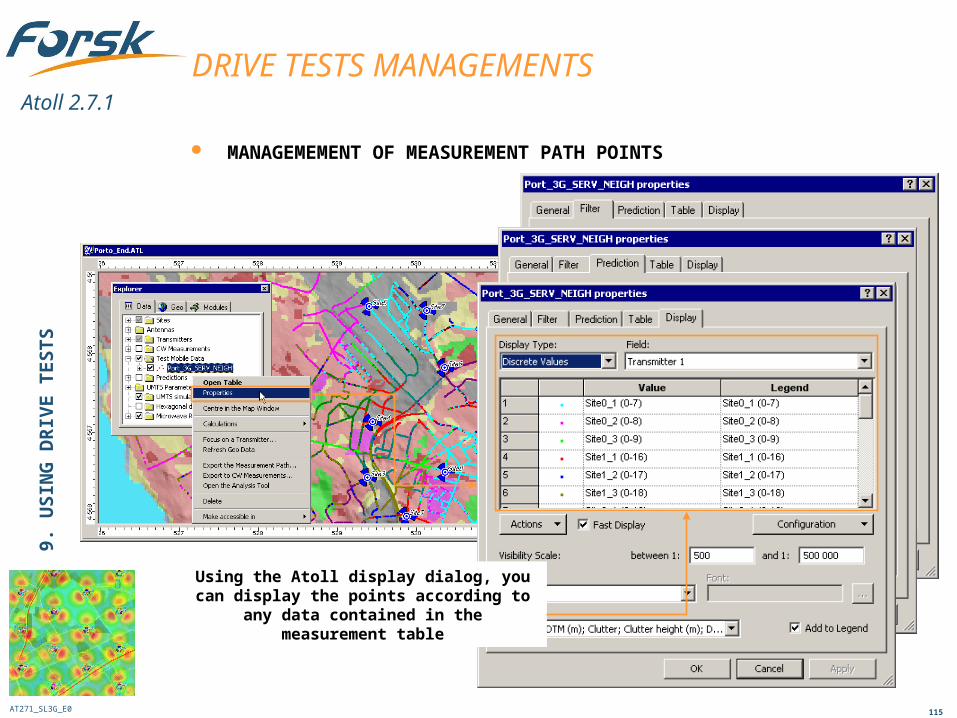
MANAGEMEMENT OF MEASUREMENT PATH POINTS
9. U
SIN
G D
RIV
E T
ES
TS
DRIVE TESTS MANAGEMENTS
Using the Atoll display dialog, you can display the points according to any data
contained in the measurement table
AT271_SL3G_E0
Atoll 2.7.1
116
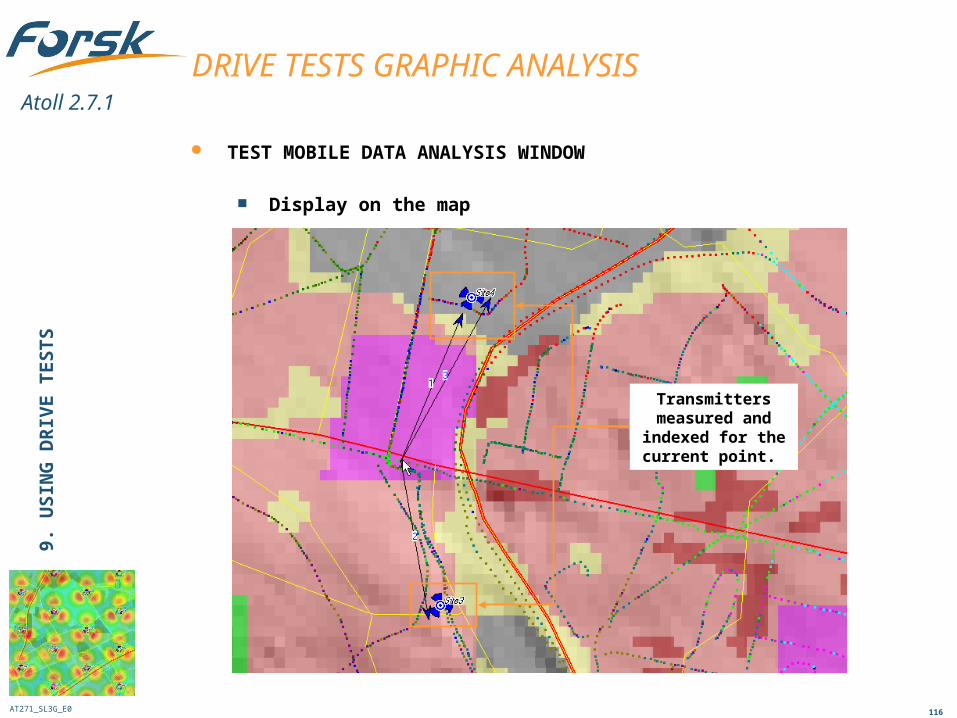
TEST MOBILE DATA ANALYSIS WINDOW
Display on the map
9. U
SIN
G D
RIV
E T
ES
TS
DRIVE TESTS GRAPHIC ANALYSIS
Transmitters measured and indexed for the current point.
AT271_SL3G_E0
Atoll 2.7.1
117
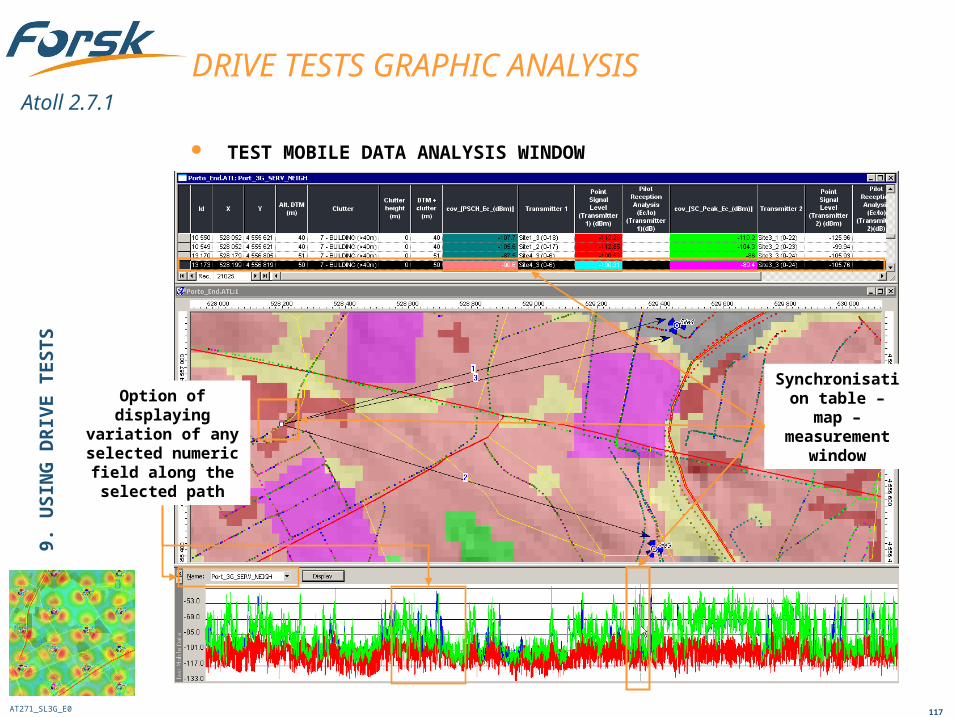
TEST MOBILE DATA ANALYSIS WINDOW
9. U
SIN
G D
RIV
E T
ES
TS
DRIVE TESTS GRAPHIC ANALYSIS
Synchronisation table – map – measurement
window
Option of displaying variation of any
selected numeric field along the selected path

AT271_SL3G_E0
Atoll 2.7.1
118
THANK YOU!


