Atomic layer deposition of aluminium phosphate based on the plasma polymerization of trimethyl phosphate Thomas Dobbelaere, †,¶ Amit K. Roy, †,¶ Philippe Vereecken, ‡ and Christophe Detavernier *,† Department of Solid State Sciences, Ghent University, Krijgslaan 281 S1, 9000 Gent, Belgium, and IMEC, Kapeldreef 75, 3001 Leuven, Belgium E-mail: [email protected]Abstract Aluminium phosphate thin films were deposited by plasma-assisted atomic layer deposition (ALD) using a sequence of trimethyl phosphate (TMP, Me 3 PO 4 ) plasma, O 2 plasma and trimethylaluminium (TMA, Me 3 Al) exposures. In-situ characteriza- tion was performed, including spectroscopic ellipsometry, optical emission spectroscopy, mass spectrometry and FTIR. In the investigated temperature region between 50 ◦ C and 320 ◦ C, nucleation delays were absent and linear growth was observed, with the growth per cycle (GPC) being strongly dependent on temperature. The plasma poly- merization of TMP was found to play an important role in this process, resulting in CVD-like behavior at low temperatures and ALD-like behavior at high tempera- tures. Films grown at 320 ◦ C had a GPC of 3.7 ˚ A/cycle and consisted of amorphous * To whom correspondence should be addressed † Ghent University ‡ IMEC ¶ These authors contributed equally to this work 1
Transcript
Atomic layer deposition of aluminium phosphate
based on the plasma polymerization of trimethyl
phosphate
Thomas Dobbelaere,†,¶ Amit K. Roy,†,¶ Philippe Vereecken,‡ and Christophe
Detavernier∗,†
Department of Solid State Sciences, Ghent University, Krijgslaan 281 S1, 9000 Gent,
Belgium, and IMEC, Kapeldreef 75, 3001 Leuven, Belgium
Aluminium phosphate thin films were deposited by plasma-assisted atomic layer
deposition (ALD) using a sequence of trimethyl phosphate (TMP, Me3PO4) plasma,
O2 plasma and trimethylaluminium (TMA, Me3Al) exposures. In-situ characteriza-
tion was performed, including spectroscopic ellipsometry, optical emission spectroscopy,
mass spectrometry and FTIR. In the investigated temperature region between 50 ◦C
and 320 ◦C, nucleation delays were absent and linear growth was observed, with the
growth per cycle (GPC) being strongly dependent on temperature. The plasma poly-
merization of TMP was found to play an important role in this process, resulting
in CVD-like behavior at low temperatures and ALD-like behavior at high tempera-
tures. Films grown at 320 ◦C had a GPC of 3.7 A/cycle and consisted of amorphous
∗To whom correspondence should be addressed†Ghent University‡IMEC¶These authors contributed equally to this work
1
aluminium pyrophosphate (Al4P6O21). They could be crystallized to triclinic AlPO4
tridymite by annealing to 900 ◦C, as evidenced by high temperature XRD measure-
ments. The use of a TMP plasma might open up the possibility of depositing many
other metal phosphates by combining it with appropriate organometallic precursors.
Introduction
Atomic layer deposition (ALD) is a thin film deposition technique in which layer-by-layer
growth is achieved through alternating exposures to chemical vapors. It can be seen as a
special form of chemical vapor deposition (CVD) where the precursor exposures are separated
in sequential, self-limiting half reactions. Many classes of materials have been deposited by
ALD processes, including various oxides, ii-vi and iii-v semiconductors, metal nitrides,
metals, metal sulfides, and fluorides.1 Reports on the atomic layer deposition of phosphates
are still scarce, but seem to be gaining popularity over the last years. Table 1 presents a
summary of the existing literature on this subject.
Phosphate ALD processes have been developed targeting a wide range of applications:
aluminium phosphate as a catalyst support,2 as an ion barrier in electroluminescent dis-
plays,3 to improve lithium-ion battery cathodes,12 as a transistor gate dielectric,13 and to
improve the oxidation resistance of carbon fibers;9 calcium phosphate (hydroxyapatite) for
biomedical applications;4 titanium phosphate for its ion-exchange properties14 and for its
catalytic activity;15 iron phosphate as a cathode material10 and lithium phosphate as a
solid-state electrolyte16 for lithium-ion batteries.
These processes are typically based on the inclusion of a phosphorus source in an existing
metal oxide ALD process. In theory, phosphoric acid (H3PO4) would be an ideal candidate
for this, but its use in vapor deposition is prohibited by its low vapor pressure at room
temperature and its tendency to decompose rather than evaporate upon heating. Phosphorus
pentoxide (P2O5) can be used, but needs to be heated to 170 ◦C or higher;2,3 this presents
challenges to the reactor design. Trimethyl phosphate (TMP, Me3PO4) is an attractive
2
Table 1: Overview of earlier work on the atomic layer deposition of phosphates.
Authors(Year)
Metal (source) Phosphorussource
Temperature(◦C)
GPC (A) GPSS (A) a
Nieminenet al. (1995)2
Aluminium(trichloride)
P2O5,TMP
500 N.A. N.A.
Tiittaet al. (1998)3
Aluminium(trichloride,n - propoxide)
P2O5 450 - 500 0.5 - 1.3 0.3 - 0.6
Putkonenet al. (2009)4
Calcium ((thd)2) TMP 300 0.4 0.1
Hamalainenet al. (2012)5
Lithium (hexa-methyldisilazide)
TMP 225 - 300 0.7 - 1.0 0.3 - 0.5
Hamalainenet al. (2012)5
Lithium (tert -butoxide)
TMP 275 - 350 0.4 - 1.3 0.2 - 0.7
Wiedmannet al. (2012)6
Titanium(tetrachloride)
TMP 150 - 300 1.2 0.3
Hamalainenet al. (2012)7
Aluminium(trichloride)
TMP 150 - 400 1.4 - 2.4 0.7 - 1.2
Hamalainenet al. (2012)7
Titanium(tetrachloride)
TMP 275 - 450 0.4 - 1.4 0.2 - 0.7
Liuet al. (2013)8
Aluminium(trimethyl-)
TMP 150 1.7 0.08
Knohlet al. (2013)9
Aluminium(trimethyl-)
TEP 250 0.8 - 1.3 0.4 - 0.7
Gandrudet al. (2013)10
Iron ((thd)3) TMP 200 - 380 1.0 0.05
Sønstebyet al. (2014)11
Lanthanum((thd)3)
TMP 250 - 300 0.8 0.2
This work Aluminium(trimethyl-)
TMPplasma
320 3.7 1.2
a Growth per substep = (growth per cycle) / (number of substeps in one cycle)
3
alternative: this organophosphate compound reaches a vapor pressure of 15 mbar at 70 ◦C.17
Thermal ALD processes using TMP have been demonstrated for a variety of metal
sources. Especially where chloride precursors were avoided,4,5,8–10 it has proven difficult
to incorporate a sufficiently high atomic percentage of phosphorus in the growing film (pre-
sumably due to the low reactivity of TMP with organometallic compounds), unless one
introduces a large number of phosphate subcycles for each metal pulse. This considerably
slows down the growth; for this reason, table 1 not only lists the reported growth per cycle
(GPC) but also the average growth per substep (calculated by dividing the GPC by the
number of substeps in one cycle) in order to make a fair comparison between the expected
deposition rates of different ALD chemistries.
In this work, the TMP precursor is used in a novel way: the vapor is brought into an
inductively coupled plasma (ICP) discharge, and a TMP plasma is created. To the best of
our knowledge, the use and/or properties of an inductively coupled plasma of low-pressure
TMP vapor have not previously been reported in literature. Perhaps most closely related to
this topic is the work by Hilt et al.18 wherein organophosphate coatings were deposited by
an atmospheric-pressure plasma of triethyl phosphate (TEP), and a patent application by
Zhang et al.19 which describes the deposition of lithium-containing solid electrolyte films by
mixing a volatile lithium precursor and a volatile phosphate precursor (TMP or TEP) into a
low-pressure nitrogen/hydrogen plasma. The use of plasma greatly increases the reactivity
of TMP and its tendency to introduce phosphorus into the deposited film. By alternating
TMP plasma pulses with O2 plasma and TMA exposures in an ALD-type process, we are
able to grow thin films of aluminium phosphate with a high growth rate and with precise
thickness control.
4
Experimental
Depositions were carried out in a home-built pump-type ALD reactor, shown schematically
in figure 1. The stainless steel deposition chamber was continuously evacuated by a turbo-
molecular pump to a base pressure in the 10−6 mbar range. Precursor vapors and gases were
admitted through computer-controlled pneumatic valves and manually adjustable needle
valves. The TMP precursor was heated in a stainless steel container to 68 ◦C, while the tube
leading to the reactor was kept at 70 ◦C. The TMA precursor was used at room tempera-
ture. The temperature of the chamber walls was set to 95 ◦C. On top of the chamber, a gate
valve leads to a fused quartz column wrapped by a copper coil. The coil is connected to a
13.56 MHz RF generator (Advanced Energy CESAR 136) and a matching network in order
to generate an inductively coupled plasma in the column. By opening the gate valve and
pulsing the RF generator, substrates could be exposed to remote plasma. The TMP plasma
was created by feeding TMP vapor from the chamber through the gate valve, while for the
oxygen plasma the O2 gas was injected directly into the column. The plasma power was
set to 100 W and the impedance matching parameters were tuned to minimize the reflected
power. All gas flows (TMP, TMA and oxygen) were adjusted to reach a partial pressure of
6× 10⁻³ mbar in the deposition chamber. All substrates were pieces of standard p-type sili-
con (100) wafer cut to size; for in-situ FTIR measurements in transmission mode, the double
FTIRSource
EllipsometryDetector
FTIRDetector
Mass spec.
Spectrometer
manual valve
TMP
TMA
O2 supply
ICPcoil
RF generator
Heatedsample stage
To backing pump
gatevalve
Stainless steeldeposition chamber
Plasmacolumn
Precursorbottle
Precursorbottle
EllipsometryLight source
Turbopump
Fiberoptic cable
needlevalve
pneumaticvalve
Bypass valve
~
Figure 1: Schematic drawing of the deposition system used in this work, along with thein-situ characterization options.
5
polished variety was used. They were mounted to a molybdenum sample holder which rested
on a heated copper block. The temperature of the copper block was PID controlled, and
sample temperatures were calculated from copper block temperatures by calibration.
In-situ spectroscopic ellipsometry measurements were performed with a J.A. Woollam
M-2000 ellipsometer working in the ultraviolet-visible region and using the CompleteEASE
software for fitting and data analysis. The optical model always consisted of a silicon sub-
strate covered by a single layer which satisfied a Cauchy dispersion relation; coefficients were
determined from layers with a known thickness (aided by XRR) and were held fixed, while
the thickness (as the only free parameter) was fitted in situ. Optical emission spectra were
recorded with an Ocean Optics QE Pro spectrometer coupled to the plasma column by an
optical fiber. Mass spectrometry was carried out with a Hiden HPR-30 mass spectrometer
using 70 eV electron impact ionization and a quadrupole mass filter combined with a Faraday
detector. Infrared spectroscopy was performed on a Bruker VERTEX 70V FTIR spectrome-
ter with KBr beamsplitter and an LN2-cooled MCT detector (mid-infrared). XRR and XRD
patterns were acquired on a Bruker D8 diffractometer using Cu Kα radiation; in-situ an-
nealing was performed in a home-built chamber under a helium atmosphere using a position
sensitive detector. Energy-dispersive X-ray spectroscopy (EDX) was carried out in an FEI
Quanta 200 F scanning electron microscope using a 10 keV electron beam and an EDAX
silicon-drift detector. X-ray Photoelectron Spectroscopy (XPS) analysis was performed on a
Thermo Scientific Theta Probe XPS instrument using Al Kα X-rays generated at 15 kV and
70 W and focused to a spot size of 0.3 mm by an MXR1 monochromator gun. The sample
surface was etched by Ar+ ions at an acceleration voltage of 3 keV and a current of 2 µA.
The elastic recoil detection (ERD) measurements were carried out using a 10 MeV 63Cu5+
beam, with a scattering angle of 40◦ and a sample tilt of 20◦.
6
Results and discussion
TMP plasma properties
To start, we will focus on the TMP plasma, which is the first step in the proposed ALD
process. Figure 2 shows the optical emission spectrum of this plasma in the visible range.
To the naked eye, its color appears bluish white. The spectrum contains atomic emission
lines of hydrogen (Balmer series: Hα at 656.3 nm, Hβ at 486.1 nm and Hγ at 434.0 nm)
and oxygen (O I triplet around 777.4 nm) in addition to a molecular band structure which
could not be identified from literature but which is thought to arise from transitions between
molecular energy levels in the (charged) TMP molecule and/or fragments of it.
400 450 500 550 600 650 700 750
Wavelength (nm)
Em
issi
on inte
nsi
ty (
a.u
.) x3
HαHβ
OHγ
TMP molecular band
Figure 2: The optical emission spectrum of a 100W inductively coupled TMP plasma between375 nm and 790 nm. Hydrogen and oxygen atomic emission lines are superimposed on themolecular band spectrum.
To further investigate what makes up this plasma, the mass spectra of TMP vapor and
TMP plasma were compared. The results are shown in figure 3. While the spectrometer
measured masses between 1 and 300 atomic mass units (amu), figure 3 only shows masses
up to 150 amu because no heavier species were detected.
The upper and lower graphs are largely identical; even as vapor, TMP is broken up into
many fragments by electron impact ionization in the spectrometer. One could expect the
plasma to do the same thing, but it is not possible to distinguish this from fragmentation
in the instrument. However, upon close inspection, some differences due to the plasma
7
0
1
2
3
4
0 20 40 60 80 100 120 14002468
1012
Mass to charge ratio m/z (amu)
Pre
ssure
(1
0-9
mbar)
x2
x2
H
H2
TMP vapor
100W TMP plasma
CH
3H
2O PO
PC
OC
2H
2
Me 3
PO
4P 2
O5
PO
3
PO
4
PO
2
HPO
3
MePO
4
C
CO
2
O
O2
Figure 3: Mass spectra of TMP vapor (upper graph) and TMP plasma (lower graph) between1 and 150 amu. Selected peaks are labeled with their corresponding fragment structures.
are visible. Most notable is the formation of H2 (hydrogen gas), witnessed by a significant
increase at m/z = 2. This is obviously related to the strong hydrogen emission lines in OES.
Other appearances include elemental carbon at m/z = 12, C2H2 (acetylene) at m/z = 26,
C2H3 at m/z = 27 and CO2 at m/z = 44. The increase at m/z = 16 could be attributed to
contributions from either atomic oxygen or CH4 (methane), but the presence of the atomic
oxygen emission line in the optical spectrum makes the former option the most likely one.
50 100 150 200 250 300 350
Temperature (°C)
0
1
2
3
4
GPC
(nm
/cycl
e) 10s
pulses
3spulses
0 10 20 30 40 50
Cycle #
0
20
40
60
80
100
Thic
kness
(nm
)
50 °C
160 °C
260 °C 320 °C
Plasma polymerization Inhibited growth
Figure 4: The growth per cycle as a function of the deposition temperature for sequencesconsisting of 3 s and 10 s TMP plasma pulses. Inset: growth curves measured by in-situellipsometry for 10 s TMP plasma pulses, showing linear growth.
8
TMP plasma polymerization
It was observed that material got deposited onto substrates by exposure to this remote TMP
plasma. Figure 4 shows the result of exposing a substrate to a sequence of TMP plasma
pulses at different temperatures while monitoring the growth using in-situ ellipsometry. The
Cauchy dispersion relation for these layers was n(λ) = 1.454 + 5.30× 10⁻³ µm2/λ2 − 7.82×
10−5 µm4/λ4, yielding a refractive index of 1.47 at a wavelength of 589 nm. Two pulse lengths
had been chosen, namely 3 s and 10 s. At low temperatures, a large amount of material was
being deposited, and the amount increased with the TMP plasma pulse length. This suggests
a continuous, CVD-like deposition process. However, at higher temperatures, the deposition
rate dropped spectacularly and the process was almost totally inhibited.
The formation of a solid deposit by a plasma discharge is generally known as plasma
polymerization. The growth rates of such processes often show a strong temperature depen-
dency. In particular, the growth rate vs. temperature plot of the plasma polymerization of
tetrafluoroethylene20 looks very similar to the curve in figure 4. This can be understood from
thermodynamic arguments: whether the polymerization reaction proceeds is determined by
the change in Gibbs free energy ∆G = ∆H − T∆S, where ∆H represents the reaction en-
thalpy and ∆S the change in entropy. The reaction will only proceed if ∆G < 0. As ∆H < 0
(the formation of new chemical bonds in the solid deposit is energetically favorable) but also
∆S < 0 (the gas → solid transition results in increased order and thus decreased entropy),
∆G < 0 for sufficiently small T. However, as ∆G increases with temperature, there will be
a temperature above which ∆G > 0 and the polymerization reaction no longer takes place.
In other words, there is a ceiling temperature above which the polymerization reaction is
inhibited. Another piece of evidence to support our argument is the formation of hydrogen
gas in the plasma by the release of hydrogen from C−H bonds, in this case witnessed by
mass spectrometry and OES, and as frequently encountered in the plasma polymerization
of hydrocarbons.20 We therefore identify this process step as the plasma polymerization of
TMP, with a ceiling temperature in the vicinity of 300 ◦C.
9
The chemical nature of the deposited layer was further investigated by in-situ FTIR
as shown in figure 5. For reference purposes, the absorption spectrum of TMP vapor was
separately measured and included in the same figure. In this spectrum, peaks at 2960, 2860
and 2350 cm−1 can be attributed to various C−H stretching vibrations of methyl groups in
the TMP molecule, while a P−−O stretch can be identified around 1300 cm−1, a CH3 rocking
vibration at 1190 cm−1, a (P)−O−C stretch at 1060 cm−1, and a P−O−(C) stretch at
850 cm−1.21,22 During deposition, absorption spectra of the deposited material were measured
in-situ at a substrate temperature of 150 ◦C; the sample was exposed to TMP plasma for
120 s between two consecutive measurements. The infrared absorbance grows progressively
stronger over time, which is in agreement with the linear growth evidenced earlier by in-situ
ellipsometry, confirming the continuous deposition of material at this temperature. Several
absorption peaks coincide with the TMP vapor reference spectrum, which suggests that the
solid deposit is chemically similar to TMP. However, the peaks are heavily broadened, and in
particular a new structure consisting of three very broad bands around 2700 cm−1, 2200 cm−1
and 1600 cm−1 can be observed. This is a so-called ABC structure, which typically arises
from O−H stretching vibrations in strongly hydrogen bonded complexes; in particular, the
observed O−H band structure is very similar to the one encountered for dimethylphosphinic
acid ((CH3)2POOH) in the solid state.23 This implies that some of the −O−CH3 groups in
5001000150020002500300035004000
Wavenumber (cm-1)
Infr
are
d a
bso
rbance
TMP vapour
Depositedlayer
t= 0
t= 2 mint= 4 mint= 6 mint= 8 mint= 10 min
Figure 5: In-situ FTIR during TMP plasma polymerization at a substrate temperature of150 ◦C, along with the absorption spectrum of TMP vapor.
10
the TMP precursor are being converted to −OH groups during the plasma polymerization
process, and the resulting deposited layers are presumably mixtures of phosphate esters.
The layers resulting from TMP plasma polymerization were closed films when inspected
immediately after removal from the reactor, but film degradation became visible after a few
hours of exposure to an ambient atmosphere. This suggests a reaction of the deposited
material with ambient oxygen and/or water vapor. After a few weeks, some samples in
particular started to show fractal-like dendritic structures. This reactivity might be related
to the high amount of free radicals which are typically embedded in plasma-polymerized
films.20
Further oxidation by O2 plasma
Freshly deposited samples were brought into a scanning electron microscope for EDX anal-
ysis. The results are shown in figure 6. Layers deposited by the TMP plasma contained
oxygen, phosphorus and carbon, as shown by curve (a); we can thus refer to them as
organophosphate coatings. When one wants to grow metal phosphates, however, carbon
is an undesirable contaminant in the final layer. An additional oxygen plasma exposure was
500 1000 1500 2000 2500
Energy (eV)
Photo
n c
ount
C
O
Si P
(a)
(b)
Figure 6: Energy-dispersive X-ray spectroscopy of phosphate films grown on silicon sub-strates by TMP plasma polymerization at 150 ◦C. Peaks at the characteristic X-ray K-linesof C, O, Si and P are indicated. Curve (a) corresponds to a layer grown by 400 cycles of 3 sTMP plasma, while curve (b) is the result of 400× [3 s TMP plasma - 3 s O2 plasma] andcontains a significantly lower amount of carbon.
11
therefore introduced after each TMP plasma step in order to remove carbon by combustion.
The effectiveness of this step is illustrated by curve (b) in figure 6, which shows that the
amounts of phosphorus and oxygen remain the same but the amount of carbon is signifi-
cantly reduced. The oxygen plasma presumably converts remaining −O−CH3 groups in the
phosphate deposit into −OH groups, transforming dimethylphosphinic acid into methylphos-
phinic acid or possibly phosphoric acid. As many metal precursors (e.g. TMA) need −OH
groups to chemisorb on, this not only removes unwanted carbon but also enhances the re-
action of the organophosphate layer with a metal precursor to form a metal phosphate. In
other words, a phosphorus source is formed “in-situ” on the sample surface, ready to accept
a metal source.
Growth of aluminium phosphate
In what follows, we will focus on a three-step process to grow aluminium phosphate by
combining TMP plasma and O2 plasma with a third step in the form of a TMA exposure.
As opposed to the films deposited by TMP plasma or TMP/O2 plasma alone, which degraded
after removal from the reactor, the [TMP plasma - O2 plasma - TMA] process resulted in
the growth of aluminium phosphate films which remained stable in an ambient atmosphere.
Figure 7 shows the growth per cycle of this process as a function of the deposition
temperature. It can be compared to figure 4, the only difference being the inclusion of an
O2 plasma and TMA pulse after each TMP plasma pulse. The TMP plasma pulse durations
were set to 3 s for curve (a) and 10 s for curve (b), while the O2 plasma pulse and TMA pulse
durations were fixed to 3 s each in both cases. GPC values were determined from the slopes
of in-situ ellipsometry growth curves, as shown in the inset of figure 7. All layers satisfied a
which yields a refractive index of 1.52 at a wavelength of 589 nm. At low temperatures
(< 100 ◦C), curve (b) shows a significantly higher GPC than curve (a). This should not
come as a surprise: at low temperatures, TMP plasma polymerizes at a high rate, and
12
extending the pulse duration significantly increases the total amount of deposited material
(i.e. the GPC) and also the P/Al ratio (numbers in gray). At the high-temperature side
(> 300 ◦C), however, something remarkable happens: material still gets deposited at a rate
of 4 to 5 A/cycle, even though the polymerization of TMP plasma is inhibited (as seen in
figure 4). Additionally, the GPC of curve (b) is only slightly higher than for curve (a), despite
the three-fold increase in TMP plasma duration, and the P/Al ratios are similar. We are
lead to the conclusion that this process must be split up in two regimes: a low-temperature
regime characterized by continuous and unsaturated growth (plasma-enhanced CVD), and a
high-temperature regime characterized by saturated growth where individual TMP plasma
pulses do not result in deposition but sequential exposures with O2 plasma and TMA vapor
do. We therefore regard this high-temperature regime as plasma-enhanced ALD. The fact
that TMP polymerization is no longer temperature-inhibited when TMA pulses are included
might be caused by an increased tendency to form chemical bonds on the surface, i.e. the
reaction enthalpy is more negative by the presence of TMA on the sample surface, which
shifts the ceiling temperature upwards.
50 100 150 200 250 300 350
Temperature (°C)
0
1
2
3
4
GPC
(nm
/cycl
e)
0 10 20 30 400
5
10
15
20
25
30
35
50 °C
160 °C
260 °C
320 °C
Cycle #
Thic
kness
(nm
)
PECVD regime PEALD regime
(b)
(a)
4.5
2.2
2.01.8
Figure 7: The growth per cycle as a function of the deposition temperature for two sequences:(a) [3 s TMP plasma - 3 s O2 plasma - 3 s TMA] and (b) [10 s TMP plasma - 3 s O2 plasma - 3 sTMA]. Inset: growth curves measured by in-situ ellipsometry for (a), showing linear growth(similar for (b)). Numbers in gray represent the P/Al ratios of certain samples determinedfrom XPS analysis.
13
The influence of the TMA pulse duration on the GPC was investigated for the same
process in both low-temperature (PECVD) and high-temperature (PEALD) regimes. The
results are shown in figure 8. The GPC does not depend on the TMA pulse duration if the
duration is 1 s or longer, and this holds for both regimes, although with very different values.
In the low-temperature regime, the saturated GPC value (i.e. for for ≥1 s TMA) is about
2.8 nm/cycle and the one for 0 s TMA (i.e. for the [TMP plasma - O2 plasma] process) is
even higher than that. This might be because the aluminium-containing layers are denser
and thus have a lower thickness for the same amount of material. In the high-temperature
regime, the GPC is close to zero in the absence of TMA pulses (as previously discussed) and
assumes a value of 5.5 A/cycle for TMA durations of 1 s or longer. Additionally, P/Al ratios
derived from XPS analysis are independent of the TMA pulse duration. These observations
suggest saturation during the TMA exposure step.
Unraveling the reaction mechanism
In order to better understand how this deposition process works, the reaction products
were analyzed by multiple ion detection mass spectrometry. In figure 9, two species were
monitored: PO at m/z = 47 (a fragment of TMP, as can be seen in figure 3, chosen to track
0 2 4 6 8 10
TMA duration (s)
0.0
0.5
1.0
1.5
2.0
2.5
3.0
3.5
4.0
4.5
GPC
(nm
)
320 °C
50 °C
Figure 8: Growth per cycle of the [TMP plasma - O2 plasma - TMA] process as a functionof the TMA pulse duration, showing saturated behavior in both the PECVD temperatureregime (50 ◦C, upper curve) and the PEALD regime (320 ◦C, lower curve). The TMP plasmaand O2 plasma pulse times were fixed to resp. 10 s and 3 s.
14
the TMP pulses) and CH4/oxygen at m/z = 16 (chosen because methane is released when
TMA reacts with hydroxyl surface groups). The substrate temperature was set to 150 ◦C.
However, as the reaction products may originate from all over the deposition chamber and
the chamber walls comprise most of the inner surface area, we assume that the reaction
products mainly originate from deposition on the chamber walls at a temperature of 95 ◦C.
In both cases, the reactions happen in the PECVD temperature regime.
In figure 9a, the [TMP plasma - O2 plasma - TMA] process was studied. During the TMP
plasma discharge, both PO and oxygen were present, as previously discussed and shown in
figure 3. During the subsequent oxygen plasma step, only oxygen was visible. When TMA
was introduced, a sharp spike in the channel at m/z = 16 was observed. This signal is very
similar to what is observed in the well-known TMA-water process (figure 9f) where Al2O3
is grown and CH4 is produced as a reaction product. This provides experimental evidence
that TMA reacts with −OH groups in the organophosphate layer created by the TMP and
0.00
0.05
0.10
0.00.40.8
0.00.40.8
0.00.51.0
Part
ial p
ress
ure
(1
0-6
mbar)
0.00.40.8
0 20 40 60 80 100 120 140 160 180
Time (s)
0
1
2
PO (47)CH4 / O (16)
TMA
O2 plasma
TMP
TMP plasma
(a)
(b)
(c)
(d)
(e)
(f)
H2O H2O H2O
Figure 9: Multiple ion detection mass spectrometry during five different variations on the[TMP plasma - O2 plasma - TMA] process and one standard [TMA - H2O] process forreference purposes. Dark gray: CH4/oxygen signal at m/z = 16. Light gray: PO signal(TMP fragment) at m/z = 47.
15
O2 plasma exposures and forms CH4 as a byproduct:
−OH + Al(CH3)3 −−→ −O−Al(CH2)2 + CH4
In figure 9b, the oxygen plasma step was skipped, resulting in a [TMP plasma - TMA]
process. The CH4 spike while pulsing TMA is still present, but is much lower in magnitude.
However, as can be seen in figure 9c, when TMA is pulsed immediately after the TMP
plasma, the spike increases in magnitude again. This might indicate dehydration of the
organophosphate layer over time. In figure 9d, TMP vapor was used instead of TMP plasma;
no methane spike was visible, supporting our observation that the [TMP vapor - TMA]
process does not grow anything due to lack of a chemical reaction. However, by adding
an intermediate oxygen plasma, as was done in figure 9e, a (weak) methane spike is again
observed; this process resembles the one by Liu et al8 and grows material very slowly.
Figure 10 focuses on the [TMP plasma - O2 plasma - TMA] process as in figure 9a
but provides additional channels. Figure 10b shows CH3 at m/z = 15, which is prominent
0.0
0.2
0.4H2O (18)
0.00.10.20.3
0.00.61.2
Part
ial p
ress
ure
(1
0-6
mbar)
0 20 40 60 80 100 120 140 160 180
Time (s)
0
1
2
PO (47)
CO2 (44) PO (47)
CH3 (15) PO (47)
CH4 / O (16) PO (47)
(a)
(b)
(c)
(d)
Figure 10: Multiple ion detection mass spectrometry of the [TMP plasma - O2 plasma -TMA] process (designated by resp. diamonds, triangles and pentagons, same as in figure 9a),monitoring additional species. The PO signal (TMP fragment) at m/z = 47 is shownthroughout, in addition to (from top to bottom) (a) H2O at m/z = 18, (b) CO2 at m/z = 44,(c) CH3 at m/z = 15 and (d) CH4/oxygen at m/z = 16.
16
during the TMP plasma (as can be seen in figure 3) and spikes simultaneously with the
methane channel. A weak signal can also be observed during the oxygen plasma pulse; this
is probably the result of instrumental bleed from the adjacent oxygen channel. Figures 10c
and 10d respectively show CO2 at m/z = 44 and H2O at m/z = 18. Both of them are formed
during the TMP plasma (as previously noted) and during the oxygen plasma, while they are
absent during the TMA pulse. Their presence during the oxygen plasma, coupled with the
observation that the amount of carbon in the organophosphate layers is reduced, suggests
that the O2 plasma removes methyl ligands in the organophosphate layer by a combustion
reaction:
−O−CH3 + 3 O · −−→ −OH + CO2 + H2O
The surface chemistry during the [TMP plasma - O2 plasma - TMA] process was also
investigated by in-situ infrared spectroscopy. The substrate temperature was held at 150 ◦C;
spectra were acquired after each substep, and this was repeated during 50 cycles. The results
are shown in figure 11, wherein the total absorption spectrum of the deposited film is plotted
along with difference spectra after each substep. Each difference spectrum was averaged over
50 cycles in order to minimize noise contributions. The absorption spectrum equals the sum
of the three difference spectra, as the absorption of the substrate was already subtracted.
5001000150020002500300035004000
Wavenumber (cm-1)
Infr
are
d a
bso
rbance Total spectrum
Difference after TMP plasma
Difference after O2 plasma
Difference after TMA
C-HAl O
Al O
Al CH3
P OP O
O P O
C-H
C-H
Figure 11: In-situ infrared spectroscopy during the [TMP plasma - O2 plasma - TMA]process at 150 ◦C. The upper curve shows the infrared absorption spectrum of the aluminiumphosphate film after 50 cycles. The three curves below it are difference spectra after eachsubstep, each one averaged over 50 cycles to improve the signal/noise ratio.
17
The difference spectrum after the TMP plasma shows a C−H stretch at 2960 cm−1, P−−O
stretching vibrations around 1300 cm−1, P−O stretching vibrations around 1050 cm−1 and
O−P−O bending vibrations around 600 cm−1.2,18,24,25 This demonstrates the formation of
(poly)phosphate groups by exposure to the TMP plasma. The O2 plasma difference spectrum
shows a small valley at the exact location of the TMP plasma C−H stretch; this implies that
carbon is being removed by O2 plasma, in accordance with previous observations. A number
of other valleys can be seen between 1500 and 500 cm−1; these are supposedly also related
to the removal of carbon-containing bonds, although their exact attribution is unclear. The
difference spectrum associated with the TMA pulse shows a C−H stretch at 2940 cm−1 due
to the methyl ligands which remain around each aluminium atom. Additionally, Al−−O and
Al−O stretch bands26 could be identified at resp. 1350 cm−1 and 700 cm−1.
To summarize, the information above leads us to the following picture of the deposition
process:
• Through plasma polymerization of the TMP precursor, a surface organophosphate
layer is grown, its chemical structure being similar to TMP albeit with some methyl
groups getting replaced by hydroxyl groups.
• By exposure to O2 plasma, additional methyl groups in the surface layer are replaced
by hydroxyl groups. The resulting chemical structure is presumably more similar to
phosphoric acid than to the original TMP molecule. One could state that the plasma
induces the in-situ synthesis of a suitable phosphorus precursor on the substrate surface,
thereby circumventing the impossibility of bringing phosphoric acid into the vapor
phase.
• TMA now chemisorbs on the surface because its methyl ligands react with hydroxyl
groups, creating Al−O bonds and resulting in the formation of aluminium phosphate.
18
PEALD film properties
Films were deposited at 320 ◦C using the [TMP plasma - O2 plasma - TMA] process with
3 s pulse times in order to characterize them by XPS, ERD and in-situ XRD.
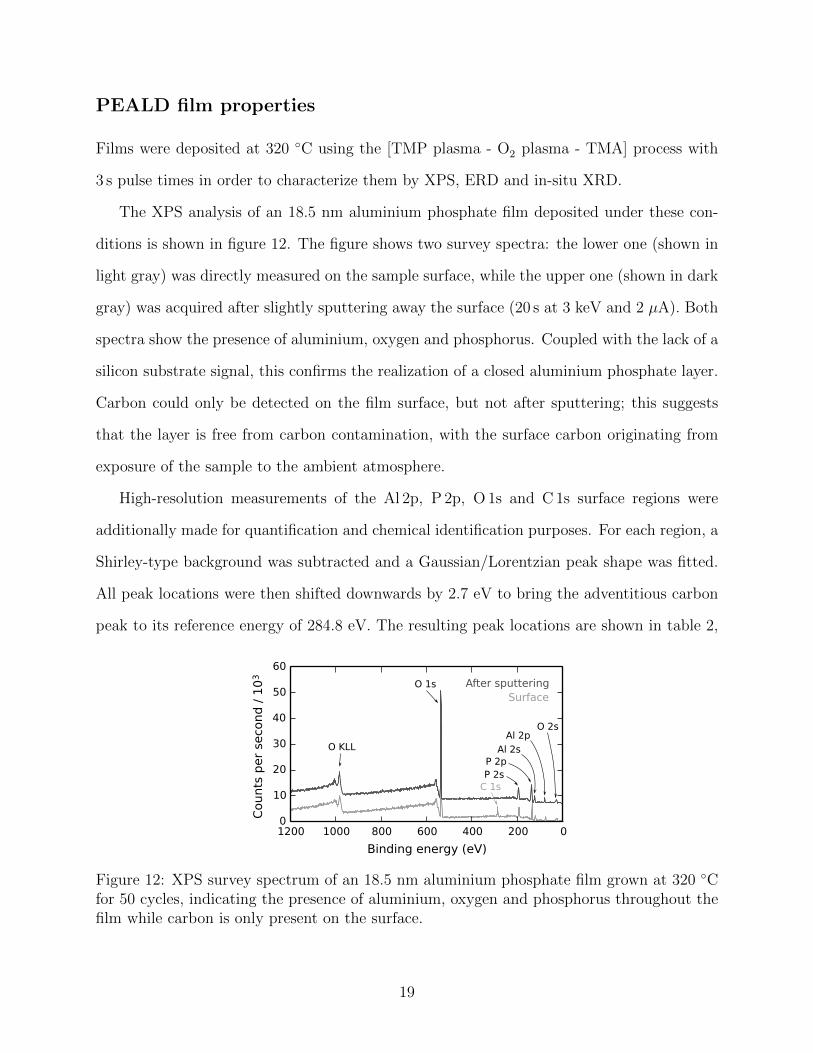
The XPS analysis of an 18.5 nm aluminium phosphate film deposited under these con-
ditions is shown in figure 12. The figure shows two survey spectra: the lower one (shown in
light gray) was directly measured on the sample surface, while the upper one (shown in dark
gray) was acquired after slightly sputtering away the surface (20 s at 3 keV and 2 µA). Both
spectra show the presence of aluminium, oxygen and phosphorus. Coupled with the lack of a
silicon substrate signal, this confirms the realization of a closed aluminium phosphate layer.
Carbon could only be detected on the film surface, but not after sputtering; this suggests
that the layer is free from carbon contamination, with the surface carbon originating from
exposure of the sample to the ambient atmosphere.
High-resolution measurements of the Al 2p, P 2p, O 1s and C 1s surface regions were
additionally made for quantification and chemical identification purposes. For each region, a
Shirley-type background was subtracted and a Gaussian/Lorentzian peak shape was fitted.
All peak locations were then shifted downwards by 2.7 eV to bring the adventitious carbon
peak to its reference energy of 284.8 eV. The resulting peak locations are shown in table 2,
020040060080010001200
Binding energy (eV)
0
10
20
30
40
50
60
Counts
per
seco
nd /
10
3
SurfaceAfter sputtering
Al 2pO KLL
O 2s
Al 2sP 2pP 2s
C 1s
O 1s
Figure 12: XPS survey spectrum of an 18.5 nm aluminium phosphate film grown at 320 ◦Cfor 50 cycles, indicating the presence of aluminium, oxygen and phosphorus throughout thefilm while carbon is only present on the surface.
19
along with the atomic percentages of Al, P, O and C. These were calculated from the surface
areas under each peak, making use of tabulated sensitivity factors. A sample deposited
under these conditions was also quantified by elastic recoil detection (ERD) analysis, of
which the results are also shown in table 2. Finally, the theoretical amounts of aluminium,
phosphorus, oxygen are included for two possible types of aluminium phosphate, namely
aluminium orthophosphate (AlPO4) and aluminium pyrophosphate (Al4P6O21). The main
difference between them is the P/Al ratio, which is unity in the former case and 1.5 in the
latter.
The chemical shifts are in agreement with the ones expected for an aluminophosphate
material.27 The XPS surface measurement shows a considerable amount of carbon; after
etching away some surface material, the remaining amount of carbon is below the detection
limit of about 1%, the P/Al ratio is 1.8 and the atomic percentage of oxygen is 57%. The
ERD analysis (which is more accurate, generally to within ±1%) shows a P/Al ratio of 1.8,
and 2.2% of carbon impurities. We conclude that this layer mainly consists of aluminium
pyrophosphate, although still with some excess phosphorus.
A thick film (400 cycles, resulting in a layer thickness of about 150 nm) was grown
to study its crystallinity by in-situ X-ray diffraction (XRD) during annealing in a helium
Table 2: XPS peak positions measured on the deposited aluminium phosphate film, togetherwith theoretical and measured atomic percentages of aluminium, phosphorus, oxygen andcarbon determined by XPS and ERD.
are lighter) and the temperature (dashed white line) as a function of time during a linear
ramp up to 1050 ◦C at 12 ◦C/min. The material starts off amorphous, but three distinct
diffraction peaks appear when the temperature approaches 900 ◦C. These are more easily
visible in figure 14, where the XRD patterns before and after annealing have been plotted in
a more conventional way. The observed diffraction pattern after crystallization corresponds
to triclinic AlPO4 tridymite.28
Figure 13: In-situ XRD measurement of the aluminium phosphate film while applying a lineartemperature ramp from room temperature to 1050 ◦C at 12 ◦C/min in a He atmosphere.The as-deposited material is amorphous, but becomes crystalline upon heating to around900 ◦C.
20 25 30 35
2 (°)
Diffr
act
ed
inte
nsi
ty (
a.u
.)
Before anneal
After anneal
AlPO4 tridymite
Figure 14: XRD patterns measured at room temperature before and after annealing forthe same aluminium phosphate film as in figure 13. The pattern before annealing onlyshows an amorphous background, while the one after annealing shows clear diffraction peakscorresponding to triclinic AlPO4 tridymite.
21
Conclusions
We demonstrated the layer-by-layer growth of aluminium phosphate by exploiting the poly-
merization properties of an inductively coupled trimethyl phosphate plasma. The plasma was
shown to contain excited hydrogen and oxygen atoms and produced hydrogen gas in addition
to hydrocarbons, oxygen and CO2, indicating that chemical bonds in the TMP molecule were
being broken and reconfigured. At low temperatures, the TMP plasma polymerized at a high
rate and continuously grew an organophosphate layer; at temperatures above 300 ◦C, this
process was inhibited. The addition of subsequent O2 plasma and TMA pulses resulted in
the growth of aluminium phosphate, likewise showing a strong temperature dependency. We
distinguished a low-temperature PECVD regime, where the growth per cycle and the P/Al
ratio increased with the TMP plasma duration, and a high-temperature PEALD regime,
where they saturated. The TMP plasma and O2 plasma steps resulted in the formation of
a phosphorus-containing surface which contained hydroxyl groups and readily reacted with
an organometallic precursor such as TMA to form aluminium-oxygen bonds. Saturation
with regard to the TMA exposure was found in both temperature regimes, backed by the
observation of short CH4 spikes when TMA was pulsed. The resulting films consisted of


![Advanced Coating: Laser Metal Deposition of Aluminium ... · Laser Technology Institute [26-27], and laser melting deposition (LMD) by the Beihang University (China) [28-31]. Despite](https://static.documents.pub/doc/80x56/5f0c5a047e708231d434f916/advanced-coating-laser-metal-deposition-of-aluminium-laser-technology-institute.jpg)

![. Observation of Cu deposition on glassy carbon …...are chemical pollutants of the atmosphere, water systems, and many food products [1]. Tricresyl phosphate (TCP), a potential contaminate](https://static.documents.pub/doc/80x56/5f0797d37e708231d41dc1e9/-observation-of-cu-deposition-on-glassy-carbon-are-chemical-pollutants-of-the.jpg)


