14
| Date post: | 19-Jul-2015 |
| Category: |
Economy & Finance |
| Upload: | ats-investments |
| View: | 49 times |
| Download: | 0 times |


Current price 65.40
Sector Fertilizers
No of shares 551688100
52 week high 74.75
52 week low 33.80
BSE Sensex 27886.21
Nifty 8448.10
Average Volume 557,213
BSE Code 524230
NSE Symbol RCF
Recommendation
– BUY/HOLD
Date – 20/04/2015
Rashtriya Chemicals and Fertilizers Ltd.
Company Overview
RCF is a leading fertilizer and chemical manufacturing company in India in the Public Sector. It was
established on 6th March, 1978 on the reorganization of erstwhile Fertilizer Corporation of India Ltd. into five
new companies viz. Fertilizer Corporation of India (FCI), Hindustan Fertilizer Corporation Limited (HFC),
Projects & Development India Limited (PDIL), National Fertilizers Limited (NFL) and Rashtriya Chemicals &
Fertilizers Limited (RCF).
Company operates two units viz. one at Trombay (Mumbai) and the other one at Thal, Raigad district, about
100 KM from Mumbai. Company has portfolio of products which includes Urea, Complex Fertilizers and
Industrial Chemicals. The Ujjwala Urea and Complex fertilizer Suphala brands of fertilizers manufactured by
RCF carry high brand equity and are recognized brands all over the country. These products are taken to the
farthest corner of the country by extensive RCF dealers network spread throughout the country.
RCF also produces bio-fertilizers, micronutrients and 100% water soluble fertilizers. Apart from these
products, RCF produces 20 industrial chemicals such as Methanol, Ammonium bicarbonate, Methyl Amine,
Formic Acid, Dimethyl Formamide etc. which find elaborate applications in many industries like dyes, solvents,
leather, pharmaceuticals and a host of other industries.
RCF always strives for upkeep of the plants through modernizing and upgrading technology. Revamping and
de-bottlenecking is the secret that has kept the company thriving for four and a half decades. As part of
modernization, RCF has modernized its Ammonia – I, Nitric Acid, Methanol and ANP plants at its Trombay
unit. This has facilitated plants to sustain operations and meet technological challenges of improved efficiency,
lower energy consumption and maintain environmental norms. It has also resulted in company achieving the
highest standards of safety and product quality. Company has also completed another ambitious project viz.
Ammonia revamp at Thal unit which enabled company to produce an additional 3.0 Lakh MT of Urea and save
precious foreign exchange. The current market capitalisation stands at Rs 3,657.69 crore.

Category No. of Shares Percentage
Promoters 441,353,888 80.00
General Public 42,488,257 7.70
Financial Institutions 38,077,431 6.90
Foreign Institutions 16,046,886 2.91
Other Companies 8,081,789 1.46
Foreign - Others 3,226,477 0.58
Others 1,390,514 0.25
Foreign - NRI 848,750 0.15
NBFC and Mutual
Funds172,868 0.03
Foreign - OCB 900 0.00
Foreign Industries 340 0.00
Market Cap (Rs Cr) – 3591.49
Company P/E (x) – 8.80
Industry P/E (x) – 10.78
Book Value (Rs) – 45.47
Price / BV (x) – 1.43
Dividend (%) – 15 %
EPS (TTM) – 7.40
Dividend Yield (%) – 2.30 %
Face Value (Rs) – 10
Share Holding Pattern Financial Details

Industry Overview
India fertilizer industry is one industry with immense scopes in the future. India is primarily agriculture oriented
country and its economy is highly dependent on the agrarian produce. The majority of the populace of India
lives in rural areas and the foremost occupation in the villages is agriculture. Developments pertaining to
different industries are being made on a massive scale to change the country's economy from an agrarian one
to a industrial one. It is extremely important for the fertilizer industry India to have development in terms of
technologically advance manufacturing process and innovative new-age products.
Fertilizers play an important role in increasing efficiency of agricultural output. With the strengthening ofpricing control policies and reforms, the fertilizers market is expected to be regulated soon in India. Fertilizerproducts are based on chemicals such as Nitrogen, Potassium and Phosphorus, where nitrogen basedfertilizers have the largest usage in India. India is the second largest consumer of fertilizers in the World, after
China. It accounted for 15.3 per cent of the World’s consumption of nitrogenous (N), 19 per cent of phosphatic
(P) and 14.4 per cent of potassic (K) nutrients in 2008 (FAI, 2010). Indian agricultural fertilizers market is
anticipated to be growing at the CAGR of around 7% during 2012-17. Indian fertilizers market structure
constitute of public as well as private companies, manufacturing wide range of phosphatic and nitrogenous
based fertilizers.
Fertilizer management is mostly influenced by two sets of policies: fertilizer subsidies and nutrient
management policies. In a five-year perspective, changes to fertilizer subsidy schemes can be anticipated in
India to rebalance fertilization; : As monsoons picked up pace during Q2 FY15, the sales volumes are estimatedto have picked up during Q2 FY15. However, gas availability and prices continue to remain a concern for theindustry. The comprehensive fertiliser policy is also expected to usher in long-term and long-awaited reformsfor the fertiliser industry, largely related to improvement in soil health and optimisation of nutrientconsumption, apart from ensuring long-term food security of the country by trying up long-term supply offertilisers and raw materials.

Balance Sheet
Mar '14 Mar '13 Mar '12 Mar '11 Mar '10
Sources Of Funds
Total Share Capital 551.69 551.69 551.69 551.69 551.69
Equity Share Capital 551.69 551.69 551.69 551.69 551.69
Reserves 1,956.70 1,803.60 1,619.51 1,460.04 1,285.45
Networth 2,508.39 2,355.29 2,171.20 2,011.73 1,837.14
Secured Loans 1,128.68 1,037.87 294.33 351.71 258.10
Unsecured Loans 538.41 635.34 890.88 129.91 1,072.74
Total Debt 1,667.09 1,673.21 1,185.21 481.62 1,330.84
Total Liabilities 4,175.48 4,028.50 3,356.41 2,493.35 3,167.98
Application Of Funds
Gross Block 3,999.29 3,675.82 3,483.97 3,245.25 3,110.69
Less: Accum. Depreciation 2,379.62 2,259.11 2,086.82 1,962.82 1,867.98
Net Block 1,619.67 1,416.71 1,397.15 1,282.43 1,242.71
Capital Work in Progress 77.19 184.25 177.31 90.84 140.05
Investments 17.86 18.04 18.04 15.32 15.30
Inventories 802.54 1,205.06 1,177.71 534.75 409.59
Sundry Debtors 2,769.09 2,579.21 1,978.24 891.17 858.98
Cash and Bank Balance 70.95 175.74 592.28 99.14 84.54
Total Current Assets 3,642.58 3,960.01 3,748.23 1,525.06 1,353.11
Loans and Advances 257.55 245.34 277.65 574.91 1,482.97
Fixed Deposits 0.00 0.00 0.00 320.11 700.11
Total CA, Loans & Advances 3,900.13 4,205.35 4,025.88 2,420.08 3,536.19
Current Liabilities 1,136.56 1,500.53 1,971.70 1,072.16 1,543.43
Provisions 302.81 295.32 290.27 243.16 222.84
Total CL & Provisions 1,439.37 1,795.85 2,261.97 1,315.32 1,766.27
Net Current Assets 2,460.76 2,409.50 1,763.91 1,104.76 1,769.92
Miscellaneous Expenses 0.00 0.00 0.00 0.00 0.00
Total Assets 4,175.48 4,028.50 3,356.41 2,493.35 3,167.98
Contingent Liabilities 438.78 548.26 634.93 407.19 125.23
Book Value (Rs) 45.47 42.69 39.36 36.46 33.30
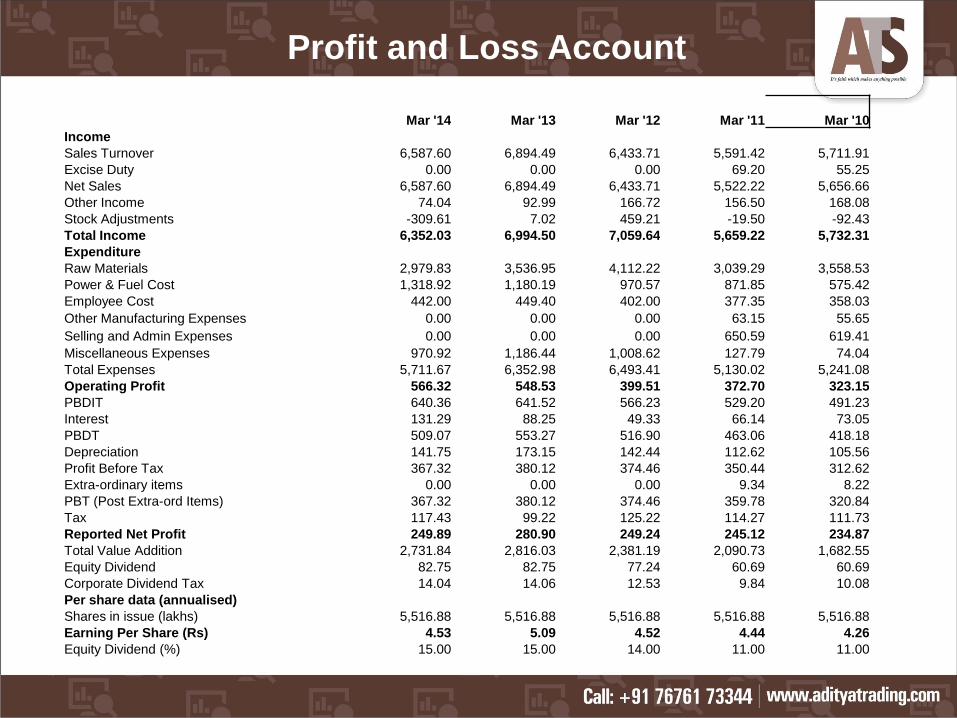
Profit and Loss Account
Mar '14 Mar '13 Mar '12 Mar '11 Mar '10
Income
Sales Turnover 6,587.60 6,894.49 6,433.71 5,591.42 5,711.91
Excise Duty 0.00 0.00 0.00 69.20 55.25
Net Sales 6,587.60 6,894.49 6,433.71 5,522.22 5,656.66
Other Income 74.04 92.99 166.72 156.50 168.08
Stock Adjustments -309.61 7.02 459.21 -19.50 -92.43
Total Income 6,352.03 6,994.50 7,059.64 5,659.22 5,732.31
Expenditure
Raw Materials 2,979.83 3,536.95 4,112.22 3,039.29 3,558.53
Power & Fuel Cost 1,318.92 1,180.19 970.57 871.85 575.42
Employee Cost 442.00 449.40 402.00 377.35 358.03
Other Manufacturing Expenses 0.00 0.00 0.00 63.15 55.65
Selling and Admin Expenses 0.00 0.00 0.00 650.59 619.41
Miscellaneous Expenses 970.92 1,186.44 1,008.62 127.79 74.04
Total Expenses 5,711.67 6,352.98 6,493.41 5,130.02 5,241.08
Operating Profit 566.32 548.53 399.51 372.70 323.15
PBDIT 640.36 641.52 566.23 529.20 491.23
Interest 131.29 88.25 49.33 66.14 73.05
PBDT 509.07 553.27 516.90 463.06 418.18
Depreciation 141.75 173.15 142.44 112.62 105.56
Profit Before Tax 367.32 380.12 374.46 350.44 312.62
Extra-ordinary items 0.00 0.00 0.00 9.34 8.22
PBT (Post Extra-ord Items) 367.32 380.12 374.46 359.78 320.84
Tax 117.43 99.22 125.22 114.27 111.73
Reported Net Profit 249.89 280.90 249.24 245.12 234.87
Total Value Addition 2,731.84 2,816.03 2,381.19 2,090.73 1,682.55
Equity Dividend 82.75 82.75 77.24 60.69 60.69
Corporate Dividend Tax 14.04 14.06 12.53 9.84 10.08
Per share data (annualised)
Shares in issue (lakhs) 5,516.88 5,516.88 5,516.88 5,516.88 5,516.88
Earning Per Share (Rs) 4.53 5.09 4.52 4.44 4.26
Equity Dividend (%) 15.00 15.00 14.00 11.00 11.00

Dividend History
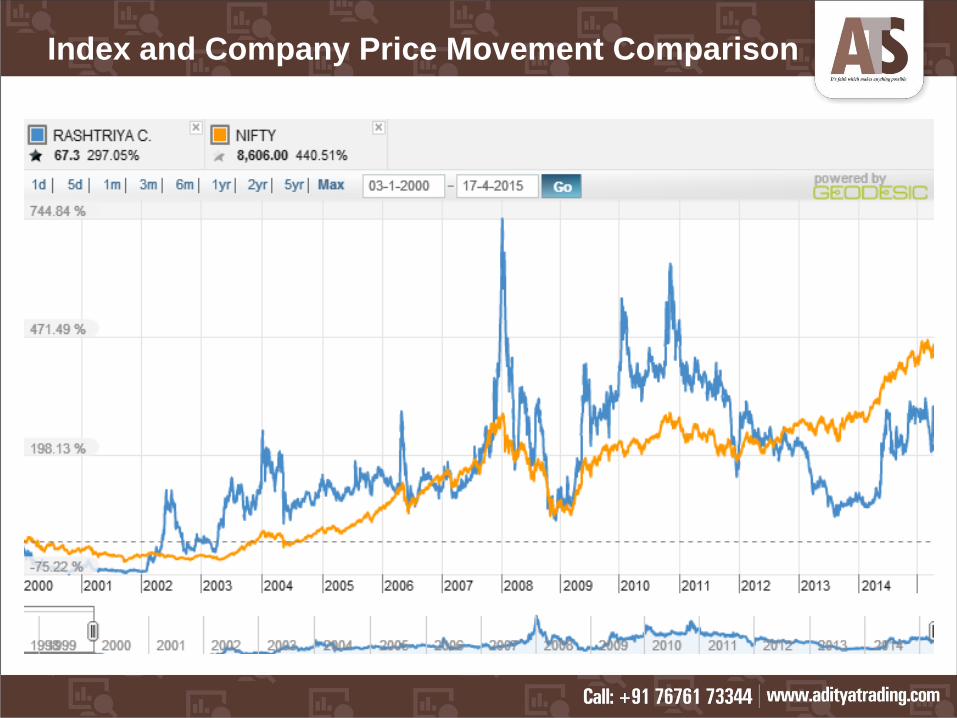
Index and Company Price Movement Comparison

Company Forecast

Name Value Action
RSI(14) 69.846 Buy
STOCH(9,6) 78.071 Buy
STOCHRSI(14) 67.695 Buy
MACD(12,26) 116.560 Buy
ADX(14) 50.696 Buy
Williams %R -17.756 Overbought
CCI(14) 111.9634 Buy
ATR(14) 103.6714 High Volatility
Highs/Lows(14) 115.3500 Buy
Ultimate Oscillator 68.670 Buy
ROC 162.699 Buy
Bull/Bear Power(13) 286.8980 Buy
Technical Indicators

PBIT – 6.37 v/s 5.37
RoCE – 11.94 v/s 11.62
RoE – 10.04 v/s 9.32
Net Profit Margin – 3.75 v/s 4.02
Return on net worth – 9.96 v/s 11.62
D/E Ratio – 0.66 v/s 0.71
Interest Cover – 4.88 v/s 7.27
Current Ratio – 1.09 v/s 1.03
Reserves – 1956.70 cr v/s 1803.60 cr
PAT – 249.89 cr v/s 280.90 cr
Total assets – 4175.48 cr v/s 4028.50 cr
Net sales – 6587.60 cr v/s 6894.49 cr
Book Value – 45.47 v/s 42.69
Important Ratios (YoY)
Days BSE NSE
30 60.92 60.96
50 63.63 63.65
150 62.83 62.83
200 61.45 61.45
Simple Moving Average

Investment Rationalize
Rashtriya Chemicals and Fertilizers Ltd (RCF), a Government of India Undertaking is a leading fertilizer and chemical manufacturing company with about 80% of its equity held by the Government of India with a market capitalization of Rs.3591 crore.
Chemicals essential for every industry from food and drugs to Synthetic fibres, from textiles and cement to pesticides and paints; from explosives to specialty solvents and dye stock are produced by RCF, which helps the company to tap the demand of the products in each and every industry.
Company have a well established chain of dealers and corporative marketing societies in order to sell the
products all over the country.
Improvement in technology used in manufacturing and increase in production capacity will help the company
in order to face the challenges in the market in terms of efficiency, production capacity and reduction in
manufacturing cost.
MoU and Joint Ventures with industrial majors such as GAIL, Coal India and FACT will add to the profitability
and efficiency of the company.
Governments policy towards agriculture, its efforts towards modernizing public limited companies and “Make
in India” campaign will act as a major trigger towards the next big movement.
Price to Sales Ratio of the company stands at 0.55, which means company is reasonably priced, and the
past consistent performance and future growth prospects ensures the company is reasonably priced.


