76
Texas CHIP Coalition 83rd Session Briefing for Legislative Staff January 24, 2013
Texas CHIP Coalition
83rd Session Briefing for Legislative Staff
January 24, 2013

Thanks for the Generous Support
of Our Event Sponsors
Texas Association of
Community Health Centers
Children’s Hospital
Association of
Texas
Texas Pediatric Society
the Texas Chapter of the American
Academy of Pediatrics

Medicaid and CHIP 101
Kathy Eckstein
Director of Public Policy
Children’s Hospital Association of Texas
(CHAT)

The Significance of Medicaid
• 14% of the Texas population was covered
by Medicaid in 2011, and more than three-
fourths of these recipients were children.
• In 2011, Medicaid totaled $29.4 billion (All
Funds), accounting for 26% of the budget.
• Of the total funding request for health and
human services agencies in 2014-15,
Medicaid accounts for almost 80%.
4

Medicaid History and Oversight
• Established by Title XIX of the Social Security
Act in 1965
• A joint state-federal entitlement program
• Administered by the Centers for Medicare
and Medicaid Services (CMS), part of the US
Department of Health and Human Services
• In Texas, the Health and Human Services
Commission (HHSC) is the “single state
agency” for Medicaid.
5

Children’s Health Insurance Program
(CHIP) History and Oversight
• Established by Title XXI of the Social
Security Act in 1997
• Not a federal entitlement, but in Texas
all eligible children are provided service
• Like Medicaid, CMS administers the
federal program and HHSC administers
CHIP.
6

What is Medicaid???
7

What Does Medicaid Provide?
• Health insurance coverage to low-income
– Children (all medically necessary services)
– Pregnant Women
– Very Low Income Parents
– Persons with Disabilities
• Assistance to low-income Medicare beneficiaries
• Long-term care services for the elderly and
persons with disabilities
• Support for the health care safety net
8

9

Income Caps for Texas Medicaid and CHIP, 2012
0%
50%
100%
150%
200%
250%
Pregnant
Women
Newborns Age 1-5 Age 6-18 TANF
parent of
2, no
income
Working
Parent of
2
SSI (aged
or
disabled)
Long
Term
Care
CHIP
Mandatory Optional
$25,390
$35,317 $35,317
185% 185%
133%
$19,090
100% $2,256 $3,696
12% 19%
75%
$8,376
225%
$25,128 $38,180
200%
indicates Texas choices to go ABOVE federal minimum
Income Limit as Percentage of Federal Poverty Income
Annual Income is for a family of 3, except individual incomes shown for SSI and
Long Term Care 10

11
2012 Federal Poverty Levels
Family Size
12% 75% 100% 133% 185% 200%
1 $1,340 $8,378 $11,170 $14,856 $20,665 $22,340
2 $1,816 $11,348 $15,130 $20,123 $27,991 $30,260
3 $2,291 $14,318 $19,090 $25,390 $35,317 $38,180
4 $2,766 $17,288 $23,050 $30,657 $42,643 $46,100
5 $3,241 $20,258 $27,010 $35,923 $49,969 $54,020
6 $3,716 $23,228 $30,970 $41,190 $57,295 $61,940
7 $4,192 $26,198 $34,930 $46,457 $64,621 $69,860
8 $4,667 $29,168 $38,890 $51,724 $71,947 $77,780

Citizenship Requirements
• Medicaid does not provide health
coverage to undocumented persons.
• Medicaid reimbursement for
undocumented persons is limited to
emergency medical services.
• Legal immigrant adults are not covered by
Texas Medicaid.
• Legal immigrant children are covered by
Medicaid, as well as CHIP.
12

13
Texas Medicaid/CHIP: Who is Helped Today
Medicaid Children, 2,540,312
Maternity 93,531
TANF Parent, 82,660
Poor Parents, 143,406
Elderly, 320,467
Disabled, 418,368
CHIP, 583,151
August 2012, HHSC data
Total enrolled 8/1/2012: 3.6 million Medicaid; 583,000 CHIP
1 in 7 Texans, but 42% of Texas kids
25.6 million Texans 7.4 million under 19

2,027,0822,105,663 2,118,841
2,276,341
2,519,915
2,728,628 2,769,173
298,776 307,700452,402 500,461 535,776 534,943 581,687
2,325,858 2,413,3632,571,243
2,776,802
3,055,691
3,263,5713,350,860
0
500,000
1,000,000
1,500,000
2,000,000
2,500,000
3,000,000
3,500,000
4,000,000
2006 2007 2008 2009 2010 2011 2012
Nu
mb
er
En
rolle
d
Total Children Enrolled
Children <19 Enrolledin Medicaid
CHIP
Children Under 19 Enrolled in Medicaid & CHIP
Texas, 2006-2012
Note: Counts are for May of each year. CHIP counts include the CHIP Perinatal Program.
Source: Final Count – Medicaid Enrollment by Month at www.hhsc.state.tx.us/research.MedicaidEnrollment/ME-Monthly.asp.
CHIP Enrollment, Renewal and Disenrollment by Month at www.hhsc.state.tx.us/research/CHIP/Disenrollment-Rate.asp.
CHIP Perinatal Coverage Enrollment by Month at www.hhsc.state.tx.us/research/CHIP/perinatal.shtml.
Children's Hospital Association of Texas

Texas Medicaid & CHIP Eligibles by Age
May 2012
Sources: Medicaid Eligibles: HHSC 8th Month Medicaid Eligibility File (final eligibility count); CHIP Eligibles: Maximus
A010 CHIP Enrollment file. Prepared by Data Quality and Dissemination, SDS, HHSC.
Children's Hospital Association of Texas

Number and Percent* of Texas Children Enrolled in
Public Insurance (Medicaid or CHIP) by Age Group
May 2012=100,000 Texas Children
Enrolled in Public Insurance
All Others
Infants and Toddlers
0-1 Years – 800,000 ChildrenPreschool
2-4 Years – 1,200,000 Children
Elementary School 5-11 Years
2,800,000 Children
Public Insurance - 500,000 (63%) Public Insurance - 600,000 (50%)
Public Insurance - 1,300,000 (46%)
Junior High School
12-14 Years – 1,200,000 Children
High School 15-18 Years
1,500,000 Children
Public Insurance - 500,000 (42%)
*Numbers rounded to nearest 100,000; percentages based on rounded numbers.
Sources: Medicaid 8th Month Eligibility File (final eligibility count) & Maximus A010 CHIP Enrollment File; Data Quality & Dissemination; Strategic Decision Support; HHSC. 2012
Population Projections by Age: 2010-2050, Texas State Data Center, Texas Population Estimates & Projections Program; University of Texas at San Antonio, November 2012.
Public Insurance - 500,000 (33%)

7,442,755
7,779,305
8,345,673
8,958,154
Projected increasebetween 2012 and 2015:
336,550
Projected increase between 2015 and 2020:
566,368
Projected increase between 2020 and 2025:
612,511
5,000,000
6,000,000
7,000,000
8,000,000
9,000,000
10,000,000
2012 2015 2020 2025
Nu
mb
er
of
Ch
ild
ren
Projected Growth in the Number of Children
Under 19 Years of Age
Texas 2015, 2020 and 2025
Source: Projections of the Population of Texas and Counties in Texas by Age, Sex and Race/Ethnicity for 2010-2050 (based on 2000-2010
Migration (1.0) Scenario); Population Estimates and Projections Program, Texas State Data Center, Office of the State Demographer, Institute
for Demographic and Socioeconomic Research, The University of Texas at San Antonio, November 2012.
Children's Hospital Association of Texas

18
Services and Providers

Medicaid Services: Mandatory and Optional
Federal Law Requires • Inpatient/outpatient hospital • Physician services • Lab and x-ray • EPSDT (Texas Health Steps) • Ambulance • Home health • Rural Health Clinics/FQHCs • Nursing facilities • Immunizations/comprehensive
care for children • Family planning • Nurse Midwife, Nurse
Practitioner • Medical and surgical services
provided by a dentist
Federal Law Allows • Prescription drugs • Institutional care for
developmentally disabled • Community care for elders or
people with disabilities • Rehabilitation and other therapies • Care by physician extenders and
mental health providers • Dental care, Eyeglasses, Hearing
aids • Private duty nursing • Maternity service clinics • Case management • Podiatry • Chiropractic • Hospice services 19

Children's Hospital Association of Texas

Teen Obstetrics = 0.4% (47,400 days)
Normal Newborns = 4.4% (546,600 days)
Neonatal = 7.1% (890,100 days)
Pediatric 0-17 Yrs = 6.0% (749,700 days)
Adults 18+ Yrs = 82.1% (10.3 million days)
Texas Hospital Industry Serves an Adult Population Predominantly
Total Inpatient Days in 375 Texas Acute Care Hospitals* = 12.5 Million
*Includes acute care hospitals only: CHAT - 7; Other Urban - 285; Rural - 83. Excludes state-owned and licensed psychiatric hospitals, rehab hospitals, acute long term care hospitals, approximately 65 additional rural hospitals and other hospitals specificially not required to report discharge data in 2010. Pediatric days include inpatient data for pediatric cases age 0 -17, excluding normal newborns and teen obstetrical care.
Source: Texas Hospital Inpatient Discharge Public Use Data File, 2010; State Center for Health Statistics; DSHS.
Children's Hospital Association of Texas

22
Payment Models
• As of July 2012, 82% of Medicaid clients were provided care through risk-based contracts with Managed Care Organizations.
• Dental services for children on Medicaid are provided through contracts with Dental Maintenance Organizations.
• Payment for Medicaid clients who are newly enrolled and most children receiving SSI (who are now voluntary for managed care) is made through fee-for-service claims.
• Children enrolled in CHIP are also provided care through risk-based managed care contracts.

Medicaid Managed Care Programs
• The STAR program serves low-income families, non-disabled children and pregnant women.
• The STAR+PLUS program integrates acute and long-term care services for clients who are disabled or elderly.
• The STAR Health program provides care to children in foster care.
• NorthSTAR is a behavioral health delivery system in the Dallas area.
23

Provider Payment Rates
• HHSC develops rates for fee-for-service claims.
• HHSC’s Consolidated Budget contains detailed information on rates: http://www.hhsc.state.tx.us/about_hhsc/finance/2014-2015.pdf
• Medicaid provider rates are generally below
rates for comparable services in Medicare and
the commercial insurance marketplace.
• Managed care payments must be actuarially sound; plans negotiate rates with providers to build an adequate network.
24

Safety Net Support
25

Safety Net Support
• Safety Net Hospitals – High volume Medicaid and charity care hospitals
– Regional, highly specialized services; burns,
trauma, tertiary care
• Disproportionate Share Hospital (DSH) – Medicaid program to assist with the shortfall in
reimbursement and uninsured costs
– State match provided through local public funds
– Texas’ 2012 federal DSH allotment: $979 million
– Texas’ 2013 DSH funds in jeopardy due to lack of
state match
26

A Look at Medicaid Spending
27

FMAP: Federal Medical
Assistance Percentage
• FMAP is an annual calculation based on a
state’s per capita income, relative to the nation.
• As Texas’ per capita income has improved, the
FMAP has declined about 5 points the past 20
years, contributing to the cost of Medicaid.
• Although differences seem small, given the
volume of spending the fiscal impact is
significant.
• The FMAP in 2013 is 59.3%.
28

Enhanced FMAP for CHIP
• States receive federal funds based on an
Enhanced FMAP for CHIP.
• In 2013, Texas’ match rate is 71.51%
federal.
• Unlike Medicaid, the allotment to states is
capped, based on a formula that
recognizes growth in the child population
and variance in health care costs.
29

30
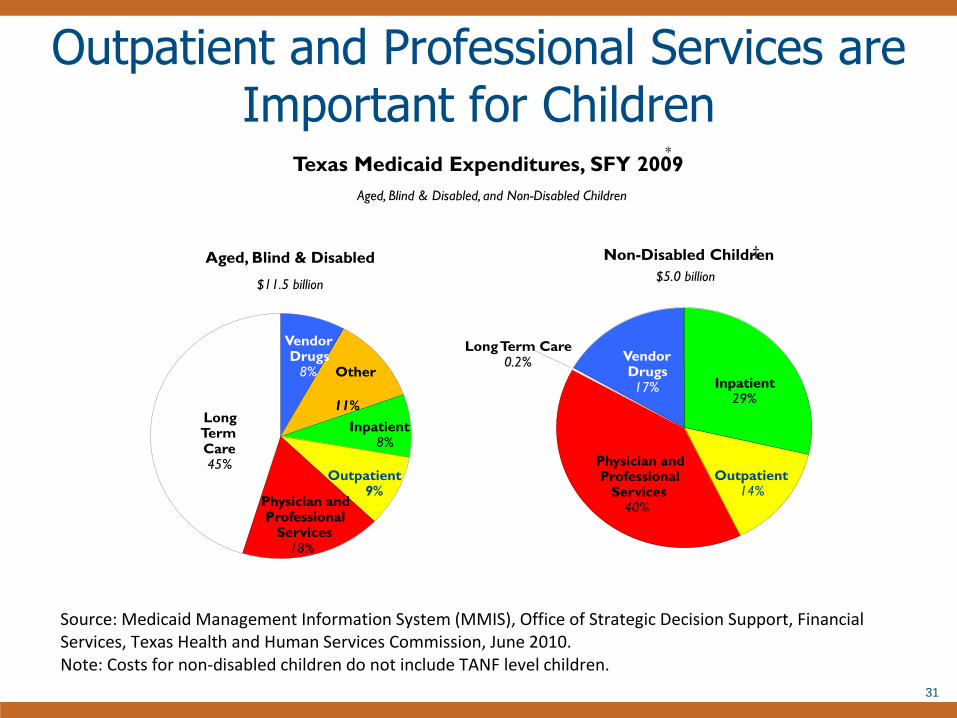
Outpatient and Professional Services are Important for Children
Texas Medicaid Expenditures, SFY 2009 *
Aged, Blind & Disabled, and Non-Disabled Children
Aged, Blind & Disabled
$11.5 billion
Non-Disabled Children ‡
$5.0 billion
Inpatient 8%
Outpatient 9%
Physician and Professional
Services 18%
Other
11%
Vendor Drugs
8%
Long Term Care 45%
Inpatient 29%
Outpatient 14%
Physician and Professional
Services 40%
Vendor Drugs 17%
Long Term Care 0.2%
31
Source: Medicaid Management Information System (MMIS), Office of Strategic Decision Support, Financial Services, Texas Health and Human Services Commission, June 2010. Note: Costs for non-disabled children do not include TANF level children.
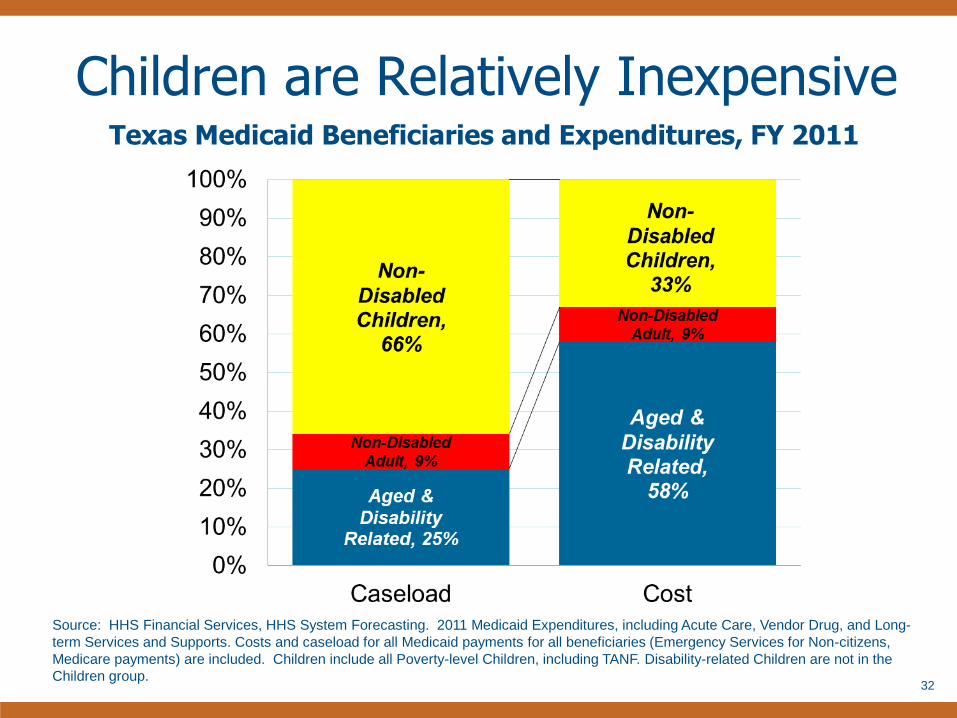
Children are Relatively Inexpensive
32
Source: HHS Financial Services, HHS System Forecasting. 2011 Medicaid Expenditures, including Acute Care, Vendor Drug, and Long-
term Services and Supports. Costs and caseload for all Medicaid payments for all beneficiaries (Emergency Services for Non-citizens,
Medicare payments) are included. Children include all Poverty-level Children, including TANF. Disability-related Children are not in the
Children group.
Texas Medicaid Beneficiaries and Expenditures, FY 2011

What’s Next for Medicaid?
33

1115 Transformation Waiver
• In September 2011, CMS approved an 1115
waiver to improve health outcomes while
containing costs through delivery system reform.
• The 5-year demonstration allows Texas to
expand managed care while preserving funding
formerly provided through Upper Payment Limit
(UPL) payments.
• $17 billion in federal funds are available to
Texas (over 5 years), dependent on $12 billion
in matching funds and performance measures
being met.
34

1115 Waiver (continued)
• Two new funding streams replace UPL funds:
– Uncompensated Care Payments
– Delivery System Reform Incentive Payments
(DSRIP)
• 20 Regional Healthcare Partnerships have
submitted over 1,300 DSRIP projects.
• For the pediatric population, projects focus on
access to care, medical homes, navigation
services, health improvement activities, and
management of patients with chronic conditions.
35

Affordable Care Act (ACA)
• Streamlined application for Medicaid, CHIP
and subsidized Exchange coverage
• Medicaid and CHIP eligibility based on
Modified Adjusted Gross Income (MAGI),
without assets tests and income disregards
• Transition of children age 6 to 18 between
100% and 133% FPL from CHIP to Medicaid
• Increases for certain Medicaid services by
primary care providers to Medicare rates
(calendar years 2013 and 2014)
36

References and Resources • Centers for Medicare and Medicaid Services
http://www.cms.org
• Health and Human Services Commission
http://www.hhsc.state.tx.us (PINK BOOK)
• Kaiser Family Foundation
http://www.kff.org
• Children’s Hospital Association of Texas
http://www.childhealthtx.org
• Center for Public Policy Priorities
http://www.cppp.org
• Texas CHIP Coalition
http://www.texaschip.org
37

Thanks for the Generous Support
of Our Event Sponsors
Texas Association of
Community Health Centers
Children’s Hospital
Association of
Texas
Texas Pediatric Society
the Texas Chapter of the American
Academy of Pediatrics

39
The Texas CHIP Coalition was
formed in 1998 to work for
the establishment of a
strong Children’s Health
Insurance Program in
Texas. Today, our broad-
based Coalition continues
to work to improve access
to health care for all Texas
children, whether through
Medicaid, CHIP, or private
insurance. www.texaschip.org

40
Texas Kids’ Uninsured Rate Drops,
Thanks to CHIP and Medicaid
• Since 2000, Texas CHIP and streamlined children’s Medicaid have
provided health coverage for 2.1 million more Texas children.
– In May 2000 just under a million Texas kids had Medicaid, and there was
no CHIP; today 3.1 million kids are covered.
– Overall uninsured rate of Texas children dropped from 25% in 1997 to
16.3% of all kids in 20011.
– Uninsured rate for Texas children below 200% FPL has dropped from
35% in 1997 to 21.5% in 2011 -- these are the kids potentially served
by children's Medicaid and CHIP.

41
Texas CHIP Coalition Supporting Organizations, 83rd Session American Congress of Obstetricians and
Gynecologists, Texas District
AMERIGROUP Community Care
Catholic Health Association of Texas
Center for Public Policy Priorities
Children's Defense Fund -- Texas
Children's Hospital Association of Texas (CHAT)
CHRISTUS Health
Coalition for Nurses in Advanced Practice
Community First Health Plans
Community Health Choice
Disability Rights Texas
Driscoll Health Plan
Harris Healthcare (former Harris County Hospital District)
insure•a•kid
La Fe Policy Research and Education Center
League of Women Voters of Texas
March of Dimes
Methodist Healthcare Ministries
National Association of Social Workers-Texas Chapter
National Council of Jewish Women Texas State Policy Advocacy Network
San Antonio Non-Profit Council
Seton Healthcare Family
Teaching Hospitals of Texas
Texans Care For Children
Texas Academy of Family Physicians
Texas AFL-CIO
Texas American Federation of Teachers (Texas AFT)
Texas Association of Community Action Agencies, Inc.
Texas Association of Community Health Centers
Texas Baptist Christian Life Commission
Texas Dental Association
Texas Hospital Association
Texas Impact
Texas Nurses Association
Texas Pediatric Society
United Ways of Texas

42
More Children’s Medicaid and CHIP Supporters These organizations have also adopted strong positions in favor of protecting
and strengthening Medicaid and CHIP – you may hear from them, too!
The Texas Catholic Conference http://www.txcatholic.org/legislative-agenda Support improvements and modernizations of the Medicaid and CHIP eligibility system.;
Expansion of Medicaid up to 133% of the federal poverty line; Improvements to Texas’ critical
public health safety net and infrastructure; Elimination of all system barriers that delay access
to newborn or prenatal care; Access to basic and preventive health care for low income
uninsured women and children, including access to breast and cancer screenings.; care and
dignity for persons who are aging or who live with disabilities.
Network of Texas Industrial Areas Foundation Organizations Austin, Valley, and Dallas Area Interfaith, COPS/Metro Alliance in San Antonio, Border
Interfaith and EPISO in El Paso, TMO in Houston, Border Organization in Del Rio, and West
Texas Organizing Strategy in Lubbock.
My Medicaid Matters Over 102 Texas organizations working together to provide a unified voice in support of a
strong Medicaid program that will continue to meet millions of Texans’ needs. Our mission is
to inform policymakers and the public about the benefits of Medicaid and what could happen
to Texans if Medicaid were reduced or eliminated. See www.mmmtx.org

43
To achieve these goals, the Texas CHIP
Coalition outlines the following principles:
1. Preserve comprehensive coverage under Medicaid and CHIP
2. Reverse Damaging Cuts to Texas’ Critical Public Health Safety Net and Infrastructure
3. Bolster the Texas Health Care Workforce
4. Reduce Health Care Costs by Supporting Practices that Improve the Quality of Care for Children, Mothers and Newborns
5. Continue to Improve and Modernize the Medicaid and CHIP Eligibility Systems
6. Use New Revenue Sources to Fill Budget Gaps instead of Slashing Health Care Programs for Children and other Vulnerable Texans.
7. Improve the health and well-being of Texas children by Maximizing Opportunities to connect entire families with affordable health care.

Preserve Comprehensive Coverage
under Medicaid and CHIP
Some proposals could re-structure Medicaid and CHIP in ways that could reduce
access to quality care for the over 3 million Texas children who rely on the
programs today to stay healthy.
Our coalition supports reforms to our public health insurance programs that:
• reduce the rate of health care spending growth while raising standards for
quality of care, promoting evidence-based cost-effective care, and improving
outcomes; and
• re-direct financial incentives away from rewarding either the over-or under-
provision of care.
We oppose re-structuring and deficit reduction methods that:
• reduce children’s access to comprehensive medically necessary care;
• reduce children’s eligibility for affordable comprehensive coverage;
• make children’s coverage unaffordable through cost-sharing obligations that
are excessive relative to family income;
• eliminate the current federal funding partnership that guarantees that Texas
can depend on increased federal funding to reflect both population and inflation
growth, and in response to higher needs in times of economic downturns and
major disasters. 44

Top Concerns: Block Grants, Per-capita Cap
• Block grant, PCC would lock Texas into our
historically low Medicaid spending, far below
national average.
• Both result of low provider fees and minimal
coverage of parents.
• Also locks in recent rate cuts, like physician fees
and “Medicare Equalization”
• Does not provide for cost surges due to medical
advances; (recent example, use of anti-retrovirals)
• Does not provide for natural disaster or recession
surges in enrollment
• Rewards states that have not attempted to
economize with a higher cap.
• Texas would either have to spend more state
funds on Medicaid, or significantly shrink our
Medicaid spending on a per-beneficiary basis.
45

Reverse Damaging Cuts to Texas’ Critical Public
Health Safety Net and Infrastructure
Health Care Cuts in Texas 2012-2013 Budget,
Supplemental Need in 2013
Medicaid/CHIP:
• $2 billion GR in specific cuts and “savings,”
– Provider rate/fee cuts (approx. $805 million GR);
– Other benefit and spending cuts (approx. $843 million GR); and
– Managed care expansion spending reductions (approx. $385.7 million GR
per HHSC rider #51)
• ~$4.7 billion in Medicaid Shortfall
– UPDATED score: $3.7 billion at HHSC, just under $1B @ DADS = $4.7
billion Medicaid-CHIP supplemental in January 2013.
– Because Texas Medicaid pays nearly $1 billion/month in state dollars
(GR) for health & long term care bills, the program (HHSC and DADS)
needs money ASAP to pay bills past March.
46
Reverse Damaging Cuts to Texas’ Critical
Public Health Safety Net and Infrastructure
• The Legislature must honor its 2011 pledge to fully fund and cover the Medicaid funding shortfall “IOU” in 2013.
• The Legislature must Carefully consider all benefit, policy changes, and provider rate cuts enacted since 2011, and reverse those that have reduced access to medically necessary care.
• Going forward, the Legislature must fully vet, evaluate, and transparently inform the public of the true impact--both fiscal and human—of all proposed reforms and cost-saving measures.

Medicaid and CHIP Rate Cuts in Texas 2012-2013 Budget
48
Rate Cuts 2010-2011 2012-2013
Nursing Homes 3% 0%
ICF-MR (not SSLC) 3% 2%
HCS Waiver 2% 1%
NF-related Hospice 2% 1%
Other Community Waivers 0% $12.5 million GR
cut in in admin for
agencies
Medicaid & CHIP physician, dentist,
orthodontist
2% 0%
Medicaid Hospital 2% 8%
Medicaid DME & Labs 2% 10.5%
Other Medicaid Providers 2% 5%
Other CHIP Providers 2% 8%
Medicaid Pediatric private duty
nursing & home health
2% 0%
Medicaid Managed Care premiums
reduced to “average acuity”
n/a $169.3 million
GR cut

Critical Condition: Texas Health
Professions
Shortage and Maldistribution
• “Data have shown year after year that Texas is faced with
two clear trends:
– 1) the population is growing faster than almost any other
state in the U.S.
– 2) the number of health care providers in not keeping
pace with that rate of growth
In addition, there continues to be major geographic
maldistributions of health care practitioners across Texas.”
Statewide Health Coordinating Council,
2011–2016 Texas State Health Plan


Budget Cuts Work Against Growing
Texas’ Health Care Workforce
• Graduate Medical Education funding slashed nearly 40%.
• Training of health care professionals eliminated or reduced – professional nurse shortage reduction and family medicine residency training.
• Physician Education Loan Repayment Program cut 80%
• Community Health Center (FQHC) infrastructure grants eliminated.


More Students than Residency Slots
• Texas increased its medical school enrollments 31% from fall 2002
to fall 2011, from 1,342 to 1,762.
• Texas currently provides instruction and operation formula funding
to support its medical students at $42,000 annually, or a total of
$168,000 per student.
• Without increases in the number of first-year residency positions,
beginning in 2014, at least 63 graduates of Texas medical schools
will not have an opportunity to enter a Texas residency program.
• By 2016, at least 180 medical school graduates will have to leave
the state for their first year of residency training due to a lack of
residency positions. The state’s investment in their education of
$168,000 per graduate, or $30.2 million annually will not benefit
the state.


Insurance Does Not Equal Access: Texas Must Grow
its Health Care Workforce • Increase, to parity with Medicare, all Medicaid and CHIP professional and provider
payments.
• Reverse 2011 cuts to health care provider education and training programs, invest in
expanded training and residency capacity to put our state on track for improved
access to care for all Texans. Specifically restore funding for: – the physician loan repayment program to encourage more physicians to practice in medically underserved
areas;
– the Texas dental loan repayment program; and
– the Children’s Medicaid loan repayment program, which provided loan repayments to primary and specialty
care physicians and dentists accepting Medicaid.
• Identify and promote innovations in training primary care residents that encourage
more medical students to choose primary care.
• Establish & implement a legislative plan to increase residency slots to match the
number of incoming medical students, to retain more of the doctors we have invested
in and trained.
• Plans to train & retain an adequate health workforce must cover the full spectrum of
clinicians, technicians, and para-professionals needed to provide access to care.
• Streamline Medicaid administrative processes to entice more providers to stay in
Medicaid.
• Medicaid-CHIP program integrity policies and practices should seek a proper
balance between due diligence and administrative burdens, for both providers
and clients.
55

Mothers and Babies
In 2006, 54,000 babies in Texas were born preterm and
33,000 were born low birthweight
Map: March of Dimes. 2012. http://www.marchofdimes.com/mission/prematurity_reportcard.html
Data is from 2006. “Texas Health Data,” Center for Health Statistics, Texas Department of State Health Services, http://www.dshs.state.tx.us/chs/default.shtm.

Mothers and Babies • CHIP Priority: Reduce Health Care Costs by
Supporting Practices that Improve the Quality of Care for Children, Mothers and Newborns
– Access to affordable basic and preventive health
care for low-income uninsured Texas women.
– Policies that promote early entry into prenatal care.
– Policies that promote on-going preventive care for women and children, like chronic disease management and annual screenings.
– Development of a Maternal Mortality Review Program and ongoing support for Fetal, Infant and Child Mortality Review Programs.
– Policies that ensure continued access to critical neonatal services.
– NICU policies and procedures that promote AAP levels of care.
– Maternity services that reflect best practices identified in current, peer-reviewed obstetrical literature.

Continue to Improve and Modernize the
Medicaid and CHIP Eligibility System
To further improve the current system and prepare to meet Texas’
future needs, the Coalition supports:
• Giving top priority to identifying and eliminating all system barriers
that delay access to newborn care or prenatal care. The HHSC should
ensure that eligible newborns are enrolled in Medicaid no later than 15
days after proper documentation of delivery is received. The agency
should also prioritize streamlining processes for submitting documentation,
to reduce burdens on both families and providers;
• Full implementation of online self-service applications and renewals
for Medicaid and CHIP, online access to case information, ability for
families to update and request information and submit documents online,
and the ability to contact families via email or text when they need to take
actions.
58

Continue to Improve and Modernize
the Medicaid and CHIP Eligibility
System
• Continuing to identify and remove unnecessary or redundant
policies and procedures, and adopt new processes that improve
productivity and/or accountability to facilitate streamlined systems;
• Ensuring that the HHSC eligibility system is fully interoperable with
the Health Insurance Exchange and able to provide “No Wrong
Door” access for Texans; and
• Giving HHSC the resources and support needed to ensure a
robust and diverse network of community partners to maximize the
benefit of the new web portal and increase efficiency and access in the
public benefits enrollment process.
59

Seek New Revenue Sources to Fill Budget Gaps
instead of Slashing Health Care Programs for
Children and other Vulnerable Texans
• The Coalition supports addressing the revenue deficit projected by
state officials to result in a recurring shortfall of at least $10 billion
every legislative session. The Coalition also supports using existing
and new sources of revenue to ensure all eligible Texas children
receive the quality health care they need.
• In order to restore and protect health coverage for Texas children
and families through Medicaid and CHIP, provider payment rates,
and other vital public health and preventive health services, the state
must utilize existing state resources, including the Rainy Day Fund,
and look to increasing our resources, particularly by discouraging
unhealthy behaviors related to the use of tobacco, alcohol, and
sugary beverages.
60

January 24, 2013
Improve the Health and Wellbeing of Texas
Children by Maximizing Opportunities to
Connect Families with Affordable Health
Care

Uninsured Texans
All Ages:
• 6.1 million uninsured Texans, 23.8% of all ages
• Slight improvement over 2010 (6.2 million, 24.6%)
• Still worst rate in the nation by several percentage points
Children Under Age 19:
• Stable at 1.2 million uninsured children; 16.3% of all Texas kids.
• Texas ranks 2nd
worst in uninsured rate for kids (Nevada is now 1st
).
• More than half of uninsured children are U.S. citizens or legal residents who could be enrolled in Medicaid or
CHIP today, but are not.

Working-age Texans: Almost Twice as Likely as Children to be Uninsured
Source: CPPP Analysis of 2012 CPS Annual Social & Economic Supplement.
www.census.gov/cps/data/cpstablecreator.html

Parent Coverage Improves
Child Health
• Covering parents means that more eligible children will enroll.
– Low-income families with uninsured parents are three times as
likely to have eligible but uninsured children as families with
parents covered by private insurance or Medicaid.
– Previous expansions of Medicaid coverage for parents have led
to a significant increase in enrollment of eligible children and a
drop in the number of uninsured children.
Source: Joan Alker and Jocelyn Guyer, et al. Georgetown Center for Children and Families; and
Bob Greenstein, Center on Budget and Policy Priorities; Expanding Coverage for Parents Helps Children: Children’s Groups Have a Key Role in Urging States to Move
Forward and Expand Medicaid University Center for Children and Families; July 12, 21012.

Parent Coverage Improves
Child Health
• Covering parents means that children are more likely to stay
enrolled.
– Studies have found that covering parents makes it less likely that
children experience breaks in their own Medicaid and CHIP
coverage and remain insured.
Source: Joan Alker and Jocelyn Guyer, et al. Georgetown Center for Children and Families; and
Bob Greenstein, Center on Budget and Policy Priorities; Expanding Coverage for Parents Helps Children: Children’s Groups Have a Key Role in Urging States to Move
Forward and Expand Medicaid University Center for Children and Families; July 12, 21012.

Parent Coverage Improves
Child Health
• Covering parents makes it more likely that children receive
needed care like preventive care and other health care services.
– Studies have found that insured children whose parents are also
insured are more likely to receive check-ups and other care,
compared to insured children whose parents are uninsured.
Source: Joan Alker and Jocelyn Guyer, et al. Georgetown Center for Children and Families; and
Bob Greenstein, Center on Budget and Policy Priorities; Expanding Coverage for Parents Helps Children: Children’s Groups Have a Key Role in Urging States to Move
Forward and Expand Medicaid University Center for Children and Families; July 12, 21012.

Parent Coverage Improves
Child Health
• Parents’ health can affect children’s health and well-being.
– The Institute of Medicine has reported that a parent’s poor
physical or mental health can contribute to a stressful family
environment that may impair the health or well-being of a child.
– Moreover, uninsured parents who can’t get care may be unable
to work or may end up with big medical bills when they do get
care. In either case, the financial consequences have a big
impact on children even if the children have coverage.
Source: Joan Alker and Jocelyn Guyer, et al. Georgetown Center for Children and Families; and
Bob Greenstein, Center on Budget and Policy Priorities; Expanding Coverage for Parents Helps Children: Children’s Groups Have a Key Role in Urging States to Move
Forward and Expand Medicaid University Center for Children and Families; July 12, 21012.

Low-income Adults
• Texas Medicaid has very low coverage of parents
– must live in extreme poverty, below 12% of FPL ($3,696/year for parent with 2 children)
– must earn under $308 per month for a family of 3
• This dollar limit set by the Texas legislature in 1985 has never been updated
• Today, only about 226,000 poor Texas parents get Medicaid
Medicaid Expansion (MedXP)
• Medicaid expansion would allow U.S. citizens up to 133% FPL ($14,856 for individuals or $30,657 for
family of 4)* to enroll.
• The Texas HHSC and other experts estimate 1.3 - 1.8 million uninsured U.S. citizen adults in Texas
would be eligible for the Medicaid option in 2014.
• HHSC projects over a million of these adults would actually enroll by 2016.
• HHSC also estimates that over 400,000 more children—eligible today, but un-enrolled—would sign up for
Medicaid by 2016 because of heightened public awareness… “the welcome mat effect” .
* 2012 federal poverty levels, updated every Spring

If Texas Opts Out
• Uninsured Texas adults below 100% FPL would have NO assistance available
in 2014.
• Urban Institute/Kaiser Family Foundation estimate 1.75 million uninsured TX
adults under 133% FPL, 1.33 of these with incomes below 100% FPL.
• Those from 100-133% FPL would be eligible for premium assistance, but
because the system was designed assuming this group would have Medicaid,
some of these near-poor will have difficulty affording coverage even with a cap
on premiums of 2% of family income.
• Costs of care for uninsured poor Texas adults will continue to be carried
primarily by local property taxpayers, secondarily by charity care providers,
and without benefit of the 90%+ federal matching dollars.

Texas Uninsured: Now, With ACA Medicaid, and Without
6.1 million
uninsured
Michael E. Cline, Ph.D., and Steve H. Murdock, Ph.D. , Rice University, Estimates of the Impact of the Affordable Care Act on Counties in
Texas, April 2012.

Official HHSC Cost Estimates
• HHSC (Texas Medicaid) estimates the state-budget (GR) Medicaid costs
to cover these new adults and “welcome mat” children would:
– Total $3.1 billion GR over first four years (2014-2017),
and
– Those state funds would draw $27.2 billion in federal matching
funds for Texas health care providers.
That’s enough new federal $$$ to support roughly 33,000 more Family
Practice Physicians or nearly 89,000 more Registered Nurses each year!

Official HHSC Cost Estimates
• Of that $3.1 billion total, HHSC estimates that for 2013-2017:
– The adult Medicaid Expansion costs Texas $1.3 billion GR,
drawing another $23.9 billion in federal match;
and
– The “welcome mat effect” new enrollment of currently eligible
children which costs another $1.8 billion of state GR, draws an
additional $3.3 billion in federal match. These costs are in the
base HHSC LAR!

3 Great Tools: On Medicaid Expansion and Texas
1. Choices and Challenges: How Texas County Uninsured Rates Will
Drop Under Health Care Reform. Choices and Challenges Report >> Cline & Murdock, of Rice U. (former TX State Demographer and Director of the
US Census Bureau)
2. Your County and the ACA . Medicaid Expansion County Level Data >> CPPP compiled data for all 254 Texas counties on impact of ACA on uninsured,
and the new federal dollars by county, based on Rice data above and Texas
HHSC’s latest official Medicaid expansion estimates. Understanding the Sources
3. Texas Has Only One Rational Choice: Expanding Medicaid Under
the Affordable Care Act. http://www.perrymangroup.com/ Study by The Perryman Group Finds that Expanding Medicaid More than Pays
for Itself.

Texas CHIP Coalition Supports
• A thorough, thoughtful analysis and statewide dialogue on the costs and
benefits of accepting the ACA’s Medicaid coverage opportunity.
• Careful consideration of the positive impact on child and family well-being if
the low-income parents of children in Texas Medicaid could also access care.
• Assessment of the economic impacts for state and local government budgets,
including offsets to current local and state health, mental health, and criminal
justice costs.
• Analysis of new opportunities to allow families to enroll in the same private
health plan through the health insurance Exchange in 2014, such as
consideration of the Basic Health Plan option to create “CHIP for parents” in
Texas (this option is available only to states that accept the Medicaid
expansion).

Texas CHIP Coalition
83rd Session Briefing for Legislative Staff
January 24, 2013


