17
Attaching Fluorescent Nanoclusters to DNA Origami Microarrays John Devany 10/31/14 Worster Fellowship Presentation 1
Attaching Fluorescent Nanoclusters to DNA Origami Microarrays
John Devany
10/31/14
Worster Fellowship Presentation
1
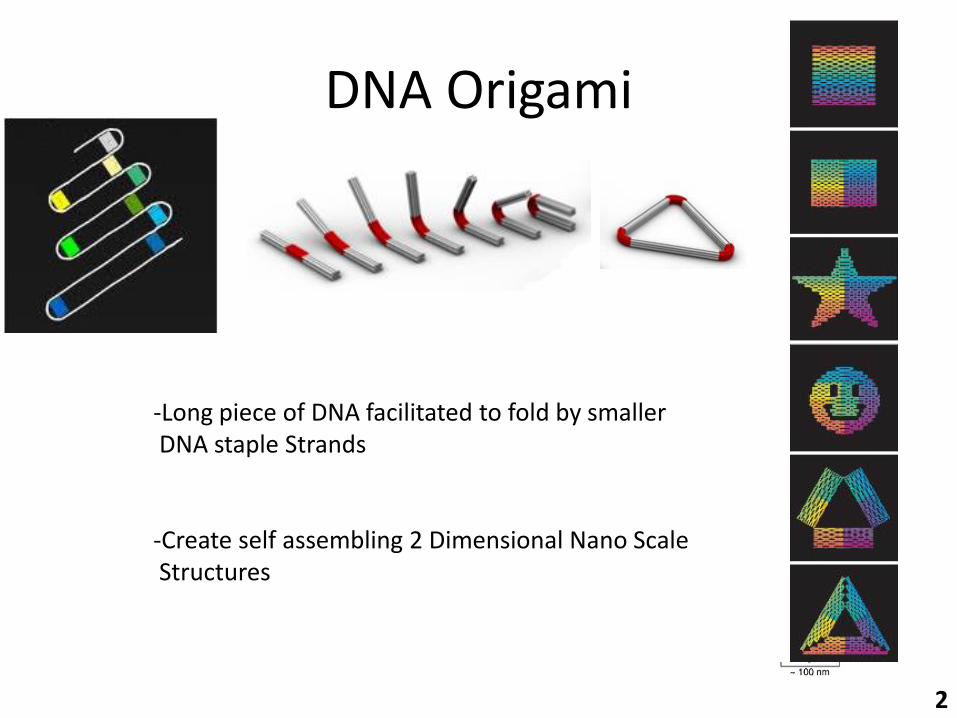
DNA Origami
-Long piece of DNA facilitated to fold by smaller DNA staple Strands -Create self assembling 2 Dimensional Nano Scale Structures
2
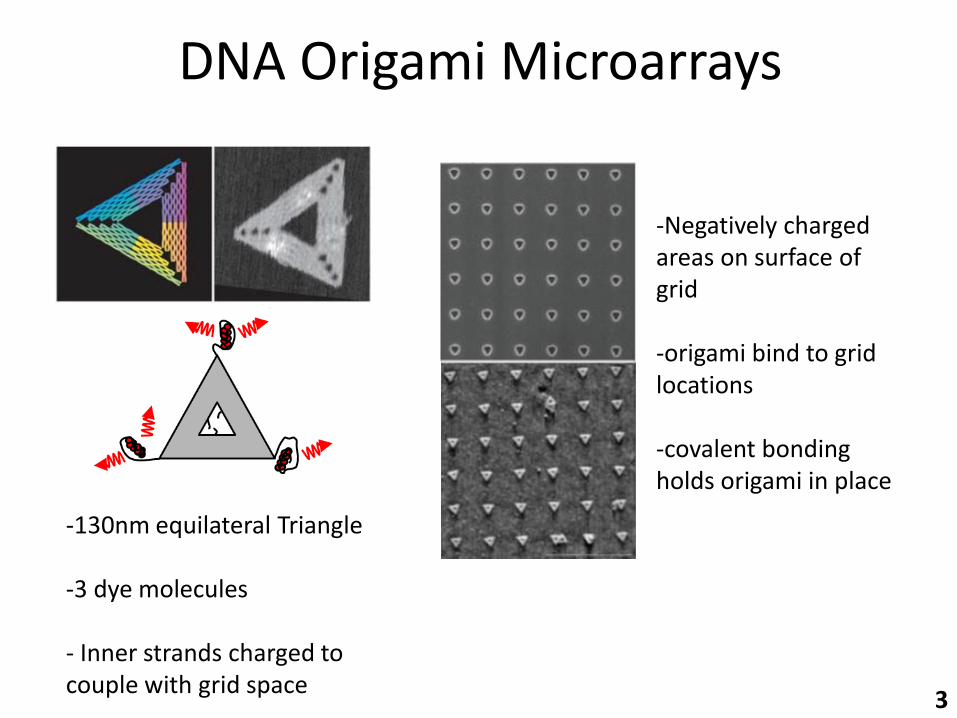
DNA Origami Microarrays
-130nm equilateral Triangle -3 dye molecules - Inner strands charged to couple with grid space
-Negatively charged areas on surface of grid -origami bind to grid locations -covalent bonding holds origami in place
3
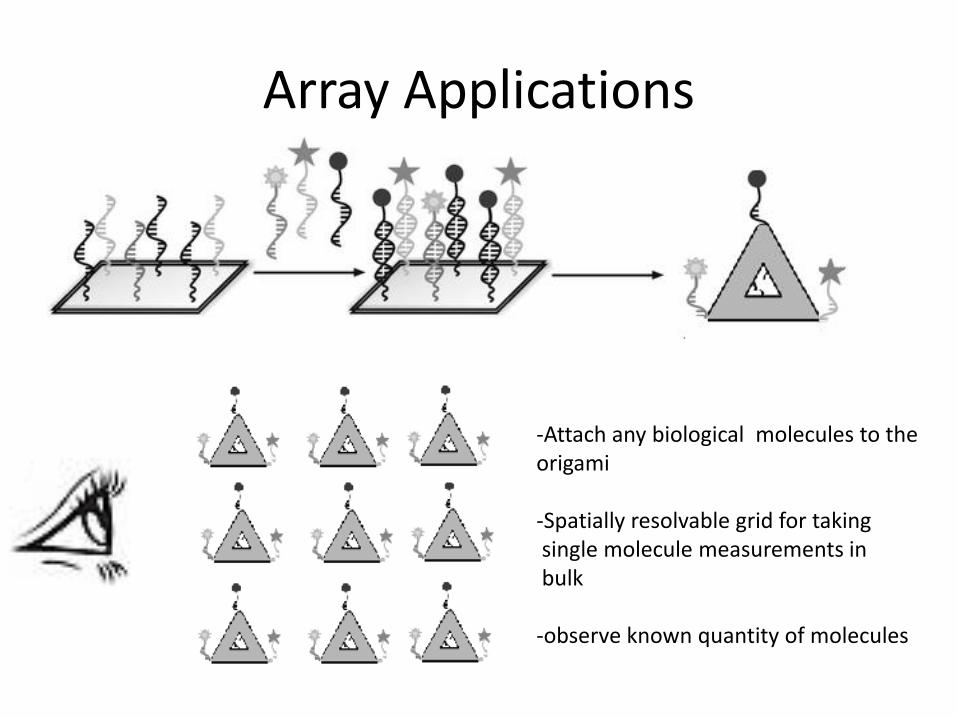
Array Applications
-Attach any biological molecules to the origami -Spatially resolvable grid for taking single molecule measurements in bulk -observe known quantity of molecules
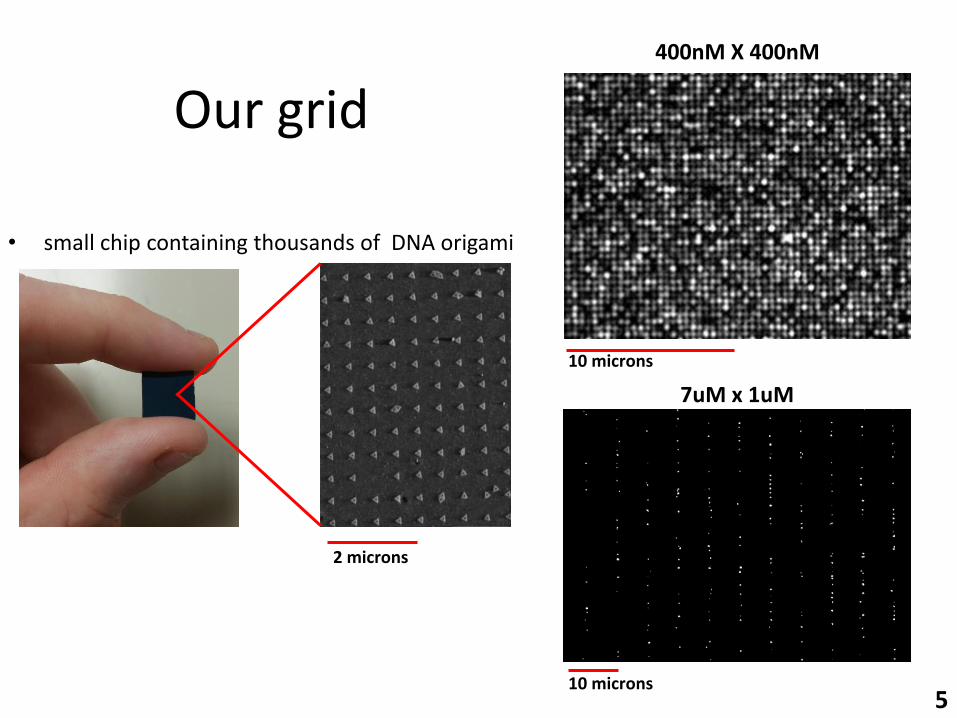
2 microns
10 microns
Our grid
• small chip containing thousands of DNA origami
400nM X 400nM
7uM x 1uM
10 microns
5
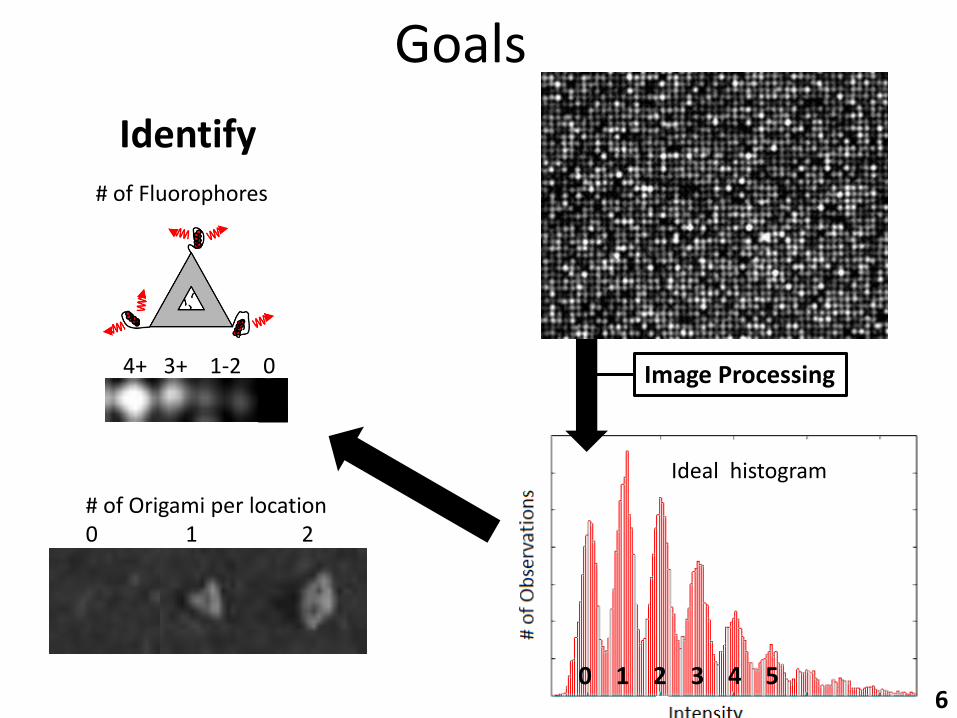
Goals
# of Fluorophores 4+ 3+ 1-2 0
# of Origami per location 0 1 2
Identify
Image Processing
Ideal histogram
6 0 1 2 3 4 5
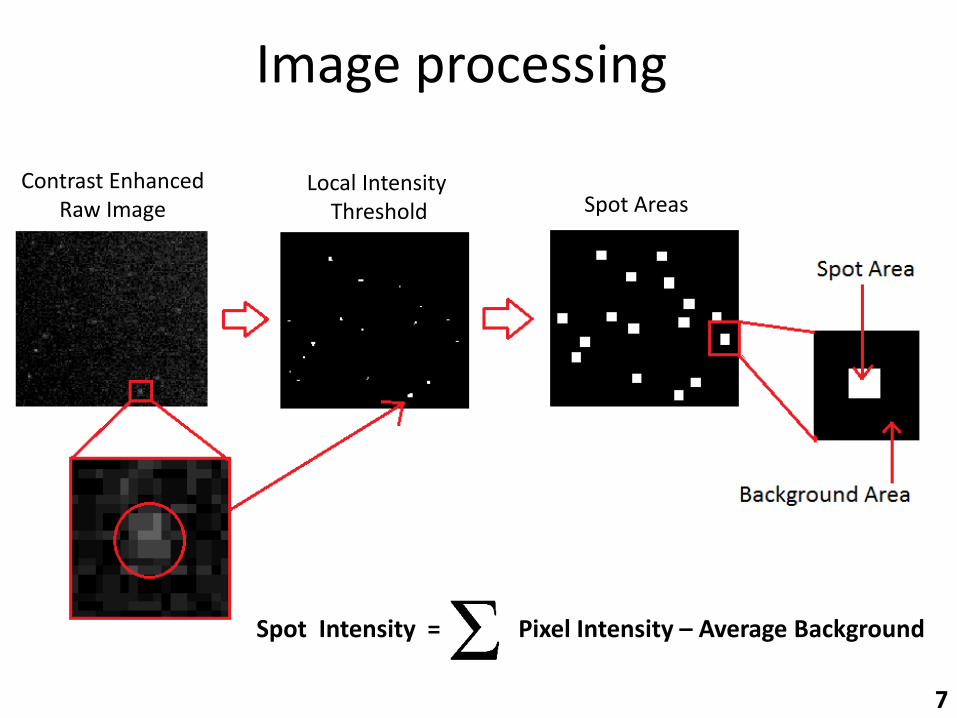
Image processing
7
Contrast Enhanced Raw Image
Local Intensity Threshold Spot Areas
Spot Intensity = Pixel Intensity – Average Background
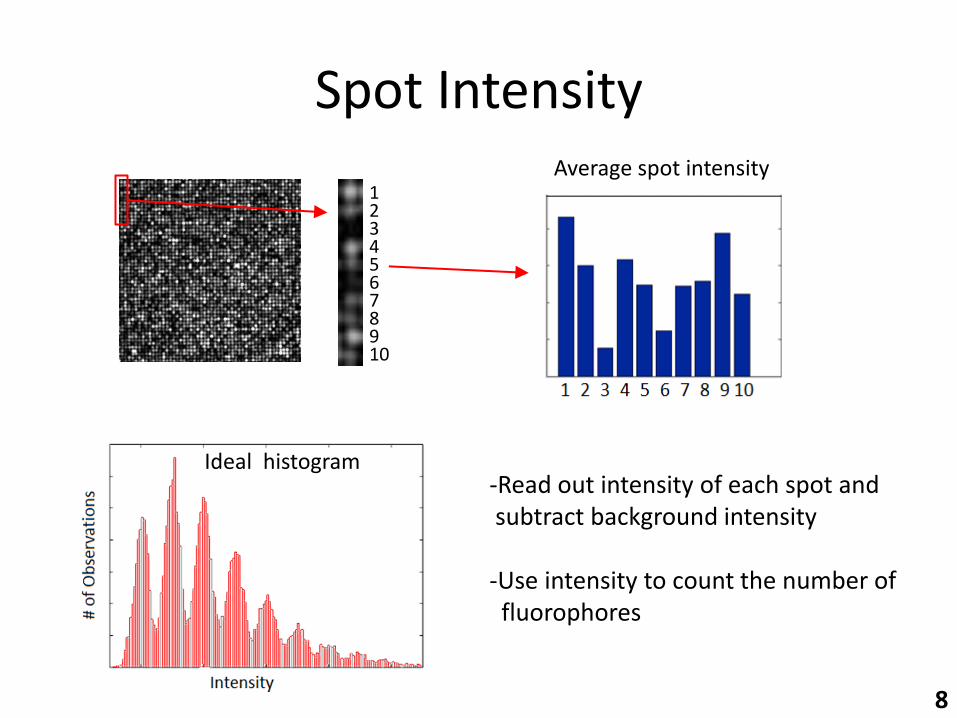
Spot Intensity
1 2 3 4 5 6 7 8 9 10
Average spot intensity
Ideal histogram -Read out intensity of each spot and subtract background intensity -Use intensity to count the number of fluorophores
8
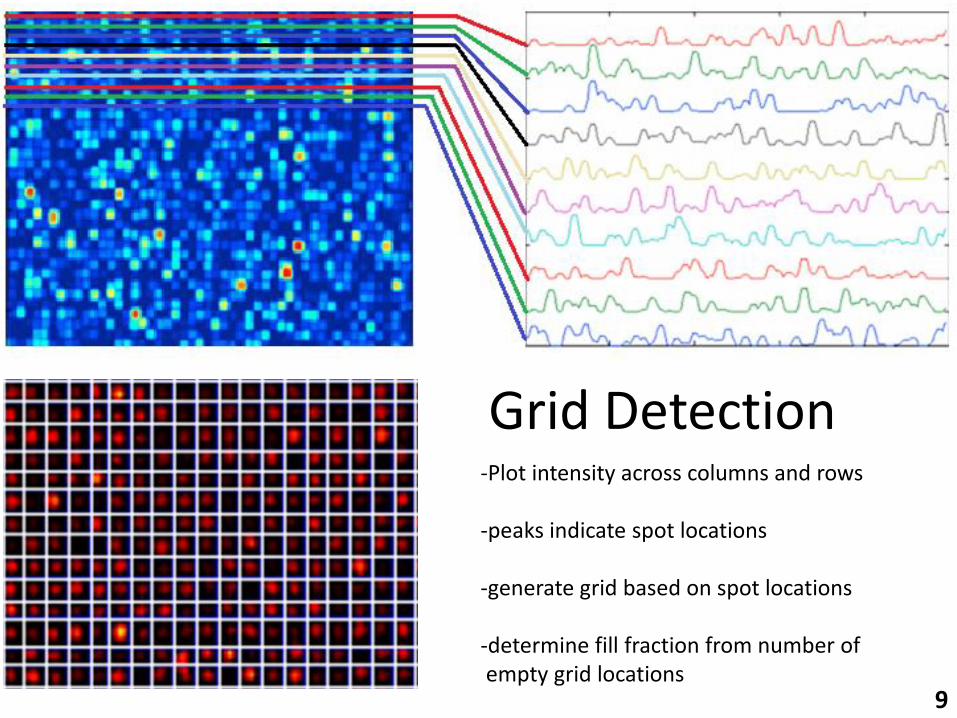
Grid Detection -Plot intensity across columns and rows -peaks indicate spot locations -generate grid based on spot locations -determine fill fraction from number of empty grid locations
9
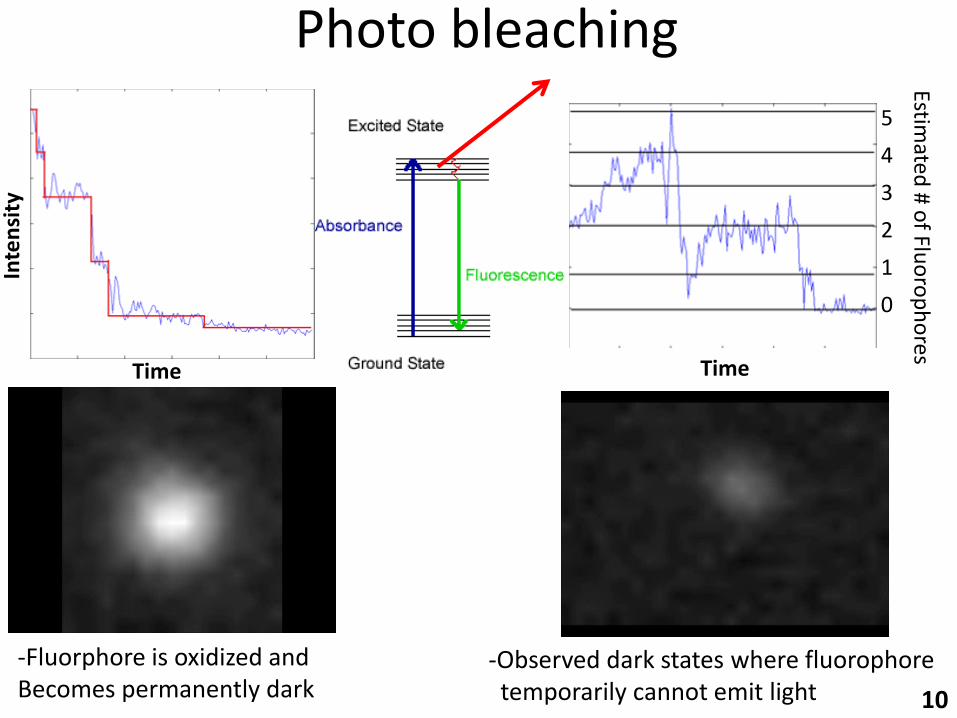
Photo bleaching
-Observed dark states where fluorophore temporarily cannot emit light
-Fluorphore is oxidized and Becomes permanently dark 10
Time Time
Inte
nsi
ty
Inte
nsi
ty
Estimated
# of Flu
oro
ph
ores
5
4
3
2
1
0
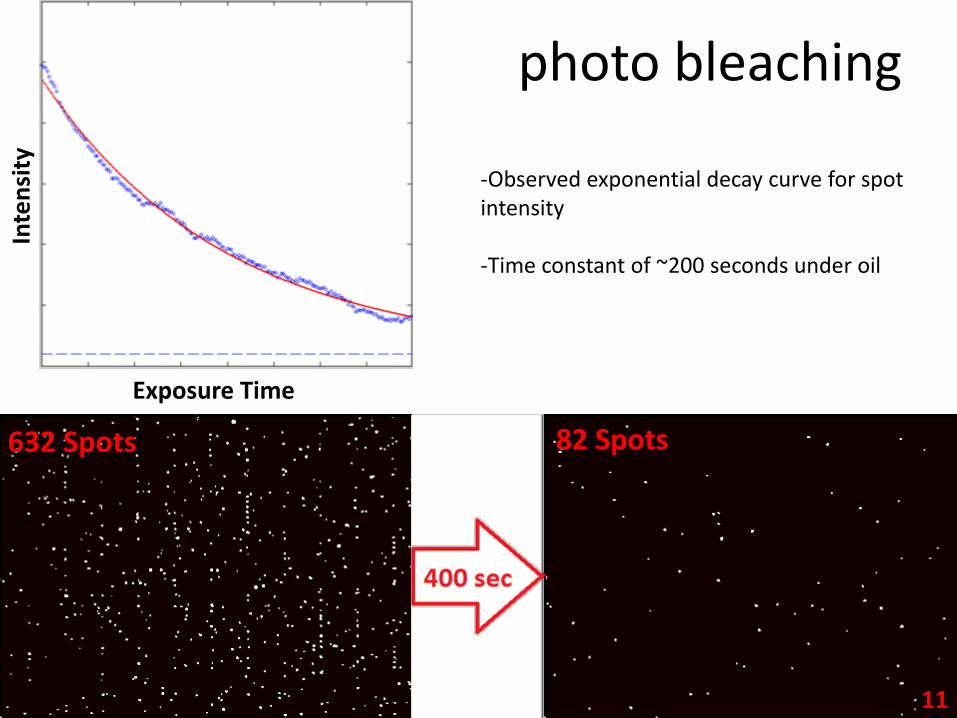
photo bleaching
-Observed exponential decay curve for spot intensity -Time constant of ~200 seconds under oil
632 Spots 82 Spots
11
Exposure Time
Inte
nsi
ty
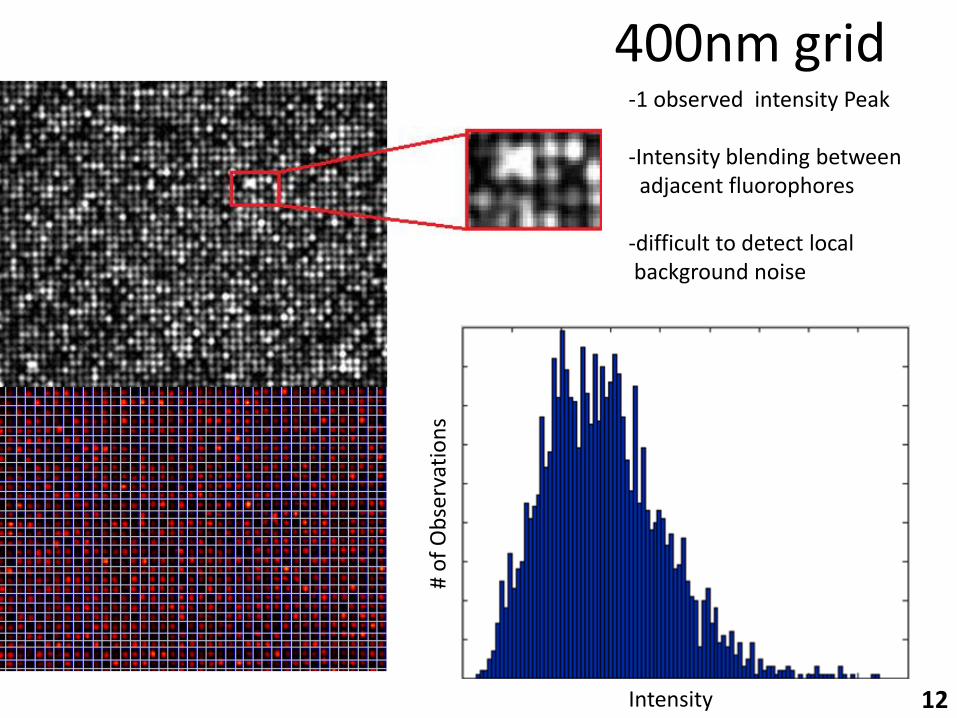
400nm grid -1 observed intensity Peak -Intensity blending between adjacent fluorophores -difficult to detect local background noise
12 Intensity
# o
f O
bse
rvat
ion
s
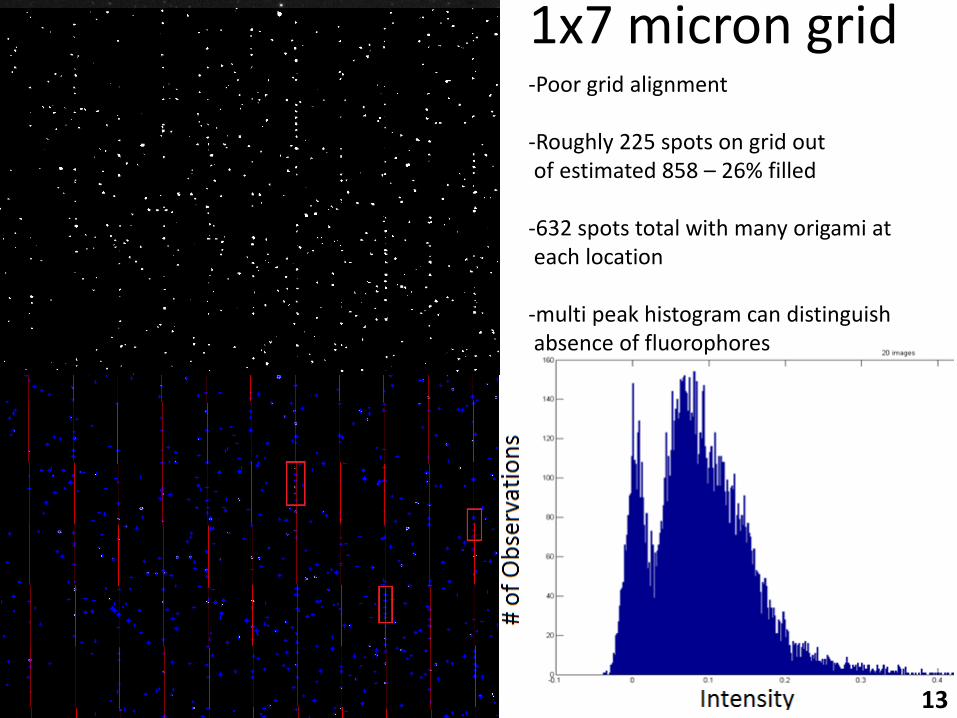
1x7 micron grid -Poor grid alignment -Roughly 225 spots on grid out of estimated 858 – 26% filled -632 spots total with many origami at each location -multi peak histogram can distinguish absence of fluorophores
13
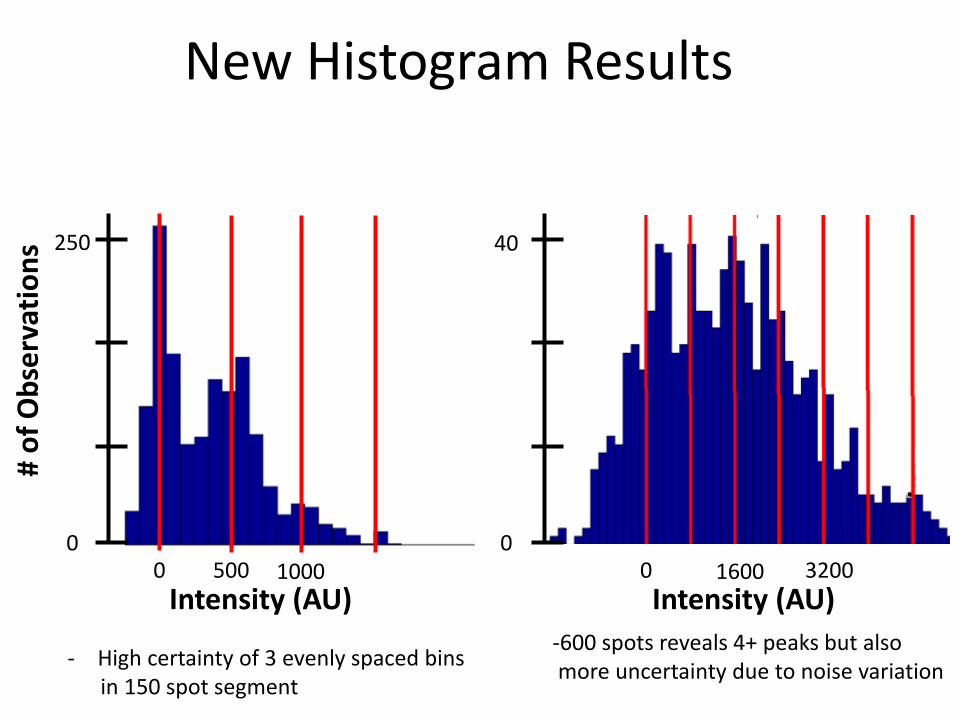
New Histogram Results
40
# o
f O
bse
rvat
ion
s 250
0 0
- High certainty of 3 evenly spaced bins in 150 spot segment
Intensity (AU) 500 0 1000 0 3200 1600
Intensity (AU)
-600 spots reveals 4+ peaks but also more uncertainty due to noise variation
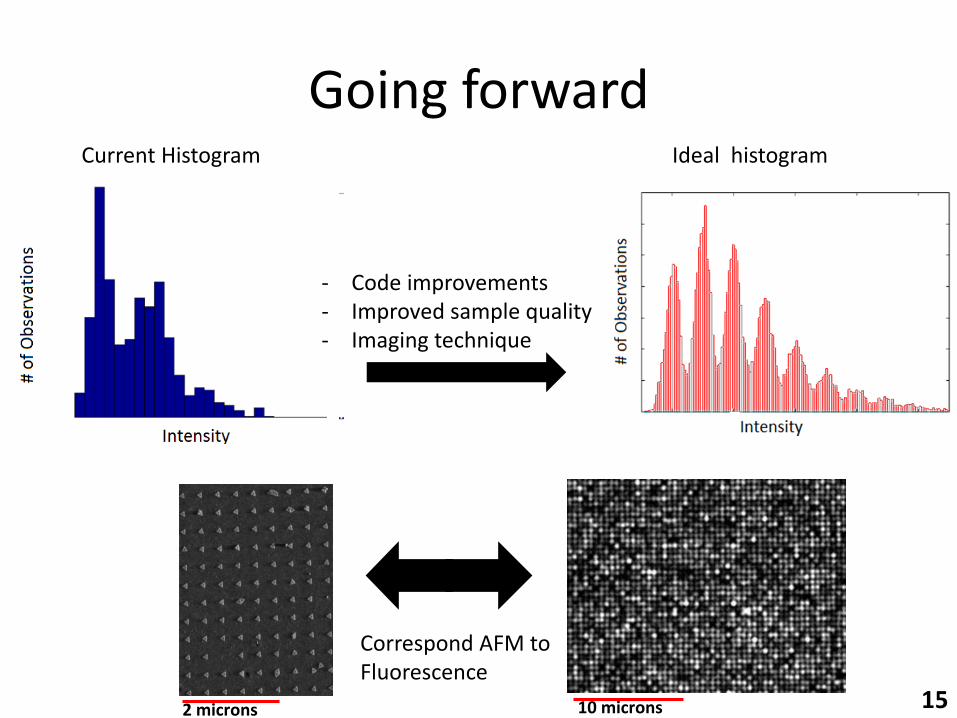
Going forward Ideal histogram Current Histogram
15
- Code improvements - Improved sample quality - Imaging technique
2 microns 10 microns
Correspond AFM to Fluorescence
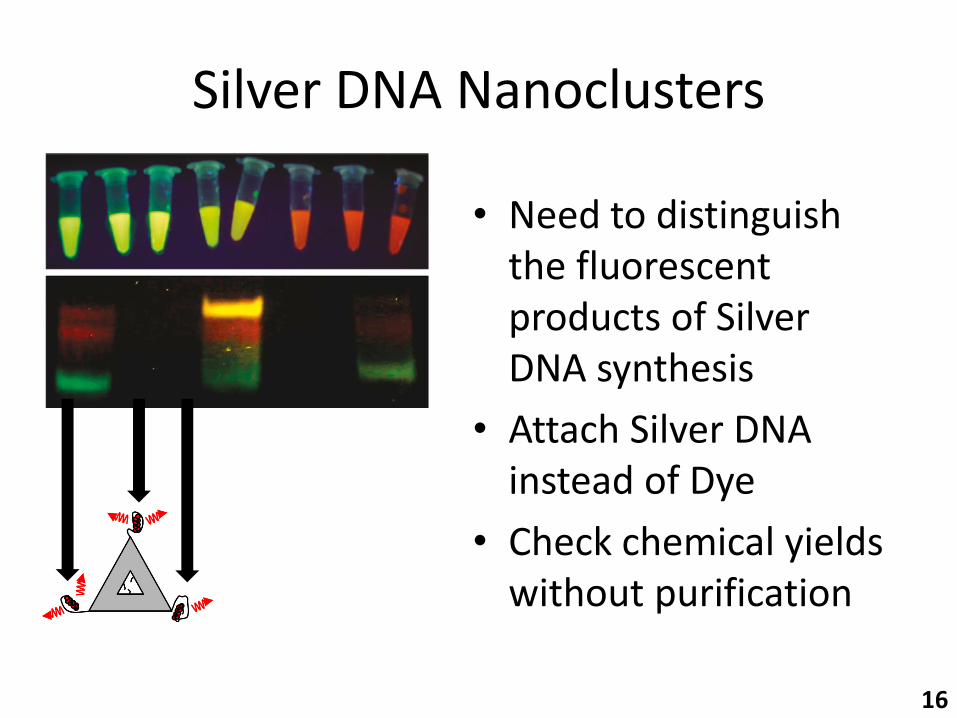
Silver DNA Nanoclusters
• Need to distinguish the fluorescent products of Silver DNA synthesis
• Attach Silver DNA instead of Dye
• Check chemical yields without purification
16
Acknowledgments
Deborah Fygenson
Travis Del Bonis-O’Donnel
Ashwin Gopinath
Deborah Clayton-Warwick
The Worster Family
17


