22
Forestry, Department of Annual Performance Progress Report Reporting Year 2018 Published: 7/19/2018 3:21:40 PM AGENDA ITEM C Attachment 1 Page 1 of 22

Forestry, Department ofAnnual Performance Progress Report
Reporting Year 2018
Published: 7/19/2018 3:21:40 PM
AGENDA ITEM C Attachment 1 Page 1 of 22

KPM # Approved Key Performance Measures (KPMs)
1 CUSTOMER SERVICE TO COUNTY 'GOVERNMENTS AND FOREST LANDOWNERS - Percent of Oregon’s forested counties and forest protective associations rating that ODF programs collectively provide “good” or “excellent” customer service:overall, timeliness, accuracy, helpfulness, expertise, availability of information.
2 BOARD OF FORESTRY PERFORMANCE - Percent of total best practices met by the Board of Forestry.
3 FOREST PRACTICES ACT COMPLIANCE - Percent of forest operations that are in compliance with the Forest Practices Act
4 URBAN AND COMMUNITY FOREST MANAGEMENT - Percent of Oregon cities actively managing their urban and community forest resources.
5 STATE FORESTS TOTAL REVENUE - Percent increase in total revenue produced by State Forests
6 AIR QUALITY PROTECTION - Total number of smoke intrusions into designated areas per total number of units burned.
7 PRIVATE FORESTLAND MANAGED AT OR ABOVE FOREST PRACTICES ACT STANDARDS. - Acres of industrial private forestlands managed under an approved certification system, stewardship agreement, or other approved management planincluding wildlife habitat conservation and management plans
8 FOREST STREAM WATER QUALITY - Percent of monitored stream sites associated predominately with forestland with significantly increasing trends in water quality.
9 VOLUNTARY PUBLIC AND PRIVATE INVESTMENTS MADE TO CREATE HEALTHY FORESTS - Cumulative public and private forest landowner investments made in voluntary projects for the Oregon Plan for Salmon and Watersheds or for the OregonConservation Strategy.
10 STATE FORESTS NORTH COAST HABITAT - Complex forest structure as a percent of the State Forests landscape.
11 FIRE SUPPRESSION EFFECTIVENESS - Percent of wildland forest fires under ODF jurisdiction controlled at 10 acres or less.
12 PREVENTION OF HUMAN-CAUSED WILDLAND FOREST FIRES - Number of human-caused wildland forest fires per 100,000 Oregon residents (lower is better).
13 DAMAGE TO OREGON FORESTS FROM INSECTS, DISEASES, AND OTHER AGENTS - Percent of forest lands without significant damage mortality as assessed by aerial surveys.
Performance Summary Green Yellow Red
= Target to -5% = Target -5% to -15% = Target > -15%
Summary Stats: 53.85% 7.69% 38.46%
redgreenyellow
AGENDA ITEM C Attachment 1 Page 2 of 22

KPM #1 CUSTOMER SERVICE TO COUNTY 'GOVERNMENTS AND FOREST LANDOWNERS - Percent of Oregon’s forested counties and forest protective associations rating that ODF programscollectively provide “good” or “excellent” customer service: overall, timeliness, accuracy, helpfulness, expertise, availability of information.Data Collection Period: Jan 01 - Dec 31
Report Year 2014 2015 2016 2017 2018
Availability of InformationActual 100% 100% 100% 86% 83%Target 100% 100% 100% 100% 100%OverallActual 100% 100% 100% 86% 100%Target 100% 100% 100% 100% 100%HelpfulnessActual 100% 100% 100% 100% 100%Target 100% 100% 100% 100% 100%ExpertiseActual 100% 100% 100% 93% 80%Target 100% 100% 100% 100% 100%TimelinessActual 100% 100% 100% 93% 83%Target 100% 100% 100% 100% 100%AccuracyActual 100% 100% 100% 100% 100%Target 100% 100% 100% 100% 100%
How Are We Doing
actual target
AGENDA ITEM C Attachment 1 Page 3 of 22

Survey results indicate that while the Department of Forestry strives to exceed the expectations of county governments and forest landowners, ongoing controversial issues are challenging ourability to do so. The past year's results show that we continued to meet our target in Accuracy and Helpfulness and improved our Overall Level of Service to reach the set target; however, we areseeing a continued decrease in our Availability of Information, Timeliness, and Expertise.
Factors Affecting ResultsThe successes of our working relationships between Department of Forestry field offices and county commissioners, county staff, and forest protective associations significantly contribute to theresults of this performance measure; however, controversial issues in matters of policy and administration are ultimately influencing the end result. While many of the survey comments extendedpraise and support for our staff’s excellence in service and ongoing commitment to building strong partnerships across all jurisdictions and forestry programs, it is clear that current challenges instate forest management are affecting our results in this performance measure.
AGENDA ITEM C Attachment 1 Page 4 of 22

KPM #2 BOARD OF FORESTRY PERFORMANCE - Percent of total best practices met by the Board of Forestry.Data Collection Period: Jul 01 - Jun 30
* Upward Trend = positive result
Report Year 2014 2015 2016 2017 2018
Oregon Board of Forestry GovernanceActual 100% 100% 100% 100% 100%Target 100% 100% 100% 100% 100%
How Are We DoingThe Board’s annual board governance performance evaluation resulted in Board member agreement that all sixteen best-practices criteria had been met with a 100 percent achievement rate,effectively meeting their annual target.
Factors Affecting ResultsWhile the Board continues to meet its performance measure goals, a reflection of the board’s positive working relationships and mutual respect across differences on the issues before them,significant concerns remain. Continued challenges in addressing financial viability and state forest management amongst noted polarization of stakeholders are affecting the board’s results. Interestis shared across the board in building consensus and making the difficult decisions needed within the controversial and complex landscape; however, growing concerns surrounding the multiplevacancies of the board is clear. A full complement of board members, prioritization of strategic issues, and continued engagement on the best practices criteria could improve the board’sperformance.
actual target
AGENDA ITEM C Attachment 1 Page 5 of 22

KPM #3 FOREST PRACTICES ACT COMPLIANCE - Percent of forest operations that are in compliance with the Forest Practices ActData Collection Period: Jan 01 - Dec 31
* Upward Trend = positive result
Report Year 2014 2015 2016 2017 2018
Percent of Operations in Compliance with Oregon’s Forest Practices ActActual 97% 96% No Data 97% 97%Target 100% 100% 100% 100% 100%
How Are We DoingIn 2013, the Oregon Department of Forestry (ODF) began monitoring rates of compliance with a subset of the Oregon Revised Statutes and Oregon Administrative Rules that comprise the OregonForest Practices Act (FPA). The study began in response to a Budget Note attached to the 2011 Agency Biennial Budget. In 2013, 200 sites where timber harvests had occurred were sampled. In2014, 2016, and 2017, 100 sites were sampled. Reports on the results of individual years have been published by ODF.
The focus of the study was primarily on rules concerning road construction, road maintenance, timber harvesting, and protection measures for waters of the state.
Data indicated the following overall rates of compliance, for the year prior to the year in which the report was issued:
2014 – 97%
2015 – 96%
2016 – No Data
2017 – 97%
2018 – 97%
actual target
AGENDA ITEM C Attachment 1 Page 6 of 22

The study protocol provides for allowing results to be considered by ODF Administrative Area, Landowner Type, and Rule Division. Compliance rates for individual rules are also available, thoughfor some rules, the number of samples is not robust.
Factors Affecting ResultsThe forestland subject to the FPA are managed according to a broad range of strategies by a variety of different types of landowners. A number of ownerships enroll in a voluntary set of measuresto demonstrate responsible stewardship of the land, such as certification systems. The Sustainable Forestry Initiative and the American Tree Farm System are such systems. Enrollees agree tomeet and/or exceed state standards for environmental protection.
Other owners have less formally articulated plans for their lands. Some lands subject to the study, such as state forests lands, are subject to very studied and deliberate management plans.
Landowner preferences bear almost strongly on how land is managed and the standards that are met during forest management activities.
The Department of Forestry (ODF) strives to help keep Oregon’s non-federal, non-tribal timberlands healthy and productive through a variety of means, typified by the notion of the “Three E’s”: education, engineering, and enforcement, and the field representatives (stewardship foresters) routinely work with landowners in an effort to support informed, effective, and appropriatemanagement of forestlands.
Results from the compliance audit inform training strategies for ODF as well as industry groups who support the FPA in their work. Numerous training sessions statewide have focused on the rulesfor which compliance rates are lower.
ODF engages an external advisory committee to periodically review the project, the protocols, and results. That group also helps deliver the message regarding findings of the audit and how theycan be used to support better forest practices.
AGENDA ITEM C Attachment 1 Page 7 of 22

KPM #4 URBAN AND COMMUNITY FOREST MANAGEMENT - Percent of Oregon cities actively managing their urban and community forest resources.Data Collection Period: Jan 01 - Dec 31
* Upward Trend = positive result
Report Year 2014 2015 2016 2017 2018
Percent of Oregon cities actively managing their urban and community forest resourcesActual 36% 37% 36% 39% 39%Target 50% 50% 50% 50% 50%
How Are We DoingCurrently, close to 40 percent of the 241 Oregon cities are actively managing their urban forests.. Although this is less than half of the total number of Oregon cities, more than 74% Oregon’spopulation (2010 census) lives in these urban forest-managing cities. (With more up-to-date population figures and development trend information, the actual population percentage is very likelygreater than reported here.)
The number of cities with urban forestry programs may reflect the needs and desires of Oregon’s growing population as cities develop. Also, in recent years, several Oregon cities have been ableto “remodel” their downtown cores, which usually involves planting significant numbers of new trees. In turn, this prompts community investment and citizen engagement in a city’s urban forest. Citiesare requesting more urban forestry assistance from ODF staff now than during the Great Recession.
Factors Affecting ResultsThe Department receives no state funds for its Urban and Community Forestry Program and thus relies solely on federal funds to achieve this KPM. Based on the availability and uses of federalsources, the Department has a very limited staff to serve the entire state. A statewide survey conducted in 2014 clearly shows that if cities receive assistance from the Department of Forestry, theywere more likely to have components of an actively managed urban forest program. The components considered to be signs of active management include urban forestry trained professional staff(city employee or private contractor), a citizen advisory committee, a tree ordinance, and an inventory-based management plan. These are nationally agreed-upon components that every statecollects. Achievement of this KPM is clearly constrained by staffing limitations.
actual target
AGENDA ITEM C Attachment 1 Page 8 of 22

KPM #5 STATE FORESTS TOTAL REVENUE - Percent increase in total revenue produced by State ForestsData Collection Period: Jul 01 - Jun 30
* Upward Trend = positive result
Report Year 2014 2015 2016 2017 2018
Percent increase in revenue produced by State Forests compared to the previous yearActual 8.30% 5.50% 14.20% 11.20% -4%Target 3% 2% 1% 1% 3%
How Are We DoingThe FY 2017 data show a 4.0 percent decrease in total revenues from the previous year, $101,303,414 down to $97,258,056. The amount of revenue distributed to counties decreased 1.9% from the previous year, $60,107,296 down to $58,992,627. A major factor decreasing total revenue is DSL’s decision to transfer ownership of the Elliott State Forest. This KPM focuses on the percent change in total revenue produced from the sale of timber from State Forests. The Oregon Department of Forestry is committed to sustainable management of these lands. Harvest levels that contribute to the revenue flow for this measure are set annually by the Division at the direction of the State Forester. The KPM targets establish an objective for management activities to predictably generate revenue for the State. The Division is evaluating financial viability and is exploring opportunities to increase revenue while continuing to provide a balanced range of social and environmental values.
Factors Affecting ResultsThe major factor affecting FY 2017 timber sale revenue is the protection of threatened and endangered species and the Elliott State Forest ownership transfer, which reduced harvest levels. Revenue from Board of Forestry Lands decreased 1.2% and revenue from Common School Lands decreased 45.8%.
actual target
AGENDA ITEM C Attachment 1 Page 9 of 22

KPM #6 AIR QUALITY PROTECTION - Total number of smoke intrusions into designated areas per total number of units burned.Data Collection Period: Jan 01 - Dec 31
* Upward Trend = negative result
Report Year 2014 2015 2016 2017 2018
Total number of smoke intrusions into designated areas per total number of units burnedActual 0 0 0 0 0Target 0 0 0 0 0
How Are We DoingThe Smoke Management Program is doing a good job of protecting Oregon's air quality while, at the same time, allowing forest landowners to dispose of unwanted accumulations of forest fuel. Theinclusion of the entire state into the measurement target beginning in 2008 precludes any comparison with previous year's data. 10 intrusions occurred from 2,849 units burned. Intrusions haveincreased in recent years due to an increase in forest restoration burning near Smoke Sensitive Receptor Areas east of the Cascades.
Factors Affecting ResultsIn addition to restoration burning, weather variations and economic market conditions can also influence the outcome, by substantially increasing or decreasing the number of units available forburning.
actual target
AGENDA ITEM C Attachment 1 Page 10 of 22

KPM #7 PRIVATE FORESTLAND MANAGED AT OR ABOVE FOREST PRACTICES ACT STANDARDS. - Acres of industrial private forestlands managed under an approved certification system,stewardship agreement, or other approved management plan including wildlife habitat conservation and management plansData Collection Period: Jul 01 - Jun 30
Report Year 2014 2015 2016 2017 2018
Acres of industrial private forestlands managed under an approved system, agreement, or planActual 3,966,686 3,672,736 5,684,581 5,602,908 4,747,442Target 6,000,000 6,000,000 6,000,000 6,000,000 6,000,000Acres of non-industrial private forestlands managed under an approved system, agreement, or planActual 509,341 426,246 439,742 470,151 430,394Target 900,000 900,000 900,000 900,000 900,000
How Are We Doinga. Three certification systems operate in Oregon. The American Tree Farm System provides certification endorsed by the Program for the Endorsement of Forest Certification schemes (PEFC).The PEFC is an international, independent, non-profit, non-governmental organization, founded in 1999, which promotes sustainably managed forests through independent third-party certification.Forest Stewardship Council U.S. provides certification verified by Accreditation Services International, an independent accreditation body offering international, third-party accreditation for voluntarycertification schemes. The Sustainable Forestry Initiative provides certification endorsed by the PEFC.
The Department of Forestry (ODF) approves and monitors management plans, under the USDA-Forest Service's State and Private Forestry Program, and enters into Stewardship Agreements(ORS 541.423) with forestland owners, who agree to manage beyond FPA standards. The Oregon Department of Fish and Wildlife approves forest management plans under their Wildlife HabitatConservation and Management Program (ORS 308A-400).
ODF requested information on acres of industrial private forestland certified or approved under each system, and 4.7 of the 6.0 million acres of industrial private forestlands are managed under anapproved certification system, as summarized below:
Sustainable Forestry Initiative, Inc. 4,111,054 acres[1]American Tree Farm System 481,367 acres
actual target
AGENDA ITEM C Attachment 1 Page 11 of 22

Forest Stewardship Council U.S. 155,021 acresTotal 4,747,442 acres
b. ODF requested information on acres of non-industrial private forestland certified or approved under each system, and 0.4 of the 4.6 million acres of non-industrial private forestlands aremanaged under an approved certification system, as summarized below:
ODF; USDA-FS Forest Stewardship Plan 125,485 acresODF Stewardship Agreements 3,484 acresAmerican Tree Farm System 263,389 acresForest Stewardship Council U.S. 38,036 acresTotal 430,394 acres
While these acres are approximately 48 percent of the target of 900,000 acres, less than ten (10) percent of non-industrial private forestlands are managed under an approved certification system,stewardship agreement, or other approved management plan.
[1] The large reduction in SFI reported acres in 2017 results from database calculation corrections of certificate holders with forests in multiple states.
Factors Affecting Resultsa. Along with forestry-related agencies and organizations, the market place encourages forest certification. Forestland owners wanting to sell timber increasingly find that milling facilities arerequiring that their log supply come from certified forests. This market access requirement is motivating landowners to obtain certification from recognized third-party systems. Industrial forestlandowners generally have the capacity to develop procedures to maintain certification.
Domestically and internationally, voluntary forest certification systems are used as a mechanism to recognize forest products originating from lands meeting specific management and harvestingrequirements. Certification involves observation of management and harvesting requirements and is validated through third-party review. Costs are incurred by landowners to certify lands. In turn,certified forest products are able to access certain markets, which are otherwise closed and/or be differentiated from uncertified competing goods. Regardless of certification status, all of Oregon'sprivate and state forestlands are subject to the requirements of the Oregon Forest Practices Act and comprehensive land use plans and as such, are held to standards that in many respects aresimilar to those of certification systems.
During the second part of 2017, Oregon will achieve certification with the American Society for Testing and Materials (ASTM) standard on forest certification systems D7612-10 for wood grown andharvested under the Oregon Forest Practices Act (OFPA) and compliance of subject wood to the 2012 and 2015 International Code Council (ICC) International Green Construction Code (IgCC).The recognition from ASTM will provide opportunities for private and state forestlands to access additional markets for their forest products.
b. Along with forestry-related agencies and organizations, the market place encourages forest certification. Forestland owners wanting to sell timber increasingly find that milling facilities arerequiring that their log supply come from certified forests. This market access requirement is motivating landowners to develop management plans, since forest certification systems require forestmanagement planning.
Non-industrial forestland owners often need assistance in developing inventory data and management documentation needed for certification. The cost of certification may represent a barrier forsmaller ownerships. Approximately 81 thousand owners hold forestland between 1 and 9 acres in size, accounting for 369,000 acres of forests. Another 50 thousand owners have forestlandholdings between 10 and 49 acres in size, accounting for 1,024,000 acres of family forests. The large number of owners with smallholdings creates a significant challenge to achieving certificationon all non-industrial forestlands.
Beginning in 2012, data for acres managed under an ODF/USDA-FS Forest Stewardship Plan incorporated a new requirement that acres need to be managed under a current Forest StewardshipPlan, with current defined as a plan that is no older than, or has not been formally updated within, 10 years. This change explains the drop in this KPM between the values reported in 2011 versusthe values reported for 2012-2017. The decrease from 2012-2017 reflects a decline in federal funding that supports this work.
To increase certification on non-industrial forestlands, ODF needs to provide additional technical and financial assistance to landowners for development of management plans and procedures.AGENDA ITEM C Attachment 1 Page 12 of 22

ODF does not receive any state support for this effort, and relies solely on federal funding to conduct this work. ODF works with multiple organizations to promote the development of forestmanagement plans and the mutual recognition of approved plans.
NOTE: Collection dates varied for KPM 7 as follows:
SFI and America Tree Farm data collected - July 1, 2017-June 30, 2018FSC data collected - July 1, 2017-June 30, 2018ODF; USDA-FS Forest Stewardship Plan data is from July 1, 2017 through June 30, 2018
AGENDA ITEM C Attachment 1 Page 13 of 22

KPM #8 FOREST STREAM WATER QUALITY - Percent of monitored stream sites associated predominately with forestland with significantly increasing trends in water quality.Data Collection Period: Oct 01 - Sep 30
Report Year 2014 2015 2016 2017 2018
Percent of monitored forested stream sites with significantly increasing trends in water qualityActual 9% 15% 18% 25% 49%Target 25% 25% 25% 25% 25%Percent of monitored forested stream sites with significantly decreasing trends in water qualityActual 15% 2% 5% 0% 5%Target 15% 10% 10% 5% 5%Percent of monitored forested stream sites with water quality in good to excellent conditionActual 65% 65% 77% 79% 74%Target 60% 65% 65% 67% 80%
How Are We Doinga. In 2017, 49 percent of monitored forest stream sites showed increasing trends in water quality. While the percent of forested streams with increasing trends in water quality has improved over thepast five years, and the target continues to be met, it may be unrealistic to expect continued trends in increasing water quality on stream sites where water quality is already in good or excellentcondition. No increasing or decreasing trend was observed on 46 percent of monitored forest stream sites.
The performance is based on the Oregon Water Quality Index (OWQI). The OWQI describes general stream water quality status and trends. The OWQI also shows the general effectiveness ofwater quality management activities. No industry standards exist. However, 2016 data for agricultural lands in Oregon indicate 12 percent of monitored agricultural stream sites with increasing trendsin water quality. Statewide data for 2017 for all land uses, including agricultural and forest lands indicate 29 percent of monitored stream sites with increasing trends in water quality.
actual target
AGENDA ITEM C Attachment 1 Page 14 of 22

b. In 2017, three (5 percent) monitored sample points showed significantly decreasing trends in water quality. Compared to last year, when zero (0 percent) monitored sampled points indicatedsignificantly decreasing trends in water quality, this change represents a slight decrease in water quality. However, even with this change the target continues to be met and has been met for thepast 5 years. It is important to note that about half of the ambient sites statewide, and a higher percentage of forest sites (74 percent), continue to have "good" or "excellent" water quality and thathas remained consistent over the last 10 years. No increasing or decreasing trend was observed on about 46 percent of the monitored forest streams.
The performance is based primarily on the Oregon Water Quality Index (OWQI). The OWQI describes general stream water quality status and trends. The OWQI also shows the generaleffectiveness of water quality management activities. No industry standards exist. However, 2016 data for mixed land use in Oregon indicate 1 (5 percent) monitored stream sites with decreasingtrends in water quality. Statewide, data for 2017 for all land uses, including agricultural and forest lands indicate 12 (eight percent) monitored stream sites with decreasing trends in water quality.
c. In 2017, 74 percent of monitored forest stream sites showed "good" to "excellent" water quality, which is below the target of 80 percent. Except for 2018, monitored sites on forestland have met orexceeded the target every year since 2009 when this measure was established. About half of the ambient sites statewide continue to have "good" to "excellent" water quality and that has remainedconsistent over the last 10 years. In 2017, about 49 percent of all ambient water quality monitoring sites were in "good" to "excellent" water quality category.
The performance is based primarily on the Oregon Water Quality Index (OWQI). The OWQI describes general stream water quality status and trends. The OWQI also shows the generaleffectiveness of water quality management activities. No industry standards exist. However, 2016 data for agricultural lands in Oregon indicate about 33 percent of monitored agricultural streamsites with water quality in good to excellent condition. Statewide data for 2017 for all land uses, including agricultural and forest lands indicate about 49 percent of monitored stream sites with waterquality in good to excellent condition. These comparisons demonstrate that maintaining forestlands in forest use is an effective and efficient way to maintain water quality.
Factors Affecting Resultsa. Statewide targets were revised by DEQ and the Oregon Progress Board in 1999 to reflect substantial improvements in water quality. Where sites show significant improvement not affected bypoint source discharges, such improvements may be attributed to reduced levels of non-point source activity, increased education about water quality impacts, and watershed restoration efforts.Underlying all of these factors is stream flow. As Oregon transitions between drought and wet years, changes in stream flows and, indirectly, water quality are typically observed. A variety ofactivities occurring on forestlands, including forest management (timber harvesting and road construction and use), fire suppression, recreation, and livestock grazing, can affect soil and waterresources. Disturbances that trigger large erosion events can produce important changes in aquatic conditions. These episodic changes are critical in maintaining aquatic habitat over time, eventhough they may temporarily decrease water quality. Another factor is the reassignment of sample points between land use classes (e.g., forest to urban or vice versa). These reassignments havetaken place and will continue to be refined over time, which may affect water quality results.
b. Statewide targets were revised by DEQ and the Oregon Progress Board in 1999 to reflect substantial improvements in water quality. Where sites show significant improvement not affected bypoint source discharges, such improvements may be attributed to reduced levels of non-point source activity, increased education about water quality impacts, and watershed restoration efforts.Underlying all of these factors is stream flow. As Oregon transitions between drought and wet years, changes in stream flows and, indirectly, water quality are typically observed. A variety ofactivities occurring on forestlands, including forest management (timber harvesting and road construction and use), fire suppression, recreation, and livestock grazing, can affect soil and waterresources. Disturbances that trigger large erosion events can produce important changes in aquatic conditions. These episodic changes are critical in maintaining aquatic habitat over time, eventhough they may temporarily decrease water quality. Another factor is the reassignment of sample points between land use classes (e.g., forest to urban or vice versa). These reassignments havetaken place and will continue to be refined over time, which may affect water quality results.
c. Statewide targets were revised by DEQ and the Oregon Progress Board in 1999 to reflect substantial improvements in water quality. Where sites show significant improvement not affected bypoint source discharges, such improvements may be attributed to reduced levels of non-point source activity, increased education about water quality impacts, and watershed restoration efforts.Underlying all of these factors is stream flow. As Oregon transitions between drought and wet years, changes in stream flows and, indirectly, water quality are typically observed. A variety ofactivities occurring on forestlands, including forest management (timber harvesting and road construction and use), fire suppression, recreation, and livestock grazing, can affect soil and waterresources. Disturbances that trigger large erosion events can produce important changes in aquatic conditions. These episodic changes are critical in maintaining aquatic habitat over time, eventhough they may temporarily decrease water quality. Another factor is the reassignment of sample points between land use classes (e.g., forest to urban or vice versa). These reassignments havetaken place and will continue to be refined over time, which may affect water quality results.
AGENDA ITEM C Attachment 1 Page 15 of 22

KPM #9 VOLUNTARY PUBLIC AND PRIVATE INVESTMENTS MADE TO CREATE HEALTHY FORESTS - Cumulative public and private forest landowner investments made in voluntary projects forthe Oregon Plan for Salmon and Watersheds or for the Oregon Conservation Strategy.Data Collection Period: Jan 01 - Dec 31
* Upward Trend = positive result
Report Year 2014 2015 2016 2017 2018
Private forestland owner investment in Oregon Plan habitat restoration projects - $ in millionsActual $98.76 $100.03 $101.70 $103.00 $105.01Target $105.50 $100.00 $101.00 $102.00 $103.03
How Are We DoingPrivate forestland owners have made significant investments in improving water quality and fish habitat. Reported cumulative investments for 2018 were $105 million compared to a target of $103million. The 2018 accomplishment level represents the fourth consecutive year that cumulative private investments in Oregon Plan met the target. In 2018, private forestland owners invested $1.3million. The Department had expected the rate of expenditures to decline over time as more projects were completed and opportunities for restoration decreased. The great recession caused asteep drop in investment corresponding to a steep decline in timber harvest. However, in 2012-2018, restoration activities showed a slight increase and are approximately $1.5 million averageinvestment per year. At this time, data are not available for investments under the Conservation Strategy.
Private forestland owners are the major contributor to Oregon Plan for Salmon and Watersheds (Oregon Plan) accomplishments, providing over 70 percent of reported private landaccomplishments. Oregon is unique among western states in its focus on voluntary measures; voluntary measures work in concert with regulatory approaches to achieve additional habitatprotection and restoration.
Factors Affecting ResultsThe Oregon Plan has been successful because of the strong forestland owner community who work with Watershed Councils and the Department to achieve restoration and protection goals fornatural resources. There continues to be broad support for voluntary measures versus regulatory mandates. ODF Stewardship Foresters provide education and technical assistance to landownersin support of restoration activities. The economic downturn significantly affected the housing market and corresponding demand for wood products. Timber harvests, the primary forest operationduring which restoration activities occur, dropped by one billion board feet from 2007 to 2009. In addition, 2009-11 departmental budget reduction eliminated Oregon Plan funding and about 40
actual target
AGENDA ITEM C Attachment 1 Page 16 of 22

percent of stewardship foresters (from 60 to 30 field foresters) who encourage and provide technical assistance for these types of projects including encouraging reporting. After building back somecapacity for this work, the department took a 40% reduction in 2017-19 for Oregon Plan funding. Oregon Plan funding supports coordination with watershed councils and other groups thatencourage restoration.
Voluntary restoration activities by landowners, combined with continued regulatory compliance, provide a foundation for the success of the Oregon Plan in protecting and restoring water quality andfish habitat on forestland. The Oregon Conservation Strategy provides an analogous voluntary framework for restoration of all habitat types. The Conservation Strategy emphasizes proactivelyconserving declining species and habitats to reduce the possibility of future federal or state listings. The strategy presents issues and opportunities, and recommends voluntary actions that willimprove the efficiency and effectiveness of conservation in Oregon. The Department revised its stewardship agreement program to improve efficacy at encouraging forestland owners to self-regulate to meet and exceed applicable regulatory requirements and achieve conservation, restoration and improvement of fish and wildlife habitat and water quality. The Department developed aprogrammatic Safe Harbor Agreement for Northern Spotted Owls to provide regulatory certainty and encourage voluntary enhancement of owl habitat. Working with landowners and the public thedepartment updated voluntary measures which were presented to, and approved by, the Board of Forestry in April 2009. In 2012, the Department worked with private forestland owners to updatethe Oregon Plan voluntary measures, "Private Forest Landowners and the Oregon Plan: Oregon Plan Actions for Landowners, by Landowners."
In 2016, the Department completed a project, along with the Oregon Watershed Enhancement Board and the Oregon Forest Resources Institute, to evaluate and better understand what has beenaccomplished by private forestland owners under the Oregon Plan and identify any potential barriers to implementing and reporting voluntary restoration activities. This work included a survey offorestland owners in the coast range to identify any perceived or real barriers to implementing and reporting voluntary measures. The final report was received in July 2016 and the results werepresented to the Oregon Board of Forestry and the Oregon Watershed Enhancement Board. ODF, agency partners, and private landowners are currently evaluating next steps.
AGENDA ITEM C Attachment 1 Page 17 of 22

KPM #10 STATE FORESTS NORTH COAST HABITAT - Complex forest structure as a percent of the State Forests landscape.Data Collection Period: Jul 01 - Jun 30
* Upward Trend = positive result
Report Year 2014 2015 2016 2017 2018
Complex structure as a percent of the State Forests landscapeActual 17.05% 17.25% 17.01% 16.21% 10.30%Target 30% 30% 30% 30% 30%
How Are We DoingThe FY 2017 data show that 14.4% of Astoria district, 10.3% of Forest Grove district, and 8.0% of Tillamook district are in complex forest structure.
Factors Affecting ResultsComplex forest structure develops very slowly and it is anticipated to take decades to achieve the range of 30 to 50% complex structure now described in the forest management plans. ODF’s Stand Level Inventory (SLI) system is not designed to report on year-to-year difference but rather indicate longer term trends.
The year-to-year changes in complex structure are the result of updates to SLI data as well as active management, such as thinning, that may temporarily reduce stand complexity, but are designed to enhance the development of complex forest structure over time, as the growth of the remaining trees is improved.
Following an external expert review, ODF adopted a new growth model in 2018 to improve consistency of inventory estimates. The new growth model provides improved estimates of stand growthand development; however, further refinements are needed to accurately estimate complex forest structure. As a result the estimates may change as the refinements are implemented and newinformation becomes available. ODF is currently undertaking several projects that will result in improved inventory estimates in the future, for both timber production and wildlife habitat.
actual target
AGENDA ITEM C Attachment 1 Page 18 of 22

KPM #11 FIRE SUPPRESSION EFFECTIVENESS - Percent of wildland forest fires under ODF jurisdiction controlled at 10 acres or less.Data Collection Period: Jan 01 - Dec 31
* Upward Trend = positive result
Report Year 2014 2015 2016 2017 2018
Percent of wildland forest fires controlled at 10 acres or lessActual 93.93% 93.04% 94.90% 96.30% 94.73%Target 97% 98% 98% 98% 98%
How Are We DoingThe Department was not able to meet the target of suppressing 98 percent of all wildfires at ten acres or less in size for the 2017 fire season. We were 3.27% under target at 94.73%.
Factors Affecting ResultsInfluencing factors: 2017 was an historic fire season year with sustained, intensive wildfire activity, an increase in human-caused fires, and severe conditions including multiplethunderstorm/lightning fire ignition events. Fire environment conditions that contribute to large fire growth intensified very quickly to sustained record levels in many areas across the state. Multiplesimultaneous large and severe fires on neighboring jurisdictions also threatened ODF-protected lands, stretching all firefighting resources thin. Comparing 2017 with our 10-year average, therewere 13% more fires and 36% more acres burned. There were 17% more human-caused fires and 251% more protected acres burned from human-caused fires than the average.
actual target
AGENDA ITEM C Attachment 1 Page 19 of 22
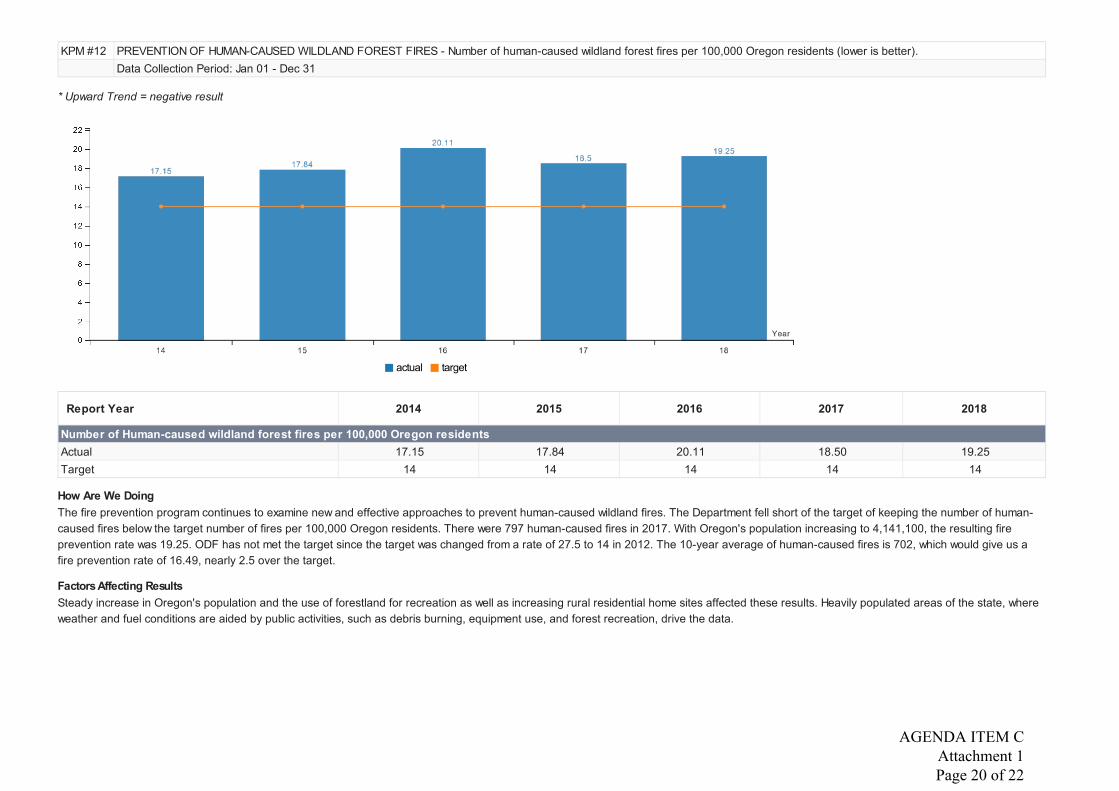
KPM #12 PREVENTION OF HUMAN-CAUSED WILDLAND FOREST FIRES - Number of human-caused wildland forest fires per 100,000 Oregon residents (lower is better).Data Collection Period: Jan 01 - Dec 31
* Upward Trend = negative result
Report Year 2014 2015 2016 2017 2018
Number of Human-caused wildland forest fires per 100,000 Oregon residentsActual 17.15 17.84 20.11 18.50 19.25Target 14 14 14 14 14
How Are We DoingThe fire prevention program continues to examine new and effective approaches to prevent human-caused wildland fires. The Department fell short of the target of keeping the number of human-caused fires below the target number of fires per 100,000 Oregon residents. There were 797 human-caused fires in 2017. With Oregon's population increasing to 4,141,100, the resulting fireprevention rate was 19.25. ODF has not met the target since the target was changed from a rate of 27.5 to 14 in 2012. The 10-year average of human-caused fires is 702, which would give us afire prevention rate of 16.49, nearly 2.5 over the target.
Factors Affecting ResultsSteady increase in Oregon's population and the use of forestland for recreation as well as increasing rural residential home sites affected these results. Heavily populated areas of the state, whereweather and fuel conditions are aided by public activities, such as debris burning, equipment use, and forest recreation, drive the data.
actual target
AGENDA ITEM C Attachment 1 Page 20 of 22

KPM #13 DAMAGE TO OREGON FORESTS FROM INSECTS, DISEASES, AND OTHER AGENTS - Percent of forest lands without significant damage mortality as assessed by aerial surveys.Data Collection Period: May 01 - Oct 31
* Upward Trend = positive result
Report Year 2014 2015 2016 2017 2018
Percent of Oregon forestlands without significant damage from insects, diseases and other agentsActual 98.07% 97.93% 98.01% 97.24% 98.34%Target 96% 96% 96% 96% 96%
How Are We DoingSince 1994, Oregon forests have met or exceeded the KPM target of 96 percent. The current year value is largely attributable to overall declines in forest areas impacted by bark beetles and insectdefoliators. Some of this decline, however, is due to the loss of preferred hosts rather than a drop in outbreaks – particularly for bark beetles and a non-native sap-sucking insect. Declines indefoliator-attributed damage may be attributed to the cyclical nature of outbreaks from these agents. In 2017 there was an increase in adults of one of these defoliators, Pandora moth. As part oftheir two-year life cycle, defoliation from the larvae of these moths is expected for pines in central Oregon in 2018. Generally pines rebound from this defoliation, due to the biennial feeding cycle ofthis species. The majority of tree mortality detected during statewide aerial surveys over the last decade has been due to pine-infesting bark beetles (Ips, mountain and western pine beetles).Collective mortality from these agents has declined for a third consecutive year in 2017, to 60% of what was observed in 2016. Activity by other major bark beetles (Douglas-fir beetle, fir engraver)rose in 2017. Douglas-fir beetle alone contributed to a 4-fold increase in mortality of Douglas-fir. This and another Douglas-fir attacking insect, flatheaded fir borer, are known to outbreak indrought-stressed stands. Douglas-fir is a species that is particularly intolerant of drought and we continue to see widespread tree mortality, especially in dry sites throughout the Willamette Valleyand southwestern Oregon where drought has been followed by beetle attack. Chronic damage to true fir from the non-native, sap-feeding insect, balsam woolly adelgid also continues along theCascade crest and in high-elevation firs in northeastern Oregon. Management is often not feasible in these remote areas and the number of fir trees continue to diminish. The most significant forestdiseases observed in statewide aerial surveys this year included Cytospora canker and Port-Orford-cedar root disease, the former increased in 2017 although damage and/or mortality from eachwas far less than historical observations. Note: This report does not include two major diseases that impact forests in western Oregon, Swiss needle cast and sudden oak death, as these agents arethe subject of separate surveying, data processing, and reporting efforts. Additionally, damage from other widespread disease agents such as root diseases may not be accurately identified andcaptured in aerial surveys. Young conifer mortality in western Oregon, which is attributed to a variety of causes such as vertebrate damage and root diseases, was reduced by 30% in 2017 - butwas more concentrated in distribution. Cooperative trapping surveys and monitoring for high-priority, non-native insects continued this year and resulted in the detection of 10 European gypsy
actual target
AGENDA ITEM C Attachment 1 Page 21 of 22
moths (Portland, Corvallis and Eugene) but no Asian gypsy moths. 2017 marked year two out of three for the exotic, woodboring insect monitoring project at interception pathways along theColumbia River. This trapping effort collected two non-native species, a woodboring beetle (Chrysobothris rugosiceps) and an ambrosia beetle (Cyclorhipidion pelliculosum), both of which are novelto the Pacific Northwest.
Factors Affecting ResultsOver the last decade, an average of over 783,000 acres of forest lands have been designated as having been significantly affected by insects, diseases, and other damaging agents during aerialsurveys. Thousands more acres are unhealthy and under-producing due to being overstocked, planted off-site, exposed to abiotic stresses such as drought, and stagnating from the suppression ofnatural fire cycles. These acres are becoming increasingly susceptible to damage by insects and diseases. While the statewide aerial survey data provides valuable information about key forestdamaging agents, aerial surveys are just an estimate and are not able to evaluate the impact of many forest diseases, nor indicate the current or future risk of forests to damage by insects anddiseases. In Oregon, thousands of acres of forests need active management to reduce the risk of insect outbreaks and catastrophic wildfires to produce resilient and sustainable forests. A centuryof fire suppression and inconsistent forest management has resulted in thousands of acres of Oregon’s forests becoming overstocked and unhealthy. In addition, changing climatic conditions thatcontribute to drought directly cause damage or increase susceptibility to insects and disease. Thinning stands to reduce competition, promote tree health and vigor, and increase age and speciesdiversity, have been shown to reduce the risk associated with many damaging insects and diseases. Federal bark beetle mitigation grants, administered by the Department’s stewardship foresters,provide cost share funds to landowners to implement activities to improve forest health and increase stand resistance to bark beetles. Federal National Fire Plan funds also provide cost-share tolandowners to improve forest health and prevent damage within the wildland-urban interface. However, as limited funds are available each year, the total acres of private forest lands treatedannually is relatively limited and is unlikely to affect overall statewide trends.
AGENDA ITEM C Attachment 1 Page 22 of 22


