42
attachment 3 to item 54 Net Zero Emissions and Water Efficiency Strategy date of meeting:30 March 2021 location: council chambers time:6:30 p.m.

a t t a c h m e n t 3
t o
i t e m 5 4
Net Zero Emissions and Water
Efficiency Strategy
d a t e o f m e e t i n g : 3 0 M a r c h 2 0 2 1
l o c a t i o n : c o u n c i l c h a m b e r s
t i m e : 6 : 3 0 p . m .


DRAFT NET ZERO EMISSIONS + WATER EFFICIENCY STRATEGY | 1
NET ZERO EMISSIONS +
WATER EFFICIENCY STRATEGY
HAWKESBURYCITY COUNCIL
www.hawkesbury.nsw.gov.au

DRAFT NET ZERO EMISSIONS + WATER EFFICIENCY STRATEGY | 2
Statement ofCommitmentto AboriginalAustraliansCouncil acknowledges that the Darug and Darkinjung people are the traditional owners and custodians of the land throughout the Hawkesbury.
Council recognises the continuing connection of Aboriginal peoples to their country and respects that Aboriginal people were the first people of this land.

DRAFT NET ZERO EMISSIONS + WATER EFFICIENCY STRATEGY | 3
ContentsContents. .............................................................................................................................................................3
Executive Summary .....................................................................................................................................4
Strategic Context .............................................................................................................. ...........................5
Community engagement results . ....................................................................................................8
Community baseline ......................................................................................................... ........................9
Council’s baseline . ......................................................................................................................................10
Climate action since 2017 ......................................................................................................................11
6 Strategies to a zero-carbon resilient Hawkesbury ............................................................12
Our action plan to get there ..................................................................................................................25
Appendix A United Nations Sustainable Development Goals ...................................................................29 Appendix B Exploring Pathways to Zero Emissions Hawkesbury ............................................................30Appendix C Methodology and Data Sets .................................................................................................................35
DRAFT NET ZERO EMISSIONS + WATER EFFICIENCY STRATEGY | 4
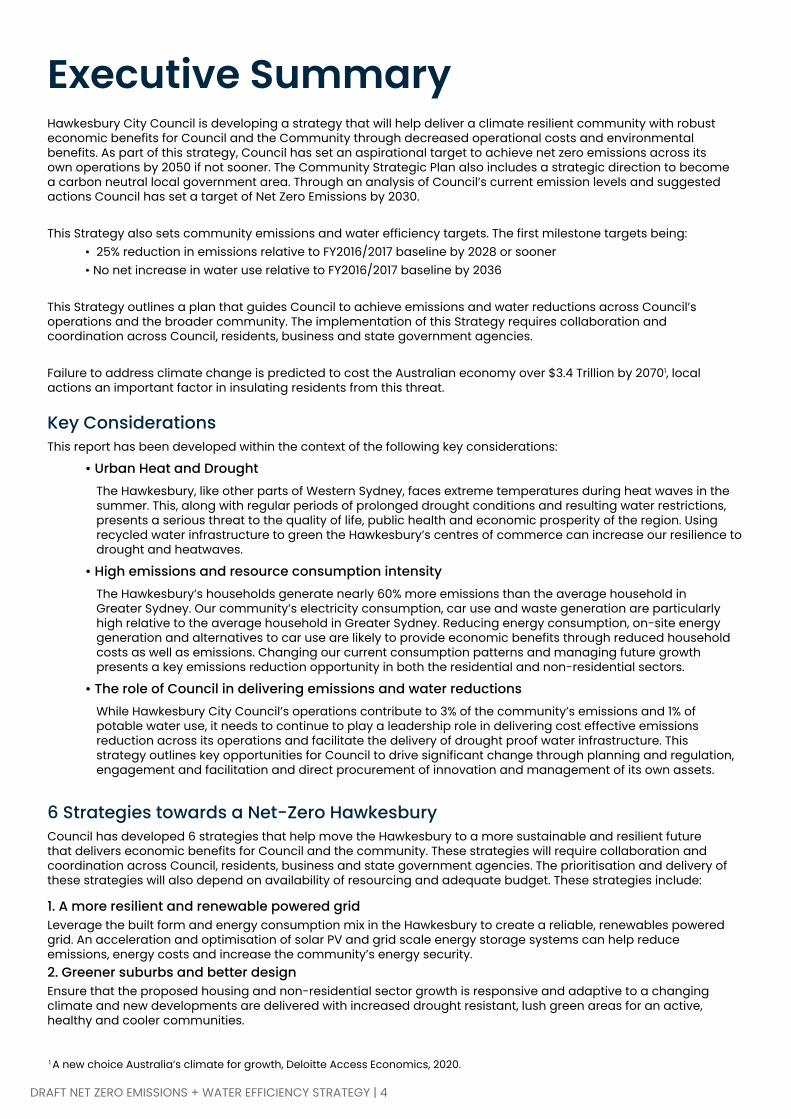
Executive SummaryHawkesbury City Council is developing a strategy that will help deliver a climate resilient community with robust economic benefits for Council and the Community through decreased operational costs and environmental benefits. As part of this strategy, Council has set an aspirational target to achieve net zero emissions across its own operations by 2050 if not sooner. The Community Strategic Plan also includes a strategic direction to become a carbon neutral local government area. Through an analysis of Council’s current emission levels and suggested actions Council has set a target of Net Zero Emissions by 2030.
This Strategy also sets community emissions and water efficiency targets. The first milestone targets being:• 25% reduction in emissions relative to FY2016/2017 baseline by 2028 or sooner• No net increase in water use relative to FY2016/2017 baseline by 2036
This Strategy outlines a plan that guides Council to achieve emissions and water reductions across Council’s operations and the broader community. The implementation of this Strategy requires collaboration and coordination across Council, residents, business and state government agencies.
Failure to address climate change is predicted to cost the Australian economy over $3.4 Trillion by 20701, local actions an important factor in insulating residents from this threat.
Key ConsiderationsThis report has been developed within the context of the following key considerations:
• Urban Heat and DroughtThe Hawkesbury, like other parts of Western Sydney, faces extreme temperatures during heat waves in the summer. This, along with regular periods of prolonged drought conditions and resulting water restrictions, presents a serious threat to the quality of life, public health and economic prosperity of the region. Using recycled water infrastructure to green the Hawkesbury’s centres of commerce can increase our resilience to drought and heatwaves.
• High emissions and resource consumption intensityThe Hawkesbury’s households generate nearly 60% more emissions than the average household in Greater Sydney. Our community’s electricity consumption, car use and waste generation are particularly high relative to the average household in Greater Sydney. Reducing energy consumption, on-site energy generation and alternatives to car use are likely to provide economic benefits through reduced household costs as well as emissions. Changing our current consumption patterns and managing future growth presents a key emissions reduction opportunity in both the residential and non-residential sectors.
• The role of Council in delivering emissions and water reductionsWhile Hawkesbury City Council’s operations contribute to 3% of the community’s emissions and 1% of potable water use, it needs to continue to play a leadership role in delivering cost effective emissions reduction across its operations and facilitate the delivery of drought proof water infrastructure. This strategy outlines key opportunities for Council to drive significant change through planning and regulation, engagement and facilitation and direct procurement of innovation and management of its own assets.
6 Strategies towards a Net-Zero HawkesburyCouncil has developed 6 strategies that help move the Hawkesbury to a more sustainable and resilient future that delivers economic benefits for Council and the community. These strategies will require collaboration and coordination across Council, residents, business and state government agencies. The prioritisation and delivery of these strategies will also depend on availability of resourcing and adequate budget. These strategies include:
1. A more resilient and renewable powered gridLeverage the built form and energy consumption mix in the Hawkesbury to create a reliable, renewables powered grid. An acceleration and optimisation of solar PV and grid scale energy storage systems can help reduce emissions, energy costs and increase the community’s energy security.2. Greener suburbs and better designEnsure that the proposed housing and non-residential sector growth is responsive and adaptive to a changing climate and new developments are delivered with increased drought resistant, lush green areas for an active, healthy and cooler communities.
1 A new choice Australia’s climate for growth, Deloitte Access Economics, 2020.

DRAFT NET ZERO EMISSIONS + WATER EFFICIENCY STRATEGY | 5
3. Low carbon and local transport A localised mobility response that aims to service the high levels of worker containment within the Hawkesbury. The strategy also enables an accelerated uptake in electric vehicles given the recurrent financial and environmental benefits for the community it can enable.
4. Towards a zero-waste communityUse the Integrated Waste Strategy to rethink waste as a resource as we move towards higher waste diversion from landfill through increased services as well as a circular economy approach that boosts the agri-business sector.
5. Drought resilient, green centresRealise the vision for green, cool centres across the Hawkesbury through urban design excellence and recycled water infrastructure provision. The master planning of Richmond, Windsor and South Windsor town centres will set the standard to deliver a network of attractive town centres in the region.
6. Council leading by exampleCouncil has a role to play in all the strategies including but not limited to leadership in delivering best practice sustainability through energy efficiency, renewable energy and water reuse opportunities in its own assets as well as advocacy and partnering with other public and private sector organisations to lead change within our community.
These six strategies are supported by key actions that Council can take in the short, medium and long term, providing an ambitious but manageable pathway towards a net zero emissions Hawkesbury.
The effectiveness of this plan must be measured and tracked against overarching targets. This report recommends the following targets and monitoring framework to track our success:
Council Operations• Net Zero Emissions by 2030 or earlier• No net increase in potable water use (Sydney Water Mains)• All non-potable water demand to be serviced using recycled water
The Community• 25% reduction in emissions relative to FY2016/2017 baseline by 2028 or sooner• 60% reduction in emissions relative to FY2016/2017 baseline by 2036 or sooner• Net Zero Emissions by 2050 or sooner through strategies and carbon offsets• No net increase in water use relative to FY2016/2017 baseline by 2028• Under 5% increase in water use relative to FY2016/2017 baseline by 2036• Under 25% increase in water use relative to FY2016/2017 baseline by 2050
Actions taken to deliver emissions and water reductions, and their impact towards delivering the target will be monitored. This will enable Council to respond to this data and adapt through the planning and implementation phases of the strategy. Council will continue to:
• Monitor Council operational usage of water, electricity, fuel, gas usage and methane flaring via our utilities data platform.
• Utilise the Resilient Sydney Climate Change Adaptation Plan Tool to monitor community emissions for electricity, transport, water and waste.
Establishing Targets and Monitoring Our Success

DRAFT NET ZERO EMISSIONS + WATER EFFICIENCY STRATEGY | 6
Strategic ContextAdapting to a changing climate is the biggest challenge facing our community.Climate change has caused average global temperatures to rise between 0.8°C and 1.2°C above pre-industrial levels2, and communities globally are already dealing with the effects, from flooding to fires, heat waves and more frequent storms. For Hawkesbury this means more extreme summer temperatures, longer drought periods and bushfire seasons, and floods (Figure 1 and Figure 2)
In addition, without the benefit of a cooling sea breeze, Hawkesbury’s community feels the full effect of heatwave conditions and climate predictions point toward the amplification of summer heat, representing a serious threat to the quality of life, public health and economic prosperity in the region.
In response, Hawkesbury City Council is developing a pathway to net zero emissions and water efficiency and a detailed waste options assessment across its own operations and the broader LGA to assist the community and businesses take action and adapt to a changing climate.
The call to action is further necessitated when considering the broader context of the Paris Agreement’s target of limiting global warming to under 1.5 degrees Celsius, the United Nations Sustainable Development Goals (refer to Appendix A) to deliver sustainable cities and communities as well as combating climate change, the NSW Government’s Net Zero Plan and Greater Sydney Commission’s target of Net Zero Emissions by 2050.
The Hawkesbury has an opportunity to drive significant change in the LGA and move towards a zero emissions and resilient future that delivers positive social, environmental and economic outcomes for the community.
EXTREME TEMPERATURES - NUMBER OF DAYS OVER 35°C
Figure 1: Extreme Temperatures - Number of days over 35 degrees Celsius - Richmond vs Sydney HarbourSource: Bureau of Meteorology
Figure 2: Gospers Mountain Bushfire, December 2020
GOSPERS MOUNTAIN BUSHFIRE
2 IPCC Special Report: Global Warming of 1.5°C, Summary for Policy Makers, 2019
DRAFT NET ZERO EMISSIONS + WATER EFFICIENCY STRATEGY | 7
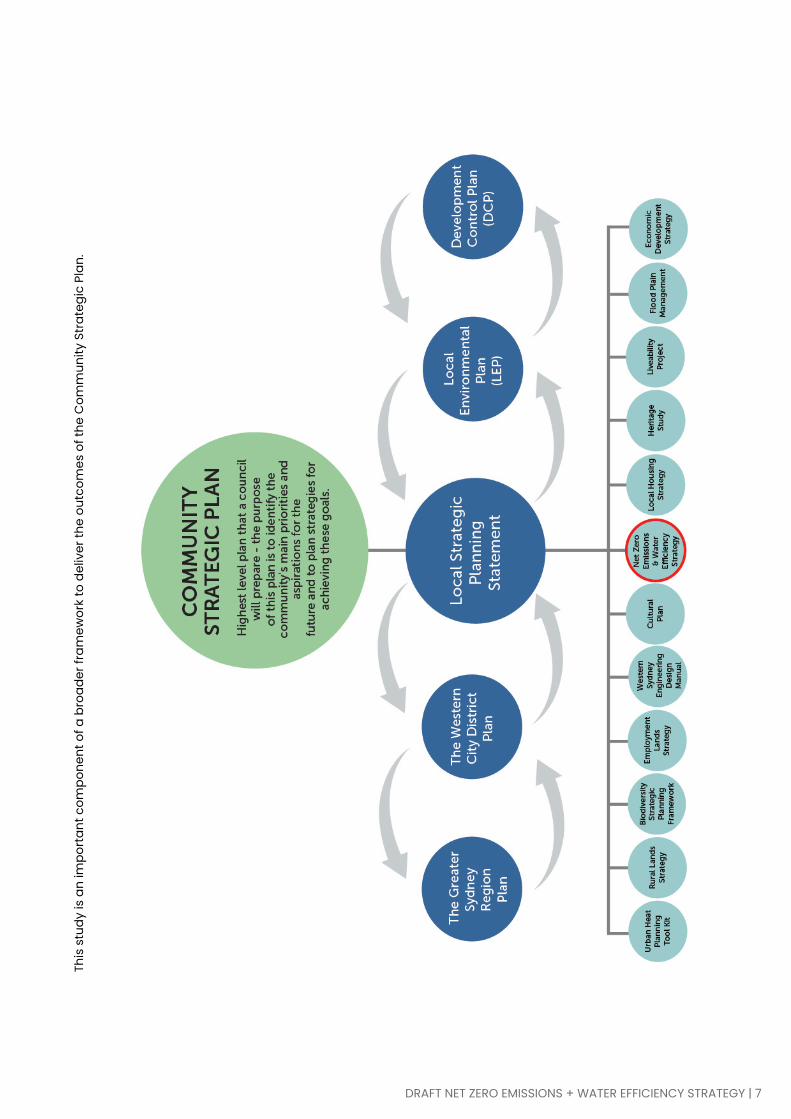
This
stu
dy is
an
impo
rtan
t com
pone
nt o
f a b
road
er fr
amew
ork
to d
eliv
er th
e ou
tcom
es o
f the
Com
mun
ity S
trat
egic
Pla
n.

DRAFT NET ZERO EMISSIONS + WATER EFFICIENCY STRATEGY | 8
Community engagement resultsDuring August 2020, Council invited the community to let us know what actions they were already undertaking at home or work to reduce carbon emissions and save water. We also asked the community what actions they would like to see Council take in order to reduce carbon emissions and water usage.
The responses highlighted that the Hawkesbury community are well on their way to reducing carbon emissions, being water efficient and supporting Council efforts to assist our community to reduce their emissions even further.Council received 124 survey responses and 32 ideas on how emissions can be reduced. This feedback has informed the six key strategies and the associated actions on page 10 onwards of this report.
Feedback SnapshotYour survey responses told us:
• 54% have installed solar PV and a further 16% are interested in hearing more about how to go about installing solar PV.• 76% have installed LED globes or replaced inefficient appliances, with 7% planning to do so in the next 12 months.• 90% have reduced their energy consumption by either- hanging clothes on the clothesline, using cold water to wash clothes, using curtains/ blinds and awnings, opening windows to control internal temperatures and switching off lights and appliances when not in use.• 90% have installed ceiling/ wall insulation.• 30% use public transport and 21% are interested in doing this more.• 30% have reduced car use by walking, carpooling, or riding with 27% wanting to use alternative transport methods more often.• 33% are planning to purchase an electric or hybrid vehicle• 59% have installed rainwater tanks for flushing toilets, laundry use or watering the garden.
Support for Council actions:• 97% of survey respondents are supportive of Council encouraging the installation of solar PV within the Hawkesbury Local Government Area.• 98% of respondents support Council encouraging developers and property owners to renovate and build new structures with the highest energy efficiency rating.• 96% of respondents are supportive of sustainable transport options, and infrastructure within the community.• 98% of respondents support recycling efforts.• 94% support Council’s continued community education on energy and water efficiency.
SCREENSHOT OF SAMPLE SURVEY RESPONSES
Figure 3: Screenshot of sample survey responses

DRAFT NET ZERO EMISSIONS + WATER EFFICIENCY STRATEGY | 9
Com
mun
ity b
asel
ine
Base
line
anal
ysis
3 pr
ovid
es a
sou
nd u
nder
stan
ding
of c
urre
nt re
sour
ce c
onsu
mpt
ion
and
emis
sion
s pa
tter
ns in
the
Haw
kesb
ury,
hel
ps id
entif
y ke
y ar
eas
of o
ppor
tuni
ty, d
evel
op re
spon
sive
str
ateg
ies,
the
impa
ct o
f whi
ch c
an b
e m
onito
red
and
adap
ted
as re
quire
d. F
Y 20
16/2
017
was
use
d as
the
base
line
year
giv
en th
e av
aila
bilit
y of
com
plet
e da
tase
ts a
s w
ell a
s to
alig
n w
ith o
ther
Cou
ncil,
regi
onal
and
sta
te re
port
s in
clud
ing
the
Com
mun
ity S
trat
egic
Pla
n an
d Lo
cal S
trat
egic
Pla
nnin
g St
atem
ent.
Thou
sand
tonn
es o
f CO
2-e
emis
sion
s ge
nera
ted
by th
e Ha
wke
sbur
y C
omm
unity
in
2016
/201
7El
ectr
icity
con
sum
ptio
n m
akes
up
59%
of t
otal
em
issi
ons.
Tra
nspo
rt
is n
ext h
ighe
st, p
rodu
cing
29%
of
com
mun
ity e
mis
sion
s. W
aste
co
ntrib
utes
7%
. Agr
icul
ture
onl
y m
akes
up
3% d
espi
te a
larg
e ec
onom
ic fo
otpr
int w
ithin
the
LGA.
777
Of h
ouse
hold
s in
stal
led
sola
r PV
in
2016
/201
7Th
e Ha
wke
sbur
y’s
sola
r PV
take
up
was
low
er th
an c
ompa
rabl
e lo
cal
gove
rnm
ent
area
s in
Syd
ney’
s fr
inge
in
FY20
16/2
017.
Addi
tiona
lly, B
ASIX
dat
a su
gges
ts o
nly
13%
of n
ew h
omes
wer
e bu
ilt w
ith
sola
rPV
in 2
016/
2017
. Fur
ther
mor
e,
com
mer
cial
scal
e so
lar P
V sy
stem
s (i
nsta
llatio
ns
over
10kW
) on
ly m
ade
up 3
0% o
f the
tota
lso
lar P
V ca
paci
ty in
stal
led
in th
eHa
wke
sbur
y.14%
Of h
ouse
hold
red
bin
mad
e up
of
food
and
gar
den
orga
nics
was
te in
20
16/2
017
The
aver
age
resi
dent
in th
e Ha
wke
sbur
yge
nera
tes
560
kg o
f was
te p
er y
ear,
30%
mor
e th
an th
e av
erag
e ho
useh
old
in
Gre
ater
Syd
ney.
Red
ucin
g ou
r was
te
and
dive
rtin
g as
muc
h as
we
can
from
land
fill w
ill m
ake
a si
gnifi
cant
co
ntrib
utio
n to
redu
cing
em
issi
ons
and
exte
ndin
g th
e lif
espa
n of
the
land
fill
site
.C
urre
ntly
, Cou
ncil
has
take
n
40%
Can
opy
cove
r in
Rich
mon
d,
Win
dsor
and
Sou
th W
inds
or to
wn
cent
res
in 2
016/
2017
Anal
ysis
by
the
cons
ulta
nt h
as
show
n a
stro
ng c
orre
latio
n be
twee
n hi
gher
urb
an tr
ee c
anop
y co
ver
(are
a co
vere
d by
tree
s on
pub
lic
and
priv
ate
land
with
in u
rban
ar
eas)
with
low
er la
nd s
urfa
ce
tem
pera
ture
s in
Gre
ater
Syd
ney.
Whi
lst r
ural
are
as o
f the
Haw
kesb
ury
are
char
acte
rised
by
high
can
opy
cove
r, ur
bani
sed
area
s cu
rren
tly
have
can
opy
cove
r rat
es fa
lling
wel
l be
low
10%
. Gre
enin
g ou
r citi
es a
nd
publ
ic p
lace
s is
a k
ey p
riorit
y fo
r C
ounc
il an
d th
e st
ate
<10%
High
er e
lect
ricity
use
than
the
aver
age
hous
ehol
d in
Gre
ater
Sy
dney
in 2
016/
2017
The
aver
age
hous
ehol
d in
the
Haw
kesb
ury
cons
umes
ove
r 9,0
00
kilo
wat
ts p
er h
our (
kWh)
per
an
num
. Lar
ger s
ingl
e dw
ellin
gs
gene
rally
con
sum
er m
ore
ener
gy.
Elec
tric
ity c
onsu
mpt
ion
is e
venl
y sp
lit a
cros
s th
e re
side
ntia
l and
no
nres
iden
tial s
ecto
rs.
45%
Of w
ater
is u
sed
by th
e Ha
wke
sbur
y co
mm
unity
in 2
016/
2017
62%
of m
ains
wat
er (
from
Syd
ney
Wat
erne
twor
k) is
con
sum
ed in
the
resi
dent
ial
sect
or a
nd n
early
hal
f of a
ll th
e w
ater
used
in a
hou
seho
ld is
for n
on-p
otab
leus
es s
uch
as ir
rigat
ion,
toile
ts a
ndla
undr
y. In
dust
rial w
ater
use
s ac
coun
t for
a 17
% o
f dem
and.
6,40
0ML
3 All
data
pre
sent
ed in
this
bas
elin
e pa
ge is
bas
ed o
n an
alys
is o
f FY2
016/
2017
dat
a.
The
car u
se o
f ave
rage
ho
useh
old
in G
reat
er S
ydne
y in
20
16/2
017
The
aver
age
hous
ehol
d in
the
Haw
kesb
ury
owns
ove
r 2.3
car
s an
d tr
avel
s 90
km p
er d
ay b
y ca
r. Th
is is
dou
ble
the
car u
se o
f the
av
erag
e ho
useh
old
in G
reat
er
Sydn
ey. T
hees
timat
ed fu
el c
ost a
lone
is o
ver
$4,5
00 p
er y
ear p
er h
ouse
hold
.
2xO
f Haw
kesb
ury’
s re
side
nts
wor
k w
ithin
the
LGA
in 2
016/
2017
A fu
rthe
r 30%
com
mut
e to
the
neig
hbou
ring
LGAs
– B
lack
tow
n,
Penr
ith a
nd th
e Hi
lls S
hire
. Des
pite
th
e sh
ort c
omm
ute,
Haw
kesb
ury’
s re
side
nts
are
very
car
relia
nt a
nd
over
60%
of t
he s
hort
to m
ediu
m
trip
s to
wor
k ar
e m
ade
usin
g a
car.
Switc
hing
to m
ore
sust
aina
ble
tran
spor
t opt
ions
can
mak
e a
sign
ifica
nt d
iffer
ence
in e
mis
sion
s an
d de
liver
hou
seho
ld c
ost
savi
ngs.
44%

DRAFT NET ZERO EMISSIONS + WATER EFFICIENCY STRATEGY | 10
Tonn
es o
f CO
2-e
emis
sion
s ge
nera
ted
by H
awke
sbur
y C
ounc
il O
pera
tions
in
2016
/201
7El
ectr
icity
con
trib
utes
to 7
8%
of H
awke
sbur
y’s
corp
orat
e em
issi
ons
excl
udin
g co
unci
l op
erat
ed w
aste
faci
litie
s.
The
coun
cil f
leet
acc
ount
s fo
r a fu
rthe
r 17%
of c
orpo
rate
em
issi
ons
with
gas
and
ch
emic
als
used
mak
ing
upth
e re
mai
ning
5%
. Not
e th
at
emis
sion
s fr
om m
etha
ne
capt
ure
and
flarin
g at
the
land
fill s
ite h
as b
een
excl
uded
as
it is
an
abat
emen
t mea
sure
to
redu
ce th
e co
mm
unity
’s
was
te e
mis
sion
s. N
ote
also
th
e fu
gitiv
e em
issi
ons
and
emis
sion
s fr
om w
aste
wat
er
trea
tmen
t are
not
exp
ecte
d to
be
a si
gnifi
cant
por
tion
of
Cou
ncil’
s em
issi
ons
prof
ile a
nd
have
bee
n ex
clud
ed fr
om th
e an
alys
is d
ue to
the
com
plex
ity
in a
ccur
atel
y m
odel
ling
them
.
10,8
24O
f sol
ar P
V in
stal
led
on
twoc
ounc
il as
sets
in
2016
/201
7C
ounc
il ha
d in
stal
led
sola
r PV
pan
els
on tw
o co
unci
l as
sets
– 16
kW
on
the
Oas
is
Aqua
tic C
entr
e an
d 22
kW
on
the
Win
dsor
Adm
inis
trat
ion
Build
ing
by 2
016/
2017
.
38kW
Tonn
es o
f CO
2e a
void
ed
thro
ugh
Met
hane
Fla
ring
up to
Au
gust
202
0Ha
wke
sbur
y C
ity C
ounc
il ha
s in
crem
enta
lly e
xpan
ded
the
num
ber o
f met
hane
cap
ture
wel
ls
acro
ss th
e la
ndfil
l site
sin
ce 2
014
to
redu
ce th
e em
issi
ons
gene
rate
d fr
om c
omm
unity
was
te. E
mis
sion
s ab
atem
ent c
omes
from
the
capt
ure
and
flarin
g of
met
hane
ac
cum
ulat
ed fr
om h
isto
rical
w
aste
bur
ied
at th
e la
ndfil
l site
an
d do
es n
ot s
impl
y re
late
to th
e w
aste
em
isss
ions
for t
he b
asel
ine
year
. Ove
r 40%
of a
n av
erag
e ho
useh
old’
s Ke
rbsi
de re
sidu
al
was
te c
ompr
ised
of o
rgan
ics.
O
rgan
ics
was
te g
ener
ates
m
etha
ne w
hen
burie
d in
land
fill.
50,0
00+
Of S
ydne
y W
ater
(m
ains
w
ater
) us
age
acro
ss th
e LG
A is
att
ribut
able
to c
ounc
il in
20
16/2
017
Cou
ncil
uses
30
ML
per y
ear o
f wat
er
from
the
Sydn
ey W
ater
mai
ns fo
r its
op
erat
ions
. Cou
ncil
also
ope
rate
s th
e So
uth
Win
dsor
Rec
ycle
d W
ater
Sc
hem
e th
at c
an s
uppl
y up
to
360M
L of
recy
cled
wat
er p
er y
ear.
1%
Cou
ncil’
s ba
selin
e
Emis
sion
s M
etho
dolo
gy N
ote
• Th
e co
mm
unity
gre
enho
use
gas
emis
sion
s an
alys
ed in
this
repo
rt a
re s
ecto
r-ba
sed
emis
sion
s co
verin
g el
ectr
icity
,
gas,
was
te, t
rans
port
and
agr
icul
ture
. Sou
rces
for v
ario
us d
atas
ets
are
prov
ided
in th
e Ap
pend
ix. T
he e
stim
ated
emis
sion
s in
vent
ory
is G
loba
l Pro
toco
l for
Com
mun
ity-S
cale
Gre
enho
use
Gas
Em
issi
on In
vent
orie
s BA
SIC
com
plia
nt a
nd c
over
emis
sion
sco
pes
1, 2
and
3.•
The
gree
nhou
se g
as e
mis
sion
s fo
r cou
ncil
oper
atio
ns a
naly
sed
in th
is re
port
cov
er e
mis
sion
s fr
om e
lect
ricity
, gas
and
flee
t. Th
e
est
imat
ed e
mis
sion
s in
vent
ory
was
dev
elop
ed u
sing
dat
a fr
om C
ounc
il’s
mon
itorin
g pl
atfo
rm a
nd e
mis
sion
s fa
ctor
s co
verin
g sc
opes
1
, 2 a
nd 3
ext
ract
ed fr
om A
ustr
alia
n G
over
nmen
t Nat
iona
l Gre
enho
use
Acco
unts
and
Nat
iona
l Gre
enho
use
and
Ener
gy R
epor
ting
D
eter
min
atio
ns.

DRAFT NET ZERO EMISSIONS + WATER EFFICIENCY STRATEGY | 11
Climate action since 2017The baseline analysis at FY2016/2017 provides a benchmark to measure progress against. The Hawkesbury Community Strategic Plan released in 2017 outlined a long-term vision to become a carbon neutral Local Government Area. In line with this vision, Council and the Community have already undertaken climate action particularly through investment in renewable energy and energy efficiency strategies.
Across the community, solar PV take up has increased in the residential and non-residential sectors.As at June 2020, 21% of Hawkesbury’s households installed solar PV relative to only 14% in FY2016/2017. Despite the increase, solar PV penetration across households in the Hawkesbury is still lower than comparable regions in Sydney’s fringe. For example, 26% of households in Wollondilly have solar PV.
Additionally, BASIX data suggests 22% of new homes were built with solar PV in FY2017/2018 - a significant increase from only 7% of new homes built with solar PV in FY2016/2017.
As at June 2020, commercial scale solar PV systems (over 10kW) make up over 40% of the total solar PV capacity in the Hawkesbury relative to only 30% in FY2016/2017. However, there are also far fewer commercial scale solar PV installations (over 10 kW) in the Hawkesbury relative to neighbouring Blacktown, Penrith or Hills Shire.
Council’s Hawkesbury City Solar Program has increased solar PV installations on Council assets, growing from 38 kW on two assets in FY2016/2017 to 764 kW on 12 assets. Additionally, Council has also signed a power purchase agreements that ensures 90% of its electricity use is powered by renewable energy. Council is investigating additional sites for solar PV installation.
Council’s Accelerated LED Streetlighting Upgrade program and Light Years Ahead program have also delivered significant energy efficiency savings since FY2016/2017.
The impact of these measures on Council and the Community emissions are quantified in the Appendix B.
Figure 4: Solar panels in the Hawkesbury City Council Administration Precinct
SOLAR PV ON COUNCIL ADMINISTRATION PRECINCT

DRAFT NET ZERO EMISSIONS + WATER EFFICIENCY STRATEGY | 12
Six Strategies to a zero-carbon resilient HawkesburyCouncil has developed 6 strategies that help move Hawkesbury to a more sustainable and climate resilient future. These strategies will require collaboration and coordination across Council, partners in the Western Sydney Regional Organisation of Councils (WSROC), residents, business and state government agencies. These strategies are summarised here and described in more detail in the following pages. All strategies will be supported with broader federal, state and regional strategies. The combination of these strategies is expected to deliver significant emission reductions, moving Hawkesbury towards a net-zero emissions future by 2050 (Figure 5). More detailed analysis of the pathways and impact of individual strategies as well as emissions and water targets is provided in the Technical Appendix.
1. A more resilient and renewable powered grid Leverage the built form and energy consumption mix in the Hawkesbury to create a resilient, renewable powered grid. An acceleration and optimisation of solar PV and grid scale energy storage systems can help reduce emissions, energy costs and increase the community’s energy resilience.2. Greener suburbs and better designEnsure that the proposed housing and non-residential sector growth is responsive and adaptive to a changing climate and new developments are delivered with drought resilient, lush green areas for an active, healthy and cooler communities.3. Low carbon and local transportA localised mobility response that aims to service the high levels of worker containment within the Hawkesbury. The strategy also enables an accelerated uptake in electric vehicles given the recurrent financial and environmental benefits for the community it can enable.4. Towards a zero-waste communityRethink waste as a resource as we move towards higher waste diversion from landfill through increased services as well as a circular economy approach that boosts the agri-business sector.5. Drought resilient, green centresRealise the vision for green, cool centres across the Hawkesbury through urban design excellence and recycled water infrastructure provision. The master planning of Richmond, Windsor and South Windsor town centres will set the standard to deliver a network of attractive town centres in the region.6. Council leading by exampleCouncil has a role to play in all the strategies including but not limited to leadership in delivering best practice sustainability through energy efficiency, renewable energy and water reuse opportunities in its own assets as well as advocacy and partnering with other public and private sector organisations to lead change within our community.
HAWKESBURY LGA EMISSION REDUCTION TRAJECTORY TO 2050
Figure 5: Hawkesbury community emission reduction trajectory. The grey area shows modelled emissions each year following reductions from various strategies represented by the different colours.

DRAFT NET ZERO EMISSIONS + WATER EFFICIENCY STRATEGY | 13
1. A more resilient and renewable powered grid
ContextElectricity consumption makes up the highest proportion of emissions in our community. This trend is consistent across both the residential and non-residential sectors (nearly evenly split in terms of electricity use). As such, managing electricity use will be a critical part of delivering emissions reduction across the Local Government Area.
The energy challenge becomes more evident when we benchmark the Hawkesbury against other regions in Greater Sydney. The Hawkesbury’s households consume 45% more electricity than the average household in Greater Sydney but the engagement surveys also indicate that the community is eager to achieve carbonneutral homes. While solar PV installations are growing, the number of commercial scale solar PV installations (>10 kW) is lower relative to the neighbouring LGAs of Blacktown, Penrith and Hills Shire.
While they are large consumers of electricity, single dwellings and industrial sites also have significant roof space and can suit high levels of solar PV take up. This strategy aims to leverage the available built form to maximise solar PV generation and use energy storage to service large daytime demand and reduce evening peak demand to create a resilient, renewable powered grid (see Figure 6).
ActionsThe actions behind this strategy aim to accelerate and optimise the solar PV installations on existing and new buildings in the LGA.
Council can establish performance targets through the BASIX policy and non-residential building standards to facilitate solar PV take up in new buildings. Council can collaborate with other councils in Greater Sydney and work with NSW Department of Planning, Infrastructure and Environment to inform the appropriate updates to the BASIX policy (see Figure 8 showing an example residential suburb with high solar PV penetration).
Additionally, Council can encourage existing buildings to take up solar PV through advocacy programs.
This local renewable energy can be balanced with a grid scale battery storage network to service the combined energy demands of the non-residential and residential sector during the day and peak residential loads in the evening (see Figure 6). Council can collaborate with Endeavour Energy to discuss the expected growth in solar PV, and network opportunities including grid scale storage as well as the impact of electric vehicles on demands and storage options.
Figure 6: Indicative residential and non-residential energy loads and solar PV generation profiles. These are modelled or estimated load profiles that are indicative of typical residential and nonresidential electricity consumption patterns.
MODELLED SOLAR PV CAPACITY GROWTH IN HAWKESBURY
Figure 7: Modelled cumulative solar PV capacity growth in the Hawkesbury. Assuming all new single dwellings and 50% of existing dwellings install 5 kW of solar PV. And 30% of the roof space of existing non-residential buildings in the Windsor, South Windsor and Richmond areas is used for solar PV.
ENERGY LOAD PROFILE MIX AND SOLAR PV GENERATION
Sustainable Development Goals

DRAFT NET ZERO EMISSIONS + WATER EFFICIENCY STRATEGY | 14
OutcomesThe proposed actions to increase renewable energy could deliver a range of positive outcomes across emission reduction, energy resilience and household cost savings. Modelling suggests that the following outcomes could be realised:
• 50% of existing single dwellings install 5 kW of solar PV per dwelling by 2028.• All new single dwellings in the Hawkesbury to install 5 kW of solar PV.
- Single dwelling BASIX Energy 90- Appartments (<14 storey) BASIX Energy 90
• Investigate opportunities for establishing a renewable energy precinct in assocoiation with the future planning of the exisitng education, research and employment opportunities associated with the existing cluster of education and defence activites at Richmond.• The proposed solar PV installations across dwellings and non-residential buildings can deliver nearly 100 MW of total solar PV capacity generating over 140 GWh/year in 2050 (see Figure 7). That is equivalent to nearly 30% of the Hawkesbury’s current electricity consumption. Target 30% of Hawkesbury’s electricity demand to be serviced through local generation by 2028 and continue to 2050.• High level load profile analysis suggests that 95% of the solar PV energy generated can be directed towards meeting the day time energy demands in the LGA. 70 MWh of battery storage strategically delivered across the Local Government Area can effectively avoid solar PV export beyond the LGA and reduce the evening peak demand by approximately 10%.• Energy resilience through local electricity distribution management and strategically located energy storage systems.• Over $1,000 per year of savings for households from solar PV.• Proposed renewables and efficient new buildings can deliver over 15% reduction relative to business-as-usual emissions in the short term (2028) but will have a reducing impact as the electricity grid gets greener. This is explained further in the Technical Appendix.
HIGH SOLAR PV PENETRATION IN RESIDENTIAL SUBURBS
Figure 8: Solar PV penetration in a residential suburb in East Richmond. Source: NSW Six Maps
DRAFT NET ZERO EMISSIONS + WATER EFFICIENCY STRATEGY | 15
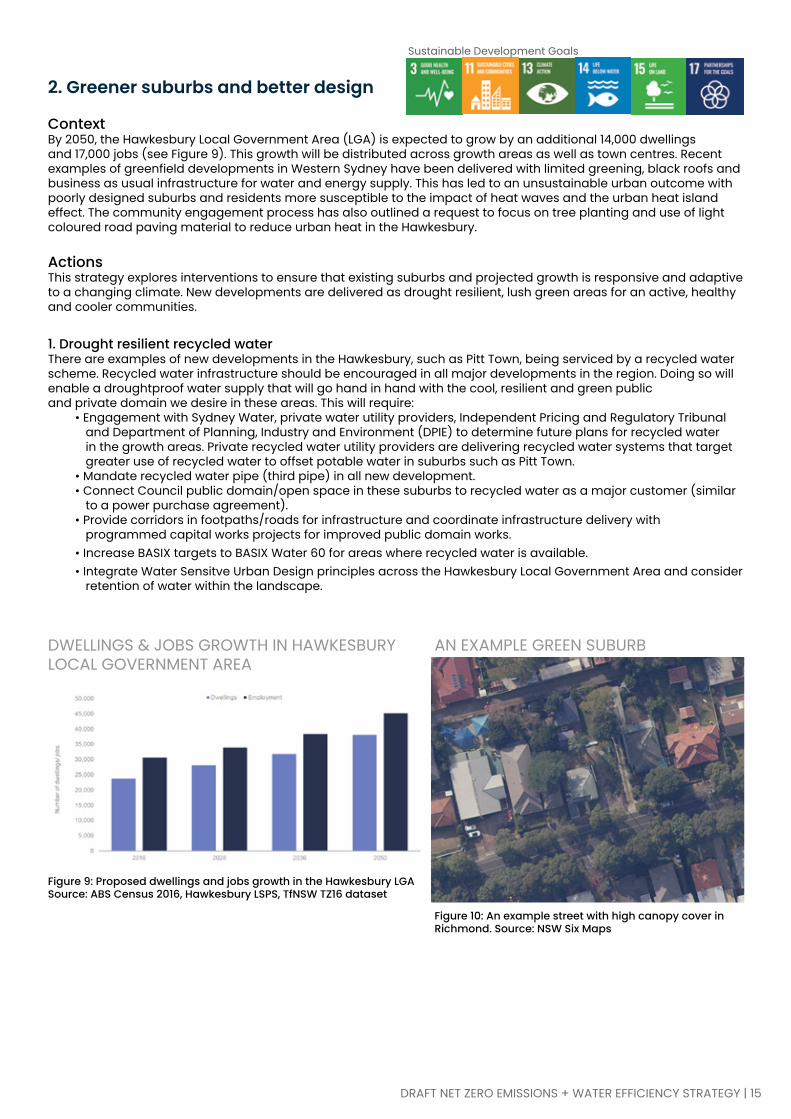
2. Greener suburbs and better design
ContextBy 2050, the Hawkesbury Local Government Area (LGA) is expected to grow by an additional 14,000 dwellings and 17,000 jobs (see Figure 9). This growth will be distributed across growth areas as well as town centres. Recent examples of greenfield developments in Western Sydney have been delivered with limited greening, black roofs and business as usual infrastructure for water and energy supply. This has led to an unsustainable urban outcome with poorly designed suburbs and residents more susceptible to the impact of heat waves and the urban heat island effect. The community engagement process has also outlined a request to focus on tree planting and use of light coloured road paving material to reduce urban heat in the Hawkesbury.
ActionsThis strategy explores interventions to ensure that existing suburbs and projected growth is responsive and adaptive to a changing climate. New developments are delivered as drought resilient, lush green areas for an active, healthy and cooler communities.
1. Drought resilient recycled waterThere are examples of new developments in the Hawkesbury, such as Pitt Town, being serviced by a recycled water scheme. Recycled water infrastructure should be encouraged in all major developments in the region. Doing so will enable a droughtproof water supply that will go hand in hand with the cool, resilient and green publicand private domain we desire in these areas. This will require:
• Engagement with Sydney Water, private water utility providers, Independent Pricing and Regulatory Tribunal and Department of Planning, Industry and Environment (DPIE) to determine future plans for recycled water in the growth areas. Private recycled water utility providers are delivering recycled water systems that target greater use of recycled water to offset potable water in suburbs such as Pitt Town.
• Mandate recycled water pipe (third pipe) in all new development.• Connect Council public domain/open space in these suburbs to recycled water as a major customer (similar
to a power purchase agreement).• Provide corridors in footpaths/roads for infrastructure and coordinate infrastructure delivery with
programmed capital works projects for improved public domain works.• Increase BASIX targets to BASIX Water 60 for areas where recycled water is available.• Integrate Water Sensitve Urban Design principles across the Hawkesbury Local Government Area and consider
retention of water within the landscape.
DWELLINGS & JOBS GROWTH IN HAWKESBURY LOCAL GOVERNMENT AREA
Figure 9: Proposed dwellings and jobs growth in the Hawkesbury LGASource: ABS Census 2016, Hawkesbury LSPS, TfNSW TZ16 dataset
Figure 10: An example street with high canopy cover in Richmond. Source: NSW Six Maps
AN EXAMPLE GREEN SUBURB
Sustainable Development Goals

DRAFT NET ZERO EMISSIONS + WATER EFFICIENCY STRATEGY | 16
2. Green public domain for resilience to urban heat
Across the Metropolitan Region the NSW state government has established a canopy cover target of 40% for low density suburban areas. However, most growth areas of the Hawkesbury have canopy less than 10%. Increased open space, green infrastructure, including street trees provide the potential to improve resilience against a changing climate and, furthermore, the urban heat island effect. When compared to an un-vegetated public domain, a well-managed, lush tree canopy can reduce land surface temperature by up to 15 degrees on a 35 degree day.
However, recent examples of development do not allow the public and private space to include significant landscaped areas or canopy cover. Council can mandate the desired canopy cover and green spaces in new developments. It is proposed that precinct design guidelines are prepared to address this, enabling a different approach to development that enables more significant space for greening and canopy cover. An example reconfiguration of a standard greenfield development area prepared by Simpson+Wilson Architects is outlined in Figure 11 and Figure 12, highlighting the additional landscaping and canopy cover available when road space and precinct design is rethought to deliver the same amount of dwellings but with increased greening.
OutcomesSome of the integrated benefits from using drought resilient recycled water to deliver cool green suburbs are outlined below:
• Over 50% capital cost savings from using recycled water utility compared to traditional public sector delivery of water infrastructure in land release areas. $13,000 savings per lot with $5,000 to the community/ government and $8,000 to the developer4.
• All blackwater and greywater to be reused on site in new developments. Target greater reuse of recycled water to offset potable water in new developments to 2050. Engage with private utility providers and developers in growth areas to facilitate this.
• All non-potable water use in suburbs serviced with recycled water to 2050.• Lush green suburbs with at least 40% canopy cover encouraging active healthy communities by 2028 and
maintain and increase canopy cover to 2050.• Increased resilience to heatwaves and water restrictions.
• Water Sensitive Urban Design, stormwater capture and recycled water enables reduced run off.
4Flow Systems, https://www.flowsystems.com.au/askus/Generic/Flow_Cost_Benefit.pdf
RECENT DEVELOPMENT IN WESTERN SYDNEY (2018)
Figure 11: Aerial view of recently developed growth area of Western Sydney highlighting road space and green space. (Source: Simpson+Wilson Architects 2020)
ALTERNATIVE APPROACH FOR INCREASED GREENING
Figure 12: Example alternative road, lot and green space layout to deliver significantly more landscape and canopy cover. (Source: Simpson+Wilson Architects 2020)

DRAFT NET ZERO EMISSIONS + WATER EFFICIENCY STRATEGY | 17
3. Low carbon and local transport
ContextTransport makes up nearly 30% of the Hawkesbury’s emissions profile. The bulk (25%) of these transport emissions are driven by households car use for work and leisure activities. Only a small fraction of the emissions is caused by people commuting from outside the LGA to the Hawkesbury for work. A clear strategy to tackle these locally generated transport emissions is vital to the Hawkesbury’s pathway to lower emissions.
The average household in the Hawkesbury owns over 2.3 cars and on average travels 90 km per day using their car. This is double the car use of an average household in Greater Sydney. Higher car ownership and use increases emissions as well as the cost of living for households. An average household in the Hawkesbury currently spends over $4,500 per year on just fuel expenses.
Analysing transport patterns of Hawkesbury’s households prior to COVID 19, there is a high level of worker containment within the LGA with 44% of Hawkesbury residents travelling to work within the LGA. A further 30% of residents travel to adjacent LGA’s – Blacktown, Penrith and the Hills Shire for work. Over 60% of these local trips for work are made using a car (see Figure 13).
Limited public and active transport infrastructure and amenity are drivers of higher car ownership and use in the Hawkesbury. Figure 14 shows the limited public transport catchment from Richmond. Through the surveys, the community has expressed a desire to reduce their car use if public and active transport choices areavailable.
ActionsA four-pronged approach to develop a mobility response that considers the specific context of the travel patterns observed in the Hawkesbury:
1. Encourage the uptake of electric vehiclesElectric vehicles provide a significant opportunity to decarbonise the transport sector. Where parking is provided it is considered prudent to provide the infrastructure or the capacity for Electric Vehicle Charging Points, includingappropriate charging outlets in each parking space allocated within a development (see Figure 15). This could begin with the provision and monitoring usage of electric vehicle charging stations in Council car parks for public use. Simultaneously, Council can include provision for Electric Vehicle ready infrastructure in relevant precinct Development Control Plans (DCP’s).
Figure 13: Place of work of the Hawkesbury’s residents. Source: ABS Journey To Work data
PLACE OF WORK OF THE HAWKESBURY’S RESIDENTS
Figure 14: 30 minute public transport catchment from Richmond
30 MINUTE PUBLIC TRANSPORT CATCHMENT - RICHMOND
Sustainable Development Goals

DRAFT NET ZERO EMISSIONS + WATER EFFICIENCY STRATEGY | 18
2. Facilitate the provision of public and on-demand transport infrastructureThere is a need to increase mobility options for residents. Public transport and on-demand Mobility as a service option are alternatives to car use. Council can collaborate with Transport for NSW to develop strategic public transport links between residential suburbs and the employment centres within and beyond the Hawkesbury LGA. Council can also engage with on-demand mobility service providers to pilot services along major transport corridors within the LGA.
3. Encourage active transportIn addition to public transport, active transport links are another alternative to car use. Council can create a network of pedestrian and bicycle friendly streets. It is recommended that Council adopt a staged approach to providing active transport infrastructure.
• Conduct a trial by imposing speed restrictions in suburban streets and centres.
• Trial temporary cycle ways along key routes between residential suburbs and centres and monitor their usage (see Figure 16).
• Transition to more permanent bike path infrastructure if a 10% increase in bike mode split is achieved.
4. Provide and test use of electric scootersCouncil can provide/facilitate electric scooters in strategic locations, specifically in the centres and test their usage. This action will enable the community to embrace a future of local electric transport in the Hawkesbury.
OutcomesThe 4 actions increase mobility choice for residents, reduce their transport emissions and cost of living. The modelled outcomes are outlined below:
• Target 15% reduction in car use across the LGA by 2028 and 30% by 2036.
• Target mode shift of public and active transport across the LGA to increase from 16% to 22% by 2028, 30% by 2036 and 40% by 2050.
• Nearly 30% reduction relative to projected reference emissions at 2050 from Electric Vehicle (EV) uptake and mode shift strategies. The emission reduction impact of electric vehicles grows as the electricity grid gets greener. This is explained further in the technical appendix.
• $4,500 per year of household cost savings from lower transport fuel costs (note: the additional upfront cost of an electric vehicle is not included in this).
• Broader benefits including improved air quality, pedestrian activity, local economic activity and active, healthy communities.
Figure 15: Making homes EV ready
EV CHARGING AT HOME
Figure 16: Westlink M7 shared path connects from Prestons to Baulkham Hills.
POP-UP CYCLEWAYS TRIALLED IN CITY OF SYDNEY

DRAFT NET ZERO EMISSIONS + WATER EFFICIENCY STRATEGY | 19
4. Towards a zero-waste community
ContextA zero waste community aims to rethink waste as a resource There are three key reasons to have a focused approach towards waste diversion and avoidance in the Hawkesbury. This strategy builds on key options and recommendations identified in Council’s Draft Integrated Waste Strategy:
1. Australia in general and the Hawkesbury in particular have relatively high waste generationAustralia has one of the highest waste generation rates in the world. When benchmarked against other regions in the Organisation for Economic Co-operation and Development (OECD), Australians generate more waste than the average country in the OECD and significantly more than European and other Asia-Pacific countries (see Figure 17). The average household throws away $1,000 worth of edible food every year. Combined, Australians waste nearly $8 billion of edible food5.. The waste problem trickles down to the Hawkesbury as well. Waste in 2016/2017 made up 7% of the Hawkesbury’s community emissions. The average Hawkesbury resident generates nearly 560 kg of waste per person each year (including landfill, recycling & green waste), in line with the Australian average but30% more than the average resident in Greater Sydney (see Figure 17).
Based on waste audits conducted by Council, over 40% of the waste in the red bin, the bin destined for landfill disposal, is composed of food and garden organics that can be composted and diverted from landfill. Organics waste disposed into landfill generates methane emissions which are 25-28 times more potent than Carbon Dioxide as a greenhouse gas. A further 20% of the waste in the red bin can be reycled.
2. Within Council and community’s sphere of influenceWaste is one of the key areas of emissions over which Council and the Community can have a direct influence. A significant portion of waste emissions can be avoided through increased composting and source separation by the community.
3. Significant and lasting impactCouncil’s Draft Integrated Waste Strategy will have a significant and lasting impact. While the impact of electricity efficiency and renewable strategies will decrease under a greener grid, the impact of waste strategies will be independent of these changes and continue to be significant in the future.
5 https://www.foodwise.com.au/foodwaste/food-waste-fast-facts/
Figure 17: Waste generation per capita – Benchmarking Hawkesbury to Australia and OECD Regions
2017 WASTE GENERATION – THE HAWKESBURY VS AUSTRALIA & OECD REGIONS
Figure 18: Composition of household red bin
COMPOSITION OF RED BIN
Sustainable Development Goals

DRAFT NET ZERO EMISSIONS + WATER EFFICIENCY STRATEGY | 20
ActionsThree key actions have been identified to maximise the use of the existing landfill site, engage and empower the community and adopt a circular economy approach to rethink waste as a resource. These actions build on the recommendations identified in Council’s Draft Integrated Waste Strategy.
1. Use captured bio methaneCouncil has traditionally taken a leadership position and embraced the challenge of managing community emissions through its landfill site. By capturing and flaring methane generated from organics waste buried in landfill, Council abated over 50 thousand tonnes of emissions until August 2020. Note that this is from the capture and flaring of methane accumulated from historical waste buried at the landfill site and does not simply relate to the waste emisssions for the baseline year.
2. Community awareness and engagementCouncil’s landfill site has a limited lifespan. At the end of life, Hawkesbury Council like other councils in Greater Sydney may need to truck its waste to other landfill sites. This will increase the emissions associated with waste and can be minimised through increase diversion from landfill through increased composting and source separation by the community. Council-led advocacy and education programs enable the community to change its consumption behaviour and attitudes towards waste.
3. Infrastructure led circular economy solution for the agribusiness sectorCouncil is currently formulating an Integrated Draft Waste Strategy that is investigating the provision of a food and garden organics collection service that mandates source separation for household and major generations of food and garden organics waste. The waste industry is undergoing significant innovation and Council as the owner and operator of the waste management facility can investigate the potential to pilot these innovative practices for the Hawkesbury.
OutcomesThese three actions are developed in alignment with Council’s Draft Integrated Waste Strategy and reinforce a collaborative approach between Council, residents and businesses to manage waste and use it as a resource.
• 100% organics diversion from landfill prior to 2028 and continue to 2050.• Emissions reduction of a steady 4-5% relative to reference emissions in 2028, 2036 and 2050 (see Figure 27). Further detailed in technical appendix.• An active and engaged community taking climate action by leveraging the tools and services provided by Council.• Reduced processing required at Council landfill site.• Extend the lifespan of the landfill site and reduce the need to truck waste elsewhere.• An innovative agribusiness hub leveraging the latest technology.
Figure 19: Modular organics waste management system using insects. Source: Goterra
EXAMPLE WASTE INNOVATION - MODULAR ORGANICS WASTE MANAGEMENT USING INSECTS

DRAFT NET ZERO EMISSIONS + WATER EFFICIENCY STRATEGY | 21
5. Drought resilient, green centres
ContextSimilar to greening in the growth areas, high density areas can be subject to local climate challenges, including the urban heat island effect. The urban heat island is effectively the difference between the land surface temperature and the average air temperature. This is caused by the prevalence in cities of heat-absorbing materials suchas dark colored pavements and roofs, concrete, urban canyons trapping hot air, and a lack of shade and green space in dense urban environments.
Council is revitalising the Richmond, South Windsor and Windsor town centres. One of the key components of the project is a public domain concept plan for the centres with improved park space, more amenity, trees and cooler streets.
The Hawkesbury’s vision for its town centres align well with broader state and regional objectives:
• Greening public spaces is a Premier’s Priority.• The NSW Government Architect has released the Draft Greener Places Strategy detailing canopy cover targets and greening strategies for Greater Sydney.• The Western Parkland City Liveability Program is a key commitment of the Western Sydney City Deal and enables Council to develop the infrastructure required to improve the built and natural environments.
There are many sources of water within the Hawkesbury Local Government Area. Sydney Water’s reticulated mains water supply and tank water are the sources of potable water within the region. Bore water, river water and recycled water are alternative sources used within the region for irrigation.
Lush public domains in the future town centres will have significant irrigation requirements. Our changing climate is resulting in increasingly drought-like conditions resulting in water restrictions and in turn, decreased vegetation and increased urban heat. The greening strategy for the centres needs to consider a drought resilient watersupply such as a recycled water scheme and incorporating the principles of Water Sensitive Urban Design..
The benefits of a recycled water system go beyond just drought resilience. The recycled water can service the irrigation demands to deliver a cooler urban environment and lead to improved air quality and household cost savings for the Hawkesbury community. The integrated benefits of a recycled water system are described in Figure 21.
Figure 20: Governer Phillip Park, Windsor
GOVERNOR PHILLIP PARK - WINDSOR
Figure 21: Integrated benefits of recycled water
INTEGRATED BENEFITS OF RECYCLED WATER
Sustainable Development Goals

DRAFT NET ZERO EMISSIONS + WATER EFFICIENCY STRATEGY | 22
ActionsThe actions aim to utilise and expand existing recycled water infrastructure enabling a drought resilient water supply and develop a targeted green infrastructure program in alignment to the Premier’s priority and NSW State government targets.
1. Utilise and expand recycled water supplyCouncil currently operates the South Windsor Recycled Water Scheme. The scheme has a supply capacity of 1.8 ML per day (360 ML per year) and provides a continuous source of water for non-potable uses, particularly irrigation and/ or toilet flushing in over 12 sites6. They include 6 council parks and reserves, 3 schools, 1 college and 1 sports field. This strategy aims to utilise the recycled water scheme to deliver a lush green urban outcome in the Hawkesbury’s town centres. Council, provided infrastructure is funded, can connect all its current and new public open spaces in the Windsor- South Windsor area to the recycled water scheme. If 120 ha of total green space is delivered in the area, its irrigation requirements can fully utilize the 360 ML per year supply capacity of the current South Windsor Recycled Water Scheme7. Additional greening may require expanding the recycled water capacity.
2. Targeted green infrastructure programCouncil can further pursue a Green Streets Program in the Centres. This program is proposed to include:
• Premier’s priority for greener public spaces: Increase the proportion of homes in urban areas within a 10 minute walk of quality green, open and public spaces by 10% by 2023.• In line with the NSW Government Architects Draft Greener Places Design Guidelines, Canopy cover targets of
- 15% in CBD areas. - 25% in medium to high density areas. - 40% in low density suburban areas.
• Identify priority pedestrian and activity corridors in centres.• Identify public domain and additional street tree planting opportunities.• Landscaping design standards for new developments to encourage green facades on key street frontages linked to priority pedestrian and activity corridors, as well as minimum deep soil landscaping for redevelopment sites.• Quantify the irrigation requirements from the proposed greening strategies and the master planning process must size and locate the appropriate recycled water schemes to service the irrigation requirements.
OutcomesThe modelled outcomes of greening the town centres with drought resilient recycled water include:
• 25% canopy cover in the Richmond, Windsor and South Windsor centres.• Total of 120 ha of green space strategically delivered across the centres to meet the Premier’s priority - all dwellings within 10 minutes of high quality public open space.• Irrigation requirements of all trees and green spaces serviced using recycled water.• 100% utilisation of the South Windsor Recycled Water Scheme.
- Attractive town centres with high quality footpaths, furniture and landscaping. - Benefit to local businesses with more pedestrian activity, placemaking and improved image to attract more residents, visitors and businesses. - Greener Town Centres with improved park space with more amenity, more trees and shade, cooler streets, reduced carbon emissions and improved air quality.
• Healthy, inclusive community with more active transport, enhanced social environments, reduced obesity and improved mental health.
6 Hawkesbury City Council South Windsor Recycled Water Scheme https://www.hawkesbury.nsw.gov.au/__data/assets/pdf_file/0011/39386/South-Windsor-Recycled-Water-Scheme-2013-June.pdf
7 Based on Sydney Waters best practice design guidelines for open space management, https://www.sydneywater.com.au/web/groups/publicwebcontent/documents/document/zgrf/mdq1/~edisp/dd_045253.pdf
Figure 22: Hawkesbury City Council, Revitalising our Town Centres of Richmond, South Windsor and Windsor.
REVISTALISING OUR TOWNCENTRES

DRAFT NET ZERO EMISSIONS + WATER EFFICIENCY STRATEGY | 23
6. Council leading by example
ContextIn response to the Climate Emergency, Council is committed to becoming a net zero emissions organisation by 2050, if not sooner.
Council’s operations contribute to 3% of the Hawkesbury’s total emissions and 1% of the Hawkesbury’s Sydney Water use. Notwithstading Council’s contribution, its leadership on sustainability is critical to aiding our community to achieve net zero emissions. Emission and resource efficiency strategies will not only provide economic benefits to Council (through cost savings), but importantly create awareness and inspire action in the local community and stakeholders.
We have established a baseline year of FY2016/2017 to monitor progress going forwards. However, Council has also historically displayed leadership in sustainability. The Hawkesbury’s population has grown by 6% between FY2008 and FY2017 and Council has proportionally increased its services (sewer pumps, waste management, etc.) to cater tothe growing population. Despite this, Council has decreased its emissions by over 20% primarily by reducing electricity use in its buildings and assets (see shaded portion of Figure 23).
The released in FY2016/2017 outlined an aspiration to achieve net zero emissions across the community through a combination of including:
• Under the Hawkesbury City Solar program, Council has installed 2,776 solar panels with 764kW across 12 Council facilities and saving 800 tonnes carbon dioxide equivalent (CO2e) emissions per year.
• Changed street lighting to LED street lights saving more than 3,260 tonnes CO2e emissions over the next 20 years.
• Installation of LED lighting in Council facilities.• While not reflected in Council’s emissions yet, Council has entered a Power purchase agreement that ensures
90% of its electricity use is from renewable energy.• Council has also been working on its recycled water management which, during the recent drought, allowed
Council to offer the ‘Baling for our Backyard’ initiative. Bales of Lucerne were offered to local farmers at a discounted rate. The bales were grown using recycled water from Council’s McGraths Hill Waste Water Treatment Facility.
• Council has expanded the number of methane capture wells across the landfill site since 2014 to capture and combust over 8.6 million cubic metres of landfill gas and abating over 57 thousand tonnes of CO2-e.
Figure 23: Historical emission reduction of Hawkesbury City Council operations
HAWKESBURY COUNCIL OPERATIONS – HISTORICAL EMISSIONS
Note: Methane flaring emissions from the landfill site has been excluded in this analysis. Methane capture and flaring from the landfill site is considered as an emissions abatement strategy for the community’s waste emissions
Sustainable Development Goals

DRAFT NET ZERO EMISSIONS + WATER EFFICIENCY STRATEGY | 24
Actions4 key actions have been identified to further reduce Council’s operational emissions and water use while also facilitating the 5 other strategies benefting the community:
1. Continuing efficiency upgrades and solar PV installations. Council is:• Installing solar PV on council owned facilities.• Streetlighting replacement program to deliver an additional 338 tonnes of CO2-e reduction per year.• Testing the feasibility of energy and water efficiency upgrades in its assets.• Target NABERS 5.5 star Energy & 4 Star Water rating across new assets.
2. Expand recycled water utilisation and capacity as required• Work towards connecting new and existing council public open space areas to the South Windsor recycled water scheme.
3. Community financing for small scale solar PV uptake• Facilitate the uptake of solar PV in the region by providing loans to building owners and recovering them
through council rates. The Environmental Upgrade Agreement (EUA) legislation already enables Council to do this. However, the legislation currently only supports improving the environmental performance of commercial buildings. Council can collaborate with other local governments and the State Government to extend the EUA legislation for households.
• Collaborate with local clubs to create community grants program directed towards small scale solar PV uptake.
4. Transition to an all-electric Council fleet• Fleet emissions make up over 15% of Council’s total emissions. A steady transition of the Council fleet to
electric vehicles will significantly reduce Council’s emissions footprint.• The associated EV charging stations in Council car parks can be shared with the community and aligns with
the Low Carbon & Low Transport strategy.
5. Enhance Waste Services• Council work towards an expression of interest for an Energy from Waste project as per the existing Draft
Integrated Waste strategy.• Advanced composting of FOGO, which may have agricultural applications.• Council can consider an expansion of kerbside service and stream seperation.
Outcomes• Aim to achieve Net Zero Emissions across Council Operations by 2030.• Council fleet transitioned to electric vehicles• Electric vehicle charging infrastructure to be shared with the community to facilitate uptake of electric vehicles across the community (Strategy 3).• 100% utilisation of Council’s recycled water facility to irrigate public open spaces areas in the Centres.• 100% organics divserion from Council landfill site.
Figure 24: Hawkesbury Council Operations - Future emission reduction opportunities
HAWKESBURY COUNCIL OPERATIONS – PATHWAY TO NET ZERO EMISSIONS
Note: Methane flaring emissions from the landfill site has been excluded in this analysis. Methane capture and flaring from the landfill site is considered as an emissions abatement strategy for the community’s waste emissions. Council can release an expression of interest to assess further uses for the methane captured at the landfill site.

DRAFT NET ZERO EMISSIONS + WATER EFFICIENCY STRATEGY | 25
Our action plan to get thereThis section informs the development of strategies that drive emission reduction and resource efficiency across the Hawkesbury community and council operations. While this is not an implementation plan, the following table outlines key actions and next steps to support the delivery of the 6 key strategies using practical approaches to reduce emissions and water use and appropriate tools and policies available for Council to take forward. The implementation scope and timeline of these actions are dependent on financial considerations including their business case, resourcing and budgets available. A monitoring system can help Council track the impact of various actions and refine the strategy as necessary. The monitoring platform can include an annual reporting framework aligned with the Global Protocol for Community-Scale Greenhouse Gas Emission Inventories BASIC Standard.
These actions will require collaboration and coordination across Council, partners in the Western Sydney Regional Organisation of Councils (WSROC), residents, business and state government agencies. The actions below are structured so Council can take on one of 5 roles in the implementation process:
1. Manager/Leader Council manages, leads, delivers and communicates commitment, progress and outcomes2. Critical Partner Council is an informed critical partner in the delivery of a project with mutual benefits for the partners3. Advocate Council develops an informed position and influences others who have the re-sponsibility to make the decision and act4. Supporter Where a project is initiated externally to Council, Council provides low level assistance to enable the project to be realised5. Facilitator Council makes it easier, and builds the capacity of others to deliverActions have been prioritised to be undertaken under three timeframes:
• Short (0-2 years)• Medium (2-5 years)• Long (5-10 years)
The ongoing effectiveness of the action plan to reduce carbon emissions and water use will be measured and tracked against overarching targets. Council’s progress towards the targets will be reported annually in line with Council’s Community Strategy Plan reporting requirements. The analysis outlined in the technical appendix supports Hawkesbury City Council adopting the following targets across emissions and water use:
Council Operations• Net Zero Emissions by 2030 or earlier• No net increase in potable water use (Sydney Water Mains)• All non-potable water demand to be serviced using recycled water
The Community• 25% reduction in emissions relative to FY2016/2017 baseline by 2028 or sooner• 60% reduction in emissions relative to FY2016/2017 baseline by 2036 or sooner• Net Zero Emissions by 2050 or sooner through strategies and carbon offsets• No net increase in water use relative to FY2016/2017 baseline by 2028• Under 5% increase in water use relative to FY2016/2017 baseline by 2036• Under 25% increase in water use relative to FY2016/2017 baseline by 2050
These actions and their impact towards delivering the target will be monitored. Council will continue to:• Monitor Council operational usage of water, electricity, fuel, gas usage and methane flaring via our utilities data platform• Utilise the Resilient Sydney Climate Change Action Planning Tool to monitor community emissions for electricity, transport, water and waste
A proposed monitoring and reporting framework is detailed further in Appendix B.
DRAFT NET ZERO EMISSIONS + WATER EFFICIENCY STRATEGY | 26
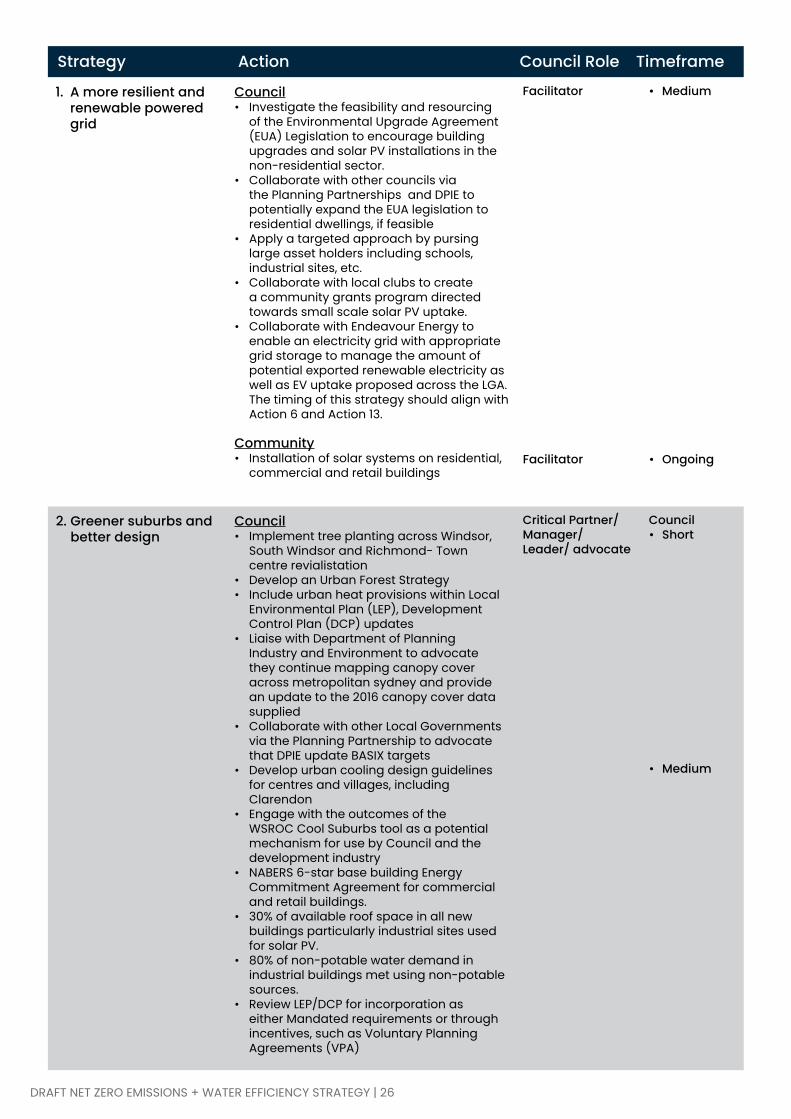
Strategy Action Council Role Timeframe
1. A more resilient and renewable powered
grid
Council• Investigate the feasibility and resourcing
of the Environmental Upgrade Agreement (EUA) Legislation to encourage building upgrades and solar PV installations in the non-residential sector.
• Collaborate with other councils via the Planning Partnerships and DPIE to potentially expand the EUA legislation to residential dwellings, if feasible
• Apply a targeted approach by pursing large asset holders including schools, industrial sites, etc.
• Collaborate with local clubs to create a community grants program directed towards small scale solar PV uptake.
• Collaborate with Endeavour Energy to enable an electricity grid with appropriate grid storage to manage the amount of potential exported renewable electricity as well as EV uptake proposed across the LGA. The timing of this strategy should align with Action 6 and Action 13.
Community• Installation of solar systems on residential,
commercial and retail buildings
Facilitator • Medium
Facilitator • Ongoing
2. Greener suburbs and better design
Council• Implement tree planting across Windsor,
South Windsor and Richmond- Town centre revialistation
• Develop an Urban Forest Strategy• Include urban heat provisions within Local
Environmental Plan (LEP), Development Control Plan (DCP) updates
• Liaise with Department of Planning Industry and Environment to advocate they continue mapping canopy cover across metropolitan sydney and provide an update to the 2016 canopy cover data supplied
• Collaborate with other Local Governments via the Planning Partnership to advocate that DPIE update BASIX targets
• Develop urban cooling design guidelines for centres and villages, including Clarendon
• Engage with the outcomes of the WSROC Cool Suburbs tool as a potential mechanism for use by Council and the development industry
• NABERS 6-star base building Energy Commitment Agreement for commercial and retail buildings.
• 30% of available roof space in all new buildings particularly industrial sites used for solar PV.
• 80% of non-potable water demand in industrial buildings met using non-potable sources.
• Review LEP/DCP for incorporation as either Mandated requirements or through incentives, such as Voluntary Planning Agreements (VPA)
Critical Partner/ Manager/ Leader/ advocate
Council• Short
• Medium

DRAFT NET ZERO EMISSIONS + WATER EFFICIENCY STRATEGY | 27
• Deliver increased BASIX targets through incentives, such as Voluntary Planning Agreements, if BASIX targets are not increased
• Educate the community on sustainable building design principles, water and energy efficiency measures and the importance of trees within the landscape, and encourage tree planting on private property
Community• Tree planting on private property• Incorporate sustainable design principals,
energy and water efficiency measures in new
Critical Partner/ Manager/ Leader/ advocate
• Ongoing
• Ongoing
• Ongoing
3. Low Carbon and Local Transport
Council• Continue to liaise with WSROC Council’s in
the development of a Regional EV Roadmap• Amend LEP/DCP to mandate EV charging
outlets and infrastructure
• Develop a car share policy and engage with car share providers to size and locate a fleet of car share vehicles in the Hawkesbury town centres
• Engage with Endeavour to discuss the expected growth in Electric Vehicles and provision of necessary electricity infrastructure requirements
• Collaborate with Transport for NSW and electric bike providers to pilot electric bike infrastructure in Hawkesbury’s centres.
• Incorporate, where feasible, the provision of EV charging infrastructure as part of the Liveability program
• Collaborate with Transport for NSW to improve public transport services in the region.
• Identifying streets as public spaces and shared uses across pedestrians, cyclists and vehicles, where possible through the master planning of town centres and villages
Community• Increased usage of public transport, walkways and cycleways• Increasing number of electric vehicles registered within the Hawkesbury Local Government Area
Manager/ Leader/ Critical Partner/ advocate
• Short
• Medium
4. Towards a Zero- Waste Community
Council• Implementation of the actions within the
Hawkesbury City Council Draft Intergrated Waste Strategy
• Engage with Western Sydney Regional Organisation of Councils to pursue further waste innovation strategies that leverage the methane capture systems in place including Waste to Energy and potential options for organics disposal in line with Council’s Draft Integrated Waste Strategy
Manager/ Leader • Medium
Strategy Action Council Role Timeframe

DRAFT NET ZERO EMISSIONS + WATER EFFICIENCY STRATEGY | 28
Council• Investigaste the feasibility of expanding
utilisation of Council owned South Windsor Recycled Water Scheme to service irrigation demands of green spaces.
• Where possible, expand utilisation of Council owned recycled water facilities to service irrigation demands of green spaces.
• Engage with DPIE regarding the growth area State Environmental Planning Policy to facilitate recycled water in new development
• Engage with recycled water infrastructure providers to service public open space and council irrigation demands.
• Engage with Sydney Water and private sector providers to determine feasibility and intensions for recycled water in major project areas across the LGA.
Community• Reductions in household mains water usage
Community• Reduction in organic waste being disposed of at Hawkesbury’s Waste Management Facility
Manager/ Leader/ Critical Partner
• Medium
• Long
6. Council leading by example
• Continue to assess and maximise solar PV installations on Council assets
• Transition Council plant/ equipment, eg mowers/ blowers, to electric and battery operated, where feasible
• Transition Council fleet to electric vehicles and share EV charging infrastructure with community if feasible
• Ensure energy and water efficiency and sustainable design principles are applied to new council commercial assets, where feasible
• Perform energy and water efficiency upgrades to exisiting council assets, when upgrades are scheduled, where feasible
Manager/ Leader • Short
• Medium
5. Drought resilient, green centres
• Ongoing
• Ongoing
• Ongoing
• Implementation of education and behaviour change programs for Council staff and the community.
5. All Strategies Manager/ Leader • Ongoing
Strategy Action Council Role Timeframe

DRAFT NET ZERO EMISSIONS + WATER EFFICIENCY STRATEGY | 29
Appendix A- Unitied Nations Sustainable Development Goals In September 2015 Australia joined 193 leaders and Ministers across the globe to welcome and endorse the 2030 Agenda for Sustainable Development, and actively participated in discussions to design the 2030 Agenda. The 2030 Agenda for Sustainable Development is made up of 17 Sustainable Development Goals.
‘The Sustainable Development Goals are a call to action by all countries- poor, rich and middle-income- to promote prosperity while protecting the planet. They recognise that ending poverty must go hand-in-hand with strategies that build economic growth that address a range of social needs including education, health, social protection, and job opportunities, while tackling climate change and environmental protection’. https://www.un.org/sustainabledevelopment/

DRAFT NET ZERO EMISSIONS + WATER EFFICIENCY STRATEGY | 30
Appendix B - Exploring Pathways to Zero Emissions HawkesburyOverview and approach
To develop a pathway to a Zero Emissions Hawkesbury, we workshopped a combination of different policy and strategy interventions with Council and community groups. The analysis established a reference scenario and quantified the impact of various strategies against this reference scenario at 2028, 2036 and 2050.
1. Reference Scenario The reference scenario approximates a business as usual reference case where the resource consumption and emissions impact in the future if all the projected new growth in Hawkesbury performed at similar levels to the existing built form in the LGA. The scenario:
• Incorporates growth in dwellings and jobs to 2028, 2036 and 2050.• Applies current energy consumption, water use, transport patterns and waste generation intensities (e.g. kWh per detached dwelling or kWh per industrial job) to this dwelling and job growth.• Applies FY 2016-2017 greenhouse gas emission factors (e.g. kgCO2-e per kWh) unless otherwise stated.
2. Model Scenario This scenario explores the implications of different policy and strategy interventions on emissions and water reductions in Hawkesbury. The scenario:
• Models the impact of strategies that affect new development, transport, waste as well as retrofits for existing development (see Appendix for details assumptions) at 2028, 2036 and 2050.
• Considers changes in the emissions intensity of the electricity grid under recent projections by the Australian Energy Market Operator in its Integrated System Plan (see Figure 25).
Figure 25: Electricity emissions factor changes over time. The Central scenario has been modelled in this study. Source: Kinesis analysis of AEMO ISP 2020 (draft)
AEMO PROJECTIONS FOR DECARBONISATION OF THE GRID
AEMO has modelled a number of scenarios to describe the transition of the electricity grid as coal power stations reach the end of their lifetime and new power sources including large scale renewable energy comes on board. This study has used the impacts of the Central change scenario simulating a transition determined by market forces and current federal and state government policies.

DRAFT NET ZERO EMISSIONS + WATER EFFICIENCY STRATEGY | 31
Emission Reduction Pathway AnalysisUnder the Reference Scenario, emissions across the Hawkesbury LGA are expected to grow by 63% to an additional 1,264 thousand tonnes CO2-e per year.
Kinesis analysed the impact of policy and strategy interventions incorporating recent projections for the electricity grid by the Australian Energy Market Operator in its Integrated System Plan, (Figure 25).
This scenario shows a significant shift in emissions from strategic interventions in the short, mid and long term to 2050. While there is no silver bullet to emission reduction, especially when it is considered through a temporal lens, a combination of strategies can direct Hawkesbury towards zero emissions.
• Greener Grid – As the electricity grid transitions to have a higher renewable generation mix, it is expected to deliver increasing emissions reduction across the LGA. In 2028, a greener grid will deliver a 13% emission reduction and 58% by 2050. The transition of the grid supports significant opportunities in the electrification of energy and transport in future years.
• Building efficiency measures - policies that impact the environmental performance of new development (such as BASIX or the National Construction Code) and retrofitting existing buildings with increased energy efficiency will have a significant impact in the short term but provide diminishing emission reductions as the grid gets greener. At 2028, building efficiency measures can reduce emissions by 10%.
• Renewables – Renewable penetration is captured to a certain degree in the greener grid as well as new building standards. Retrofitting renewables in existing buildings will have a significant impact in the short term and diminishing emissions impact as the grid gets greener. In the short term, community renewables can provide a 11% reduction in emissions.
• Transport – Electrification of transport will have a significant emissions reduction impact as the grid gets greener providing nearly 25% emissions reduction by 2050. Additional transport interventions and infrastructure that facilitate a mode shift from car use to increased public transport usage, walking/cycling is expected to reduce emissions by 1-2% each year.
• Waste – Increased diversion of waste from landfill will have a lasting impact independent of the transition of the electricity grid. Waste diversion is expected to reduce emissions by 4% by 2050.
• Carbon sequestration – The federal government’s Technology Investment Roadmap8 has identified carbon sequestration in agricultural land as a key priority for a low emissions future. Offsets created by soil carbon projects can provide a valuable additional revenue stream for farmers but are estimated to provide under 1% reduction in emissions across the Hawkesbury.
Kinesis’ technical analysis suggests that with AEMO’s predicted generation mix in 2050, the reduction opportunities can cumulatively achieve 88% reduction in emissions across Hawkesbury relative to the Reference Scenario in 2050 or 80% reduction relative to FY2016/2017 baseline. Net Zero Emissions can be achieved through carbon offsets.
Figure 26: Hawkesbury community emission reduction trajectory. The grey area shows modelled emissions each year following reductions from various strategies represented by the different colours.
HAWKESBURY COMMUNITY EMISSION REDUCTION TRAJECTORY
8 Australian Government, Technology Investment Roadmap, https://www.industry.gov.au/sites/default/files/September%202020/document/first-low-emissions-technology-statement-2020.pdf

DRAFT NET ZERO EMISSIONS + WATER EFFICIENCY STRATEGY | 32
Figu
re 2
7: E
stim
ated
GHG
em
issi
ons
redu
ctio
n po
tent
ial f
or H
awke
sbur
y LG
A at
205
0
HAW
KESB
URY
CO
MM
UNIT
Y EM
ISSI
ON
RED
UCTI
ON
AT
2050

DRAFT NET ZERO EMISSIONS + WATER EFFICIENCY STRATEGY | 33
Water Reduction Pathway AnalysisUnder the Reference Scenario, without any intervention, water use across the Hawkesbury LGA is expected to grow with new development. By 2050, water use is expected to be 55% higher than 2016/2017 levels amounting to an additional 4 gigalitres per year.
A range of water consumption reduction opportunities were tested to analyse to what degree end use efficiency and water reuse can move Hawkesbury towards a low water, drought resilient future (see Figure 28 and Figure 29). This analysis found:
• New development - improved performance standards for new residential buildings and new non-residential buildings is expected to reduce water consumption by 14%.
• Existing development - behavioural change including retrofits and refurbishments (water efficiency measures) is expected to reduce water use by 4%.
• Water reuse - for non-potable purposes in all new dwellings and industrial sites, which encompasses rainwater and recycled water is expected to reduce water demand by 6%.
• Additional greening – 5-10% increase in the canopy cover in the Centres, consistent with the targets set by NSW Government Architects Draft Greener Places Guidelines. It should be noted that canopy cover targets will vary across the LGA based on density. As the LGA develops, achieving this target would require existing canopy to be retained and expanded where possible, particularly in Council owned land, road reserves and existing developed areas. A high-level estimate suggests that the additional canopy cover could increase future water demands by 19%.
• Recycled water – required to meet this additional canopy cover and greening.
New building standards and delivering recycled water to service non-potable end uses such as irrigation, toilets and laundry will provide the largest reductions in potable water use. Combined, these strategies have the potential to reduce the reference water consumption by nearly 20%. These two strategies will increase the drought resilience ofHawkesbury’s community. Water efficient buildings sets up the community to practice water conservation and recycled water provides a reliable source of water that can be used for non-potable purposes during times of
Figure 28: Hawkesbury water trajectory. The grey area shows modelled water use each year following reductions from various strategies represented by the different colours.
Figure 29: Estimated water reduction potential for Hawkesbury Community at 2050
HAWKESBURY COMMUNITY WATER REDUCTION AT 2050
HAWKESBURY COMMUNITY WATER USE TRAJECTORY

DRAFT NET ZERO EMISSIONS + WATER EFFICIENCY STRATEGY | 34
Developing science-based targets
The Hawkesbury’s emissions target must be science based and respond to the global climate challenge we face. Under the Paris Agreement, most countries, including Australia, have agreed to limit warming at 1.5°C or “well below” 2°C above pre-industrial levels. The implications of this agreement in terms of global emissions targets have been defined by the International Panel on Climate Change in its Special Report (SR) 15.
In 2018, the International Panel on Climate Change Special Report (SR) 15, also known as “Global Warming of 1.5 Degree” report, released updated emission reduction pathways required to limit warming to 1.5°C. This report outlines several key findings for policy makers:
• Limiting global warming requires limiting total cumulative global human-induced emissions since the preindustrial period, that is, staying within a total carbon budget. Globally, the carbon budget is being depleted at a rate of 42 Gt CO2 per year.• Faster carbon reductions result in higher probability of limiting global heating to 1.5°C. To have a 66% chance of staying below 1.5°C, the report estimates the remaining global carbon budget of 420 GtCO2 (or approximately 10 years of current emissions). To have a 50% chance of staying below 1.5°C, the report estimates approximately 14 years of current emissions.• Emissions globally will need to be reduced to zero by 2050 but if the date of reaching net-zero emissions is
brought forward to 2040 the chance of limiting warming to 1.5°C is considerably higher.
If the findings of this report are applied to cities or Council areas, this effectively means establishing a carbon budget of approximately 10 years of the 2017 emissions and working towards reducing these emissions as quickly as possible to stay within this carbon budget. As can be seen above, meeting the Paris Agreement objective ofkeeping global heating to below 1.5°C requires more than achieving just emissions reduction, it requires staying within the carbon budget. The faster the rate of emission reduction, the higher the chance of preventing further global warming.
Implications for the HawkesburyBased on the IPCC SR 15 findings, the Hawkesbury’s carbon budget to do its fair share towards limiting global warming to 1.5 degrees Celsius is equivalent to approximately 10 years of its 2017 emissions. That is, the Hawkesbury’s carbon budget is approximately 7,770 thousand tonnes CO2-e. Figure 6 shows the cumulative emissions that the Hawkesbury is expected to produce from 2017 to 2036 under the reference (BAU)scenario and the modelled emissions pathways through policy and technology interventions.
We are expected to overshoot the carbon budget at different times under the reference scenario and the modelled scenario. We will exceed the carbon budget at 2026 under the Reference scenario and at 2028 under the modelled pathway. This shows two things:
• A faster rate of emissions reductions increases our ability to meet the carbon budget and do our fair share towards limiting warming to 1.5 degrees Celsius. This in turn highlights the importance of Council led action in the short term.
• Even after pursuing the recommended strategies, the modelled scenario will overshoot the carbon budget at 2028 and exceed the carbon budget by 6,850 tonnes of CO2e by 2050. Meeting the carbon budget will require pursuing the identified strategies as well as carbon offsets.
Figure 30: The Hawkesbury’s cumulative emissions vs. the 1.5 degree Carbon Budget estimated as per the IPCC SR15 report.
THE HAWKESBURY CUMULATIVE EMISSIONS & CARBON BUDGET

DRAFT NET ZERO EMISSIONS + WATER EFFICIENCY STRATEGY | 35
Setting emissions and water targets
The progress along any roadmap to carbon emissions and water reductions must be measured and tracked against an overarching target.
The technical analysis outlined in this appendix highlighted potential reduction pathways. This analysis was presented and workshopped with Council staff and Councillors to:
• Identify high impact opportunities for the Hawkesbury• Identify feasible mechanisms within Council’s sphere of influence• Consider appropriate emissions and water use targets for the Hawkesbury.
From these discussions, the following targets can be considered for Council Operations and Community:
Council Operations• Net Zero Emissions by 2030 or earlier• No net increase in potable water use (Sydney Water Mains)• All non-potable water demand to be serviced using recycled water
The Community• 25% reduction in emissions relative to FY2016/2017 baseline by 2028 or sooner• 60% reduction in emissions relative to FY2016/2017 baseline by 2036 or sooner• Net Zero Emissions by 2050 or sooner through strategies and carbon offsets• No net increase in water use relative to FY2016/2017 baseline by 2028• Under 5% increase in water use relative to FY2016/2017 baseline by 2036• Under 25% increase in water use relative to FY2016/2017 baseline by 2050
These aspirational targets are achievable by the Hawkesbury given the following:
1. The discussions with Councillors and the Community members suggests an appetite for increased sustainability in the community.2. Council’s continued leadership in sustainable operations can drive a targeted approach towards increased sustainability in the community.3. The analysis indicates that interventions at the federal and state level will drive significant emissions reduction in the Hawkesbury.

DRAFT NET ZERO EMISSIONS + WATER EFFICIENCY STRATEGY | 36
Appendix C - Monitoring PerformanceWhile the sustainability and infrastructure strategies outlined in this report are designed with resilience and adaptation in mind, the expected outcomes will vary through changes in a number of factors including dwelling, population and job growth projections, federal, state and regional changes in electricity infrastructure and market responses from utility providers including Endeavour Energy (recently trialling a large scale battery in Western Sydney).
As a result, it will be important for Council to identify performance metrics, relevant targets and monitor both the community’s response to these targets, as well as the performance of Council’s programs on the ground.
To enable Council to respond to this data and adapt through the planning and implementation phases of the strategy, we recommend the establishment of a monitoring platform to help Council capture this data and track the impact of the its actions. This will enable Council to respond to this data and adapt through the planning and implementation phases of the strategy. Any monitoring platform should also enable Council to report as per standard frameworks including the Global Protocol for Community-Scale Greenhouse Gas Emission Inventories and Climate Active for Council’s operational emissions. The frequency of reporting would depend on the need to report following successful programs/ actions and resourcing available.
In addition, while this report focuses on energy and water performance outcomes, broader social and economic benefits could be tracked in order to understand and validate the broader benefits of environmental performance outcomes, including car ownership, travel patterns and pedestrian activity.
Based on the outcomes outlined in this report, the following key metrics have been identified for tracking and monitoring by Council (see Table right). These metrics provide the key indicators for whether or not the recommendations in this report are being delivered and the expected outcomes are being achieved.Further refinement of these metrics should be determined as policies and programs are established.
DRAFT METRICS

DRAFT NET ZERO EMISSIONS + WATER EFFICIENCY STRATEGY | 37
Met
hodo
logy
and
Dat
a Th
e da
ta p
rese
nted
in th
is re
port
is th
e be
st a
vaila
ble
data
from
util
ity p
rovi
ders
, gov
ernm
ent a
genc
ies,
inst
itute
s an
d C
ounc
il. W
here
app
ropr
iate
and
fea-
sibl
e, h
igh-
leve
l dat
aset
s (e
.g. w
aste
gen
erat
ion)
hav
e be
en b
roke
n do
wn
(dis
aggr
egat
ed)
to a
fine
r gra
in w
ith re
spec
t to
area
, sec
tor a
nd e
nd u
se b
ased
on
exi
stin
g la
nd u
se a
nd ty
pica
l hou
seho
ld a
nd n
on-r
esid
entia
l con
sum
ptio
n. T
able
bel
ow o
utlin
es th
e da
ta s
ets
anal
ysed
, the
ir so
urce
and
any
est
imat
ion
and/
or d
isag
greg
atio
n th
at w
as c
arrie
d ou
t.

DRAFT NET ZERO EMISSIONS + WATER EFFICIENCY STRATEGY | 38
MO
DEL
LIN
G A
SSUM
PTIO
NS
USED
IN T
HE
ANA
LYSI
S
The
assu
mpt
ions
and
ass
ertio
ns b
ehin
d th
e m
odel
led
oppo
rtun
ities
and
inte
rven
tions
hav
e be
en d
raw
n fr
om v
ario
us p
ublis
hed
stud
ies
or h
ave
been
test
-ed
by
and
deve
lope
d in
con
sulta
tion
with
oth
er g
over
nmen
t clie
nts,
incl
udin
g th
e G
reat
er S
ydne
y C
omm
issi
on. A
ssum
ptio
ns a
re o
utlin
ed b
elow
.

DRAFT NET ZERO EMISSIONS + WATER EFFICIENCY STRATEGY | 39

DRAFT NET ZERO EMISSIONS + WATER EFFICIENCY STRATEGY | 40
Hawkesbury City Council 366 George Street, (PO BOX 146) Windsor NSW 2756 (02) 4560 4444 | (02) 4587 7740 | DX 8601 WINDSOR [email protected]


