127
Attachment D Wetland Mitigation Plan Cost Effective / Incremental Cost Analysis
| Date post: | 09-Sep-2018 |
| Category: |
Documents |
| Upload: | duongthien |
| View: | 214 times |
| Download: | 0 times |

Attachment D
Wetland Mitigation Plan
Cost Effective / Incremental Cost Analysis

HUNTING BAYOU FLOOD RISK MANAGEMENT, HARRIS COUNTY, TEXAS
DRAFT GENERAL REEVALUATION REPORT AND INTEGRATED
ENVIRONMENTAL ASSESSMENT
ATTACHMENT D WETLAND MITIGATION PLAN AND COST
EFFECTIVENESS/INCREMENTAL COST ANALYIS
June 2014
HARRIS COUNTY FLOOD CONTROL DISTRICT
Prepared By:
AECOM TECHNICAL SERVICES, INC.
Contents
1.0 BACKGROUND ..............................................................................................................................1-1 2.0 EXISTING ECOLOGICAL RESOURCES AND BASELINE HABITAT ASSESSMENT.....2-1
2.1 General Methodology ..............................................................................................................2-4 2.2 Habitat Assessment Data Collection and Modeling ................................................................2-5 2.3 Baseline Assessment Results ...................................................................................................2-7
3.0 PROJECT IMPACT ANALYSIS BACKGROUND ....................................................................3-1 3.1 Period of Analysis Timeframe.................................................................................................3-1
4.0 WITHOUT PROJECT IMPACT ANALYSIS..............................................................................4-1 4.1 Without Project Conditions – General Assumptions ...............................................................4-1
4.1.1 Offline Detention Tract ..............................................................................................4-1 4.1.2 Channel Area ..............................................................................................................4-1 4.1.3 Disposal Site 4 ............................................................................................................4-2
4.2 Without Project Variable Change Assumptions ......................................................................4-2 4.2.1 Forested Wetland Model Variable Changes ...............................................................4-3 4.2.2 Emergent Wetland Model Variable Changes .............................................................4-6
4.3 Without Project Calculation Methodology ..............................................................................4-7 4.4 Without Project Results ...........................................................................................................4-7
5.0 WITH PROJECT IMPACT ANALYSIS ......................................................................................5-1 5.1 With Project Impact Descriptions and Assumptions ...............................................................5-1 5.2 Project Component Impacts.....................................................................................................5-1
5.2.1 Offline Detention Tract ..............................................................................................5-1 5.2.2 Channel .......................................................................................................................5-1 5.2.3 Disposal Site Impacts .................................................................................................5-2
5.3 With Project Variable Change Assumptions ...........................................................................5-3 5.4 With Project Calculation Methodology ...................................................................................5-3 5.5 With Project Results ................................................................................................................5-3
6.0 CONSIDERATION OF CLIMATE CHANGE ............................................................................6-1 7.0 DETERMINATION OF SIGNIFICANT NET LOSSES - NET PROJECT IMPACT ON
WETLANDS.....................................................................................................................................7-1 8.0 MITIGATION PLANNING OBJECTIVES .................................................................................8-1 9.0 MITIGATION REQUIREMENTS ANALYSIS ...........................................................................9-1
9.1 Units of Measurement..............................................................................................................9-1 9.2 Identification, General Design and Methodology of Mitigation Strategies.............................9-1
9.2.1 Onsite Wetland Creation.............................................................................................9-2 9.2.2 GBWMB Credits ........................................................................................................9-7
9.3 Site-Specific Considerations and Assessment of Mitigation Strategies ..................................9-8 9.3.1 H110-00-00/Hunting Bayou Confluence Forested Wetland Creation........................9-8 9.3.2 Offline Detention Tract Forested Wetland Creation.................................................9-10 9.3.3 Offline Detention Tract Emergent Wetland Creation...............................................9-12 9.3.4 GBWMB Credits ...................................................................................................... 9-13
10.0 COST EFFECTIVENESS/INCREMENTAL COST ANALYSIS.............................................10-1 10.1 Methodology.......................................................................................................................... 10-1
10.1.1 Cost Estimation Methodology ..................................................................................10-1 10.1.2 CE/ICA Methodology...............................................................................................10-4
10.2 Definition and Cost Estimation of Mitigation Alternative Plan Increments..........................10-5 10.2.1 Alternative 1 – H110-00-00/Hunting Bayou Confluence and Offline Forested
Wetland Creation plus Offline Emergent Wetland Creation, equal to 1.269wet AAHUs ..................................................................................................................... 10-6
DRAFT Attachment D – Wetland Mitigation Plan and CE/ICA iiHunting Bayou Flood Risk Management Project

10.2.2 Alternative 2 – Offline Forested Wetland Creation plus Offline Emergent Wetland Creation, equal to 1.269 AAHUs ...............................................................10-8
10.2.3 Alternative 3 – GBWMB Subdivision B Forested and Emergent Wetland Credits, equal to 1.269 AAHUs................................................................................10-9
10.2.4 Alternative 4 – 2.00 acres total of H110/Hunting Bayou Confluence and Offline Forested Wetland Creation plus 2.37 acres of Offline Emergent Wetland Creation, equal to 2.63 AAHUs..............................................................................10-10
10.2.5 Alternative 5 – 2.00 Acres of Offline Forested Wetland Creation, plus 2.37 Acre of Offline Emergent Wetland Creation, equal to 2.77 AAHUs .....................10-12
10.2.6 Alternative 6 – 2.00 Acres of Forested and 2.37 Acres of Emergent Wetland Credits in GBWMB Subdivision B, Equal to 2.77 AAHUs ...................................10-13
10.2.7 Summary of Alternatives for Evaluation in the CE/ICA........................................10-15 10.3 Consideration of Risk in Mitigation Alternatives................................................................10-15
10.3.1 Plant Establishment ................................................................................................10-15 10.3.2 Hydrology...............................................................................................................10-16 10.3.3 Adequate Soil Conditions ....................................................................................... 10-17
10.4 Display of Incremental Costs – CE/ICA Results.................................................................10-18 11.0 MITIGATION PLAN FOR THE TSP.........................................................................................11-1 12.0 REFERENCES...............................................................................................................................12-1
Tables
Table 1: Existing Ecological Resources.....................................................................................................2-1 Table 2: Baseline Habitat Assessment Results Summary..........................................................................2-2 Table 3: Forested and Scrub-Shrub Wetland Models Habitat Patch Scores ..............................................2-5 Table 4: Emergent Wetland Model Habitat Patch Scores..........................................................................2-6 Table 5: Forested Wetland Model Variable Changes ................................................................................4-5 Table 6: Emergent Wetland Model Variable Changes ..............................................................................4-7 Table 7: Without Project Offline Detention Tract Patches Habitat Units Results .....................................4-9 Table 8: Without Project Channel Patches Habitat Units Results .............................................................4-9 Table 8 (continued): Without Project Channel Patches Habitat Units Results (continued).....................4-10 Table 9: Without Project Disposal Site Habitat Units Results.................................................................4-10 Table 10: Without Project Average Annual Habitat Units by TSP Component and Cover Type ...........4-11 Table 11: With Project Offline Detention Tract Patches Habitat Units Results ........................................5-4 Table 12: With Project Channel Patches Habitat Units Results ................................................................5-4 Table 12 (continued): With Project Channel Patches Habitat Units Results (continued)..........................5-5 Table 13: With Project Disposal Patches Habitat Units Results................................................................5-5 Table 14: With Project Average Annual Habitat Units by TSP Component and Cover Type ..................5-6 Table 15: Summary of Average Annual Habitat Units and Acres of Wetlands Impacted by TSP............7-1 Table 16: Water Oak (Quercus nigra) Growth Rates.................................................................................9-3 Table 17: Forested Wetland Creation Assumed Habitat Model Parameters..............................................9-5 Table 18: Emergent Wetland Creation Assumed Habitat Model Parameters ............................................9-7 Table 19: H110-00-00/Hunting Bayou Confluence Forested Wetland Creation Habitat Modeling Results,
AAHUs Produced by the Site ..................................................................................................9-10 Table 20: Offline Detention Tract Forested Wetland Creation Habitat Modeling Results, Project-Only or
Project Plus Disposal HSI Impacts Mitigation ........................................................................9-11 Table 21: Offline Detention Tract Emergent Wetland Creation Habitat Modeling Results, Project-Only
and Project Plus Disposal HSI Impacts Mitigation .................................................................9-13 Table 22: GBWMB Forested Wetland Credits Habitat Modeling Results, Project-Only or Project Plus
Disposal HSI Impacts Mitigation ............................................................................................9-14
DRAFT Attachment D – Wetland Mitigation Plan and CE/ICA iiiHunting Bayou Flood Risk Management Project

Table 23: GBWMB Emergent Wetland Credits Habitat Modeling Results, Project-Only and Project Plus Disposal HSI Impacts Mitigation ............................................................................................9-16
Table 24: Forested Wetland Creation Costs ...........................................................................................10-3 Table 25: Emergent Wetland Creation Costs...........................................................................................10-4 Table 26: Summary of Mitigation Results for Alternative 1 ...................................................................10-7 Table 27: Cost Estimate for Alternative 1 ..............................................................................................10-8 Table 28: Summary of Mitigation Results for Alternative 2 ..................................................................10-9 Table 29: Cost Estimate for Alternative 2 ..............................................................................................10-9 Table 30: Summary of Mitigation Results for Alternative 3 ................................................................10-10 Table 31: Cost Estimate for Alternative 3 ............................................................................................10-10 Table 32: Summary of Mitigation Results for Alternative 4 ................................................................10-11 Table 33: Cost Estimate for Alternative 4 ............................................................................................10-12 Table 34: Summary of Mitigation Results for Alternative 5 ................................................................10-13 Table 35: Cost Estimate for Alternative 5 ............................................................................................10-13 Table 36: Summary of Mitigation Results for Alternative 6 ................................................................10-14 Table 37: Cost Estimate for Alternative 6 ............................................................................................10-14 Table 38: Average Cost per AAHU for All Alternatives......................................................................10-21
Figures
Figure 1: IWR-Plan Cost vs. Output Graph for All Alternatives..........................................................10-18Figure 2: IWR-Plan Cost vs. Output Graph for Cost-Effective Alternatives........................................10-20 Figure 3: IWR-Plan ICA Graph of “Best Buy” Alternatives................................................................10-20
Exhibits
Exhibit 1: Vicinity MapExhibit 2: Offline Detention Tract and Channel Area WetlandsExhibit 3: Disposal Site 4 WetlandsExhibit 4: Disposal Site 5a wetlandsExhibit 5: Disposal Site 6 WetlandsExhibit 6: Alternative 1 – H110/Hunting Bayou Confluence and Offline Forested Wetland Creation plus
Offline Emergent Wetland Creation, equal to 0.699 AAHUExhibit 7: Alternative 2 – Offline Forested Wetland Creation plus Offline Emergent Wetland Creation,
equal to 1.27 AAHUsExhibit 8: GBWMB Subdivision B – Location of Alternatives 3 and 6, Forested and Emergent Wetland
Credits, equal to 1.27 AAHUs and 2.77 AAHUsExhibit 9: Alternative 4 – 2.00 acres total of H110/Hunting Bayou Confluence and Offline Forested
Wetland Creation plus 2.37 acres of Offline Emergent Wetland Creation, equal to 2.63 AAHUs
Exhibit 10: Alternative 5 – 2.00 Acres of Offline Forested Wetland Creation, plus 2.37 Acre of Offline Emergent Wetland Creation, equal to 2.77 AAHUs
DRAFT Attachment D – Wetland Mitigation Plan and CE/ICA ivHunting Bayou Flood Risk Management Project

1.0 BACKGROUND
The Hunting Bayou Federal Flood Risk Management Project is a general re-evaluation of the Hunting Bayou element of the project for flood control, Buffalo Bayou and Tributaries, Texas. The general re-evaluation was initiated by Harris County Flood Control (HCFCD), acting as the non-Federal Sponsor (NFS), in partnership with the U.S. Army Corps of Engineers (USACE) pursuant to Section 211(f) of the Water Resources Development Act of 1996. The study has resulted in a Tentatively Selected Plan [TSP] (shown on Exhibit 1) consisting of 3.8 miles ofchannel widening and deepening to provide a trapezoidal, grass lined channel between US 59 and Wayside Drive, including a 75-acre offline detention basin north of the Hunting Bayou east of Homestead Road. The project also requires various disposal tracts to accommodate excavated soil placement. This includes Disposal Sites 4, 5a and 6 (shown on Exhibit 1). These disposal sites are not anticipated to be used, but are analyzed in this mitigation plan in case it is necessary to use them. Instead, soil is anticipated to be disposed of within the community for urban development projects such as construction, residential subdivisions, and business parks. Records of Environmental Consideration (REC) will be prepared to document evaluation of potential environmental impacts to alternate disposal sites. The disposal tracts also include anapproximately 20-acre site on a tract adjacent to the proposed 75-acre offline detention tract (shown on Exhibit 1) owned by Union Pacific Railroad (UPRR) where disposal fill will be used to elevate the tract for future use by UPRR. The natural environment within the recommended project boundaries generally consists of fragmented, undeveloped land surrounded by urban residential and industrial development.
The USACE planning regulation applicable to feasibility studies and general reevaluations, Engineering Regulation (ER) 1105-2-100, Planning Guidance Notebook (PGN) requires project-caused adverse impacts to ecological resources be avoided or minimized to the extent practicable, and that remaining, unavoidable impacts be compensated to the extent justified through mitigation (USACE 2000). Mitigation planning regulations require impacts and mitigation for those impacts to be quantified. Habitat units calculated using habitat evaluation procedures or similar methodology are one acceptable way to measure impacts and mitigation planning outputs. Habitat assessments were performed for the undeveloped portions of the project areas, and the disposal areas, from July to August 2009, to evaluate the habitat quality. These assessments provide the baseline quality indices for existing conditions used to calculate habitat units (HU) for these project areas, employing Habitat Suitability Index (HSI) models.
These assessments are documented in the report titled: Habitat Assessment of the Existing Conditions of Twenty-five Wetlands Within the Hunting Bayou Channel Right-of-Way, Inline Detention Tract, Offline Detention Tract, and Soil Disposal Sites dated September 2009. Thisstudy documents field data collection and habitat modeling to assess habitat units (HU) for wetland habitats. Planning and project configuration changes since 2009 have resulted in a reduction of the number of wetlands evaluated in the study, and this Mitigation Planning Report will focus on the forested, scrub-shrub, and emergent wetlands impacted by the current project.Fringe wetlands and mitigation for the function and services of the channel will be discussed in the Hunting Bayou Federal Flood Risk Management Draft General Reevaluation Report and Integrated Environmental Assessment (GRR/EA).
DRAFT Attachment D – Wetland Mitigation Plan and CE/ICA 1-1Hunting Bayou Flood Risk Management Project

USACE planning regulations also require that project impacts to significant resources be forecasted, and compared and contrasted with the condition of these resources without the project over the project period of analysis. The period of analysis is the time required for implementation of a project plus 50 years for this type of flood damage reduction project. The existing condition HUs were used to forecast the without-project condition in terms of HUs between the existing year, and the end of the project period of analysis. The existing year is the year representative of current conditions. The models used for these habitat assessments and forecasts were also used to estimate the impacts of the TSP to forecast with-project conditions within this timeframe, and compare them to without-project conditions to determine the mitigation requirements. This was accomplished during an analysis of project impacts to habitat value.
This report documents a summary of the baseline habitat assessments, and the modeling performed to forecast the without-project conditions and the with-project impacts, in terms of habitat units, during the period of analysis for the wetlands in the project areas.
DRAFT Attachment D – Wetland Mitigation Plan and CE/ICA 1-2Hunting Bayou Flood Risk Management Project
2.0 EXISTING ECOLOGICAL RESOURCES AND BASELINE HABITAT ASSESSMENT
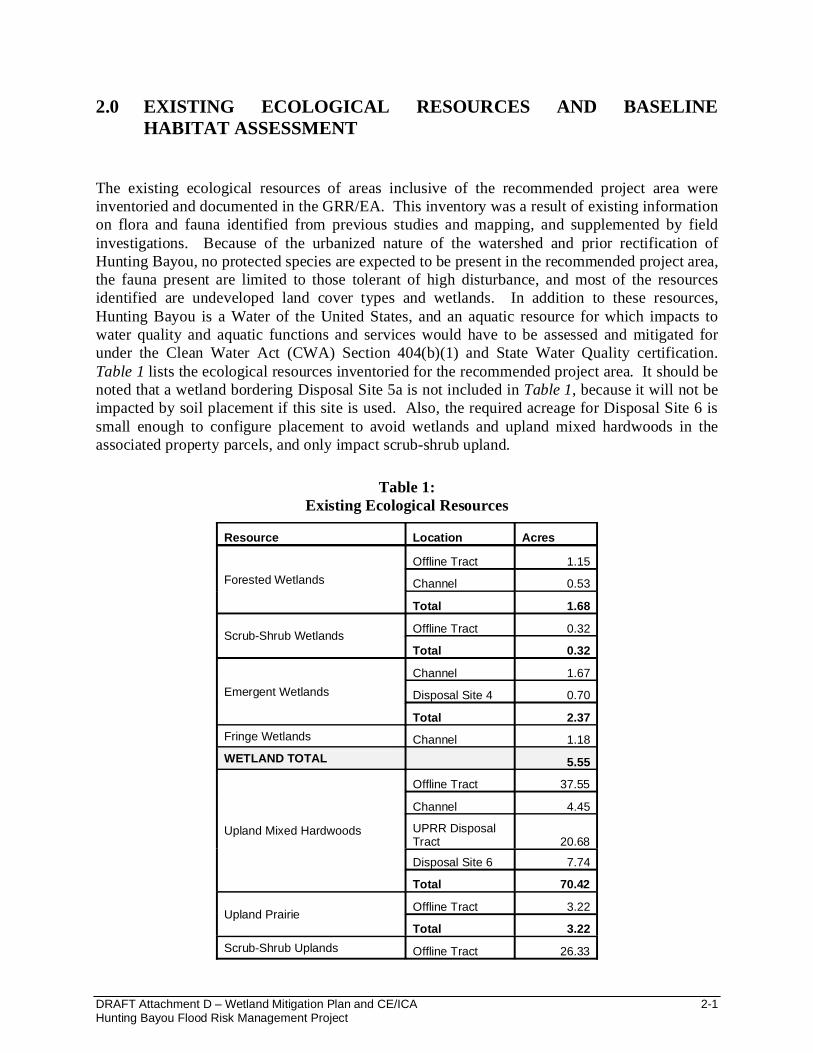
The existing ecological resources of areas inclusive of the recommended project area were inventoried and documented in the GRR/EA. This inventory was a result of existing information on flora and fauna identified from previous studies and mapping, and supplemented by field investigations. Because of the urbanized nature of the watershed and prior rectification of Hunting Bayou, no protected species are expected to be present in the recommended project area, the fauna present are limited to those tolerant of high disturbance, and most of the resources identified are undeveloped land cover types and wetlands. In addition to these resources, Hunting Bayou is a Water of the United States, and an aquatic resource for which impacts to water quality and aquatic functions and services would have to be assessed and mitigated for under the Clean Water Act (CWA) Section 404(b)(1) and State Water Quality certification. Table 1 lists the ecological resources inventoried for the recommended project area. It should be noted that a wetland bordering Disposal Site 5a is not included in Table 1, because it will not be impacted by soil placement if this site is used. Also, the required acreage for Disposal Site 6 is small enough to configure placement to avoid wetlands and upland mixed hardwoods in the associated property parcels, and only impact scrub-shrub upland.
Table 1:Existing Ecological Resources
Resource Location Acres
Forested WetlandsOffline Tract 1.15
Channel 0.53
Total 1.68
Scrub-Shrub Wetlands Offline Tract 0.32
Total 0.32
Emergent WetlandsChannel 1.67
Disposal Site 4 0.70
Total 2.37Fringe Wetlands Channel 1.18WETLAND TOTAL 5.55
Upland Mixed Hardwoods
Offline Tract 37.55
Channel 4.45
UPRR Disposal Tract 20.68
Disposal Site 6 7.74
Total 70.42
Upland Prairie Offline Tract 3.22
Total 3.22Scrub-Shrub Uplands Offline Tract 26.33
DRAFT Attachment D – Wetland Mitigation Plan and CE/ICA 2-1Hunting Bayou Flood Risk Management Project

Resource Location Acres
Channel 3.45
Disposal Site 6 5.20
Total 34.97NONWETLAND TOTAL 108.61GRAND TOTAL 114.16
Note: Mowed/disturbed vegetation within the study area is not included in this table and primarily consists of mowed and maintained grasses along the Hunting Bayou channel.
ER 1105-2-100 and the Water Resources Council Principles and Guidelines (P&G) describe the procedures for determining the significance of resources that will be impacted by a project alternative. The Institute for Water Resources’ (IWR) Publication IWR Report 97-R-4, Resource Significance Protocol For Environmental Project Planning, provides more specific guidance for determining significance. Under these criteria, the forested, scrub-shrub, and emergent wetlands have institutional significance from a national perspective due to the many laws and statutes that protect wetland resources, including CWA Section 404(b)(1) and Executive Order 11990, Protection of Wetlands, and have technical significance due to the number of research papers that document their importance to water quality, biodiversity and ecological productivity.
Baseline habitat assessments were performed for the undeveloped portions of the recommended project and for wetlands within disposal site areas. Table 2 summarizes the HUs provided by the different wetland habitat patches. As noted earlier, the identified disposal sites are not planned to be used; however, if it is deemed necessary to use them, habitat modeling has been performed for the wetlands and will be considered in the mitigation planning effort.
Table 2:Baseline Habitat Assessment Results Summary
Habitat Type Project Location AcresHabitat Units
Forested Wetland
Offline Tract 1.154 0.335
Channel 0.528 0.165
Total 1.682 0.500
Scrub-Shrub WetlandsOffline Tract 0.318 0.000
Total 0.318 0.000
Sum of Forested + Scrub-shrub Wetlands
PROJECT 2.001 0.500
DISPOSAL 0 0
PROJECT & DISPOSAL 2.001 0.500
Emergent Wetland
Channel 1.672 0.566
Disposal Site 4 0.700 0.049
Total 2.372 0.615
WETLANDS TOTAL
PROJECT 3.672 1.067
DISPOSAL 0.700 0.049
PROJECT & DISPOSAL 4.373 1.116Note: Values in this table may differ by thousandths with values in previous habitat assessment reports due to rounding.
DRAFT Attachment D – Wetland Mitigation Plan and CE/ICA 2-2Hunting Bayou Flood Risk Management Project
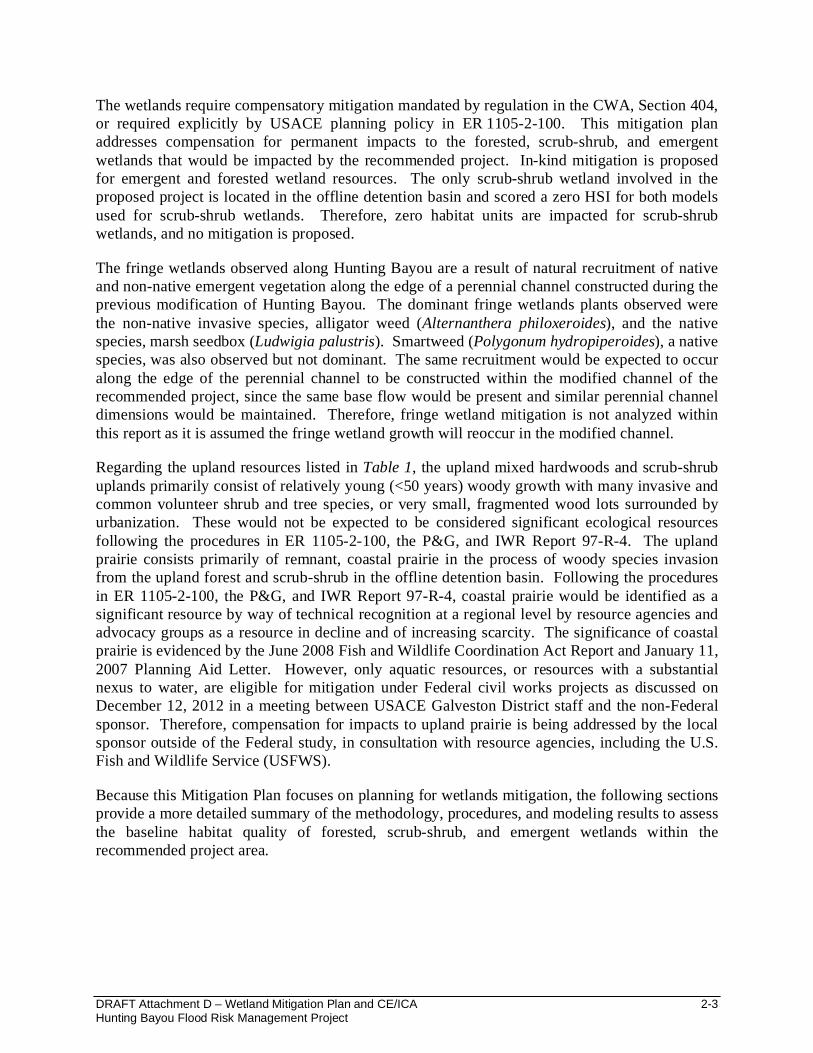
The wetlands require compensatory mitigation mandated by regulation in the CWA, Section 404, or required explicitly by USACE planning policy in ER 1105-2-100. This mitigation plan addresses compensation for permanent impacts to the forested, scrub-shrub, and emergent wetlands that would be impacted by the recommended project. In-kind mitigation is proposed for emergent and forested wetland resources. The only scrub-shrub wetland involved in the proposed project is located in the offline detention basin and scored a zero HSI for both models used for scrub-shrub wetlands. Therefore, zero habitat units are impacted for scrub-shrub wetlands, and no mitigation is proposed.
The fringe wetlands observed along Hunting Bayou are a result of natural recruitment of native and non-native emergent vegetation along the edge of a perennial channel constructed during the previous modification of Hunting Bayou. The dominant fringe wetlands plants observed were the non-native invasive species, alligator weed (Alternanthera philoxeroides), and the nativespecies, marsh seedbox (Ludwigia palustris). Smartweed (Polygonum hydropiperoides), a native species, was also observed but not dominant. The same recruitment would be expected to occur along the edge of the perennial channel to be constructed within the modified channel of the recommended project, since the same base flow would be present and similar perennial channel dimensions would be maintained. Therefore, fringe wetland mitigation is not analyzed within this report as it is assumed the fringe wetland growth will reoccur in the modified channel.
Regarding the upland resources listed in Table 1, the upland mixed hardwoods and scrub-shrub uplands primarily consist of relatively young (<50 years) woody growth with many invasive and common volunteer shrub and tree species, or very small, fragmented wood lots surrounded by urbanization. These would not be expected to be considered significant ecological resources following the procedures in ER 1105-2-100, the P&G, and IWR Report 97-R-4. The upland prairie consists primarily of remnant, coastal prairie in the process of woody species invasion from the upland forest and scrub-shrub in the offline detention basin. Following the procedures in ER 1105-2-100, the P&G, and IWR Report 97-R-4, coastal prairie would be identified as a significant resource by way of technical recognition at a regional level by resource agencies and advocacy groups as a resource in decline and of increasing scarcity. The significance of coastal prairie is evidenced by the June 2008 Fish and Wildlife Coordination Act Report and January 11, 2007 Planning Aid Letter. However, only aquatic resources, or resources with a substantial nexus to water, are eligible for mitigation under Federal civil works projects as discussed on December 12, 2012 in a meeting between USACE Galveston District staff and the non-Federalsponsor. Therefore, compensation for impacts to upland prairie is being addressed by the local sponsor outside of the Federal study, in consultation with resource agencies, including the U.S. Fish and Wildlife Service (USFWS).
Because this Mitigation Plan focuses on planning for wetlands mitigation, the following sections provide a more detailed summary of the methodology, procedures, and modeling results to assess the baseline habitat quality of forested, scrub-shrub, and emergent wetlands within the recommended project area.
DRAFT Attachment D – Wetland Mitigation Plan and CE/ICA 2-3Hunting Bayou Flood Risk Management Project

2.1 General Methodology The selection of the HSI models was conducted by the NFS with consideration of commentsreceived from resource agencies on models being proposed and aspects of model selection to consider. The NFS coordinated model selection with the USACE and resource agencies from the start of functional assessment modeling for the project in 2007 prior to 2008 USACE policy on ecosystem output model certification, until final plan selection and mitigation functional assessment modeling was conducted in 2012. The resource agencies included Texas Parks and Wildlife Department (TPWD), Texas Commission on Environmental Quality (TCEQ), U.S. Environmental Protection Agency (EPA) Region 6, and USFWS. The NFS consulted the USArmy Engineer Research and Development Center (ERDC) on an initial suite of HSI-based models which were combined with aspects of the Wildlife Habitat Appraisal Procedures (WHAP) regarding landscape edge, connectivity, and other related factors. Initial coordination of these proposed models was held in September 2007, with the models revised following feedback received from resource agencies. The NFS solicited comments on the revisions in November 2007. Data collection for these models proceeded in 2008.
However, in August 13, 2008, USACE issued their policy memo “Policy Guidance on Certification on Ecosystem Output Models”. This policy required that only standard models already certified by the USACE Ecosystem Planning Center of Excellence (PCX) be used, or that models proposed for use undergo the model certification process outline by the USACE. Because of the study schedule and implementation timeline, and the extensive process and anticipated time involved in model certification, the NFS elected to use HSI models in their standard form, to comply with this policy, and maintain the study schedule. The NFS coordinated with the resource agencies again in January 2009 on a standard set of HSI models and solicited feedback. Comments were received from TPWD and TCEQ. Comments were primarily related to patch size and recommended model adjustments, number of species, minimal scoring for some species, mitigation planting and monitoring recommendations. The NFS considered the comments within the constraints of USACE 2008 policy, the use of standard HSI procedures and methodology, and the limited availability of standard HSI models for the habitattypes and related fauna for the wetland types being impacted. Those recommendations that could be implemented without requiring modification of the standard HSI methodology were considered.
The feedback was used in the selection of the final HSI species models to use. The NFS reviewed the available species, the described habitat type and range, and minimum habitat size in the selection of the HSI models. These factors constrained the available species models that would satisfy the applicability requirements of the model for the types and size of wetlands being impacted. The wetland types and models selected are discussed in the following paragraphs,with detail on the applicability requirements that constrain the choice of suitable models for the wetlands that would be impacted.
DRAFT Attachment D – Wetland Mitigation Plan and CE/ICA 2-4Hunting Bayou Flood Risk Management Project

The wetland types were identified as result of the site visits, aerial review, and geospatial analyses used to define vegetative cover in the vicinity of the project into general classes, and were confirmed by field investigations conducted in support of habitat modeling. The wetlands addressed in the mitigation planning are all palustrine wetlands, as they are inland, non-tidal and not riverine in nature. The wildlife habitat models used in the baseline habitat assessments were published USFWS HSI models which employ the Habitat Evaluation Procedure (HEP). The models were used to provide HSI indices for purposes of measuring quality with models meeting the USACE certification requirements. The model methodology was taken from USFWS HSI models selected by HCFCD for species indicative of local wetland habitat types. This methodology involved the use of the following models for the indicated wetland cover types:
Palustrine Forested Wetland model – A composite HSI consisting of an HSI for the Barred Owl (Strix varia), and an HSI for the Mink (Mustela vison).
Palustrine Emergent Wetland model – A composite HSI consisting of an HSI for the Swamp Rabbit (Sylvilagus aquaticus) and HSI for the Mink.
Palustrine Scrub-Shrub Wetland model – A composite HSI consisting of an HSI for the Snapping Turtle (Chelydra serpentina), and an HSI for the Mink.
The species were selected considering the cover type for which the models are applicable, and the range described in the model literature. For example, Swamp Rabbit lists one of the applicable cover types as herbaceous wetlands, which the palustrine emergent wetlands of the project area are herbaceous emergent wetlands. The range is shown in a distribution map that covers the Gulf Coast region including the Houston area. In this manner, species were selected to cover the three types of wetlands impacted by the TSP. A full description of the models used for these habitat assessments are provided in the USFWS model literature listed in the references for this report (USFWS 1985, 1986, 1987a, and 1987b).
2.2 Habitat Assessment Data Collection and ModelingBaseline habitat assessments were performed for the wetland habitat patches listed in Tables 3 and 4. The Patch ID listed in Tables 3 and 4 is a combination of the numerical ID used for the patch in the individual habitat assessment reports discussed in Section 1.0, and a preceding letter designator for its location as follows: C = channel; D = disposal site; I = inline detention tract(former project feature since removed from project); O = offline detention tract. This ID designation is used in this report to provide the same numerical reference to patches used in the previous reports, with a letter designator added because of numerical duplicates between reports.Please note that the inline detention feature is no longer a part of the current project, but wetlands in the reach of this former feature are still encompassed by the required channel right-of-way (ROW) through this reach. The original Patch ID with the letter designator “I” has been retained for continuity with previous reports prior to this project change.
Table 3:Forested and Scrub-Shrub Wetland Models Habitat Patch Scores
Patch Information HSI Score* Habitat
DRAFT Attachment D – Wetland Mitigation Plan and CE/ICA 2-5Hunting Bayou Flood Risk Management Project

ID Cover Type AcresBarred Owl
Snapping Turtle Mink
Composite Avg.
Units
O-1 Forested Wetland 0.800 0.78 N/A 0 0.39 0.312O-2 Forested Wetland 0.354 0.13 N/A 0 0.07 0.023O-5 Scrub-shrub Wetland 0.318 N/A 0 0 0.00 0.000C-27 Forested Wetland 0.035 0.15 N/A 0 0.08 0.003I-21 Forested Wetland 0.493 0.14 N/A 0.52 0.33 0.163Total Project 2.001 0.500
Note: Values in this table may differ by thousandths with values in previous habitat assessment reports due to rounding.* HSI – Habitat Suitability Index
Table 4:Emergent Wetland Model Habitat Patch Scores
Patch Information HSI Score*Habitat UnitsID Cover Type Acres Mink Rabbit
Composite Avg.
C-26 Emergent Wetland 0.401 0.990 0.590 0.790 0.317I-9 Emergent Wetland 0.029 0.000 0.150 0.075 0.002I-14 Emergent Wetland 0.034 0.000 0.330 0.165 0.006
I-15 Emergent Wetland 0.021 0.000 0.330 0.165 0.003I-17 Emergent Wetland 0.360 0.000 0.640 0.320 0.115I-18 Emergent Wetland 0.026 0.000 0.460 0.230 0.006I-19 Emergent Wetland 0.751 0.000 0.310 0.155 0.116I-20 Emergent Wetland 0.049 0.020 0.000 0.010 0.0005
Project Subtotal 1.672 0.566D-1 Emergent Wetland 0.453 0.000 0.200 0.100 0.045D-2 Emergent Wetland 0.247 0.030 0.000 0.015 0.004Disposal Sites Subtotal 0.700 0.049
Total Project and Disposal 2.372 0.615Note: Values in this table may differ by thousandths with values in previous habitat assessment reports due to rounding.*HSI – Habitat Suitability Index
DRAFT Attachment D – Wetland Mitigation Plan and CE/ICA 2-6Hunting Bayou Flood Risk Management Project

The three wetland habitat patches in the offline detention tract are Patches O-1, O-2, and O-5,located north of IH 610 and east of Homestead Road in Harris County, Texas (Exhibit 2). Two are forested wetlands (O-1 and O-2), and one is a shrub-scrub wetland (O-5). The 12 wetland habitat patches in the channel modification component, and Disposal Site 4, are located in eastern Harris County, Texas (Exhibits 2 and 3). Several wetlands, identified in the Habitat Assessment of the Existing Conditions of Thirty-one Habitat Areas within the Hunting Bayou Inline Detention Basin, Channel, Vacant Lots, and Soil Disposal Sites, are being avoided due to project reconfiguration. This includes (as identified in the referenced report) Patch 8 located on the southern border of Disposal Site 5a (Exhibit 4), which was reconfigured to avoid this wetland, Patches D-3 through D-7 located in Disposal Site 6 (Exhibit 5), which has been reduced in size to avoid these wetlands, and Patches I-12 and I-16, which are located within the proposed channel maintenance ROW (thus avoiding excavation) [Exhibit 2]. Therefore, mitigation for these wetlands was not analyzed. Of the 12 wetland habitat patches that would be impacted by the channel component and disposal for the proposed project, 2 are forested wetlands, and 10 are emergent wetlands. These 12 wetland habitat patches include C-26, C-27, I-9, I-14, I-15, I-17, I-18, I-19, I-20, and I-21 located in the Channel Modification boundary (Exhibits 2 and 3); D-1and D-2 located in Disposal Site 4 (Exhibit 3). The field investigation of these wetlands for habitat model data collection began July 8, 2009 and concluded on August 19, 2009. The results of the habitat data collection and existing condition modeling are documented in the aforementioned report Habitat Assessment of the Existing Conditions of Twenty-five Wetlands Within the Hunting Bayou Channel Right-of-Way, Inline Detention Tract, Offline Detention Tract, and Soil Disposal Sites dated September 2009, hereafter referred to as the 2009 Habitat Assessment of Existing Conditions.
The data collected was compiled and calculated (totaled, averaged, etc.) as appropriate to provide input values for HSI variables in spreadsheets that implemented the model calculations described in the USFWS HSI model literature. These spreadsheets contained Visual Basic code and Excel formulas that performed calculations for HSI. The individual baseline reports listed in Section 1.0 include detailed information about data collection and variable calculation. To meet USACE mitigation habitat model requirements, HUs using the HSI score were calculated for each wetland patch.
2.3 Baseline Assessment Results Results of the habitat assessments are shown in Tables 3 and 4. Mink scores for the ForestedWetland and Scrub-shrub Models in offline Patches O-1 through O-5, and C-27 are zero due to the lack of standing water for greater than 3 consecutive months, a requisite for the model to score more than zero. The Snapping Turtle score for offline Patch O-5 is zero because the wetland lacks standing water year-round during a majority of years to be defined as permanently or semipermanently flooded, which is a requirement to apply the Snapping Turtle model. Since O-5 is the only Scrub-shrub wetland impacted by the project, and it scored zero for both of the models applied, no HUs were impacted. Therefore, no mitigation is proposed for Scrub-shrub wetland impacts.
DRAFT Attachment D – Wetland Mitigation Plan and CE/ICA 2-7Hunting Bayou Flood Risk Management Project

During review of the baseline data for use in the mitigation plan modeling, it was noted that transects to determine percent canopy cover of trees and shrubs within 100 m of the wetland edge (CANEDGE or SIV5) for the Mink model were limited to one side of the wetland for Patch C-26, lacking data for the other side. This omitted contribution to the percent edge cover of the treeless, mowed grass cover adjacent to the wetland on the side omitted, which would reflect 0 percent edge cover. This was corrected, and the HSI recalculated, slightly lowering the Mink score from 0.99 to 0.90 and the overall HSI score from 0.79 to 0.74 for this wetland. This was not an issue in any other wetland. Mink scores for I-9, I-14, I-15, I-17 through I-19, and D-1,using the Emergent Wetland Model were zero due to the lack of standing water. The Swamp Rabbit score for I-20 was zero because the average height of the herbaceous canopy is below the model threshold to result in any positive score.
Table 2 summarizes the baseline habitat units by cover type and project location. The baseline habitat assessments show that there are a total of 1.067 habitat units, provided by 3.672 acres of wetlands located within the project components. Within the disposal sites, a total of 0.049habitat units, are provided by 0.700 acres of wetlands located within the disposal sites. The totals for project wetlands and disposal site wetlands are 1.116 habitat units, from a total of 4.373acres of wetlands.
DRAFT Attachment D – Wetland Mitigation Plan and CE/ICA 2-8Hunting Bayou Flood Risk Management Project

3.0 PROJECT IMPACT ANALYSIS BACKGROUND
The project impact analysis involves forecasting the future habitat conditions in terms of HUs under “without project” and “with project” scenarios to determine the net impact of the project on habitat values. According to ER 1105-2-100, the impacts are evaluated over the period of analysis, which is the time required for implementation of a project plus 50 years, for a project of this type. The time required for implementation is the time construction of the project starts until it is completed and providing the intended benefits. The year when the implementation period is completed is defined as the base year, which is anticipated to be 2022 for this project. For this mitigation planning study, the period of analysis is from the existing year 2009 (when the baseline habitat assessments were performed), to 2072, which is 50 years after the base year2022.
3.1 Period of Analysis TimeframeConstruction of a smaller 20-acre interim basin began in the winter of 2008, but did not involve any of the basin wetland areas. The project construction schedule for the TSP was used to establish dates for project implementation. The construction of the remainder of the project is assumed to start in 2015, and is assumed to follow the 7-year phased construction schedule, resulting in a base year of 2022.
The project impact analysis forecasts future habitat conditions over the timeframe for analyzing project impacts (2009 to 2072 or, 63 years) in terms of average annual habitat units (AAHUs) and determines the net impact of the recommended project. This timeframe was chosen in accordance with the HEP methodology in USFWS Ecological Service Manual (ESM) 102, in order to capture impacts to wetland that occur during the construction period, before the TSP is complete. HUs were calculated for the habitat conditions within the recommended project areas without the recommended project constructed (without project condition), and for the habitat conditions within the recommended project areas with the recommended project constructed (with project). In accordance with the HEP methodology in USFWS ESM 102, the AAHUs were calculated using area-weighted average HSIs for each wetland cover type (forested wetland, emergent wetland etc.) for the available habitat at a given project component or site (e.g. offline detention) and the total area of the cover type at the site (USFWS 1980). The calculated HUs are annualized by summing cumulative HUs for all time intervals in the period of analysis and dividing the total by the number of years in the period of analysis, resulting in AAHUs. The cumulative HU term provides simplified integration of HSI scores over time, to provide time-weighting of habitat value. The period of analysis was divided into yearly time intervals between the existing year (2009), and the base year (2022), and into 10-year intervals between 2022 and the end of the period of analysis, 2072. The following equations were used to determine AAHUs (USFWS 1980).
63HUCumulative 21122211
12HAHAHAHA
TT
AnalysisofPeriodin YearsTotal
HUsCumulativeAAHUs
DRAFT Attachment D – Wetland Mitigation Plan and CE/ICA 3-1Hunting Bayou Flood Risk Management Project

where: T1 = First year of time intervalT2 = Second year of time intervalA1 = Habitat area of wetland cover type at site at T1A2 = Habitat area of wetland cover type at site at T2H1 = Average HSI value of wetland cover type at site at T1H2 = Average HSI value of wetland cover type at site at T2
The net average annual impact of the recommended project is equal to the difference between the "without project" AAHUs and the "with project" AAHUs.
DRAFT Attachment D – Wetland Mitigation Plan and CE/ICA 3-2Hunting Bayou Flood Risk Management Project

4.0 WITHOUT PROJECT IMPACT ANALYSIS
For mitigation planning, the without project condition for wetland habitat areas that would be impacted by the proposed project was defined by taking the existing conditions in 2009 and projecting anticipated habitat changes over the period of analysis, in the absence of constructing the project. These projected conditions would then be compared to the impacts the proposed project would have without mitigation in accordance with ER 1105-2-100 requirements to compare impacts to future without project conditions. In the remainder of this report, the term “without project” is used for brevity, and refers to the future of the proposed project wetland areas without construction, or the future without project condition. The without project impact analysis was conducted by projecting general impacts to project areas due to anticipated development trends, forecasting the change in habitat model variables over time that would occur in the absence of development, prior to development impacts, and reflecting these impacts and changes in the habitat model for the time intervals in the period of analysis. The following subsections describe the assumptions and methodology for this analysis.
4.1 Without Project Conditions – General AssumptionsBecause the project area is located in a relatively developed area of central northeast Houston, development is expected to impact the few remaining undeveloped parcels, in the absence of the recommended project. The 15 wetlands that have been identified within the Hunting Bayou Federal Flood Control project are found at three locations:
Offline Detention Tract
Channel Area
Disposal Site 4
Each of the three locations potentially has a different future condition under the without project scenario. The following paragraphs describe the scenarios and assumptions used to define the future without project conditions at these locations.
4.1.1 Offline Detention TractThe offline detention site was purchased in 2007 by HCFCD for the proposed project from UPRR. Therefore, it was assumed that the wetlands within the offline detention tract would continue to exist over the period of analysis if the project were not built, leaving Patches O-1, O-2, and O-5 in place. Over the period of analysis, the forested wetlands would continue to mature and the scrub/shrub wetlands would be expected to become forested wetlands.
4.1.2 Channel AreaThe wetlands in the channel area are limited to the reach between Homestead Road and LibertyRoad. The wetlands in the channel area are almost entirely within the current ownership right-of-way (ROW) of HCFCD or the City of Houston (COH), or within HCFCD easement. HCFCD ROW would be expected to remain under HCFCD ownership or easement for continued flood and drainage conveyance, and would not be developed during the period of analysis. Most of the property containing wetlands on the north bank of Hunting Bayou in this reach is COH property. This property is a closed, unregistered municipal solid waste landfill, and is within HCFCD’s
DRAFT Attachment D – Wetland Mitigation Plan and CE/ICA 4-1Hunting Bayou Flood Risk Management Project
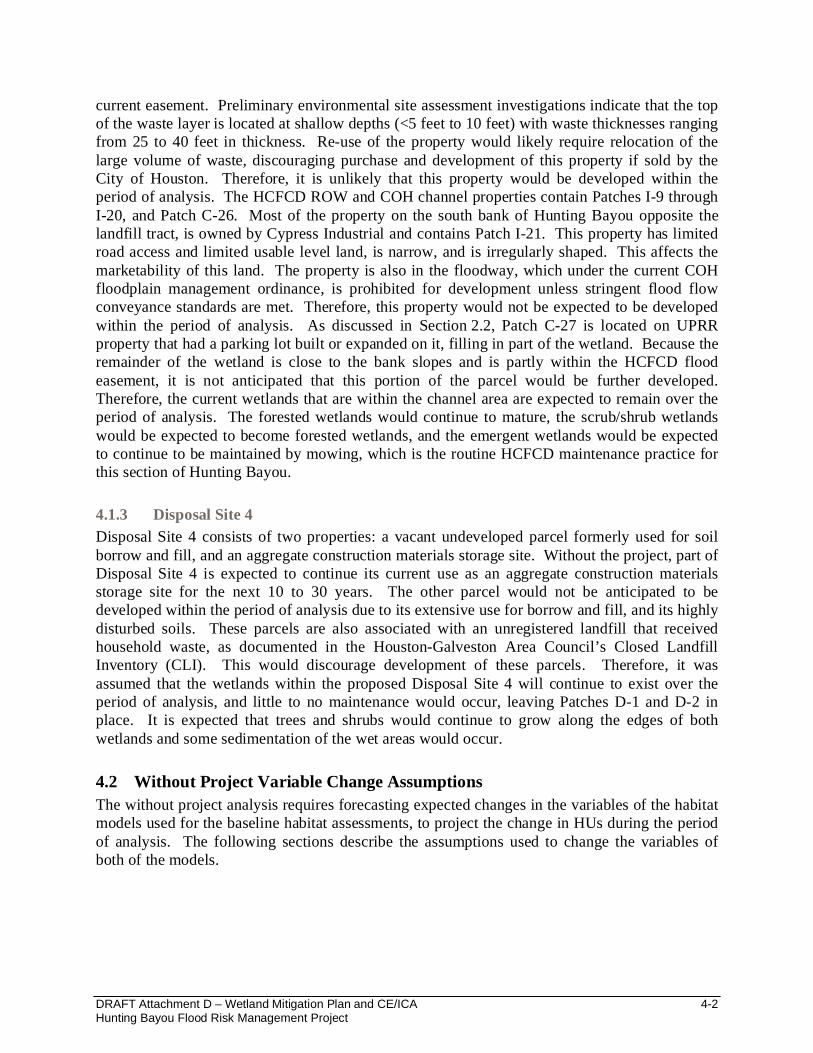
current easement. Preliminary environmental site assessment investigations indicate that the top of the waste layer is located at shallow depths (<5 feet to 10 feet) with waste thicknesses ranging from 25 to 40 feet in thickness. Re-use of the property would likely require relocation of the large volume of waste, discouraging purchase and development of this property if sold by the City of Houston. Therefore, it is unlikely that this property would be developed within the period of analysis. The HCFCD ROW and COH channel properties contain Patches I-9 through I-20, and Patch C-26. Most of the property on the south bank of Hunting Bayou opposite the landfill tract, is owned by Cypress Industrial and contains Patch I-21. This property has limited road access and limited usable level land, is narrow, and is irregularly shaped. This affects the marketability of this land. The property is also in the floodway, which under the current COH floodplain management ordinance, is prohibited for development unless stringent flood flow conveyance standards are met. Therefore, this property would not be expected to be developed within the period of analysis. As discussed in Section 2.2, Patch C-27 is located on UPRR property that had a parking lot built or expanded on it, filling in part of the wetland. Because the remainder of the wetland is close to the bank slopes and is partly within the HCFCD flood easement, it is not anticipated that this portion of the parcel would be further developed. Therefore, the current wetlands that are within the channel area are expected to remain over the period of analysis. The forested wetlands would continue to mature, the scrub/shrub wetlands would be expected to become forested wetlands, and the emergent wetlands would be expected to continue to be maintained by mowing, which is the routine HCFCD maintenance practice for this section of Hunting Bayou.
4.1.3 Disposal Site 4Disposal Site 4 consists of two properties: a vacant undeveloped parcel formerly used for soil borrow and fill, and an aggregate construction materials storage site. Without the project, part of Disposal Site 4 is expected to continue its current use as an aggregate construction materials storage site for the next 10 to 30 years. The other parcel would not be anticipated to be developed within the period of analysis due to its extensive use for borrow and fill, and its highly disturbed soils. These parcels are also associated with an unregistered landfill that received household waste, as documented in the Houston-Galveston Area Council’s Closed Landfill Inventory (CLI). This would discourage development of these parcels. Therefore, it wasassumed that the wetlands within the proposed Disposal Site 4 will continue to exist over the period of analysis, and little to no maintenance would occur, leaving Patches D-1 and D-2 in place. It is expected that trees and shrubs would continue to grow along the edges of both wetlands and some sedimentation of the wet areas would occur.
4.2 Without Project Variable Change AssumptionsThe without project analysis requires forecasting expected changes in the variables of the habitat models used for the baseline habitat assessments, to project the change in HUs during the period of analysis. The following sections describe the assumptions used to change the variables of both of the models.
DRAFT Attachment D – Wetland Mitigation Plan and CE/ICA 4-2Hunting Bayou Flood Risk Management Project

4.2.1 Forested Wetland Model Variable ChangesThe forested wetland model has 8 variables (Table 5) that are used in the calculation of HSI. Seven of the 8 variables measure vegetation. Following a typical vegetation succession, it is expected that the trees would grow taller and the percentage of the tree canopy would increase. With the increased tree canopy, the understory shrub and herbaceous vegetation would have increased competition for light and other resources. This increased competition would, over time, reduce the percent cover. One of the 8 variables measures hydrology and another variable is a yes/no question whether the wetland is greater than 405 hectares in size. For this study, it is assumed that major catastrophic events such as fires, class 4 or 5 hurricanes, and major floods events such as ones greater than a 1 percent event would not occur in the study area during the period of analysis. It should be noted that the channel emergent wetlands did not appear to be altered in shape or extent (due to storm flow velocity scour etc.) after Tropical Storm Allison, based on examination of 1999 and 2002 aerials. Tropical Storm Allison has been determined to be the flood of record for this channel. Most of the forested wetlands are located farther from the channel, where flow velocities would be less, especially considering the increased hydraulic roughness provided by trees. Therefore, no natural catastrophic changes to the vegetation,topography, and geology of the wetlands are anticipated during the period of analysis.
The following are assumptions for each of the 8 variables in the Forested Wetland model. Sections 4.2.1.1 through 4.2.1.6 describe the 6 variables for the Mink portion of the model, and Sections 4.4.1.6 and 4.2.1.7 describe the 3 variables for the Barred Owl portion of the model. Each variable was reviewed for potential changes during the period of analysis. Some variable values are expected to change. Table 5 summarizes these changes.
4.2.1.1 PERSWATERThe percent of the year with standing water, on average, is not expected to change. Though year-to-year wet/drought cycles would make the parameter value fluctuate within the period ofanalysis, wholesale climatic shift towards one condition would not be expected within the period of analysis. The local prevailing climate change trend with respect to precipitation and soil moisture is not well-defined and equivocal, as discussed in Section 6.
4.2.1.2 CANSHRUBThe percent of deciduous shrub crown cover is expected to decrease as the shrubs are shaded out by closing of the forest canopy. For this study, a 1 percent decrease from initial crown cover value per year to a minimum of 10 percent would be used over the period of analysis. The decrease of crown cover is related to increase of tree cover, some plants that are classified as shrubs becoming classified as trees (greater than 20 feet, as defined in the Mink and Swamp Rabbit models), and increase in competition for light and other resources.
4.2.1.3 CANEMERVEGFor wetlands without emergent vegetation present today (and where standing water was recorded sufficiently to require the Mink model), no change in the percent canopy of emergent vegetation would be expected, because these are wetlands that have existed for many years, providing plenty of time for natural recruitment of vegetation and natural seasonal hydroperiod fluctuations to have resulted in growth if it were to have happened. Underlying reasons for the lack of growth would be expected in such cases, such as wetland bottom topographical transitions being
DRAFT Attachment D – Wetland Mitigation Plan and CE/ICA 4-3Hunting Bayou Flood Risk Management Project

too abrupt or steep, or the substrate or water quality too poor. Usually during ebbs in the hydroperiod, remnants of emergent vegetation would be present as dried or decayed vegetation to indicate growth during the wetter part of a season, or would be present if standing water is present. Therefore, it is assumed growth will not appear after many years. For those wetlands with emergent vegetation present today (and sufficient standing water to require the Mink model), no change was assumed, if the emergent cover was already within the optimal HSI score range (e.g. C-26). Although emergent canopy cover could fluctuate seasonally with the wet and dry season (and decline below the observed value), this is a conservative assumption with respect to higher scoring for the affected wetland. Therefore, for both of these cases, CANEMERVEG would not be assumed to change. Because most of the wetlands did not contain standing water for at least 3 consecutive months, and therefore did not require Mink modeling, there were no other cases for emergent vegetation being present other than the ones discussed.
4.2.1.4 CANEDGEThis variable measures the percent canopy of trees and shrubs surrounding the wetland within 100 meters (m). Aerials and field data were reviewed to assess the potential for vegetation (or development) surrounding the wetland out to 100 m to change. In all cases, the surrounding edge consisted of one or more of the following: 1) grass-covered areas maintained by HCFCD, 2) closed forested canopy cover (already at optimal value >75 percent) out to 100 m or with well-defined maintained (or routinely disturbed) non-forest boundaries, and 3) developed areas (buildings, pavement etc.). Forested cover were typically thin bands surrounding the wetland amidst maintained ROW or land disturbed by industrial use (construction aggregate storage), or forest edge amidst development within 100 m of the wetland. Though some wetlands are surrounded by closed canopy out to 100 m, such as the offline basin wetlands, none of these required the Mink model due to lack of standing water for sufficient time. There were no instances where wetlands being evaluated for the Mink model would have surrounding, unmaintained vegetation where shrub or tree colonization would be expected. Therefore, none of the aforementioned situations were conducive to tree or shrub cover changing within 100 m of the wetland. As a result, CANEDGE was not assumed to change.
4.2.1.5 Threshold Size of 405 HectareThe variable consisting of the question of whether or not the wetland is greater than 405 hectares (approximately 1,000 acres) in size, would not be expected to change since catastrophic topographical or geologic changes would not be expected for the reasons discussed in Section 4.2.1. Also, all of the wetlands are less than 2 acres in contiguous size, and a change to greater than 1,000 acres would not be conceivable.
4.2.1.6 NUMBERLGTREEThe variable NUMBERLGTREE is a measure of the expected density of large trees (20 inches dbH or larger), derived from sampling transects and scaling the results to express the number per acre. The baseline data for this variable collected in 2009 for the various forested wetland patches was reviewed to determine conditions and assumptions for an expected progression. The numbers counted along the transects were found to be assumed to represent the number per acre. This was because scaling the linear transect count to that which would reflect an acre would result in far greater numbers of large trees than field observations indicated, especially considering the small size of the wetlands involved. The number of trees 20 inches dBH or
DRAFT Attachment D – Wetland Mitigation Plan and CE/ICA 4-4Hunting Bayou Flood Risk Management Project

larger per acre would be expected to increase as trees large enough to reach the 20-inch threshold within the period of analysis, given the assumed growth rate, grow and reach this size. To estimate the number of large trees, individual tree dBH data collected for each wetland during the 2009 habitat evaluation was used, and the dBH growth rate discussed in Section 4.2.1.7 applied to calculate the numbers of trees meeting or exceeding the threshold during each analysis year.
4.2.1.7 CANTREE, DBHTREEFor this study, a 1 percent increase in initial crown cover per year up to closure (100 percent) of trees would be used. Review of forestry information indicates that unbounded trees (trees that are not limited by adjacent vegetation) will increase the diameter at breast height (DBH) from 0.2 to 0.3 inches per year (PBS&J 2007, Mills 2008), and growth varies by species, soil types, climate, and size/age of the tree (larger/older trees grow slower) [Coder 1996]. Trees that are bounded have slower increases of DBH, from near 0 to 0.2 inches per year (Nash 1959). For the species and local conditions in this study, a rate of increase of 0.15 inches per year would be used for the average DBH growth for the period of analysis. Because of the relatively small initial DBH values, establishing maximum values (i.e. 50 inches) for this variable was not required, considering the growth rate and period of analysis.
Table 5:Forested Wetland Model Variable Changes
Variable Description Expected Change Species
1 CANTREE Percent canopy cover of overstory trees
Increase 1 percent/year to 100 percent maximum
Barred Owl and Mink
2 DBHTREE Mean DBH of overstory trees Increase 0.15 inch/year Barred Owl
3 NUMBERLGTREE Increase when tree DBH data exceeds 20 in by number of trees in transect exceeding threshold
Barred Owl
4 PERSWATER Percent of year with surface water present (between 0 and 100 percent)
No change. Mink
5 CANSHRUB Percent shrub canopy cover Decrease 1 percent/year to 10 percent minimum
Mink
6 CANEMERVEG Percent canopy cover of emergent vegetation (between 0 and 100 percent)
For wetlands without emergent vegetation present today, no change.For those with emergent present today, no change, if already within optimal range (e.g. C-26).
Mink
7 CANEDGE Percent canopy cover of trees and shrubs within 100 m (328 ft.) of wetland edge (between 0 and 100 percent)
No change due to surrounding edge containing closed forest canopy, maintained grass, or development.
Mink
8 Is Wetland >405 Hectares
Is wetland greater than 405 Ha (1000 ac) in size?
No change Mink
DRAFT Attachment D – Wetland Mitigation Plan and CE/ICA 4-5Hunting Bayou Flood Risk Management Project
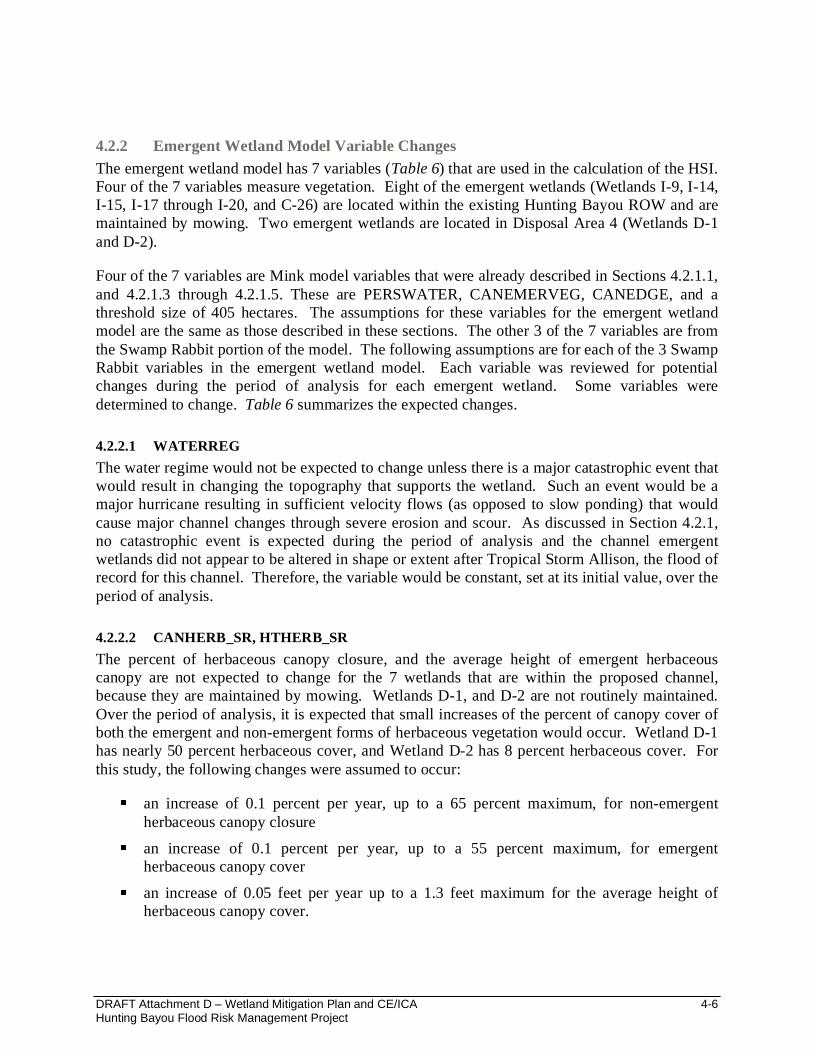
4.2.2 Emergent Wetland Model Variable ChangesThe emergent wetland model has 7 variables (Table 6) that are used in the calculation of the HSI. Four of the 7 variables measure vegetation. Eight of the emergent wetlands (Wetlands I-9, I-14, I-15, I-17 through I-20, and C-26) are located within the existing Hunting Bayou ROW and are maintained by mowing. Two emergent wetlands are located in Disposal Area 4 (Wetlands D-1and D-2).
Four of the 7 variables are Mink model variables that were already described in Sections 4.2.1.1, and 4.2.1.3 through 4.2.1.5. These are PERSWATER, CANEMERVEG, CANEDGE, and a threshold size of 405 hectares. The assumptions for these variables for the emergent wetland model are the same as those described in these sections. The other 3 of the 7 variables are from the Swamp Rabbit portion of the model. The following assumptions are for each of the 3 Swamp Rabbit variables in the emergent wetland model. Each variable was reviewed for potential changes during the period of analysis for each emergent wetland. Some variables were determined to change. Table 6 summarizes the expected changes.
4.2.2.1 WATERREGThe water regime would not be expected to change unless there is a major catastrophic event that would result in changing the topography that supports the wetland. Such an event would be a major hurricane resulting in sufficient velocity flows (as opposed to slow ponding) that would cause major channel changes through severe erosion and scour. As discussed in Section 4.2.1, no catastrophic event is expected during the period of analysis and the channel emergent wetlands did not appear to be altered in shape or extent after Tropical Storm Allison, the flood of record for this channel. Therefore, the variable would be constant, set at its initial value, over the period of analysis.
4.2.2.2 CANHERB_SR, HTHERB_SRThe percent of herbaceous canopy closure, and the average height of emergent herbaceous canopy are not expected to change for the 7 wetlands that are within the proposed channel,because they are maintained by mowing. Wetlands D-1, and D-2 are not routinely maintained. Over the period of analysis, it is expected that small increases of the percent of canopy cover of both the emergent and non-emergent forms of herbaceous vegetation would occur. Wetland D-1has nearly 50 percent herbaceous cover, and Wetland D-2 has 8 percent herbaceous cover. For this study, the following changes were assumed to occur:
an increase of 0.1 percent per year, up to a 65 percent maximum, for non-emergent herbaceous canopy closure
an increase of 0.1 percent per year, up to a 55 percent maximum, for emergent herbaceous canopy cover
an increase of 0.05 feet per year up to a 1.3 feet maximum for the average height of herbaceous canopy cover.
DRAFT Attachment D – Wetland Mitigation Plan and CE/ICA 4-6Hunting Bayou Flood Risk Management Project

Table 6:Emergent Wetland Model Variable Changes
Variable Description Expected Change Species
1 PERSWATER Percent of Year with Surface Water Present (between 0 and 100)
Same as for Forested WetlandsMink
2 CANEMERVEG Percent Canopy Cover of Emergent Vegetation(between 0 and 100)
Same as for Forested WetlandsMink
3 CANEDGE Percent Canopy Cover of Trees and Shrubs within 100 m of Wetland Edge (between 0 and 100)
Same as for Forested Wetlands
Mink
4 Is Wetland >405 Hectares
Is wetland greater than 405 Ha (1000 ac) in size?
No change Mink
5 CANHERB_SR Percent herbaceous canopy closure
No Change for mowed areas; Increase 0.1 Percent/Year to 65 Percent Maximum
Swamp Rabbit
6 HTHERB_SR Average height of herbaceous canopy cover
No Change for mowed areas; Increase 0.05 foot per year to 1.3 feet Maximum
Swamp Rabbit
7 WATERREG Water regime No Change Swamp Rabbit
4.3 Without Project Calculation MethodologyCalculation spreadsheets were developed to implement the models used for the baseline habitat assessment and were modified to provide HSI calculations for the years in all the time intervals in the period of analysis discussed in Section 3.0. These spreadsheets used Visual Basic routines and Excel formulas to calculate HSI scores based on the equations and curves in the USFWS HSI literature. Data input sheets were developed to facilitate changing variable values over the period of analysis. Scaling or increment factors were multiplied to or subtracted from previous year input values, as appropriate, to calculate the next year’s values, to implement the assumptions of change in variables discussed in Section 4.2. Results summary spreadsheets were developed to calculate HUs, and to perform the calculation of AAHUs over the period of analysis, using the formula described in Section 3.1.
4.4 Without Project ResultsThe Without Project HU calculation results are shown in Tables 7 through 10. For all wetland models, the Mink model hydrology variable PERSWATER is not expected to change for the reasons discussed in Section 4.2. So whether or not the Mink model contributes to the HSI score, PERSWATER would not effect any changes in AAHUs through the period of analysis.The HSI values for the Forested Wetland models show a gradual increase through the period of analysis, consistent with the growth in DBHTREE and CANTREE. The HSI values for Emergent Wetland models for all of the patches in the channel right-of-way remain the same for the reasons discussed in the assumptions in Section 4.2; their location makes them subject to routine channel maintenance mowing, and places them in areas where their adjacent vegetation (or lack of) would not change (e.g. development or closed canopy forest growth), which would tend to keep emergent model herbaceous and edge canopy variables the same. Also as explained Section 4.2, the lack of expected change in emergent canopy, either due to none present (almost
DRAFT Attachment D – Wetland Mitigation Plan and CE/ICA 4-7Hunting Bayou Flood Risk Management Project

all channel emergent wetlands), or due to already having the optimal percentage present (C-26), maintains the HSI constant. The HSI values for Emergent Wetland models for Disposal Site 4 generally increase because of the lack of maintenance mowing. While the Mink score does not change for the aforementioned reasons, the Swamp Rabbit variables change. Therefore, due to lack of mowing expected, the herbaceous canopy cover increases and average height of herbaceous canopy cover increases. For Patch D-2 the average height of herbaceous canopy cover increases to above 0.85 foot and in Year 2022 and the HSI is no longer zero.
Because the AAHU is a quantity that time-weights HUs within the time period of annualization, the more time the HU value is low, the lower the value of the AAHU. Tables 7 through 9 show the change in HSI and AAHUs associated with the different patches. The total AAHUs for each wetland cover type were calculated in accordance with USFWS ESM 102 and are shown inTable 10.
DRAFT Attachment D – Wetland Mitigation Plan and CE/ICA 4-8Hunting Bayou Flood Risk Management Project
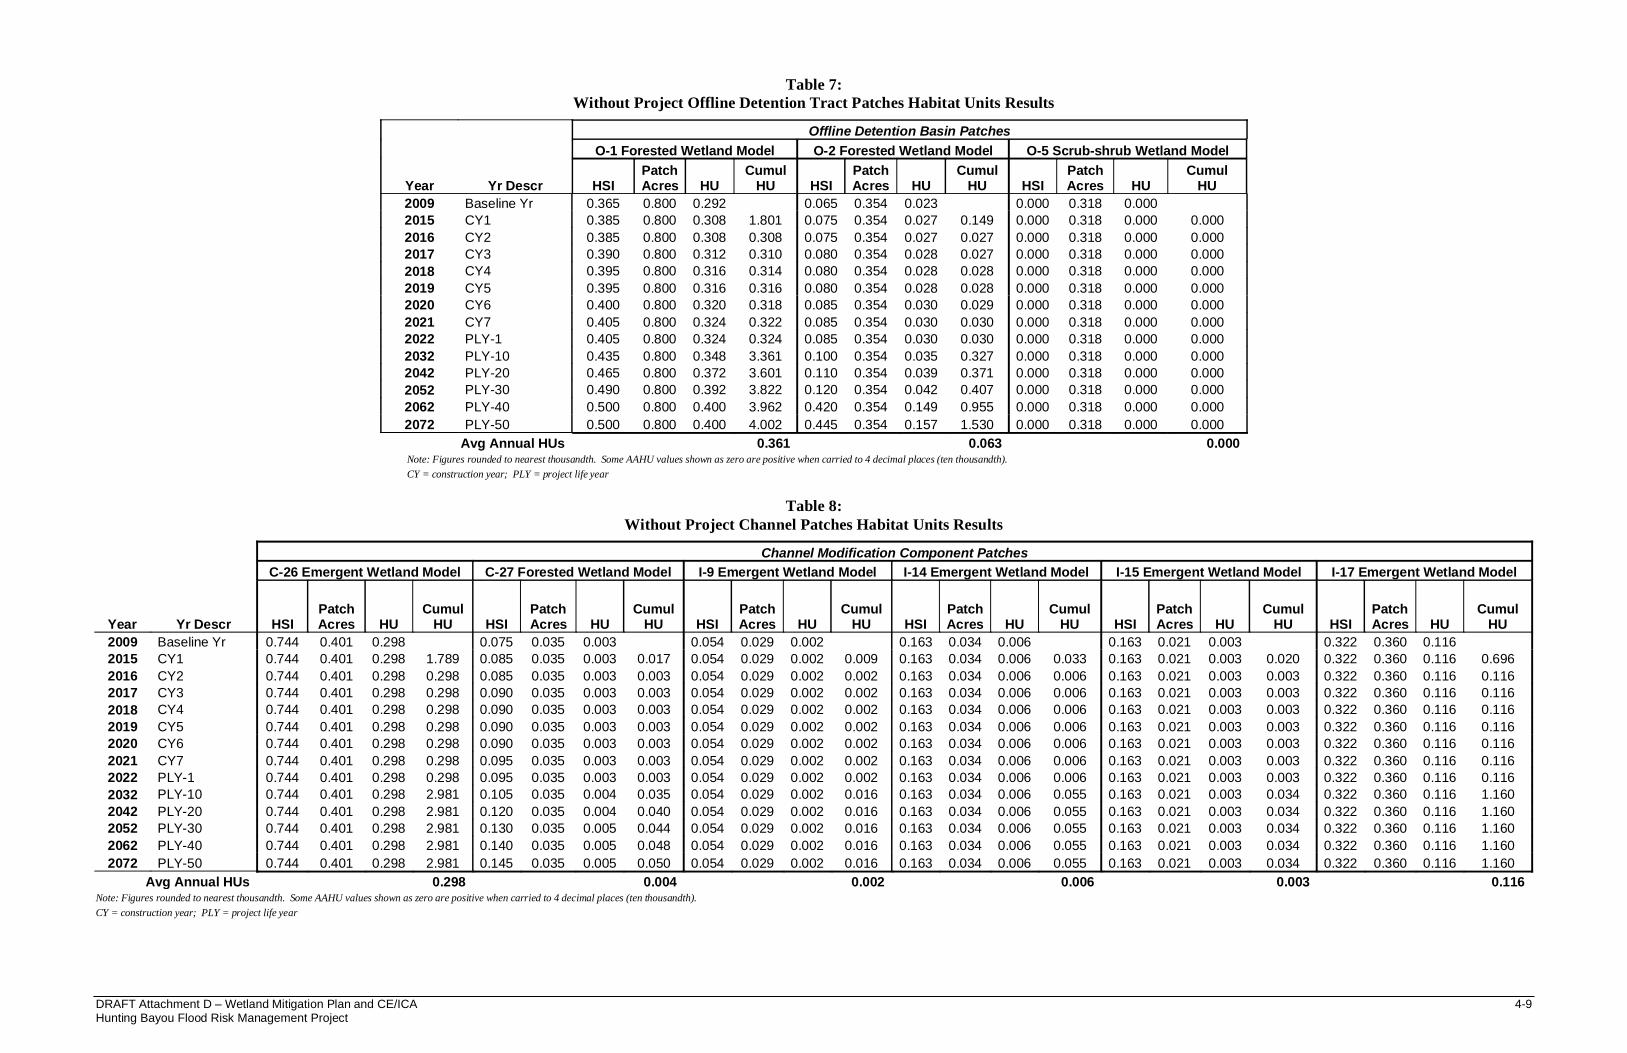
Table 7:Without Project Offline Detention Tract Patches Habitat Units Results
Year Yr Descr
Offline Detention Basin PatchesO-1 Forested Wetland Model O-2 Forested Wetland Model O-5 Scrub-shrub Wetland Model
HSIPatch Acres HU
CumulHU HSI
Patch Acres HU
CumulHU HSI
Patch Acres HU
CumulHU
2009 Baseline Yr 0.365 0.800 0.292 0.065 0.354 0.023 0.000 0.318 0.0002015 CY1 0.385 0.800 0.308 1.801 0.075 0.354 0.027 0.149 0.000 0.318 0.000 0.0002016 CY2 0.385 0.800 0.308 0.308 0.075 0.354 0.027 0.027 0.000 0.318 0.000 0.0002017 CY3 0.390 0.800 0.312 0.310 0.080 0.354 0.028 0.027 0.000 0.318 0.000 0.0002018 CY4 0.395 0.800 0.316 0.314 0.080 0.354 0.028 0.028 0.000 0.318 0.000 0.0002019 CY5 0.395 0.800 0.316 0.316 0.080 0.354 0.028 0.028 0.000 0.318 0.000 0.0002020 CY6 0.400 0.800 0.320 0.318 0.085 0.354 0.030 0.029 0.000 0.318 0.000 0.0002021 CY7 0.405 0.800 0.324 0.322 0.085 0.354 0.030 0.030 0.000 0.318 0.000 0.0002022 PLY-1 0.405 0.800 0.324 0.324 0.085 0.354 0.030 0.030 0.000 0.318 0.000 0.0002032 PLY-10 0.435 0.800 0.348 3.361 0.100 0.354 0.035 0.327 0.000 0.318 0.000 0.0002042 PLY-20 0.465 0.800 0.372 3.601 0.110 0.354 0.039 0.371 0.000 0.318 0.000 0.0002052 PLY-30 0.490 0.800 0.392 3.822 0.120 0.354 0.042 0.407 0.000 0.318 0.000 0.0002062 PLY-40 0.500 0.800 0.400 3.962 0.420 0.354 0.149 0.955 0.000 0.318 0.000 0.0002072 PLY-50 0.500 0.800 0.400 4.002 0.445 0.354 0.157 1.530 0.000 0.318 0.000 0.000
Avg Annual HUs 0.361 0.063 0.000Note: Figures rounded to nearest thousandth. Some AAHU values shown as zero are positive when carried to 4 decimal places (ten thousandth).CY = construction year; PLY = project life year
Table 8:Without Project Channel Patches Habitat Units Results
Channel Modification Component PatchesC-26 Emergent Wetland Model C-27 Forested Wetland Model I-9 Emergent Wetland Model I-14 Emergent Wetland Model I-15 Emergent Wetland Model I-17 Emergent Wetland Model
Year Yr Descr HSIPatch Acres HU
CumulHU HSI
Patch Acres HU
CumulHU HSI
Patch Acres HU
CumulHU HSI
Patch Acres HU
CumulHU HSI
Patch Acres HU
CumulHU HSI
Patch Acres HU
CumulHU
2009 Baseline Yr 0.744 0.401 0.298 0.075 0.035 0.003 0.054 0.029 0.002 0.163 0.034 0.006 0.163 0.021 0.003 0.322 0.360 0.1162015 CY1 0.744 0.401 0.298 1.789 0.085 0.035 0.003 0.017 0.054 0.029 0.002 0.009 0.163 0.034 0.006 0.033 0.163 0.021 0.003 0.020 0.322 0.360 0.116 0.6962016 CY2 0.744 0.401 0.298 0.298 0.085 0.035 0.003 0.003 0.054 0.029 0.002 0.002 0.163 0.034 0.006 0.006 0.163 0.021 0.003 0.003 0.322 0.360 0.116 0.1162017 CY3 0.744 0.401 0.298 0.298 0.090 0.035 0.003 0.003 0.054 0.029 0.002 0.002 0.163 0.034 0.006 0.006 0.163 0.021 0.003 0.003 0.322 0.360 0.116 0.1162018 CY4 0.744 0.401 0.298 0.298 0.090 0.035 0.003 0.003 0.054 0.029 0.002 0.002 0.163 0.034 0.006 0.006 0.163 0.021 0.003 0.003 0.322 0.360 0.116 0.1162019 CY5 0.744 0.401 0.298 0.298 0.090 0.035 0.003 0.003 0.054 0.029 0.002 0.002 0.163 0.034 0.006 0.006 0.163 0.021 0.003 0.003 0.322 0.360 0.116 0.1162020 CY6 0.744 0.401 0.298 0.298 0.090 0.035 0.003 0.003 0.054 0.029 0.002 0.002 0.163 0.034 0.006 0.006 0.163 0.021 0.003 0.003 0.322 0.360 0.116 0.1162021 CY7 0.744 0.401 0.298 0.298 0.095 0.035 0.003 0.003 0.054 0.029 0.002 0.002 0.163 0.034 0.006 0.006 0.163 0.021 0.003 0.003 0.322 0.360 0.116 0.1162022 PLY-1 0.744 0.401 0.298 0.298 0.095 0.035 0.003 0.003 0.054 0.029 0.002 0.002 0.163 0.034 0.006 0.006 0.163 0.021 0.003 0.003 0.322 0.360 0.116 0.1162032 PLY-10 0.744 0.401 0.298 2.981 0.105 0.035 0.004 0.035 0.054 0.029 0.002 0.016 0.163 0.034 0.006 0.055 0.163 0.021 0.003 0.034 0.322 0.360 0.116 1.1602042 PLY-20 0.744 0.401 0.298 2.981 0.120 0.035 0.004 0.040 0.054 0.029 0.002 0.016 0.163 0.034 0.006 0.055 0.163 0.021 0.003 0.034 0.322 0.360 0.116 1.1602052 PLY-30 0.744 0.401 0.298 2.981 0.130 0.035 0.005 0.044 0.054 0.029 0.002 0.016 0.163 0.034 0.006 0.055 0.163 0.021 0.003 0.034 0.322 0.360 0.116 1.1602062 PLY-40 0.744 0.401 0.298 2.981 0.140 0.035 0.005 0.048 0.054 0.029 0.002 0.016 0.163 0.034 0.006 0.055 0.163 0.021 0.003 0.034 0.322 0.360 0.116 1.1602072 PLY-50 0.744 0.401 0.298 2.981 0.145 0.035 0.005 0.050 0.054 0.029 0.002 0.016 0.163 0.034 0.006 0.055 0.163 0.021 0.003 0.034 0.322 0.360 0.116 1.160
Avg Annual HUs 0.298 0.004 0.002 0.006 0.003 0.116Note: Figures rounded to nearest thousandth. Some AAHU values shown as zero are positive when carried to 4 decimal places (ten thousandth).CY = construction year; PLY = project life year
DRAFT Attachment D – Wetland Mitigation Plan and CE/ICA 4-9Hunting Bayou Flood Risk Management Project

Table 8 (continued):Without Project Channel Patches Habitat Units Results (continued)
Channel Modification Component Patches (continued)I-18 Emergent Wetland Model I-19 Emergent Wetland Model I-20 Emergent Wetland Model I-21 Forested Wetland Model
Year Yr Descr HSIPatch Acres HU
CumulHU HSI
Patch Acres HU
CumulHU HSI
Patch Acres HU
CumulHU HSI
Patch Acres HU
CumulHU
2009 Baseline Yr 0.232 0.026 0.006 0.153 0.751 0.115 0.010 0.049 0.000 0.325 0.493 0.1602015 CY1 0.232 0.026 0.006 0.036 0.153 0.751 0.115 0.689 0.010 0.049 0.000 0.003 0.365 0.493 0.180 1.0202016 CY2 0.232 0.026 0.006 0.006 0.153 0.751 0.115 0.115 0.010 0.049 0.000 0.000 0.375 0.493 0.185 0.1822017 CY3 0.232 0.026 0.006 0.006 0.153 0.751 0.115 0.115 0.010 0.049 0.000 0.000 0.380 0.493 0.187 0.1862018 CY4 0.232 0.026 0.006 0.006 0.153 0.751 0.115 0.115 0.010 0.049 0.000 0.000 0.390 0.493 0.192 0.1902019 CY5 0.232 0.026 0.006 0.006 0.153 0.751 0.115 0.115 0.010 0.049 0.000 0.000 0.390 0.493 0.192 0.1922020 CY6 0.232 0.026 0.006 0.006 0.153 0.751 0.115 0.115 0.010 0.049 0.000 0.000 0.400 0.493 0.197 0.1952021 CY7 0.232 0.026 0.006 0.006 0.153 0.751 0.115 0.115 0.010 0.049 0.000 0.000 0.410 0.493 0.202 0.2002022 PLY-1 0.232 0.026 0.006 0.006 0.153 0.751 0.115 0.115 0.010 0.049 0.000 0.000 0.415 0.493 0.205 0.2032032 PLY-10 0.232 0.026 0.006 0.060 0.153 0.751 0.115 1.148 0.010 0.049 0.000 0.005 0.445 0.493 0.219 2.1202042 PLY-20 0.232 0.026 0.006 0.060 0.153 0.751 0.115 1.148 0.010 0.049 0.000 0.005 0.740 0.493 0.365 2.9212052 PLY-30 0.232 0.026 0.006 0.060 0.153 0.751 0.115 1.148 0.010 0.049 0.000 0.005 0.770 0.493 0.380 3.7222062 PLY-40 0.232 0.026 0.006 0.060 0.153 0.751 0.115 1.148 0.010 0.049 0.000 0.005 0.795 0.493 0.392 3.8572072 PLY-50 0.232 0.026 0.006 0.060 0.153 0.751 0.115 1.148 0.010 0.049 0.000 0.005 0.820 0.493 0.404 3.980
Avg Annual HUs 0.006 0.115 0.0005 0.301Note: Figures rounded to nearest thousandth. Some AAHU values shown as zero are positive when carried to 4 decimal places (ten thousandth).CY = construction year; PLY = project life year
Table 9:Without Project Disposal Site Habitat Units Results
Disposal Site 4 PatchesD-1 Emergent Wetland Model D-2 Emergent Wetland Model
Year Yr Descr HSIPatch Acres HU
CumulHU HSI
Patch Acres HU
CumulHU
2009 Baseline Yr 0.099 0.453 0.045 0.015 0.247 0.0042015 CY1 0.099 0.453 0.045 0.269 0.015 0.247 0.004 0.0222016 CY2 0.110 0.453 0.050 0.047 0.015 0.247 0.004 0.0042017 CY3 0.119 0.453 0.054 0.052 0.015 0.247 0.004 0.0042018 CY4 0.128 0.453 0.058 0.056 0.015 0.247 0.004 0.0042019 CY5 0.136 0.453 0.062 0.060 0.015 0.247 0.004 0.0042020 CY6 0.144 0.453 0.065 0.064 0.015 0.247 0.004 0.0042021 CY7 0.144 0.453 0.065 0.065 0.015 0.247 0.004 0.0042022 PLY-1 0.144 0.453 0.065 0.065 0.031 0.247 0.008 0.0062032 PLY-10 0.146 0.453 0.066 0.658 0.081 0.247 0.020 0.1382042 PLY-20 0.147 0.453 0.067 0.664 0.084 0.247 0.021 0.2052052 PLY-30 0.149 0.453 0.067 0.671 0.087 0.247 0.022 0.2122062 PLY-40 0.150 0.453 0.068 0.677 0.090 0.247 0.022 0.2192072 PLY-50 0.152 0.453 0.069 0.683 0.093 0.247 0.023 0.226
Avg Annual HUs 0.064 0.017Note: Figures rounded to nearest thousandth. Some AAHU values shown as zero are positive when carried to 4 decimal places (ten thousandth).CY = construction year; PLY = project life year
DRAFT Attachment D – Wetland Mitigation Plan and CE/ICA 4-10Hunting Bayou Flood Risk Management Project

Table 10:Without Project Average Annual Habitat Units by TSP Component and Cover Type
Offline Detention Channel Disposal Site 4Forested Wetlands Scrub-Shrub Wetlands Emergent Wetlands Forested Wetlands Emergent Wetlands
Year Yr DescrAvg HSI Acres HU
CumulativeHU
Avg HSI Acres HU
CumulativeHU
Avg HSI Acres HU
CumulativeHU
Avg HSI Acres HU
CumulativeHU
Avg HSI Acres HU
CumulativeHU
2009 Baseline Yr 0.273 1.154 0.315 0.000 0.318 0.000 0.327 1.672 0.546 0.308 0.528 0.163 0.069 0.700 0.0482015 CY1 0.290 1.154 0.335 1.949 0.000 0.318 0.000 0.000 0.327 1.672 0.546 3.276 0.346 0.528 0.183 1.037 0.070 0.700 0.049 0.2912016 CY2 0.290 1.154 0.335 0.335 0.000 0.318 0.000 0.000 0.327 1.672 0.546 0.546 0.356 0.528 0.188 0.185 0.076 0.700 0.053 0.0512017 CY3 0.295 1.154 0.340 0.338 0.000 0.318 0.000 0.000 0.327 1.672 0.546 0.546 0.361 0.528 0.190 0.189 0.082 0.700 0.058 0.0562018 CY4 0.298 1.154 0.344 0.342 0.000 0.318 0.000 0.000 0.327 1.672 0.546 0.546 0.370 0.528 0.195 0.193 0.088 0.700 0.062 0.0602019 CY5 0.298 1.154 0.344 0.344 0.000 0.318 0.000 0.000 0.327 1.672 0.546 0.546 0.370 0.528 0.195 0.195 0.093 0.700 0.065 0.0642020 CY6 0.303 1.154 0.350 0.347 0.000 0.318 0.000 0.000 0.327 1.672 0.546 0.546 0.379 0.528 0.200 0.198 0.099 0.700 0.069 0.0672021 CY7 0.307 1.154 0.354 0.352 0.000 0.318 0.000 0.000 0.327 1.672 0.546 0.546 0.389 0.528 0.205 0.203 0.099 0.700 0.069 0.0692022 PLY-1 0.307 1.154 0.354 0.354 0.000 0.318 0.000 0.000 0.327 1.672 0.546 0.546 0.394 0.528 0.208 0.207 0.104 0.700 0.073 0.0712032 PLY-10 0.332 1.154 0.384 3.689 0.000 0.318 0.000 0.000 0.327 1.672 0.546 5.459 0.422 0.528 0.223 2.155 0.123 0.700 0.086 0.7962042 PLY-20 0.356 1.154 0.411 3.973 0.000 0.318 0.000 0.000 0.327 1.672 0.546 5.459 0.699 0.528 0.369 2.960 0.125 0.700 0.088 0.8692052 PLY-30 0.377 1.154 0.435 4.228 0.000 0.318 0.000 0.000 0.327 1.672 0.546 5.459 0.727 0.528 0.384 3.766 0.127 0.700 0.089 0.8832062 PLY-40 0.475 1.154 0.549 4.917 0.000 0.318 0.000 0.000 0.327 1.672 0.546 5.459 0.751 0.528 0.397 3.905 0.129 0.700 0.090 0.8962072 PLY-50 0.483 1.154 0.558 5.532 0.000 0.318 0.000 0.000 0.327 1.672 0.546 5.459 0.775 0.528 0.409 4.031 0.131 0.700 0.092 0.909
Avg Annual HUs 0.424 0.000 0.546 0.305 0.081
Total Forested Wetland AAHUs 0.729Total Scrub-shrub Wetland AAHUs 0.000
Total Emergent Wetland AAHUsProject Only 0.546
Project + Disposal 0.627
Total AAHUsProject Only 1.275
Project + Disposal 1.356
DRAFT Attachment D – Wetland Mitigation Plan and CE/ICA 4-11Hunting Bayou Flood Risk Management Project

5.0 WITH PROJECT IMPACT ANALYSIS
The with project impact analysis was conducted by projecting the same change in habitat model variables over time as for the “without project” analysis until the patches are impacted by the project according to the anticipated construction schedule. These impacts and changes were made to the habitat model for the time intervals in the period of analysis. The following subsections describe the assumptions and methodology for this analysis.
5.1 With Project Impact Descriptions and AssumptionsAs discussed in Section 3.0, the interim basin construction start date and federal study phased construction schedule were used to define the construction period and base year. This schedule was used to predict when individual wetlands would be impacted, according to their location relative to the project component being built, and the time the excavation task for the component would start. The following sections describe the anticipated timing of impacts due to project construction and those that would occur if disposal sites were used.
5.2 Project Component ImpactsFollowing the construction of the interim basin, the rest of the phased construction schedule reflects implementation of the project components through a series of construction contracts (A through E), starting with construction of the offline detention basin, followed by the channelcomponent, from downstream to upstream. The following describes the anticipated impacts based on this schedule.
5.2.1 Offline Detention TractConstruction of an approximately 20-acre interim detention basin was started in 2009 but did not involve the wetlands of the full 75-acre basin. The interim basin would be expanded to the ultimate 75-acre size starting in 2015 during execution of Contract A, thus removing Wetlands O-1, O-2, and O-5. The ultimate basin would be grass-lined and sloped to drain. For clarity in displaying the mitigation planning, the with project scenario does not include the mitigation wetlands planned to be created in the offline detention site. The function and value of these wetlands is accounted for in the mitigation requirements analysis in Section 9.0.
5.2.2 ChannelTwo wetlands (C-26 and C-27) in the channel are expected to be removed in 2016 with the most downstream channel modification during Contract B. All but two of the wetlands that are located between Homestead Road and Station xx are also expected to be removed in 2016 by the excavation of the channel during Contract B. Finally, I-9 and I-21 would be expected to be removed towards the end of 2017 during execution of Contract C. For simplicity and conservative estimation of impacts, these wetlands were assumed to be removed the first year of the specific contract. The habitat values of the 15 wetlands would be lost at those times.
DRAFT Attachment D – Wetland Mitigation Plan and CE/ICA 5-1Hunting Bayou Flood Risk Management Project

5.2.3 Disposal Site ImpactsHCFCD anticipates using other methods of disposing excavated soil other than purchasing disposal sites for soil placement, such as fill for local construction projects. If use becomes necessary, RECs will be prepared to document evaluation of potential environmental impacts and coordination of the use of these disposal sites. The sites identified for soil disposal in this report may not be used; however, for planning purposes, their use is being analyzed. Information from the disposal site use analysis from the engineering alternative cost estimation discussed in Appendix 4, Cost Estimates, was used to determine the approximate dates of impact to disposal site wetlands, with the assumption that the disposal sites discussed in this report will be the primary means through which excavated soil will be disposed. The disposal site use analysis for the TSP was used. This disposal site use analysis was based on the construction schedule, required disposal volume, and considered use of all of the disposal sites, whether they contain wetlands or not. The sequence of use establishes when disposal sites that do contain wetlands would be impacted. Use of the UPRR adjacent tract, and Disposal Sites 4, 5a and 6, was analyzed. Details and assumptions of the analysis are discussed in Appendix 4, but the following summarizes the key assumptions and considerations for the analysis:
Soil placement at disposal sites will conform to local ordinance and practice for height, maximum sloping, and minimum maintenance buffer width requirements.
The adjacent UPRR tract will be used first, until the volume of fill agreed upon between HCFCD and UPRR is reached. Disposal sites will then be used based on the nearest site first using the shortest practical route from the component construction site, and filled from the side farthest from the entrance towards the entrance.
Need for soil disposal from a given component was set to start the year that the excavation task begins, with volumes for each contract obtained from the detailed engineering cost estimate.
The maximum disposal volumes available at each disposal site were calculated by constraining the disposal pile to a base area equal to the disposal site area and the aforementioned height, slope, and maintenance buffer requirements.
Use of the nearest site(s) maximum disposal volume needed to provide for disposal of the excavation volume of the component being constructed, was calculated, with any unused remainder of the site then applied to satisfy disposal requirements of the next component to be built. This process was carried out until the disposal requirement of the entire project excavation volume was satisfied or disposal site capacities were exhausted.
The analysis shows that the disposal sites provide sufficient capacity to accommodate the anticipated fill under the conditions of the assumptions discussed above, and would be used in the following order: UPRR adjacent disposal site, Disposal Site 4, Disposal Site 5a, and Disposal Site 6. The results of the analysis show that the two emergent wetlands in Disposal Site 4, Patches D-1 and D-2, would be filled with excavated soil in 2015. The habitat values of the 2 wetlands would be lost at that time. Disposal Sites 5a and 6 have no wetland impacts.
DRAFT Attachment D – Wetland Mitigation Plan and CE/ICA 5-2Hunting Bayou Flood Risk Management Project
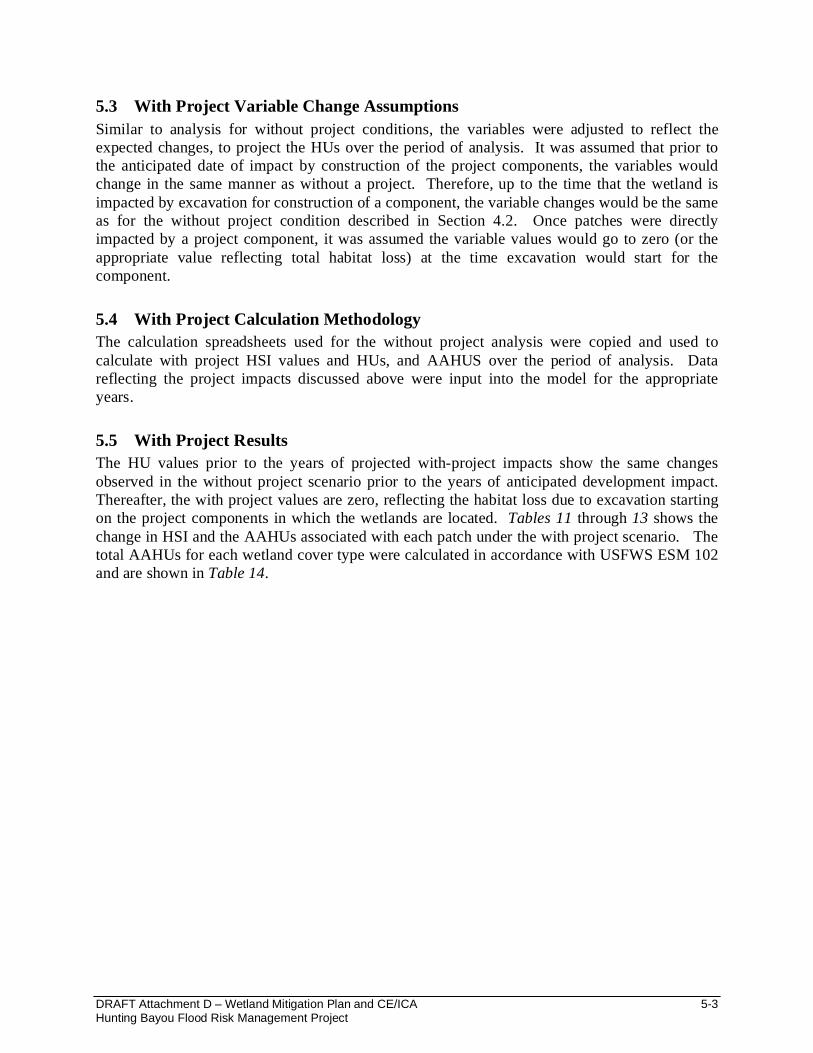
5.3 With Project Variable Change AssumptionsSimilar to analysis for without project conditions, the variables were adjusted to reflect the expected changes, to project the HUs over the period of analysis. It was assumed that prior to the anticipated date of impact by construction of the project components, the variables would change in the same manner as without a project. Therefore, up to the time that the wetland is impacted by excavation for construction of a component, the variable changes would be the same as for the without project condition described in Section 4.2. Once patches were directly impacted by a project component, it was assumed the variable values would go to zero (or the appropriate value reflecting total habitat loss) at the time excavation would start for the component.
5.4 With Project Calculation MethodologyThe calculation spreadsheets used for the without project analysis were copied and used to calculate with project HSI values and HUs, and AAHUS over the period of analysis. Data reflecting the project impacts discussed above were input into the model for the appropriate years.
5.5 With Project ResultsThe HU values prior to the years of projected with-project impacts show the same changes observed in the without project scenario prior to the years of anticipated development impact. Thereafter, the with project values are zero, reflecting the habitat loss due to excavation starting on the project components in which the wetlands are located. Tables 11 through 13 shows the change in HSI and the AAHUs associated with each patch under the with project scenario. The total AAHUs for each wetland cover type were calculated in accordance with USFWS ESM 102 and are shown in Table 14.
DRAFT Attachment D – Wetland Mitigation Plan and CE/ICA 5-3Hunting Bayou Flood Risk Management Project
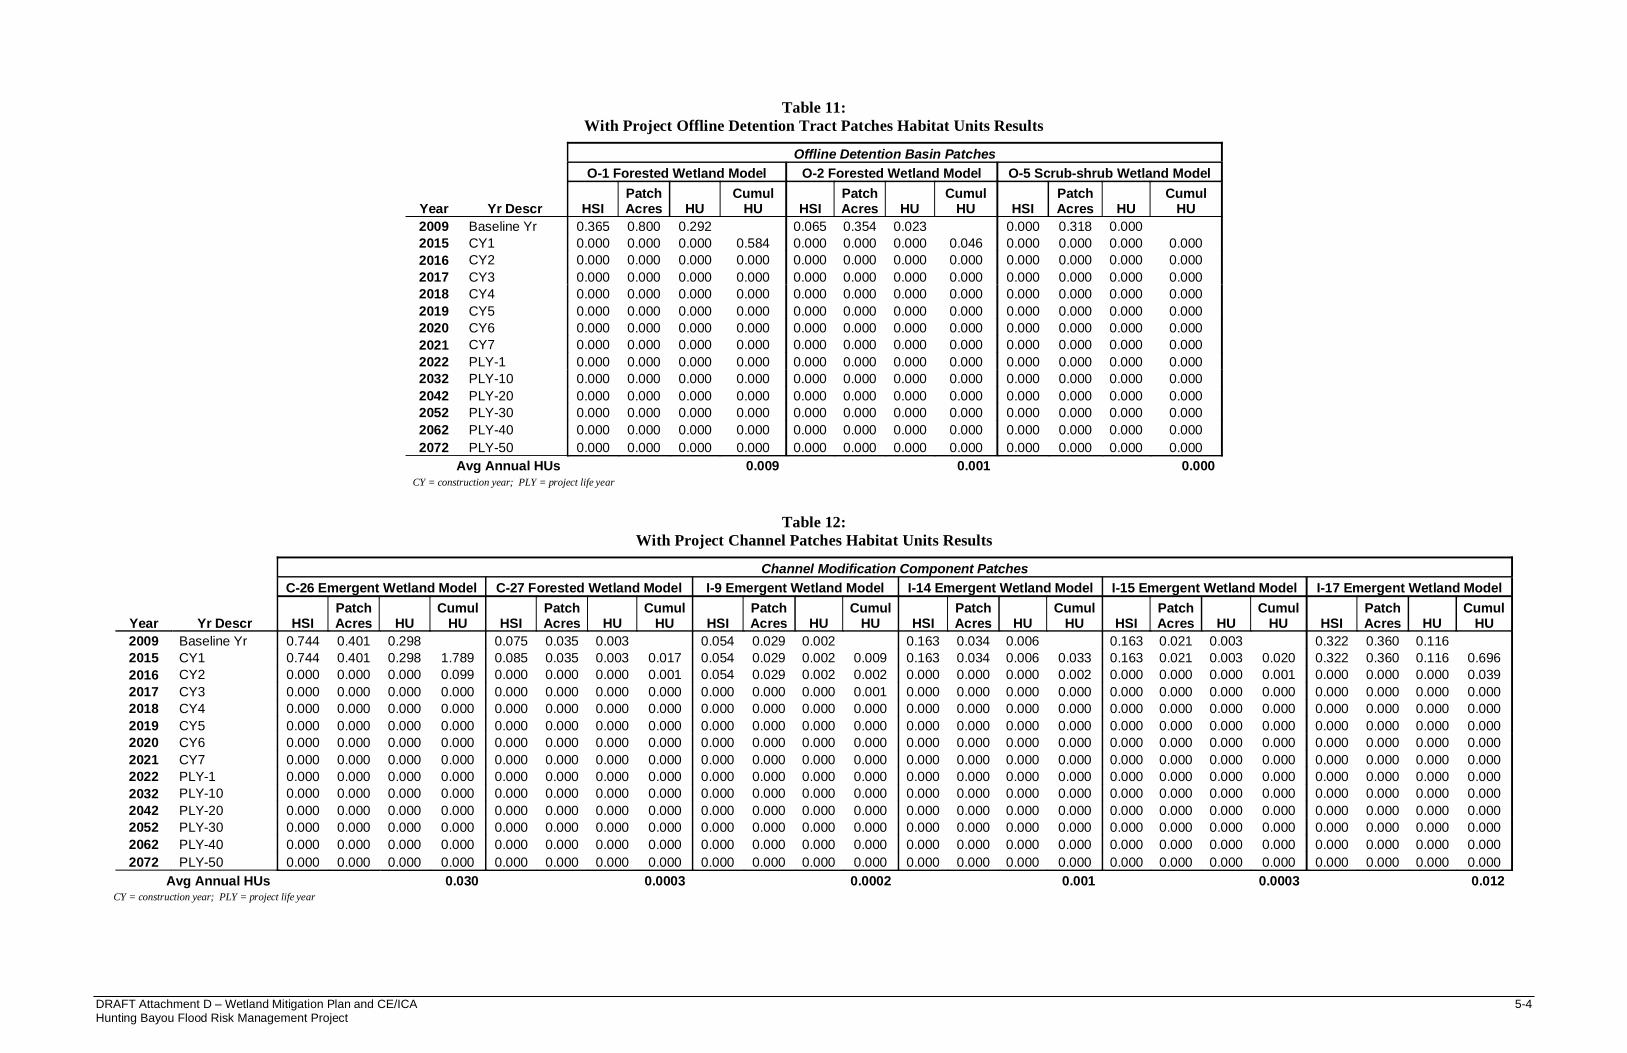
Table 11:With Project Offline Detention Tract Patches Habitat Units Results
Offline Detention Basin PatchesO-1 Forested Wetland Model O-2 Forested Wetland Model O-5 Scrub-shrub Wetland Model
Year Yr Descr HSIPatch Acres HU
CumulHU HSI
Patch Acres HU
CumulHU HSI
Patch Acres HU
CumulHU
2009 Baseline Yr 0.365 0.800 0.292 0.065 0.354 0.023 0.000 0.318 0.0002015 CY1 0.000 0.000 0.000 0.584 0.000 0.000 0.000 0.046 0.000 0.000 0.000 0.0002016 CY2 0.000 0.000 0.000 0.000 0.000 0.000 0.000 0.000 0.000 0.000 0.000 0.0002017 CY3 0.000 0.000 0.000 0.000 0.000 0.000 0.000 0.000 0.000 0.000 0.000 0.0002018 CY4 0.000 0.000 0.000 0.000 0.000 0.000 0.000 0.000 0.000 0.000 0.000 0.0002019 CY5 0.000 0.000 0.000 0.000 0.000 0.000 0.000 0.000 0.000 0.000 0.000 0.0002020 CY6 0.000 0.000 0.000 0.000 0.000 0.000 0.000 0.000 0.000 0.000 0.000 0.0002021 CY7 0.000 0.000 0.000 0.000 0.000 0.000 0.000 0.000 0.000 0.000 0.000 0.0002022 PLY-1 0.000 0.000 0.000 0.000 0.000 0.000 0.000 0.000 0.000 0.000 0.000 0.0002032 PLY-10 0.000 0.000 0.000 0.000 0.000 0.000 0.000 0.000 0.000 0.000 0.000 0.0002042 PLY-20 0.000 0.000 0.000 0.000 0.000 0.000 0.000 0.000 0.000 0.000 0.000 0.0002052 PLY-30 0.000 0.000 0.000 0.000 0.000 0.000 0.000 0.000 0.000 0.000 0.000 0.0002062 PLY-40 0.000 0.000 0.000 0.000 0.000 0.000 0.000 0.000 0.000 0.000 0.000 0.0002072 PLY-50 0.000 0.000 0.000 0.000 0.000 0.000 0.000 0.000 0.000 0.000 0.000 0.000
Avg Annual HUs 0.009 0.001 0.000CY = construction year; PLY = project life year
Table 12:With Project Channel Patches Habitat Units Results
Channel Modification Component PatchesC-26 Emergent Wetland Model C-27 Forested Wetland Model I-9 Emergent Wetland Model I-14 Emergent Wetland Model I-15 Emergent Wetland Model I-17 Emergent Wetland Model
Year Yr Descr HSIPatch Acres HU
CumulHU HSI
Patch Acres HU
CumulHU HSI
Patch Acres HU
CumulHU HSI
Patch Acres HU
CumulHU HSI
Patch Acres HU
CumulHU HSI
Patch Acres HU
CumulHU
2009 Baseline Yr 0.744 0.401 0.298 0.075 0.035 0.003 0.054 0.029 0.002 0.163 0.034 0.006 0.163 0.021 0.003 0.322 0.360 0.1162015 CY1 0.744 0.401 0.298 1.789 0.085 0.035 0.003 0.017 0.054 0.029 0.002 0.009 0.163 0.034 0.006 0.033 0.163 0.021 0.003 0.020 0.322 0.360 0.116 0.6962016 CY2 0.000 0.000 0.000 0.099 0.000 0.000 0.000 0.001 0.054 0.029 0.002 0.002 0.000 0.000 0.000 0.002 0.000 0.000 0.000 0.001 0.000 0.000 0.000 0.0392017 CY3 0.000 0.000 0.000 0.000 0.000 0.000 0.000 0.000 0.000 0.000 0.000 0.001 0.000 0.000 0.000 0.000 0.000 0.000 0.000 0.000 0.000 0.000 0.000 0.0002018 CY4 0.000 0.000 0.000 0.000 0.000 0.000 0.000 0.000 0.000 0.000 0.000 0.000 0.000 0.000 0.000 0.000 0.000 0.000 0.000 0.000 0.000 0.000 0.000 0.0002019 CY5 0.000 0.000 0.000 0.000 0.000 0.000 0.000 0.000 0.000 0.000 0.000 0.000 0.000 0.000 0.000 0.000 0.000 0.000 0.000 0.000 0.000 0.000 0.000 0.0002020 CY6 0.000 0.000 0.000 0.000 0.000 0.000 0.000 0.000 0.000 0.000 0.000 0.000 0.000 0.000 0.000 0.000 0.000 0.000 0.000 0.000 0.000 0.000 0.000 0.0002021 CY7 0.000 0.000 0.000 0.000 0.000 0.000 0.000 0.000 0.000 0.000 0.000 0.000 0.000 0.000 0.000 0.000 0.000 0.000 0.000 0.000 0.000 0.000 0.000 0.0002022 PLY-1 0.000 0.000 0.000 0.000 0.000 0.000 0.000 0.000 0.000 0.000 0.000 0.000 0.000 0.000 0.000 0.000 0.000 0.000 0.000 0.000 0.000 0.000 0.000 0.0002032 PLY-10 0.000 0.000 0.000 0.000 0.000 0.000 0.000 0.000 0.000 0.000 0.000 0.000 0.000 0.000 0.000 0.000 0.000 0.000 0.000 0.000 0.000 0.000 0.000 0.0002042 PLY-20 0.000 0.000 0.000 0.000 0.000 0.000 0.000 0.000 0.000 0.000 0.000 0.000 0.000 0.000 0.000 0.000 0.000 0.000 0.000 0.000 0.000 0.000 0.000 0.0002052 PLY-30 0.000 0.000 0.000 0.000 0.000 0.000 0.000 0.000 0.000 0.000 0.000 0.000 0.000 0.000 0.000 0.000 0.000 0.000 0.000 0.000 0.000 0.000 0.000 0.0002062 PLY-40 0.000 0.000 0.000 0.000 0.000 0.000 0.000 0.000 0.000 0.000 0.000 0.000 0.000 0.000 0.000 0.000 0.000 0.000 0.000 0.000 0.000 0.000 0.000 0.0002072 PLY-50 0.000 0.000 0.000 0.000 0.000 0.000 0.000 0.000 0.000 0.000 0.000 0.000 0.000 0.000 0.000 0.000 0.000 0.000 0.000 0.000 0.000 0.000 0.000 0.000
Avg Annual HUs 0.030 0.0003 0.0002 0.001 0.0003 0.012CY = construction year; PLY = project life year
DRAFT Attachment D – Wetland Mitigation Plan and CE/ICA 5-4Hunting Bayou Flood Risk Management Project

Table 12 (continued):With Project Channel Patches Habitat Units Results (continued)
Channel Modification Component Patches (continued)I-18 Emergent Wetland Model I-19 Emergent Wetland Model I-20 Emergent Wetland Model I-21 Forested Wetland Model
Year Yr Descr HSIPatch Acres HU
CumulHU HSI
Patch Acres HU
CumulHU HSI
Patch Acres HU
CumulHU HSI
Patch Acres HU
CumulHU
2009 Baseline Yr 0.232 0.026 0.006 0.153 0.751 0.115 0.010 0.049 0.000 0.325 0.493 0.1602015 CY1 0.232 0.026 0.006 0.036 0.153 0.751 0.115 0.689 0.010 0.049 0.000 0.003 0.365 0.493 0.180 1.0202016 CY2 0.000 0.000 0.000 0.002 0.000 0.000 0.000 0.038 0.010 0.000 0.000 0.000 0.375 0.493 0.185 0.1822017 CY3 0.000 0.000 0.000 0.000 0.000 0.000 0.000 0.000 0.010 0.000 0.000 0.000 0.000 0.000 0.000 0.0622018 CY4 0.000 0.000 0.000 0.000 0.000 0.000 0.000 0.000 0.000 0.000 0.000 0.000 0.000 0.000 0.000 0.0002019 CY5 0.000 0.000 0.000 0.000 0.000 0.000 0.000 0.000 0.000 0.000 0.000 0.000 0.000 0.000 0.000 0.0002020 CY6 0.000 0.000 0.000 0.000 0.000 0.000 0.000 0.000 0.000 0.000 0.000 0.000 0.000 0.000 0.000 0.0002021 CY7 0.000 0.000 0.000 0.000 0.000 0.000 0.000 0.000 0.000 0.000 0.000 0.000 0.000 0.000 0.000 0.0002022 PLY-1 0.000 0.000 0.000 0.000 0.000 0.000 0.000 0.000 0.000 0.000 0.000 0.000 0.000 0.000 0.000 0.0002032 PLY-10 0.000 0.000 0.000 0.000 0.000 0.000 0.000 0.000 0.000 0.000 0.000 0.000 0.000 0.000 0.000 0.0002042 PLY-20 0.000 0.000 0.000 0.000 0.000 0.000 0.000 0.000 0.000 0.000 0.000 0.000 0.000 0.000 0.000 0.0002052 PLY-30 0.000 0.000 0.000 0.000 0.000 0.000 0.000 0.000 0.000 0.000 0.000 0.000 0.000 0.000 0.000 0.0002062 PLY-40 0.000 0.000 0.000 0.000 0.000 0.000 0.000 0.000 0.000 0.000 0.000 0.000 0.000 0.000 0.000 0.0002072 PLY-50 0.000 0.000 0.000 0.000 0.000 0.000 0.000 0.000 0.000 0.000 0.000 0.000 0.000 0.000 0.000 0.000
Avg Annual HUs 0.001 0.012 0.0001 0.020CY = construction year; PLY = project life year
Table 13:With Project Disposal Patches Habitat Units Results
Disposal Site 4 PatchesD-1 Emergent Wetland Model D-2 Emergent Wetland Model
Year Yr Descr HSIPatch Acres HU
CumulHU HSI
Patch Acres HU
CumulHU
2009 Baseline Yr 0.099 0.453 0.045 0.015 0.247 0.0042015 CY1 0.000 0.000 0.000 0.089 0.000 0.000 0.000 0.0072016 CY2 0.000 0.000 0.000 0.000 0.000 0.000 0.000 0.0002017 CY3 0.000 0.000 0.000 0.000 0.000 0.000 0.000 0.0002018 CY4 0.000 0.000 0.000 0.000 0.000 0.000 0.000 0.0002019 CY5 0.000 0.000 0.000 0.000 0.000 0.000 0.000 0.0002020 CY6 0.000 0.000 0.000 0.000 0.000 0.000 0.000 0.0002021 CY7 0.000 0.000 0.000 0.000 0.000 0.000 0.000 0.0002022 PLY-1 0.000 0.000 0.000 0.000 0.000 0.000 0.000 0.0002032 PLY-10 0.000 0.000 0.000 0.000 0.000 0.000 0.000 0.0002042 PLY-20 0.000 0.000 0.000 0.000 0.000 0.000 0.000 0.0002052 PLY-30 0.000 0.000 0.000 0.000 0.000 0.000 0.000 0.0002062 PLY-40 0.000 0.000 0.000 0.000 0.000 0.000 0.000 0.0002072 PLY-50 0.000 0.000 0.000 0.000 0.000 0.000 0.000 0.000
Avg Annual HUs 0.001 0.0001CY = construction year; PLY = project life year
DRAFT Attachment D – Wetland Mitigation Plan and CE/ICA 5-5Hunting Bayou Flood Risk Management Project

Table 14:With Project Average Annual Habitat Units by TSP Component and Cover Type
Offline Detention Channel Disposal Site 4Forested Wetlands Scrub-Shrub Wetlands Emergent Wetlands Forested Wetlands Emergent Wetlands
Year Yr Descr HSI Acres HUCumulative
HU HSI Acres HUCumulative
HU HSI Acres HUCumulative
HU HSI Acres HUCumulative
HU HSI Acres HUCumulative
HU2009 Baseline Yr 0.273 1.154 0.315 0.000 0.318 0.000 0.327 1.672 0.546 0.308 0.528 0.163 0.069 0.700 0.0482015 CY1 0.000 0.000 0.000 0.630 0.000 0.000 0.000 0.000 0.327 1.672 0.546 3.276 0.346 0.528 0.183 1.037 0.000 0.000 0.000 0.0972016 CY2 0.000 0.000 0.000 0.000 0.000 0.000 0.000 0.000 0.054 0.029 0.002 0.199 0.375 0.493 0.185 0.184 0.000 0.000 0.000 0.0002017 CY3 0.000 0.000 0.000 0.000 0.000 0.000 0.000 0.000 0.000 0.000 0.000 0.001 0.000 0.000 0.000 0.062 0.000 0.000 0.000 0.0002018 CY4 0.000 0.000 0.000 0.000 0.000 0.000 0.000 0.000 0.000 0.000 0.000 0.000 0.000 0.000 0.000 0.000 0.000 0.000 0.000 0.0002019 CY5 0.000 0.000 0.000 0.000 0.000 0.000 0.000 0.000 0.000 0.000 0.000 0.000 0.000 0.000 0.000 0.000 0.000 0.000 0.000 0.0002020 CY6 0.000 0.000 0.000 0.000 0.000 0.000 0.000 0.000 0.000 0.000 0.000 0.000 0.000 0.000 0.000 0.000 0.000 0.000 0.000 0.0002021 CY7 0.000 0.000 0.000 0.000 0.000 0.000 0.000 0.000 0.000 0.000 0.000 0.000 0.000 0.000 0.000 0.000 0.000 0.000 0.000 0.0002022 PLY-1 0.000 0.000 0.000 0.000 0.000 0.000 0.000 0.000 0.000 0.000 0.000 0.000 0.000 0.000 0.000 0.000 0.000 0.000 0.000 0.0002032 PLY-10 0.000 0.000 0.000 0.000 0.000 0.000 0.000 0.000 0.000 0.000 0.000 0.000 0.000 0.000 0.000 0.000 0.000 0.000 0.000 0.0002042 PLY-20 0.000 0.000 0.000 0.000 0.000 0.000 0.000 0.000 0.000 0.000 0.000 0.000 0.000 0.000 0.000 0.000 0.000 0.000 0.000 0.0002052 PLY-30 0.000 0.000 0.000 0.000 0.000 0.000 0.000 0.000 0.000 0.000 0.000 0.000 0.000 0.000 0.000 0.000 0.000 0.000 0.000 0.0002062 PLY-40 0.000 0.000 0.000 0.000 0.000 0.000 0.000 0.000 0.000 0.000 0.000 0.000 0.000 0.000 0.000 0.000 0.000 0.000 0.000 0.0002072 PLY-50 0.000 0.000 0.000 0.000 0.000 0.000 0.000 0.000 0.000 0.000 0.000 0.000 0.000 0.000 0.000 0.000 0.000 0.000 0.000 0.000
Avg Annual HUs 0.010 0.0000 0.0552 0.020 0.0015
Total Forested Wetland AAHUs 0.030Total Scrub-shrub Wetland AAHUs 0.000
Total Emergent Wetland AAHUsProject Only 0.055
Project + Disposal 0.057
Total AAHUsProject Only 0.085
Project + Disposal 0.087
DRAFT Attachment D – Wetland Mitigation Plan and CE/ICA 5-6Hunting Bayou Flood Risk Management Project

6.0 CONSIDERATION OF CLIMATE CHANGE
The USACE issued Engineering Circular (EC) 1165-2-212 regarding the consideration of the effects of sea-level rise on water control and management in civil works. Though this policyrequires consideration of sea-level rise in projects under tidal influence, and the TSP is not in a tidal reach of Hunting Bayou, the impacts of climate change on model variables were considered for this mitigation analysis. Three reports were reviewed to determine whether model variables should be changed in response to climate change predictions. The first report, Integrated Assessment of the Climate Change Impacts on the Gulf Coast Region (Ning et. al. 2003), published by the Gulf Coast Climate Change Assessment Council (now known as the Gulf Coast Regional Climate Change Council, or GCRCC) focused largely on changes to coastal and estuarine environments, but contained some general predictions of temperature and precipitation changes in Texas. The average seasonal temperature was predicted to increase by 3 to 4 ºF from winter through fall, while average seasonal precipitation was predicted to increase by 10 percent during spring and summer by the Year 2100 (the seasons in which data should have been collected for applicable model variables). These predictions resulted from calculations of one model.
Another paper, the Intergovernmental Panel on Climate Change (IPCC) Fourth Assessment Report: Climate Change 2007 (IPCC 2007), published by the United Nations organization, IPCC, provides a summary of multi-model projections of climate change for general meteorological parameters (temperature, precipitation, etc.) as well as geophysical indicators (hydrological runoff, soil moisture, etc.). Projections are presented in terms of multi-model consensus (e.g. areas predicted to have increase/decrease according to >66 percent of models run). A slight decrease in precipitation of between 5 and 10 percent is projected for the Texas Gulf Coast area by the majority of model runs for yearly, winter, and summer month averages for the period of 2090-2099. A projection for spring is not provided. The projection of a slight decrease contradicts the predictions of the GCRCC report.
The third report reviewed was the Impacts of Climate Change and Variability on Transportation Systems and Infrastructure: Gulf Coast Study, Phase I (USCCSP 2008), by the United States Department of Transportation (USDOT), which provided multi-model projections of the same general climate parameters as the IPCC report. The USDOT study used the same Gulf Coast relevant models employed in the IPCC report, with adjustment to some input data and parameters to reflect local or regional climate change knowledge and research, to project climate changes for Gulf Coast states. The USDOT study cites equivocal results of decreases and increases in average precipitation predicted by the various models, with continued difficulty forecasting change in the next 50 to 100 years.
The habitat model parameters most directly related to precipitation change are the percent of the year with surface water present (PERSWATER) in the Forested Wetland and Emergent Wetland models, and water regime (WATERREG) in the Emergent Wetland model. Translating a change in average precipitation to a change in the propensity or ability of a wetland to pool surface water would be complex, considering the many factors involved in the interception and retention of rainfall for a particular wetland. Such factors may include soil moisture retention along the runoff path and in the wetland soil, local evapotransipration by available solar radiation and wetland and upland vegetation.
DRAFT Attachment D – Wetland Mitigation Plan and CE/ICA 6-1Hunting Bayou Flood Risk Management Project

All of the climate change studies reviewed predicted a temperature increase for the Gulf Coast Texas region ranging between 1.5°C ± 1°C (2.7°F ± 1.8°F) and 3-3.5ºC (5.4º -6.3ºF). Increased temperature results in decreased soil moisture, which increases the capacity of soils to accept rainfall before saturating enough to produce runoff, as predicted in hydrological runoff equations through parameters such as antecedent moisture condition. This would tend to decrease runoff intercepted by a wetland for a given precipitation, which would counteract precipitation increase. Increased temperature would also lead to increased evapotranspiration, which also decreases soil moisture. Increase in atmospheric carbon dioxide (CO2) is in all of the scenarios used for modeling climate change, including those in all three reports reviewed, and is a driver of temperature increase predicted in climate change models. Increased CO2 has been shown to often result in decreased leaf conductance (transfer of water vapor) through increased closure of leaf stomas (pores), which would tend to reduce evapotranspiration. The effect of increased CO2on reducing evapotranspiration, which counteracts increased evapotranspiration by temperature increases, continues to be studied in climate change research to improve large scale climate models. Considering the contradictory results for future projections of precipitation change, the complex relationships involved between precipitation and runoff retention, and the counteracting influences of temperature and CO2 increases on evapotranspiration and soil moisture, predicting a change in PERSWATER would be speculative. The WATERREG variable is an integer representing 6 different conditions, from permanently to intermittently flooded. Predicting a change from one regime to another would be speculative and subjective. Therefore, a change for these parameters is not recommended or taken into account in this mitigation analysis.
To assess the potential magnitude of not considering climate change in habitat model variable changes, some of the variables discussed above were changed in the Emergent Wetland model for Patch C-26, which had nonzero HSI scores from the relevant parameters. The following assumptions were tested, with the indicated results:
10 percent change in precipitation in spring and summer (from the GCRCC model) results only in a 10 percent increase in PERSWATER – No change in HSI.
10 percent change in precipitation in spring and summer results in both a 10 percent increase in PERSWATER and change of WATERREG from 6 to 5 – No change in HSI.
Temperature increase and IPCC and USDOT predicted declines in soil moisture, would not be able to change WATERREG as it already has the driest condition variable value –HSI does not change.
IPCC/USDOT predicted declines in soil moisture change PERSWATER from 75 percent to 65 percent –HSI decreases from 0.74 to 0.69, a 6.7 percent decrease. Though this is a relatively small change, assuming no change in the variable would actually be more conservative with respect to crediting the wetlands functional value.
Therefore, the magnitude of predicted global climate changes in the Gulf Coast area would not be expected to substantially affect habitat model scores in this mitigation analysis, if quantitatively implemented in habitat model variables. Given the results of this sensitivity test, adopting changes driven by the literature predictions would be less conservative with respect to crediting the wetlands functional value. Therefore no change in variable values due to climate change was implemented.
DRAFT Attachment D – Wetland Mitigation Plan and CE/ICA 6-2Hunting Bayou Flood Risk Management Project

7.0 DETERMINATION OF SIGNIFICANT NET LOSSES -NET PROJECT IMPACT ON WETLANDS
The without project and with project wetland AAHU results were used to calculate the net impacts of the proposed project on wetlands. The AAHU values and net impacts are summarized in Table 15. The net impacts to wetlands, as measured by AAHU values, were calculated by subtracting the without project AAHU value for a given patch from the with project AAHU value to determine the net change. The results show that there would be a reduction of 1.190AAHUs from construction of the TSP components. The 1.190 AAHU value represents 93 percent of the without project AAHUs calculated for the wetlands in the project area. The results also show a reduction of 0.079 AAHUs from use of the disposal sites. The 0.079 AAHU valuerepresents 98 percent of the without project disposal site AAHUs. Construction of the project and use of the disposal sites, together, would result in a total reduction of 1.269 AAHUs, which represents 94 percent of the without project AAHUs for the wetlands in these areas.
Table 15:Summary of Average Annual Habitat Units and Acres of Wetlands Impacted by TSP
Project ComponentWithout Project With Project Net ImpactAAHU Acres AAHU Acres AAHU Acres
Offline DetentionForested Wetlands 0.424 1.154 0.010 0.000 -0.414 -1.154
Scrub-shrub Wetlands 0.000 0.318 0.000 0.000 0.000 -0.318Channel Modification
Emergent Wetlands 0.546 1.672 0.055 0.000 -0.491 -1.672Forested Wetlands 0.305 0.528 0.020 0.000 -0.285 -0.528
Disposal Site 4Emergent Wetlands 0.081 0.700 0.0015 0.000 -0.079 -0.700
Total Forested Wetlands 0.729 1.682 0.030 0.000 -0.699 -1.682Total Scrub-shrub Wetlands 0.000 0.318 0.000 0.000 0.000 -0.318
Total Emergent WetlandsProject Only 0.546 1.672 0.055 0.000 -0.491 -1.672
Project + Disposal 0.627 2.372 0.057 0.000 -0.570 -2.372
Total WetlandsProject Only 1.275 3.672 0.085 0.000 -1.190 -3.672
Project + Disposal 1.356 4.373 0.087 0.000 -1.269 -4.373
DRAFT Attachment D – Wetland Mitigation Plan and CE/ICA 7-1Hunting Bayou Flood Risk Management Project

8.0 MITIGATION PLANNING OBJECTIVES
In accordance with ER 1105-2-100, mitigation planning objectives are clearly written statements that prescribe specific actions to be taken to avoid and minimize adverse impacts, and identify specific amounts (units of measurement, e.g., habitat units) of compensation required to replace or substitute for remaining, significant unavoidable losses.
Construction of the recommended project would require excavation for channel widening and deepening, and for providing floodwater detention volume. These actions would remove wetland features within the excavated areas. Because of limited undeveloped land in the upstream channel corridor, and the project’s proposed use of most of this available undeveloped land for excavated features, it is not practical to avoid the wetlands within the recommended project boundary by reconfiguring the alternative while still maintaining the same net benefits and costs. A change in channel alignment or location of the detention features would likely require more residential displacements and associated costs. Locating these features farther downstream would reduce the flood damage reduction performance, as the highest damage centers are in the upstream part of the channel. Locating these project components farther downstream in undeveloped areas to address other downstream damage centers would likely impact other wetlands, based on National Wetlands Inventory (NWI) information. Given that some of the wetlands identified in the project area were not mapped by the NWI, it is also likely that more wetland features would be identified in downstream channel-adjacent undeveloped areas. Therefore, with no viable alternatives available to avoid and minimize adverse impacts tothe wetlands within the recommended project boundary, mitigation of these impacts is necessary.
Although the disposal sites are not currently anticipated to be used, the wetland mitigation planning addresses compensation for both the project and disposal site wetland impacts. Mitigation quantities necessary for project-only impacts and project plus disposal site impacts are identified separately for informational purposes. Disposal Site 5a and 6 were reconfigured so that if used, wetlands would not be impacted. If other disposal sites are only partially used, soil placement will be configured to avoid wetlands, if possible.
The objectives for this wetland mitigation plan are the following:
Provide 0.699 AAHUs of forested wetland compensation, as measured by the HSI models used for the baseline habitat assessments, to fully compensate for impacts to forested wetlands from implementation of the recommended project and use of the disposal sites.
Provide 0.570 AAHUs of emergent wetland compensation, as measured by the HSI models used for the baseline habitat assessments, to fully compensate for impacts to emergent wetlands from implementation of the recommended project and use of the disposal sites.
Avoid adverse impacts to the wetland located on the parcel boundary between Disposal Site 5a (northern) and the southern tract, by not placing excavated soil in the wetland, if use of Disposal Site 5a becomes necessary.
DRAFT Attachment D – Wetland Mitigation Plan and CE/ICA 8-1Hunting Bayou Flood Risk Management Project

Avoid adverse impacts to the wetlands located within the property parcels comprisingDisposal Site 6, by not placing excavated soil in the wetlands, if use of Disposal Site 6becomes necessary.
If use of the disposal sites is not necessary, mitigation for wetlands at these sites will not occur. Mitigation planning for the recommended project will be based on HSI AAHUs to meet the USACE planning policy for using models the USACE’s their certification requirements.
DRAFT Attachment D – Wetland Mitigation Plan and CE/ICA 8-2Hunting Bayou Flood Risk Management Project

9.0 MITIGATION REQUIREMENTS ANALYSIS
This section presents an analysis of mitigation strategies and the acreage required to provide full compensation of AAHU losses resulting from the project and disposal site wetland impacts discussed in Section 7.0. This includes a definition of the units of measurement by which mitigation will be measured, and the assumptions, modeling methods, and results to determine the AAHUs provided by implementing the mitigation strategies.
9.1 Units of MeasurementThe units of measurement used to analyze and measure the compensation provided by mitigation are the same as the units used for assessing the without and with project impacts on wetlands. This is the AAHU as measured by the HSI scores of the models discussed in Section 2.1.
9.2 Identification, General Design and Methodology of Mitigation StrategiesThe strategies identified for mitigating wetland impacts include onsite wetland creation, and purchasing mitigation bank credits. The USACE CECW-P Water Resources Development Actof 2007 (WRDA 2007) implementation guidance memorandum, regarding Implementation Guidance for the WRDA 2007- Section 2036(c) Wetlands Mitigation, dated November 6, 2008,requires mitigation planning for Federal civil works studies to consider use of mitigation bank credits first. According to USACE regulatory guidance, the service area for a mitigation bank is considered to be defined by the USGS Hydrologic Unit Code (HUC) in which the mitigation bank is located. The Hunting Bayou watershed lies within the HUC of the Greens Bayou Wetland Mitigation Bank (GBWMB), which has credits available for HCFCD projects. The following mitigation strategies were identified to compensate for wetland impacts:
Onsite Wetland Creation
- mitigate for forested wetland impacts by creating forested wetlands at the confluence of H110-00-00 and Hunting Bayou
- mitigate for forested wetland impacts by creating forested wetlands at the OfflineDetention Tract basin
- mitigate for emergent wetland impacts by creating emergent wetlands at the OfflineDetention Tract basin
GBWMB Credits – mitigate for forested wetlands by purchasing forested wetland credits, and for emergent wetlands by purchasing emergent wetland credits, at theGBWMB
Each strategy is a basic component of the mitigation alternatives that are analyzed with the Cost Effectiveness/Incremental Cost Analysis (CE/ICA). The AAHUs determined by HSI scores, which employ published HEP models, were used to determine justified mitigation to meet the requirement to use USACE-certified models in planning studies and for justifying mitigation.Each strategy, including its general design and habitat modeling methodology, is discussed in more detail in the following sections.
DRAFT Attachment D – Wetland Mitigation Plan and CE/ICA 9-1Hunting Bayou Flood Risk Management Project

9.2.1 Onsite Wetland CreationThis strategy consists of creating forested wetlands and emergent wetlands at two sites within the proposed project right-of-way or on project-adjacent properties owned by the Local Sponsor.The wetlands would generally be designed to impound water to ensure standing water occurs with a rain event or receive recharge from groundwater infiltration if appropriate to the groundwater elevation and soils in the constructed basin bottom. Final design of these wetlands would consider which hydrologic source is more appropriate given the location of the H110 site, or the final location within the offline basin. Wetland designs, soil factors and site preparation discussed in Section 10.3 would be used to achieve the desired hydrologic regime. These measures would optimize hydrological retention to achieve the required percent of the year with standing water, which is the Mink model variable PERSWATER.
Wetlands would be designed and constructed with adequate soil preparation to provide appropriate conditions for successful wetland vegetation and redoximorphic soil conditions. These considerations are discussed in more detail in Section 10.3, which addresses wetland establishment risk factors and design and construction measures to reduce those risks. The site-specific considerations for general design of wetlands at each site are discussed in Section 9.3.The following subsections discuss the general design and habitat modeling methodology for each of the wetland types.
To achieve consistency with other local Federal FRM studies of the Local Sponsor, assumptions for onsite creation were used where possible for the Barred Owl and Swamp Rabbit model variables, as well as variables in the Mink model similar to those in the other models, from the White Oak Bayou HEP Mitigation report.
9.2.1.1 Forested Wetland CreationThe same forested wetland model used for with and without project habitat modeling was also used for the mitigation modeling. However, the assumptions for creation of forested wetlands are different from the assumptions used for the with and without the project model. The primary reason is the mitigation wetland model assumes newly created wetlands (young planted treesand shrubs) in an area with no existing canopy. The with and without project models used variable values for the existing forested wetland, assuming growth rates in an area with existing substantial crown cover. Table 17 summarizes the assumed initial model parameter values and changes used in onsite creation for the forested wetland model variables. The following discusses the assumptions in detail.
CANTREE, DBHTREE, and NUMBERLGTREE
The assumptions for these variables were based on the WOB mitigation plan. Tree and shrub species will be planted as appropriate based on the hydroperiod described in this section and availability at the time of planting, considering the list of tree and shrub species maintained by HCFCD. This list of species has been previously reviewed by resource agencies for use in other HCFCD Section 211(f) studies. With forested wetland creation in an area with no pre-existing canopy, the trees and shrubs are not bounded by neighboring trees and therefore would grow at a faster rate than trees and shrubs within the existing forested wetlands. However, the planted trees would be expected to be smaller than mature vegetation in existing forested wetlands, because of the impracticality, high costs, and lower survival rate of planting mature trees and shrubs. Species like water oak (Quercus nigra), willow oak (Quercus phellos), overcup oak
DRAFT Attachment D – Wetland Mitigation Plan and CE/ICA 9-2Hunting Bayou Flood Risk Management Project

(Quercus lyrata), and swamp chestnut oak (Quercus michauxii) would be planted, depending on the availability at the time of planting on 12-ft by 12-ft spacing, resulting in a density of approximately 300 trees per acre. Based on this spacing, complete canopy coverage is obtained at 6 inches dbh according to consultation with the Texas Forest Service Houston Office cited in the WOB report (Merritt 2007). A linear relationship between canopy cover and dbh was assumed for this analysis, and the initial canopy cover was interpolated from this relationship. The initial tree canopy cover value would be 53 percent and would occur the year the dbh exceeds the USACE tree/sapling dbh size class threshold of 3 inches, discussed for CANSHRUB below. The planted trees would be approximately 2 inches in diameter, or approximately 3 years old. The change in DBHTREE was based on Water oak growth rates (US Forest Service) shown in Table 16 below.
Table 16:Water Oak (Quercus nigra) Growth Rates
DBH Class(inches)
Diameter at Breast Height Growth Rate(inches/year)
0-14 0.60
14-20 0.3120-28 0.29
Source: Burns et al.. 1990
Due to all trees starting out as 2-inch saplings, no large trees (i.e., dbh > 20 inches) would be present until the growth rate establish for dbh resulted in a dbh greater than 20. Assuming a uniform growth rate for all planted trees, at the time the dbh exceeds 20 inches, the planted tree density of 300 trees/acre would result in all 300 trees per acre becoming defined as large trees, which would be the value for NUMBERLRGTREE.
CANEMERVEG and CANSHRUB
The assumptions for the emergent vegetation planting in the WOB mitigation plan were used as initial variable values, and for the initial, unshaded/semishaded growth rate to test whether the overall Mink model score responded to it. This was conducted to assess whether the increase in HSI score would be worth the cost of plantings, especially considering that eventually, the emergent coverage would be expected to decline once the surrounding tree canopy achieves closure. Planting emergent vegetation resulted in only an increase of hundredths in the HSI score, primarily due to the PERSWATER index constraining the overall Mink score. When assumptions for a slow decline in emergent vegetation due to mature tree crown shading were used, the increase was even more negligible. Excluding contribution from this variable to the score, the increase in acreage to achieve the required AAHU offsets was hundredths of an acre. Therefore, the amount of extra tree planting cost to cover this hundredths increase in acreage would be much less than the cost of planting all of the emergent vegetation in the understory of the whole forested wetland. Given the negligible increase in HSI score and the thousands of dollars that planting over the expected acreage would cost, it was determined that emergent vegetation would not be planted under the forested wetland canopy. Therefore, CANEMERVEG would be zero.
DRAFT Attachment D – Wetland Mitigation Plan and CE/ICA 9-3Hunting Bayou Flood Risk Management Project
The assumptions for CANSHRUB were based on the WOB mitigation plan assumptions used in their scrub-shrub modeling for forested wetland creation. Because the planted trees start out as 2-inch saplings less than 20-feet tall, they would be considered in the same size class as shrubs by USACE wetland delineation criteria (USACE Environmental Lab 1987). Therefore, until DBHTREE exceeds the 3-inch threshold for this woody plant class, the canopy of the saplings would be considered to provide shrub canopy. The linear relationship between canopy cover and dbh and the complete canopy cover at 6 inches dbh for the spacing assumed, as discussed for CANTREE above, was used to obtain the initial crown cover of planted saplings.
PERSWATER
Though the optimal value for PERSWATER is 75 percent or greater, this would be too frequent a hydroperiod for some of the species intended to be planted for forested wetland creation, such as water oak, to achieve the best survival and growth rates. The more water-tolerant species such as overcup oak, could be selected, but to be able to plant a more diverse variety of wetland trees, a less frequent hydroperiod in the range of 30 percent to 50 percent was investigated. The forested wetland model was used with the values discussed in this section for all the other variables for onsite PFO creation to test the sensitivity of the AAHUs produced (and acres required for compensation) to changing PERSWATER within the 30 percent to 50 percent range.The acreage required to offset the forested wetland AAHUs impacted by the project and disposalsites at 50 percent PERSWATER was 1.53 acres. This increases to 2.72 acres when PERSWATER is reduced to 30 percent. Therefore, PERSWATER was set to a value of 50percent to maximize the compensation efficiency of the created forested wetland.
CANEDGE
Because of the developed or maintained nature of the areas in which the emergent and forested wetlands would be located, preexisting tree or shrub cover surrounding the wetland, which is measured as CANEDGE, would not be available. H110-00-00/Hunting Bayou Confluence site is surrounded by residential development, and the offline basin would generally be planted with herbaceous cover. Planting trees or shrubs for CANEDGE would add cost to the wetland creation. Therefore, to investigate the worth of this extra planting cost, the sensitivity of the AAHUs produced and acreage required for compensation to changing CANEDGE was investigated. The forested wetland model was used with the values discussed in this section for all the other variables for onsite PFO creation and CANEDGE was changed between 100 and 0 percent. The score and acreage required to offset the forested wetland AAHUs impacted by the project and disposal sites did not change across the range of CANEDGE. Because the equation that calculates the HSI score from the water and cover indices uses the minimum of the two, the HSI is constrained by the lower score of the water index, which is determined from PERSWATER. The PERSWATER value of 50 percent results in a water index score lower than the cover index score resulting from changing CANEDGE to 0 given the other assumed variable values. Therefore, the Mink model score does not respond to CANEDGE, and it would not be cost or compensation-effective to plant trees or shrubs to maximize this variable in forested wetland creation. Thus, CANEDGE was set to 0 percent.
DRAFT Attachment D – Wetland Mitigation Plan and CE/ICA 9-4Hunting Bayou Flood Risk Management Project

Table 17:Forested Wetland Creation Assumed Habitat Model Parameters
Variable Initial value Description/Expected Change Species
CANTREE 53 percent once trees reach 3inches dbh
Percent canopy cover of overstory trees
Barred Owl and Mink
Increase 10 percent/year
DBHTREE 2 inches dbh Mean dbh of overstory trees Barred OwlIncrease according to Table 16
NUMBERLGTREE 0 dbh 0.4 Barred Owl
Increases once DBHTREE > 20inches for 300 trees/acre density.
PERSWATER 50 percent. Percent of year with surface water present (between 0 and 100 percent) Mink
No change
CANSHRUB 33 percent when trees are saplings <3 inches dbh Percent shrub canopy cover Mink
Increase 10 percent/year
CANEMERVEG 0 percentPercent canopy cover of emergent vegetation (between 0 and 100 percent)
Mink
No change. Emergent vegetation in forested wetland will not be planted purposefully
CANEDGE 0 percent
Percent canopy cover of trees and shrubs within 100 m (328 ft.) of wetland edge (between 0 and 100 percent)
Mink
No change. No shrubs or trees will purposely planted to provide CANEDGE
9.2.1.2 Emergent Wetland CreationThe same emergent wetland model used for with and without project habitat modeling was used for the mitigation modeling. Similar to forested wetland creation, emergent wetland creation model assumptions are different from that used in the with and without project models. This is due to a creation scenario involving growth in a relatively unconstrained environment compared to one in an existing emergent marsh with established vegetation. Table 18 summarizes the assumed initial model parameter values and changes used in onsite creation for the emergent wetland model variables. The following discusses the assumptions in detail.
CANEMERVEG, CANHERB and HTHERB
The assumptions for these variables were based on the WOB mitigation plan assumptions for the Swamp Rabbit emergent wetland model variables percent herbaceous canopy cover and average height herbaceous vegetation, for the emergent wetland creation. Since the herbaceous vegetation planted within a wetland is emergent vegetation, the percent herbaceous coverage would represent the percent canopy of emergent vegetation, providing the value for CANEMERVEG. The initial values for CANERMEVEG and CANHERB are based on the density of plantings. The emergent wetland area would be planted with emergent species such as
DRAFT Attachment D – Wetland Mitigation Plan and CE/ICA 9-5Hunting Bayou Flood Risk Management Project

squarestem eleocharis (Eleocharis quadrangulata), beaksedges (Rhynchospora sp.), and rushes (Juncus sp.), depending on availability at the time of planting, on 3-foot centers, resulting in 4,840 plants per acre. Each planted plug or sprig was assumed to cover 1 ft2, and given the 3-foot center spacing (i.e., 3 ft x 3 ft), would yield 11 percent cover, which is the assumed initial value for CANEMERVEG and CANHERB. Full canopy cover would be expected in 1 to 2 years, resulting in CANEMERVEG of 100 percent. Rapid coverage of planted species in managed conditions is commensurate with local GBWMB experience in replanted plots following feral hog damage according to staff. It is also corroborated in literature, with one study observing four species, including spikerush, achieving 80 percent coverage in their respective planted plots one year (Wetland Solutions Inc. 2008). The initial height of planted herbaceous species was assumed to be 2.5 feet. Growing at a 32 percent rate, percent optimal height of 3.3 ft (1 m) is assumed to be reached at one year. This is commensurate with commercial nursery and USDA fact sheets citing several species under these genera as rapidly growing or achieving mature height in 1 to 3 years. With planting of plugs and sprigs (as opposed to seed), the attainment of mature height would be rapid.
WATERREG and PERSWATER
The Mink model consists of a water index, which is influenced solely by PERSWATER, and a cover index that is partially influenced by CANEDGE. The optimal value for PERSWATER is 75 percent or greater. Since the emergent wetland would be located next to drainage ways with the intent to create persistent and semi-permanent hydrology, the PERSWATER initial value was assumed to be 80 percent. The value would not be expected to change for the same reasons explained for this variable in the Without Project section. Given that the growing season in this warm region is virtually year-round, standing water 80 percent of the year would be consistent with the Cowardin classification system definition of semi-permanently flooded, which is surface water persisting throughout the growing season in most years (Cowardin 1979). Therefore,WATERREG is assigned the value of 3, or semi-permanently flooded, which is also assumed to be constant throughout the period of analysis.
CANEDGE
The emergent wetland model was used with the values discussed in this section for all the other variables for onsite emergent creation. The acreage required to offset the emergent wetland AAHUs impacted by the project and disposal sites changed from 0.87 acre to 0.95 acre when CANEDGE was changed from 100 to 0 percent. This is a required increase of only 0.08 acre if no CANEDGE is planted, which would not significantly increase emergent wetland planting costs compared to the cost of planting the number of trees or shrubs required to provide a 100-meter planting zone around the wetland for CANEDGE. Therefore, it is not cost orcompensation-effective to plant trees and shrubs solely to maximize CANEDGE for onsite emergent wetland creation. However, the created forested wetland can be located adjacent to the emergent wetland to provide tree cover, which would provide a CANEDGE value in the emergent wetland model. Therefore, CANEDGE will be determined using the percent canopy (CANTREE) of the forested wetland adjacent to the emergent wetland. Because one side of the emergent wetland would be located adjacent to a drainage way that must be maintained tree and shrub-free, the CANEDGE will be an average of the forested CANTREE and 0 percent for the edge adjacent to the drainage way.
DRAFT Attachment D – Wetland Mitigation Plan and CE/ICA 9-6Hunting Bayou Flood Risk Management Project

Table 18:Emergent Wetland Creation Assumed Habitat Model Parameters
Variable Initial Value Description Species
PERSWATER 80-100 percent Percent of Year with Surface Water Present (between 0 and 100) Mink
No change
CANEMERVEG 11 percent according toplanting density
Percent Canopy Cover of Emergent Vegetation(between 0 and 100) Mink
100 percent cover in 1 yr
CANEDGE
33 percent from starting forested wetland sapling crown for one side, 0percent for side adjacent to drainage
Percent Canopy Cover of Trees and Shrubs within 100 m of Wetland Edge (between 0 and 100) Mink
Will follow planted CANSHRUB and CANTREE of adjacent to wetland for one side, 0 percentfor side adjacent to drainage
CANHERB_SR 11 percent according toplanting density Percent herbaceous canopy closure Swamp Rabbit
100 percent cover in 1 year
HTHERB_SR 2.5 ft Average height of herbaceous canopy cover Swamp Rabbit
32 percent growth until optimal 3.3 ft achieved
WATERREG 3 = SemipermanentlyFlooded Water regime Swamp Rabbit
No change
9.2.2 GBWMB CreditsAccording to mitigation bank staff, the GBWMB has credits available in Subdivision B. This subdivision consists of the Water Quality Facility (WQF), which contains primarily emergent wetlands, and the Transitional Forest, which contains primarily forested wetland. The report White Oak Bayou Federal Flood Control Project HCFCD Project ID E100-00-00-Y001 Habitat Evaluation Procedure Analysis Project Impact and Mitigation Alternatives Analysis, Harris County, Texas, dated July 2007, hereafter referred to as the White Oak Bayou (WOB) Mitigation report, provides the mitigation planning for this Federal project, for which habitat modeling and mitigation analysis included the Barred Owl and Swamp Rabbit models.
The report contains Barred Owl and Swamp Rabbit data collected at GBWMB Subdivision B.Reports of quarterly monitoring conducted at GBWMB also contain collected data that wereuseful for determining model variable values for the Mink model. These include percent cover of wetland emergent herbaceous vegetation for CANEMERGVEG, tree and understory cover in the transitional forest adjacent to the emergent wetland for CANEDGE, and water level measurements and observations for establishing PERSWATER.
DRAFT Attachment D – Wetland Mitigation Plan and CE/ICA 9-7Hunting Bayou Flood Risk Management Project

9.2.2.1 Forested Wetland CreditsData from the Barred Owl forested wetland data collection sheets for GBWMB Subdivision B in the WOB Mitigation report were used for initial model data values. GBWMB staff observations indicate that the transitional forested wetland is drier than the emergent wetland, and would not contain standing water for at least 3 consecutive months, which is a requirement for the Mink model to score more than zero. This is due to PERSWATER constraining the model score to avalue of 0 if PERSWATER is less than 25 percent (3 months). The observation is corroborated by loblolly pine recorded in forested wetland data collection. Loblolly pine is a facultative species that is often found in drier upland conditions and would not be expected in areas of prolonged inundation. Because the model would score zero due to the hydrology, regardless of other model data values, a zero score for the Mink model is assumed for the forested wetland portion of all GBWMB alternatives. Since GBWMB forested wetlands contain existing vegetation and have established conditions, the without project assumptions for the change in forested wetland model variables discussed in Section 4.2.1 and shown in Table 5 are used for the Barred Owl variables of CANTREE, DBHTREE, and NUMBERLGTREE.
9.2.2.2 Emergent Wetland CreditsData from the Swamp Rabbit emergent wetland data collection sheets for GBWMB Subdivision B in the WOB Mitigation report were used for initial model data values. GBWMB staff observations indicate that the emergent wetlands of the water quality facility contain standing water for at least 3 consecutive months, which would result in a score more than zero for the Mink model. Therefore, data from the quarterly monitoring reports for GBWMB Subdivision B were used for initial Mink model data values. Since GBWMB emergent wetlands contain existing vegetation and have established conditions, the without project assumptions for the change in emergent wetland model variables discussed in Section 4.2.2 and shown in Table 6 are used for the Swamp Rabbit and Mink model variables.
9.3 Site-Specific Considerations and Assessment of Mitigation StrategiesThe mitigation strategies have site-specific constraints and conditions that affect the mitigation design and AAHUs the sites can produce. This section discusses those factors, and the habitat modeling results from implementing the assumptions discussed in Section 9.2 to mitigate the AAHUs impacted by the project and disposal sites on a one-to-one basis.
9.3.1 H110-00-00/Hunting Bayou Confluence Forested Wetland CreationThe H110-00-00/Hunting Bayou confluence site is located on a parcel currently owned by HCFCD at the confluence of the tributary H110-00-00 and Hunting Bayou, where an existing linear detention feature of approximately 0.9 acre is located. The size of the plantable area, which excludes basin side slopes, is approximately 0.6 acre. The current site consists of a grass-covered depression at an elevation low enough to receive overflow from either H110-00-00 or Hunting Bayou more frequently than once a year, according to study and Federal Emergency Management Agency (FEMA) effective hydraulic models and U.S. Geological Survey (USGS) gauge data. The following sections describe the conceptual design and habitat value modeling performed for this mitigation feature.
DRAFT Attachment D – Wetland Mitigation Plan and CE/ICA 9-8Hunting Bayou Flood Risk Management Project

9.3.1.1 Description and DesignThe proposed mitigation at this site would consist of planting a variety of the previously discussed water-tolerant native species within the bottom of the existing linear detention feature on this parcel (see Exhibit 6, inset panel for H110). More information on the individual model variable values, which would be used to guide design details, is contained in Section 9.2.1.1.
The proposed area is currently at an elevation ranging between approximately 31.5 and 32 feet (NAVD 1988, 2001 adjustment), with this general elevation covering most of the parcel area and extending north to Hunting Bayou. Water surface elevation information from the federal study hydraulic model and the FEMA effective hydraulic model was reviewed. According to this information, 31.5 feet to 32 feet would be at an elevation estimated to be low enough to receive greater than annual overflow from either H110-00-00 or Hunting Bayou. Some minor contouring and grading would be necessary to promote water retention to achieve pooling of standing water for at least 6 months or 50 percent of the year, which is the PERSWATER value assumed in the habitat model. This feature would be constructed concurrent with the upstream channel modifications, so the minor grading and contouring could be done during upstream channel excavation. Areas required to compensate for the project-only impacts and project plus disposal impacts were calculated separately in case disposal sites are not used. These areas were calculated using the modeling procedure and variable assumptions described in Section 9.2.1.1.
9.3.1.2 Habitat Modeling Methods and ResultsThe Excel software numerical method application Goal Seek was used in conjunction with the model spreadsheet to converge to the required acreage value to achieve the target HSI AAHU value, given the assumed variable values and changes. Since this mitigation feature would be constructed concurrent with channel excavation during the upstream channel construction, the start date applied for modeling was the completion of this task, which would be the Year 2018. To provide a timeframe consistent with the project impact analysis modeling, the mitigation modeling was performed for a 57-year period of analysis, with yearly increments for the first 7years, and 10-year increments thereafter. The results of the modeling are shown in Table 19, for the project-only impacts, which are also applicable to the project plus disposal site impacts. The results show that the HSI score increases slowly, and then increases relatively sharply in the last two decades. This is because for a majority of the period of analysis, most of the composite score is provided by the Mink model variables and is constrained by the Barred Owl score and the lack of trees meeting the NUMBERLGTREE threshold. When trees reach the NUMBERLGTREE 20 inch DBH threshold in the last 2 decades, the score increases sharply due to this variable and its influence on the Barred Owl and composite HSI score. The results also show the following:
Creating the full forested wetland acreage possible at this site only replaces 0.272AAHUs of impacts
This is less than the amount required to replace the 0.699 AAHUs for project-only impacts and project plus disposal site impacts.
These results indicate that there will not be enough acreage at the site to offset AAHU impacts on a one-to-one basis for either project-only or project plus disposal impacts. Therefore, this strategy will not work without providing acreage at another site to provide the requiredcompensation. The site that could provide the remaining acreage needed is the offline basin.
DRAFT Attachment D – Wetland Mitigation Plan and CE/ICA 9-9Hunting Bayou Flood Risk Management Project

Therefore, all alternatives involving the H110/Hunting Bayou confluence for forested wetland creation, will also involve forested wetland creation, at the offline basin.
Table 19:H110-00-00/Hunting Bayou Confluence Forested Wetland Creation
Habitat Modeling Results, AAHUs Produced by the Site
Year Yr DescrCompositeHSI Score Patch Acres Total HUs Cumulative HUs
2015 CY1 0.175 0.599 0.1052016 CY2 0.205 0.599 0.123 0.1142017 CY3 0.235 0.599 0.141 0.1322018 CY4 0.250 0.599 0.150 0.1452019 CY5 0.250 0.599 0.150 0.1502020 CY6 0.250 0.599 0.150 0.1502021 CY7 0.280 0.599 0.168 0.1592022 PLY-1 0.295 0.599 0.177 0.1722032 PLY-10 0.360 0.599 0.216 1.9622042 PLY-20 0.385 0.599 0.231 2.2312052 PLY-30 0.405 0.599 0.243 2.3662062 PLY-40 0.750 0.599 0.449 3.4592072 PLY-50 0.750 0.599 0.449 4.493
AAHUs 0.272
9.3.2 Offline Detention Tract Forested Wetland CreationThe Offline Detention Tract location and habitat was discussed in Sections 1.0 and 2.0. The forested wetland mitigation would be located in an area of the offline detention basin bottom that would otherwise be a grass-lined area at an elevation low enough to receive more than annual inundation. The following sections describe the design and modeling for this mitigation feature.
9.3.2.1 Description and DesignThe proposed forested wetland mitigation would consist of the same tree and shrub planting design and density identified for the H110-00-00/Hunting Bayou Confluence forested wetland creation. The mitigation would be created in the offline detention basin bottom at a location away from the main drainage channel, to minimize hydraulic roughness concerns for flow conveyance. According to study hydraulic model data, the basin bottom would be expected to be inundated 3 to 4 times per year. The basin bottom is currently designed with a gradual slope towards the channel to provide eventual drainage of stored flows. Therefore, some minor contouring and grading to retain water would be necessary to achieve the desired hydrologywithin the created forested wetland feature. This feature would be constructed concurrent with the offline detention basin construction, so the minor grading and contouring associated with this mitigation could be conducted during offline detention basin excavation. Areas within the offline detention tract required to compensate for the project-only impacts, which would also satisfy project plus disposal site impacts, were calculated using the modeling procedure and variable assumptions described in Section 9.2.1.1.
DRAFT Attachment D – Wetland Mitigation Plan and CE/ICA 9-10Hunting Bayou Flood Risk Management Project

9.3.2.2 Habitat Modeling Methods and ResultsThe same model, variable assumptions, and procedures used for the H110-00-00/Hunting Bayou Confluence forested wetland creation were used for the Offline Detention Tract forested wetland creation. The project-only and project plus disposal site impacts of 0.699 AAHUs were addressed. Since this mitigation feature would be constructed concurrent with excavation during the offline detention basin construction, the start date applied for modeling was the completion of this task, which would be the Year 2015. The results of the modeling are shown in Table 20,which applies for the project-only or project plus disposal site impacts, since no forested wetland is affected in the disposal areas. The results show that the HSI score increases slowly, and then increases relatively sharply in the last two decades. This occurs for the same reasons explained for the H110-00-00 forested wetland creation in the previous section regarding theNUMBERLGTREE variable and its influence on the Barred Owl model and the overall composite score. The results also show the following:
2.00 acres of created forested wetland habitat are required to replace the 0.699 AAHUs of project-only or project plus disposal site impacts
There is enough acreage in the Offline Detention Tract to offset project-only or project plus disposal site forested wetland impacts through onsite creation
Table 20:Offline Detention Tract Forested Wetland Creation
Habitat Modeling Results, Project-Only or Project Plus Disposal HSI Impacts Mitigation
Year Yr DescrComposite HSI Score Patch Acres Total HUs Cumulative HUs
2015 CY1 0.175 1.536 0.2692016 CY2 0.205 1.536 0.315 0.292
2017 CY3 0.235 1.536 0.361 0.338
2018 CY4 0.250 1.536 0.384 0.3722019 CY5 0.250 1.536 0.384 0.384
2020 CY6 0.250 1.536 0.384 0.384
2021 CY7 0.280 1.536 0.430 0.4072022 PLY-1 0.295 1.536 0.453 0.4422032 PLY-10 0.360 1.536 0.553 5.029
2042 PLY-20 0.385 1.536 0.591 5.7202052 PLY-30 0.405 1.536 0.622 6.0662062 PLY-40 0.750 1.536 1.152 8.869
2072 PLY-50 0.750 1.536 1.152 11.518
AAHUs 0.699
DRAFT Attachment D – Wetland Mitigation Plan and CE/ICA 9-11Hunting Bayou Flood Risk Management Project

9.3.3 Offline Detention Tract Emergent Wetland CreationThe Offline Detention Tract location and habitat was discussed in Sections 1.0 and 2.0. The emergent wetland mitigation would be created in an area of the proposed offline detention basin bottom that would otherwise be a grass-lined area at an elevation low enough to receive more-than-annual inundation. The following sections describe the design and modeling for this mitigation feature.
9.3.3.1 Description and DesignThe offline detention basin bottom would be inundated 3 to 4 times a year by overflow from Hunting Bayou, thereby providing flood flow storage and the required wetland hydrology. The created emergent marsh would be a dedicated “no-mow” area and the emergent plants would be able to grow to their expected mature height. Emergent plant species would be planted as appropriate based on the hydroperiod described in this section and availability at the time of planting, considering the list of emergent species maintained by HCFCD. This list of species has been previously reviewed by resource agencies for use in other HCFCD Section 211(f) studies. The species selected would tend towards the more water-tolerant spectrum, since PERSWATER is targeted at 80 percent. Minor contouring and grading would be required to retain water to achieve the target 80 percent PERSWATER, which is the assumed initial value. The created wetlands would be constructed concurrent with the offline detention basin construction. The minor grading and contouring required for the wetland creation could be conducted during offline detention basin excavation. Areas required to compensate for the project-only impacts or project plus disposal site impacts, were calculated separately. The mitigation areas were calculated using the modeling procedure and variable assumptions described in Section 9.2.1.2.
9.3.3.2 Habitat Modeling Methods and ResultsFollowing the assumptions and procedures described in Section 9.2.1.2, the emergent wetland model was applied. As discussed previously, CANEDGE for the emergent wetland was to be provided by co-locating the created forested wetland adjacent to it. Geographical information system (GIS) software ESRI ArcMap was used to analyze wetland geometry and configuration to calculate the possible size of the forested wetland area around the emergent wetland. As discussed in Section 9.2.1.2, the desired configuration of the CANEDGE around the emergent wetland would be to have the side of the emergent wetland directly adjacent to the drainage wayfree of trees and shrubs, and the other side lined with the forested wetland. With the size of forested wetland dictated by the amount to offset project-only and project plus disposal impacts, as described in Section 9.3.2, a planting width of 100m was not possible. Therefore, CANEDGEon the forested side was calculated to reflect the CANTREE of the forested wetland, distance-weighted for the approximately 44 m and 43 m planting widths possible for project-only and project plus disposal site impacts, respectively, and zero for the remaining distance out to 100 m.This was averaged with zero on the tree-free side to obtain the overall CANEDGE for the emergent wetland. Similar to the forested wetland creation modeling, Goal Seek was used in conjunction with the model spreadsheet to converge to the required acreage value to achieve the target HSI AAHU value, given the assumed variable values and changes. This was performedfor both the project-only emergent impacts of 0.491 AAHUs and the project plus disposal site impacts of 0.570 AAHUs. Since the emergent wetland mitigation would be constructed concurrent with excavation during the offline detention basin construction, the start date applied for modeling was the completion of this task, which would be Year 2015. To provide a timeframe consistent with the project impact analysis modeling, the mitigation modeling was
DRAFT Attachment D – Wetland Mitigation Plan and CE/ICA 9-12Hunting Bayou Flood Risk Management Project
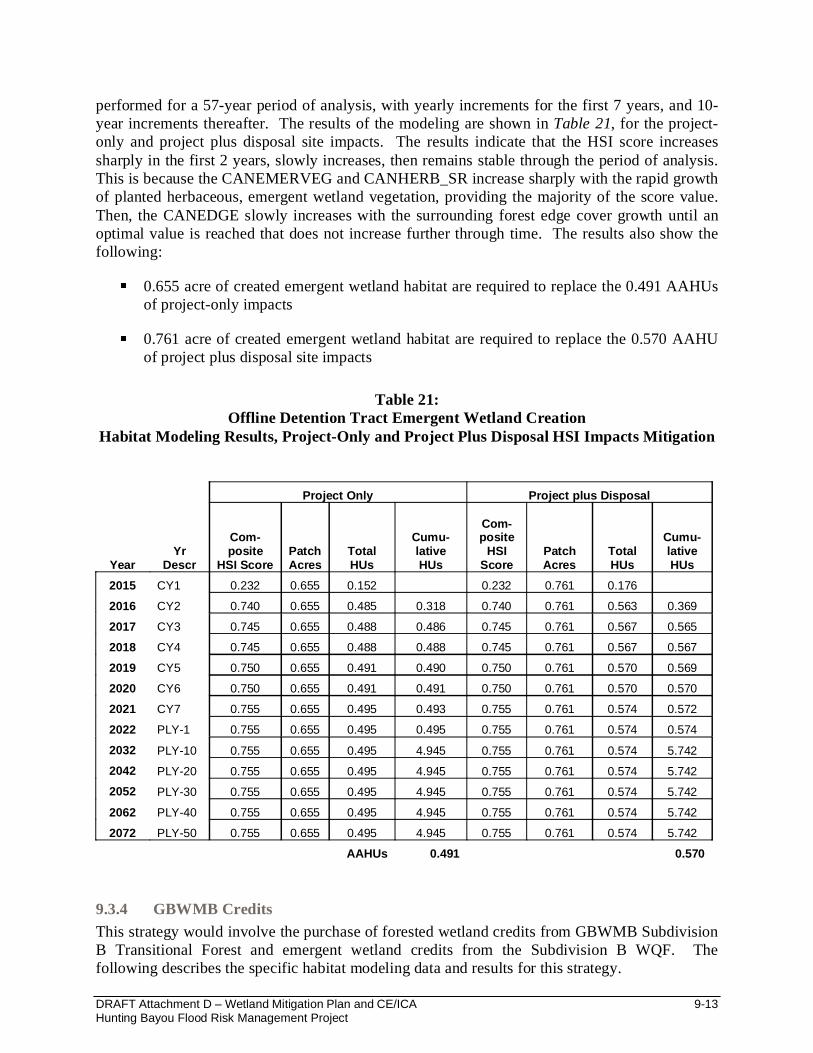
performed for a 57-year period of analysis, with yearly increments for the first 7 years, and 10-year increments thereafter. The results of the modeling are shown in Table 21, for the project-only and project plus disposal site impacts. The results indicate that the HSI score increases sharply in the first 2 years, slowly increases, then remains stable through the period of analysis. This is because the CANEMERVEG and CANHERB_SR increase sharply with the rapid growth of planted herbaceous, emergent wetland vegetation, providing the majority of the score value. Then, the CANEDGE slowly increases with the surrounding forest edge cover growth until an optimal value is reached that does not increase further through time. The results also show the following:
0.655 acre of created emergent wetland habitat are required to replace the 0.491 AAHUs of project-only impacts
0.761 acre of created emergent wetland habitat are required to replace the 0.570 AAHU of project plus disposal site impacts
Table 21:Offline Detention Tract Emergent Wetland Creation
Habitat Modeling Results, Project-Only and Project Plus Disposal HSI Impacts Mitigation
Project Only Project plus Disposal
YearYr
Descr
Com-posite
HSI ScorePatch Acres
Total HUs
Cumu-lative HUs
Com-posite
HSI Score
Patch Acres
Total HUs
Cumu-lative HUs
2015 CY1 0.232 0.655 0.152 0.232 0.761 0.176
2016 CY2 0.740 0.655 0.485 0.318 0.740 0.761 0.563 0.369
2017 CY3 0.745 0.655 0.488 0.486 0.745 0.761 0.567 0.565
2018 CY4 0.745 0.655 0.488 0.488 0.745 0.761 0.567 0.567
2019 CY5 0.750 0.655 0.491 0.490 0.750 0.761 0.570 0.569
2020 CY6 0.750 0.655 0.491 0.491 0.750 0.761 0.570 0.570
2021 CY7 0.755 0.655 0.495 0.493 0.755 0.761 0.574 0.572
2022 PLY-1 0.755 0.655 0.495 0.495 0.755 0.761 0.574 0.574
2032 PLY-10 0.755 0.655 0.495 4.945 0.755 0.761 0.574 5.742
2042 PLY-20 0.755 0.655 0.495 4.945 0.755 0.761 0.574 5.742
2052 PLY-30 0.755 0.655 0.495 4.945 0.755 0.761 0.574 5.742
2062 PLY-40 0.755 0.655 0.495 4.945 0.755 0.761 0.574 5.742
2072 PLY-50 0.755 0.655 0.495 4.945 0.755 0.761 0.574 5.742
AAHUs 0.491 0.570
9.3.4 GBWMB CreditsThis strategy would involve the purchase of forested wetland credits from GBWMB Subdivision B Transitional Forest and emergent wetland credits from the Subdivision B WQF. The following describes the specific habitat modeling data and results for this strategy.
DRAFT Attachment D – Wetland Mitigation Plan and CE/ICA 9-13Hunting Bayou Flood Risk Management Project

9.3.4.1 Forested Wetland Habitat Modeling and ResultsInitial model data values for the forested wetland model were obtained from Appendix G of the WOB Mitigation report for the Barred Owl forested wetland data collection sheets for GBWMB Subdivision B (Page G-9). As discussed in Section 9.2.2, the Mink model score is assumed to be zero due to lack of standing water for 3 or more consecutive months. The without projectassumptions for the change in forested wetland model variables were used as previously discussed in Section 9.2.2.1. Because the GBWMB data was collected in March 2007, the values were advanced to 2009 using the without project change assumptions (e.g., tree canopy and dbh growth) to provide the initial values used in the model.
The Excel software numerical method application Goal Seek was used in conjunction with the model spreadsheet to converge to the required acreage value to achieve the target AAHU value, given the assumed variable values and changes. This was performed for both the project-only and project plus disposal site impacts of 1.269 AAHUs. Since credits would be purchased at the start of project implementation, the start date applied for calculating the AAHUs providing compensation was the Year 2015. The results of the modeling to meet the HSI requirements are shown in Table 22, applicable to the project-only and project plus disposal site impacts because no forested wetlands are impacted by disposal. The results show that the HSI score slowly increases but jumps in the last decade. This is because the composite score is provided by the Barred Owl score (since the Mink model score is assumed zero – reference Section 9.2.2.1),which is constrained for a majority of the period of analysis by the lack of trees meeting the NUMBERLGTREE threshold. When trees reach the NUMBERLGTREE 20iinch dbh threshold in the last decade, the score increases sharply due to this variable and its influence on the Barred Owl and composite HSI score. The results also show that 4.33 acres of forested wetland creditsare required to replace the 0.699 AAHUs of project-only or project plus disposal site impacts.
Table 22:GBWMB Forested Wetland Credits Habitat Modeling Results, Project-Only or Project
Plus Disposal HSI Impacts Mitigation
Year Yr DescrCompositeHSI Score Patch Acres Total HUs
Cumulative HUs
2015 CY1 0.105 4.327 0.4542016 CY2 0.105 4.327 0.454 0.4542017 CY3 0.105 4.327 0.454 0.4542018 CY4 0.105 4.327 0.454 0.4542019 CY5 0.110 4.327 0.476 0.4652020 CY6 0.110 4.327 0.476 0.4762021 CY7 0.110 4.327 0.476 0.4762022 PLY-1 0.110 4.327 0.476 0.4762032 PLY-10 0.120 4.327 0.519 4.9762042 PLY-20 0.130 4.327 0.563 5.4092052 PLY-30 0.140 4.327 0.606 5.8422062 PLY-40 0.150 4.327 0.649 6.2742072 PLY-50 0.500 4.327 2.164 14.063
Average Annual Habitat Units (AAHU) 0.699
DRAFT Attachment D – Wetland Mitigation Plan and CE/ICA 9-14Hunting Bayou Flood Risk Management Project

9.3.4.2 Emergent Wetland Habitat Modeling and ResultsGBWMB quarterly monitoring reports for the Subdivision B Water Quality Facility from 2009 to 2010 and for the first two quarters of 2012, were reviewed to determine an appropriate value for PERSWATER (reference). These reports contain recorded water level data and photographic logs of observed typical conditions at the facility. Because 2011 was a record drought year for Texas, monitoring reports for this period were judged to not represent normal or usual annual conditions. The photographic logs also provide comparison photos for the same quarters in previous years. The photo evidence where all 4 quarters were available indicates that standing water was observed in 3 of the 4 quarters for 2003, 2005, and 2008-2010. Water level recorders are also installed at various points in the WQF. While some are installed in deeper basin or pond areas, others are located in areas of the more pervasive shallower topography, such as the West Habitat and Southwest Habitat Level Troll data recorders. These show steady water level readings of greater than 24 inches throughout the season. For example, the 2009 water level readings fluctuate steadily between 37 and 41 inches, and 2010 levels fluctuate between approximately 30 inches (2.5 ft) and 78 inches (6.5 ft). Considering the visible standing water throughout at least 3 quarters of a year, absent extreme drought, and the water level readings, standing water is expected to be present greater than 75 percent of the year, which is the optimal value that maximizes the water index. Therefore, the PERSWATER value was assumed to be 80 percent.
The CANEMERVEG came from the Third Quarter 2012 WQF monitoring report. Since the WQF is adjacent to the Transitional Forest, the CANEDGE was derived from transect data in the 2012 Transitional Forest 3rd Quarter Monitoring report for the transects within 100 m of the WQF. The datasheets for the percent desirable species canopy cover contained raw counts of both overstory (tree) and understory (saplings, shrubs) species, desirable or not. Since the CANEDGE variable is percent tree and shrub cover, without regard to desirable or native species, the data was used to recalculate the percent tree and shrub cover using the same method from the monitoring report to provide a value for the CANEDGE calculation. Because only one side of the WQF has forest cover, the CANEDGE was calculated as the average of percent tree and shrub cover on the side adjacent to the transitional forest, and zero.
The without project assumptions for the change in forested wetland model variables were used as previously discussed in Section 9.2.2.2 The Excel software numerical method application Goal Seek was used in conjunction with the model spreadsheet to converge to the required acreage value to achieve the target AAHU value, given the assumed variable values and changes. This was performed for both the project-only and project plus disposal site impacts of 1.269 AAHUs.Since credits would be purchased at the start of project implementation, the start date applied for calculating the AAHUs providing compensation was Year 2015. The results of the modeling to meet the HSI requirements are shown in Table 23, for the project-only and project plus disposal site impacts. The results show that 0.714 acre of emergent wetland credits are required to replace the 0.491 AAHUs of project-only impacts, and 0.829 acre of credits are needed for the 0.570 AAHUs of project plus disposal site impacts.
DRAFT Attachment D – Wetland Mitigation Plan and CE/ICA 9-15Hunting Bayou Flood Risk Management Project
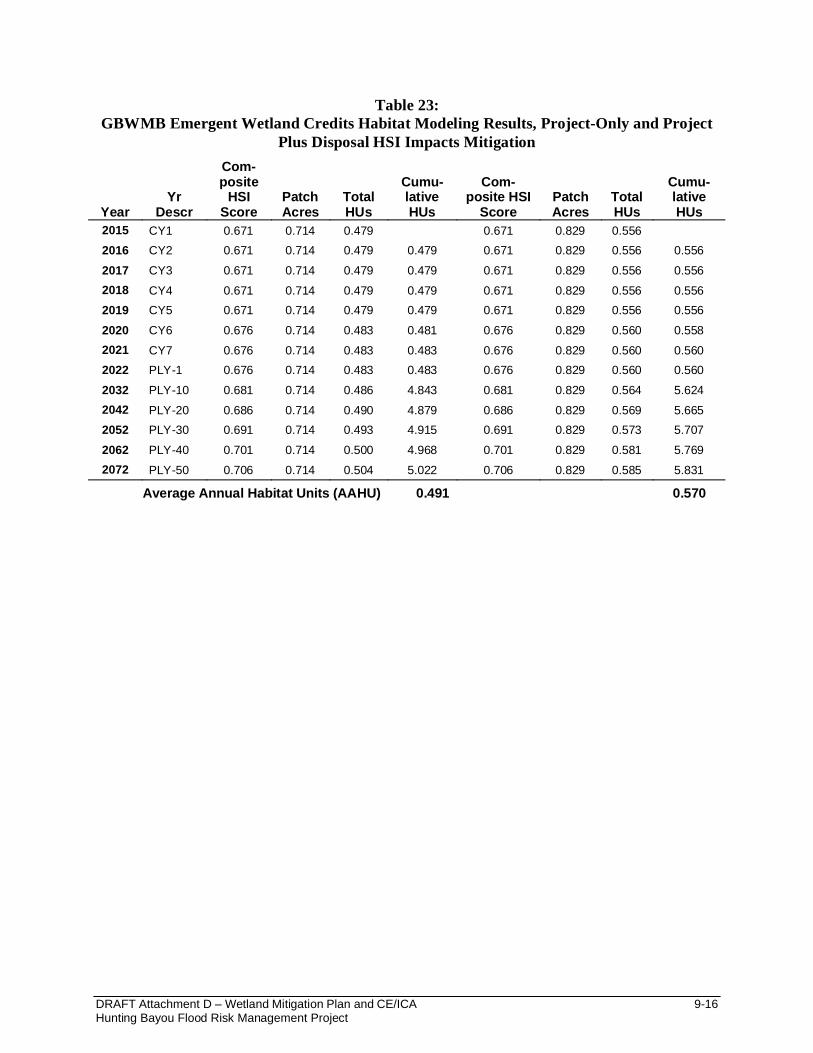
Table 23:GBWMB Emergent Wetland Credits Habitat Modeling Results, Project-Only and Project
Plus Disposal HSI Impacts Mitigation
YearYr
Descr
Com-posite
HSI Score
Patch Acres
Total HUs
Cumu-lative HUs
Com-posite HSI
ScorePatch Acres
Total HUs
Cumu-lative HUs
2015 CY1 0.671 0.714 0.479 0.671 0.829 0.5562016 CY2 0.671 0.714 0.479 0.479 0.671 0.829 0.556 0.556
2017 CY3 0.671 0.714 0.479 0.479 0.671 0.829 0.556 0.5562018 CY4 0.671 0.714 0.479 0.479 0.671 0.829 0.556 0.5562019 CY5 0.671 0.714 0.479 0.479 0.671 0.829 0.556 0.556
2020 CY6 0.676 0.714 0.483 0.481 0.676 0.829 0.560 0.5582021 CY7 0.676 0.714 0.483 0.483 0.676 0.829 0.560 0.5602022 PLY-1 0.676 0.714 0.483 0.483 0.676 0.829 0.560 0.560
2032 PLY-10 0.681 0.714 0.486 4.843 0.681 0.829 0.564 5.6242042 PLY-20 0.686 0.714 0.490 4.879 0.686 0.829 0.569 5.6652052 PLY-30 0.691 0.714 0.493 4.915 0.691 0.829 0.573 5.707
2062 PLY-40 0.701 0.714 0.500 4.968 0.701 0.829 0.581 5.7692072 PLY-50 0.706 0.714 0.504 5.022 0.706 0.829 0.585 5.831
Average Annual Habitat Units (AAHU) 0.491 0.570
DRAFT Attachment D – Wetland Mitigation Plan and CE/ICA 9-16Hunting Bayou Flood Risk Management Project

10.0 COST EFFECTIVENESS/INCREMENTAL COST ANALYSIS
ER 1105-2-100 requires performing an incremental cost analysis (ICA) for recommended mitigation plans to identify the least cost mitigation plan that provides full mitigation of losses specified in mitigation planning objectives. This report section presents a Cost Effectiveness/Incremental Cost Analysis (CE/ICA) to determine the most cost-effective and most efficient mitigation alternatives for the wetland impacts associated with the TSP for the Hunting Bayou Flood Risk Management Project. Any required mitigation for wetland losses would be provided by 1) creation of forested wetlands at either the offline detention tract or the H110-00-00/Hunting Bayou confluence tract, 2) creation of emergent wetlands at the offline detention tract, or 3) purchasing forested and emergent wetland credits at GBWMB Subdivision B. Six alternatives for compensatory mitigation for the excavation or filling of wetlands within the Hunting Bayou TSP boundaries and proposed disposal sites were identified and evaluated, as documented in this section.
Six mitigation alternatives were evaluated in this CE/ICA using the USACE Institute for Water Resources (IWR) Planning Suite software, Version 1.0.11.0. Section 10.2 provides a detailed description of each alternative. The CE/ICA was evaluated using the HSI scores and AAHUs,because the USACE requires that USACE-certified models be used in planning studies and the published HEP models have been approved by the National Ecosystem PCX.
The cost-effectiveness analysis portion of the CE/ICA evaluates the relationship between the cost and environmental output (measured as AAHUs) associated with each mitigation alternative. The term cost-effective means that for a particular level of output, no other plan costs less, or that no plan yields more output for the same or less cost. The ICA compares the additional costs to the additional outputs (AAHUs) of an alternative that produces greater outputs than another alternative. In the ICA, cost effective alternatives that are most efficient in production are selected by identifying those with the lowest incremental cost per output. These alternatives, known as "best buy" alternatives, provide the greatest increase in output for the least increase in cost. The "best buy" alternative(s) represents the most efficient of the cost effective mitigation alternative(s).
10.1 Methodology
10.1.1 Cost Estimation MethodologyEach alternative consists of one or more of the following:
a forested wetland component consisting of either
- forested wetland creation at the H110-00-00/Hunting Bayou Confluence tract or
- forested wetland creation in the Offline Detention tract
an emergent wetland creation component in the Offline Detention tract.
purchase of credits at GBWMB Subdivision B using the Transitional Forest for forested wetland credits, and the WQF for emergent wetland credits
DRAFT Attachment D – Wetland Mitigation Plan and CE/ICA 10-1Hunting Bayou Flood Risk Management Project

The costs of implementing each alternative were calculated based on unit costs associated with each of these three types of actions. For wetland creation, unit planting costs were obtained from HCFCD unit price data contained in the White Oak Bayou CE/ICA. The appropriate cost index factors were obtained from EM 1110-2-1304, Civil Works Construction Cost Index System(CWCCIS) for the Fish and Wildlife Facilities category to advance the price level to 2013.
10.1.1.1 Forested WetlandThe cost per acre of creating forested wetlands in the offline detention basin was calculated based on factors provided by HCFCD. Table 24 summarizes those factors, which are based on the following:
Costs for purchasing and planting trees were based on acquiring species from the HCFCD nursery. Re-planting for failed trees is accounted for in this cost factor as a warranty item.
Trees with the initial dbh value of 2-inches used in the model to calculate mitigation AAHUs are within the pot size (gallons) range listed in Table 24.
The tree density (300 trees/acre) was based on the assumptions discussed in Section 9.2.1.1.
Tree post-planting maintenance and establishment monitoring costs account for maintenance and initial short-term monitoring of tree health to ensure tree establishment and growth. This includes labor and materials associated with watering and invasive species removal. It also includes the effort for monitoring wetland hydroperiod and depth following rain events with graduated staff gauges to ensure proper inundation is achieved.
No land costs are included in costs of creating forested wetlands in the offline detention tract, as the cost is accounted for in real estate costs of implementing the offline detention basin project component. No land costs are included in the costs of creating forested wetlands in the H110-00-00/Hunting Bayou Confluence tract, because this land is already owned by HCFCD.
The provision of 3 to 6 inches of flooded area depth would require some minor additional excavation and grading for the forested wetland creation, in comparison to that necessary to provide the greater than 15 feet of excavation depth for the offline detention basincomponent. This work would be done concurrent with the construction of the offlinedetention component. The effort and costs to establish the wetland topography in the basin bottom are assumed to be negligible compared to the excavation effort/costs of the whole basin. Therefore, it is assumed forested wetland excavation and grading costs would be accounted for in the offline construction excavation cost.
DRAFT Attachment D – Wetland Mitigation Plan and CE/ICA 10-2Hunting Bayou Flood Risk Management Project

Table 24: Forested Wetland Creation Costs
Mitigation ItemPerformance
PeriodTree Size (gallon)
Cost per Tree
($)Trees
per AcreCost
per Acre
Design N/A N/A N/A N/A $ 1,000
Tree purchasing and planting N/A 5 to 25 $64 300 $ 19,292
Tree maintenance and establishment
2 Years 5 to 25 $57 300 $ 17,148
Post-planting Monitoring 5 Years N/A N/A N/A $4,000
Total Cost $ 41,440
For wetland creation at the H110-00-00/Hunting Bayou Confluence tract, the site is already at the desired elevation to receive frequent overflow from H110-00-00. Only minor grading to ensure water retention to achieve the required percent area flooded would be required to implement this mitigation feature, which could be done concurrently with the channel widening of the nearby Hunting Bayou channel. Therefore, similar to the offline detention wetland creation, excavation costs are accounted for in recommended project construction costs, and are not included in the cost of mitigation. The site is also within a parcel already owned by HCFCD. Therefore, land costs are not included in the cost of mitigation. The cost per acre for creating, maintaining, and monitoring forested wetlands at this site are the same as those used for creating forested wetlands at the Offline Detention Tract.
10.1.1.2 Emergent Wetland Creation The cost per acre of creating emergent wetlands in the offline detention tract was calculated based on factors provided by HCFCD and are assumed to be current price levels. Table 25summarizes those factors, which are based on the following:
The cost of acquiring and planting emergent wetland species was based on harvesting plants from the HCFCD nursery. The assumed plant density of 4,840 plants/acre equates to one plant per square yard. This would be sufficient to provide the initial model variable value of 50 percent coverage after the first year.
Wetland maintenance and establishment monitoring costs over 5 years are intended to account for monitoring plant health, monitoring wetland hydroperiod and depth following rain events with a staff gauge, and removal of invasive species.
No land costs are included in costs of creating emergent wetlands in the offline detention tract, as the cost is accounted for in real estate costs of implementing the offline detention basin project component.
DRAFT Attachment D – Wetland Mitigation Plan and CE/ICA 10-3Hunting Bayou Flood Risk Management Project

Similar to forested wetland creation, excavation effort/costs to establish the required emergent wetland topography to implement flooded areas are negligible compared to the effort/costs to excavate the offline detention component. Therefore, it is assumed any emergent wetland excavation and grading costs would be accounted for in the offlineconstruction excavation cost.
Table 25:Emergent Wetland Creation Costs
Mitigation ItemPerformance Period
Cost per Plant ($)
Plants per Acre
Cost per Acre
Design, harvesting and planting 1 Year $6.04 4,840 $ 29,219
Wetland maintenance and establishment monitoring 5 Years N/A N/A $ 9,945
Total Cost $ 39,164
10.1.1.3 Long-Term Monitoring CostsLong-term monitoring costs account for the effort to monitor, and attainment of the success criteria described in Section 8.0 based on key habitat model parameters from the models used to calculate AAHUs. This monitoring would be conducted yearly for 5 years. This is different from the short-term monitoring of tree and plant health to ensure successful establishment. A lump sum cost per monitoring/report effort per alternative was used from Appendix F, WetlandMitigation Incremental Cost Analysis from the Brays Bayou Federal Flood Control Project Alternative to The Diversion Separable Element Harris County, Texas Environmental Assessment. This factor assumes an initial monitoring event following construction, and 5 subsequent annual monitoring events, totaling 6 monitoring events, would be required at a cost of $5,500 per event. The factor also assumed costs of monitoring both emergent and forested wetlands were included. The estimated total cost of 6 monitoring events is 6 events X $5,500 = $33,000.
10.1.1.4 GBWMB Credit CostsThe current price of credits was obtained from GBWMB staff. The credit price is the same for forested or emergent wetlands. The price is $20,000 per acre needed for acreage greater than 3 acres, and $22,000 per acre for acreage less than 3 acres. The price is a one-time cost with no periodic maintenance or monitoring fees.
10.1.2 CE/ICA MethodologyThe IWR Planning Suite software performs evaluations of cost-effectiveness and ICA in terms of environmental output. Data for each mitigation alternative, including AAHUs gained and cost, was entered into IWR Planning Suite. The mitigation planning was conducted to address mitigating the forested and emergent wetland impacts together at various increments of compensation. That is, each alternative was formulated to provide compensation for all of the types of wetland impacts at various ratios of mitigation. Also, the size of onsite emergent wetland creation was dependent on the forested wetland creation, due to the emergent wetland model CANEDGE being provided by the forested wetland canopy. Also, to meet the mitigation ratio targets of each increment, certain sizes of one wetland type were modeled and conceived to
DRAFT Attachment D – Wetland Mitigation Plan and CE/ICA 10-4Hunting Bayou Flood Risk Management Project

be paired with another certain size and type of wetland to avoid mixing measures that mitigated at different ratios. This required the measures that provided mitigation for a certain type and size of wetland impact (e.g., forested, emergent) to be combined with those of another type and size to meet this planning objective. Therefore, to simplify the analysis within the IWR Plan, alternatives consisting of the required combinations of measures were entered directly as plans, instead of entering individual measures and using the automated plan generator to generate the needed alternatives.
Depending on the alternative, the acreage required for mitigation was determined from the model based on the AAHUs impacted or required, or was based on the acres of wetlands impacted. A CE/ICA was then run on the mitigation alternatives. The outcome of each plan was determined to be cost-effective, not cost-effective, or a “best buy.” A plan that provided the same amount of AAHUs for a higher cost compared to another alternative was determined to be not cost-effective. Any recommended mitigation alternative must provide an AAHU value greater than or equal to the 0.699 AAHUs of forested wetlands and 0.570 AAHUs of emergent wetlands that would be impacted under the No Mitigation alternative.
10.2 Definition and Cost Estimation of Mitigation Alternative Plan IncrementsThe six alternatives analyzed in this CE/ICA are composed of combinations of different size increments of the basic components discussed in Section 9.0, with each alternative containing a forested wetland component and an emergent wetland component. The six alternatives were formulated to provide solutions at two basic output increments: (1) full compensation equal to the AAHU impacts (1.269 AAHUs), and (2) compensation of the area (e.g., acres) of wetland impacts. The alternatives are:
Alternative 1 – H110-00-00/Hunting Bayou Confluence and Offline Forested Wetland Forested Wetland Creation plus Offline Emergent Wetland Creation, equal to 1.269AAHUs
Alternative 2 – Offline Forested Wetland Creation plus Offline Emergent Wetland Creation, equal to 1.269 AAHUs
Alternative 3 – GBWMB Subdivision B Forested and Emergent Wetland Credits, equal to 1.269 AAHUs
Alternative 4 – 2.00 acres total of H110-00-00/Hunting Bayou Confluence and Offline Forested Wetland Creation plus 2.37 acres of Offline Emergent Wetland Creation, equal to 2.63 AAHUs
Alternative 5 – 2.00 Acres of Offline Forested Wetland Creation, plus 2.37 Acres of Offline Emergent Wetland Creation, equal to 2.77 AAHUs
Alternative 6 – 2.00 Acres of Forested and 2.37 Acres of Emergent Wetland Credits in GBWMB Subdivision B Forested equal to 1.95 AAHUs
DRAFT Attachment D – Wetland Mitigation Plan and CE/ICA 10-5Hunting Bayou Flood Risk Management Project

Alternatives 1 through 3 provide the minimum amount of both forested and emergent wetlands AAHUs to fully mitigate project and disposal site impacts. Alternatives 4 through 6 provide compensation of AAHUs impacted for both forested and emergent wetlands, with their size based on the acres of wetland impacted.
10.2.1 Alternative 1 – H110-00-00/Hunting Bayou Confluence and Offline Forested Wetland Creation plus Offline Emergent Wetland Creation, equal to 1.269wetAAHUs
This alternative consists of creation of 1) forested wetland at the confluence of Hunting Bayou and the upstream tributary H110-00-00, and forested wetland at the Offline Detention Tract to mitigate for forested wetland project and disposal site impacts totaling 0.699 AAHUs (the same 0.699 AAHUs if disposal sites are not used), and 2) emergent wetland creation in the OfflineDetention Tract to mitigate for emergent wetland project and disposal site impacts totaling 0.570AAHUs (0.491 AAHUs if disposal sites are not used). The design and size of each of these components would be similar to that described in Sections 9.3.1, 9.3.2 and 9.3.3, except the offline forested wetland creation would be smaller as part of the forested wetland mitigation is also provided by the H110-00-00/Hunting Bayou Confluence site. Exhibit 6 illustrates aconceptual layout of each component of this alternative. As discussed in Section 9.2.1.2, the offline emergent wetland is shown in Exhibit 6 is conceptually oriented adjacent to where a principal basin drainage pathway would be located, with the forested wetland located on the side away from the drainage to minimize conveyance concerns, as discussed in Section 9.3.2.1. As discussed in Section 9.3.3, the offline emergent wetland would be constructed with the offline forested wetland adjacent to one side to provide the edge canopy cover to maximize the CANEDGE value as much as possible. The configuration and arrangement of the forested wetland area around the emergent wetland is shown in Exhibit 6 with basic, uniform geometry solely to simplify the modeling calculations and for basic illustration. In practice, the forested wetland band would be configured with more natural, rounded contouring.
The H110-00-00/Hunting Bayou Confluence component consists of minor contouring, and planting various species of native water-tolerant trees in the existing small detention feature bottom to provide 0.272 AAHUs of forested wetlands. As discussed in Section 9, since this was not enough to offset project impacts, the forested wetland created at the Offline Detention Tract would be required to make up the difference, providing 0.427 AAHUs. Together, these forested wetland features would compensate for project and disposal site (or project-only) forested wetland impacts of 0.699 AAHU. The offline emergent wetland creation component consists of grading and contouring the offline basin bottom and planting native species of emergent wetland vegetation to provide 0.570 AAHUs of emergent wetland to mitigate for the same amount of project and disposal site emergent wetland impacts, or 0.491 AAHUs if disposal sites are not used. The modeling and assumptions for change in model variables were discussed in Sections 9.3.1 through 9.3.3. This alternative meets the mitigation planning objective discussed in Section 8.0, which is to replace the significant unavoidable losses of wetlands that would occur with implementation of the recommended project and use of the disposal sites. A total of 1.269AAHUs would be provided by this alternative to mitigate project and disposal site impacts, or 1.190 AAHUs if disposal sites are not used. Table 26 summarizes the AAHUs provided and size of each component in this alternative.
DRAFT Attachment D – Wetland Mitigation Plan and CE/ICA 10-6Hunting Bayou Flood Risk Management Project

Table 26:Summary of Mitigation Results for Alternative 1
Wetland Impacts
Mitigation Component
Mitigation Provided AAHU Replacement
RatioAAHUs AcresComponent
AcresAAHUs
ReplacedProject Plus Disposal
0.699 2.00 H110 Forested Wetland Creation 0.599 0.272 1.00Offline Forest Wetland Creation 0.936 0.426
0.570 2.37 Emergent Wetland Creation 0.770 0.570 1.001.269 4.37 Total Project plus Disposal Site 2.31 1.269 1.00
Project Only
0.699 2.00 H110 Forested Wetland Creation 0.599 0.272 1.00Offline Forest Wetland Creation 0.936 0.426
0.491 1.67 Emergent Wetland Creation 0.663 0.491 1.001.190 3.67 Total Project Only 2.20 1.190 1.00
The cost to implement Alternative 1 was calculated by applying the unit and lump sum costs, and assumptions discussed in Section 10.1.1, to the acreage required for each component. Since Alternative 1 involves monitoring two geographically separated sites, there would be some extra costs of demobilization, travel, and remobilization for monitoring the two sites. Therefore, a time cost was estimated for demobilizing from monitoring at one site, traveling the 1.54 miles between the two sites, and mobilizing to continue monitoring at the other site. This amounts to an extra $540. Similarly, the design effort for two geographically separated sites would incur some extra costs for the design and extra set of plans for two sites. The design cost of $1,000/acre for Alternative 1 was multiplied by a factor of 1.5 to account for this. There would also be extra mobilization/demobilization costs for constructing and planting the mitigation features at two geographically separated sites because the unit costs in Tables 24 and 25 reflect mitigation at one site. A cost factor provided by HCFCD based on a recent mitigation project cost estimate was used, and consisted of a flat fee for mobilization/demobilization of $750. This accounts for the extra costs of setting up and breaking down equipment used in initial planting, seeding, fertilizing and staking of the wetland vegetation. Table 27 summarizes the line items, quantities, and costs for Alternative 1.
DRAFT Attachment D – Wetland Mitigation Plan and CE/ICA 10-7Hunting Bayou Flood Risk Management Project

Table 27: Cost Estimate for Alternative 1
Component/ItemMitigation
Acres Cost/Acre ($) Cost
H110 Forested Wetland Creation 0.599 $41,940 $25,122 Offline Forest Wetland Creation 0.936 $41,940 $39,256 Emergent Wetland Creation 0.770 $39,163.62 $30,172 Long Term Monitoring Costs for Forested & Emergent N/A N/A $33,000 Extra travel cost for monitoring 2 separate sites N/A N/A $540 Extra construction mobilization/demobilization for separate site N/A N/A $750
Total Cost $128,840 Cost of Alternative 1 if disposal sites are not used $123,885
10.2.2 Alternative 2 – Offline Forested Wetland Creation plus Offline Emergent Wetland Creation, equal to 1.269 AAHUs
This alternative consists of 1) forested wetland creation in the Offline Detention Tract to mitigate for forested and scrub-shrub wetland project and disposal site impacts totaling 0.699 AAHUs (whether or not disposal sites are used), and 2) emergent wetland creation in the OfflineDetention Tract to mitigate for emergent wetland project and disposal site impacts totaling 0.570 AAHUs (0.491 AAHUs if disposal sites are not used). The design and size of each of these components would be the same as that described in Sections 9.3.2 and 9.3.3. Exhibit 7illustrates the conceptual layout of each component of this alternative. The offline forested wetland creation component consists of planting the offline basin bottom with a variety of native water-tolerant trees to mitigate for the forested wetland AAHU impacts. The offline emergent creation component is essentially the same as that described in Alternative 1, except it is slightly smaller due to the slightly thicker forested wetland band which reduces the acreage required to mitigate for the same amount of emergent wetland AAHU impacts. The modeling and assumptions for changes in model variables were discussed in Sections 9.3.2 and 9.3.3. This alternative meets the mitigation planning objective discussed in Section 8.0, which is to replace unavoidable losses of wetlands that would occur with implementation of the recommended project and use of the disposal sites — a total of 1.269 AAHUs by this alternative to mitigate project and disposal site impacts, or 1.190 AAHUs if disposal sites are not used. Table 28summarizes the AAHUs and size of each component in this alternative.
DRAFT Attachment D – Wetland Mitigation Plan and CE/ICA 10-8Hunting Bayou Flood Risk Management Project

Table 28: Summary of Mitigation Results for Alternative 2
Wetland Impacts
Mitigation Component
Mitigation Provided AAHU Replacement
RatioAAHUs AcresComponent
AcresAAHUs
ReplacedProject Plus Disposal
0.699 2.00 Offline Forest Wetland Creation 1.536 0.699 1.000.570 2.37 Offline Emergent Wetland Creation 0.761 0.570 1.001.269 4.37 Total Project plus Disposal Site 2.30 1.269 1.00
Project Only0.699 2.00 Forested Wetland Creation 1.536 0.699 1.000.491 1.67 Emergent Wetland Creation 0.655 0.491 1.001.190 3.67 Total Project Only 2.19 1.190 1.00
The cost to implement Alternative 2 was calculated by applying the unit and lump sum costs, and assumptions discussed in Section 10.1.1, to the acreage required for each component. Table 29summarizes the line items, quantities, and costs for Alternative 2.
Table 29: Cost Estimate for Alternative 2
Component/ItemMitigation
Acres Cost/Acre ($) Cost
Forested Wetland Creation 1.536 $41,440 $63,638 Emergent Wetland Creation 0.761 $39,164 $29,787 Long Term Monitoring Costs for Forested & Emergent N/A N/A $33,000
Total Cost $126,425 Cost of Alternative 2 if disposal sites are not used $122,291
10.2.3 Alternative 3 – GBWMB Subdivision B Forested and Emergent Wetland Credits,equal to 1.269 AAHUs
This alternative would involve the purchase of forested wetland credits from GBWMB Subdivision B Transitional Forest and emergent wetland credits from the Subdivision B WQF.This alternative and the associate modeling is the same as that described in Section 9.3.4,producing the same 0.699 AAHUs of forested wetland and 0.570 AAHUs of emergent wetland credits, for a total of 1.269 AAHUs, to offset project plus disposal impacts. Exhibit 8 shows the Transitional Forest and WQF for the GBWMB where credits for this alternative would be purchased. Table 30 summarizes the AAHUs provided and size of each component in this alternative. The analysis shows the following:
4.33 acres of forested wetland credits are required to offset 0.699 AAHUs of forested wetland impacts
0.83 acre of emergent wetland credits are required to offset 0.570 AAHUs of emergent wetland impacts
DRAFT Attachment D – Wetland Mitigation Plan and CE/ICA 10-9Hunting Bayou Flood Risk Management Project

Table 30:Summary of Mitigation Results for Alternative 3
Wetland Impacts
Mitigation Component
Mitigation Provided AAHU Replacement
RatioAAHUs AcresComponent
AcresAAHUs
ReplacedProject Plus Disposal
0.699 2.00 Forested Wetland Credits 4.327 0.699 1.000.570 2.37 Emergent Wetland Credits 0.829 0.570 1.001.269 4.37 Total Project plus Disposal Site Mitigation 5.16 1.269 1.00
Project Only0.699 2.00 Forested Wetland Credits 4.327 0.699 1.000.491 1.67 Emergent Wetland Credits 0.714 0.491 1.001.190 1.67 Total Project Only Mitigation 5.04 1.190 1.00
The cost to implement Alternative 3 was calculated by applying the unit costs, and assumptions discussed in the Cost Estimation Methodology section, to the acreage required for each component. Because the total acreage required for mitigation is greater than 3 acres, the unit price for credits was $20,000 per acre. Table 31 summarizes the line items, quantities, and costs for Alternative 3.
Table 31: Cost Estimate for Alternative 3
Component/ItemMitigation
AcresCost/Acre
($) Cost
Forested Wetland Credits 4.327 $20,000 $86,543Emergent Wetland Credits 0.829 $20,000 $16,588
Total Cost $103,131Cost of Alternative 3 if disposal sites are not used $100,829
10.2.4 Alternative 4 – 2.00 acres total of H110/Hunting Bayou Confluence and Offline Forested Wetland Creation plus 2.37 acres of Offline Emergent Wetland Creation,equal to 2.63 AAHUs
This alternative consists of 1) creation of forested wetland at the H110-00-00/Hunting Bayou Confluence Site and in the Offline Detention Tract, with the same acreage as the forested wetland area impacts, totaling 2.00 acres, and 2) emergent wetland creation in the OfflineDetention Tract to provide the same wetland area as the emergent wetland area impacts, totaling 2.37 acres. Exhibit 9 illustrates the conceptual layout of each component of this alternative.
DRAFT Attachment D – Wetland Mitigation Plan and CE/ICA 10-10Hunting Bayou Flood Risk Management Project

The forested wetland creation component consists of the same features, general shape and design as the forested wetland component in Alternative 1, except it is sized to provide 2.00 acres, which is the acreage of the forested wetland area impacts. The AAHUs of this area were determined using the same methodology, assumptions and procedures described in Sections 9.3.1 and 9.3.2. The only difference was that, instead of using a numerical method application to converge to a required acreage value for the model to meet a target AAHU, the acreage impacted was input into the model, as it was the basis on which AAHUs produced would be calculated. Since this mitigation feature would be constructed concurrent with excavation during offlinedetention basin construction, the start date applied for modeling of the mitigation feature was the completion of this construction task, which is Year 2015.
The offline emergent wetland creation component is the same as in Alternative 1, except it is sized to provide 2.37 acres, the acreage of the emergent wetland area impacts, or 1.67 acres if disposal sites are not used. The AAHUs of this area were determined using the same methodology, assumptions and procedures described in Section 9.3.3, except, as for the forested wetland, the acreage impacted was input into the model instead of using a numerical method to converge on an AAHU value. Similar to Alternative 1, the offline forested wetland would belocated adjacent to one side of the emergent wetland and modeling was accomplished using the CANTREE of the offline detention forested wetland features as the value for CANEDGE.Table 32 summarizes the AAHUs provided and size of each component in this alternative:
Table 32: Summary of Mitigation Results for Alternative 4
Wetland Impacts
Mitigation Component
Mitigation Provided AAHU Replacement
RatioAAHUs AcresComponent
AcresAAHUs
ReplacedProject Plus Disposal
0.699 2.00 H110-00-00 Forested Wetland Creation 0.599 0.272 1.30Additional Forest Wetland Creation 1.402 0.638
0.570 2.37 Emergent Wetland Creation 2.372 1.721 3.021.269 4.37 Total Project plus Disposal Site Mitigation 4.37 2.631 2.07
Project Only
0.699 2.00 H110-00-00 Forested Wetland Creation 0.599 0.272 1.30Additional Forest Wetland Creation 1.402 0.638
0.49 1.67 Emergent Wetland Creation 1.672 1.213 2.471.19 3.67 Total Project Only Mitigation 3.67 2.12 1.78
The cost to implement Alternative 4 was calculated by applying the unit and lump sum costs, and assumptions discussed in Section 10.1.1, to the acreage required for each component. Table 33summarizes the line items, quantities, and costs for Alternative 4.
DRAFT Attachment D – Wetland Mitigation Plan and CE/ICA 10-11Hunting Bayou Flood Risk Management Project

Table 33: Cost Estimate for Alternative 4
Component/ItemMitigation
AcresCost/Acre
($) Cost
H110 Forested Wetland Creation 0.599 $41,440 $ 24,822.00 Additional Forest Wetland Creation 1.402 $41,440 $ 58,086.00 Emergent Wetland Creation 2.37 $39,164 $ 92,894.00 Long Term Monitoring Costs for Forested & Emergent $ 33,000.00 Extra travel cost for monitoring 2 separate sites $ 540.00 Extra construction mobilization/demobilization for separate site $ 750.00
Total Cost $ 210,092Cost of Alternative 4 if disposal sites are not used $ 182,666.00
10.2.5 Alternative 5 – 2.00 Acres of Offline Forested Wetland Creation, plus 2.37 Acre of Offline Emergent Wetland Creation, equal to 2.77 AAHUs
Alternative 5 consists of creation of 1) forested wetlands at the Offline Detention Tract sized to provide 2.00 acres, and 2) an emergent wetland in the Offline Detention Tract sized to provide 2.37 acres. Exhibit 10 illustrates the conceptual layout of each component of this alternative. The AAHUs and acreage of each site were determined using the same methodology, assumptions, and procedures described in Section 9.3.2, except instead of using a numerical method to converge to a required acreage value for the model to meet a target AAHU, the acreage impacted was input into the model. Since the mitigation feature would be constructed concurrent with excavation during construction of the offline detention basin, the start date applied for modeling was the completion of the construction task, which is Year 2018. The AAHUs provided by this component are 0.910 AAHUs, which compensates 1.30 times the project and disposal site forested wetland AAHU impacts.
The offline emergent wetland creation component consists of the same general shape and design as the emergent component of Alternative 2, except it is sized to provide 2.37 acres. The AAHUs of this area was determined using the same methodology, assumptions, and procedures described in Section 9.3.3, except, as for the forested wetland, the acreage impacted was input into the model instead of using a numerical method to converge on an AAHU value. The emergent wetland component would be 2.37 acres and provide 1.858 AAHUs, which compensates 3.26 times the project and disposal site emergent wetland AAHU impacts. If disposal sites were not used, this component would be sized to provide 1.31 AAHUs.
This alternative exceeds the mitigation planning objective discussed in Section 8.0, which is to replace the significant unavoidable losses of wetlands that would occur with implementation of the recommended project and use of the disposal sites. A total of 2.768 AAHUs would be provided by this alternative to mitigate project and disposal site impacts, or 2.22 AAHUs if disposal sites are not used. Table 34 summarizes the AAHUs provided and the size of each component in this alternative:
DRAFT Attachment D – Wetland Mitigation Plan and CE/ICA 10-12Hunting Bayou Flood Risk Management Project

Table 34: Summary of Mitigation Results for Alternative 5
Wetland Impacts
Mitigation Component
Mitigation Provided AAHU Replacement
RatioAAHUs AcresComponent
AcresAAHUs
ReplacedProject Plus Disposal
0.699 2.00 Forested Wetland Creation 2.001 0.910 1.300.570 2.37 Emergent Wetland Creation 2.372 1.858 3.261.269 4.37 Total Project plus Disposal Site Mitigation 4.37 2.768 2.18
Project Only0.699 2.00 Forested Wetland Creation 2.001 0.910 1.300.491 1.67 Emergent Wetland Creation 1.672 1.309 2.671.190 3.67 Total Project Only Mitigation 3.67 2.219 1.87
The cost to implement Alternative 5 was calculated by applying the unit and lump sum costs, and assumptions discussed in Section 10.1.1, to the acreage required for each component. Table 35summarizes the line items, quantities, and costs for Alternative 5.
Table 35: Cost Estimate for Alternative 5
Component/ItemMitigation
Acres Cost/Acre ($) Cost
Forested Wetland Creation 2.001 $41,940 $83,909 Emergent Wetland Creation 2.372 $39,164 $92,894 Long Term Monitoring Costs for Forested & Emergent N/A N/A $33,000
Total Cost $209,803 Cost of Alternative 5 if disposal sites are not used $182,377
10.2.6 Alternative 6 – 2.00 Acres of Forested and 2.37 Acres of Emergent Wetland Credits in GBWMB Subdivision B, Equal to 2.77 AAHUs
This alternative is similar to Alternative 3, except that the acres of impact were used to determine credits. This alternative consists of 1) 2.00 acres of forested wetland credits in the Transitional Forest of GBWMB Subdivision B, and 2) 2.37 acres of emergent wetland credits in the WQF of GBWMB Subdivision B (reference Exhibit 8).
The AAHUs and acreage of the forested wetland credits were determined using the same methodology, assumptions and procedures described in Section 9.3.4.1. Since the credits would be purchased concurrent with the start of project construction, the start date applied for modeling of the credits was Year 2015.
DRAFT Attachment D – Wetland Mitigation Plan and CE/ICA 10-13Hunting Bayou Flood Risk Management Project

The emergent wetland credits were determined using the same methodology, assumptions and procedures described in Section 9.3.4.2. The results show that 2.00 acres of forested wetland credits produces 0.323 AAHUs and 2.37 acres of emergent wetlands produces 1.631 AAHUs.The same acreage at GBWMB does not produce the same AAHUs as the same acreage of the impacted forested wetland, primarily due to the NUMBERLGTREE variable. Forested wetland O-1 has existing trees meeting the threshold to provide a higher NUMBERLGTREE index score through the period of analysis, whereas the average dbh of the GBWMB is below this threshold and does not reach this threshold until later in the period of analysis. Although this alternative provides more AAHUs than are impacted for the emergent wetlands, it does not provide sufficient forested wetland AAHUs to offset project impacts. Therefore, this alternative does not meet the mitigation planning objective to replace 0.699 AAHUs of forested wetland. Table 36summarizes the AAHUs provided and size of each component in this alternative:
Table 36: Summary of Mitigation Results for Alternative 6
Wetland Impacts
Mitigation Component
Mitigation Provided AAHU Replacement
RatioAAHUs AcresComponent
AcresAAHUs
ReplacedProject Plus Disposal
0.699 2.00 Forested Wetland Credits 2.001 0.323 0.460.570 2.37 Emergent Wetland Credits 2.372 1.631 2.861.269 4.37 Total Project plus Disposal Site Mitigation 4.37 1.954 1.54
Project Only0.699 2.00 Forested Wetland Credits 2.001 0.323 0.460.491 1.67 Emergent Wetland Credits 1.672 1.149 2.341.190 3.67 Total Project Only Mitigation 3.67 1.472 1.24
The cost to implement Alternative 6 was calculated by applying the unit and lump sum costs, and assumptions discussed in Section 10.1.1, to the acreage required for each component. Table 37summarizes the line items, quantities, and costs for Alternative 6.
Table 37: Cost Estimate for Alternative 6
Component/ItemMitigation
Acres Cost/Acre ($) Cost
Forested Wetland Credits 2.001 $20,000 $40,014 Emergent Wetland Credits 2.372 $20,000 $47,439
Total Cost $87,453 Cost of Alternative 5 if disposal sites are not used $73,447
DRAFT Attachment D – Wetland Mitigation Plan and CE/ICA 10-14Hunting Bayou Flood Risk Management Project
10.2.7 Summary of Alternatives for Evaluation in the CE/ICAAlternatives 1 through 3 meet the mitigation planning objectives of replacing 0.699 AAHUs of forested wetland impacts, and 0.570 AAHUs of emergent wetland impacts. Alternatives 4 and 5 also meet these planning objectives, except their output exceeds the project plus disposal site impacts. Alternative 6 did not meet the objective to replace 0.699 AAHUs of forested wetland impacts. Therefore, Alternative 6 was not carried forward to evaluation in the CE/ICA.
10.3 Consideration of Risk in Mitigation AlternativesEach general type of mitigation strategy (e.g., onsite creation, mitigation banks) has risks for achieving successful mitigation. Some risks can be more easily anticipated, quantified, and accounted for in costs of implementation, while others are more rare or more situation-specific occurrences where expected costs through the 50-year period would be speculative. Literature examining causes of failures and measures for success of constructed wetlands was reviewed to aid in this discussion. The following sections discuss some of the risk factors associated with each mitigation strategy to assist in informing mitigation plan selection decisions.
10.3.1 Plant EstablishmentA retrospective study of the success and failure of constructed wetlands providing mitigation from 117 Federal Energy Regulatory Commission (FERC) permitted projects summarized common factors involved in constructed wetlands failing to achieve the basic FERC success criteria of sufficient wetland vegetation cover (80 percent), target diversity (at least 50 percent of the diversity of the original wetland), and attainment of Federal regulatory wetland identification characteristics (e.g., hydrophytic vegetation) (reference). Overall, approximately 35 percent of wetlands failed to meet all of the FERC criteria, with the most common cause being failure to meet the vegetation coverage, accounting for 24 percent of the 35 percent failure rate. However, the study authors recommended reconsideration of the vegetation coverage criteria, as some of those failures were attributed to wetlands having greater than 20 percent open water interspersed with wetland vegetation, a positive habitat trait. Given the measures for ensuring successful plant establishment discussed in the next paragraph, and the desirable attribute of standing water for the target wetlands, this major risk factor would be managed. The next largest cause, failure to meet the Federal regulatory hydrophytic wetland vegetation criterion, was involved in causing 14 percent of all wetlands to fail. Part of that risk would be similarly addressed by the plant establishment measures discussed in the next paragraph. Failing to meet the targeted plant diversity was involved in causing only 6 percent of all wetlands to fail. Although a desirable trait, the diversity criteria is less relevant to success as defined by the habitat models used in this mitigation planning study.
Generally, onsite wetland creation has been viewed as having more risks for achieving successful mitigation than the purchase of credits at an established, well-maintained, and well-monitored mitigation bank. However, inasmuch as many mitigation banks use constructed wetlands for part of the mitigating habitat, including the GBWMB, such mitigation banks have had some of the same risks as onsite creation, particularly during initial establishment. One of these risks is failure to achieve successful wetland vegetation establishment, or stated more directly for the case of this particular onsite creation alternative, planting failure. The costs for emergent wetland planting discussed in Section 10.1.1 include maintenance and monitoring for 5 years. With the relatively rapid growth to maturity of target wetland species, successful establishment
DRAFT Attachment D – Wetland Mitigation Plan and CE/ICA 10-15Hunting Bayou Flood Risk Management Project

within two years would typically be a warranty item in the wetland construction contract, and would address the risk of planting failure for emergent species. For forested wetland species, initial planting success would also be a warranty item, and the cost item for 2 years of post-planting maintenance and establishment monitoring would address reducing the risk of short-term growth success and providing conditions for continued successful growth, such as removing competing invasive species. The emergent and forested wetland species warranty requirements and post-planting monitoring and maintenance costs were derived from the same methods and costs used in establishment of GBWMB habitat. Therefore, the risk of initial vegetation establishment would be addressed by these costs, and conversely, the chance of initial planting success would be anticipated to be the same as the GBWMB.
10.3.2 HydrologyAnother general risk for wetlands is insufficient hydrology due to drought or climate change. Climate change was discussed in Section 6, and the predicted changes affecting hydrology and soil moisture for this region were equivocal. Because drought would affect the whole region, the risk for experiencing drought for both onsite creation and GBWMB credits would be the same.The intensity of the effect of drought on maintaining adequate hydrology may differ according to site-specific factors such as the size of the wetland compared to its hydrology source, and the “reserve” of impounded waters available to the wetland. Smaller wetlands could be subject to more rapid drying in periods of scarce rainfall. However, larger wetlands would have more water volume to fill to maintain depth. So, scarce rainfall could maintain depth over more of the smaller wetlands comparatively. GBWMB Subdivision B has a larger catchment area than would the offline basin wetlands, and has a collection of polishing ponds and surge basin that can provide managed reserves to release water as needed through drought periods. However, the onsite created wetlands would be small in size compared to the offline basin drainage catchment area that could provide hydrology, especially if the wetlands are located as downstream as possible in the basin drainage flow path. So a smaller rainfall could more readily inundate a smaller wetland. The larger inundated area of GBWMB emergent wetlands would serve as a buffer and heat sink against long-term evaporation compared to small onsite created wetlands. However, the onsite created wetlands could be designed with areas of greater depth at one end to store water to buffer against evaporative losses in shallower wetland areas. The Subdivision B Transitional Forest, where forested wetland credits would be obtained, has a drier hydroperiod than what would be targeted for onsite wetland creation. However, the AAHU score for the GBWMB alternatives did not depend on a hydrology variable, as the Mink model score was assumed to be zero due to lack of standing water for at least 3 consecutive months. Predicting the net effect of all of these factors to determine which wetlands, onsite creation or GBWMB would fare better through an extended drought, would be speculative.
A related risk is not achieving the intended hydrology to achieve the required mitigation. Astudy assessing soil and hydrologic properties for the successful creation of non-tidal wetlands discussed hydrologic attributes in relation to achieving proper or intended wetland soil conditions (Daniels and Whittecar 2004). One concern was the widespread use of mitigation designs that rely primarily on surface water hydrology and highly compacted and sealed subsoil layers to “perch” a wetland system, and essentially isolate it from ground water inputs and losses. The underlying concern was that many past wetland soil studies indicate that ground water input is a major component of many natural and created forested wetland sites, and the“perched wetland” designs may be substituting episaturated soils, where soil is saturated in a
DRAFT Attachment D – Wetland Mitigation Plan and CE/ICA 10-16Hunting Bayou Flood Risk Management Project

horizon that overlies an unsaturated horizon that lies within a depth of 2 m (approximately 6.6 ft) from the surface, for endosaturated soil systems, where soil is saturated in all horizons between the upper boundary of saturation and 2 meters. Natural perched wetlands are often considered a type of depressional wetland, whose typical characteristics include being relatively small (few acres or less), relying on surface water for hydrology, usually lacking channel inlets and outlets, and commonly occurring as inclusions in upland forests (Federal Energy Regulatory Commission (FERC). 2004. Research of Wetland Construction and Mitigation Activities for Certificated Section 7(C) Pipeline Projects. FERC Office of Energy Projects. Washington, D.C.). Many of the impacted wetlands fit this description. Given the typical 2-foot depth to highly impermeable clays indicated by offline detention basin soil borings and by project wetland soil station data, and the 15 to 18-foot depth to groundwater at the offline basin indicated by project geotechnical investigations (Appendix 3), many of the impacted wetlandswould be considered perched wetlands. Therefore, creating mitigation wetlands with a “perched” design would be recreating the soil systems of many of the impacted wetlands.
Detailed wetland design would consider whether a “perched” wetland approach, or an approach using groundwater recharge and a more permeable base for the primary hydrology, would be appropriate for the required inundation frequency and period. Wetland grading could include areas of greater depths (>1 ft) to decrease losses to evaporation, as wetlands are often designed to retain as much water as possible. For creation at the offline basin, the wetlands would be situated as downstream on the basin drainage way as practicable to increase the chance and frequency of intercepting site drainage or backflow/overflow from Hunting Bayou. Soils used for the wetland bottom could consist of highly impermeable clays for the “perched” approach.The majority of soils to be excavated for the offline basin and channel consists of low permeability clays and would be available for use. Since the groundwater elevation at the offline basin site is expected at depths of 15 to 18 feet below ground, which is essentially the depth range to which the basin would be excavated, the groundwater hydrology approach would also be feasible.
Because of the relatively low landscape position and elevation at which onsite created wetlands could be located, bayou overflow would also be a hydrology source in addition to surface runoff,and having sufficient hydrology would not be expected to be a major risk. The aforementioned design considerations would manage risk from other forms of hydrologic failure of wetlands.Therefore, hydrologic risks would not be expected to be greater for onsite creation than for initial establishment of the GBWMB.
10.3.3 Adequate Soil ConditionsAnother risk for achieving successful onsite wetland creation is having adequate soil conditions for wetland plant growth and desirable geochemical attributes. The FERC study examined underlying physical factors that might influence the causes of failure, and found clay-dominated soils were the most common in failing wetlands, associated with 53 percent of failing wetlands, followed by sand associated with 23 percent of failing wetlands. Some possible contributors discussed were the high water-holding capacity of clay particles, clay soil particles being plastic when wet and extremely hard to cemented when dry, and the fine-grained nature of clay supporting relatively low rates of germination, establishment, and survival of seeds. Daniels and Whittecar 2004 cited that sites having an adequate hydroperiod for wetland establishment otherwise suffered from very dry and hot mid-summer conditions due to causes that included
DRAFT Attachment D – Wetland Mitigation Plan and CE/ICA 10-17Hunting Bayou Flood Risk Management Project
adverse surface soil conditions of high clay content and bulk density and low organic matter, and lack of an insulating canopy and well-developed forest litter layer (Daniels and Whittecar 2004).Underlying causes attributed to clay soils cited were a lack of organic matter coupled with very low infiltration rates and water-holding capacity due to compaction preventing maintenance oflow reduction-oxidation (redox) soil conditions over the late spring through fall, which limits the competitiveness of wetland vegetation. The authors also implicated the widespread application of “perching designs” without sufficient low bulk density cover soil thickness leading to restricted rooting depth and productivity potentials.
Recommendations to avoid this type of problem included harvesting and reuse of existing impacted wetland soils, a practice known as “mucking,” to provide a 10-inch topsoil horizon, reducing subsoil bulk density to 1.35 Mg/m3 through chisel plowing or ripping in non-perched wetland designs, wood chip or leaf mulching, and a vegetation planting scheme that rapidly establishes summer canopy shade while not overly competing with planted wetland tree species.Other recommendations included soil amendments for organic content and pH control, andvariable microtopography recreation. Despite the difficulties cited with clay soils, local wetland construction projects, including those of the Local Sponsor, have been successful in an area with high clay content in native soils by using appropriate soils in the root growth horizon or sufficient soil preparation to avoid common problems. The onsite created wetlands would be designed and constructed to use many of these recommended techniques, including offline basin existing wetland soil harvesting, soil preparation, mulching, and organic amendment. Therefore, the risk of failure due to inadequate soil conditions would be managed.
10.4 Display of Incremental Costs – CE/ICA ResultsThe 5 remaining alternatives from the preceding step, consisting of Alternatives 1 through 5, were analyzed in the CE/ICA. The mitigation planning was conducted to address mitigating the forested and emergent wetland impacts together at various increments of compensation. That is, each alternative was formulated to provide compensation for all of the types of wetland impacts at various ratios of mitigation. Also, the size of onsite emergent wetland creation was dependent on the forested wetland creation, due to the emergent wetland model CANEDGE being provided by the forested wetland canopy. Also, to meet the mitigation ratio targets of each increment, certain sizes of one wetland type were modeled and conceived to be paired with another certain size and type of wetland to avoid mixing measures that mitigated at different ratios. This required the measures that provided mitigation for a certain type and size of wetland impact (e.g.,forested, emergent) to be combined with those of another type and size to meet this planning objective. Therefore, to simplify the analysis within the IWR Plan, alternatives consisting of the required combinations of measures were entered directly as plans, instead of entering individual measures and using the automated plan generator to generate the needed alternatives. The No Mitigation plan is equivalent to the With Project condition analyzed in Section 5.0; it is implementation of the recommended flood damage reduction project with no mitigation. The CE/ICA analysis routine was then applied for the 5 alternatives and the No Action plan. The results are shown in Figures 1, 2, and 3.
DRAFT Attachment D – Wetland Mitigation Plan and CE/ICA 10-18Hunting Bayou Flood Risk Management Project

Figure 1 shows the costs and outputs for all mitigation alternatives differentiated by cost effectiveness. Based on the cost effectiveness analysis, Alternative 1 produces the same amount of AAHUs as Alternative 2 for a slightly higher cost. Alternative 3 produces the same amount of AAHUs at lesser cost than Alternatives 1 or 2. Alternative 5 produces a greater amount of AAHUs than Alternative 4 for a slightly lower cost. Therefore, Alternatives 3 and 5 are the only cost-effective alternatives. There is little difference in cost between Alternative 1 and Alternative 2 because the mitigation methods and, therefore, the assumed cost factors, are almost the same. Only the minor extra costs for two geographically separated sites of Alternative 1cause Alternative 2 to be more cost-effective. There is little difference in cost between Alternatives 4 and 5 for the same reasons.
Figure 1: IWR-Plan Cost vs. Output Graph for All Alternatives
AAHUs, CostAlternative 1 Alternative 2
Alternative 3
Alternative 4
AAHUs, Cost
No MitigationAAHUs, Cost
Alternative 5
AAHUs, Cost
DRAFT Attachment D – Wetland Mitigation Plan and CE/ICA 10-19Hunting Bayou Flood Risk Management Project

Figure 2: IWR-Plan Cost vs. Output Graph for Cost-Effective Alternatives
Figure 3: IWR-Plan ICA Graph of “Best Buy” Alternatives
No Action
Alternative 5
Alternative 5
Alternative 3
DRAFT Attachment D – Wetland Mitigation Plan and CE/ICA 10-20Hunting Bayou Flood Risk Management Project

The average cost per AAHU was calculated for each mitigation alternative (Table 38). This quantity is variously referred to in USACE CE/ICA guidance as average cost, cost per unit of output, or average cost per unit of output. It is calculated by dividing the total cost by the output (AAHUs). Of the two cost-effective alternatives, the average cost per AAHU for Alternative 3 is $81,270, and the average cost per AAHU for Alternative 5 is $75,496. Alternative 5 provides the lowest average cost per AAHU of all alternatives. Figure 2 shows the costs and outputs of the cost effective alternatives. The decision logic for an ICA is documented in Chapter 3 of the IWR publication Cost Effectiveness for Environmental Planning: Nine Easy Steps, and implemented in the IWR-Plan software. Steps 4 through 7 of this logic require identifying “bestbuy” plans by picking the lowest cost per output solution from the cost effective solutions, eliminating those with less output, then incrementally determining the next lowest cost per output solution at higher plan output increments. According to this logic, Alternative 3 would be eliminated, and only Alternative 5 would remain in the ICA for the following reasons:
Step 4 – eliminate economically inefficient solutions (identify most cost effective solutions at each level of output): Alternatives 3 and 5 are identified as the most cost-effective alternatives at their respective levels of output, and Alternatives 1, 2, and 4 are eliminated.
Step 5 – eliminate economically ineffective solutions: Economically ineffective solutions are those solutions in the cost effective set where there are other higher output solutions that cost less. No such alternatives exist.
Step 6 – calculate average costs (identify most efficient of remaining cost effective alternatives): Alternative 5 is the lowest cost per output solution between the remaining solutions (Alternatives 3 and 5). Solutions with levels of output lower than this alternative are eliminated from further analysis (Alternative 3), while solutions with output greater than this also remain (no other solutions).
Therefore, Alternative 5 remains when following these steps The ICA cannot be carried out further, and it is the only solution identified as a “best buy.” Figure 3 shows the results of the incremental cost analysis in terms of incremental cost per unit of output (measured as AAHUs).
Table 38: Average Cost per AAHU for All Alternatives
Name Output (AAHU) Total Cost ($) Average Cost/AAHU
No Action Plan 0.000Alternative 1 1.27 $ 128,840 $ 101,609Alternative 2 1.27 $ 126,425 $ 99,626Alternative 3 1.27 $ 103,131 $ 81,270
Alternative 4 2.63 $ 210,092 $ 79,853
Alternative 5 2.77 $ 209,803 $ 75,796
DRAFT Attachment D – Wetland Mitigation Plan and CE/ICA 10-21Hunting Bayou Flood Risk Management Project
Based on the CE/ICA, Alternative 3 is the alternative with the lowest average cost per AAHU and the lowest total cost that provides the minimum 1.27 AAHUs required to mitigate for wetland impacts associated with the Hunting Bayou Flood Risk Management Project. It is the least cost mitigation plan that provides full mitigation of losses specified in the mitigation planning objectives. It was not among the “best buy” alternatives in this particular analysis however, for the reasons discussed in the previous two paragraphs. At the higher levels of output (2.77 AAHUs), Alternative 5 provides the lowest average cost per AAHU and costs less thanAlternative 4, which has a lower output. Alternative 5 has a lower cost per AAHU because the fixed lump sum costs that are not calculated based on acreage, such as long-term monitoring, do not increase with the larger size alternatives. Therefore, these costs become a smaller percentage of the quantities used to calculate average cost per AAHU.
Although Alternative 5 is identified by the CE/ICA as the only “best buy,” ER 1105-2-100, Appendix C, Paragraph C-3, e.(2), which discusses justification of the plan selected, does not require the recommended mitigation plan to be chosen from the “best buy” plans. It only requires that the most cost-effective mitigation measures have been selected. Also, Paragraph C-3, e.(4), discussing the range of alternatives to analyze states, “mitigation planning shall address a range of alternatives up to the full compensation of significant ecological resource losses.” The phrase “up to the full compensation” would indicate that mitigation increments of output in excess of the project impacts need not be analyzed or considered further. When Alternative 5 is eliminated to follow ER 1105-2-100, Appendix C, Paragraph C-3, e.(4), Alternative 3 becomes the most cost effective plan that compensates up to the full compensation of significant ecological resources. It also costs less than half of what Alternative 5 costs. Therefore, Alternative 3, which provides most cost effective mitigation up to the full compensation of significant ecological resources losses, is selected as the justified mitigation plan for the impacts of the TSP.
DRAFT Attachment D – Wetland Mitigation Plan and CE/ICA 10-22Hunting Bayou Flood Risk Management Project

11.0 MITIGATION PLAN FOR THE TSP
The preceding mitigation planning and CE/ICA demonstrated that the mitigation plan justified for the TSP is Alternative 3, GBWMB Subdivision B Forested and Emergent Wetland Credits equal to 1.27 AAHUs. The required credits would be purchased prior to project impacts on wetlands. The 31 August 2009 CECW-PC policy memorandum on “Implementation Guidance for Section 2036 (a) of the Water Resources Development Act (WRDA) of 2007 – Mitigation for Fish and Wildlife and Wetland Losses” requires civil works project decision documents to describe the 6 elements of a mitigation plan required under USACE regulatory programs. Many of these elements are intended to address provisions for successful mitigation through applicant habitat restoration or creation. Because the proposed mitigation is purchase of credits at an already-established, monitored, and regulated mitigation bank, many of these elements do not directly apply. The following is a discussion of those 6 elements for the proposed mitigation plan.
1) A description of the physical action to be undertaken to achieve the mitigation objectives within the watershed in which such losses occur and, in any case in which mitigation must take place outside the watershed, a justification detailing the rationale for undertaking the mitigation outside of the watershed;
The action will consist of purchase of credits at GBWMB, which is the bank in the watershed service area for Hunting Bayou, and will consist of the following:
Purchase of 4.33 acres of forested wetland credits in the Transitional Forest of GBWMB Subdivision B to offset 0.699 AAHUs of forested wetland impacts
Purchase of 0.83 acre of emergent wetland credits in the WQF of GBWMB Subdivision B to offset 0.570 AAHUs of emergent wetland impacts
Hunting Bayou is part of the major USGS HUC in which GBWMB is located. No mitigation will take place outside of the watershed.
2) The type, amount, and characteristics of the habitat being restored;
No habitat is being restored. Credits at GBWMB, which contains established forested wetland and emergent wetland, are proposed for purchase to mitigate losses.
3) Ecological success criteria for mitigation based on replacement of lost functions and values of the habitat, including hydrologic and vegetative characteristics. The ecologicalsuccess criteria should be included in the draft feasibility report;
GBWMB Subdivision B is an already-established mitigation bank that is monitored and maintained to meet operational requirements. The replacement of lost functions and value of the habitat were predicated on purchase of the requisite credits demonstrated by the habitat modeling, whose score depended largely on values for hydrologic and vegetative variables reflective of mature, established, and managed habitat. Mitigation success would be inherent in the monitoring, managing, and controlling of hydrology
DRAFT Attachment D – Wetland Mitigation Plan and CE/ICA 11-1Hunting Bayou Flood Risk Management Project

and vegetative cover already performed as part of mitigation bank operations, and in the continued maturation of tree canopy and trunk diameter in established forest.
4) A plan for monitoring to determine the success of the mitigation, including the cost and duration of any monitoring and the entities responsible for any monitoring. If it is not practicable to identify the entities responsible for monitoring in the project decision document, the responsible parties will be identified in the project partnership agreement.
Not applicable. The proposed mitigation involves purchase of credits at an already-established bank. The GBWMB is already monitored under regulation of its operation as a mitigation bank, as set forth in a 1995 Memorandum of Agreement (MOA) between HCFCD, the USACE, and members of the Interagency Review Team (IRT). The IRT includes representatives from the US Environmental Protection Agency, US Fish and Wildlife Service, Texas Parks and Wildlife Department, Texas General Land Office, and Texas Commission on Environmental Quality.
5) A contingency plan (i.e., adaptive management) for taking corrective actions in cases where monitoring demonstrates that mitigation measures are not achieving ecological success.
Not applicable. The proposed mitigation involves purchase of credits at an already-established bank. The GBWMB already operates and is regulated under the aforementioned 1995 MOA. The bank is actively managed to ensure hydrological and vegetation habitat parameters are met, including management and corrective measures when drought, feral hog damage, or other events affect established habitat.
6) Should land acquisition be proposed as part of the mitigation plan, a description of the lands or interests in lands to be acquired for mitigation and the basis for a determination that such lands are available for acquisition;
Not applicable. No land is being purchased as part of the proposed mitigation.
DRAFT Attachment D – Wetland Mitigation Plan and CE/ICA 11-2Hunting Bayou Flood Risk Management Project

12.0 REFERENCES
1. Coder, K. 1996. Tree Growth Rate: Area Increase Table. University of Georgia Cooperative Extension Service Forest Resources Unit FOR96-50. Available from the World Wide Web at warnell.forestry,usga.edu/service/library/for96-049/index.html.
2. Daniels, W.L. and G.R. Whittecar. 2004. Assessing Soil and Hydrologic Properties for the Successful Creation of Non-Tidal Wetlands. Pp. 114-124. In: A Guide to Hydric Soils in the Mid-Atlantic Region, ver. 1.0, Mid-Atlantic Hydric Soils Committee, Vasilas,L.M. and Vasilas, B.L. (eds.) USDA, NRCS, Morgantown, WV.
3. Intergovernmental Panel on Climate Change (IPCC). 2007. Climate Change 2007: Synthesis Report. Contribution of Working Groups I, II and III to the Fourth Assessment Report of the Intergovernmental Panel on Climate Change [Core Writing Team, Pachauri, R.K and Reisinger, A. (eds.)]. IPCC, Geneva, Switzerland, 104 pp.
4. Mills, B. Undated. The Brooks and Neil Tree Investment Chart. USDA, Forest Service. Available from the World Wide Web at www/na.fs.fed.us/stewardship/pubs/books_chart/brooks_chart.html [Accessed 11/4/2008]
5. Nash, A.J., 1959. Growth in Well-Stocked Natural Oak Stands in Missouri, Research Bulletin 700, University of Missouri, College of Agriculture, Agricultural Experiment station.
6. Ning, Z.H., R.E. Turner, T. Doyle, K. Abdollahi. 2003. Integrated Assessment of the Climate Change Impacts on the Gulf Coast Region. GCRCC and LSU Graphic Services.
7. PBS&J, 2007, White Oak Bayou, Federal Flood Control Project, HCFCD Project ID E100-00-00-Y001, Habitat Evaluation Procedure Analysis, Project Impact and Mitigation Alternatives Analysis, Harris County, Texas, Table 7 Water Oak (Quercus nigra) Growth Rates, Page 3-7.
8. U.S. Army Corps of Engineers. 2000. Engineer Regulation 1105-2-100 Planning Guidance Notebook. Department of the Army, U.S. Army Corps of Engineers, Washington, D.C.
9. ———. 2008. Memorandum concerning Policy Guidance on Certification of Ecosystem Output Models. August 13, 2008. Steven L. Stockton, P.E., Director of Civil Works. Headquarters U.S. Army Corps of Engineers, Civil Works Directorate, Policy & Policy Compliance Division (CECW-CP). Washington, D.C..
10. U.S. Climate Change Science Program (USCCSP). 2008. Impacts of Climate Change and Variability on Transportation Systems and Infrastructure: Gulf Coast Study, Phase I. A Report by the U.S. Climate Change Science Program and the Subcommittee on Global Change Research [Savonis, M. J., V.R. Burkett, and J.R. Potter (eds.)]. U.S. Department of Transportation, Washington, DC, USA, 445 pp.
DRAFT Attachment D – Wetland Mitigation Plan and CE/ICA 12-1Hunting Bayou Flood Risk Management Project

11. U.S. Fish and Wildlife Service (USFWS). 1980. Habitat Evaluation Procedures (HEP), Ecological Services Manual (ESM) 102. Division of Ecological Services, U.S. Fish and Wildlife Service, Department of the Interior, Washington, D.C.
12. Wetland Solutions, Inc. (WSI) in association with Parsons. 2008. Lake Hancock Plant Establishment Study, Final Report. Technical report prepared for the Southwest Florida Water Management District. WSI. Gainesville, Florida.
DRAFT Attachment D – Wetland Mitigation Plan and CE/ICA 12-2Hunting Bayou Flood Risk Management Project
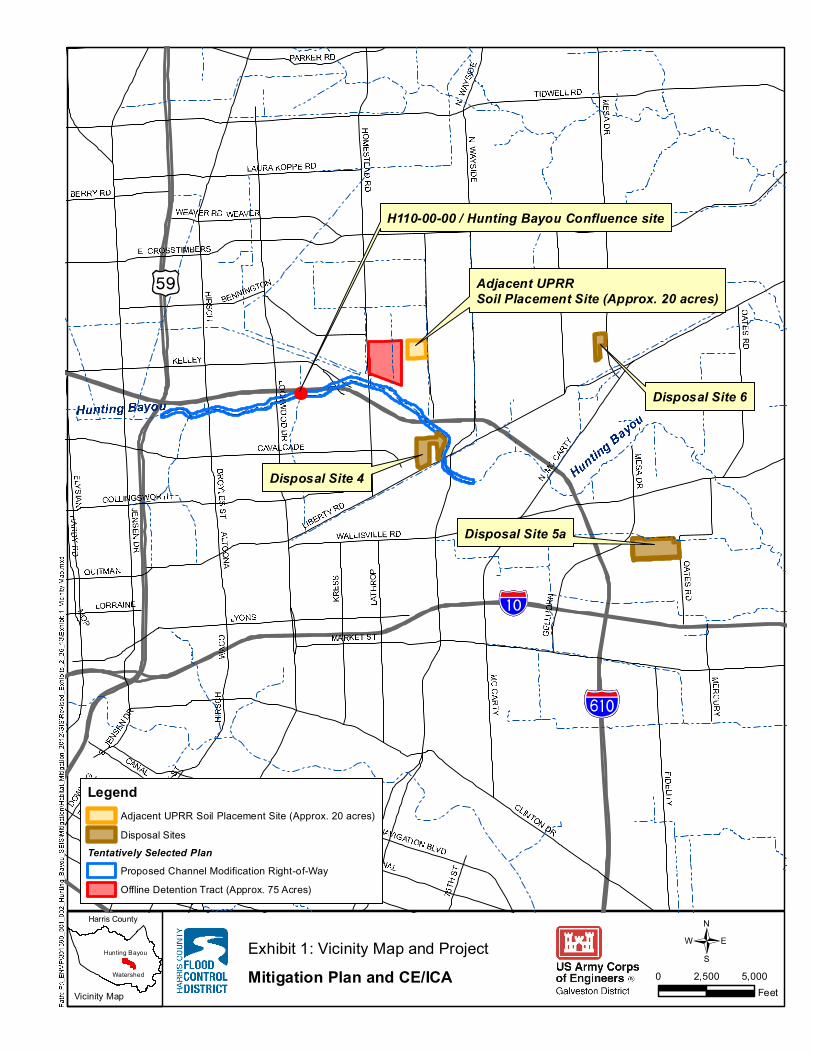

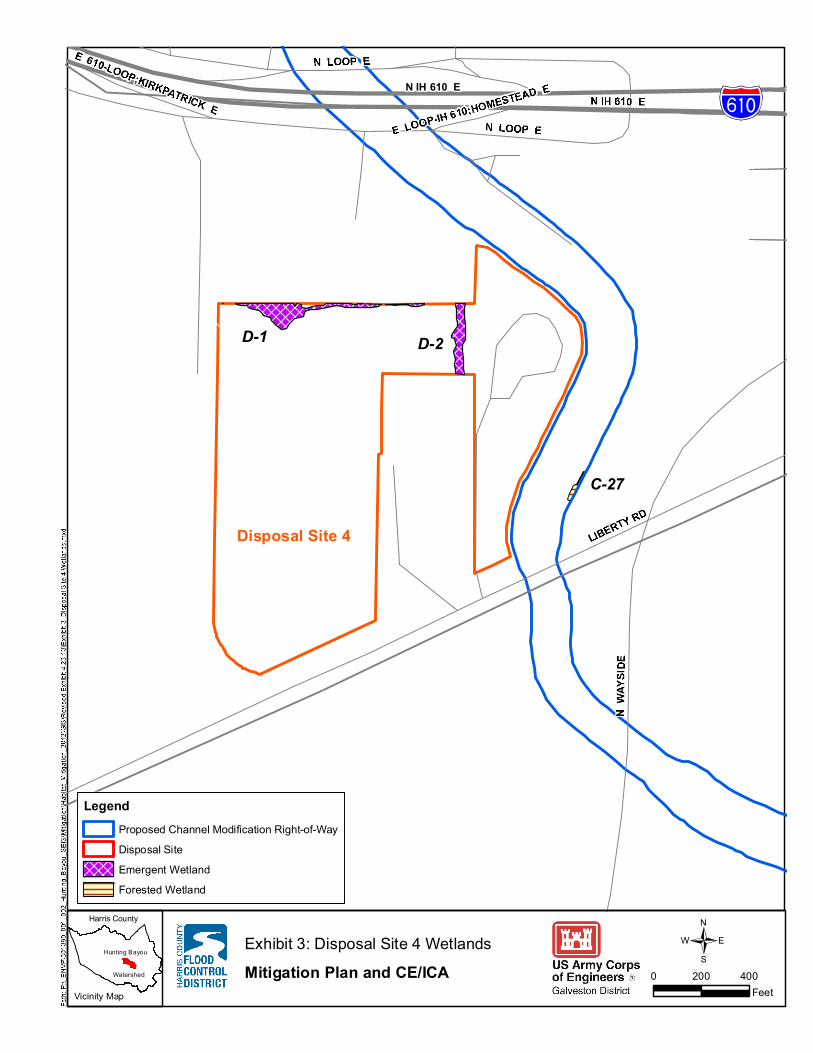


Attachment E
Section 404(b)(1) Evaluation
TCEQ 401 Certification
TCEQ 401 certification requires completion of a Tier II questionnaire and Tier II Alternatives Analysis Checklist. The questionnaire and checklist ask specific questions concerning construction, operation, and maintenance activities that may impact water quality (surface waters of the State). Further, the checklist is designed to determine if alternatives were considered that would limit impacts to surface waters. The questionnaire and checklist will be filled out with specific references to the GRR/EA that are responsive to the questions/concerns. Once completed the TCEQ 401 questionnaire and checklist will be located after the 404(b)(1) short form.
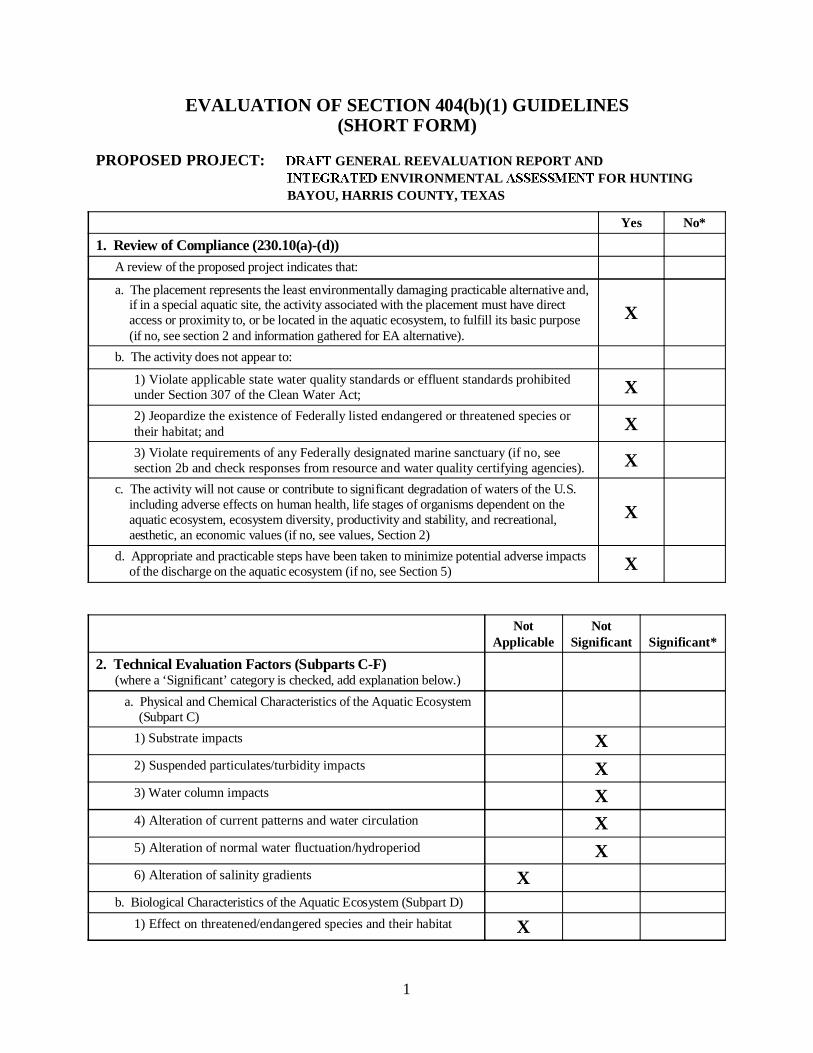
1
EVALUATION OF SECTION 404(b)(1) GUIDELINES(SHORT FORM)
PROPOSED PROJECT: GENERAL REEVALUATION REPORT AND ENVIRONMENTAL FOR HUNTING
BAYOU, HARRIS COUNTY, TEXAS
Yes No*
1. Review of Compliance (230.10(a)-(d))A review of the proposed project indicates that:
a. The placement represents the least environmentally damaging practicable alternative and,if in a special aquatic site, the activity associated with the placement must have directaccess or proximity to, or be located in the aquatic ecosystem, to fulfill its basic purpose(if no, see section 2 and information gathered for EA alternative).
X
b. The activity does not appear to:
1) Violate applicable state water quality standards or effluent standards prohibitedunder Section 307 of the Clean Water Act; X2) Jeopardize the existence of Federally listed endangered or threatened species ortheir habitat; and X3) Violate requirements of any Federally designated marine sanctuary (if no, seesection 2b and check responses from resource and water quality certifying agencies). X
c. The activity will not cause or contribute to significant degradation of waters of the U.S.including adverse effects on human health, life stages of organisms dependent on theaquatic ecosystem, ecosystem diversity, productivity and stability, and recreational,aesthetic, an economic values (if no, see values, Section 2)
X
d. Appropriate and practicable steps have been taken to minimize potential adverse impactsof the discharge on the aquatic ecosystem (if no, see Section 5) X
NotApplicable
NotSignificant Significant*
2. Technical Evaluation Factors (Subparts C-F)(where a ‘Significant’ category is checked, add explanation below.)
a. Physical and Chemical Characteristics of the Aquatic Ecosystem(Subpart C)
1) Substrate impacts X2) Suspended particulates/turbidity impacts X3) Water column impacts X4) Alteration of current patterns and water circulation X5) Alteration of normal water fluctuation/hydroperiod X6) Alteration of salinity gradients X
b. Biological Characteristics of the Aquatic Ecosystem (Subpart D)1) Effect on threatened/endangered species and their habitat X
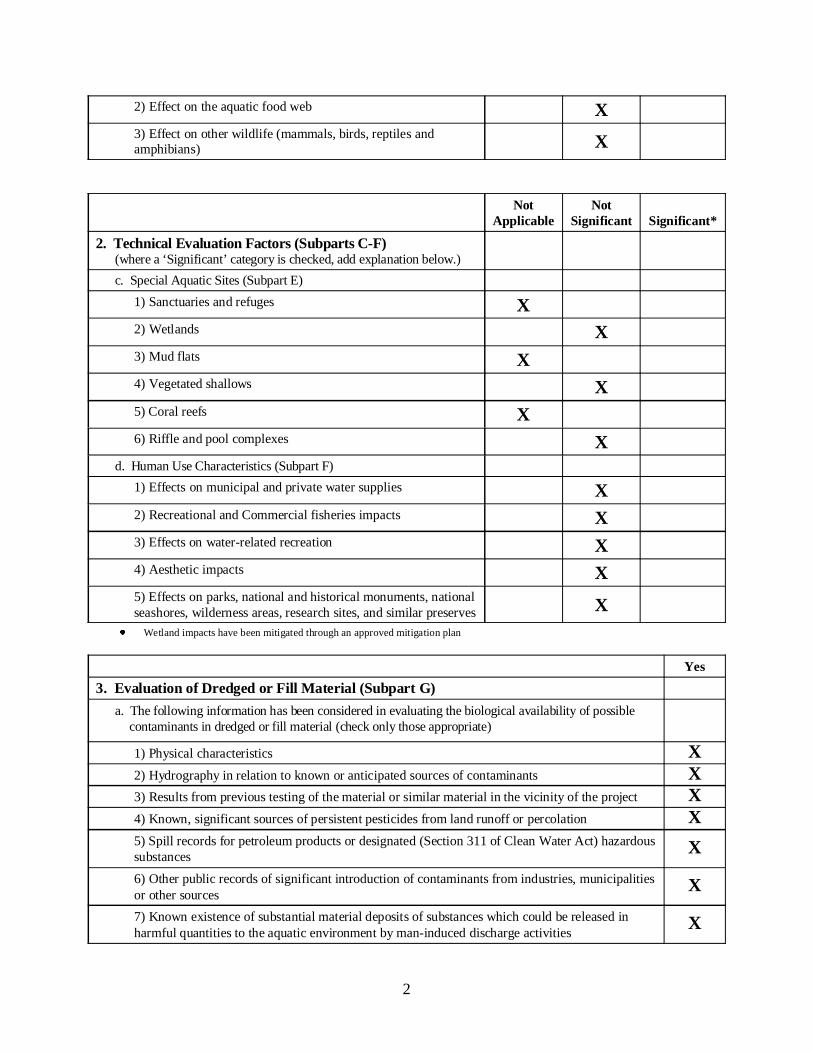
2
2) Effect on the aquatic food web X3) Effect on other wildlife (mammals, birds, reptiles andamphibians) X
NotApplicable
NotSignificant Significant*
2. Technical Evaluation Factors (Subparts C-F)(where a ‘Significant’ category is checked, add explanation below.)c. Special Aquatic Sites (Subpart E)
1) Sanctuaries and refuges X2) Wetlands X3) Mud flats X4) Vegetated shallows X5) Coral reefs X6) Riffle and pool complexes X
d. Human Use Characteristics (Subpart F)1) Effects on municipal and private water supplies X2) Recreational and Commercial fisheries impacts X3) Effects on water-related recreation X4) Aesthetic impacts X5) Effects on parks, national and historical monuments, nationalseashores, wilderness areas, research sites, and similar preserves X
Wetland impacts have been mitigated through an approved mitigation plan
Yes3. Evaluation of Dredged or Fill Material (Subpart G)
a. The following information has been considered in evaluating the biological availability of possiblecontaminants in dredged or fill material (check only those appropriate)
1) Physical characteristics X2) Hydrography in relation to known or anticipated sources of contaminants X3) Results from previous testing of the material or similar material in the vicinity of the project X4) Known, significant sources of persistent pesticides from land runoff or percolation X5) Spill records for petroleum products or designated (Section 311 of Clean Water Act) hazardoussubstances X6) Other public records of significant introduction of contaminants from industries, municipalitiesor other sources X7) Known existence of substantial material deposits of substances which could be released inharmful quantities to the aquatic environment by man-induced discharge activities X

3
8) The material to be placed in the water consists of sand and rock. The material is considered tobe exempt from contaminant testing. NA
List appropriate references:
Yes Nob. An evaluation of the appropriate information in 3a above indicates that there is reason to
believe the proposed dredge or fill material is not a carrier of contaminants, or that levelsof contaminants are substantively similar at extraction and placement sites and not likelyto degrade the placement sites, or the material meets the testing exclusion criteria.
X
Yes4. Placement Site Delineation (230.11(f)) NA
a. The following factors as appropriate, have been considered in evaluating the placement site:
1) Depth of water at placement site
2) Current velocity, direction, and variability at placement site3) Degree of turbulence
4) Water column stratification
5) Discharge vessel speed and direction
6) Rate of discharge
7) Fill material characteristics (constituents, amount, and type of material, settling velocities)
8) Number of discharges per unit of time
9) Other factors affecting rates and patterns of mixing (specify)List appropriate references:
1) not applicable
Yes Nob. An evaluation of the appropriate factors in 4a above indicates that the placement site
and/or size of mixing zone are acceptable. NA
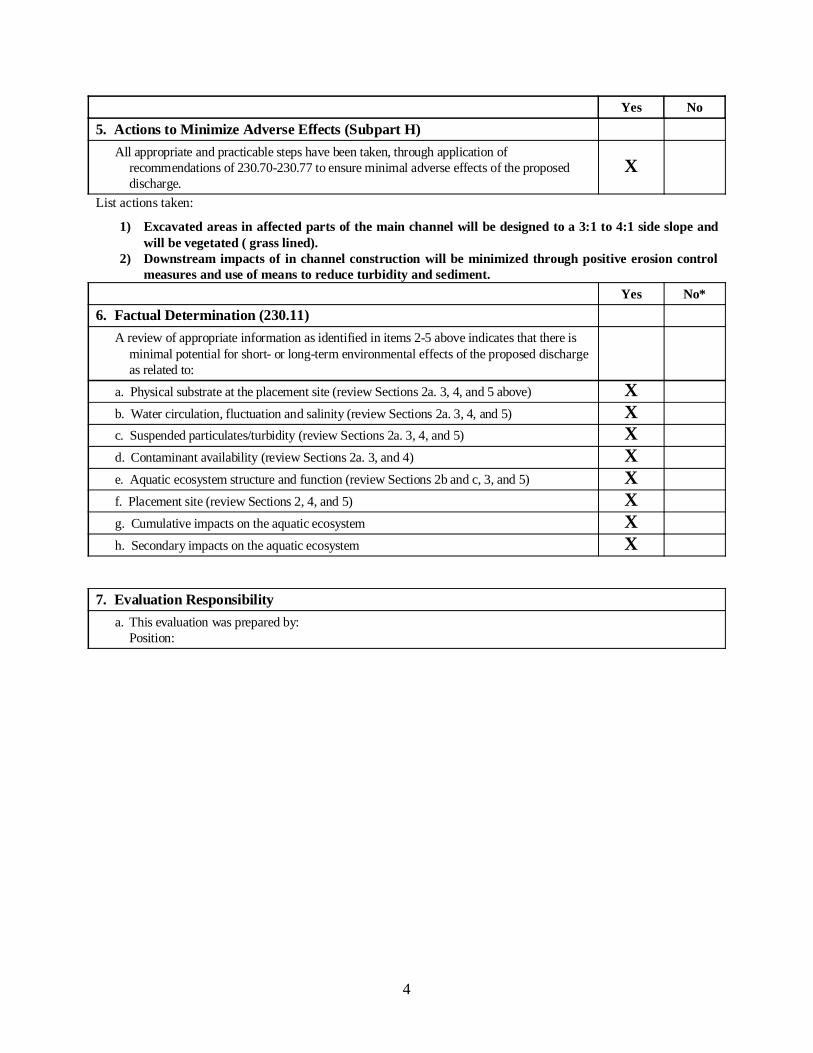
4
Yes No
5. Actions to Minimize Adverse Effects (Subpart H)All appropriate and practicable steps have been taken, through application of
recommendations of 230.70-230.77 to ensure minimal adverse effects of the proposeddischarge.
X
List actions taken:
1) Excavated areas in affected parts of the main channel will be designed to a 3:1 to 4:1 side slope andwill be vegetated ( grass lined).
2) Downstream impacts of in channel construction will be minimized through positive erosion controlmeasures and use of means to reduce turbidity and sediment.
Yes No*6. Factual Determination (230.11)
A review of appropriate information as identified in items 2-5 above indicates that there isminimal potential for short- or long-term environmental effects of the proposed dischargeas related to:
a. Physical substrate at the placement site (review Sections 2a. 3, 4, and 5 above) Xb. Water circulation, fluctuation and salinity (review Sections 2a. 3, 4, and 5) Xc. Suspended particulates/turbidity (review Sections 2a. 3, 4, and 5) Xd. Contaminant availability (review Sections 2a. 3, and 4) Xe. Aquatic ecosystem structure and function (review Sections 2b and c, 3, and 5) Xf. Placement site (review Sections 2, 4, and 5) Xg. Cumulative impacts on the aquatic ecosystem Xh. Secondary impacts on the aquatic ecosystem X
7. Evaluation Responsibilitya. This evaluation was prepared by:
Position:

5
8. Findings Yesa. The proposed placement site for discharge of or fill material complies with the Section 404(b)(1)
Guidelines. Xb. The proposed placement site for discharge of dredged or fill material complies with the
Section 404(b)(1) Guidelines with the inclusion of the following conditions: XList of conditions:
1) not applicable
c. The proposed placement site for discharge of dredged or fill material does not comply with the Section404(b)(1) Guidelines for the following reason(s):1) There is a less damaging practicable alternative
2) The proposed discharge will result in significant degradation of the aquatic ecosystem
3) The proposed discharge does not include all practicable and appropriate measures to minimizepotential harm to the aquatic ecosystem
____________________Date
_____________________________________________________[NAME][Title]
NOTES:* A negative, significant, or unknown response indicates that the permit application may not be in
compliance with the Section 404(b)(1) Guidelines.
Negative responses to three or more of the compliance criteria at the preliminary stage indicatethat the proposed projects may not be evaluated using this “short form” procedure. Care shouldbe used in assessing pertinent portions of the technical information of items 2a-e beforecompleting the final review of compliance.
Negative response to one of the compliance criteria at the final stage indicates that the proposedproject does not comply with the Guidelines. If the economics of navigation and anchorage ofSection 404(b)(2) are to be evaluated in the decision-making process, the “short form” evaluationprocess is inappropriate.

Attachment F
Cultural Resources Report
(Available by Request from USACE – Galveston District)

Attachment G
Coordination
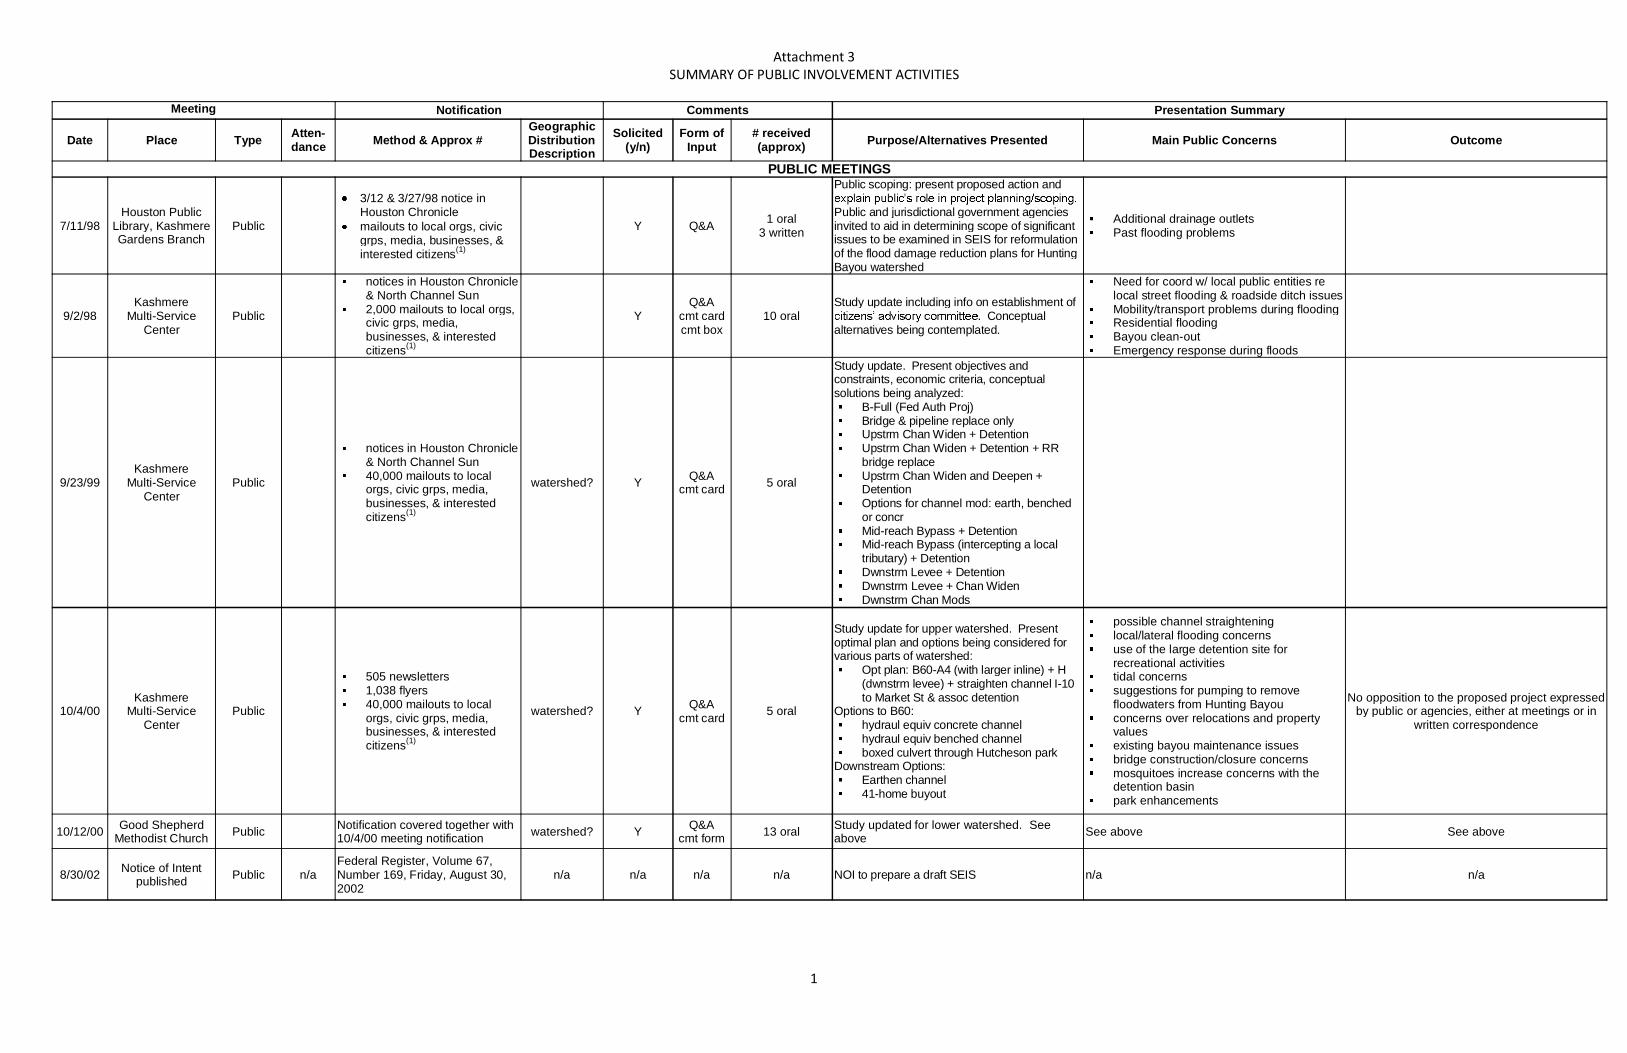
Attachment 3 SUMMARY OF PUBLIC INVOLVEMENT ACTIVITIES
1
Meeting Notification Comments Presentation Summary
Date Place Type Atten-dance Method & Approx #
Geographic Distribution Description
Solicited (y/n)
Form of Input
# received (approx) Purpose/Alternatives Presented Main Public Concerns Outcome
PUBLIC MEETINGS
7/11/98 Houston Public
Library, Kashmere Gardens Branch
Public
3/12 & 3/27/98 notice in Houston Chronicle
mailouts to local orgs, civic grps, media, businesses, & interested citizens(1)
Y Q&A 1 oral 3 written
Public scoping: present proposed action and
Public and jurisdictional government agencies invited to aid in determining scope of significant issues to be examined in SEIS for reformulation of the flood damage reduction plans for Hunting Bayou watershed
Additional drainage outlets Past flooding problems
9/2/98 Kashmere
Multi-Service Center
Public
notices in Houston Chronicle & North Channel Sun
2,000 mailouts to local orgs, civic grps, media, businesses, & interested citizens(1)
Y Q&A
cmt card cmt box
10 oral Study update including info on establishment of
. Conceptual alternatives being contemplated.
Need for coord w/ local public entities re local street flooding & roadside ditch issues
Mobility/transport problems during flooding Residential flooding Bayou clean-out Emergency response during floods
9/23/99 Kashmere
Multi-Service Center
Public
notices in Houston Chronicle & North Channel Sun
40,000 mailouts to local orgs, civic grps, media, businesses, & interested citizens(1)
watershed? Y Q&A cmt card 5 oral
Study update. Present objectives and constraints, economic criteria, conceptual solutions being analyzed:
B-Full (Fed Auth Proj) Bridge & pipeline replace only Upstrm Chan Widen + Detention Upstrm Chan Widen + Detention + RR
bridge replace Upstrm Chan Widen and Deepen +
Detention Options for channel mod: earth, benched
or concr Mid-reach Bypass + Detention Mid-reach Bypass (intercepting a local
tributary) + Detention Dwnstrm Levee + Detention Dwnstrm Levee + Chan Widen Dwnstrm Chan Mods
10/4/00 Kashmere
Multi-Service Center
Public
505 newsletters 1,038 flyers 40,000 mailouts to local
orgs, civic grps, media, businesses, & interested citizens(1)
watershed? Y Q&A cmt card 5 oral
Study update for upper watershed. Present optimal plan and options being considered for various parts of watershed:
Opt plan: B60-A4 (with larger inline) + H (dwnstrm levee) + straighten channel I-10 to Market St & assoc detention
Options to B60: hydraul equiv concrete channel hydraul equiv benched channel boxed culvert through Hutcheson park
Downstream Options: Earthen channel 41-home buyout
possible channel straightening local/lateral flooding concerns use of the large detention site for
recreational activities tidal concerns suggestions for pumping to remove
floodwaters from Hunting Bayou concerns over relocations and property
values existing bayou maintenance issues bridge construction/closure concerns mosquitoes increase concerns with the
detention basin park enhancements
No opposition to the proposed project expressed by public or agencies, either at meetings or in
written correspondence
10/12/00 Good Shepherd Methodist Church Public
Notification covered together with 10/4/00 meeting notification watershed? Y Q&A
cmt form 13 oral Study updated for lower watershed. See above See above See above
8/30/02 Notice of Intent published Public n/a
Federal Register, Volume 67, Number 169, Friday, August 30, 2002
n/a n/a n/a n/a NOI to prepare a draft SEIS n/a n/a

Attachment 3 SUMMARY OF PUBLIC INVOLVEMENT ACTIVITIES
2
Meeting Notification Comments Presentation Summary
Date Place Type Atten-dance Method & Approx #
Geographic Distribution Description
Solicited (y/n)
Form of Input
# received (approx) Purpose/Alternatives Presented Main Public Concerns Outcome
3/25/03 Kashmere
Multi-Service Center
Public 375 6,000-7,000 mailouts upper watershed Y
Q&A cmt
form(2)
16 oral 169 cmt frm
Study update. Present 5 alternatives being considered for upper watershed
No Action A3 + X3 B60-A3 + X1 B60-A3 C (watershed buyout)
impacts of forced relocations and buyouts on elderly and low income
general land acquisition process
Public generally agreed some type of measures should necessary; however, had concerns listed to left. Feedback resulted in 4/21/03 concrete
channel alternative
4/21/03 Francis Scott Key Middle School Public
Notification covered together with 3/25/03 meeting notification
upper watershed Y
Q&A cmt
form(2)
12 oral 165 cmt frm
Study update. Present 6 alternatives being considered for upper watershed
Same five as above B50C (concrete channel) + A3
11/10/07 St. Francis of
Assisi Catholic Church
Public 325 7,500 mailouts
½ mile of Hunting US 59 to Wayside + properties adj to offline basin
(Comp A)
Present information of project being considered for Hunting Bayou
1/09/10 Barbara Jordan High School Public 130
7,500 mailouts 7,500 reminder mailouts flyers at 20 local businesses
½ mile of Hunting US 59 to Wayside + properties adj to offline basin
(Comp A)
Y Q&A
cmt card questnr
Provide information about the status of Project Hunting, what has been accomplished and what the next steps are. Info presented included:
Basic project features The flood reduction benefits Planned property acquisitions (~80) Final alignment changes Progress
Numerous including following: Project timeline Impacts on elderly Need for use of money on jobs instead of
impacts on African Americans Flooding concerns before project is built Home valuation, need for new mortages Needed channel dimensions Bayou and drainage maintenance
MEETINGS WITH IMPACTED RESIDENTS
4/28/07
The Hill at Sims, Willow Waterhole, Keith-Wiess Park,
Hunting Bayou basin site
Tour
Bus tour provided an opportunity for residents to see different design features at each of the basins to gain a better understand how they work and what will take place at the Hunting Bayou site.
11/14/09 Barbara Jordan High School Imp Res 46 83 mailouts project Y Q&A
Several questions during the Q&A
session. 16 indicated in
transcript)
Meet with impacted property owners about the right-of-way acquisition process. Key points
Project Hunting goal is substantially reducing flooding risks and damages along the bayou, as well sensitivity to community needs and natural values
To build this project, land acquisition in needed
The property acquisition process is simple and straightforward
HCFCD is there to assist property owners during the acquisition process
Parents are too old to move Other areas in the community are not as
safe as where I live Renters may not be able to find affordable
housing and compatible to where they are currently living.
11/17/09
12/31/09
Precinct One Calvalcade Office, Imp Res 38
38 one-on-one meetings with impacted property owners
door to door to delivery of handout materials and schedule meetings for those unable to attend
project Y Q&A Answer questions specific to individual owners whose property is being acquired.
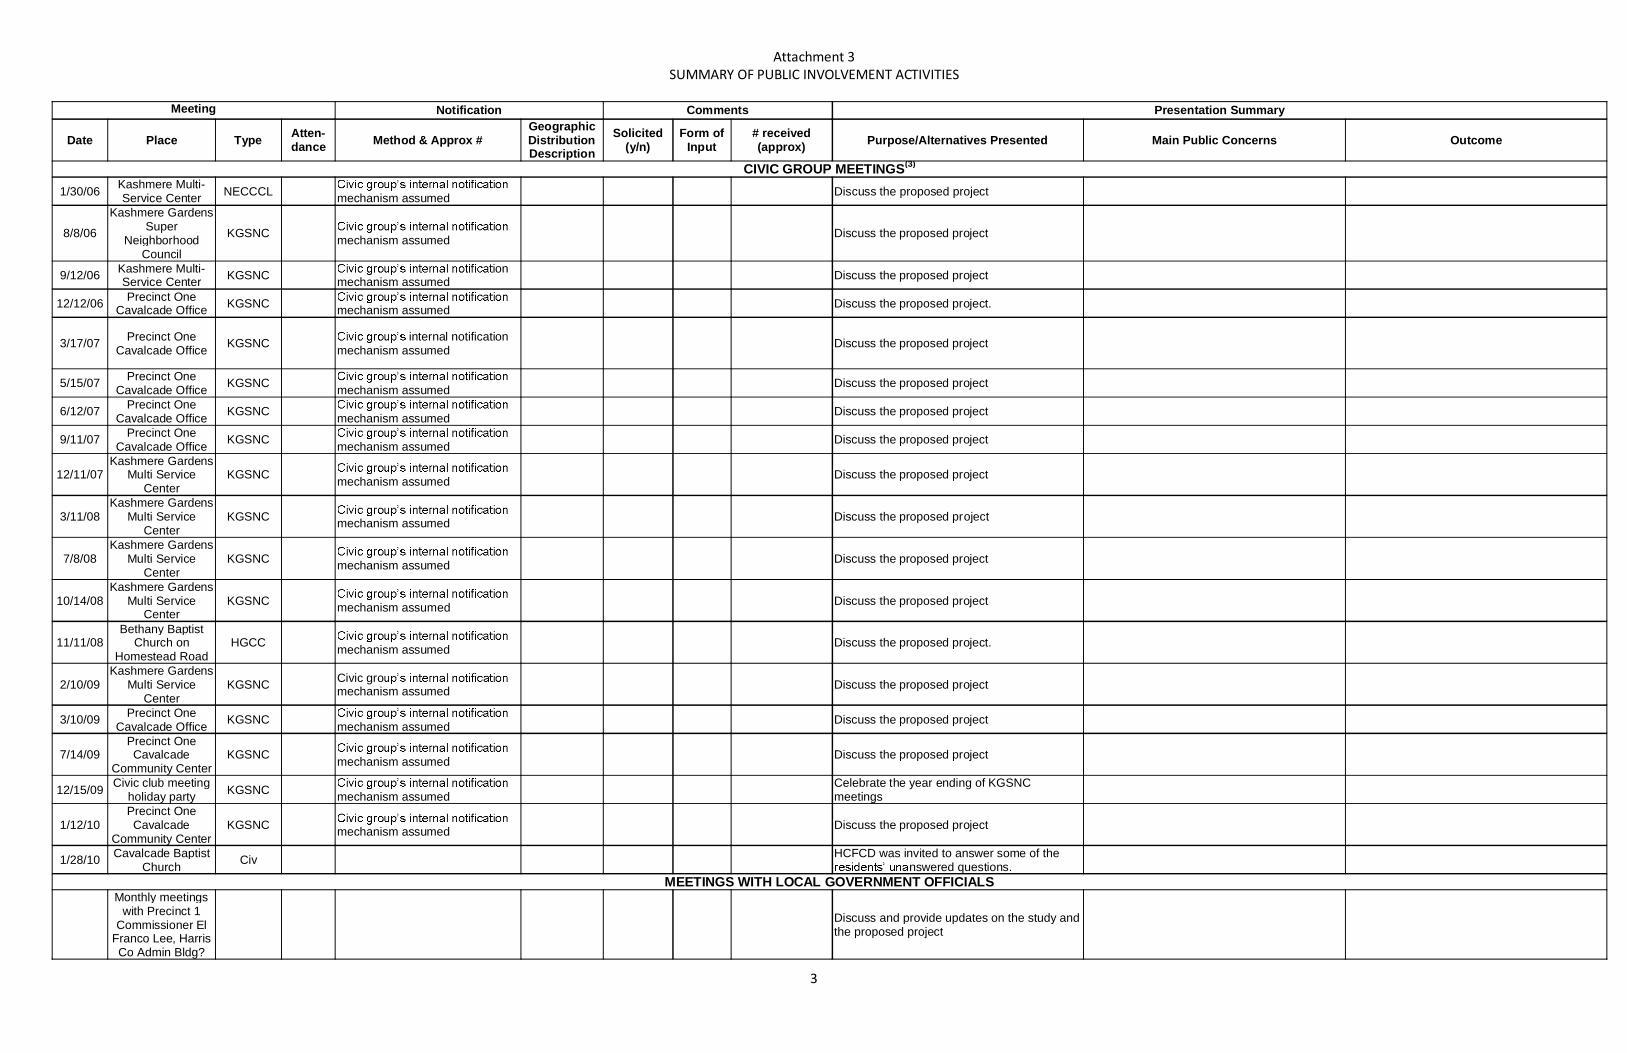
Attachment 3 SUMMARY OF PUBLIC INVOLVEMENT ACTIVITIES
3
Meeting Notification Comments Presentation Summary
Date Place Type Atten-dance Method & Approx #
Geographic Distribution Description
Solicited (y/n)
Form of Input
# received (approx) Purpose/Alternatives Presented Main Public Concerns Outcome
CIVIC GROUP MEETINGS(3)
1/30/06 Kashmere Multi-Service Center NECCCL mechanism assumed Discuss the proposed project
8/8/06
Kashmere Gardens Super
Neighborhood Council
KGSNC mechanism assumed Discuss the proposed project
9/12/06 Kashmere Multi-Service Center KGSNC
ion mechanism assumed Discuss the proposed project
12/12/06 Precinct One Cavalcade Office KGSNC mechanism assumed Discuss the proposed project.
3/17/07 Precinct One Cavalcade Office KGSNC
internal notification mechanism assumed Discuss the proposed project
5/15/07 Precinct One Cavalcade Office KGSNC mechanism assumed Discuss the proposed project
6/12/07 Precinct One Cavalcade Office KGSNC mechanism assumed Discuss the proposed project
9/11/07 Precinct One Cavalcade Office KGSNC mechanism assumed Discuss the proposed project
12/11/07 Kashmere Gardens
Multi Service Center
KGSNC mechanism assumed Discuss the proposed project
3/11/08 Kashmere Gardens
Multi Service Center
KGSNC mechanism assumed Discuss the proposed project
7/8/08 Kashmere Gardens
Multi Service Center
KGSNC mechanism assumed Discuss the proposed project
10/14/08 Kashmere Gardens
Multi Service Center
KGSNC mechanism assumed Discuss the proposed project
11/11/08 Bethany Baptist
Church on Homestead Road
HGCC mechanism assumed Discuss the proposed project.
2/10/09 Kashmere Gardens
Multi Service Center
KGSNC Civic gromechanism assumed Discuss the proposed project
3/10/09 Precinct One Cavalcade Office KGSNC mechanism assumed Discuss the proposed project
7/14/09 Precinct One Cavalcade
Community Center KGSNC mechanism assumed Discuss the proposed project
12/15/09 Civic club meeting holiday party KGSNC mechanism assumed
Celebrate the year ending of KGSNC meetings
1/12/10 Precinct One Cavalcade
Community Center KGSNC mechanism assumed Discuss the proposed project
1/28/10 Cavalcade Baptist Church Civ
HCFCD was invited to answer some of the nswered questions.
MEETINGS WITH LOCAL GOVERNMENT OFFICIALS
Monthly meetings with Precinct 1
Commissioner El Franco Lee, Harris Co Admin Bldg?
Discuss and provide updates on the study and the proposed project
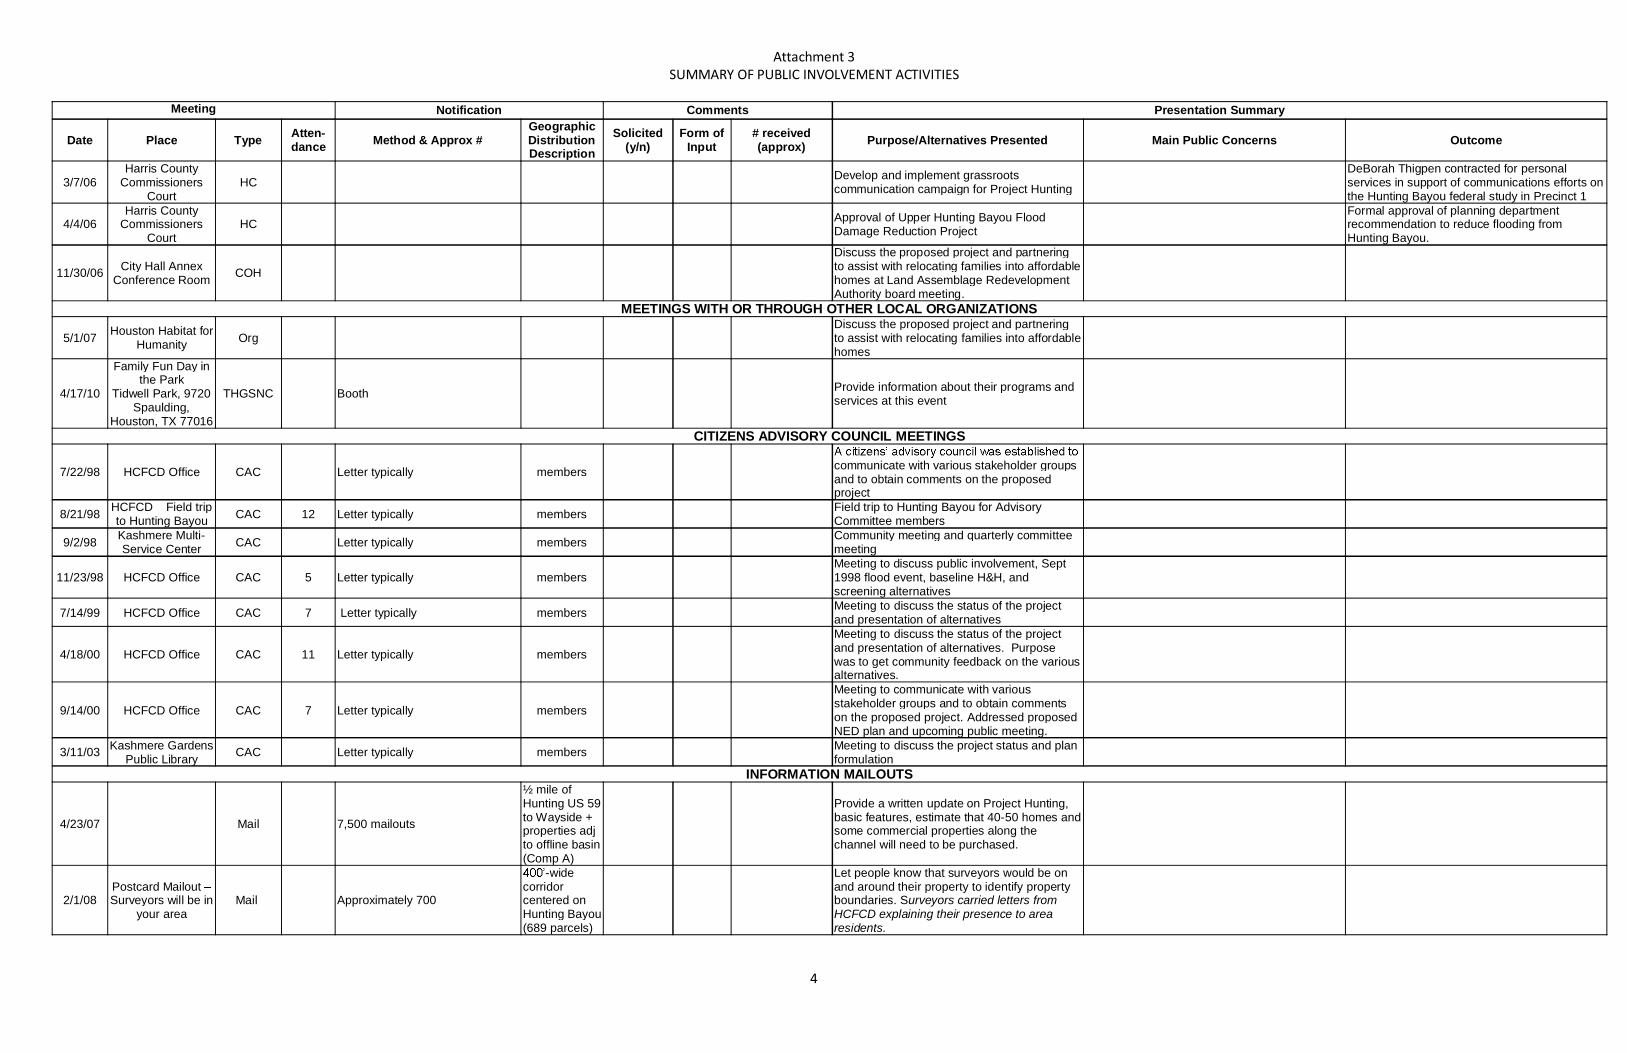
Attachment 3 SUMMARY OF PUBLIC INVOLVEMENT ACTIVITIES
4
Meeting Notification Comments Presentation Summary
Date Place Type Atten-dance Method & Approx #
Geographic Distribution Description
Solicited (y/n)
Form of Input
# received (approx) Purpose/Alternatives Presented Main Public Concerns Outcome
3/7/06 Harris County
Commissioners Court
HC Develop and implement grassroots communication campaign for Project Hunting
DeBorah Thigpen contracted for personal services in support of communications efforts on the Hunting Bayou federal study in Precinct 1
4/4/06 Harris County
Commissioners Court
HC Approval of Upper Hunting Bayou Flood Damage Reduction Project
Formal approval of planning department recommendation to reduce flooding from Hunting Bayou.
11/30/06 City Hall Annex Conference Room COH
Discuss the proposed project and partnering to assist with relocating families into affordable homes at Land Assemblage Redevelopment Authority board meeting.
MEETINGS WITH OR THROUGH OTHER LOCAL ORGANIZATIONS
5/1/07 Houston Habitat for Humanity Org
Discuss the proposed project and partnering to assist with relocating families into affordable homes
4/17/10
Family Fun Day in the Park
Tidwell Park, 9720 Spaulding,
Houston, TX 77016
THGSNC Booth Provide information about their programs and services at this event
CITIZENS ADVISORY COUNCIL MEETINGS
7/22/98 HCFCD Office CAC Letter typically members
communicate with various stakeholder groups and to obtain comments on the proposed project
8/21/98 HCFCD Field trip to Hunting Bayou CAC 12 Letter typically members
Field trip to Hunting Bayou for Advisory Committee members
9/2/98 Kashmere Multi-Service Center CAC Letter typically members
Community meeting and quarterly committee meeting
11/23/98 HCFCD Office CAC 5 Letter typically members Meeting to discuss public involvement, Sept 1998 flood event, baseline H&H, and screening alternatives
7/14/99 HCFCD Office CAC 7 Letter typically members Meeting to discuss the status of the project and presentation of alternatives
4/18/00 HCFCD Office CAC 11 Letter typically members
Meeting to discuss the status of the project and presentation of alternatives. Purpose was to get community feedback on the various alternatives.
9/14/00 HCFCD Office CAC 7 Letter typically members
Meeting to communicate with various stakeholder groups and to obtain comments on the proposed project. Addressed proposed NED plan and upcoming public meeting.
3/11/03 Kashmere Gardens Public Library CAC Letter typically members
Meeting to discuss the project status and plan formulation
INFORMATION MAILOUTS
4/23/07 Mail 7,500 mailouts
½ mile of Hunting US 59 to Wayside + properties adj to offline basin (Comp A)
Provide a written update on Project Hunting, basic features, estimate that 40-50 homes and some commercial properties along the channel will need to be purchased.
2/1/08 Postcard Mailout Surveyors will be in
your area Mail Approximately 700
-wide corridor centered on Hunting Bayou (689 parcels)
Let people know that surveyors would be on and around their property to identify property boundaries. Surveyors carried letters from HCFCD explaining their presence to area residents.
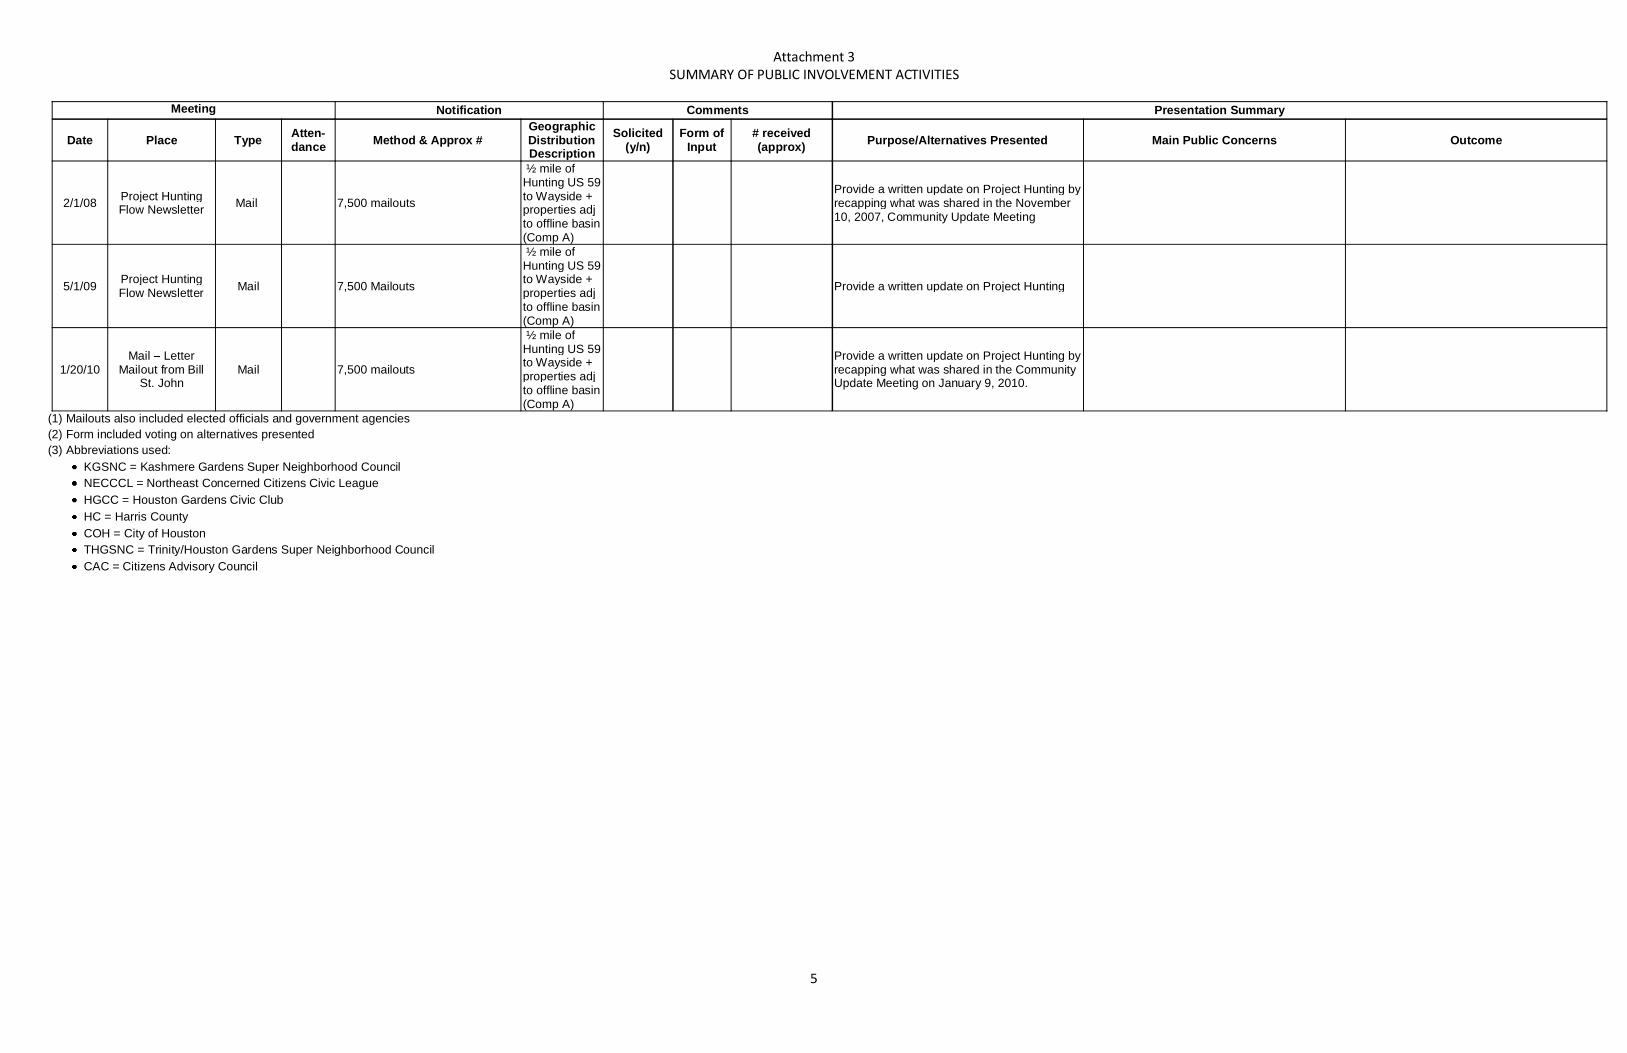
Attachment 3 SUMMARY OF PUBLIC INVOLVEMENT ACTIVITIES
5
Meeting Notification Comments Presentation Summary
Date Place Type Atten-dance Method & Approx #
Geographic Distribution Description
Solicited (y/n)
Form of Input
# received (approx) Purpose/Alternatives Presented Main Public Concerns Outcome
2/1/08 Project Hunting Flow Newsletter Mail 7,500 mailouts
½ mile of Hunting US 59 to Wayside + properties adj to offline basin (Comp A)
Provide a written update on Project Hunting by recapping what was shared in the November 10, 2007, Community Update Meeting
5/1/09 Project Hunting Flow Newsletter Mail 7,500 Mailouts
½ mile of Hunting US 59 to Wayside + properties adj to offline basin (Comp A)
Provide a written update on Project Hunting
1/20/10 Mail Letter
Mailout from Bill St. John
Mail 7,500 mailouts
½ mile of Hunting US 59 to Wayside + properties adj to offline basin (Comp A)
Provide a written update on Project Hunting by recapping what was shared in the Community Update Meeting on January 9, 2010.
(1) Mailouts also included elected officials and government agencies (2) Form included voting on alternatives presented (3) Abbreviations used:
KGSNC = Kashmere Gardens Super Neighborhood Council NECCCL = Northeast Concerned Citizens Civic League HGCC = Houston Gardens Civic Club HC = Harris County COH = City of Houston THGSNC = Trinity/Houston Gardens Super Neighborhood Council CAC = Citizens Advisory Council
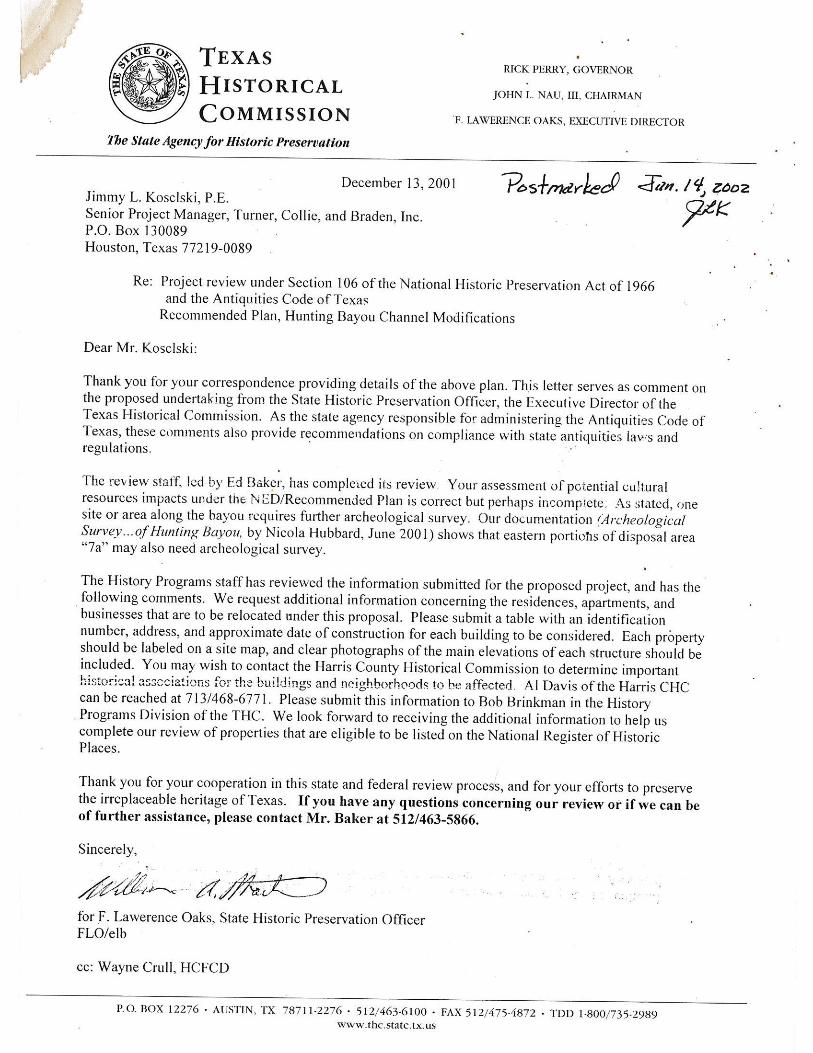
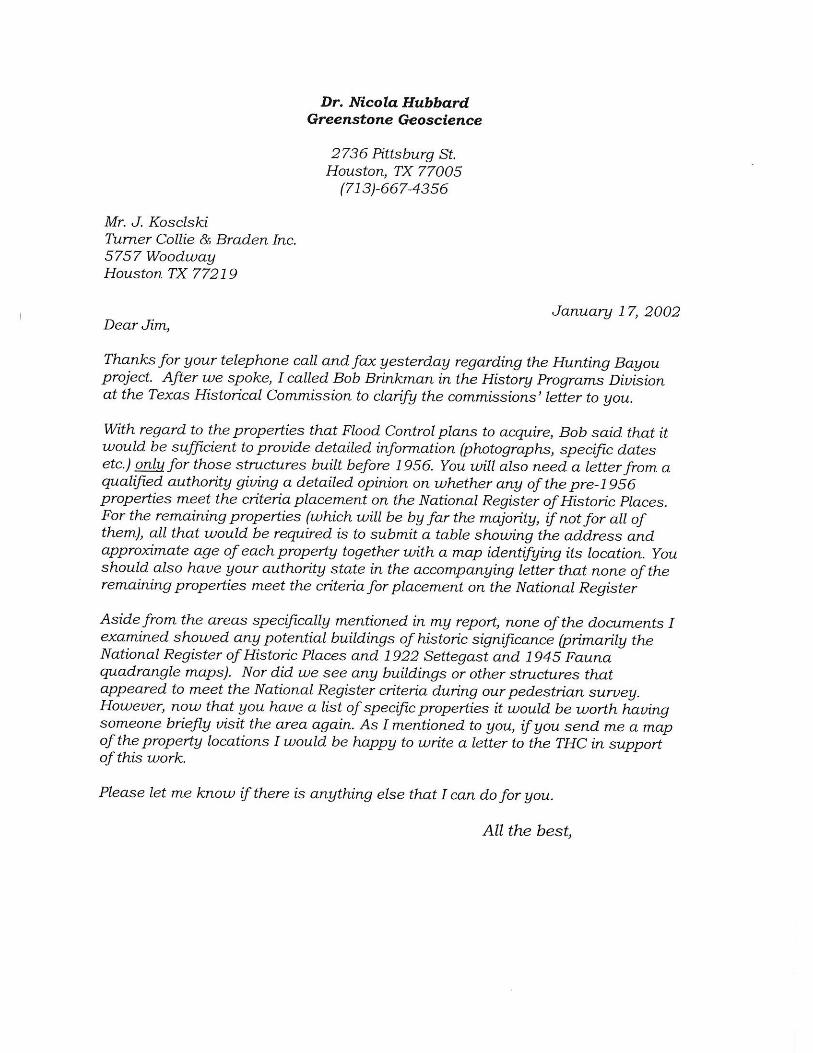
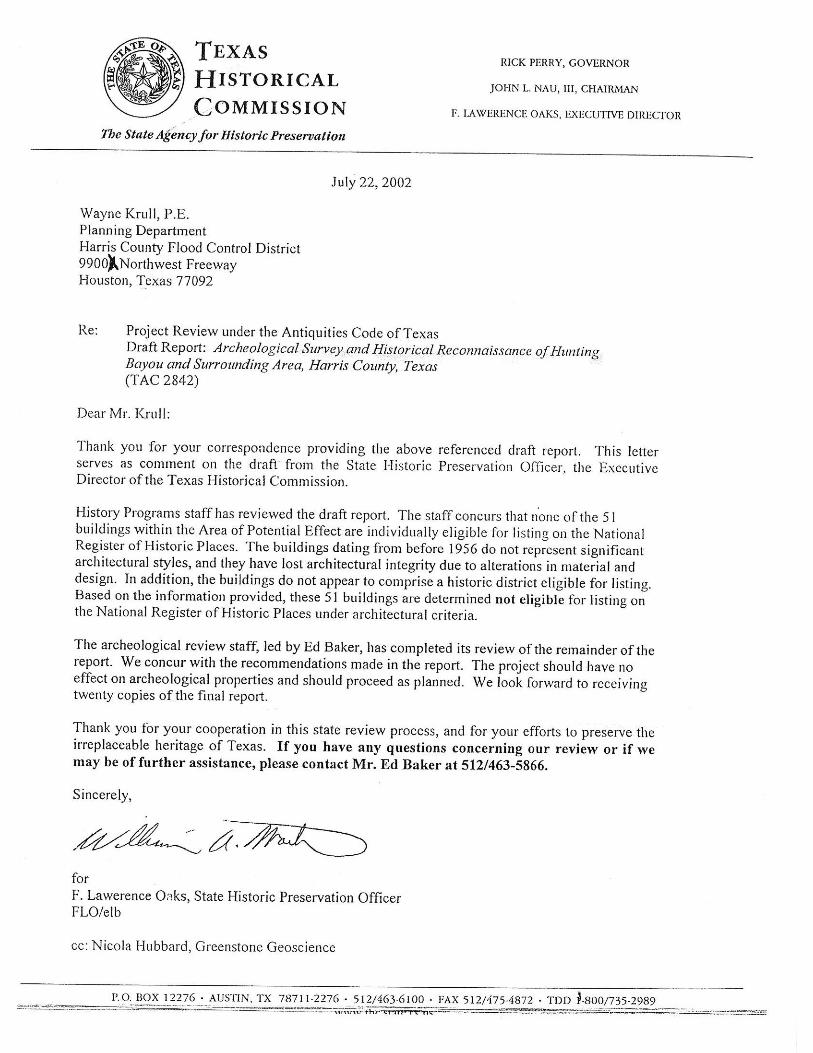


AECOM5757 Woodway, Suite 101WHouston, TX 77057www.aecom.com
713.780.4100 tel713.267.3110 fax
September 14, 2012
Donna AndersonWildlife BiologistUSFWS Ecological Services Office17629 El Camino Real, Suite 211Houston, Texas 77058
RE: Hunting Bayou Federal Flood Control Project Biological Assessment ReportMay 2010 Addendum 2012HCFCD Project ID H100-00-00-Y001
Dear Ms. Anderson:
In a February 15, 2011, approval email for the above referenced biological assessment to EddieGeorge with the Harris County Flood Control District (HCFCD), you asked that HCFCD provide youany project changes or additional information on the distribution of listed or proposed species.HCFCD is adding an additional disposal area, Disposal Area 6, to the project. Attached are exhibitsthat document the historical land use for this area. The following is a description of the Disposal Area6.
Disposal Area 6
Disposal Area 6 in the 1930 aerial photography was forested with an area of what appears to bedisturbed soils (white areas) in the upper third of the area (Exhibit 1). This disturbed area does notappear to be the typical “mima mounds” or “pimple mounds” that are associated with Hymenoxystexana. The 1944 and 1950 aerial photography confirm that forested areas within Disposal Area 6matured with little disturbance to the area (Exhibits 2 and 3). Note between 1930 and 1950, thedisturbed areas in the upper third of the tract remained open and did not become vegetated with treesor dense understory.
Sometime between 1950 and 1984, the majority of the area, including the disturbed area, wascleared (Exhibits 3 and 4). The 1995 infrared aerial photography clearly shows the cleared area(Exhibit 5). Aerial photography from 1995 and 2010 show that the area has not be disturbed and hasbecome more overgrown (Exhibits 5 through 9). Site visits in 2006 and 2008 confirmed that thecentral section of the cleared area had received one to two feet of fill material including the disturbedarea found in the 1944 through 1950 aerials. Exhibit 9 provides the locations where the photos weretaken during the 2006 site visit, while Exhibit 10 contains the photos taken during the 2006 field visit.
Disposal Area 6 in 1944 was a forested area that did not have typical Hymenoxys texana habitat.Between 1994 and 2010, Sections of Disposal Area 6 has been cleared and filled with the areas notcleared have become dense forest. None of these activities are conducive to maintaining habitat forHymenoxys texana. Without the appropriate habitat for Hymenoxys texana, we have determined thatthere is no effect of the Hunting Bayou Federal Flood Control Project on this federally listed species.

From: [email protected] [mailto:[email protected]]Sent: Tuesday, September 18, 2012 8:08 AM To: Love, Timothy Subject: RE: FW: Hunting Bayou BA Update - Disposal Site 6
Mr. Love,The Service does not concur on a "no effect" call. Please document your findings and make them available should the need arise. Donna Anderson Wildlife Biologist USFWS Ecological Services Office 17629 El Camino Real, Suite 211 Houston, Texas 77058 Office: 281/286-8282 Cell: 713/542-1861 Fax: 281/488-5882
"Love, Timothy" <[email protected]>
09/17/2012 12:29 PM
To "[email protected]" <[email protected]>cc
Subject RE: FW: Hunting Bayou BA Update - Disposal Site 6
Donna,Does this means that USFWS concur on our findings for Disposal Site 6 that there will no effect to Hymenoxys texana?
Timothy D. Love, Professional Wetland Scientist Associate Environmental Specialist, Water Direct 713.267.2788 Cell [email protected] Woodway, Suite 101 West, Houston, Texas 77057-1599 T 713.780.4100 F 713.267.3283www.aecom.comThis electronic communication, which includes any files or attachments thereto, contains proprietary or confidential information and may be privilegedand otherwise protected under copyright or other applicable intellectual property laws. All information contained in this electronic communication is solelyfor the use of the individual(s) or entity to which it was addressed. If you are not the intended recipient(s), you are hereby notified that distributing,copying, or in any way disclosing any of the information in this e-mail is strictly prohibited. If you have received this e-mail in error, please notify thesender immediately, and destroy the communication and any files or attachments in their entirety, whether in electronic or hard copy format. Since datastored on electronic media can deteriorate, be translated or modified, AECOM, its subsidiaries, and/or affiliates will not be liable for the completeness, correctness or readability of the electronic data. The electronic data should be verified against the hard copy.
Please consider the environment before printing this e-mail.
From: [email protected] [mailto:[email protected]]Sent: Friday, September 14, 2012 3:16 PMTo: Love, TimothyCc: [email protected]: Re: FW: Hunting Bayou BA Update - Disposal Site 6
Mr. Love,Thank you for the update to the Hunting Bayou Federal Flood Control Project. I have placed the letter referenced below in the Service file. Please feel free to contact me should you have any questions. Donna Anderson Wildlife Biologist USFWS Ecological Services Office

17629 El Camino Real, Suite 211 Houston, Texas 77058 Office: 281/286-8282 Cell: 713/542-1861 Fax: 281/488-5882
"Love, Timothy" <[email protected]>
09/14/2012 12:50 PMTo "[email protected]" <[email protected]>cc
Subject FW: Hunting Bayou BA Update - Disposal Site 6
Donna,Please see the below message.
Timothy D. Love, Professional Wetland Scientist Associate Environmental Specialist, Water Direct 713.267.2788 Cell [email protected] Woodway, Suite 101 West, Houston, Texas 77057-1599 T 713.780.4100 F 713.267.3283www.aecom.comThis electronic communication, which includes any files or attachments thereto, contains proprietary or confidential information and may be privilegedand otherwise protected under copyright or other applicable intellectual property laws. All information contained in this electronic communication is solelyfor the use of the individual(s) or entity to which it was addressed. If you are not the intended recipient(s), you are hereby notified that distributing,copying, or in any way disclosing any of the information in this e-mail is strictly prohibited. If you have received this e-mail in error, please notify thesender immediately, and destroy the communication and any files or attachments in their entirety, whether in electronic or hard copy format. Since datastored on electronic media can deteriorate, be translated or modified, AECOM, its subsidiaries, and/or affiliates will not be liable for the completeness, correctness or readability of the electronic data. The electronic data should be verified against the hard copy.
From: Love, Timothy Sent: Friday, September 14, 2012 12:08 PMTo:Cc: '[email protected]'; 'Dyke, Jennifer (Flood Control)'; Zeve, Matthew K.Subject: Hunting Bayou BA Update - Disposal Site 6
Donna,Attached is update letter for Hunting Bayou project for your review. If you have any questions, please contact me or Eddie George/HCFCD.
Timothy D. Love, Professional Wetland Scientist Associate Environmental Specialist, Water Direct 713.267.2788 Cell [email protected] Woodway, Suite 101 West, Houston, Texas 77057-1599 T 713.780.4100 F 713.267.3283www.aecom.comThis electronic communication, which includes any files or attachments thereto, contains proprietary or confidential information and may be privilegedand otherwise protected under copyright or other applicable intellectual property laws. All information contained in this electronic communication is solelyfor the use of the individual(s) or entity to which it was addressed. If you are not the intended recipient(s), you are hereby notified that distributing,copying, or in any way disclosing any of the information in this e-mail is strictly prohibited. If you have received this e-mail in error, please notify thesender immediately, and destroy the communication and any files or attachments in their entirety, whether in electronic or hard copy format. Since datastored on electronic media can deteriorate, be translated or modified, AECOM, its subsidiaries, and/or affiliates will not be liable for the completeness, correctness or readability of the electronic data. The electronic data should be verified against the hard copy.
Please consider the environment before printing this e-mail.

1
Zeve, Matthew K.
From: George, Eddie (Flood Control) <[email protected]>Sent: Tuesday, February 15, 2011 1:00 PMTo: Garmon, Mike (Flood Control); Zeve, Matthew K.Cc: Fairchild, Ingrid (Flood Control); Wade, Denise (Flood Control)Subject: FW: FW: Hunting Bayou BA
Categories: Green Category
USFWS concurrence email regarding our BA for the Federal Study.
From: [email protected] [mailto:[email protected]]Sent: Tuesday, February 15, 2011 12:58 PMTo: George, Eddie (Flood Control)Subject: Re: FW: Hunting Bayou BA
Hello Eddie,Thank you for forwarding the link for the Hunting Bayou BA. It appears that Harris County FloodControl District has determined that the proposed project will not affect any federally listed species orcritical habitat. No coordination or contact with the Service is necessary. However, if the projectchanges or additional information on the distribution of listed or proposed species becomes available,the project should be reanalyzed for effects not previously considered.
The Service recommends that you maintain a complete record of the evaluation, including stepsleading to the determination of affect, the qualified personnel conducting the evaluation, habitatconditions, site photographs, and other related articles.
The Service's Consultation Handbook is available on-line to assist you with further information ondefinitions, process, and fulfilling Endangered Species Act requirements for your projects athttp://endangered.fws.gov/consultations/s7hndbk/s7hndbk.htm.
If I can further assist you, please feel free to contact me.
Thank you,
Donna AndersonWildlife BiologistUSFWS Ecological Services Office17629 El Camino Real, Suite 211Houston, Texas 77058Cell: 713-542-0389Office: 281/286-8282Fax: 281/488-5882
"George, Eddie (Flood Control)"<[email protected]>
02/14/2011 09:44 AM
To <[email protected]>cc
Subject FW: Hunting Bayou BA

2
Donna
Do you know if you have had a chance to review this? I have a meeting with Glenn on status updates for our federal projects thisweek. If you can provide a status report before Thursday, that would be great.
Thanks and I hope all is well.
Eddie
From: [email protected] [mailto:[email protected]]Sent: Wednesday, May 26, 2010 11:02 AMTo: George, Eddie (Flood Control)Subject: Hunting Bayou BA
PLEASE DO NOT REPLY TO THIS E-MAIL.
New files have been added to your FC FileShare inbox by:
Donna
Attached is the Electronic version of the updated Hunting Bayou BA. Once you finish your review, can youplease email/fax a statement indicating what USFWS stance is on the BA and its findings?
Thanks
Eddie
Hunting Bayou Biological Assessment_May_Final.pdf
*Files in your inbox will be automatically deleted after 120 days.
These files were shared with the following users:
Donna Anderson | [email protected]

PROJECT SITE
59
90
610
8
8
0 400200Feet
ExhibitDate September 2010 Job No.
AECOM USA Group, Inc.5757 Woodway Drive, Suite 101WHouston, Texas 77057-1599www.aecom.com
160073177
Biological Assessment SupplementNED Disposal Area 6 - Aerial 1930
Hunting Bayou FederalFlood Control Project
Source: HCFCD 1930
Legend
NED Disposal 6
Disturbed Area

PROJECT SITE
59
90
610
8
8
0 400200Feet
ExhibitDate September 2010 Job No.
AECOM USA Group, Inc.5757 Woodway Drive, Suite 101WHouston, Texas 77057-1599www.aecom.com
260073177
Biological Assessment SupplementNED Disposal Area 6 - Aerial 1944
Hunting Bayou FederalFlood Control Project
Source: HCFCD 1944
Legend
NED Disposal 6

PROJECT SITE
59
90
610
8
8
0 400200Feet
ExhibitDate September 2010 Job No.
AECOM USA Group, Inc.5757 Woodway Drive, Suite 101WHouston, Texas 77057-1599www.aecom.com
360073177
Biological Assessment SupplementNED Disposal Area 6 - Aerial 1950
Hunting Bayou FederalFlood Control Project
Source: HCFCD 1950
Legend
NED Disposal 6
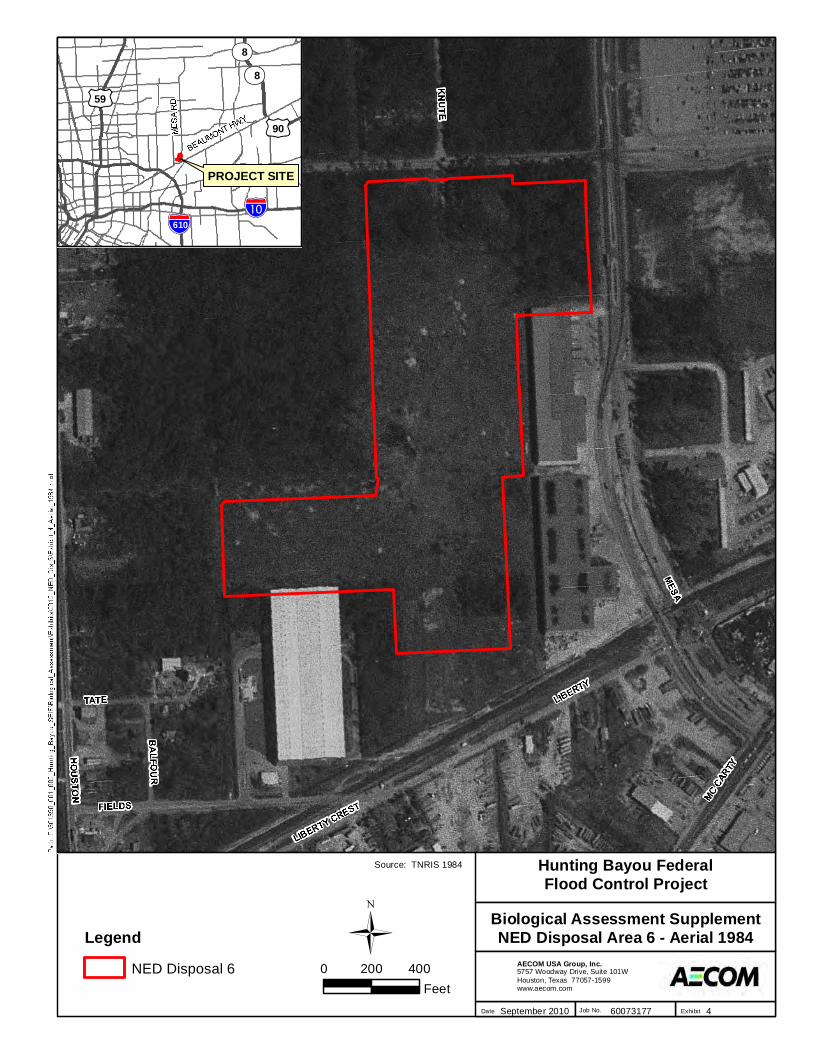
PROJECT SITE
59
90
610
8
8
0 400200Feet
ExhibitDate September 2010 Job No.
AECOM USA Group, Inc.5757 Woodway Drive, Suite 101WHouston, Texas 77057-1599www.aecom.com
460073177
Biological Assessment SupplementNED Disposal Area 6 - Aerial 1984
Hunting Bayou FederalFlood Control Project
Source: TNRIS 1984
Legend
NED Disposal 6

PROJECT SITE
59
90
610
8
8
0 400200Feet
ExhibitDate September 2010 Job No.
AECOM USA Group, Inc.5757 Woodway Drive, Suite 101WHouston, Texas 77057-1599www.aecom.com
560073177
Biological Assessment SupplementNED Disposal Area 6 - Aerial 1995
Hunting Bayou FederalFlood Control Project
Source: MrSID DOQQ 1995
Legend
NED Disposal 6
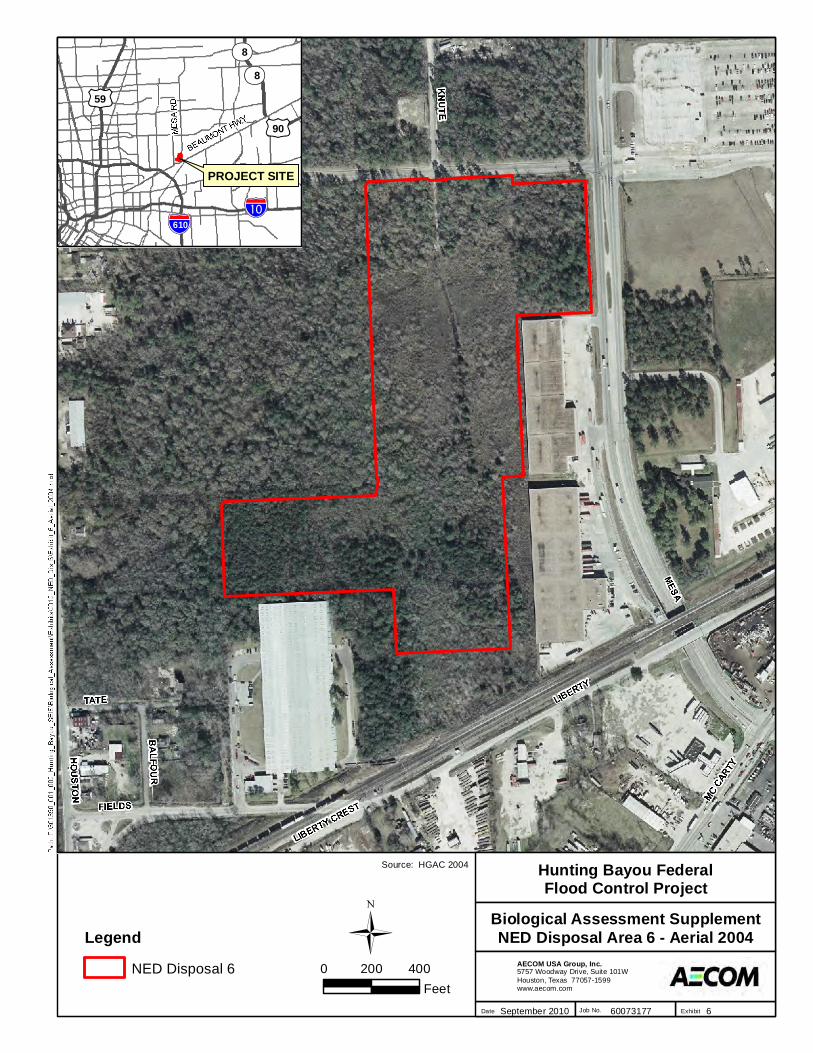
PROJECT SITE
59
90
610
8
8
0 400200Feet
ExhibitDate September 2010 Job No.
AECOM USA Group, Inc.5757 Woodway Drive, Suite 101WHouston, Texas 77057-1599www.aecom.com
660073177
Biological Assessment SupplementNED Disposal Area 6 - Aerial 2004
Hunting Bayou FederalFlood Control Project
Source: HGAC 2004
Legend
NED Disposal 6

PROJECT SITE
59
90
610
8
8
0 400200Feet
ExhibitDate September 2010 Job No.
AECOM USA Group, Inc.5757 Woodway Drive, Suite 101WHouston, Texas 77057-1599www.aecom.com
760073177
Biological Assessment SupplementNED Disposal Area 6 - Aerial 2006
Hunting Bayou FederalFlood Control Project
Source: HGAC 2006
Legend
NED Disposal 6

PROJECT SITE
59
90
610
8
8
0 400200Feet
ExhibitDate September 2010 Job No.
AECOM USA Group, Inc.5757 Woodway Drive, Suite 101WHouston, Texas 77057-1599www.aecom.com
860073177
Biological Assessment SupplementNED Disposal Area 6 - Aerial 2008
Hunting Bayou FederalFlood Control Project
Source: HGAC 2008
Legend
NED Disposal 6

2
1
PROJECT SITE
59
90
610
8
8
0 400200Feet
ExhibitDate September 2010 Job No.
AECOM USA Group, Inc.5757 Woodway Drive, Suite 101WHouston, Texas 77057-1599www.aecom.com
960073177
Biological Assessment SupplementNED Disposal Area 6 - Aerial 2010
Hunting Bayou FederalFlood Control Project
Source: HGAC 2010
Legend
Photo Location
NED Disposal 6

Photo 1. Looking west near the disturbed area observed in 1930,1944, and 1950 aerials. Photo Taken December 6, 2006.
Photo 2. Looking north just south of the disturbed area observedin 1930, 1944, and 1950 aerials. Photo Taken December 6, 2006.
ExhibitDate September 2010 Job No.
AECOM USA Group, Inc.5757 Woodway Drive, Suite 101WHouston, Texas 77057-1599www.aecom.com
1060073177
Biological Assessment SupplementNED Disposal Area 6 - Site Photos
Hunting Bayou FederalFlood Control Project


