28
+ Attendanc e Dashboard Inquiry 1 Summer 2013 Finco & Torkelson Day 2

Finco & Torkelson
+
Attendance
Dashboard Inquiry
1Summer 2013
Day 2

Finco & Torkelson
2+ ATTENDANCEEntry Points School Report Card
Attendance Rate• All and lowest
attending subgroup• Chronic Absenteeism
Rate
Summer 2013

Finco & Torkelson
3+ ATTENDANCE Question Topics Which questions are most important to explore?
Common ATTENDANCE Data
Inquiry TopicsMy Data Inquiry Questions
What are the differences in attendance rates for groups of students?
Which students have chronic absenteeism?
What is the achievement level of low attending students?
Summer 2013

Finco & Torkelson
4+ About the ATTENDANCE Dashboard
Use the filters to view the attendance rates for subgroups.
View year-by-year trends.
Summer 2013

Finco & Torkelson
5+Thinking Ahead about“Drilling-Down”
Some helpful “drill-down” investigations when studying “attendance.”
1. Who are the low-attending students?
2. How do attendance patterns align with WSAS achievement patterns?
Respect confidentiality. Save data in a secure data folder.
Summer 2013
Finco & Torkelson
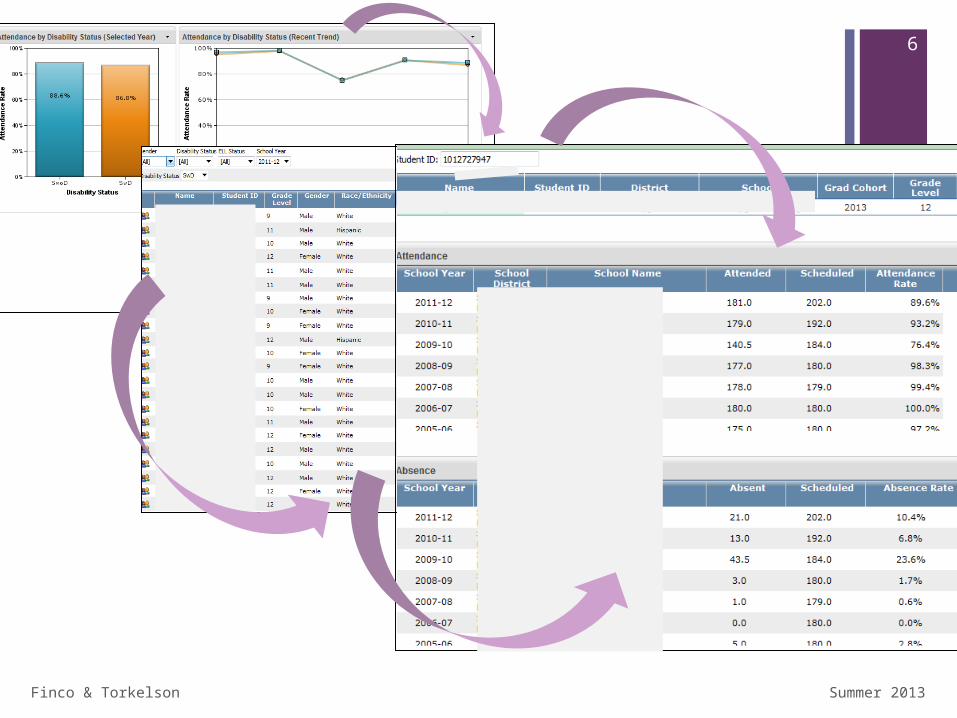
6+
Summer 2013
Finco & Torkelson
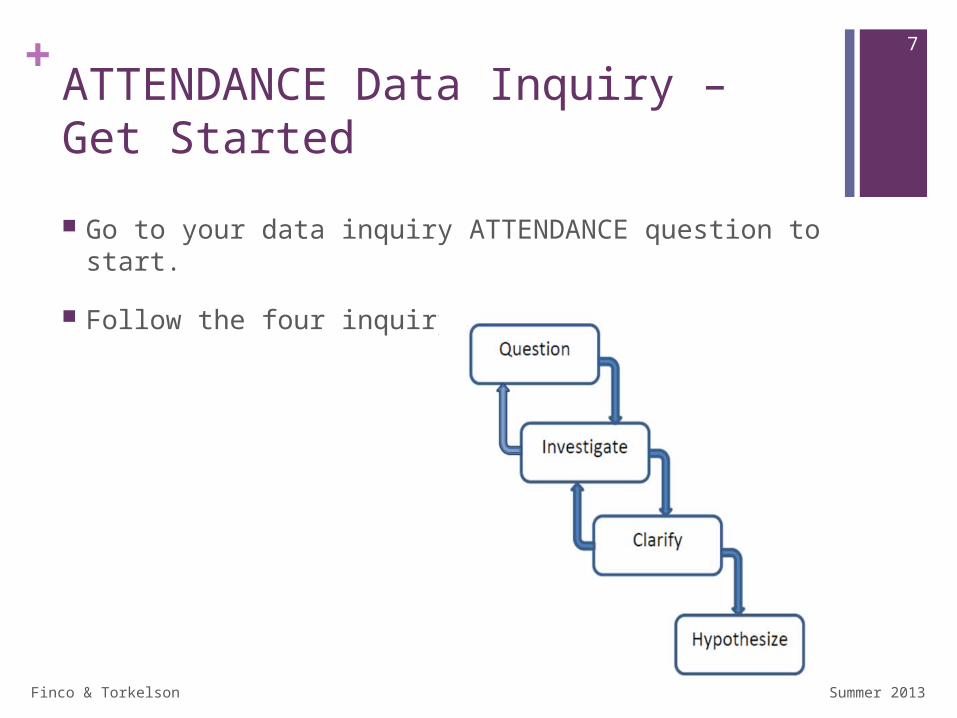
7+ATTENDANCE Data Inquiry – Get Started
Go to your data inquiry ATTENDANCE question to start.
Follow the four inquiry steps.
Summer 2013

Finco & Torkelson
8+Use the Fillable Form to Guidethe Data Inquiry Process
QUESTION Enter your data question and select the data source
INVESTIGATE Enter WISEdash. Navigate and apply filters to find the data
picture that answers the data question.
CLARIFY Document data findings. Fill in the areas indicated on the
Fillable Form.
HYPOTHESIZE Pose and categorize hypotheses of teacher and leadership
practices related to the data findings.
Summer 2013

9+
June 2013

Finco & Torkelson
10+
What did you learn through this Inquiry Process?
Reflecting…
Summer 2013

11+
June 2013
Finco & Torkelson
+ Click icon to add picture
Access Dashboard Inquiry
12

Finco & Torkelson
13+ ACCESS Question Topics Which questions are most important to explore?
Common ACCESS Data Inquiry Topics
My Data Inquiry Questions
Progress in speaking proficiency
Progress in listening proficiency
Progress in reading proficiency
Progress in writing proficiency
Progress in overall LEP levels
Data on students who have “exited” ELL status
Summer 2013

Finco & Torkelson
14+Thinking Ahead about“Drilling-Down”
Because WISEdash allows you to “drill down” to specific students, think ahead about the role that the ACCESS LEP levels play in planning for students..
Respect confidentiality. Save data in a secure data folder.
Student ListsWill you need lists of …
• Students who are at different ACCESS levels in the four domains?
• Students who are at levels one and two overall?
Student ProfilesWill you need individual student data such as …
• Specific language domain results and history?
• ELL student performance on the WSAS to relate to ACCESS results?
Summer 2013

Finco & Torkelson
15+
Summer 2013
Finco & Torkelson
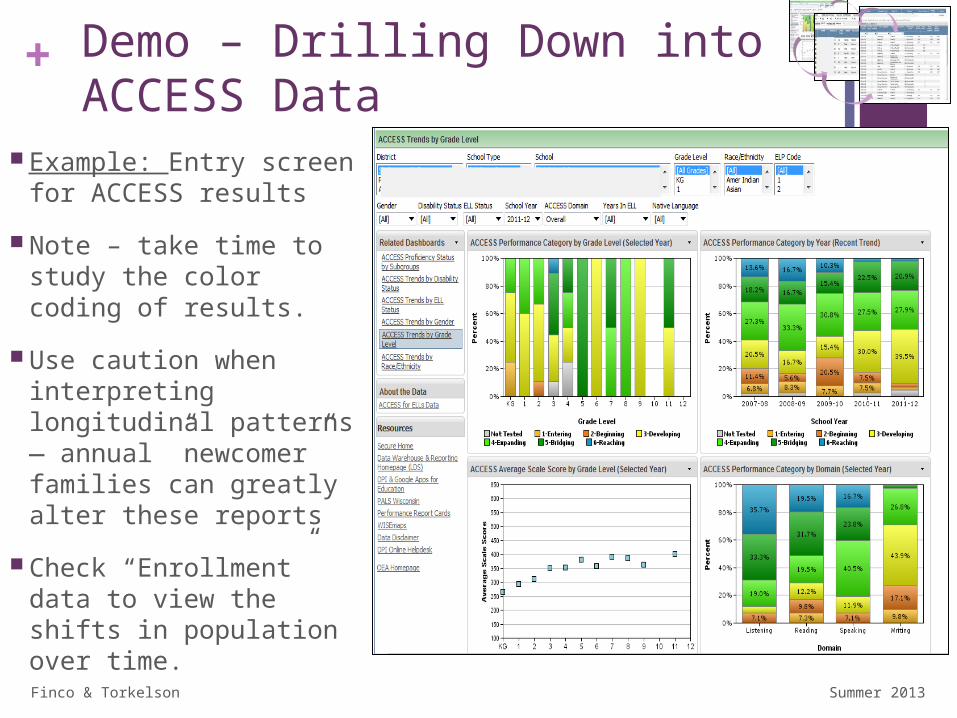
16+ Demo – Drilling Down intoACCESS Data
Example: Entry screen for ACCESS results
Note – take time to study the color coding of results.
Use caution when interpreting longitudinal patterns— annual ”newcomer” families can greatly alter these reports
Check “Enrollment” data to view the shifts in population over time. Summer 2013

Finco & Torkelson
17+Demo – Drilling Down to theStudent Profile
Example:
Note the ACCESS test history and details for the student.
Note the varying levels of English proficiency based on domain (reading, writing, speaking, listening)
Note the sorting functionality of column headings.
Summer 2013

Finco & Torkelson
18+ACCESS Data Inquiry – Get Started
Go to your data inquiry ACCESS question to start.
Follow the four steps.
Summer 2013

Finco & Torkelson
19+Use the Fillable Form to Guidethe Data Inquiry Process
QUESTION Enter your data question and select the data source
INVESTIGATE Enter WISEdash. Navigate and apply filters to find the data
picture that answers the data question.
CLARIFY Document data findings. Fill in the areas indicated on the
Fillable Form.
HYPOTHESIZE Pose and categorize hypotheses of teacher and leadership
practices related to the data findings.
Fillable Form
Summer 2013

Finco & Torkelson
20+
What did you learn through this Inquiry Process?
Reflecting…
Summer 2013

21+
June 2013
+
Action Planning
22

Finco & Torkelson Summer 2013
What?
So What?
Now What?
Finco & Torkelson
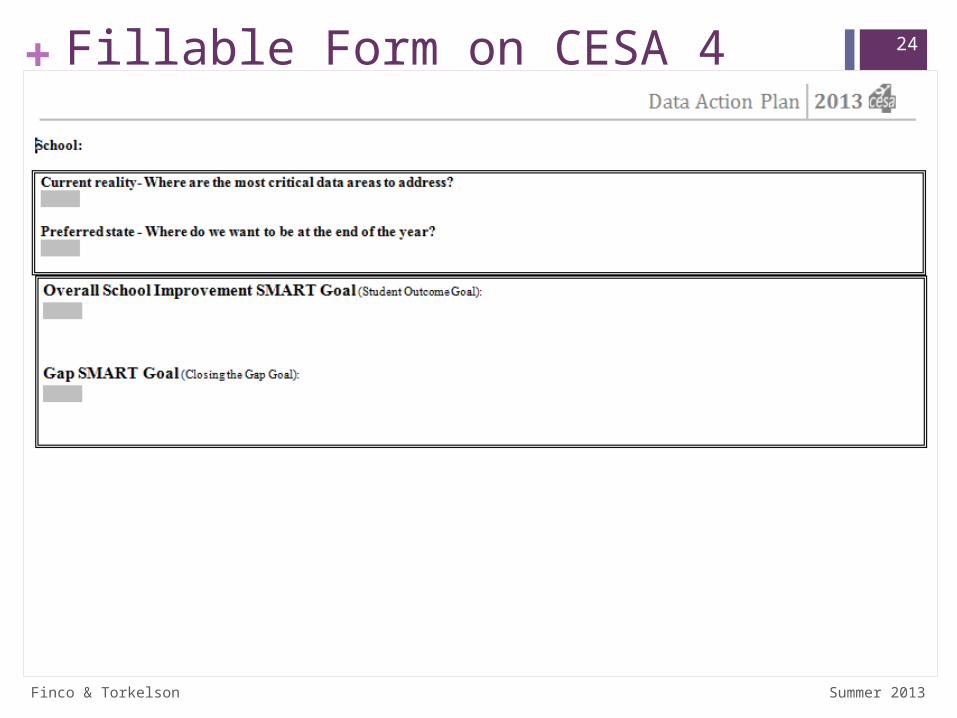
24+Fillable Form on CESA 4 Website
Summer 2013

25
Actions Tasks• Check to see that all Fillable Forms are saved in the
Data Folder.
• List the Data Inquiries where the “clarify” steps showed “HIGH PRIORITY” in terms of criticality.
• Schedule a School Improvement Planning meeting with the SIP team this summer.
• Organize local summative assessment data to analyze with the SIP team.
• Use the Data Inquiry Process and Fillable Forms to analyze local assessment data.
• Based on the “high priority” data findings, develop annual school improvement SMART goals.
• In the School Improvement Plan, utilize data inquiry HOPs statements and categories to develop critical strategies for improvement goals.
• Refine all details in the School Improvement Plan.
• Plan a “Roll-Out Launch” to communicate the SIP plan to all staff.
Action Planning

26+
June 2013

27+Don’t Forget Your Exit Ticket!
We want and need your feedback!

Finco & Torkelson
28
Summer 2013


