19
Attitude towards corporal punishment of children Survey of Latvia’s Population April 2009 Marketing and public opinion research centre SKDS
Attitude towards corporal punishment
of children
Survey of Latvia’s Population
April 2009
Marketing and public opinion research centre SKDS
tirgus un sabiedriskās domas pētījumu centrs market and public opinion research centre
SKDS, April 2009 2
Contents
Technical Information of the Survey....................................................................................... 3
Basic Terms........................................................................................................................... 4
Socio-Demographic Profile of Respondents........................................................................... 5
The Accuracy of the Results .................................................................................................. 6
1. Opinion about subjecting children to corporal punishment in Latvia ................................... 7
2. Attitude towards corporal punishment as a method of upbringing children ....................... 10
Tables of results .................................................................................................................. 12
Frequencies......................................................................................................................... 13
Answers in Socio-demographic Groups ............................................................................... 15
1. Regarding the entire population of children in your country as 100%, please
estimate, what percentage of them experience corporal punishment (or
beating/spanking as a penalty) in their families............................................................................15
2. In your opinion is corporal punishment of children a method of upbringing which…. ..............16
Questionnaire used in the survey......................................................................................... 17
Research: Attitude towards corporal punishment of children
SKDS, April 2009 3
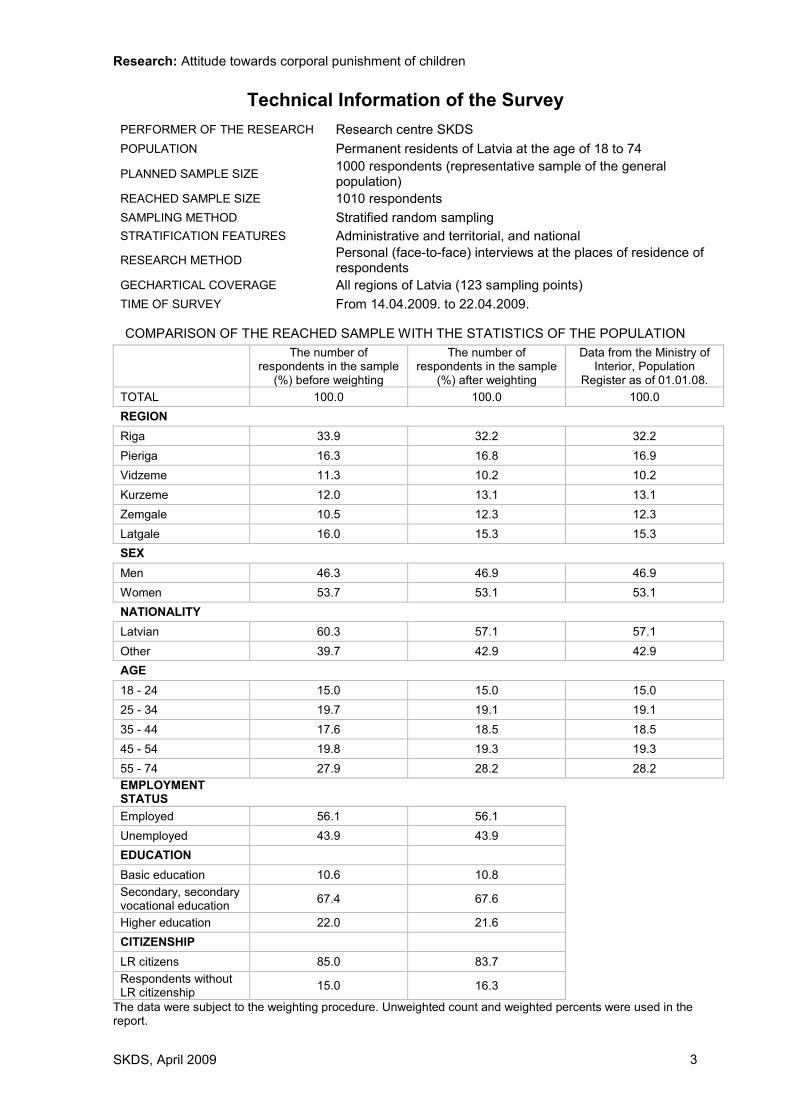
Technical Information of the Survey
PERFORMER OF THE RESEARCH Research centre SKDS
POPULATION Permanent residents of Latvia at the age of 18 to 74
PLANNED SAMPLE SIZE 1000 respondents (representative sample of the general population)
REACHED SAMPLE SIZE 1010 respondents
SAMPLING METHOD Stratified random sampling
STRATIFICATION FEATURES Administrative and territorial, and national
RESEARCH METHOD Personal (face-to-face) interviews at the places of residence of respondents
GECHARTICAL COVERAGE All regions of Latvia (123 sampling points)
TIME OF SURVEY From 14.04.2009. to 22.04.2009.
COMPARISON OF THE REACHED SAMPLE WITH THE STATISTICS OF THE POPULATION
The number of
respondents in the sample (%) before weighting
The number of respondents in the sample
(%) after weighting
Data from the Ministry of Interior, Population
Register as of 01.01.08.
TOTAL 100.0 100.0 100.0
REGION
Riga 33.9 32.2 32.2
Pieriga 16.3 16.8 16.9
Vidzeme 11.3 10.2 10.2
Kurzeme 12.0 13.1 13.1
Zemgale 10.5 12.3 12.3
Latgale 16.0 15.3 15.3
SEX
Men 46.3 46.9 46.9
Women 53.7 53.1 53.1
NATIONALITY
Latvian 60.3 57.1 57.1
Other 39.7 42.9 42.9
AGE
18 - 24 15.0 15.0 15.0
25 - 34 19.7 19.1 19.1
35 - 44 17.6 18.5 18.5
45 - 54 19.8 19.3 19.3
55 - 74 27.9 28.2 28.2
EMPLOYMENT STATUS
Employed 56.1 56.1
Unemployed 43.9 43.9
EDUCATION
Basic education 10.6 10.8
Secondary, secondary vocational education
67.4 67.6
Higher education 22.0 21.6
CITIZENSHIP
LR citizens 85.0 83.7
Respondents without LR citizenship
15.0 16.3
The data were subject to the weighting procedure. Unweighted count and weighted percents were used in the report.
Research: Attitude towards corporal punishment of children
SKDS, April 2009 4
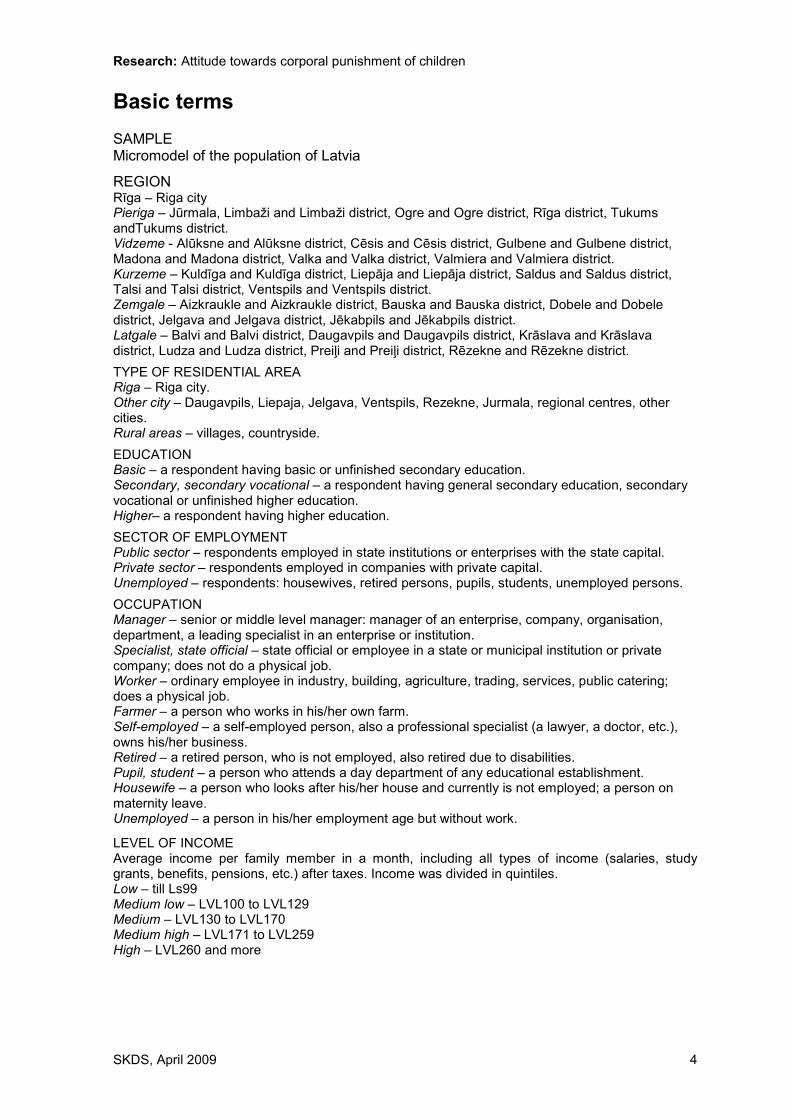
Basic terms SAMPLE Micromodel of the population of Latvia
REGION Rīga – Riga city Pieriga – Jūrmala, Limbaži and Limbaži district, Ogre and Ogre district, Rīga district, Tukums andTukums district. Vidzeme - Alūksne and Alūksne district, Cēsis and Cēsis district, Gulbene and Gulbene district, Madona and Madona district, Valka and Valka district, Valmiera and Valmiera district. Kurzeme – Kuldīga and Kuldīga district, Liepāja and Liepāja district, Saldus and Saldus district, Talsi and Talsi district, Ventspils and Ventspils district. Zemgale – Aizkraukle and Aizkraukle district, Bauska and Bauska district, Dobele and Dobele district, Jelgava and Jelgava district, Jēkabpils and Jēkabpils district. Latgale – Balvi and Balvi district, Daugavpils and Daugavpils district, Krāslava and Krāslava district, Ludza and Ludza district, PreiĜi and PreiĜi district, Rēzekne and Rēzekne district.
TYPE OF RESIDENTIAL AREA Riga – Riga city. Other city – Daugavpils, Liepaja, Jelgava, Ventspils, Rezekne, Jurmala, regional centres, other cities. Rural areas – villages, countryside.
EDUCATION Basic – a respondent having basic or unfinished secondary education. Secondary, secondary vocational – a respondent having general secondary education, secondary vocational or unfinished higher education. Higher– a respondent having higher education.
SECTOR OF EMPLOYMENT Public sector – respondents employed in state institutions or enterprises with the state capital. Private sector – respondents employed in companies with private capital. Unemployed – respondents: housewives, retired persons, pupils, students, unemployed persons.
OCCUPATION Manager – senior or middle level manager: manager of an enterprise, company, organisation, department, a leading specialist in an enterprise or institution. Specialist, state official – state official or employee in a state or municipal institution or private company; does not do a physical job. Worker – ordinary employee in industry, building, agriculture, trading, services, public catering; does a physical job. Farmer – a person who works in his/her own farm. Self-employed – a self-employed person, also a professional specialist (a lawyer, a doctor, etc.), owns his/her business. Retired – a retired person, who is not employed, also retired due to disabilities. Pupil, student – a person who attends a day department of any educational establishment. Housewife – a person who looks after his/her house and currently is not employed; a person on maternity leave. Unemployed – a person in his/her employment age but without work.
LEVEL OF INCOME Average income per family member in a month, including all types of income (salaries, study grants, benefits, pensions, etc.) after taxes. Income was divided in quintiles. Low – till Ls99 Medium low – LVL100 to LVL129 Medium – LVL130 to LVL170 Medium high – LVL171 to LVL259 High – LVL260 and more
Research: Attitude towards corporal punishment of children
SKDS, April 2009 5
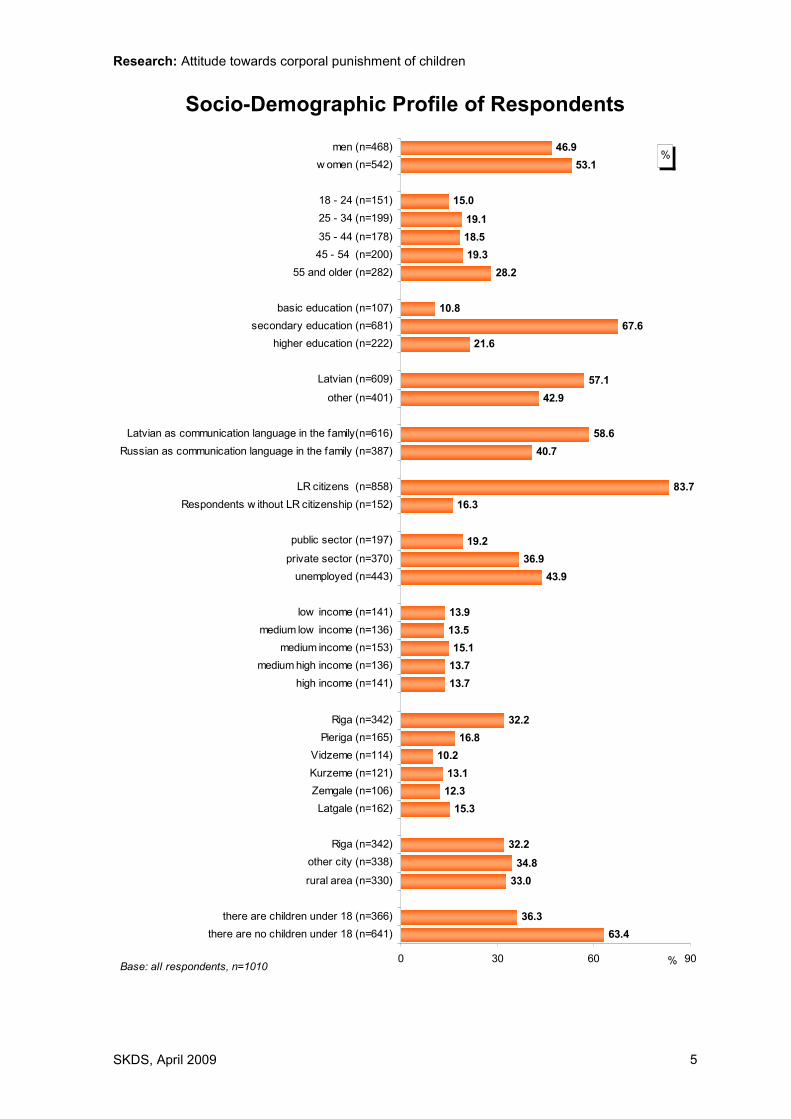
Socio-Demographic Profile of Respondents
Base: all respondents, n=1010
63.4
36.3
33.0
34.8
32.2
15.3
12.3
13.1
10.2
16.8
32.2
13.7
13.7
15.1
13.5
13.9
43.9
36.9
19.2
16.3
40.7
58.6
42.9
57.1
67.6
10.8
28.2
19.3
18.5
19.1
15.0
53.1
46.9
21.6
83.7
0 30 60 90
there are no children under 18 (n=641)
there are children under 18 (n=366)
rural area (n=330)
other city (n=338)
Riga (n=342)
Latgale (n=162)
Zemgale (n=106)
Kurzeme (n=121)
Vidzeme (n=114)
Pieriga (n=165)
Riga (n=342)
high income (n=141)
medium high income (n=136)
medium income (n=153)
medium low income (n=136)
low income (n=141)
unemployed (n=443)
private sector (n=370)
public sector (n=197)
Respondents w ithout LR citizenship (n=152)
LR citizens (n=858)
Russian as communication language in the family (n=387)
Latvian as communication language in the family(n=616)
other (n=401)
Latvian (n=609)
higher education (n=222)
secondary education (n=681)
basic education (n=107)
55 and older (n=282)
45 - 54 (n=200)
35 - 44 (n=178)
25 - 34 (n=199)
18 - 24 (n=151)
w omen (n=542)
men (n=468)%
%
Research: Attitude towards corporal punishment of children
SKDS, April 2009 6
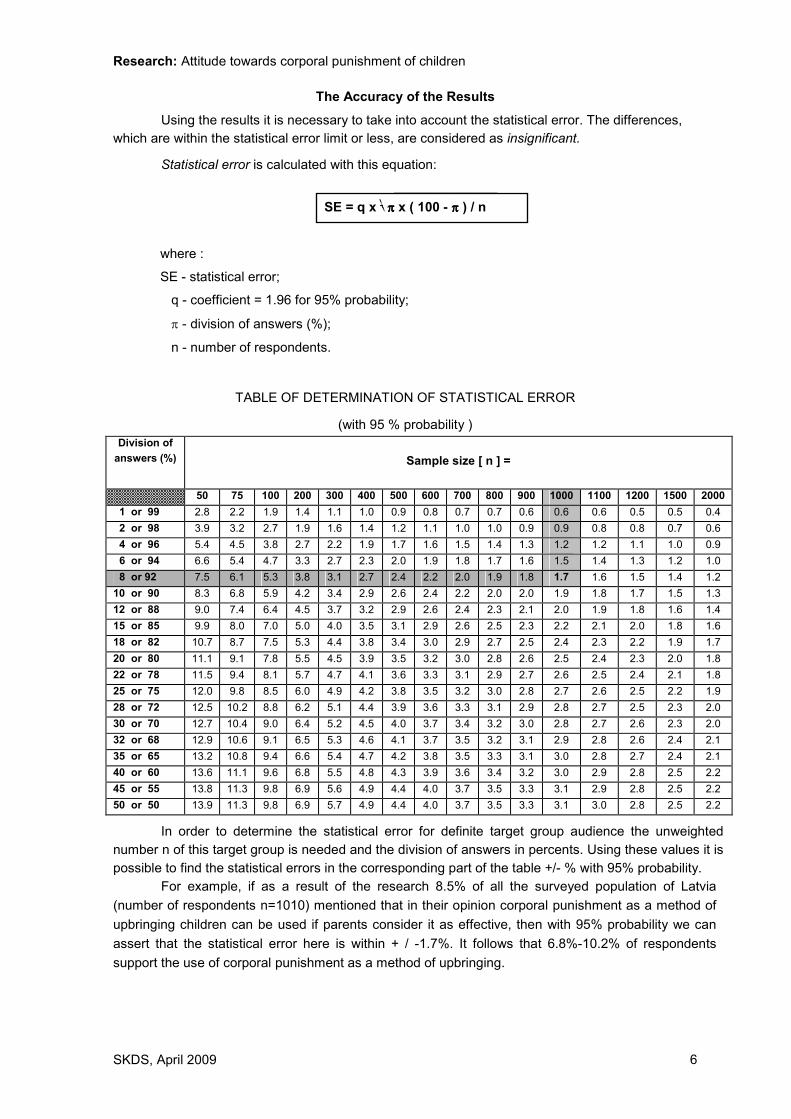
The Accuracy of the Results
Using the results it is necessary to take into account the statistical error. The differences,
which are within the statistical error limit or less, are considered as insignificant.
Statistical error is calculated with this equation:
______________
SE = q x √√√√ππππ x ( 100 - ππππ ) / n
where :
SE - statistical error;
q - coefficient = 1.96 for 95% probability;
π - division of answers (%);
n - number of respondents.
TABLE OF DETERMINATION OF STATISTICAL ERROR
(with 95 % probability )
Division of
answers (%)
Sample size [ n ] =
50 75 100 200 300 400 500 600 700 800 900 1000 1100 1200 1500 2000
1 or 99 2.8 2.2 1.9 1.4 1.1 1.0 0.9 0.8 0.7 0.7 0.6 0.6 0.6 0.5 0.5 0.4
2 or 98 3.9 3.2 2.7 1.9 1.6 1.4 1.2 1.1 1.0 1.0 0.9 0.9 0.8 0.8 0.7 0.6
4 or 96 5.4 4.5 3.8 2.7 2.2 1.9 1.7 1.6 1.5 1.4 1.3 1.2 1.2 1.1 1.0 0.9
6 or 94 6.6 5.4 4.7 3.3 2.7 2.3 2.0 1.9 1.8 1.7 1.6 1.5 1.4 1.3 1.2 1.0
8 or 92 7.5 6.1 5.3 3.8 3.1 2.7 2.4 2.2 2.0 1.9 1.8 1.7 1.6 1.5 1.4 1.2
10 or 90 8.3 6.8 5.9 4.2 3.4 2.9 2.6 2.4 2.2 2.0 2.0 1.9 1.8 1.7 1.5 1.3
12 or 88 9.0 7.4 6.4 4.5 3.7 3.2 2.9 2.6 2.4 2.3 2.1 2.0 1.9 1.8 1.6 1.4
15 or 85 9.9 8.0 7.0 5.0 4.0 3.5 3.1 2.9 2.6 2.5 2.3 2.2 2.1 2.0 1.8 1.6
18 or 82 10.7 8.7 7.5 5.3 4.4 3.8 3.4 3.0 2.9 2.7 2.5 2.4 2.3 2.2 1.9 1.7
20 or 80 11.1 9.1 7.8 5.5 4.5 3.9 3.5 3.2 3.0 2.8 2.6 2.5 2.4 2.3 2.0 1.8
22 or 78 11.5 9.4 8.1 5.7 4.7 4.1 3.6 3.3 3.1 2.9 2.7 2.6 2.5 2.4 2.1 1.8
25 or 75 12.0 9.8 8.5 6.0 4.9 4.2 3.8 3.5 3.2 3.0 2.8 2.7 2.6 2.5 2.2 1.9
28 or 72 12.5 10.2 8.8 6.2 5.1 4.4 3.9 3.6 3.3 3.1 2.9 2.8 2.7 2.5 2.3 2.0
30 or 70 12.7 10.4 9.0 6.4 5.2 4.5 4.0 3.7 3.4 3.2 3.0 2.8 2.7 2.6 2.3 2.0
32 or 68 12.9 10.6 9.1 6.5 5.3 4.6 4.1 3.7 3.5 3.2 3.1 2.9 2.8 2.6 2.4 2.1
35 or 65 13.2 10.8 9.4 6.6 5.4 4.7 4.2 3.8 3.5 3.3 3.1 3.0 2.8 2.7 2.4 2.1
40 or 60 13.6 11.1 9.6 6.8 5.5 4.8 4.3 3.9 3.6 3.4 3.2 3.0 2.9 2.8 2.5 2.2
45 or 55 13.8 11.3 9.8 6.9 5.6 4.9 4.4 4.0 3.7 3.5 3.3 3.1 2.9 2.8 2.5 2.2
50 or 50 13.9 11.3 9.8 6.9 5.7 4.9 4.4 4.0 3.7 3.5 3.3 3.1 3.0 2.8 2.5 2.2
In order to determine the statistical error for definite target group audience the unweighted
number n of this target group is needed and the division of answers in percents. Using these values it is
possible to find the statistical errors in the corresponding part of the table +/- % with 95% probability.
For example, if as a result of the research 8.5% of all the surveyed population of Latvia
(number of respondents n=1010) mentioned that in their opinion corporal punishment as a method of
upbringing children can be used if parents consider it as effective, then with 95% probability we can
assert that the statistical error here is within + / -1.7%. It follows that 6.8%-10.2% of respondents
support the use of corporal punishment as a method of upbringing.
Research: Attitude towards corporal punishment of children
SKDS, April 2009 7
1. Opinion about subjecting children to corporal punishment in
Latvia
In the survey of Latvia’s population carried out in April 2009, the participants of the
research were asked to evaluate what percentage of children in Latvia in their opinion is
subjected to corporal punishment (beating, spanking as punishment) in their families.
Data about the answers of respondents is summarized in the following chart (it
should be added that respondents were not offered variants of answers, they named the
appropriate number).
%
0.7
0.4
0.2
0.1
3.1
0.1
6.7
0.1
3.2
0.1 0.2
0.1
9.2
3.5
0.1
10.7
1.6
0.2
8.0
0.1
1.6
16.2
0.8
8.0
0.1 0.8
0.1
0.1
6.3
0.1 0.9
0.1
0.1
0.1
5.1
0.3 0.7
0.2
2.9
0.1 0.2 0.5 0.7 1.2
4.4
0.1
0
5
10
15
20
0%
1%
2%
3%
5%
6%
10
%
11
%
15
%
16
%
17
%
18
%
20
%
25
%
28
%
29
%
30
%
35
%
37
%
40
%
42
%
45
%
50
%
55
%
60
%
63
%
65
%
66
%
68
%
70
%
72
%
75
%
76
%
78
%
79
%
80
%
82
%
85
%
89
%
90
%
94
%
95
%
98
%
99
%
10
0%
NA
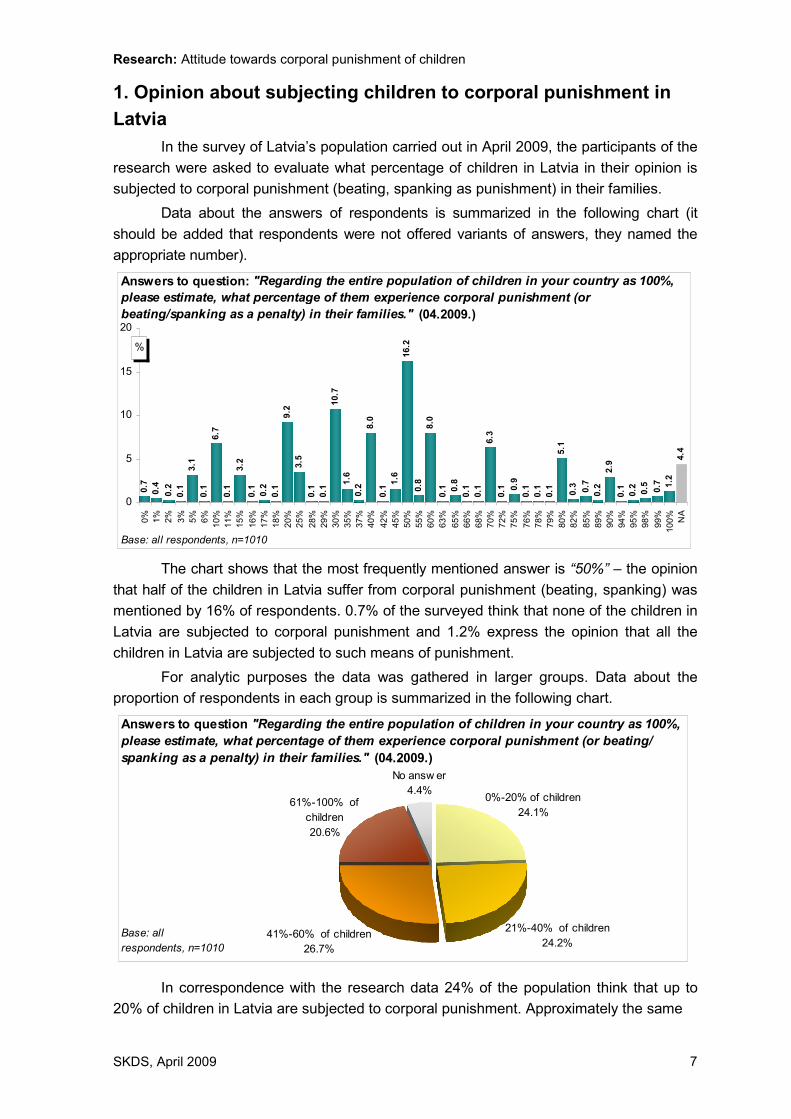
Answers to question: "Regarding the entire population of children in your country as 100%,
please estimate, what percentage of them experience corporal punishment (or
beating/spanking as a penalty) in their families." (04.2009.)
Base: all respondents, n=1010
The chart shows that the most frequently mentioned answer is “50%” – the opinion
that half of the children in Latvia suffer from corporal punishment (beating, spanking) was
mentioned by 16% of respondents. 0.7% of the surveyed think that none of the children in
Latvia are subjected to corporal punishment and 1.2% express the opinion that all the
children in Latvia are subjected to such means of punishment.
For analytic purposes the data was gathered in larger groups. Data about the
proportion of respondents in each group is summarized in the following chart.
0%-20% of children
24.1%
No answ er
4.4%61%-100% of
children
20.6%
41%-60% of children
26.7%
21%-40% of children
24.2%
Answers to question "Regarding the entire population of children in your country as 100%,
please estimate, what percentage of them experience corporal punishment (or beating/
spanking as a penalty) in their families." (04.2009.)
Base: all
respondents, n=1010
In correspondence with the research data 24% of the population think that up to
20% of children in Latvia are subjected to corporal punishment. Approximately the same
Research: Attitude towards corporal punishment of children
SKDS, April 2009 8
number of respondents (24%) believe that 21%-40% of children undergo such means of
punishment but the opinion that such punishment affects 41%-60% of children was
mentioned slightly more frequently (27%). The numbers from 61% to 100% were named
by 21% of respondents.
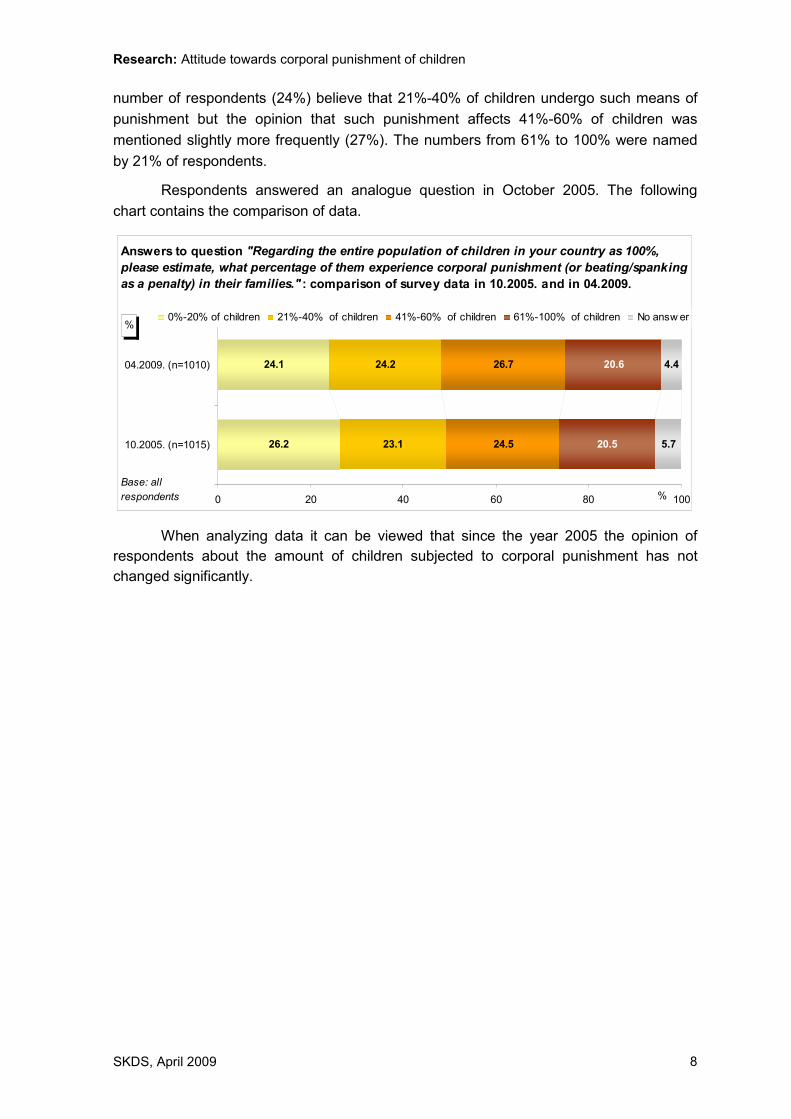
Respondents answered an analogue question in October 2005. The following
chart contains the comparison of data.
24.2
23.1 24.5
20.6
20.5
4.4
5.726.2
24.1 26.7
0 20 40 60 80 100
04.2009. (n=1010)
10.2005. (n=1015)
%
%
0%-20% of children 21%-40% of children 41%-60% of children 61%-100% of children No answ er
Base: all
respondents
Answers to question "Regarding the entire population of children in your country as 100%,
please estimate, what percentage of them experience corporal punishment (or beating/spanking
as a penalty) in their families." : comparison of survey data in 10.2005. and in 04.2009.
When analyzing data it can be viewed that since the year 2005 the opinion of
respondents about the amount of children subjected to corporal punishment has not
changed significantly.
Research: Attitude towards corporal punishment of children
SKDS, April 2009 9
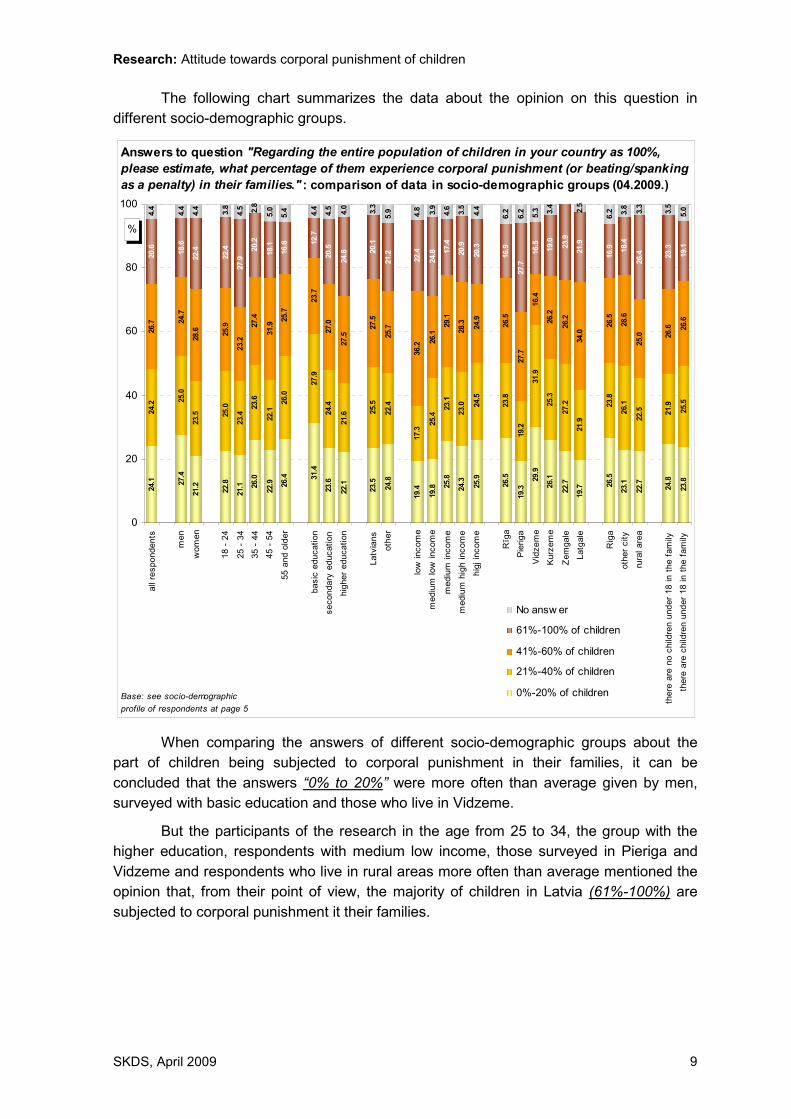
The following chart summarizes the data about the opinion on this question in
different socio-demographic groups.
24.1 27.4
21.2
22.8
21.1 26.0
22.9 26.4 31.4
23.6
22.1
23.5
24.8
19.4
19.8 25.8
24.3
25.9
26.5
19.3 26.1
22.7
19.7 26.5
23.1
22.7
24.8
23.8
24.2
25.0
23.5 25.0
23.4
23.6 26.0
27.9
24.4
25.5
23.1
23.0 24.5
23.8
25.3
27.2
21.9 22.5 25.5
25.9
23.2
27.4
31.9
25.7
23.7
27.0
27.5
27.5
25.7
36.2
26.1
29.1
28.3
24.9
26.5
27.7
16.4
26.2
26.2
34.0
26.5
28.6
25.0 26.6 26.6
22.4
27.9
20.2
18.1
16.6 12.7
20.5
24.8 20.1
21.2
22.4
24.8 17.4
20.9
20.3
16.9
27.7
16.5
19.0
23.9
21.9
16.9 18.4
26.4 23.3
19.1
3.5 3.4 2.5
3.3
29.9
22.1
21.6 22.4
17.3
25.4
19.2
31.9
23.8
26.1
21.9
24.7
26.7
28.6
22.418.6
20.6
4.4
5.0
6.25.3
6.2
6.24.83.3
4.5 3.8 3.5
4.4
4.63.9
5.94.0
4.5
4.4
5.45.02.8
3.8
4.4
4.4
0
20
40
60
80
100
all
responden
ts
men
wom
en
18 -
24
25 -
34
35 -
44
45 -
54
55
and o
lder
basic
educati
on
se
condary
educati
on
hig
her
educati
on
Latv
ians
oth
er
low
incom
e
mediu
m l
ow
incom
e
mediu
m incom
e
mediu
m h
igh incom
e
hig
j in
com
e
Rīg
a
Pie
riga
Vid
ze
me
Kurz
em
e
Zem
ga
le
Latg
ale
Rig
a
oth
er
city
rura
l are
a
there
are
no c
hild
ren u
nd
er
18 in t
he f
am
ily
there
are
child
ren u
nd
er
18 in t
he f
am
ily
%
No answ er
61%-100% of children
41%-60% of children
21%-40% of children
0%-20% of childrenBase: see socio-demographic
profile of respondents at page 5
Answers to question "Regarding the entire population of children in your country as 100%,
please estimate, what percentage of them experience corporal punishment (or beating/spanking
as a penalty) in their families." : comparison of data in socio-demographic groups (04.2009.)
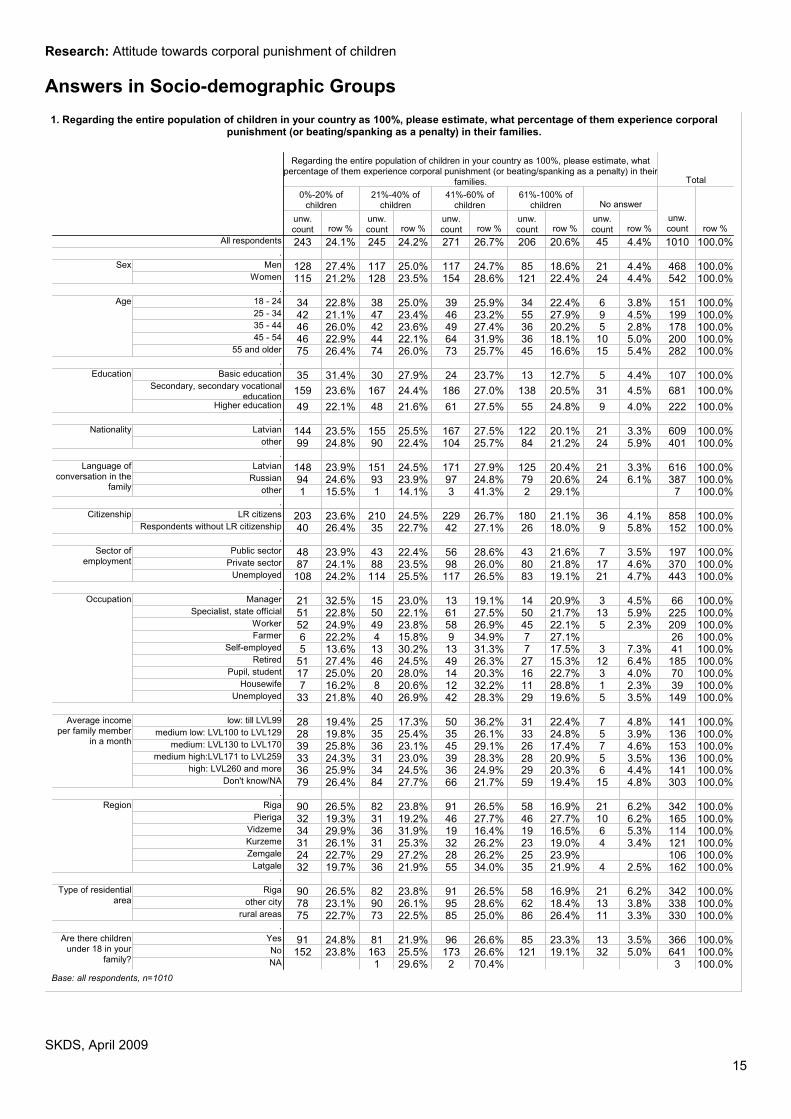
When comparing the answers of different socio-demographic groups about the
part of children being subjected to corporal punishment in their families, it can be
concluded that the answers “0% to 20%” were more often than average given by men,
surveyed with basic education and those who live in Vidzeme.
But the participants of the research in the age from 25 to 34, the group with the
higher education, respondents with medium low income, those surveyed in Pieriga and
Vidzeme and respondents who live in rural areas more often than average mentioned the
opinion that, from their point of view, the majority of children in Latvia (61%-100%) are
subjected to corporal punishment it their families.
Research: Attitude towards corporal punishment of children
SKDS, April 2009 10
2. Attitude towards corporal punishment as a method of
upbringing children
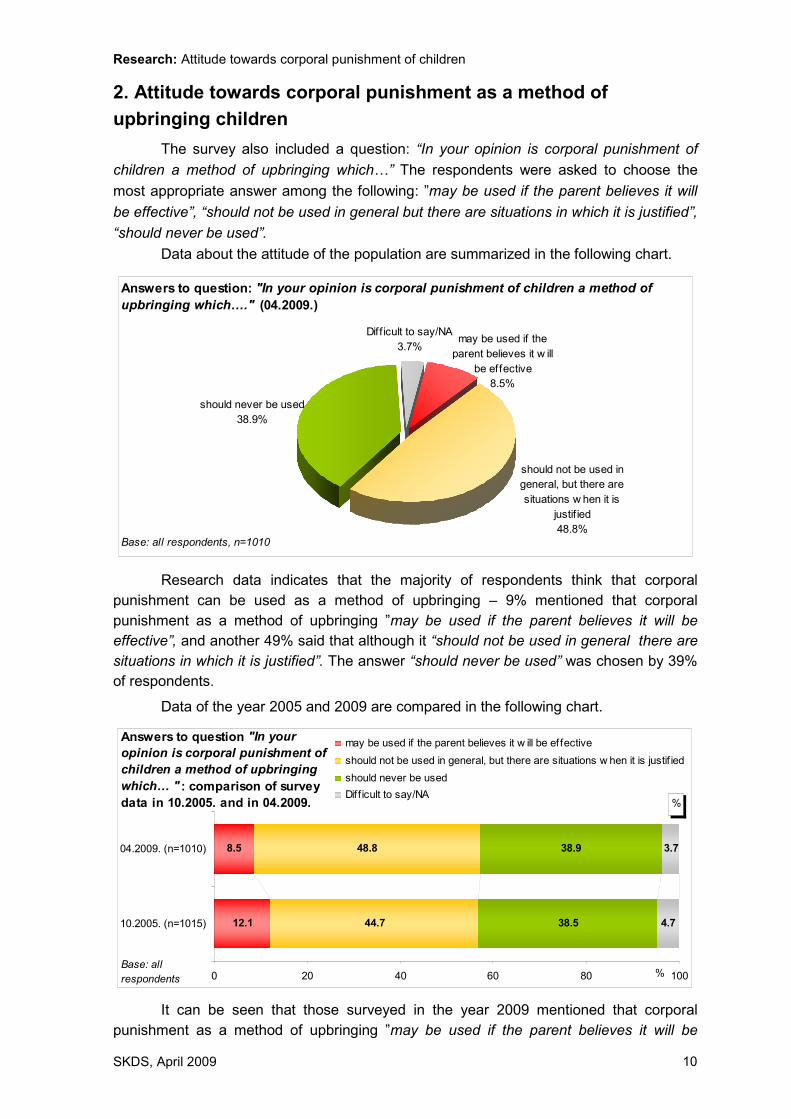
The survey also included a question: “In your opinion is corporal punishment of
children a method of upbringing which…” The respondents were asked to choose the
most appropriate answer among the following: ”may be used if the parent believes it will
be effective”, “should not be used in general but there are situations in which it is justified”,
“should never be used”.
Data about the attitude of the population are summarized in the following chart.
should not be used in
general, but there are
situations w hen it is
justif ied
48.8%
should never be used
38.9%
Diff icult to say/NA
3.7%may be used if the
parent believes it w ill
be effective
8.5%
Answers to question: "In your opinion is corporal punishment of children a method of
upbringing which…." (04.2009.)
Base: all respondents, n=1010
Research data indicates that the majority of respondents think that corporal
punishment can be used as a method of upbringing – 9% mentioned that corporal
punishment as a method of upbringing ”may be used if the parent believes it will be
effective”, and another 49% said that although it “should not be used in general there are
situations in which it is justified”. The answer “should never be used” was chosen by 39%
of respondents.
Data of the year 2005 and 2009 are compared in the following chart.
48.8
44.7 38.5
3.7
4.7
8.5
12.1
38.9
0 20 40 60 80 100
04.2009. (n=1010)
10.2005. (n=1015)
%
%
may be used if the parent believes it w ill be effective
should not be used in general, but there are situations w hen it is justif ied
should never be used
Dif f icult to say/NA
Base: all
respondents
Answers to question "In your
opinion is corporal punishment of
children a method of upbringing
which… " : comparison of survey
data in 10.2005. and in 04.2009.
It can be seen that those surveyed in the year 2009 mentioned that corporal
punishment as a method of upbringing ”may be used if the parent believes it will be
Research: Attitude towards corporal punishment of children
SKDS, April 2009 11
effective” more rarely (9%) than those surveyed in the year 2005 (12%). However, the
frequency of marking the answer “should never be used” has not changed significantly
(39% in both surveys)
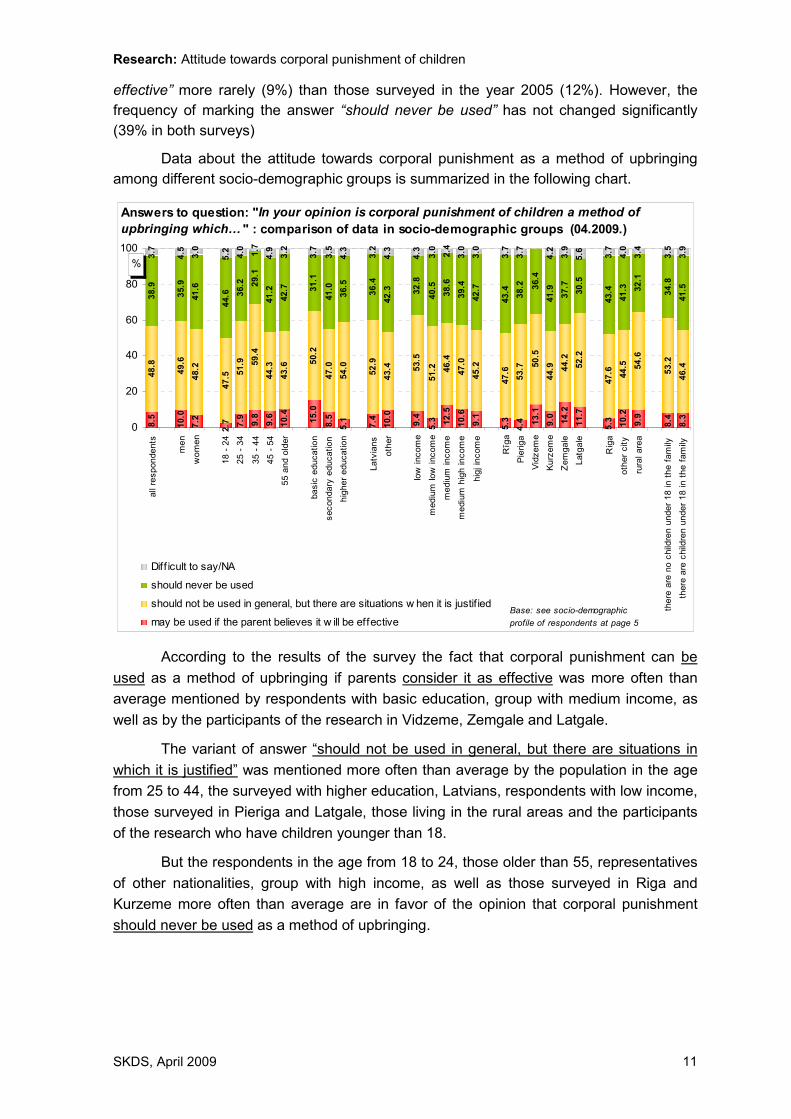
Data about the attitude towards corporal punishment as a method of upbringing
among different socio-demographic groups is summarized in the following chart.
8.5
10.0
7.2 7.9 9.8
9.6
10.4
15.0
8.5
7.4
10.0
9.4
5.3 12.5
10.6
5.3
4.4 11.7
5.3 10.2
9.9
8.4
8.3
48.8
49.6
48.2
47.5 51.9 59.4
43.6
50.2
47.0
52.9
46.4
47.0
45.2
47.6
44.9 44.2
52.2
54.6
46.4
44.6 36.2 29.1
41.2
42.7 31.1
41.0
36.5
36.4
42.3 32.8
40.5
38.6
39.4
42.7
43.4
38.2 36.4
41.9
37.7
30.5
43.4
41.3 32.1
34.8
41.5
5.2 4.0 1.7
4.9 3.2
3.7
3.5
4.3 3.2
4.3
4.3 3.0 2.4
3.0
3.0
3.7
3.7
4.2 3.9
3.7
4.0
3.4
3.5
3.9
9.1
9.0
5.1
2.7 14.2
13.1
44.3
54.0
43.4 53.5
51.2
53.7 50.5
47.6 44.5
53.2
35.9
38.9
41.6
5.63.0
4.53.7
0
20
40
60
80
100
all
resp
on
de
nts
me
n
wo
me
n
18 -
24
25 -
34
35 -
44
45 -
54
55 a
nd o
lder
ba
sic
edu
ca
tio
n
sec
on
da
ry e
du
ca
tio
n
hig
he
r e
du
ca
tio
n
La
tvia
ns
oth
er
low
inc
om
e
med
ium
low
inc
om
e
me
diu
m in
co
me
me
diu
m h
igh
in
com
e
hig
j in
com
e
Rīg
a
Pie
rig
a
Vid
zem
e
Ku
rzem
e
Ze
mga
le
Latg
ale
Rig
a
oth
er
cit
y
rura
l are
a
the
re a
re n
o c
hild
ren u
nde
r 1
8 in
th
e f
am
ily
there
are
child
ren u
nde
r 1
8 in
th
e f
am
ily
%
Diff icult to say/NA
should never be used
should not be used in general, but there are situations w hen it is justif ied
may be used if the parent believes it w ill be effectiveBase: see socio-demographic
profile of respondents at page 5
Answers to question: "In your opinion is corporal punishment of children a method of
upbringing which… " : comparison of data in socio-demographic groups (04.2009.)
According to the results of the survey the fact that corporal punishment can be
used as a method of upbringing if parents consider it as effective was more often than
average mentioned by respondents with basic education, group with medium income, as
well as by the participants of the research in Vidzeme, Zemgale and Latgale.
The variant of answer “should not be used in general, but there are situations in
which it is justified” was mentioned more often than average by the population in the age
from 25 to 44, the surveyed with higher education, Latvians, respondents with low income,
those surveyed in Pieriga and Latgale, those living in the rural areas and the participants
of the research who have children younger than 18.
But the respondents in the age from 18 to 24, those older than 55, representatives
of other nationalities, group with high income, as well as those surveyed in Riga and
Kurzeme more often than average are in favor of the opinion that corporal punishment
should never be used as a method of upbringing.

12
Tables of results
Frequencies
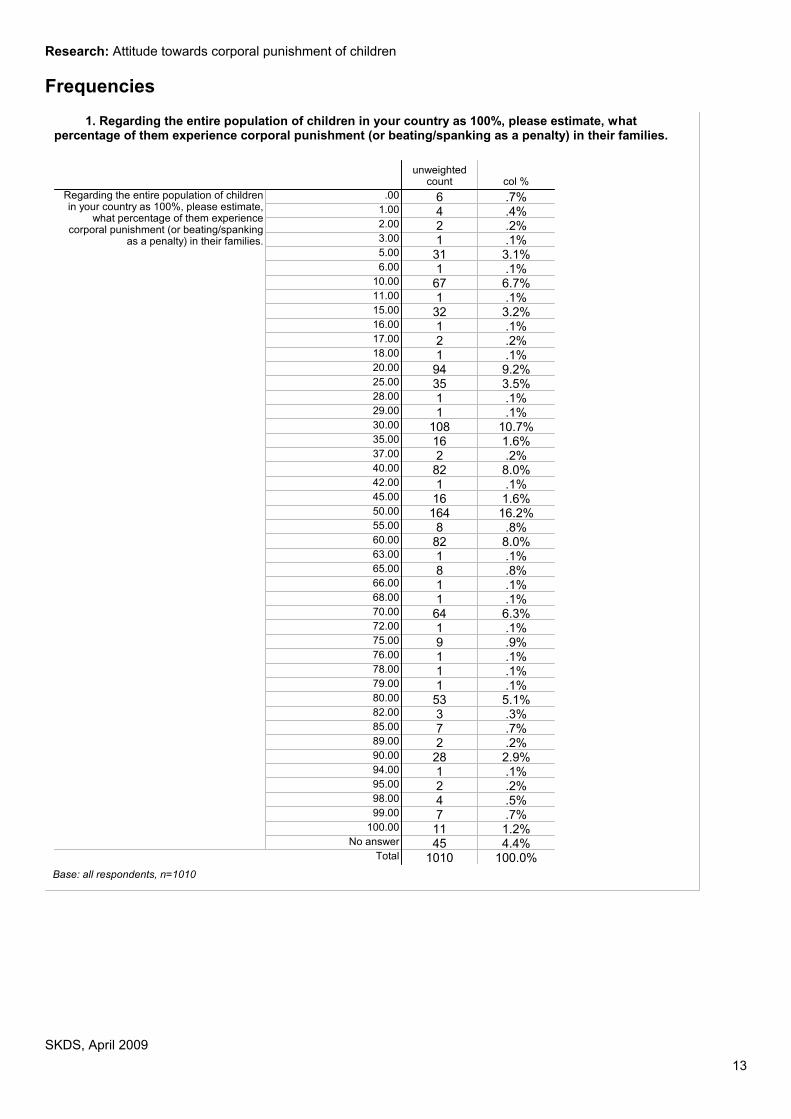
1. Regarding the entire population of children in your country as 100%, please estimate, whatpercentage of them experience corporal punishment (or beating/spanking as a penalty) in their families.
6 .7%4 .4%2 .2%1 .1%31 3.1%1 .1%67 6.7%1 .1%32 3.2%1 .1%2 .2%1 .1%94 9.2%35 3.5%1 .1%1 .1%
108 10.7%16 1.6%2 .2%82 8.0%1 .1%16 1.6%164 16.2%8 .8%82 8.0%1 .1%8 .8%1 .1%1 .1%64 6.3%1 .1%9 .9%1 .1%1 .1%1 .1%53 5.1%3 .3%7 .7%2 .2%28 2.9%1 .1%2 .2%4 .5%7 .7%11 1.2%45 4.4%
1010 100.0%
.00
1.00
2.00
3.00
5.00
6.00
10.00
11.00
15.00
16.00
17.00
18.00
20.00
25.00
28.00
29.00
30.00
35.00
37.00
40.00
42.00
45.00
50.00
55.00
60.00
63.00
65.00
66.00
68.00
70.00
72.00
75.00
76.00
78.00
79.00
80.00
82.00
85.00
89.00
90.00
94.00
95.00
98.00
99.00
100.00
No answer
Regarding the entire population of childrenin your country as 100%, please estimate,
what percentage of them experiencecorporal punishment (or beating/spanking
as a penalty) in their families.
Total
unweightedcount col %
Base: all respondents, n=1010
Research: Attitude towards corporal punishment of children
SKDS, April 2009
13
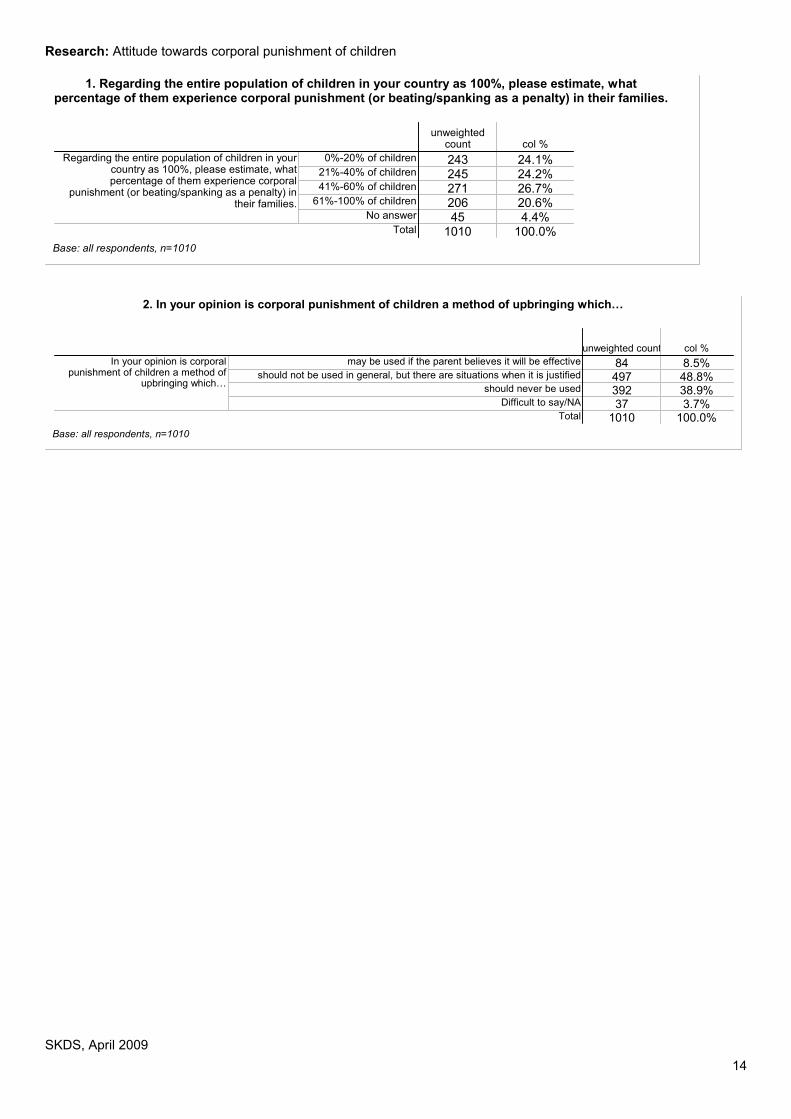
1. Regarding the entire population of children in your country as 100%, please estimate, whatpercentage of them experience corporal punishment (or beating/spanking as a penalty) in their families.
243 24.1%245 24.2%271 26.7%206 20.6%45 4.4%
1010 100.0%
0%-20% of children
21%-40% of children
41%-60% of children
61%-100% of children
No answer
Regarding the entire population of children in yourcountry as 100%, please estimate, whatpercentage of them experience corporal
punishment (or beating/spanking as a penalty) intheir families.
Total
unweightedcount col %
Base: all respondents, n=1010
2. In your opinion is corporal punishment of children a method of upbringing which…
84 8.5%497 48.8%392 38.9%37 3.7%
1010 100.0%
may be used if the parent believes it will be effective
should not be used in general, but there are situations when it is justified
should never be used
Difficult to say/NA
In your opinion is corporalpunishment of children a method of
upbringing which…
Total
unweighted count col %
Base: all respondents, n=1010
Research: Attitude towards corporal punishment of children
SKDS, April 2009
14
Answers in Socio-demographic Groups
1. Regarding the entire population of children in your country as 100%, please estimate, what percentage of them experience corporalpunishment (or beating/spanking as a penalty) in their families.
243 24.1% 245 24.2% 271 26.7% 206 20.6% 45 4.4% 1010 100.0%
128 27.4% 117 25.0% 117 24.7% 85 18.6% 21 4.4% 468 100.0%115 21.2% 128 23.5% 154 28.6% 121 22.4% 24 4.4% 542 100.0% 34 22.8% 38 25.0% 39 25.9% 34 22.4% 6 3.8% 151 100.0%42 21.1% 47 23.4% 46 23.2% 55 27.9% 9 4.5% 199 100.0%46 26.0% 42 23.6% 49 27.4% 36 20.2% 5 2.8% 178 100.0%46 22.9% 44 22.1% 64 31.9% 36 18.1% 10 5.0% 200 100.0%75 26.4% 74 26.0% 73 25.7% 45 16.6% 15 5.4% 282 100.0% 35 31.4% 30 27.9% 24 23.7% 13 12.7% 5 4.4% 107 100.0%
159 23.6% 167 24.4% 186 27.0% 138 20.5% 31 4.5% 681 100.0%
49 22.1% 48 21.6% 61 27.5% 55 24.8% 9 4.0% 222 100.0%
144 23.5% 155 25.5% 167 27.5% 122 20.1% 21 3.3% 609 100.0%99 24.8% 90 22.4% 104 25.7% 84 21.2% 24 5.9% 401 100.0%
148 23.9% 151 24.5% 171 27.9% 125 20.4% 21 3.3% 616 100.0%94 24.6% 93 23.9% 97 24.8% 79 20.6% 24 6.1% 387 100.0%1 15.5% 1 14.1% 3 41.3% 2 29.1% 7 100.0%
203 23.6% 210 24.5% 229 26.7% 180 21.1% 36 4.1% 858 100.0%40 26.4% 35 22.7% 42 27.1% 26 18.0% 9 5.8% 152 100.0% 48 23.9% 43 22.4% 56 28.6% 43 21.6% 7 3.5% 197 100.0%87 24.1% 88 23.5% 98 26.0% 80 21.8% 17 4.6% 370 100.0%108 24.2% 114 25.5% 117 26.5% 83 19.1% 21 4.7% 443 100.0% 21 32.5% 15 23.0% 13 19.1% 14 20.9% 3 4.5% 66 100.0%51 22.8% 50 22.1% 61 27.5% 50 21.7% 13 5.9% 225 100.0%52 24.9% 49 23.8% 58 26.9% 45 22.1% 5 2.3% 209 100.0%6 22.2% 4 15.8% 9 34.9% 7 27.1% 26 100.0%5 13.6% 13 30.2% 13 31.3% 7 17.5% 3 7.3% 41 100.0%51 27.4% 46 24.5% 49 26.3% 27 15.3% 12 6.4% 185 100.0%17 25.0% 20 28.0% 14 20.3% 16 22.7% 3 4.0% 70 100.0%7 16.2% 8 20.6% 12 32.2% 11 28.8% 1 2.3% 39 100.0%33 21.8% 40 26.9% 42 28.3% 29 19.6% 5 3.5% 149 100.0% 28 19.4% 25 17.3% 50 36.2% 31 22.4% 7 4.8% 141 100.0%28 19.8% 35 25.4% 35 26.1% 33 24.8% 5 3.9% 136 100.0%39 25.8% 36 23.1% 45 29.1% 26 17.4% 7 4.6% 153 100.0%33 24.3% 31 23.0% 39 28.3% 28 20.9% 5 3.5% 136 100.0%36 25.9% 34 24.5% 36 24.9% 29 20.3% 6 4.4% 141 100.0%79 26.4% 84 27.7% 66 21.7% 59 19.4% 15 4.8% 303 100.0% 90 26.5% 82 23.8% 91 26.5% 58 16.9% 21 6.2% 342 100.0%32 19.3% 31 19.2% 46 27.7% 46 27.7% 10 6.2% 165 100.0%34 29.9% 36 31.9% 19 16.4% 19 16.5% 6 5.3% 114 100.0%31 26.1% 31 25.3% 32 26.2% 23 19.0% 4 3.4% 121 100.0%24 22.7% 29 27.2% 28 26.2% 25 23.9% 106 100.0%32 19.7% 36 21.9% 55 34.0% 35 21.9% 4 2.5% 162 100.0% 90 26.5% 82 23.8% 91 26.5% 58 16.9% 21 6.2% 342 100.0%78 23.1% 90 26.1% 95 28.6% 62 18.4% 13 3.8% 338 100.0%75 22.7% 73 22.5% 85 25.0% 86 26.4% 11 3.3% 330 100.0% 91 24.8% 81 21.9% 96 26.6% 85 23.3% 13 3.5% 366 100.0%152 23.8% 163 25.5% 173 26.6% 121 19.1% 32 5.0% 641 100.0% 1 29.6% 2 70.4% 3 100.0%
All respondents
.
Men
Women
Sex
.
18 - 24
25 - 34
35 - 44
45 - 54
55 and older
Age
.
Basic education
Secondary, secondary vocational
educationHigher education
Education
.
Latvian
other
Nationality
.
Latvian
Russian
other
Language of
conversation in thefamily
.
LR citizens
Respondents without LR citizenship
Citizenship
.
Public sector
Private sector
Unemployed
Sector of
employment
.
Manager
Specialist, state official
Worker
Farmer
Self-employed
Retired
Pupil, student
Housewife
Unemployed
Occupation
.
low: till LVL99
medium low: LVL100 to LVL129
medium: LVL130 to LVL170
medium high:LVL171 to LVL259
high: LVL260 and more
Don't know/NA
Average income
per family memberin a month
.
Riga
Pieriga
Vidzeme
Kurzeme
Zemgale
Latgale
Region
.
Riga
other city
rural areas
Type of residential
area
.
Yes
No
NA
Are there children
under 18 in your
family?
unw.
count row %
0%-20% ofchildren
unw.
count row %
21%-40% ofchildren
unw.
count row %
41%-60% ofchildren
unw.
count row %
61%-100% ofchildren
unw.
count row %
No answer
Regarding the entire population of children in your country as 100%, please estimate, what
percentage of them experience corporal punishment (or beating/spanking as a penalty) in their
families.
unw.
count row %
Total
Base: all respondents, n=1010
Research: Attitude towards corporal punishment of children
SKDS, April 2009
15
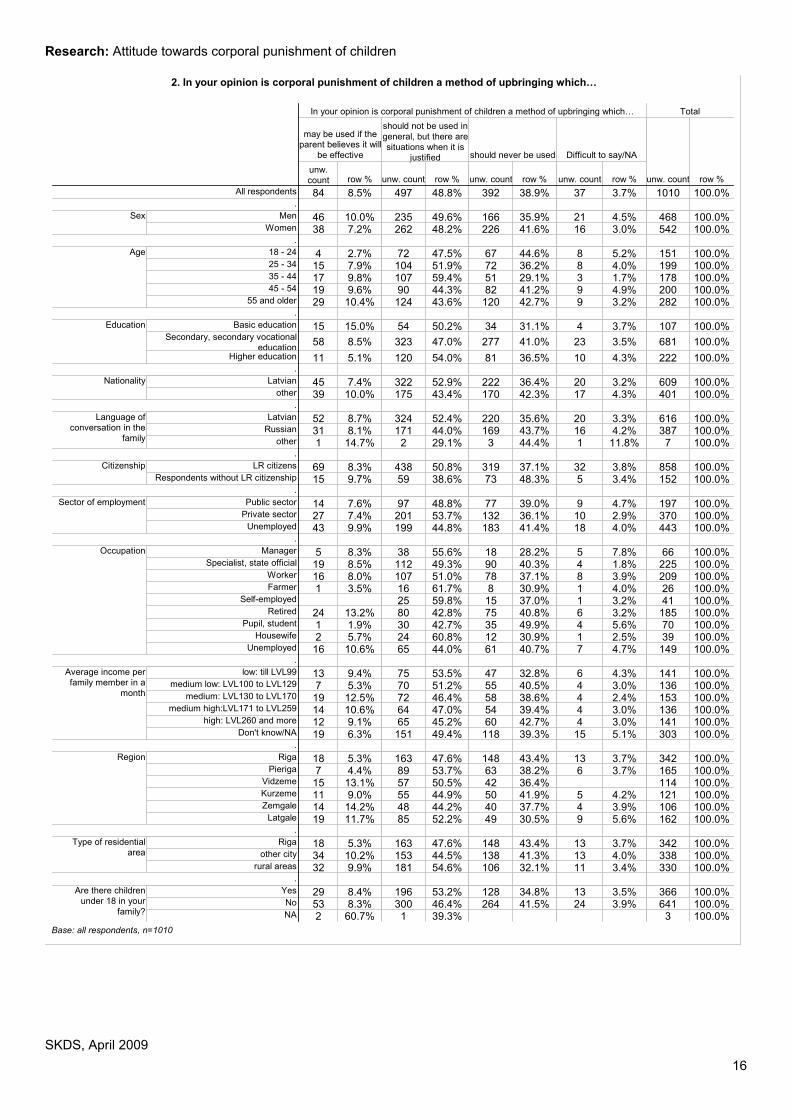
2. In your opinion is corporal punishment of children a method of upbringing which…
84 8.5% 497 48.8% 392 38.9% 37 3.7% 1010 100.0% 46 10.0% 235 49.6% 166 35.9% 21 4.5% 468 100.0%38 7.2% 262 48.2% 226 41.6% 16 3.0% 542 100.0% 4 2.7% 72 47.5% 67 44.6% 8 5.2% 151 100.0%15 7.9% 104 51.9% 72 36.2% 8 4.0% 199 100.0%17 9.8% 107 59.4% 51 29.1% 3 1.7% 178 100.0%19 9.6% 90 44.3% 82 41.2% 9 4.9% 200 100.0%29 10.4% 124 43.6% 120 42.7% 9 3.2% 282 100.0% 15 15.0% 54 50.2% 34 31.1% 4 3.7% 107 100.0%
58 8.5% 323 47.0% 277 41.0% 23 3.5% 681 100.0%
11 5.1% 120 54.0% 81 36.5% 10 4.3% 222 100.0% 45 7.4% 322 52.9% 222 36.4% 20 3.2% 609 100.0%39 10.0% 175 43.4% 170 42.3% 17 4.3% 401 100.0% 52 8.7% 324 52.4% 220 35.6% 20 3.3% 616 100.0%31 8.1% 171 44.0% 169 43.7% 16 4.2% 387 100.0%1 14.7% 2 29.1% 3 44.4% 1 11.8% 7 100.0% 69 8.3% 438 50.8% 319 37.1% 32 3.8% 858 100.0%15 9.7% 59 38.6% 73 48.3% 5 3.4% 152 100.0% 14 7.6% 97 48.8% 77 39.0% 9 4.7% 197 100.0%27 7.4% 201 53.7% 132 36.1% 10 2.9% 370 100.0%43 9.9% 199 44.8% 183 41.4% 18 4.0% 443 100.0% 5 8.3% 38 55.6% 18 28.2% 5 7.8% 66 100.0%19 8.5% 112 49.3% 90 40.3% 4 1.8% 225 100.0%16 8.0% 107 51.0% 78 37.1% 8 3.9% 209 100.0%1 3.5% 16 61.7% 8 30.9% 1 4.0% 26 100.0% 25 59.8% 15 37.0% 1 3.2% 41 100.0%24 13.2% 80 42.8% 75 40.8% 6 3.2% 185 100.0%1 1.9% 30 42.7% 35 49.9% 4 5.6% 70 100.0%2 5.7% 24 60.8% 12 30.9% 1 2.5% 39 100.0%16 10.6% 65 44.0% 61 40.7% 7 4.7% 149 100.0% 13 9.4% 75 53.5% 47 32.8% 6 4.3% 141 100.0%7 5.3% 70 51.2% 55 40.5% 4 3.0% 136 100.0%19 12.5% 72 46.4% 58 38.6% 4 2.4% 153 100.0%14 10.6% 64 47.0% 54 39.4% 4 3.0% 136 100.0%12 9.1% 65 45.2% 60 42.7% 4 3.0% 141 100.0%19 6.3% 151 49.4% 118 39.3% 15 5.1% 303 100.0% 18 5.3% 163 47.6% 148 43.4% 13 3.7% 342 100.0%7 4.4% 89 53.7% 63 38.2% 6 3.7% 165 100.0%15 13.1% 57 50.5% 42 36.4% 114 100.0%11 9.0% 55 44.9% 50 41.9% 5 4.2% 121 100.0%14 14.2% 48 44.2% 40 37.7% 4 3.9% 106 100.0%19 11.7% 85 52.2% 49 30.5% 9 5.6% 162 100.0% 18 5.3% 163 47.6% 148 43.4% 13 3.7% 342 100.0%34 10.2% 153 44.5% 138 41.3% 13 4.0% 338 100.0%32 9.9% 181 54.6% 106 32.1% 11 3.4% 330 100.0% 29 8.4% 196 53.2% 128 34.8% 13 3.5% 366 100.0%53 8.3% 300 46.4% 264 41.5% 24 3.9% 641 100.0%2 60.7% 1 39.3% 3 100.0%
All respondents
.
Men
Women
Sex
.
18 - 24
25 - 34
35 - 44
45 - 54
55 and older
Age
.
Basic education
Secondary, secondary vocational
educationHigher education
Education
.
Latvian
other
Nationality
.
Latvian
Russian
other
Language of
conversation in the
family
.
LR citizens
Respondents without LR citizenship
Citizenship
.
Public sector
Private sector
Unemployed
Sector of employment
.
Manager
Specialist, state official
Worker
Farmer
Self-employed
Retired
Pupil, student
Housewife
Unemployed
Occupation
.
low: till LVL99
medium low: LVL100 to LVL129
medium: LVL130 to LVL170
medium high:LVL171 to LVL259
high: LVL260 and more
Don't know/NA
Average income per
family member in a
month
.
Riga
Pieriga
Vidzeme
Kurzeme
Zemgale
Latgale
Region
.
Riga
other city
rural areas
Type of residential
area
.
Yes
No
NA
Are there children
under 18 in your
family?
unw.
count row %
may be used if theparent believes it will
be effective
unw. count row %
should not be used in
general, but there are
situations when it is
justified
unw. count row %
should never be used
unw. count row %
Difficult to say/NA
In your opinion is corporal punishment of children a method of upbringing which…
unw. count row %
Total
Base: all respondents, n=1010
Research: Attitude towards corporal punishment of children
SKDS, April 2009
16

17
Questionnaire used in the survey
Research: Attitude towards corporal punishment of children
SKDS, April 2009 18
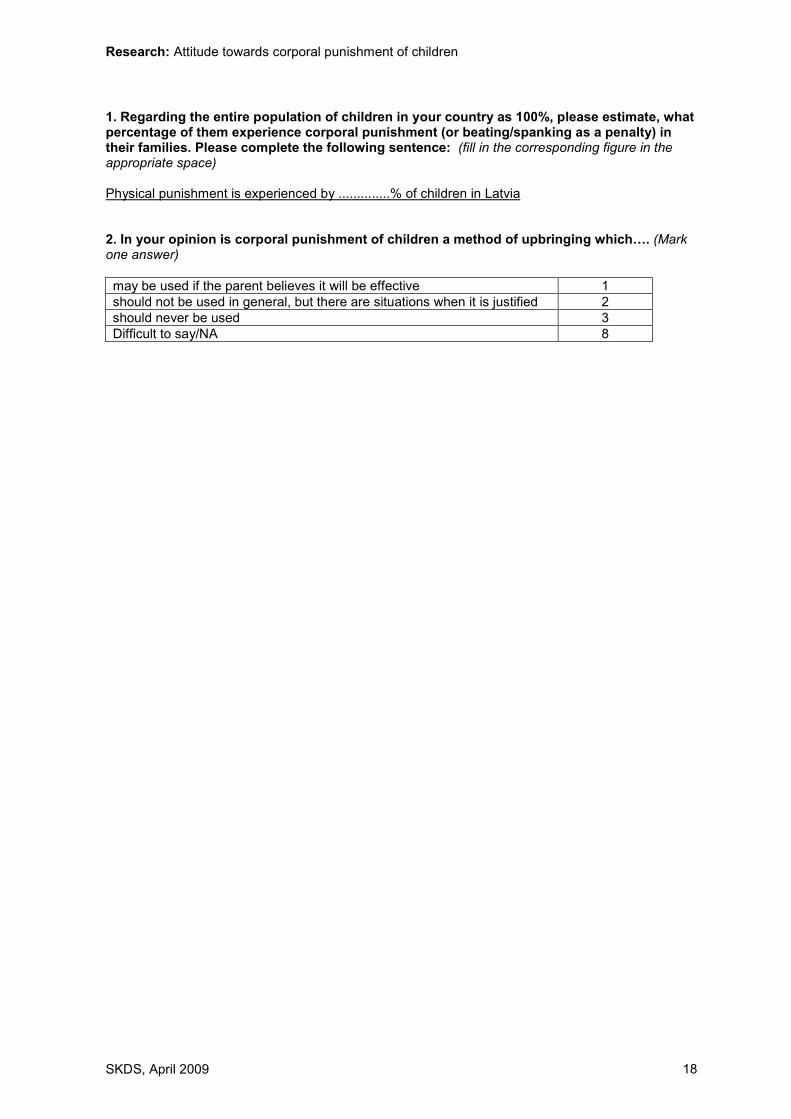
1. Regarding the entire population of children in your country as 100%, please estimate, what percentage of them experience corporal punishment (or beating/spanking as a penalty) in their families. Please complete the following sentence: (fill in the corresponding figure in the appropriate space) Physical punishment is experienced by ..............% of children in Latvia 2. In your opinion is corporal punishment of children a method of upbringing which…. (Mark one answer)
may be used if the parent believes it will be effective 1
should not be used in general, but there are situations when it is justified 2
should never be used 3
Difficult to say/NA 8

SKDS
marketing and public opinion research centre
Baznicas str. 32-2, Riga, Latvia, LV-1010
Phone: +371 7 312 876, Fax: +371 7 312 874
E-mail: [email protected]
www.skds.lv


