48
Attitudes Toward Recycling: A survey of residents of Sheridan, WY December 2012 #122250 Lori Weigel Partner
Attitudes Toward Recycling: A survey of residents of Sheridan, WY
December 2012
#122250
Lori Weigel Partner
2 Sheridan, Wyoming Survey – December 2012
• Public Opinion Strategies conducted a survey of 250 residents of the city of Sheridan, Wyoming.
• Interviews conducted December 1-6, 2012.
• This survey has a margin of error of + 6.20%. Margin of error for sub-groups varies with population size.
• Interviews distributed proportionally throughout Sheridan and are demographically representative of the stable populace.
• 80% of interviews were conducted on traditional land lines with the other 20% conducted on cell phones.
Key Findings
4 Sheridan, Wyoming Survey – December 2012
• The vast majority of Sheridan residents say they recycle at least some of their waste, with women and older residents most likely to take these actions. That said, many report knowing other people who do not participate in recycling and most say they do not recycle all that they could.
• The majority feel recycling is an important personal action – one
that they view as important to reduce waste and help the earth. Plastic and newspaper are most commonly cited types of materials to recycle.
• Residents give the recycling program high marks and say it is easy to
use. If anything, they would like additional information on exactly what they can recycle, as even recyclers say they get confused.
5 Sheridan, Wyoming Survey – December 2012
• There is broad willingness to pay in concept for recycling pick-up among the majority of residents, especially at lower amounts around $3 per month. It is worth noting though that the minority of residents who do not recycle are less inclined to support some sort of fee, and a minority can often be disproportionately vocal at times.
• There is not significant willingness to pay for green waste/composting at this time.
Reported Recycling Behavior
7 Sheridan, Wyoming Survey – December 2012
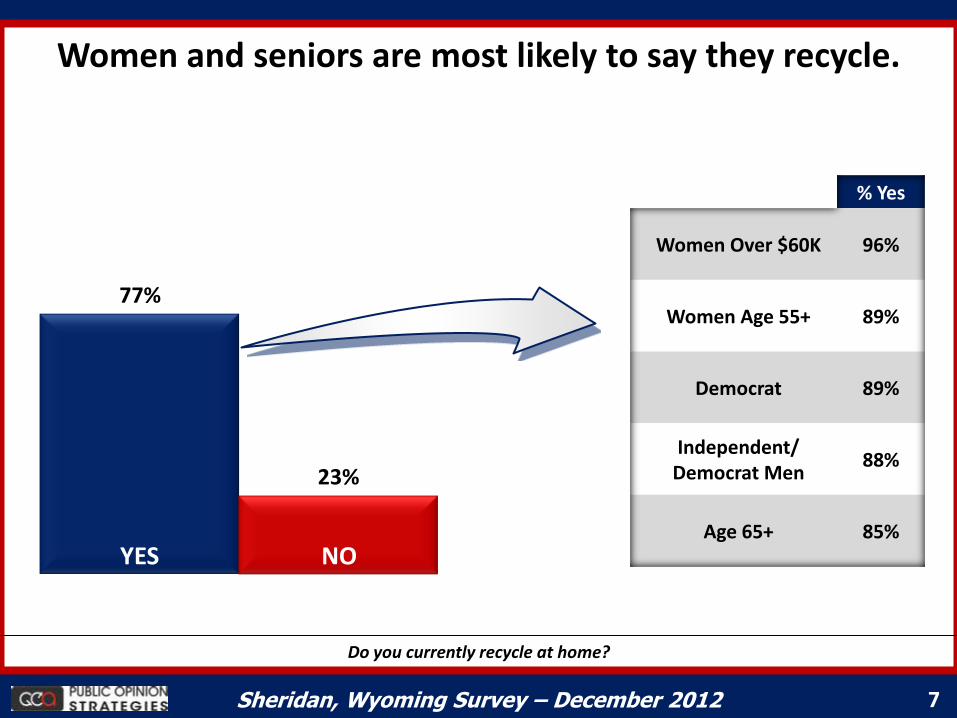
Women and seniors are most likely to say they recycle.
Do you currently recycle at home?
% Yes
Women Over $60K 96%
Women Age 55+ 89%
Democrat 89%
Independent/ Democrat Men
88%
Age 65+ 85%
77%
23%
YES NO
8 Sheridan, Wyoming Survey – December 2012
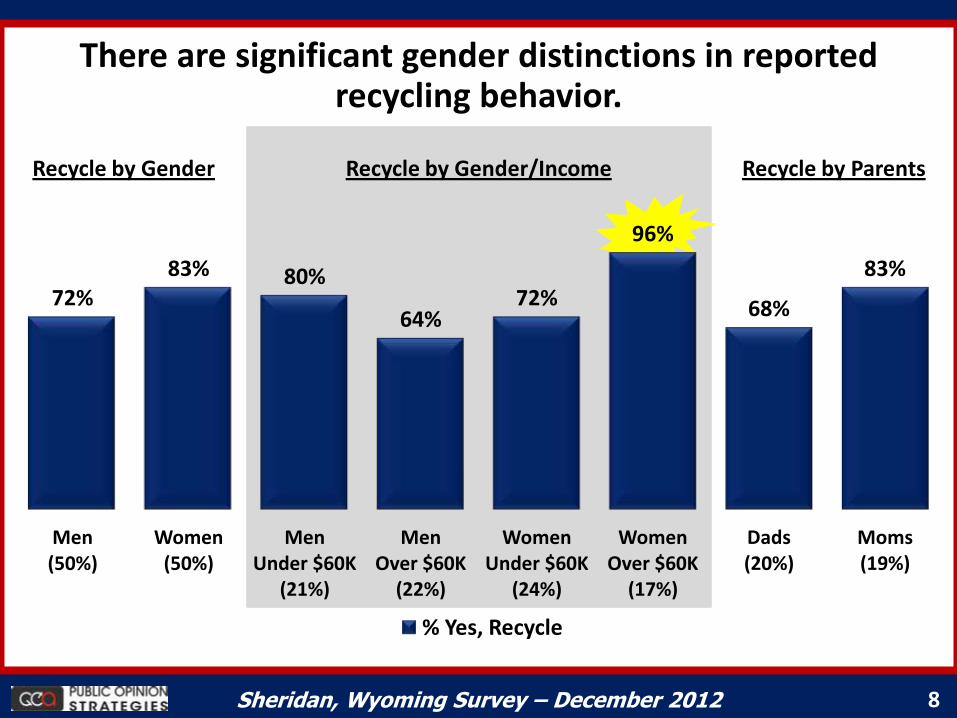
72% 83% 80%
64% 72%
96%
68%
83%
Men (50%)
Women (50%)
Men Under $60K
(21%)
Men Over $60K
(22%)
Women Under $60K
(24%)
Women Over $60K
(17%)
Dads (20%)
Moms (19%)
% Yes, Recycle
There are significant gender distinctions in reported recycling behavior.
Recycle by Gender Recycle by Gender/Income Recycle by Parents
9 Sheridan, Wyoming Survey – December 2012
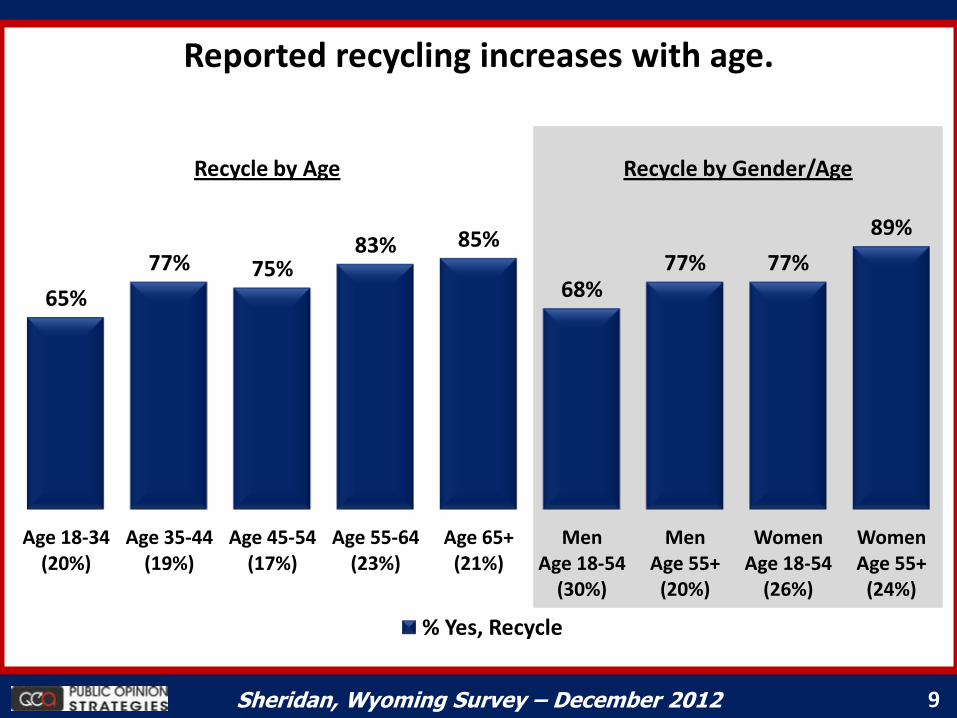
Reported recycling increases with age.
Recycle by Age
65%
77% 75% 83% 85%
68% 77% 77%
89%
Age 18-34 (20%)
Age 35-44 (19%)
Age 45-54 (17%)
Age 55-64 (23%)
Age 65+ (21%)
Men Age 18-54
(30%)
Men Age 55+
(20%)
Women Age 18-54
(26%)
Women Age 55+
(24%)
% Yes, Recycle
Recycle by Gender/Age
10 Sheridan, Wyoming Survey – December 2012
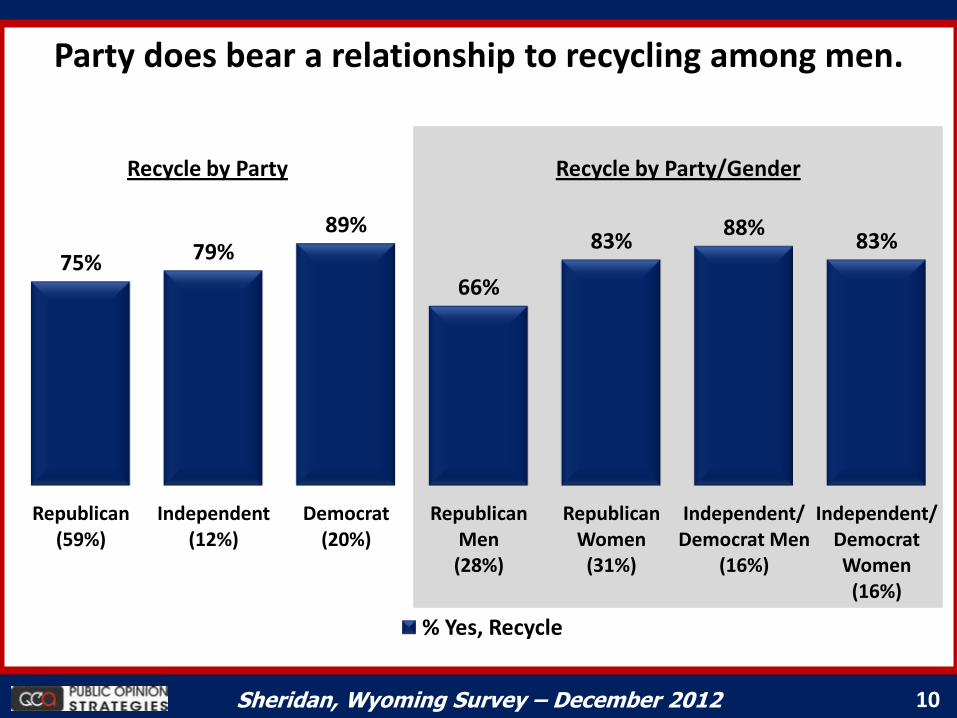
Party does bear a relationship to recycling among men.
Recycle by Party
75% 79% 89%
66%
83% 88%
83%
Republican (59%)
Independent (12%)
Democrat (20%)
Republican Men (28%)
Republican Women
(31%)
Independent/ Democrat Men
(16%)
Independent/ Democrat Women
(16%)
% Yes, Recycle
Recycle by Party/Gender
11 Sheridan, Wyoming Survey – December 2012
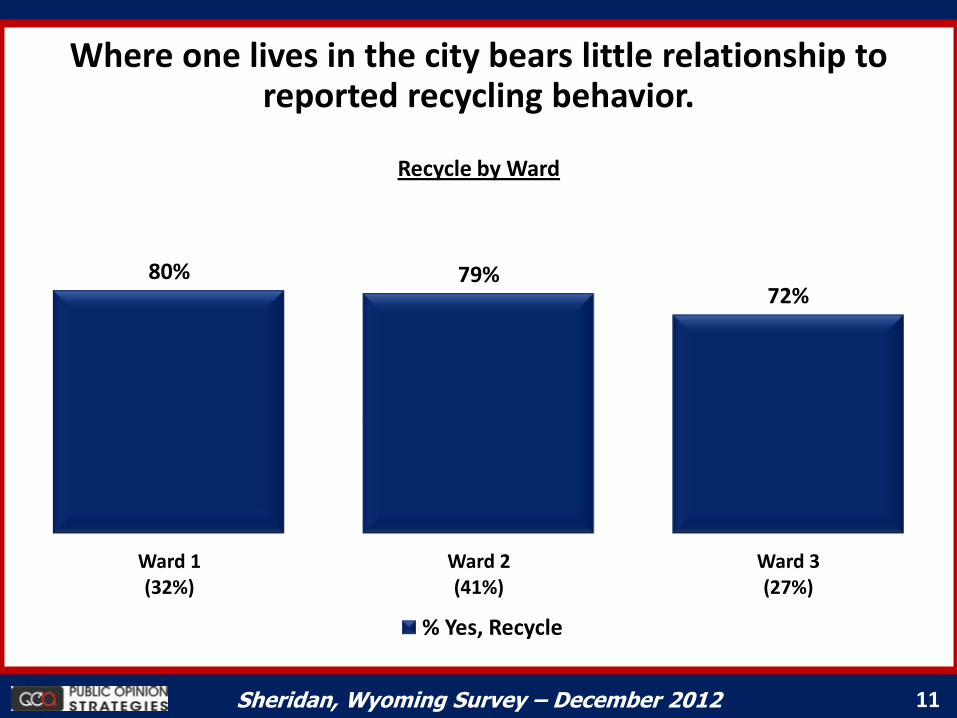
Where one lives in the city bears little relationship to reported recycling behavior.
Recycle by Ward
80% 79% 72%
Ward 1 (32%)
Ward 2 (41%)
Ward 3 (27%)
% Yes, Recycle
12 Sheridan, Wyoming Survey – December 2012
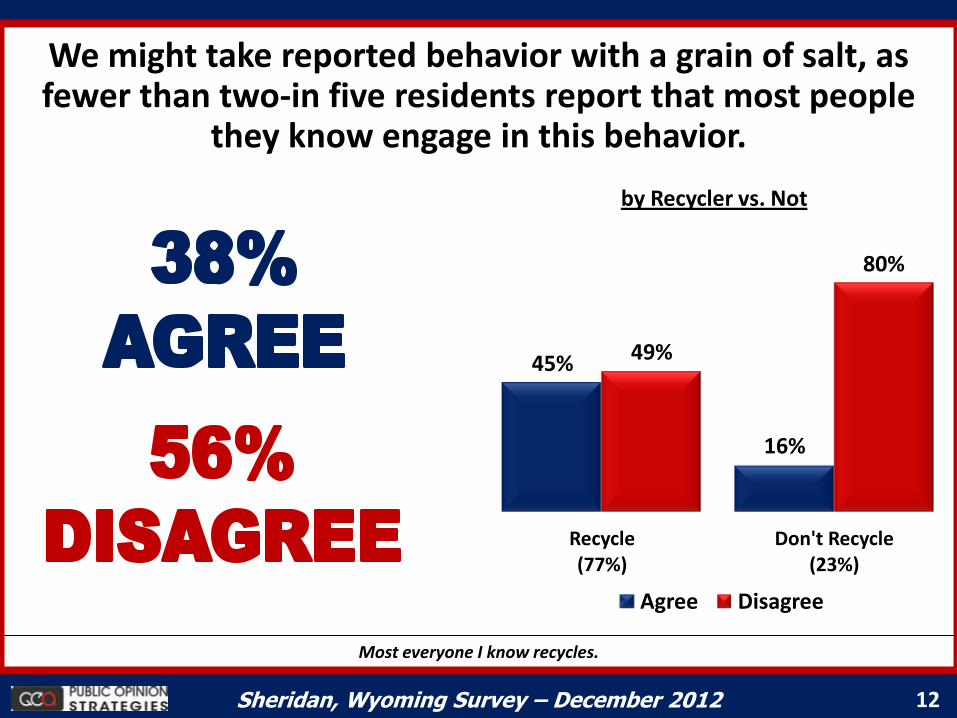
We might take reported behavior with a grain of salt, as fewer than two-in five residents report that most people
they know engage in this behavior.
45%
16%
49%
80%
Recycle (77%)
Don't Recycle (23%)
Agree Disagree
by Recycler vs. Not
Most everyone I know recycles.
13 Sheridan, Wyoming Survey – December 2012
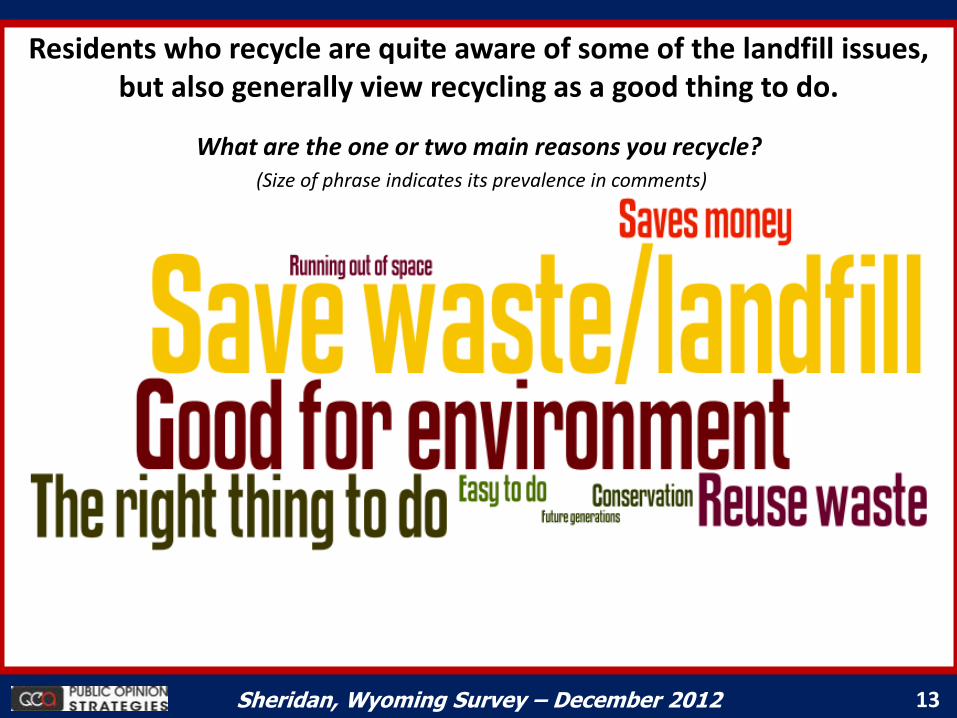
Residents who recycle are quite aware of some of the landfill issues, but also generally view recycling as a good thing to do.
What are the one or two main reasons you recycle? (Size of phrase indicates its prevalence in comments)
14 Sheridan, Wyoming Survey – December 2012
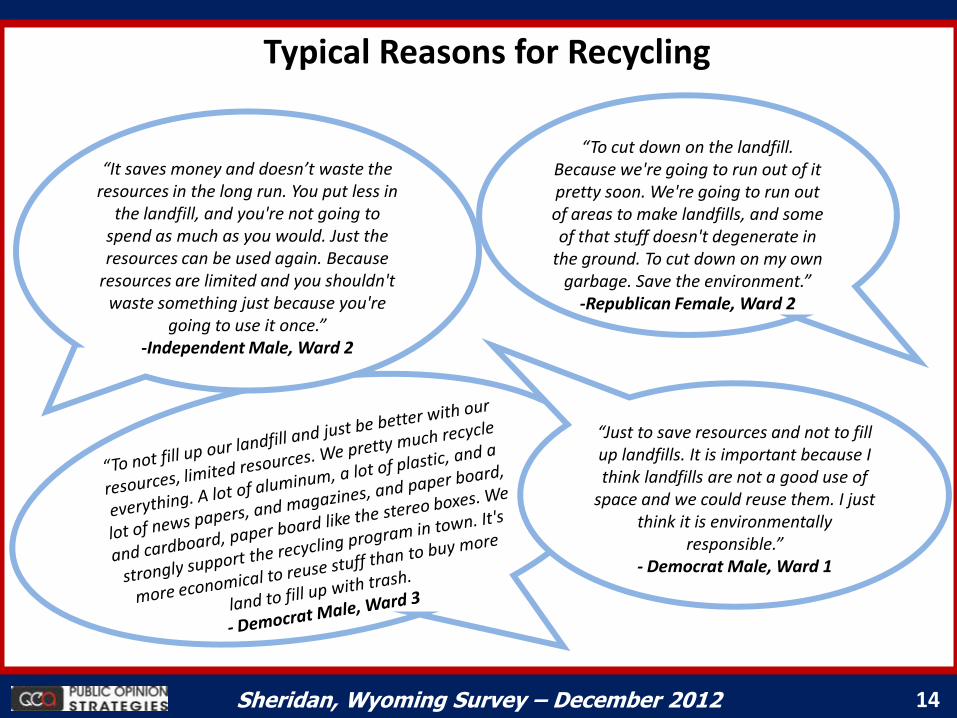
Typical Reasons for Recycling
“To cut down on the landfill. Because we're going to run out of it pretty soon. We're going to run out of areas to make landfills, and some of that stuff doesn't degenerate in
the ground. To cut down on my own garbage. Save the environment.”
-Republican Female, Ward 2
“It saves money and doesn’t waste the resources in the long run. You put less in
the landfill, and you're not going to spend as much as you would. Just the resources can be used again. Because
resources are limited and you shouldn't waste something just because you're
going to use it once.” -Independent Male, Ward 2
“Just to save resources and not to fill up landfills. It is important because I think landfills are not a good use of
space and we could reuse them. I just think it is environmentally
responsible.” - Democrat Male, Ward 1
15 Sheridan, Wyoming Survey – December 2012
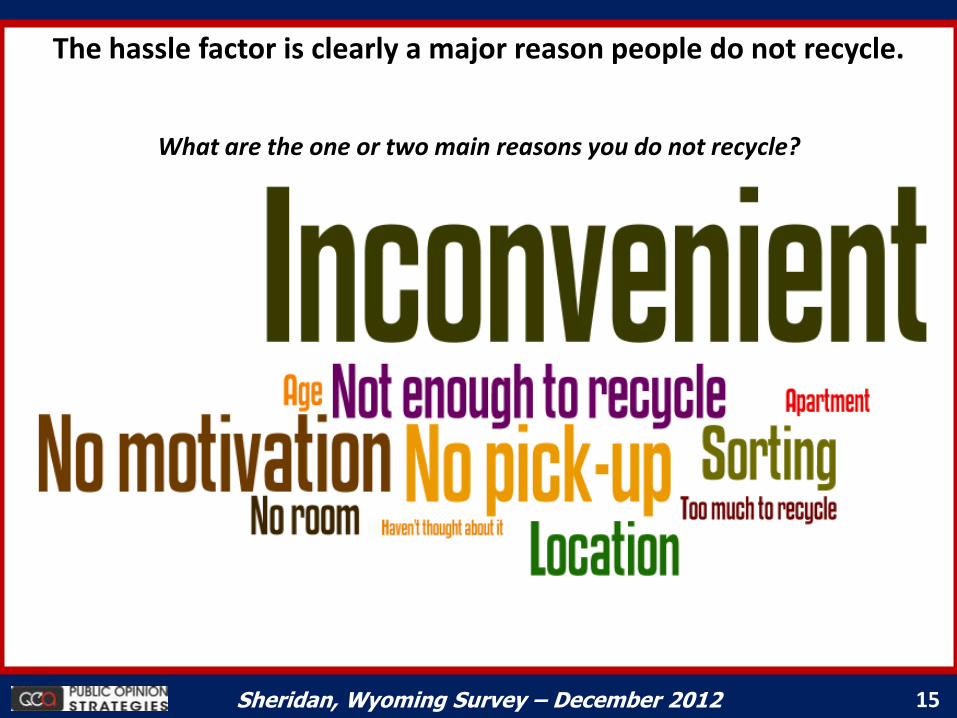
The hassle factor is clearly a major reason people do not recycle.
What are the one or two main reasons you do not recycle? (Size of phrase indicates its prevalence in comments)
16 Sheridan, Wyoming Survey – December 2012
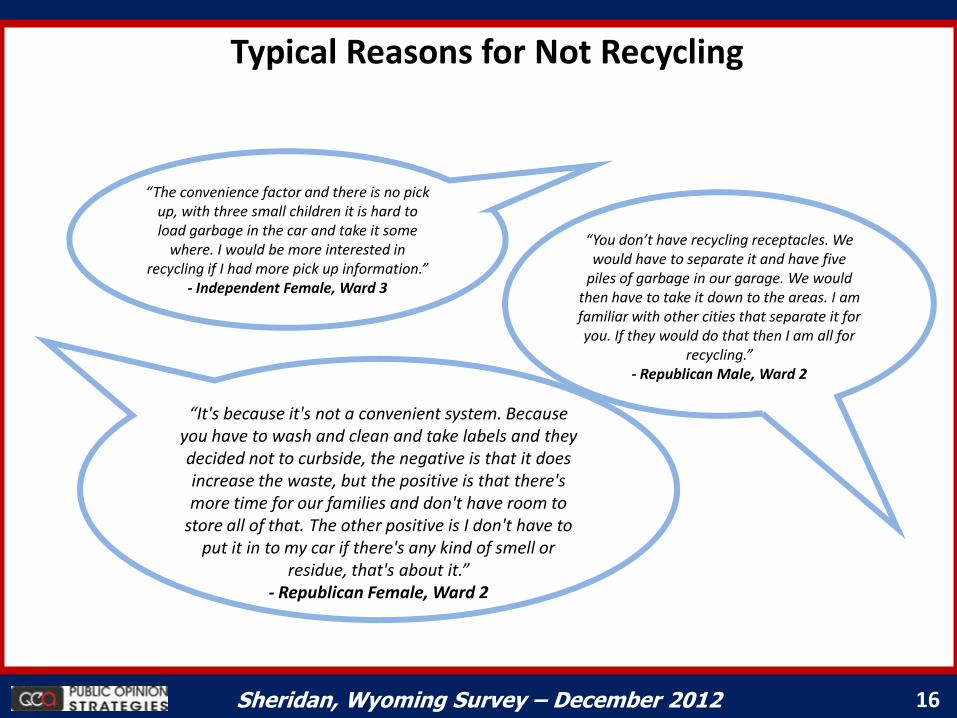
Typical Reasons for Not Recycling
“The convenience factor and there is no pick up, with three small children it is hard to load garbage in the car and take it some
where. I would be more interested in recycling if I had more pick up information.”
- Independent Female, Ward 3
“It's because it's not a convenient system. Because you have to wash and clean and take labels and they decided not to curbside, the negative is that it does increase the waste, but the positive is that there's more time for our families and don't have room to
store all of that. The other positive is I don't have to put it in to my car if there's any kind of smell or
residue, that's about it.” - Republican Female, Ward 2
“You don’t have recycling receptacles. We would have to separate it and have five
piles of garbage in our garage. We would then have to take it down to the areas. I am familiar with other cities that separate it for you. If they would do that then I am all for
recycling.” - Republican Male, Ward 2
17 Sheridan, Wyoming Survey – December 2012
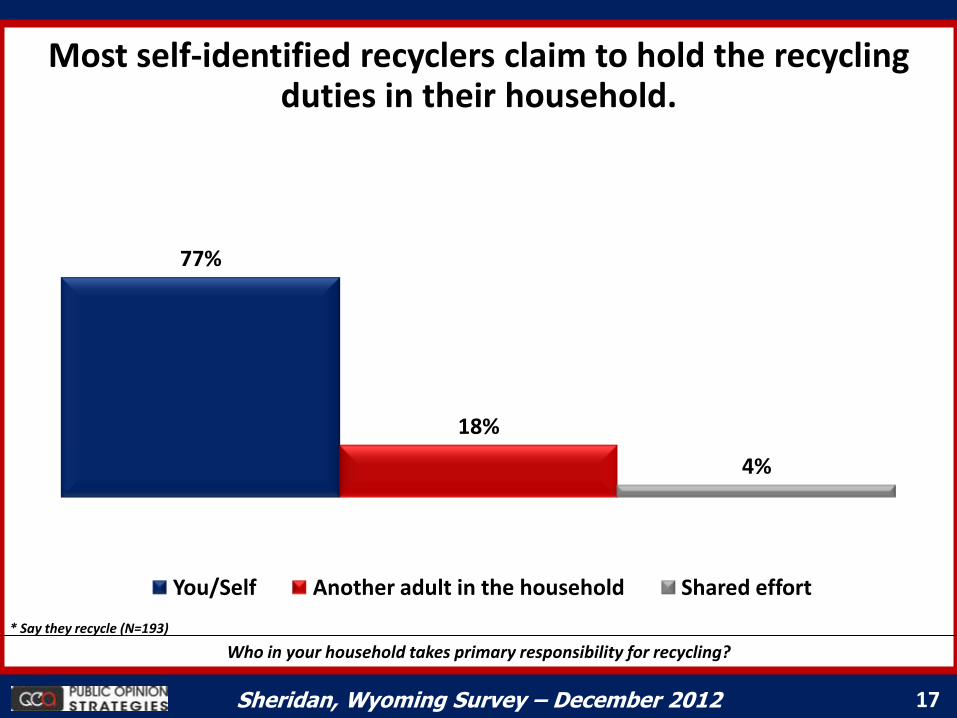
Most self-identified recyclers claim to hold the recycling duties in their household.
77%
18%
4%
You/Self Another adult in the household Shared effort
Who in your household takes primary responsibility for recycling?
* Say they recycle (N=193)

18 Sheridan, Wyoming Survey – December 2012
But a majority or recyclers only engage in the activity occasionally.
1%
31% 29% 26%
13%
Daily Weekly Every other week Monthly Every few months
How often do you currently deliver your recycling to drop sites?
* Say they recycle (N=193)
Frequently 31%
Occasionally 55%
Rarely 13%
19 Sheridan, Wyoming Survey – December 2012
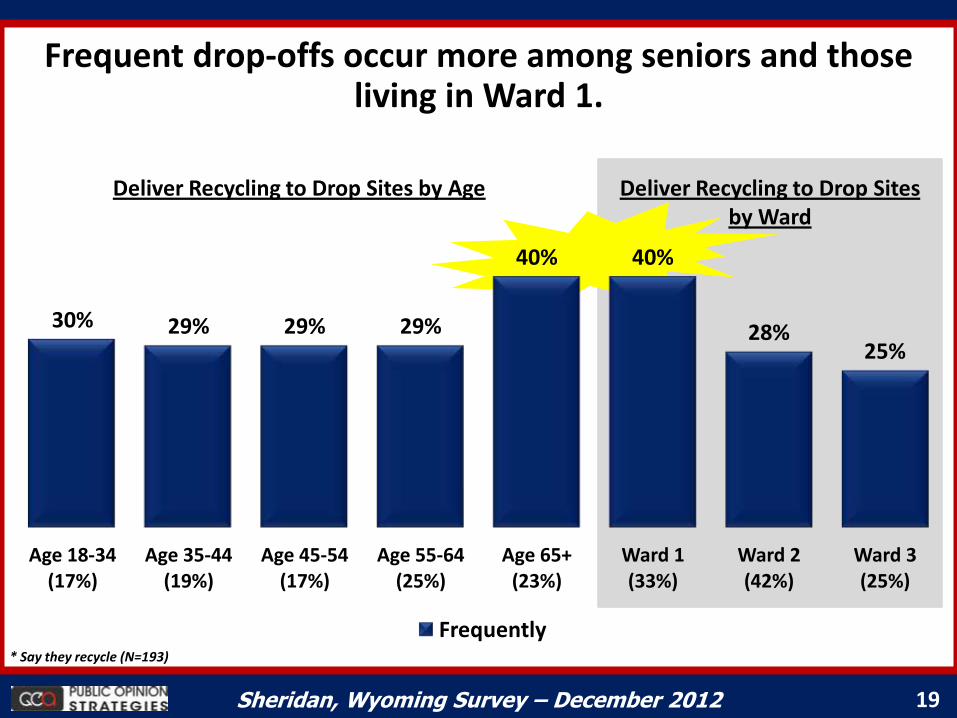
Deliver Recycling to Drop Sites by Age Deliver Recycling to Drop Sites by Ward
Frequent drop-offs occur more among seniors and those living in Ward 1.
30% 29% 29% 29%
40% 40%
28% 25%
Age 18-34 (17%)
Age 35-44 (19%)
Age 45-54 (17%)
Age 55-64 (25%)
Age 65+ (23%)
Ward 1 (33%)
Ward 2 (42%)
Ward 3 (25%)
Frequently * Say they recycle (N=193)
20 Sheridan, Wyoming Survey – December 2012
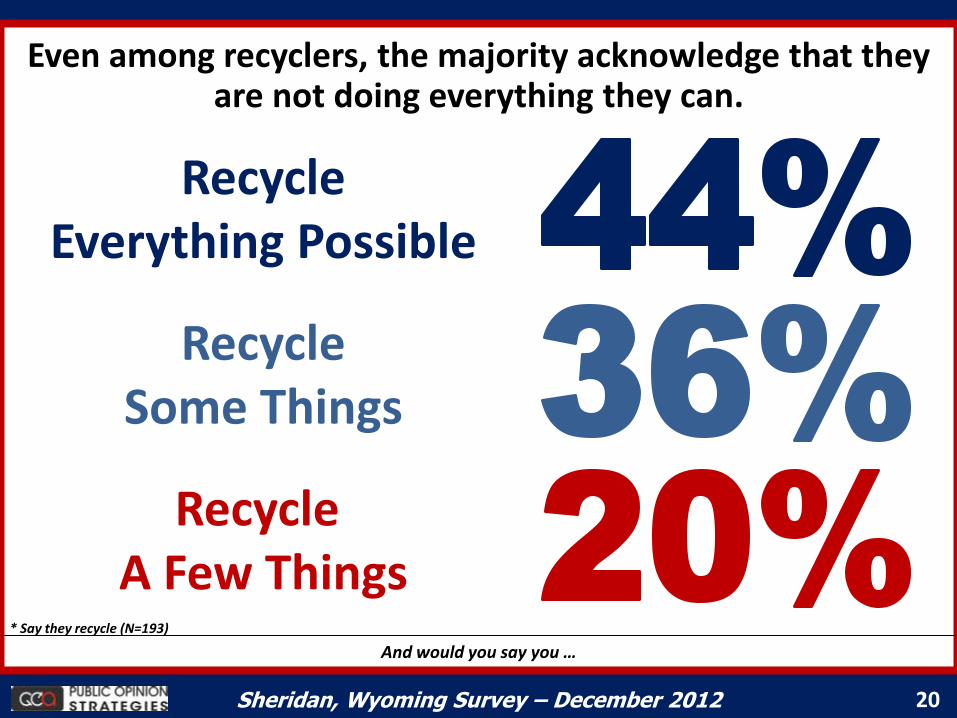
Even among recyclers, the majority acknowledge that they are not doing everything they can.
And would you say you …
Recycle Some Things
Recycle Everything Possible
Recycle A Few Things
* Say they recycle (N=193)
21 Sheridan, Wyoming Survey – December 2012
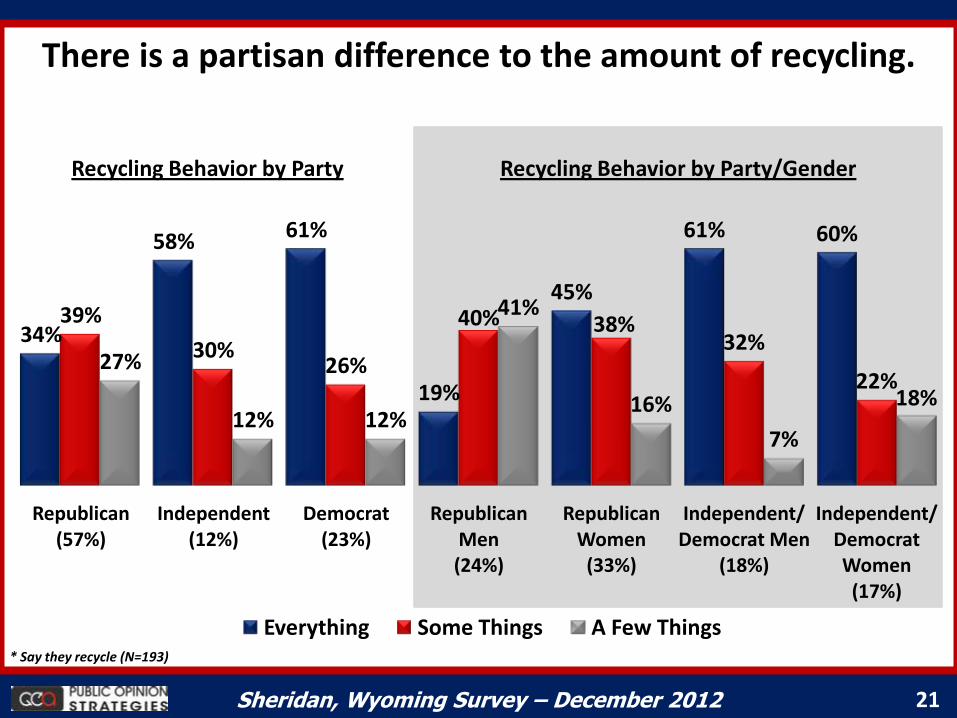
There is a partisan difference to the amount of recycling.
Recycling Behavior by Party
34%
58% 61%
19%
45%
61% 60%
39%
30% 26%
40% 38% 32%
22% 27%
12% 12%
41%
16%
7%
18%
Republican (57%)
Independent (12%)
Democrat (23%)
Republican Men (24%)
Republican Women
(33%)
Independent/ Democrat Men
(18%)
Independent/ Democrat Women
(17%)
Everything Some Things A Few Things
Recycling Behavior by Party/Gender
* Say they recycle (N=193)
22 Sheridan, Wyoming Survey – December 2012
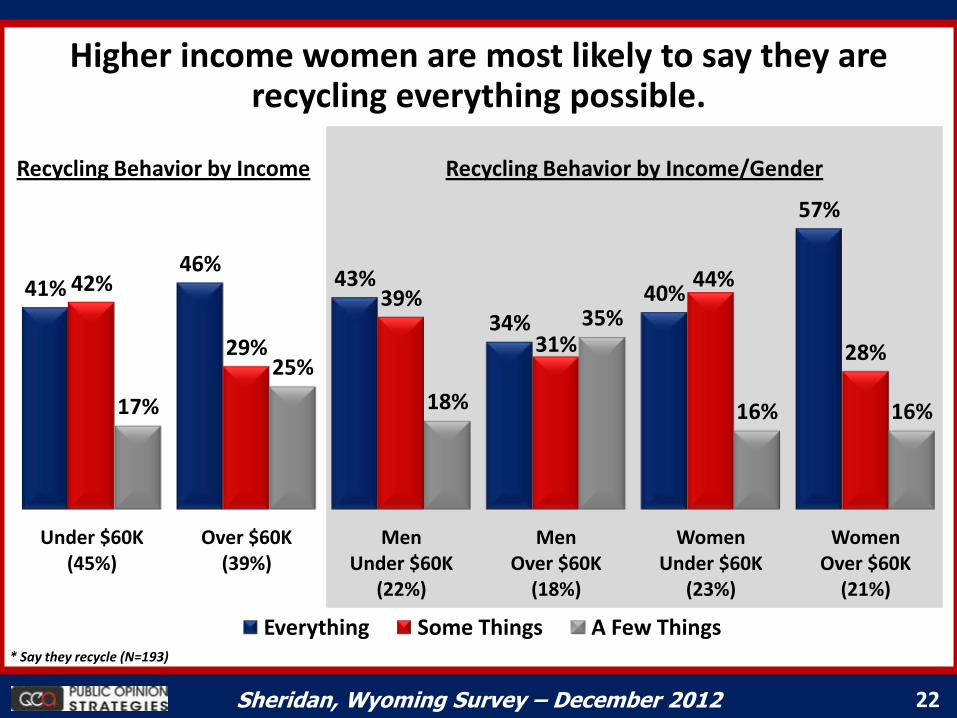
Higher income women are most likely to say they are recycling everything possible.
Recycling Behavior by Income
41% 46%
43%
34% 40%
57%
42%
29%
39%
31%
44%
28%
17%
25%
18%
35%
16% 16%
Under $60K (45%)
Over $60K (39%)
Men Under $60K
(22%)
Men Over $60K
(18%)
Women Under $60K
(23%)
Women Over $60K
(21%)
Everything Some Things A Few Things
Recycling Behavior by Income/Gender
* Say they recycle (N=193)
23 Sheridan, Wyoming Survey – December 2012
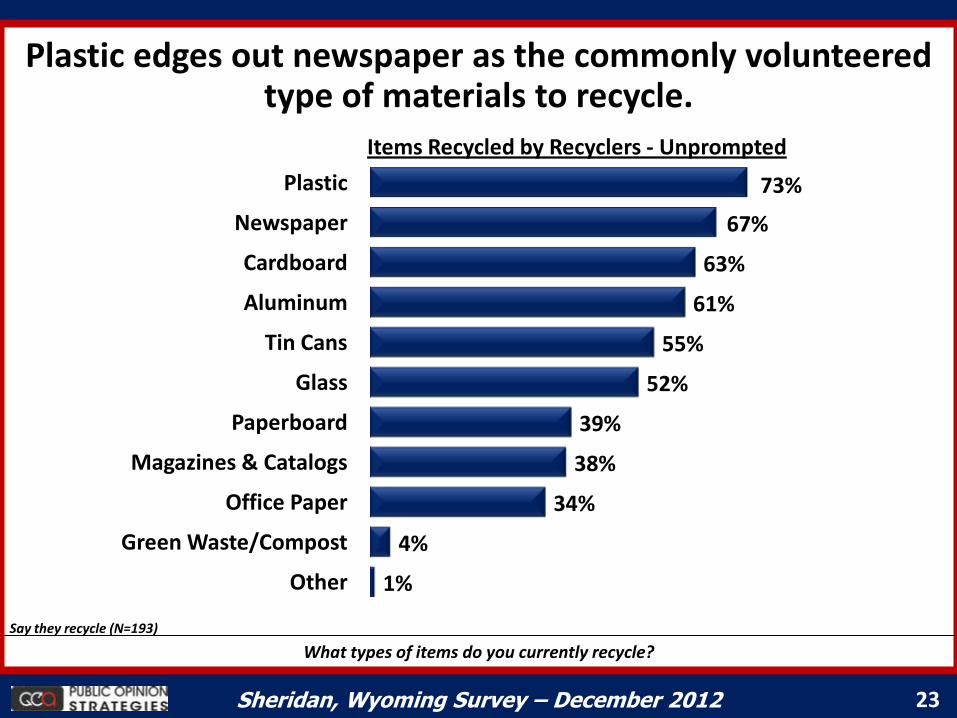
Plastic edges out newspaper as the commonly volunteered type of materials to recycle.
What types of items do you currently recycle?
Say they recycle (N=193)
73%
67%
63%
61%
55%
52%
39%
38%
34%
4%
1%
Plastic
Newspaper
Cardboard
Aluminum
Tin Cans
Glass
Paperboard
Magazines & Catalogs
Office Paper
Green Waste/Compost
Other
Items Recycled by Recyclers - Unprompted
24 Sheridan, Wyoming Survey – December 2012
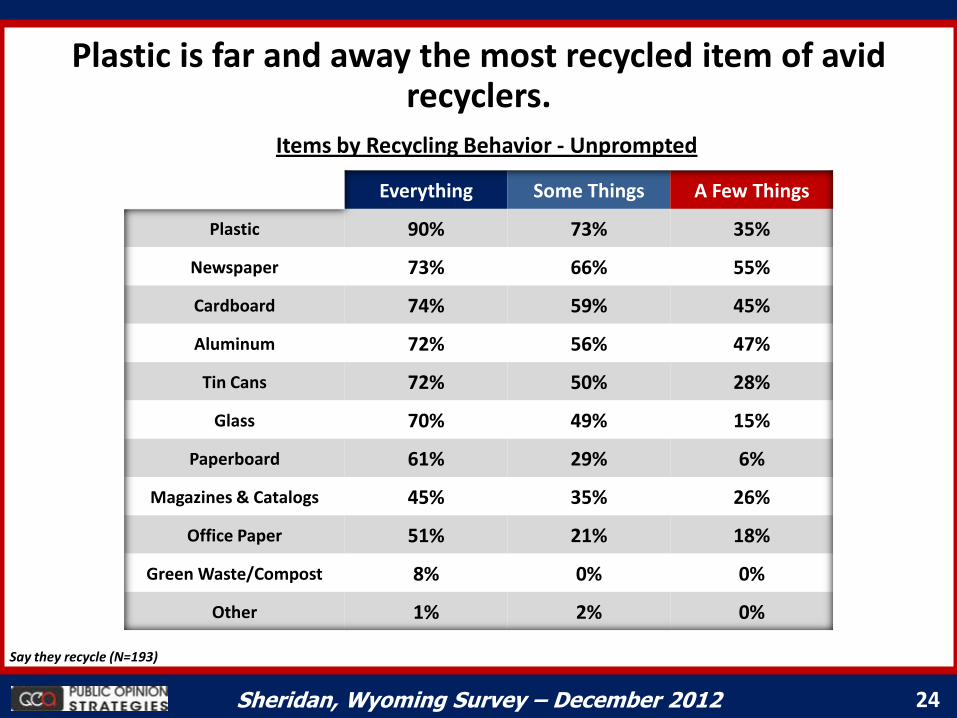
Plastic is far and away the most recycled item of avid recyclers.
Say they recycle (N=193)
Everything Some Things A Few Things
Plastic 90% 73% 35%
Newspaper 73% 66% 55%
Cardboard 74% 59% 45%
Aluminum 72% 56% 47%
Tin Cans 72% 50% 28%
Glass 70% 49% 15%
Paperboard 61% 29% 6%
Magazines & Catalogs 45% 35% 26%
Office Paper 51% 21% 18%
Green Waste/Compost 8% 0% 0%
Other 1% 2% 0%
Items by Recycling Behavior - Unprompted
25 Sheridan, Wyoming Survey – December 2012
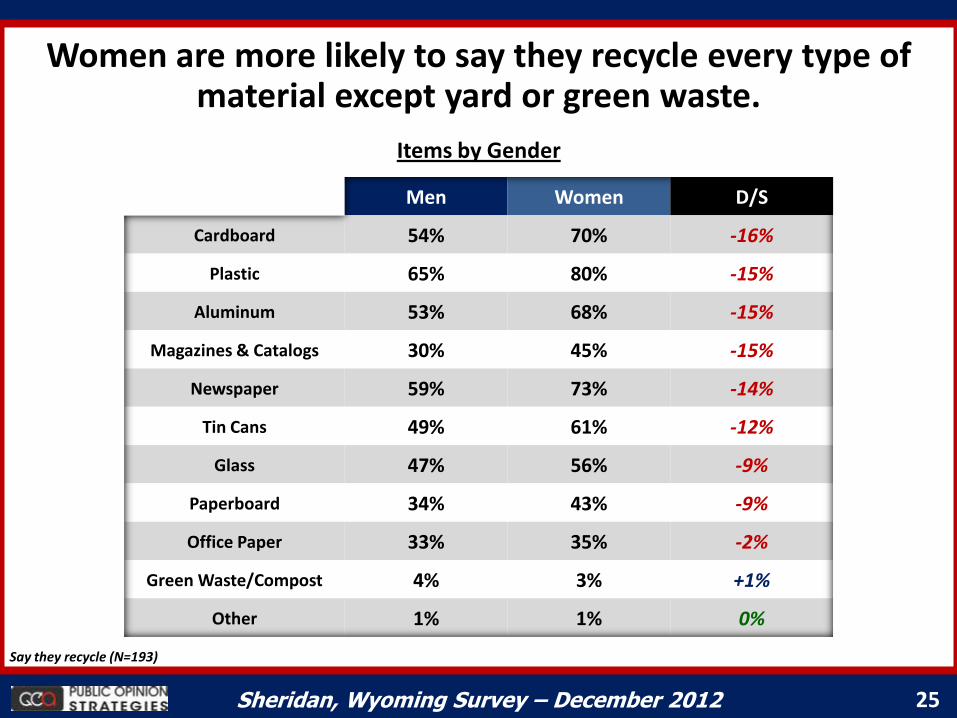
Women are more likely to say they recycle every type of material except yard or green waste.
Say they recycle (N=193)
Men Women D/S
Cardboard 54% 70% -16%
Plastic 65% 80% -15%
Aluminum 53% 68% -15%
Magazines & Catalogs 30% 45% -15%
Newspaper 59% 73% -14%
Tin Cans 49% 61% -12%
Glass 47% 56% -9%
Paperboard 34% 43% -9%
Office Paper 33% 35% -2%
Green Waste/Compost 4% 3% +1%
Other 1% 1% 0%
Items by Gender
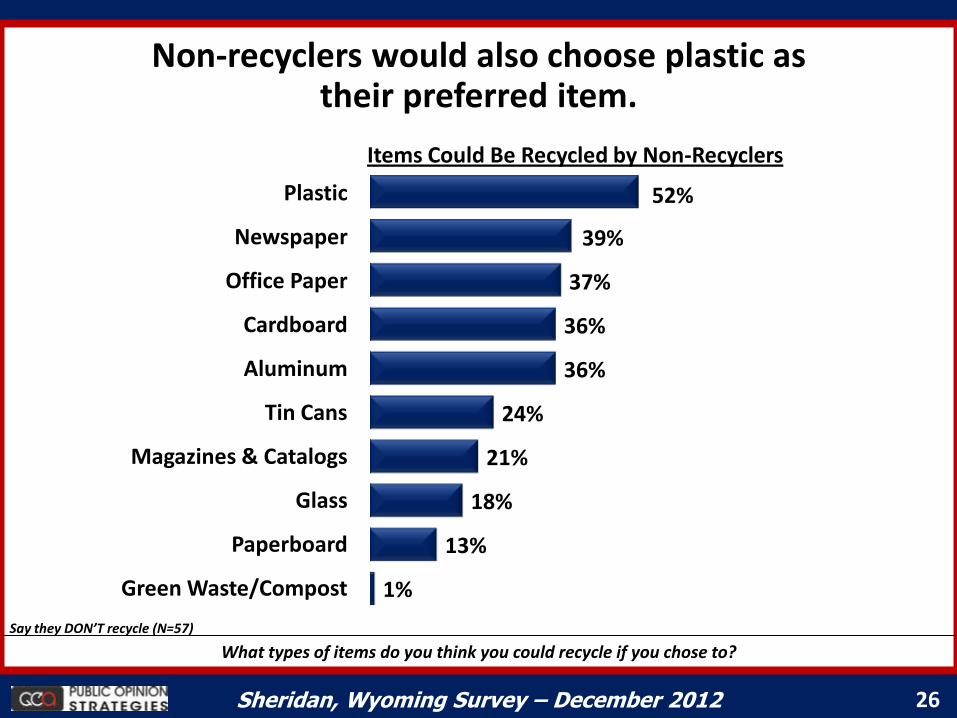
26 Sheridan, Wyoming Survey – December 2012
52%
39%
37%
36%
36%
24%
21%
18%
13%
1%
Plastic
Newspaper
Office Paper
Cardboard
Aluminum
Tin Cans
Magazines & Catalogs
Glass
Paperboard
Green Waste/Compost
Non-recyclers would also choose plastic as their preferred item.
What types of items do you think you could recycle if you chose to?
Say they DON’T recycle (N=57)
Items Could Be Recycled by Non-Recyclers

27 Sheridan, Wyoming Survey – December 2012
Those who recycle currently are most optimistic about the amount of their waste they could recycle.
How much of your household waste do you believe could be recycled today if you chose to do so?
Half or More 62%
Less Than Half 36%
Most of it 27%
Unsure 1%
Very little to none at all
13%
Less than half of it
23%
At least half of it 36%
70%
36% 29%
60%
Recycle (77%)
Don't Recycle (23%)
Half or More Less Than Half
Amount Could Be Recycled by Recycler vs. Not
Perceptions of Recycling
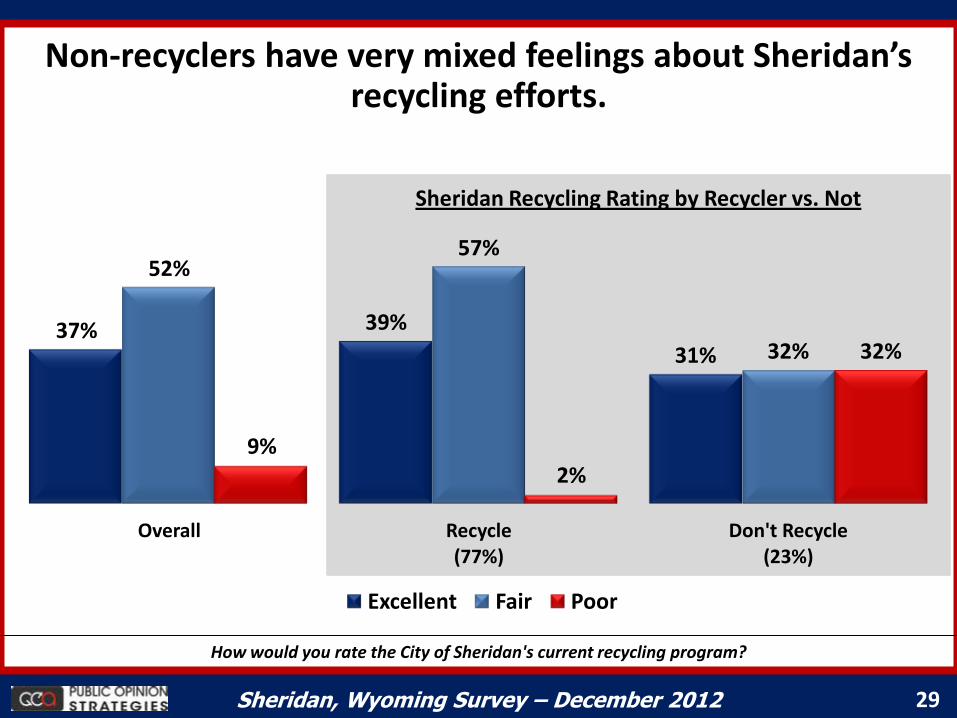
29 Sheridan, Wyoming Survey – December 2012
Non-recyclers have very mixed feelings about Sheridan’s recycling efforts.
How would you rate the City of Sheridan's current recycling program?
37% 39%
31%
52% 57%
32%
9% 2%
32%
Overall Recycle (77%)
Don't Recycle (23%)
Excellent Fair Poor
Sheridan Recycling Rating by Recycler vs. Not
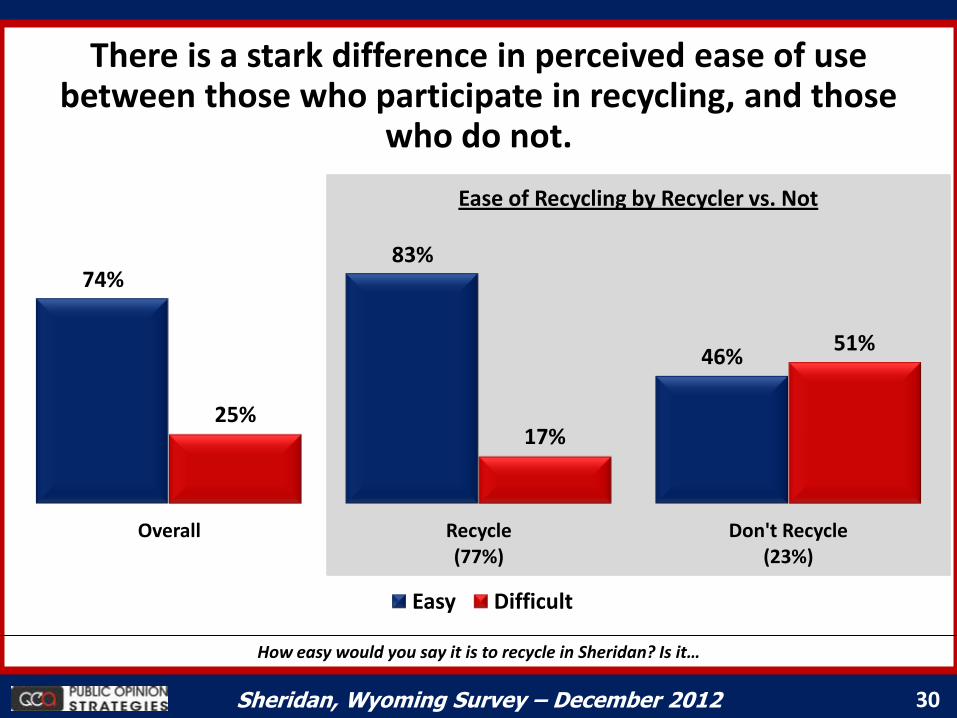
30 Sheridan, Wyoming Survey – December 2012
There is a stark difference in perceived ease of use between those who participate in recycling, and those
who do not.
How easy would you say it is to recycle in Sheridan? Is it…
74% 83%
46%
25% 17%
51%
Overall Recycle (77%)
Don't Recycle (23%)
Easy Difficult
Ease of Recycling by Recycler vs. Not
31 Sheridan, Wyoming Survey – December 2012
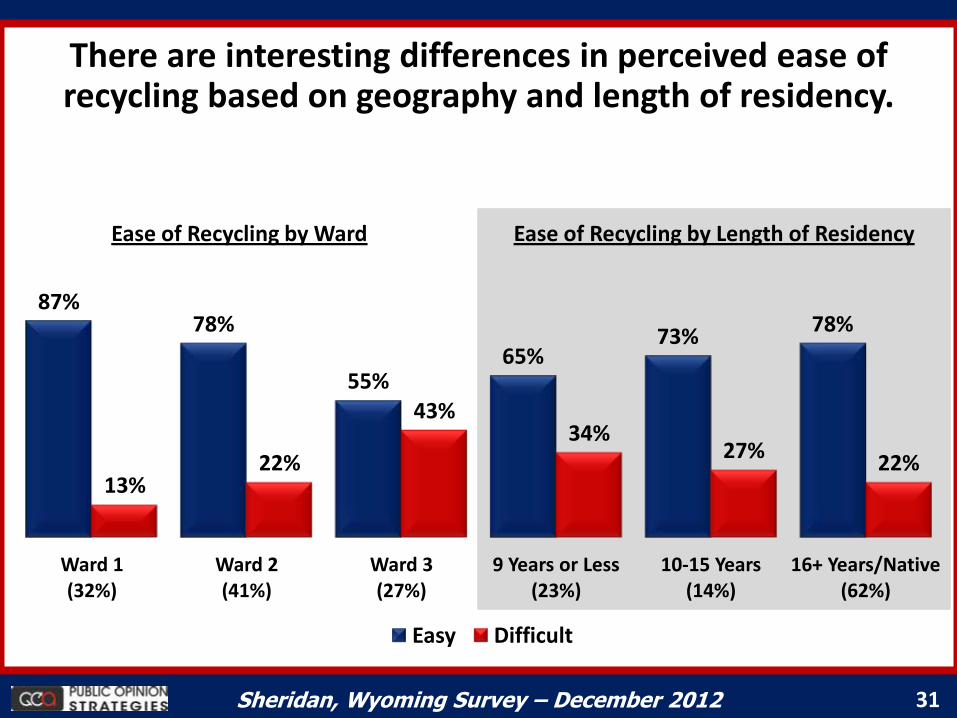
There are interesting differences in perceived ease of recycling based on geography and length of residency.
87% 78%
55% 65%
73% 78%
13% 22%
43% 34%
27% 22%
Ward 1 (32%)
Ward 2 (41%)
Ward 3 (27%)
9 Years or Less (23%)
10-15 Years (14%)
16+ Years/Native (62%)
Easy Difficult
Ease of Recycling by Length of Residency Ease of Recycling by Ward
32 Sheridan, Wyoming Survey – December 2012
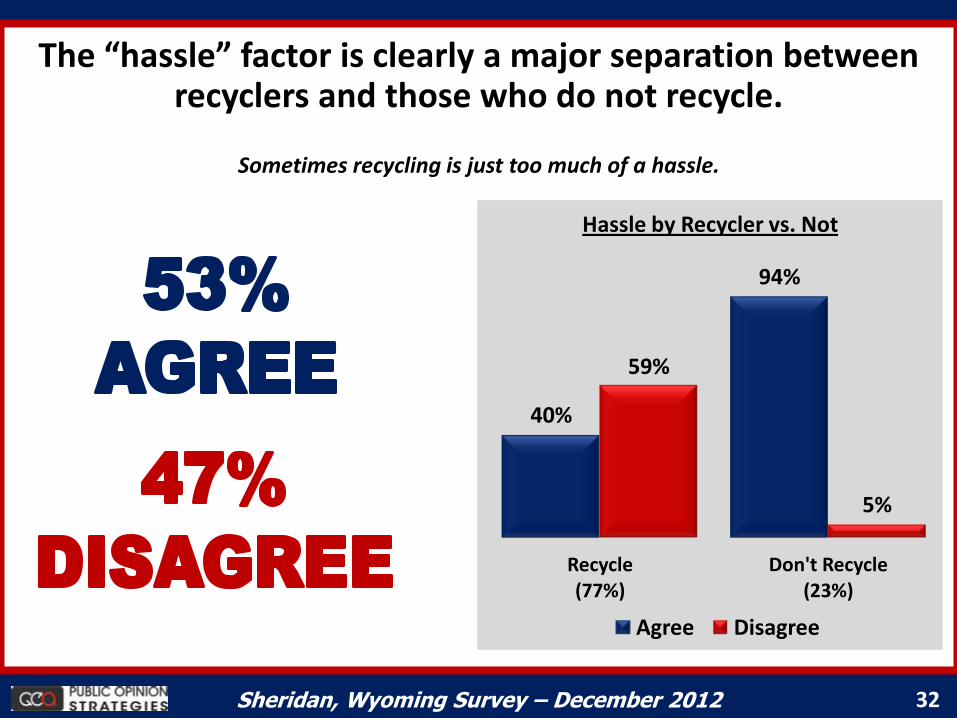
The “hassle” factor is clearly a major separation between recyclers and those who do not recycle.
Sometimes recycling is just too much of a hassle.
40%
94%
59%
5%
Recycle (77%)
Don't Recycle (23%)
Agree Disagree
Hassle by Recycler vs. Not
33 Sheridan, Wyoming Survey – December 2012
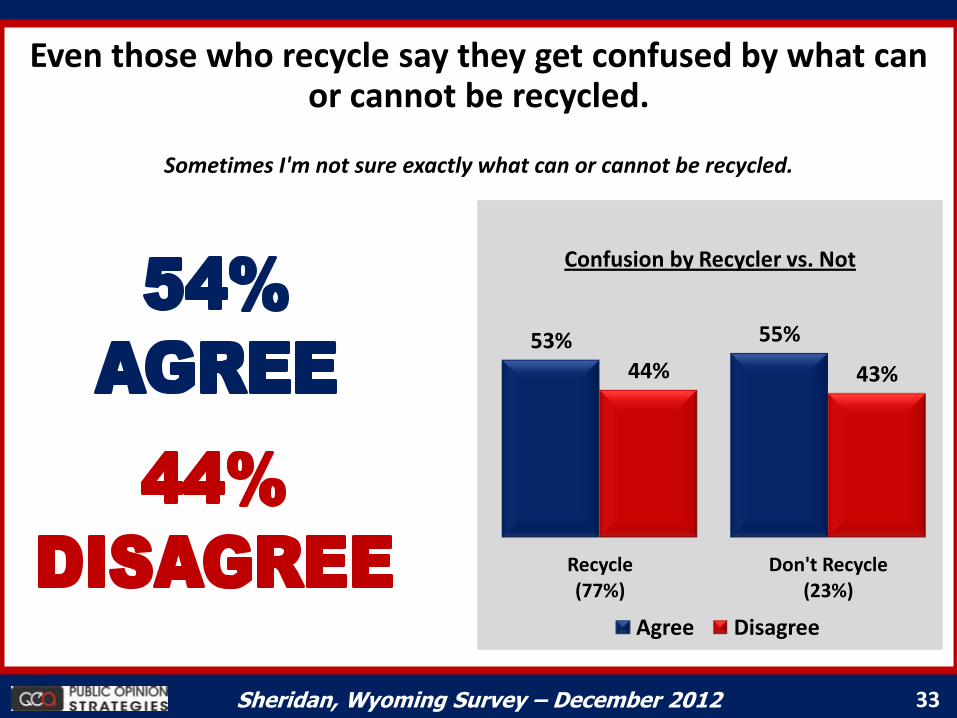
Even those who recycle say they get confused by what can or cannot be recycled.
53% 55%
44% 43%
Recycle (77%)
Don't Recycle (23%)
Agree Disagree
Confusion by Recycler vs. Not
Sometimes I'm not sure exactly what can or cannot be recycled.
34 Sheridan, Wyoming Survey – December 2012
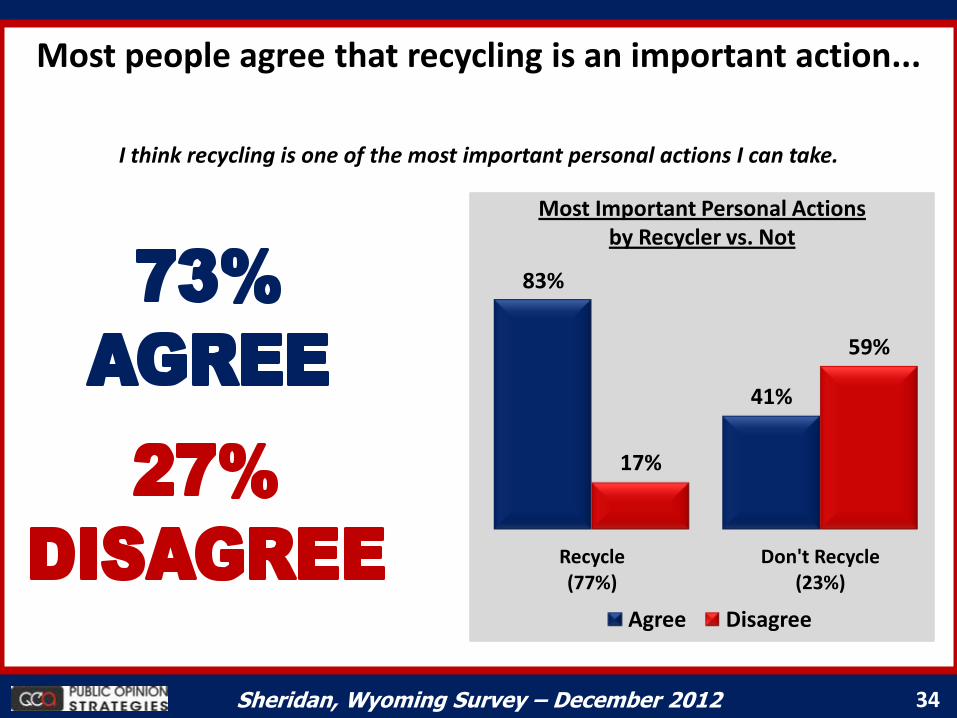
Most people agree that recycling is an important action...
83%
41%
17%
59%
Recycle (77%)
Don't Recycle (23%)
Agree Disagree
Most Important Personal Actions by Recycler vs. Not
I think recycling is one of the most important personal actions I can take.
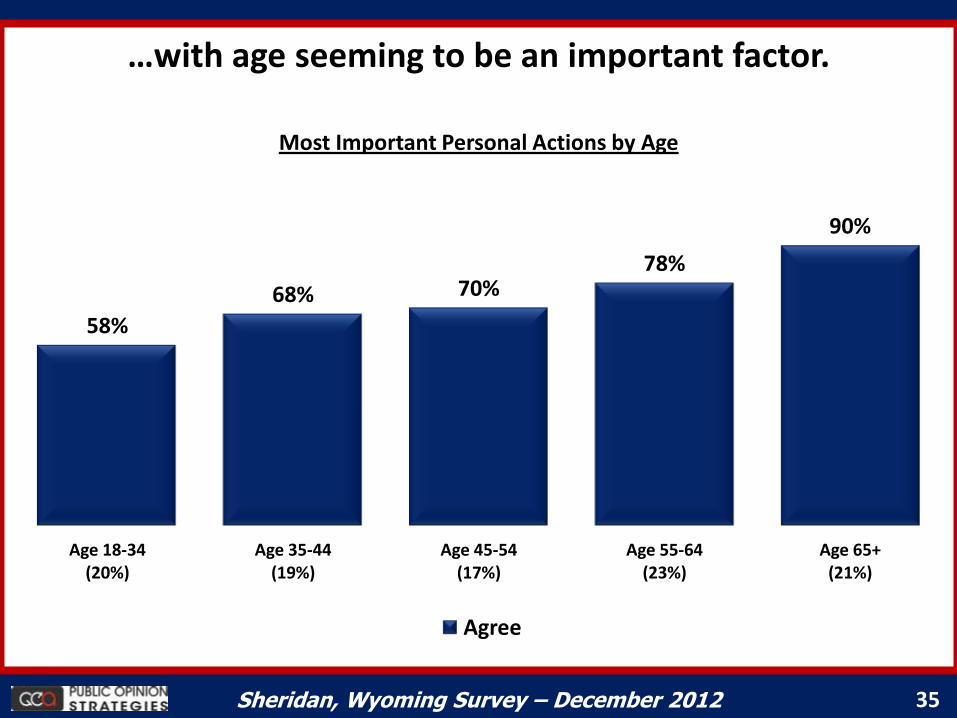
35 Sheridan, Wyoming Survey – December 2012
…with age seeming to be an important factor.
Most Important Personal Actions by Age
58%
68% 70% 78%
90%
Age 18-34 (20%)
Age 35-44 (19%)
Age 45-54 (17%)
Age 55-64 (23%)
Age 65+ (21%)
Agree
36 Sheridan, Wyoming Survey – December 2012
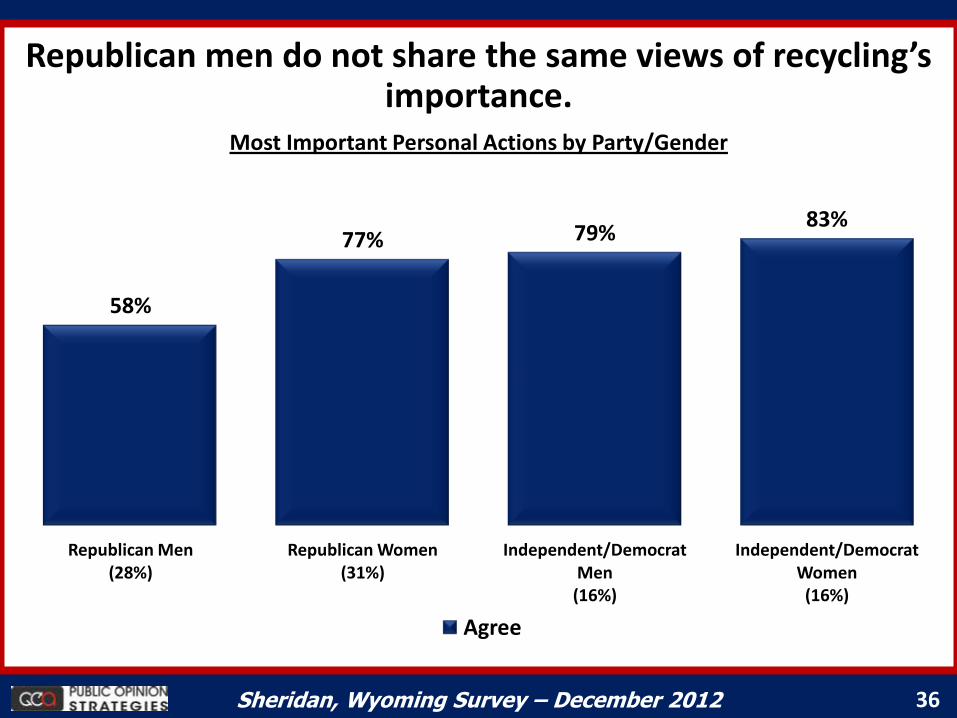
Republican men do not share the same views of recycling’s importance.
58%
77% 79% 83%
Republican Men (28%)
Republican Women (31%)
Independent/Democrat Men (16%)
Independent/Democrat Women
(16%)
Agree
Most Important Personal Actions by Party/Gender
Improving the Recycling Program
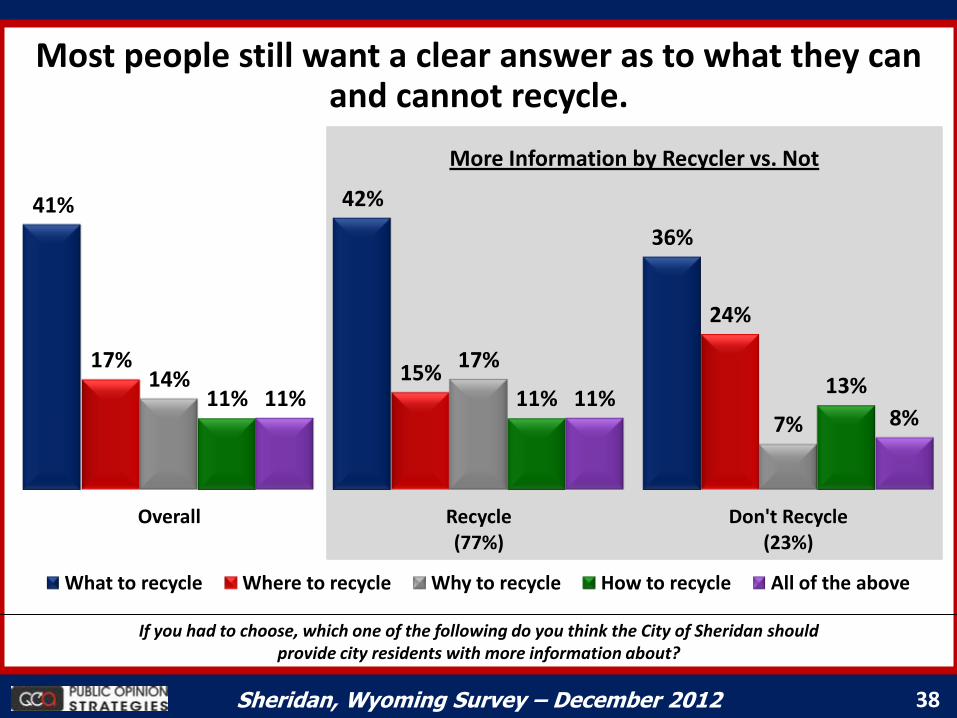
38 Sheridan, Wyoming Survey – December 2012
41% 42%
36%
17% 15%
24%
14% 17%
7% 11% 11%
13% 11% 11%
8%
Overall Recycle (77%)
Don't Recycle (23%)
What to recycle Where to recycle Why to recycle How to recycle All of the above
Most people still want a clear answer as to what they can and cannot recycle.
If you had to choose, which one of the following do you think the City of Sheridan should provide city residents with more information about?
More Information by Recycler vs. Not
39 Sheridan, Wyoming Survey – December 2012
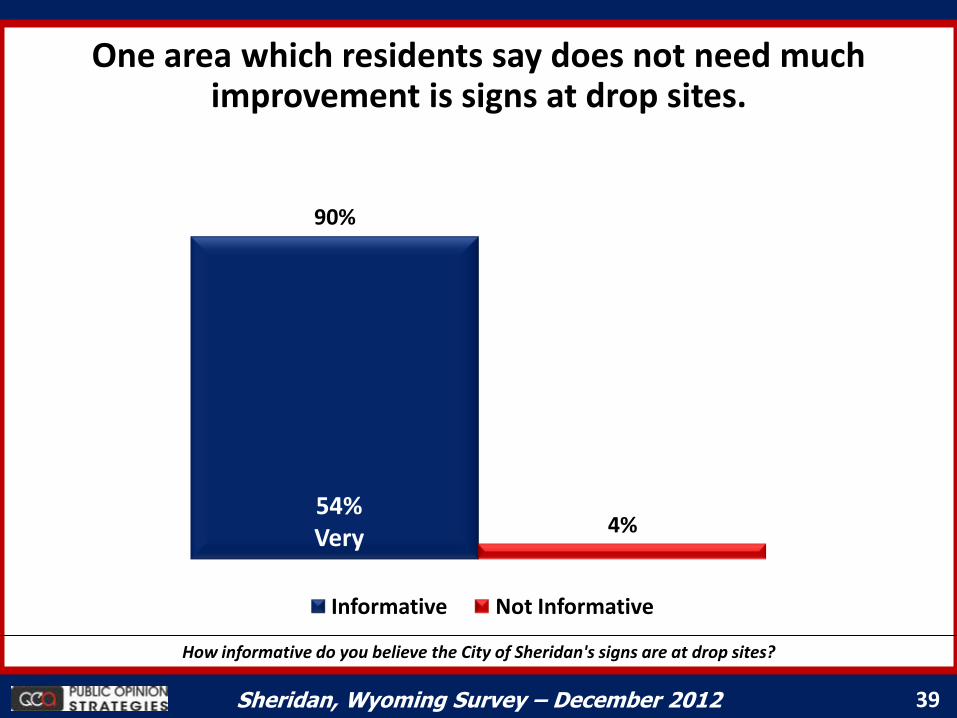
One area which residents say does not need much improvement is signs at drop sites.
90%
4%
Informative Not Informative
How informative do you believe the City of Sheridan's signs are at drop sites?
54% Very
40 Sheridan, Wyoming Survey – December 2012
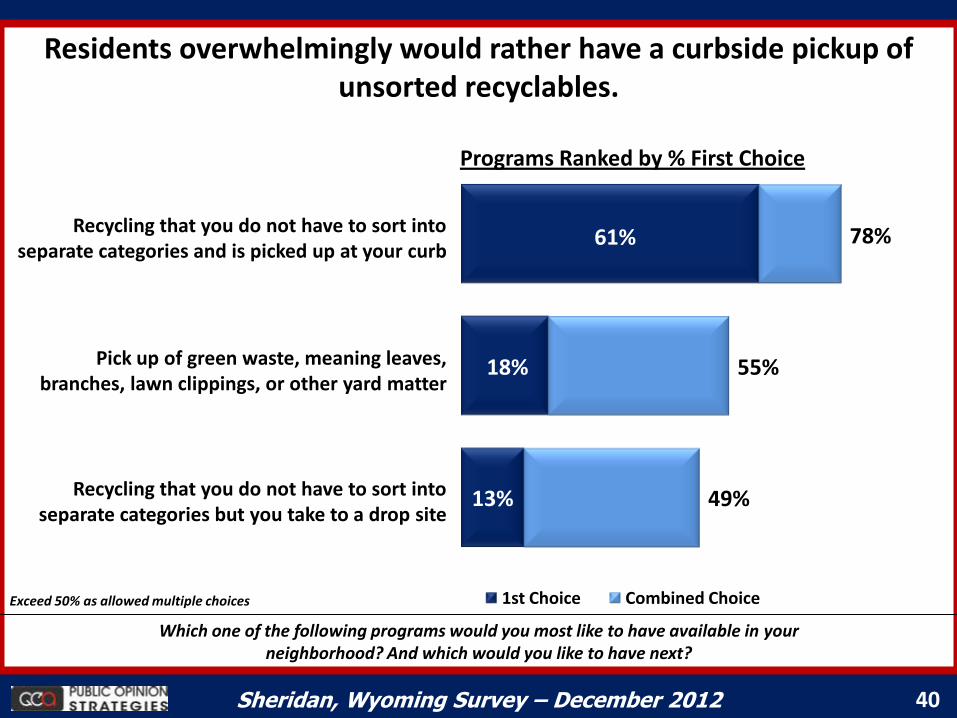
61%
18%
13%
78%
55%
49%
1st Choice Combined Choice
Which one of the following programs would you most like to have available in your neighborhood? And which would you like to have next?
Residents overwhelmingly would rather have a curbside pickup of unsorted recyclables.
Programs Ranked by % First Choice
Recycling that you do not have to sort into separate categories and is picked up at your curb
Pick up of green waste, meaning leaves, branches, lawn clippings, or other yard matter
Recycling that you do not have to sort into separate categories but you take to a drop site
Exceed 50% as allowed multiple choices
41 Sheridan, Wyoming Survey – December 2012
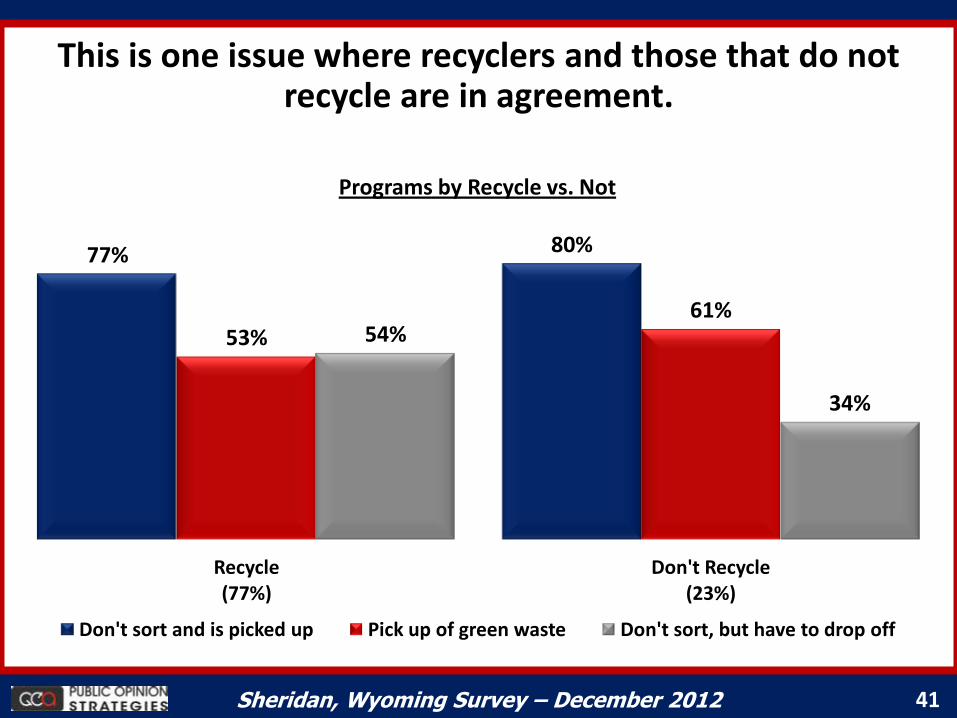
This is one issue where recyclers and those that do not recycle are in agreement.
77% 80%
53% 61%
54%
34%
Recycle (77%)
Don't Recycle (23%)
Don't sort and is picked up Pick up of green waste Don't sort, but have to drop off
Programs by Recycle vs. Not
42 Sheridan, Wyoming Survey – December 2012
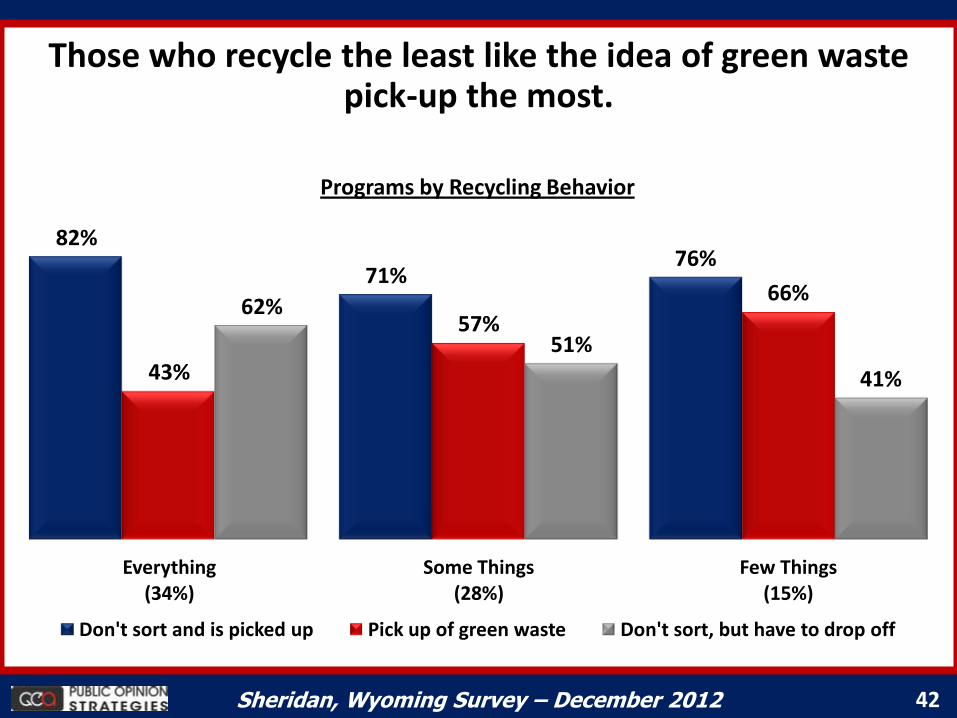
Those who recycle the least like the idea of green waste pick-up the most.
82%
71% 76%
43%
57%
66% 62%
51%
41%
Everything (34%)
Some Things (28%)
Few Things (15%)
Don't sort and is picked up Pick up of green waste Don't sort, but have to drop off
Programs by Recycling Behavior
43 Sheridan, Wyoming Survey – December 2012
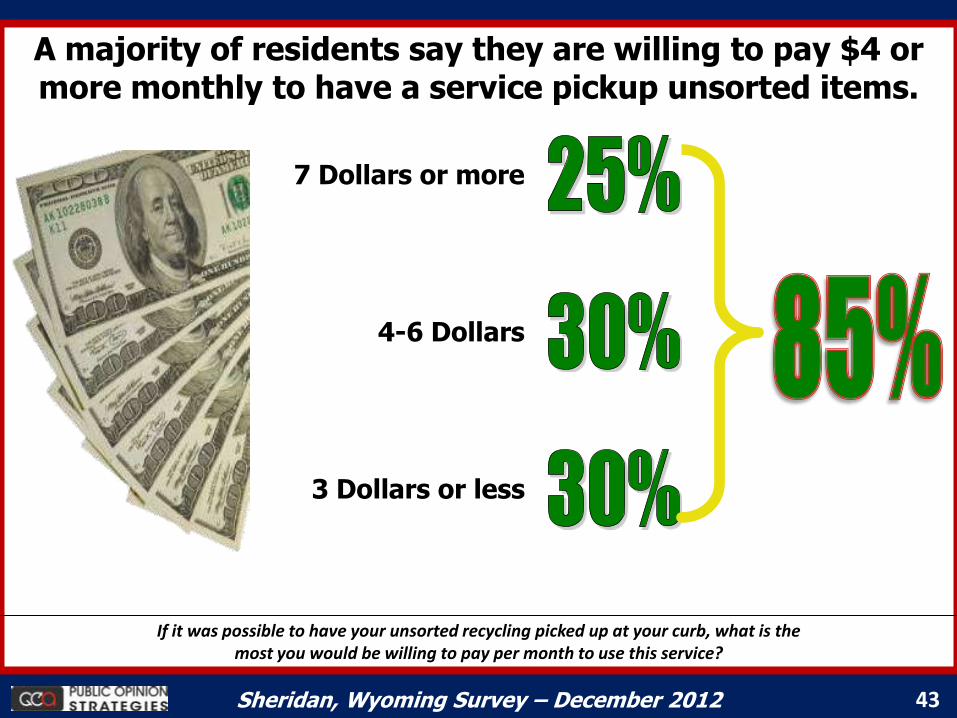
A majority of residents say they are willing to pay $4 or more monthly to have a service pickup unsorted items.
If it was possible to have your unsorted recycling picked up at your curb, what is the most you would be willing to pay per month to use this service?
7 Dollars or more
4-6 Dollars
3 Dollars or less
44 Sheridan, Wyoming Survey – December 2012
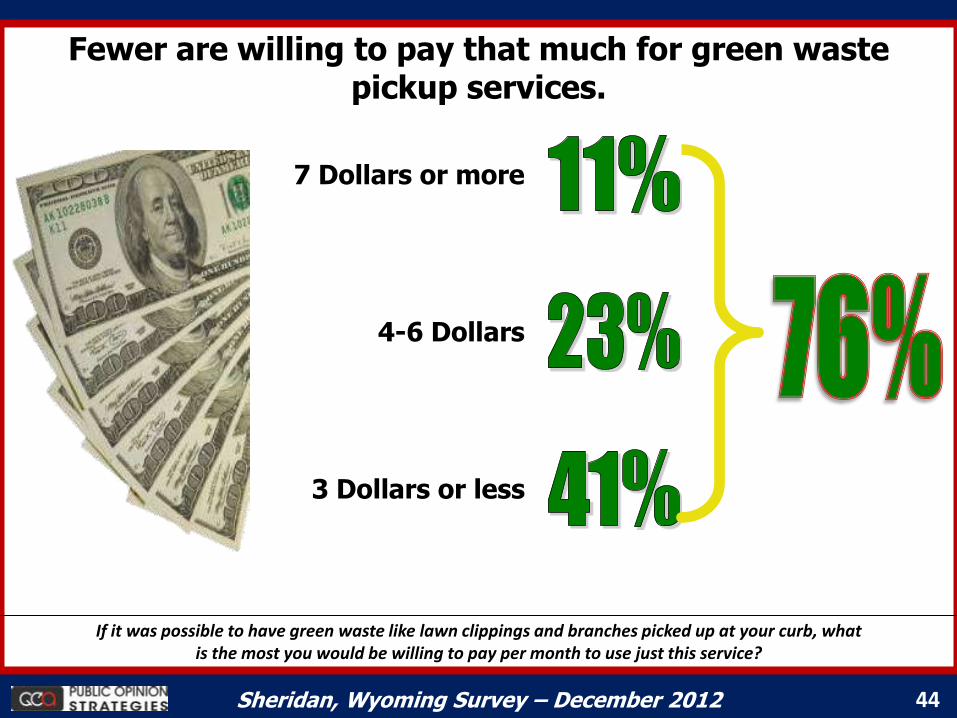
Fewer are willing to pay that much for green waste pickup services.
If it was possible to have green waste like lawn clippings and branches picked up at your curb, what is the most you would be willing to pay per month to use just this service?
7 Dollars or more
4-6 Dollars
3 Dollars or less
45 Sheridan, Wyoming Survey – December 2012
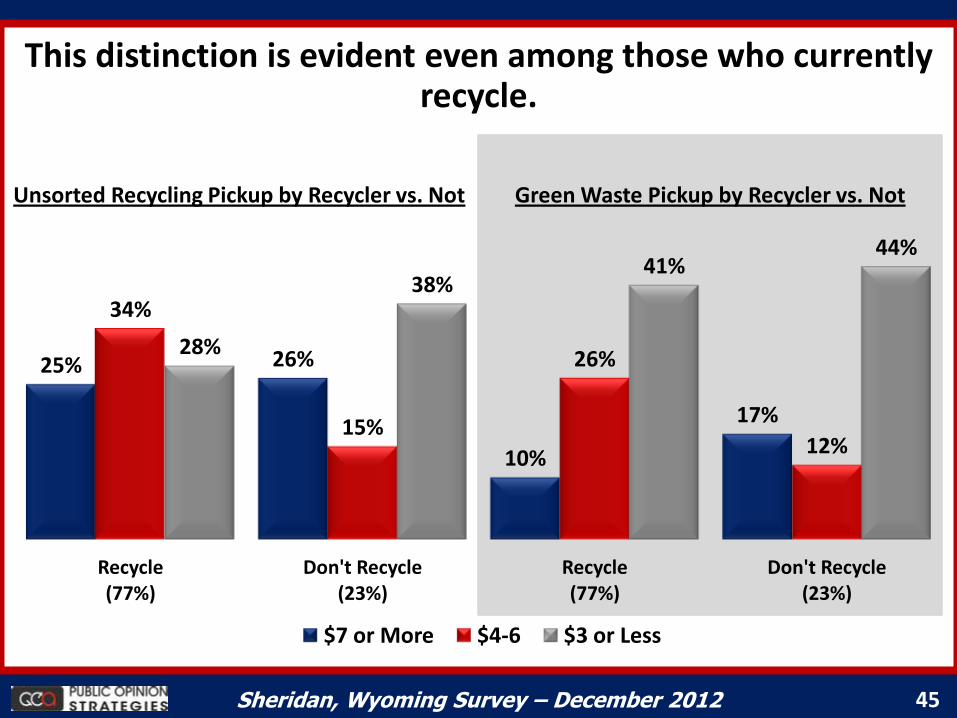
This distinction is evident even among those who currently recycle.
25% 26%
10%
17%
34%
15%
26%
12%
28%
38% 41%
44%
Recycle (77%)
Don't Recycle (23%)
Recycle (77%)
Don't Recycle (23%)
$7 or More $4-6 $3 or Less
Green Waste Pickup by Recycler vs. Not Unsorted Recycling Pickup by Recycler vs. Not
46 Sheridan, Wyoming Survey – December 2012
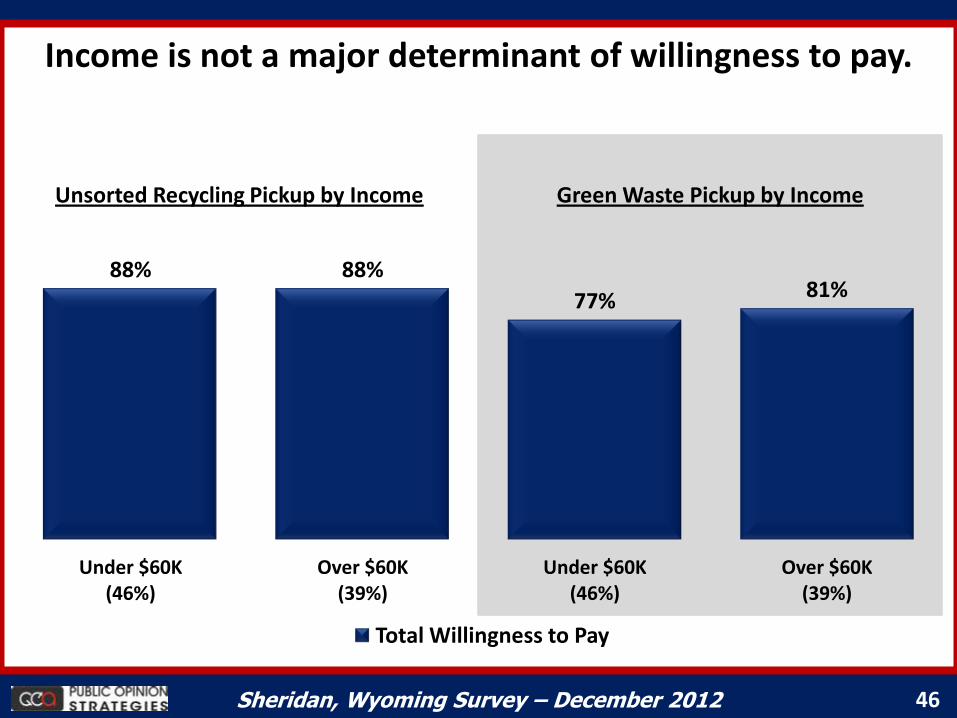
88% 88%
77% 81%
Under $60K (46%)
Over $60K (39%)
Under $60K (46%)
Over $60K (39%)
Total Willingness to Pay
Green Waste Pickup by Income Unsorted Recycling Pickup by Income
Income is not a major determinant of willingness to pay.
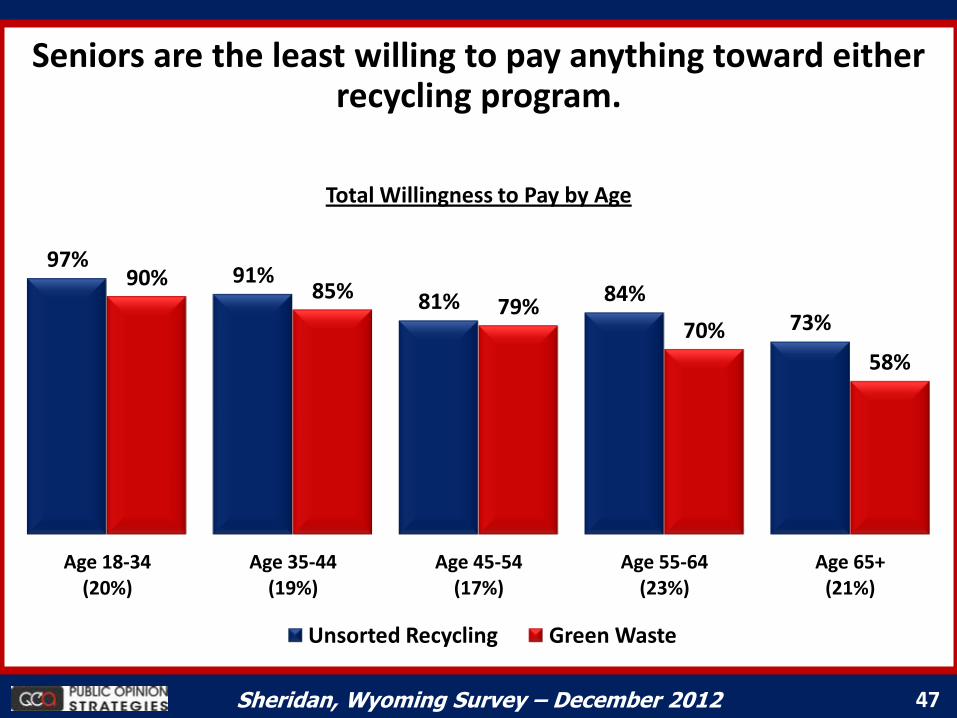
47 Sheridan, Wyoming Survey – December 2012
Seniors are the least willing to pay anything toward either recycling program.
97% 91%
81% 84% 73%
90% 85%
79% 70%
58%
Age 18-34 (20%)
Age 35-44 (19%)
Age 45-54 (17%)
Age 55-64 (23%)
Age 65+ (21%)
Unsorted Recycling Green Waste
Total Willingness to Pay by Age