27
Attrition and Graduation Rates • Undergraduate Graduation and Attrition Rates for 3 Cohorts in 2005-09 • Postgraduate Graduation Rates and Time to Degree
Attrition and Graduation Rates
• Undergraduate Graduation and Attrition Rates for 3 Cohorts in 2005-09
• Postgraduate Graduation Rates and Time to Degree
Undergraduate Graduation and Attrition Rates for 3 Cohorts in 2005-09
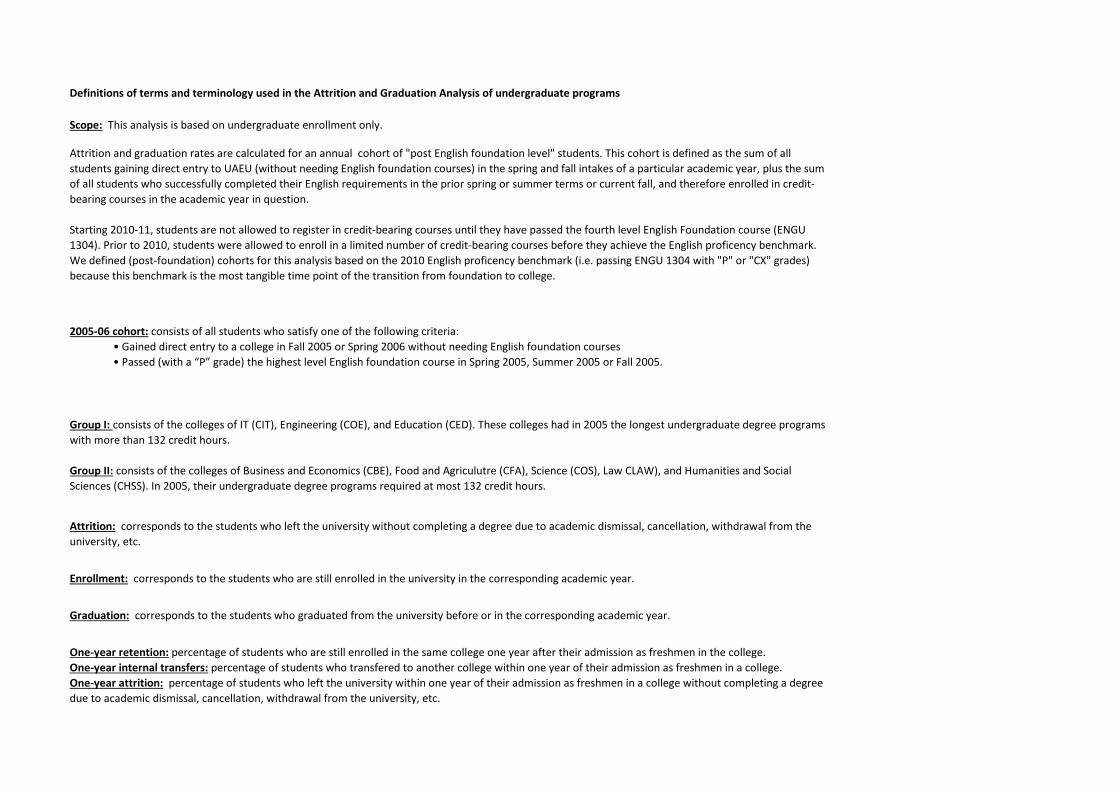
Enrollment: corresponds to the students who are still enrolled in the university in the corresponding academic year.
Graduation: corresponds to the students who graduated from the university before or in the corresponding academic year.
One-year retention: percentage of students who are still enrolled in the same college one year after their admission as freshmen in the college. One-year internal transfers: percentage of students who transfered to another college within one year of their admission as freshmen in a college. One-year attrition: percentage of students who left the university within one year of their admission as freshmen in a college without completing a degree due to academic dismissal, cancellation, withdrawal from the university, etc.
Definitions of terms and terminology used in the Attrition and Graduation Analysis of undergraduate programs
Scope: This analysis is based on undergraduate enrollment only.
Attrition and graduation rates are calculated for an annual cohort of "post English foundation level" students. This cohort is defined as the sum of all students gaining direct entry to UAEU (without needing English foundation courses) in the spring and fall intakes of a particular academic year, plus the sum of all students who successfully completed their English requirements in the prior spring or summer terms or current fall, and therefore enrolled in credit-bearing courses in the academic year in question.
Starting 2010-11, students are not allowed to register in credit-bearing courses until they have passed the fourth level English Foundation course (ENGU 1304). Prior to 2010, students were allowed to enroll in a limited number of credit-bearing courses before they achieve the English proficency benchmark. We defined (post-foundation) cohorts for this analysis based on the 2010 English proficency benchmark (i.e. passing ENGU 1304 with "P" or "CX" grades) because this benchmark is the most tangible time point of the transition from foundation to college.
2005-06 cohort: consists of all students who satisfy one of the following criteria: • Gained direct entry to a college in Fall 2005 or Spring 2006 without needing English foundation courses • Passed (with a “P” grade) the highest level English foundation course in Spring 2005, Summer 2005 or Fall 2005.
Group I: consists of the colleges of IT (CIT), Engineering (COE), and Education (CED). These colleges had in 2005 the longest undergraduate degree programs with more than 132 credit hours.
Group II: consists of the colleges of Business and Economics (CBE), Food and Agriculutre (CFA), Science (COS), Law CLAW), and Humanities and Social Sciences (CHSS). In 2005, their undergraduate degree programs required at most 132 credit hours.
Attrition: corresponds to the students who left the university without completing a degree due to academic dismissal, cancellation, withdrawal from the university, etc.
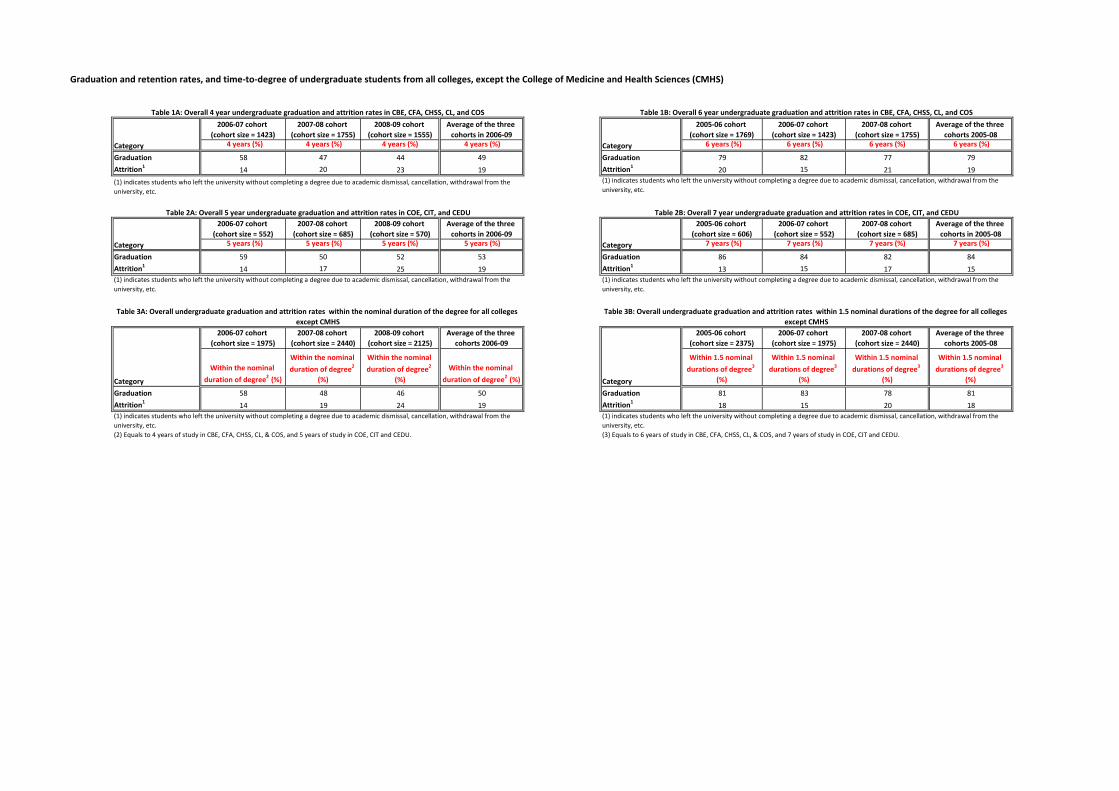
2006-07 cohort (cohort size = 1423)
2007-08 cohort (cohort size = 1755)
2008-09 cohort (cohort size = 1555)
Average of the three cohorts in 2006-09
2005-06 cohort (cohort size = 1769)
2006-07 cohort (cohort size = 1423)
2007-08 cohort (cohort size = 1755)
Average of the three cohorts 2005-08
4 years (%) 4 years (%) 4 years (%) 4 years (%) 6 years (%) 6 years (%) 6 years (%) 6 years (%)
Graduation 58 47 44 49 Graduation 79 82 77 79Attrition1 14 20 23 19 Attrition1 20 15 21 19
2006-07 cohort (cohort size = 552)
2007-08 cohort (cohort size = 685)
2008-09 cohort (cohort size = 570)
Average of the three cohorts in 2006-09
2005-06 cohort (cohort size = 606)
2006-07 cohort (cohort size = 552)
2007-08 cohort (cohort size = 685)
Average of the three cohorts in 2005-08
5 years (%) 5 years (%) 5 years (%) 5 years (%) 7 years (%) 7 years (%) 7 years (%) 7 years (%)
Graduation 59 50 52 53 Graduation 86 84 82 84Attrition1 14 17 25 19 Attrition1 13 15 17 15
2006-07 cohort (cohort size = 1975)
2007-08 cohort (cohort size = 2440)
2008-09 cohort (cohort size = 2125)
Average of the three cohorts 2006-09
2005-06 cohort (cohort size = 2375)
2006-07 cohort (cohort size = 1975)
2007-08 cohort (cohort size = 2440)
Average of the three cohorts 2005-08
Within the nominal duration of degree2 (%)
Within the nominal duration of degree2
(%)
Within the nominal duration of degree2
(%)Within the nominal
duration of degree2 (%)
Within 1.5 nominal durations of degree3
(%)
Within 1.5 nominal durations of degree3
(%)
Within 1.5 nominal durations of degree3
(%)
Within 1.5 nominal durations of degree3
(%)
Graduation 58 48 46 50 Graduation 81 83 78 81Attrition1 14 19 24 19 Attrition1 18 15 20 18
Category
Category
CategoryCategory
Category
Category
Table 3A: Overall undergraduate graduation and attrition rates within the nominal duration of the degree for all colleges except CMHS
Table 3B: Overall undergraduate graduation and attrition rates within 1.5 nominal durations of the degree for all colleges except CMHS
(1) indicates students who left the university without completing a degree due to academic dismissal, cancellation, withdrawal from the university, etc.
(1) indicates students who left the university without completing a degree due to academic dismissal, cancellation, withdrawal from the university, etc.
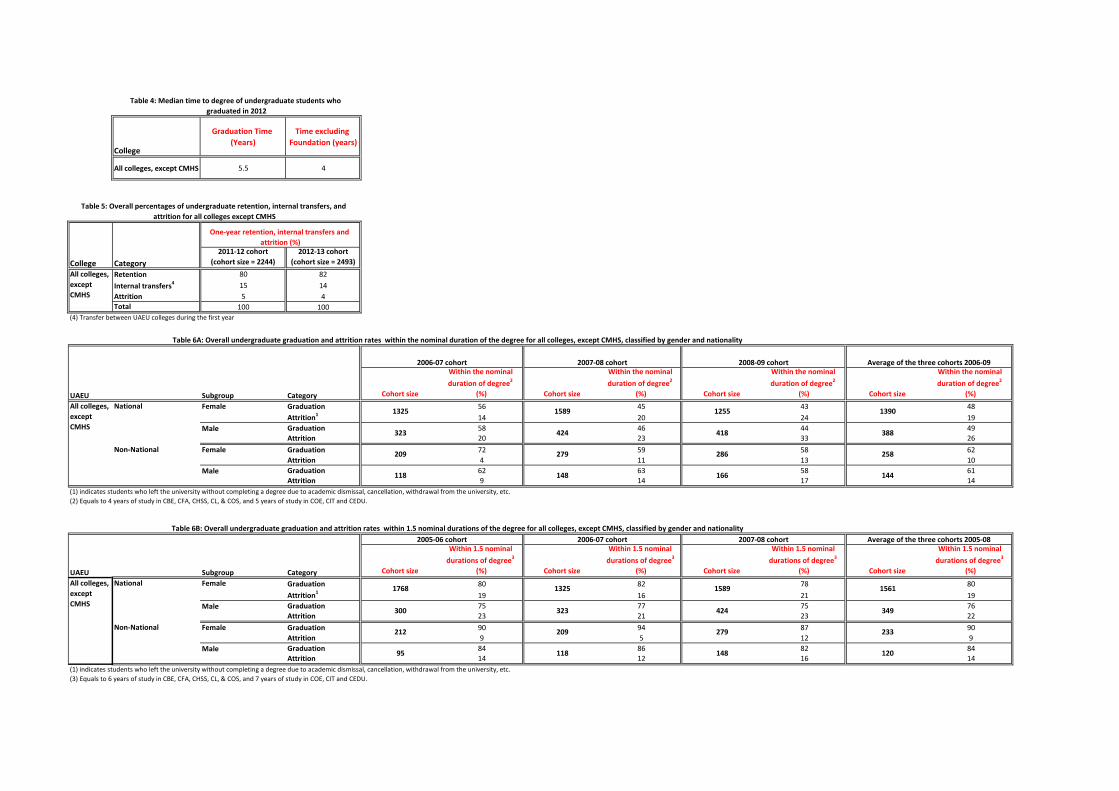
Graduation and retention rates, and time-to-degree of undergraduate students from all colleges, except the College of Medicine and Health Sciences (CMHS)
(1) indicates students who left the university without completing a degree due to academic dismissal, cancellation, withdrawal from the university, etc.
(1) indicates students who left the university without completing a degree due to academic dismissal, cancellation, withdrawal from the university, etc.
Table 1A: Overall 4 year undergraduate graduation and attrition rates in CBE, CFA, CHSS, CL, and COS Table 1B: Overall 6 year undergraduate graduation and attrition rates in CBE, CFA, CHSS, CL, and COS
Table 2A: Overall 5 year undergraduate graduation and attrition rates in COE, CIT, and CEDU Table 2B: Overall 7 year undergraduate graduation and attrition rates in COE, CIT, and CEDU
(1) indicates students who left the university without completing a degree due to academic dismissal, cancellation, withdrawal from the university, etc.(2) Equals to 4 years of study in CBE, CFA, CHSS, CL, & COS, and 5 years of study in COE, CIT and CEDU.
(1) indicates students who left the university without completing a degree due to academic dismissal, cancellation, withdrawal from the university, etc.(3) Equals to 6 years of study in CBE, CFA, CHSS, CL, & COS, and 7 years of study in COE, CIT and CEDU.
College
Graduation Time (Years)
Time excluding Foundation (years)
All colleges, except CMHS 5.5 4
2011-12 cohort(cohort size = 2244)
2012-13 cohort(cohort size = 2493)
Retention 80 82Internal transfers4 15 14Attrition 5 4Total 100 100
Cohort size
Within the nominal duration of degree2
(%) Cohort size
Within the nominal duration of degree2
(%) Cohort size
Within the nominal duration of degree2
(%) Cohort size
Within the nominal duration of degree2
(%)
Graduation 56 45 43 48Attrition1 14 20 24 19Graduation 58 46 44 49Attrition 20 23 33 26Graduation 72 59 58 62Attrition 4 11 13 10Graduation 62 63 58 61Attrition 9 14 17 14
Cohort size
Within 1.5 nominal durations of degree3
(%) Cohort size
Within 1.5 nominal durations of degree3
(%) Cohort size
Within 1.5 nominal durations of degree3
(%) Cohort size
Within 1.5 nominal durations of degree3
(%)
Graduation 80 82 78 80Attrition1 19 16 21 19Graduation 75 77 75 76Attrition 23 21 23 22Graduation 90 94 87 90Attrition 9 5 12 9Graduation 84 86 82 84Attrition 14 12 16 14
Table 6A: Overall undergraduate graduation and attrition rates within the nominal duration of the degree for all colleges, except CMHS, classified by gender and nationality
UAEU Subgroup Category
2006-07 cohort 2007-08 cohort 2008-09 cohort
All colleges, except CMHS
One-year retention, internal transfers and attrition (%)
Table 5: Overall percentages of undergraduate retention, internal transfers, and attrition for all colleges except CMHS
CategoryCollege
(4) Transfer between UAEU colleges during the first year
Male 118 148 166
Table 4: Median time to degree of undergraduate students who graduated in 2012
Average of the three cohorts 2005-08
1390
388
258
144
209 279
(1) indicates students who left the university without completing a degree due to academic dismissal, cancellation, withdrawal from the university, etc.(2) Equals to 4 years of study in CBE, CFA, CHSS, CL, & COS, and 5 years of study in COE, CIT and CEDU.
424 418
Female 209 279 286
All colleges, except CMHS
Female 1325 1589 1255
Male 323
(1) indicates students who left the university without completing a degree due to academic dismissal, cancellation, withdrawal from the university, etc.(3) Equals to 6 years of study in CBE, CFA, CHSS, CL, & COS, and 7 years of study in COE, CIT and CEDU.
1561
349
233
120
All colleges, except CMHS
Female1768 1325 1589
Male 300
118
323 424
Female
Male 95
Average of the three cohorts 2006-09
National
Non-National
148
National
Non-National
Table 6B: Overall undergraduate graduation and attrition rates within 1.5 nominal durations of the degree for all colleges, except CMHS, classified by gender and nationality
UAEU Subgroup Category
2005-06 cohort 2006-07 cohort 2007-08 cohort
212
College Subgroup Category Cohort size 4 years (%) 6 years (%) Cohort size 4 years (%) 6 years (%) Cohort size 4 years (%) 6 years (%) Cohort size 4 years (%) 6 years (%)Female Graduation 55 82 45 76 43 76 47 78
Attrition1 13 14 20 21 22 22 19 19Male Graduation 70 86 45 74 56 73 56 77
Attrition 14 14 19 21 24 24 20 20Female Graduation 60 95 58 91 56 90 58 92
Attrition 0 3 7 9 10 10 6 8Male Graduation 79 86 75 89 43 68 63 80
Attrition 7 7 7 11 32 32 17 19All Graduation 57 84 47 78 46 77 50 79
Attrition 12 13 18 19 21 21 17 18
College Program Category Cohort size 4 years (%) 6 years (%) Cohort size 4 years (%) 6 years (%) Cohort size 4 years (%) 6 years (%) Cohort size 4 years (%) 6 years (%)Graduation 63 92 53 96 57 93 58 94Attrition1 0 2 0 2 4 6 1 3Graduation 73 78 57 69 48 64 61 71Attrition 17 20 29 31 36 36 26 28Graduation 62 90 30 68 56 88 47 80Attrition 8 8 28 30 9 13 17 18Graduation 38 88 56 85 61 91 52 88Attrition 9 9 6 8 9 9 8 9Graduation 69 92 50 85 59 91 58 89Attrition 4 4 14 14 8 8 9 9Graduation 75 83 47 79 69 92 61 84Attrition 17 17 16 21 0 0 12 14Graduation 62 86 63 85 60 81 62 84Attrition 8 9 15 15 19 19 13 14Graduation 53 89 42 87 37 85 43 87Attrition 7 7 8 8 11 11 9 9Graduation - - 0 0 - - 0 0Attrition - - 0 33 - - 0 33Graduation 41 82 42 77 48 89 45 84Attrition 18 18 13 13 4 4 10 10Graduation 50 60 43 93 25 63 41 75Attrition 30 30 7 7 38 38 22 22Graduation 57 81 42 71 46 80 47 77Attrition 9 13 19 21 20 20 17 19Graduation 50 100 55 82 44 78 50 82Attrition 0 0 18 18 11 11 14 14Graduation 47 94 56 96 46 100 50 96Attrition 2 2 4 4 0 0 2 2Graduation 78 89 83 91 91 91 82 90Attrition 11 11 9 9 9 9 10 10Graduation - - 0 100 100 100 50 100Attrition - - 0 0 0 0 0 0
(1) indicates students who left the university without completing a degree due to academic dismissal, cancellation, withdrawal from the university, etc.
College ProgramGraduation Time
(Years)Time excluding
Foundation (years)
CHSS Applied Linguistics / TESOL 5 4
Arabic Language & Literature 6.5 4
English Literature 5 4
General Linguistics 5 4
Geography 5.5 4
History 6 4
Human Services & Counseling 5.5 3.5
Leadership and Society 5 4
Mass Communication 5.5 4.25
Philosophy 7 6.5
Political Science 5 4
Psychology 5.25 4.25
Social Work 5.5 3.5
Sociology 6.5 4
Translation (Arabic/English) 5 4
Urban Planning 6 4.5
Overall 5.5 4
CHSS Applied Linguistics / TESOL51
14
45
Sociology
Mass Communication
Philosophy
Arabic Language & Literature
English Literature
19
67
General Linguistics
39 50
34 48
Geography
History
Human Services & Counseling
49
12
66
75
0
Political Science
Psychology
22
10
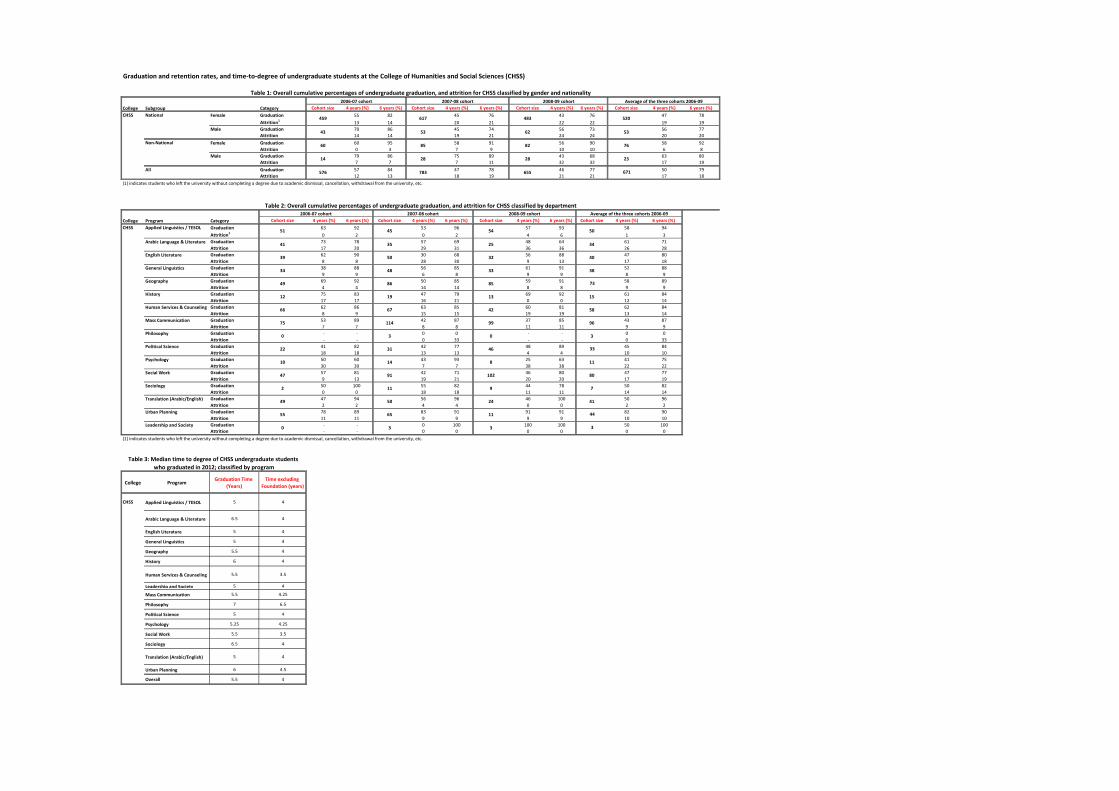
Graduation and retention rates, and time-to-degree of undergraduate students at the College of Humanities and Social Sciences (CHSS)
2006-07 cohort 2007-08 cohort 2008-09 cohort
CHSS
114
3
31
86
14 28
576 783
46
2006-07 cohort 2007-08 cohort
41 35
Translation (Arabic/English)
Urban Planning
Table 3: Median time to degree of CHSS undergraduate students who graduated in 2012; classified by program
91
11
50
65
47
49
55
Leadership and Society 0 3
2
Social Work
National
Non-National
459 617
43 53
60 85
520
53
76
23
Average of the three cohorts 2006-09
483
62
82
28
655
102
9
33
85
13
42
99
7
2008-09 cohort
54
25
32
671
Table 2: Overall cumulative percentages of undergraduate graduation, and attrition for CHSS classified by department
41
44
3
Table 1: Overall cumulative percentages of undergraduate graduation, and attrition for CHSS classified by gender and nationality
(1) indicates students who left the university without completing a degree due to academic dismissal, cancellation, withdrawal from the university, etc.
24
11
3
Average of the three cohorts 2006-09
50
34
40
38
73
15
58
96
3
33
11
80
0
8
Graduation Time (years)
Time excluding Fondation
(years)
Graduation Time (years)
Time excluding Fondation
(years)
Graduation Time (years)
Time excluding
Foundation (years)
Applied Linguistics / TESOL
5 4 - - 5 4
Arabic Language & Literature
6.5 4 7 4 6.5 4
English Literature5 4 - - 5 4
General Linguistics5 4 - - 5 4
Geography 5.5 4 5.5 4 5.5 4
History 6 4 5.5 5 6 4
Human Services & Counseling
5.5 4 - - 5.5 4
Leadership and Society
5 4 - - 5 4
Mass Communication5.5 4.5 5.5 4 5.5 4.5
Philosophy 7.5 7 - - 7.5 7
Political Science5 4 5 3.5 5 3.75
Psychology 5.5 4.5 3 2 5.5 4.5
Social Work 5.5 3.75 6.5 4.5 5.5 4
Sociology 7 4.5 5.75 3.75 6.5 4
Translation (Arabic/English)
5 4.5 - - 5 4.5
Urban Planning 6 4.5 - - 6 4.5
Applied Linguistics / TESOL
5 3.75 - - 5 3.75
Arabic Language & Literature
5.5 4 - - 5.5 4
English Literature 5.25 4 - - 5.25 4General Linguistics 5 4 - - 5 4
Geography 5.75 4 5.75 3.75 5.75 4
History 5.5 2 - - 5.5 2
Human Services & Counseling
5.5 3.5 - - 5.5 3.5
Mass Communication 5.5 4 5.5 4.5 5.5 4
Philosophy 6.5 6 - - 6.5 6
Political Science 6 4.5 - - 6 4.5
Psychology 5 4 - - 5 4
Social Work 5.5 3.5 - - 5.5 3.5
Translation (Arabic/English)
5.25 4 - - 5.25 4
2011-12 cohort(cohort size = 507)
2012-13 cohort(cohort size = 535)
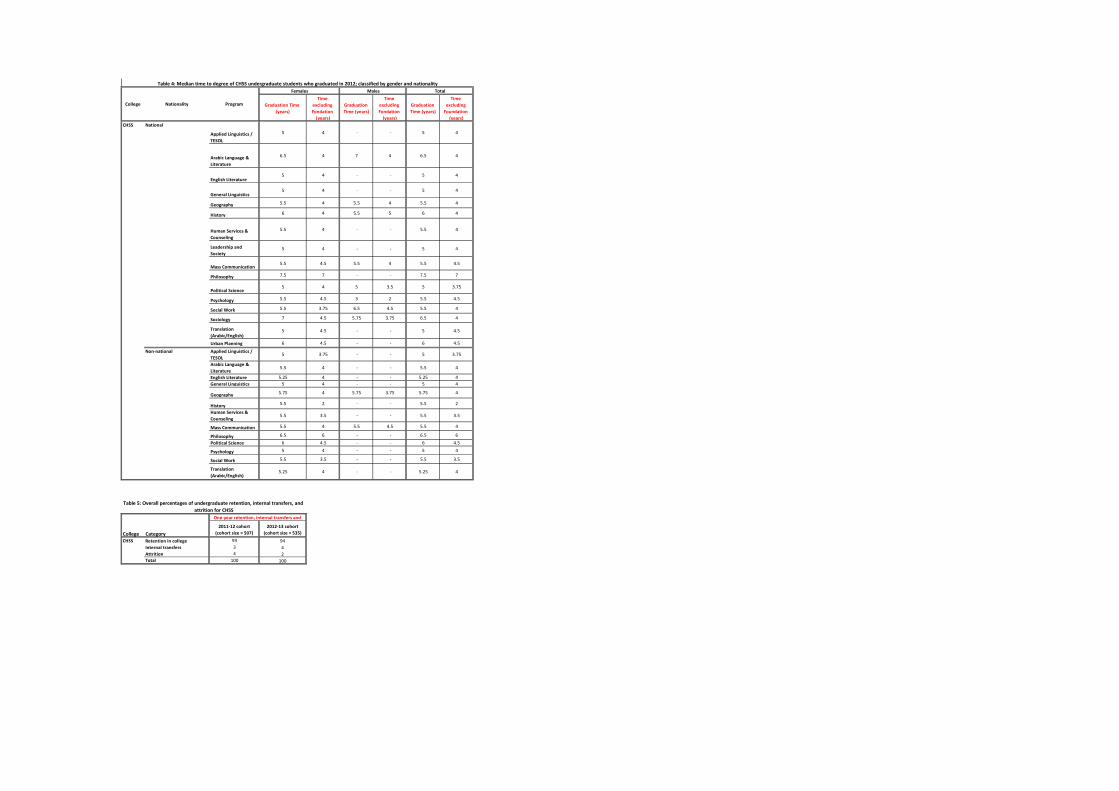
Retention in college 93 94Internal transfers 3 4Attrition 4 2Total 100 100
NationalCHSS
Non-national
CHSS
Table 4: Median time to degree of CHSS undergraduate students who graduated in 2012; classified by gender and nationalityFemales Males Total
ProgramNationalityCollege
Table 5: Overall percentages of undergraduate retention, internal transfers, and attrition for CHSS
College Category
One-year retention, internal transfers and
College Subgroup Category Cohort size 4 years (%) 6 years (%) Cohort size 4 years (%) 6 years (%) Cohort size 4 years
(%) 6 years (%) Cohort size 4 years (%) 6 years (%)Female Graduation 66 87 45 79 43 71 53 80
Attrition1 11 12 19 19 27 27 18 18Male Graduation 53 74 54 86 27 45 49 74
Attrition 26 26 14 14 45 45 24 24Female Graduation 76 94 47 92 56 91 59 92
Attrition 6 6 8 8 6 6 7 7Male Graduation 24 65 56 78 47 65 43 70
Attrition 24 29 11 11 35 35 23 25All Graduation 63 85 47 82 45 73 52 81
Attrition 13 14 16 16 25 25 17 18
College Program Category Cohort size 4 years (%) 6 years (%) Cohort size 4 years (%) 6 years (%) Cohort size 4 years (%)6 years
(%) Cohort size 4 years (%) 6 years (%)Graduation 56 91 21 79 35 70 39 80Attrition1 9 9 15 15 30 30 18 18Graduation 43 76 52 81 25 75 42 78Attrition 22 24 19 19 15 15 19 20Graduation 61 89 43 86 29 74 45 84Attrition 7 9 11 11 24 24 13 14Graduation 79 90 61 89 79 87 73 89Attrition 8 9 11 11 13 13 10 11Graduation 65 76 77 92 43 71 65 81Attrition 24 24 8 8 14 14 16 16
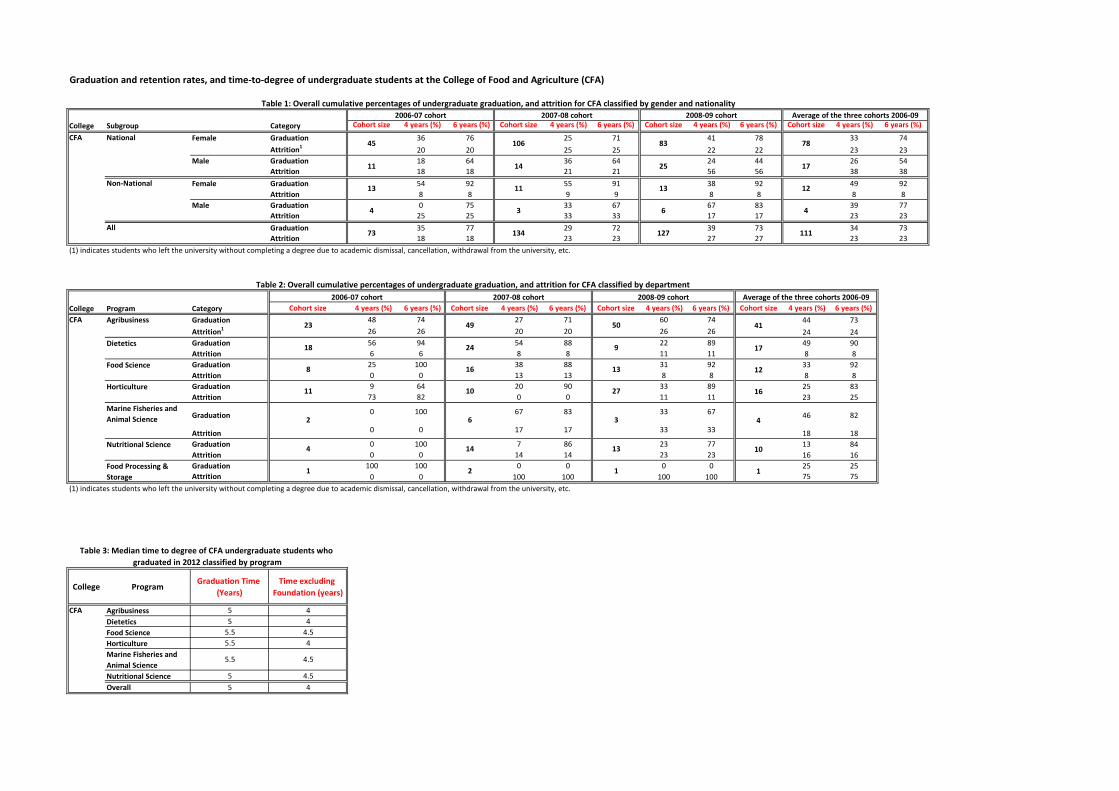
College ProgramGraduation Time
(Years)Time excluding
Foundation (years)
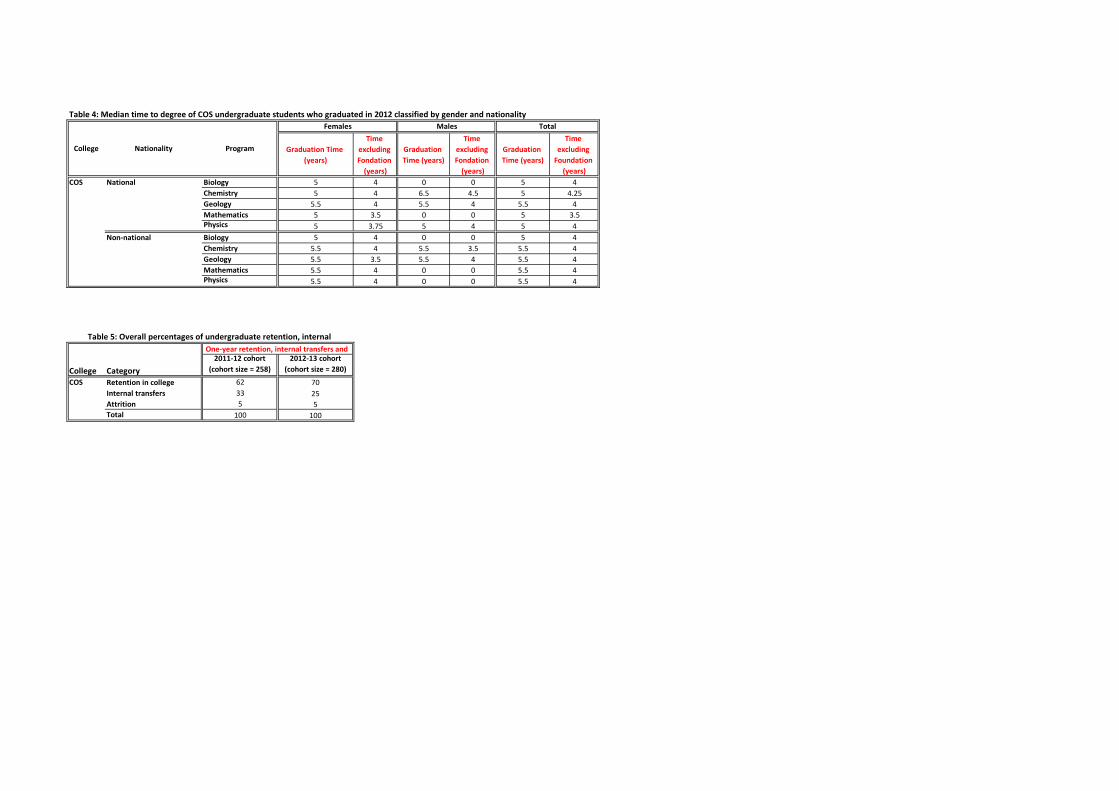
Biology 5 4Chemistry 5.5 4Geology 5.5 4Mathematics 5 4Physics 5.25 4Overall 5 4
Chemistry 31
Geology 44 56
71
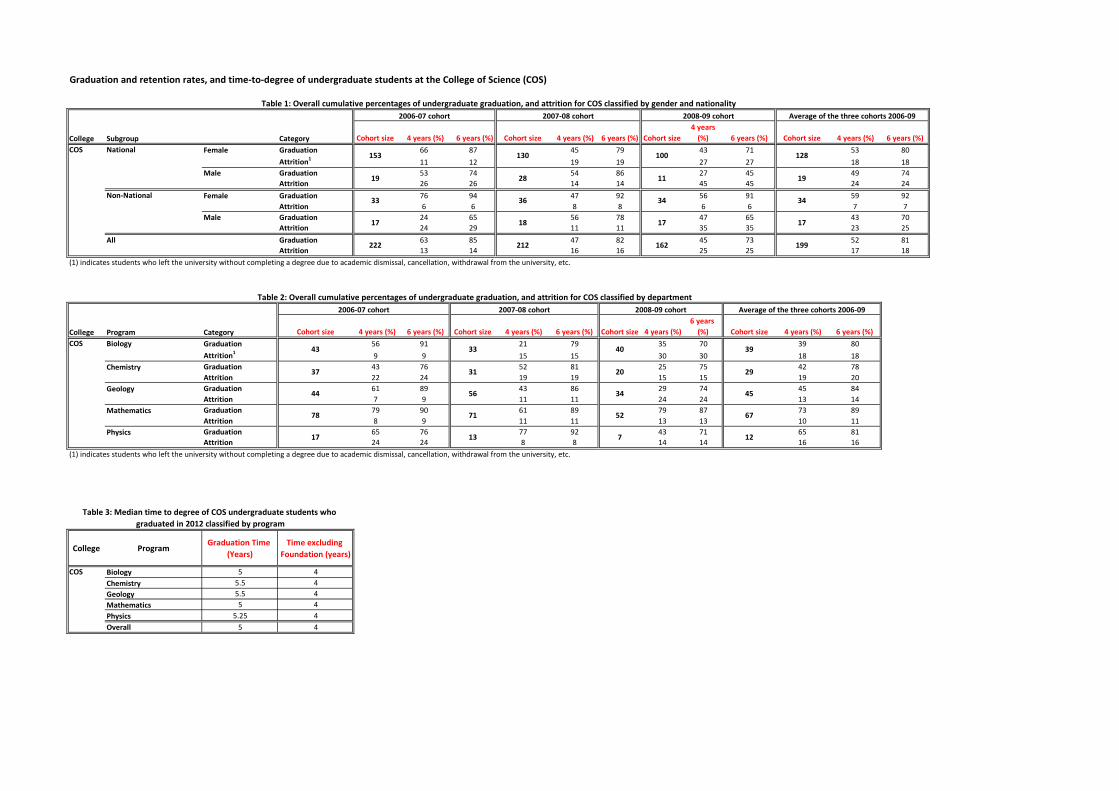
Table 1: Overall cumulative percentages of undergraduate graduation, and attrition for COS classified by gender and nationality
222 212
Non-National 33 36
17 18
COS
Average of the three cohorts 2006-09
128
19
34
17
199
Mathematics 78
2006-07 cohort 2007-08 cohort 2008-09 cohort
National153 130
19 28
100
11
17
162
2008-09 cohort
Physics 17 13
COS
COS
Table 2: Overall cumulative percentages of undergraduate graduation, and attrition for COS classified by department
34
(1) indicates students who left the university without completing a degree due to academic dismissal, cancellation, withdrawal from the university, etc.
2006-07 cohort 2007-08 cohort
Biology43 33
Table 3: Median time to degree of COS undergraduate students who graduated in 2012 classified by program
Graduation and retention rates, and time-to-degree of undergraduate students at the College of Science (COS)
37
7
Average of the three cohorts 2006-09
39
29
45
67
12
(1) indicates students who left the university without completing a degree due to academic dismissal, cancellation, withdrawal from the university, etc.
40
20
34
52
Graduation Time (years)
Time excluding Fondation
(years)
Graduation Time (years)
Time excluding Fondation
(years)
Graduation Time (years)
Time excluding
Foundation (years)
Biology 5 4 0 0 5 4Chemistry 5 4 6.5 4.5 5 4.25Geology 5.5 4 5.5 4 5.5 4Mathematics 5 3.5 0 0 5 3.5Physics 5 3.75 5 4 5 4Biology 5 4 0 0 5 4Chemistry 5.5 4 5.5 3.5 5.5 4Geology 5.5 3.5 5.5 4 5.5 4Mathematics 5.5 4 0 0 5.5 4Physics 5.5 4 0 0 5.5 4
2011-12 cohort(cohort size = 258)
2012-13 cohort(cohort size = 280)
Retention in college 62 70Internal transfers 33 25Attrition 5 5Total 100 100
COS National
Non-national
Program
Females MalesTable 4: Median time to degree of COS undergraduate students who graduated in 2012 classified by gender and nationality
College
COSCollege Category
One-year retention, internal transfers and Table 5: Overall percentages of undergraduate retention, internal
Total
Nationality
College Subgroup Category Cohort size 5 years (%) 7 years (%) Cohort size 5 years (%) 7 years (%) Cohort size 5 years (%) 7 years (%) Cohort size 5 years (%) 7 years (%)Female Graduation 72 79 64 76 71 82 69 79
Attrition1 19 19 21 23 17 18 19 20Male Graduation - - - - - - - -
Attrition - - - - - - - -Female Graduation 83 100 92 96 76 78 83 90
Attrition 0 0 4 4 19 22 9 10Male Graduation - - - - - - - -
Attrition - - - - - - - -All Graduation 74 82 68 80 72 81 72 81
Attrition 16 17 19 19 17 19 17 18
College Program Category Cohort size 5 years (%) 7 years (%) Cohort size 5 years (%) 7 years (%) Cohort size 5 years (%) 7 years (%) Cohort size 5 years (%) 7 years (%)CEDU Graduation 83 87 73 85 82 92 80 89
Attrition1 10 10 15 15 8 8 10 10Graduation 83 93 79 94 75 87 80 92Attrition 6 6 4 6 10 13 7 8Graduation 67 83 78 83 84 94 79 89Attrition 8 17 11 11 6 6 8 10
College ProgramGraduation Time
(Years)Time excluding
Foundation (years)
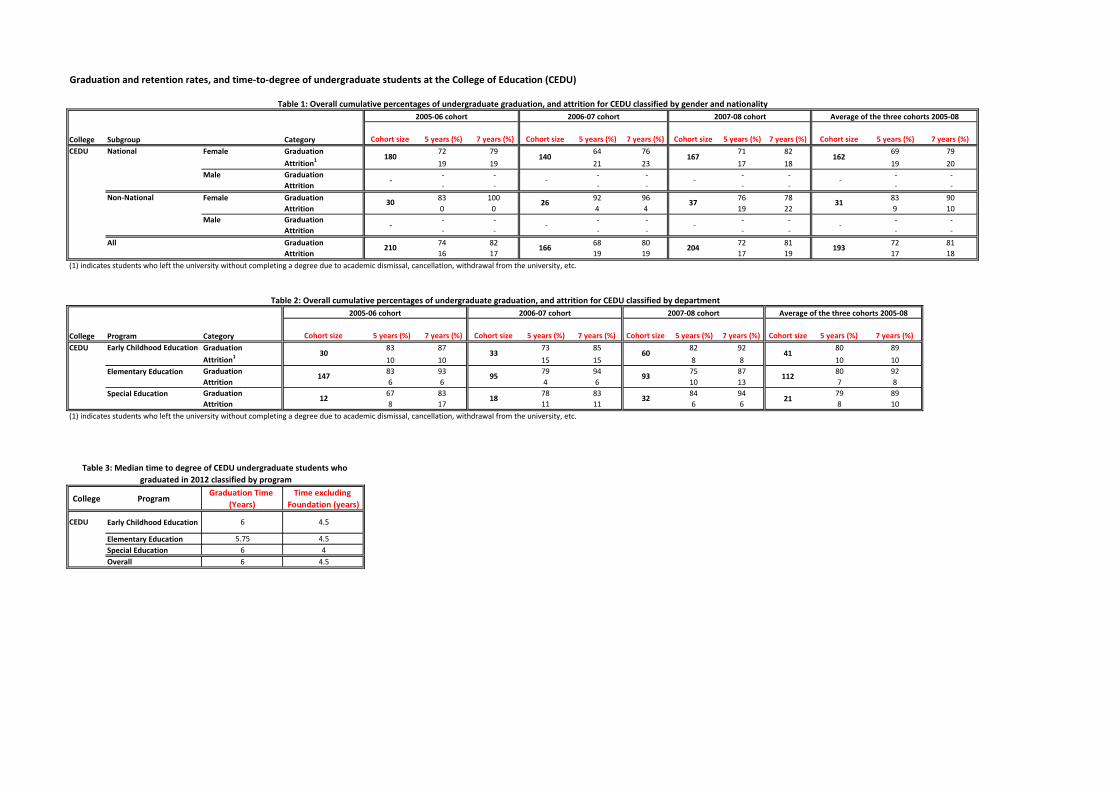
CEDU Early Childhood Education 6 4.5
Elementary Education 5.75 4.5Special Education 6 4Overall 6 4.5
Table 3: Median time to degree of CEDU undergraduate students who graduated in 2012 classified by program
30
(1) indicates students who left the university without completing a degree due to academic dismissal, cancellation, withdrawal from the university, etc.
2132
26
Special Education 1812
147
2005-06 cohort 2006-07 cohort
33
37
204
Early Childhood Education
Table 2: Overall cumulative percentages of undergraduate graduation, and attrition for CEDU classified by department
93
2007-08 cohort
60
CEDU
-
(1) indicates students who left the university without completing a degree due to academic dismissal, cancellation, withdrawal from the university, etc.
162
-
31
-
-
-
210 166
National
Elementary Education 95
30
Average of the three cohorts 2005-08
41
112
Graduation and retention rates, and time-to-degree of undergraduate students at the College of Education (CEDU)
193
Non-National
- -
Table 1: Overall cumulative percentages of undergraduate graduation, and attrition for CEDU classified by gender and nationalityAverage of the three cohorts 2005-082005-06 cohort 2006-07 cohort 2007-08 cohort
-
180 140 167
Graduation Time (years)
Time excluding Fondation
(years)
Graduation Time (years)
Time excluding Fondation
(years)
Graduation Time (years)
Time excluding
Foundation (years)
Early Childhood Education
6 4.5 - - 6 4.5
Elementary Education 5.5 4.5 - - 5.5 4.5
Special Education 6 4 - - 6 4Early Childhood Education
6 4 - - 6 4
Elementary Education 6 4.5 - - 6 4.5
Special Education 6 3.75 - - 6 3.75
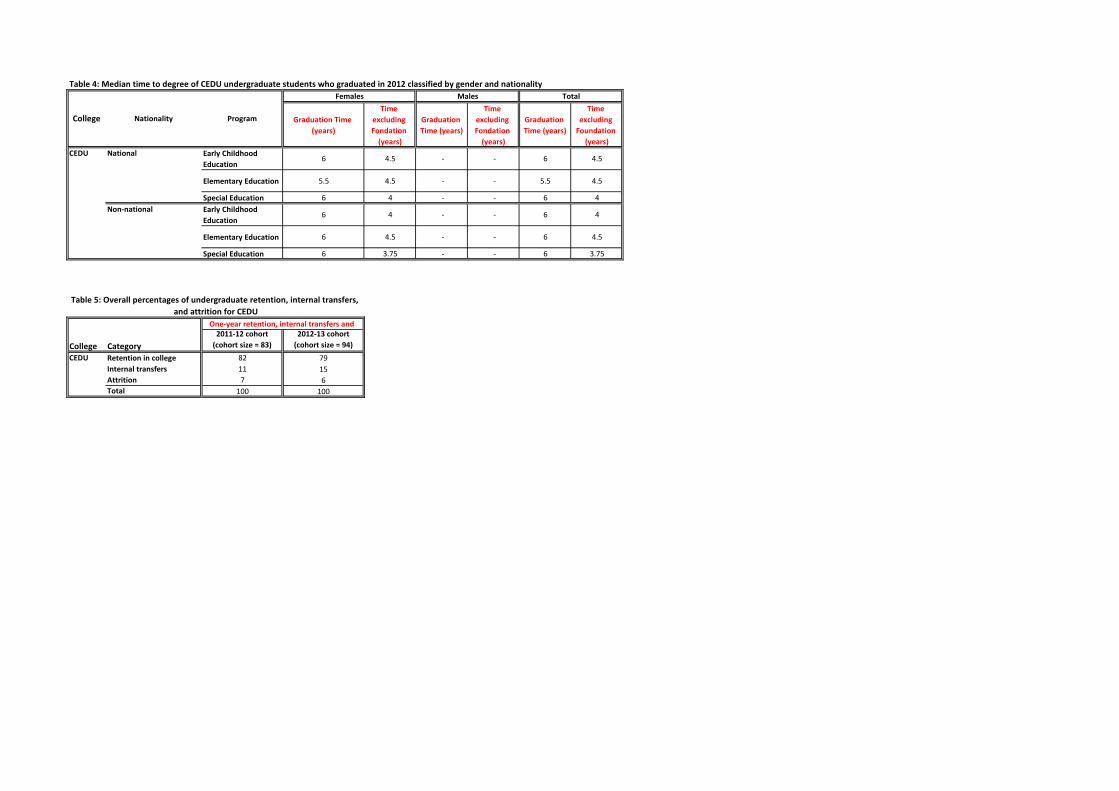
2011-12 cohort(cohort size = 83)
2012-13 cohort(cohort size = 94)
Retention in college 82 79Internal transfers 11 15Attrition 7 6Total 100 100
CEDU
TotalTable 4: Median time to degree of CEDU undergraduate students who graduated in 2012 classified by gender and nationality
CEDU National
Non-national
Table 5: Overall percentages of undergraduate retention, internal transfers, and attrition for CEDU
College Category
One-year retention, internal transfers and
College Nationality Program
Females Males
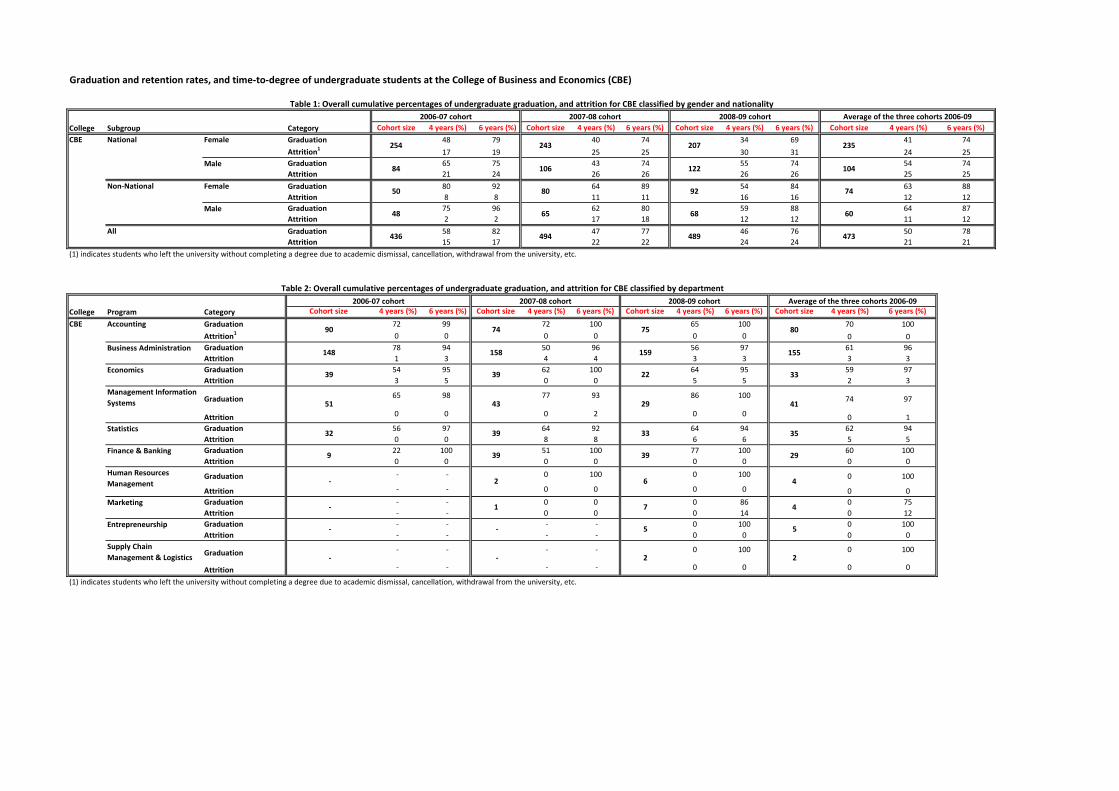
College Subgroup Category Cohort size 4 years (%) 6 years (%) Cohort size 4 years (%) 6 years (%) Cohort size 4 years (%) 6 years (%) Cohort size 4 years (%) 6 years (%)Graduation 48 79 40 74 34 69 41 74Attrition1 17 19 25 25 30 31 24 25Graduation 65 75 43 74 55 74 54 74Attrition 21 24 26 26 26 26 25 25Graduation 80 92 64 89 54 84 63 88Attrition 8 8 11 11 16 16 12 12Graduation 75 96 62 80 59 88 64 87Attrition 2 2 17 18 12 12 11 12Graduation 58 82 47 77 46 76 50 78Attrition 15 17 22 22 24 24 21 21
College Program Category Cohort size 4 years (%) 6 years (%) Cohort size 4 years (%) 6 years (%) Cohort size 4 years (%) 6 years (%) Cohort size 4 years (%) 6 years (%)Graduation 72 99 72 100 65 100 70 100Attrition1 0 0 0 0 0 0 0 0Graduation 78 94 50 96 56 97 61 96Attrition 1 3 4 4 3 3 3 3Graduation 54 95 62 100 64 95 59 97Attrition 3 5 0 0 5 5 2 3
Graduation 65 98 77 93 86 100 74 97
Attrition 0 0 0 2 0 0 0 1Graduation 56 97 64 92 64 94 62 94Attrition 0 0 8 8 6 6 5 5Graduation 22 100 51 100 77 100 60 100Attrition 0 0 0 0 0 0 0 0
Graduation - - 0 100 0 100 0 100
Attrition - - 0 0 0 0 0 0Graduation - - 0 0 0 86 0 75Attrition - - 0 0 0 14 0 12Graduation - - - - 0 100 0 100Attrition - - - - 0 0 0 0
Graduation - - - - 0 100 0 100
Attrition - - - - 0 0 0 0
254 243
84 106
All
CBE Female
Male
Female
Male
2006-07 cohort 2007-08 cohort
Accounting90 74
CBE
Management Information Systems
Statistics
51
32
Economics 39
- -
39
39
92
Table 1: Overall cumulative percentages of undergraduate graduation, and attrition for CBE classified by gender and nationality
Finance & Banking 9
Marketing - 1
Supply Chain Management & Logistics - -
Business Administration 148 158
2006-07 cohort 2007-08 cohort 2008-09 cohort
National
Entrepreneurship
473
7
207
122
Non-National 50 80
48 65
6
436 494
Human Resources Management - 2
43
39
39
2008-09 cohort
75
159
22
29
33
5
(1) indicates students who left the university without completing a degree due to academic dismissal, cancellation, withdrawal from the university, etc.
Table 2: Overall cumulative percentages of undergraduate graduation, and attrition for CBE classified by department
(1) indicates students who left the university without completing a degree due to academic dismissal, cancellation, withdrawal from the university, etc.
Graduation and retention rates, and time-to-degree of undergraduate students at the College of Business and Economics (CBE)
2
Average of the three cohorts 2006-09
80
155
33
41
35
29
4
4
5
2
68
489
Average of the three cohorts 2006-09
235
104
74
60
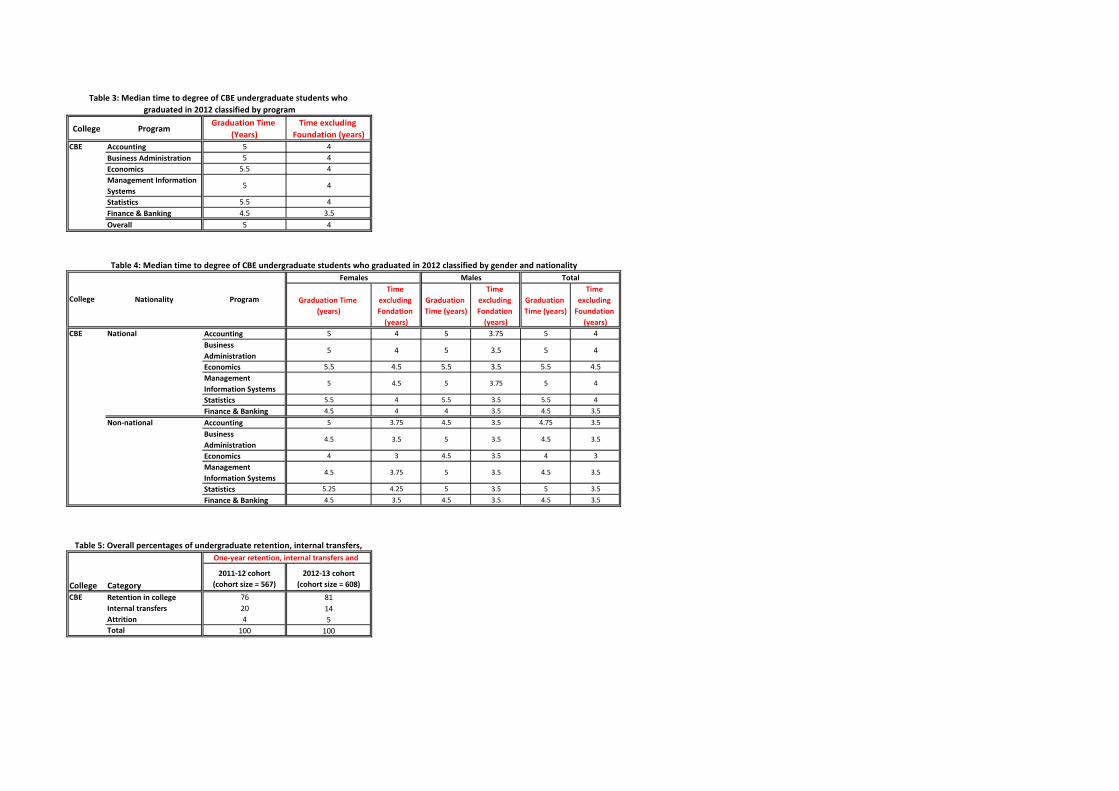
College ProgramGraduation Time
(Years)Time excluding
Foundation (years)CBE Accounting 5 4
Business Administration 5 4Economics 5.5 4Management Information Systems
5 4
Statistics 5.5 4Finance & Banking 4.5 3.5Overall 5 4
Graduation Time (years)
Time excluding Fondation
(years)
Graduation Time (years)
Time excluding Fondation
(years)
Graduation Time (years)
Time excluding
Foundation (years)
Accounting 5 4 5 3.75 5 4Business Administration
5 4 5 3.5 5 4
Economics 5.5 4.5 5.5 3.5 5.5 4.5Management Information Systems
5 4.5 5 3.75 5 4
Statistics 5.5 4 5.5 3.5 5.5 4Finance & Banking 4.5 4 4 3.5 4.5 3.5Accounting 5 3.75 4.5 3.5 4.75 3.5Business Administration
4.5 3.5 5 3.5 4.5 3.5
Economics 4 3 4.5 3.5 4 3Management Information Systems
4.5 3.75 5 3.5 4.5 3.5
Statistics 5.25 4.25 5 3.5 5 3.5Finance & Banking 4.5 3.5 4.5 3.5 4.5 3.5
2011-12 cohort(cohort size = 567)
2012-13 cohort(cohort size = 608)
Retention in college 76 81Internal transfers 20 14Attrition 4 5Total 100 100
CBE National
Non-national
Table 5: Overall percentages of undergraduate retention, internal transfers,
College Category
One-year retention, internal transfers and
CBE
College Nationality
Table 4: Median time to degree of CBE undergraduate students who graduated in 2012 classified by gender and nationality
Table 3: Median time to degree of CBE undergraduate students who graduated in 2012 classified by program
Program
Females Males Total
College Subgroup Category Cohort size 4 years (%) 6 years (%) Cohort size 4 years (%) 6 years (%) Cohort size 4 years (%) 6 years (%) Cohort size 4 years (%) 6 years (%)Graduation 64 66 54 67 29 75 49 69Attrition1 34 34 33 33 23 25 30 31Graduation 71 81 57 78 31 63 53 74Attrition 17 17 21 22 35 35 24 25Graduation 91 100 64 73 40 70 66 81Attrition 0 0 27 27 30 30 19 19Graduation 57 86 58 75 50 75 55 77Attrition 0 14 25 25 17 25 16 23Graduation 69 77 57 73 33 69 53 73Attrition 22 23 26 27 28 30 25 27
College Program Category Cohort size 4 years (%) 6 years (%) Cohort size 4 years (%) 6 years (%) Cohort size 4 years (%) 6 years (%) Cohort size 4 years (%) 6 years (%)Graduation 76 78 73 73 50 50 73 75Attrition1 22 22 27 27 50 50 25 25Graduation 72 75 67 71 77 77 70 74Attrition 25 25 29 29 23 23 26 26Graduation 27 82 39 80 29 74 32 76Attrition 0 9 18 20 24 24 20 22
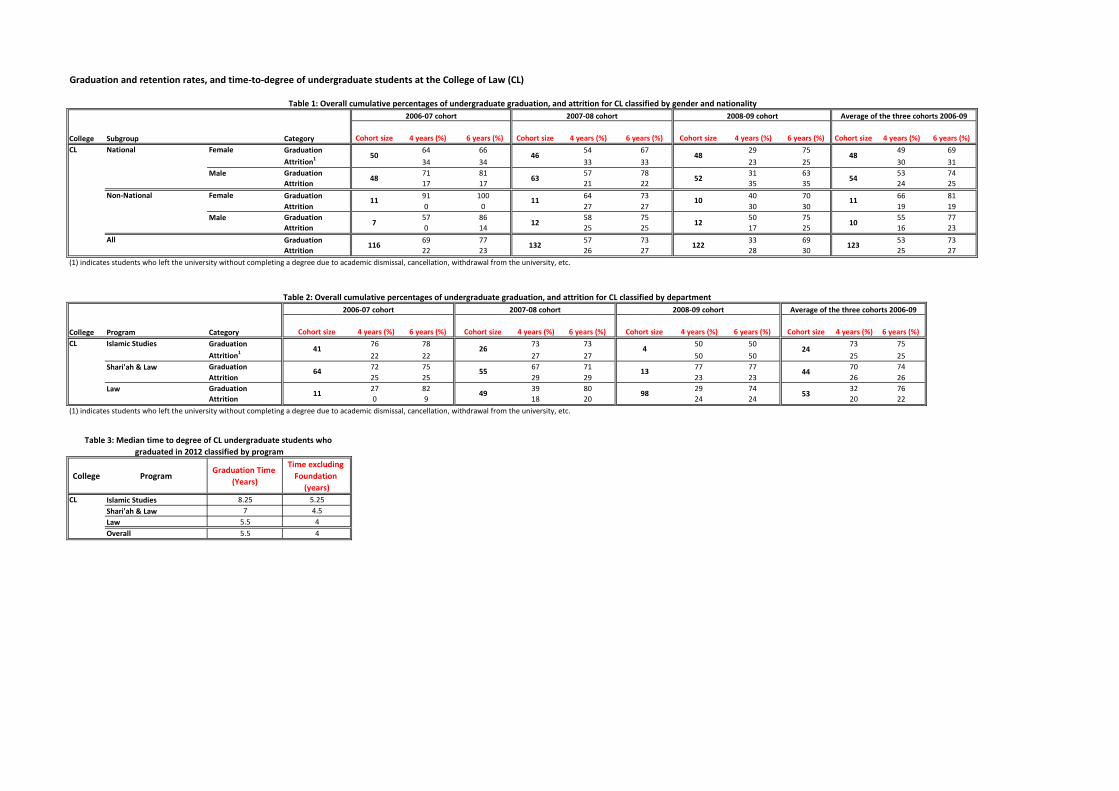
College ProgramGraduation Time
(Years)
Time excluding Foundation
(years)Islamic Studies 8.25 5.25Shari'ah & Law 7 4.5Law 5.5 4Overall 5.5 4
CL
Graduation and retention rates, and time-to-degree of undergraduate students at the College of Law (CL)
49
Table 3: Median time to degree of CL undergraduate students who graduated in 2012 classified by program
Law 11 98
(1) indicates students who left the university without completing a degree due to academic dismissal, cancellation, withdrawal from the university, etc.
CL
48
2008-09 cohort
National48
52
Non-National 11 11
7 12
63
CL Female
Male
Female
Male
All116 132
2006-07 cohort 2007-08 cohort
Shari'ah & Law 64 55
Islamic Studies41 26
Average of the three cohorts 2006-09
24
44
53
2008-09 cohort
13
4
Table 1: Overall cumulative percentages of undergraduate graduation, and attrition for CL classified by gender and nationality
(1) indicates students who left the university without completing a degree due to academic dismissal, cancellation, withdrawal from the university, etc.
Table 2: Overall cumulative percentages of undergraduate graduation, and attrition for CL classified by department
10
12
122
Average of the three cohorts 2006-09
48
54
11
10
123
2006-07 cohort 2007-08 cohort
50 46
Graduation Time (years)
Time excluding Fondation
(years)
Graduation Time (years)
Time excluding Fondation
(years)
Graduation Time (years)
Time excluding Foundation
(years)
Islamic Studies 8.5 7 0 0 8.5 7Shari'ah & Law 6.5 3 7 4.75 7 4.5Law 5.5 3.75 5.5 4 5.5 4Islamic Studies 0 0 8 3.5 8 3.5
Shari'ah & Law - - - - - -Law 6 3.5 6 4 6 3.5
2011-12 cohort(cohort size = 184)
2012-13 cohort(cohort size = 180)
Retention in college 83 82Internal transfers 6 14Attrition 11 4Total 100 100
CL National
Non-national
Table 4: Median time to degree of CL undergraduate students who graduated in 2012 classified by gender and nationality
College Nationality
Table 5: Overall percentages of undergraduate retention, internal transfers, and attrition for CL
College Category
One-year retention, internal transfers and attrition (%)
CL
Program
Females Males Total
College Subgroup Category Cohort size 4 years (%) 6 years (%) Cohort size 4 years (%) 6 years (%) Cohort size 4 years (%) 6 years (%) Cohort size 4 years (%) 6 years (%)
Female Graduation 36 76 25 71 41 78 33 74Attrition1 20 20 25 25 22 22 23 23
Male Graduation 18 64 36 64 24 44 26 54Attrition 18 18 21 21 56 56 38 38
Female Graduation 54 92 55 91 38 92 49 92Attrition 8 8 9 9 8 8 8 8
Male Graduation 0 75 33 67 67 83 39 77Attrition 25 25 33 33 17 17 23 23Graduation 35 77 29 72 39 73 34 73Attrition 18 18 23 23 27 27 23 23
College Program Category Cohort size 4 years (%) 6 years (%) Cohort size 4 years (%) 6 years (%) Cohort size 4 years (%) 6 years (%) Cohort size 4 years (%) 6 years (%)Graduation 48 74 27 71 60 74 44 73Attrition1 26 26 20 20 26 26 24 24Graduation 56 94 54 88 22 89 49 90Attrition 6 6 8 8 11 11 8 8Graduation 25 100 38 88 31 92 33 92Attrition 0 0 13 13 8 8 8 8Graduation 9 64 20 90 33 89 25 83Attrition 73 82 0 0 11 11 23 25
Graduation 0 100 67 83 33 67 46 82
Attrition 0 0 17 17 33 33 18 18Graduation 0 100 7 86 23 77 13 84Attrition 0 0 14 14 23 23 16 16Graduation 100 100 0 0 0 0 25 25Attrition 0 0 100 100 100 100 75 75
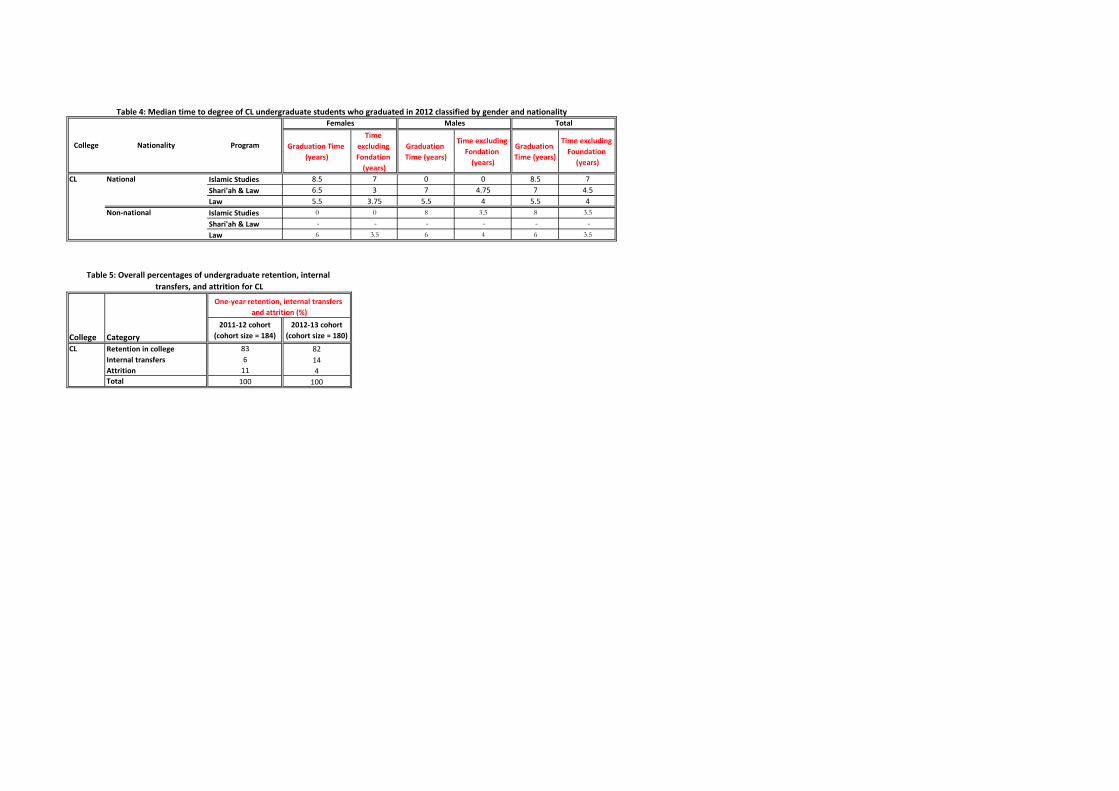
College ProgramGraduation Time
(Years)Time excluding
Foundation (years)
Agribusiness 5 4Dietetics 5 4Food Science 5.5 4.5Horticulture 5.5 4Marine Fisheries and Animal Science
5.5 4.5
Nutritional Science 5 4.5Overall 5 4
Graduation and retention rates, and time-to-degree of undergraduate students at the College of Food and Agriculture (CFA)
CFA
CFA
CFA
All
16
4
10
1
Table 1: Overall cumulative percentages of undergraduate graduation, and attrition for CFA classified by gender and nationality
(1) indicates students who left the university without completing a degree due to academic dismissal, cancellation, withdrawal from the university, etc.
Table 2: Overall cumulative percentages of undergraduate graduation, and attrition for CFA classified by department
111
17
12
Average of the three cohorts 2006-09
78
17
12
4
13
6
127
Average of the three cohorts 2006-09
41
Dietetics 18 24
Food Science 8 16
Food Processing & Storage
1
2
2
Table 3: Median time to degree of CFA undergraduate students who graduated in 2012 classified by program
Marine Fisheries and Animal Science
4
Horticulture 11 10
(1) indicates students who left the university without completing a degree due to academic dismissal, cancellation, withdrawal from the university, etc.
13
6
Nutritional Science 14
1
73
9
13
27
3
2006-07 cohort 2007-08 cohort
134
Agribusiness23 49
2008-09 cohort
50
2006-07 cohort 2007-08 cohort 2008-09 cohort
National45 106
11 14
83
25
Non-National 13 11
4 3
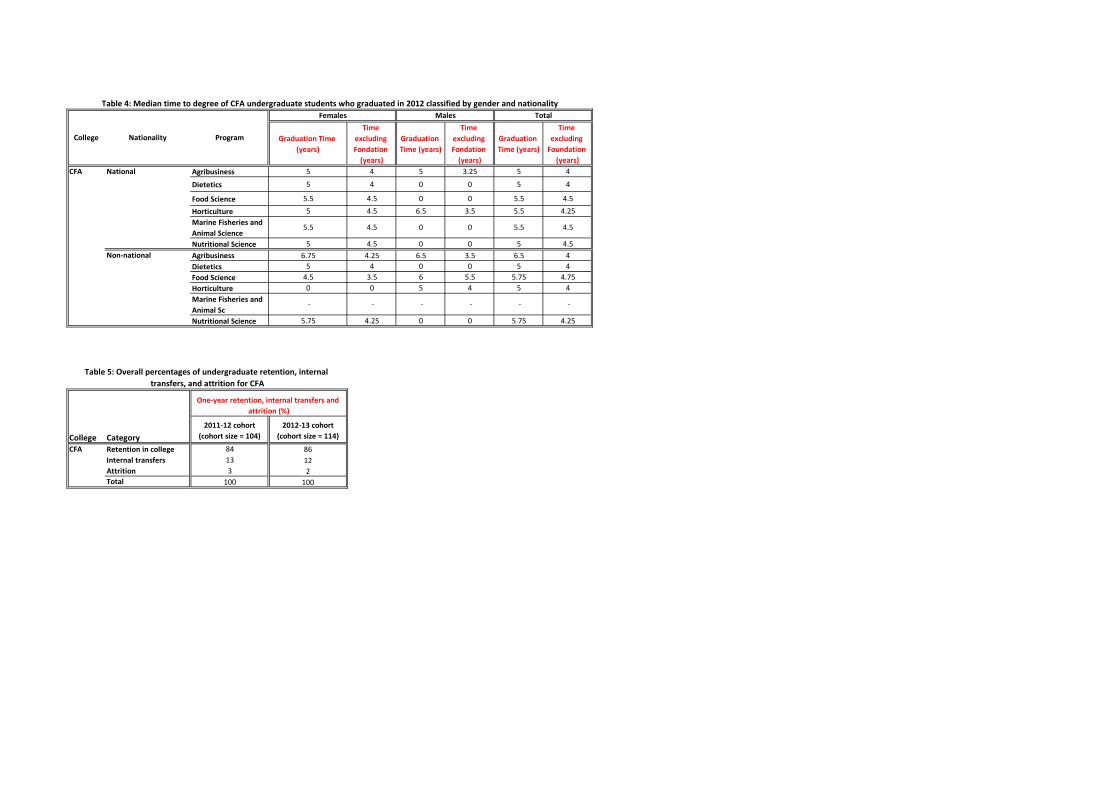
Graduation Time (years)
Time excluding Fondation
(years)
Graduation Time (years)
Time excluding Fondation
(years)
Graduation Time (years)
Time excluding
Foundation (years)
Agribusiness 5 4 5 3.25 5 4
Dietetics 5 4 0 0 5 4
Food Science 5.5 4.5 0 0 5.5 4.5
Horticulture 5 4.5 6.5 3.5 5.5 4.25Marine Fisheries and Animal Science
5.5 4.5 0 0 5.5 4.5
Nutritional Science 5 4.5 0 0 5 4.5Agribusiness 6.75 4.25 6.5 3.5 6.5 4Dietetics 5 4 0 0 5 4Food Science 4.5 3.5 6 5.5 5.75 4.75Horticulture 0 0 5 4 5 4Marine Fisheries and Animal Sc
- - - - - -
Nutritional Science 5.75 4.25 0 0 5.75 4.25
2011-12 cohort(cohort size = 104)
2012-13 cohort(cohort size = 114)
Retention in college 84 86Internal transfers 13 12Attrition 3 2Total 100 100
National
Non-national
CFA
Table 5: Overall percentages of undergraduate retention, internal transfers, and attrition for CFA
College Category
One-year retention, internal transfers and attrition (%)
CFA
Total
College Nationality Program
Females MalesTable 4: Median time to degree of CFA undergraduate students who graduated in 2012 classified by gender and nationality
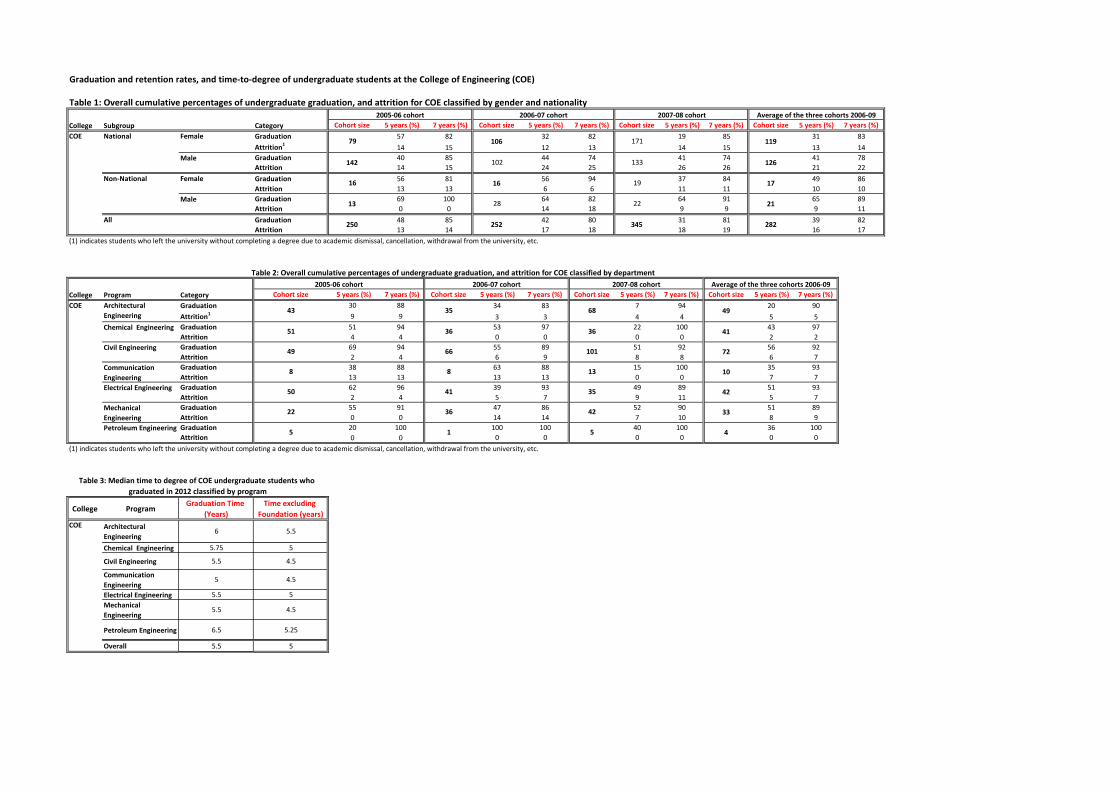
Table 1: Overall cumulative percentages of undergraduate graduation, and attrition for COE classified by gender and nationality
College Subgroup Category Cohort size 5 years (%) 7 years (%) Cohort size 5 years (%) 7 years (%) Cohort size 5 years (%) 7 years (%) Cohort size 5 years (%) 7 years (%)Graduation 57 82 32 82 19 85 31 83Attrition1 14 15 12 13 14 15 13 14Graduation 40 85 44 74 41 74 41 78Attrition 14 15 24 25 26 26 21 22Graduation 56 81 56 94 37 84 49 86Attrition 13 13 6 6 11 11 10 10Graduation 69 100 64 82 64 91 65 89Attrition 0 0 14 18 9 9 9 11Graduation 48 85 42 80 31 81 39 82Attrition 13 14 17 18 18 19 16 17
College Program Category Cohort size 5 years (%) 7 years (%) Cohort size 5 years (%) 7 years (%) Cohort size 5 years (%) 7 years (%) Cohort size 5 years (%) 7 years (%)Graduation 30 88 34 83 7 94 20 90Attrition1 9 9 3 3 4 4 5 5Graduation 51 94 53 97 22 100 43 97Attrition 4 4 0 0 0 0 2 2Graduation 69 94 55 89 51 92 56 92Attrition 2 4 6 9 8 8 6 7Graduation 38 88 63 88 15 100 35 93Attrition 13 13 13 13 0 0 7 7Graduation 62 96 39 93 49 89 51 93Attrition 2 4 5 7 9 11 5 7Graduation 55 91 47 86 52 90 51 89Attrition 0 0 14 14 7 10 8 9Graduation 20 100 100 100 40 100 36 100Attrition 0 0 0 0 0 0 0 0
College ProgramGraduation Time
(Years)Time excluding
Foundation (years)Architectural Engineering
6 5.5
Chemical Engineering 5.75 5
Civil Engineering 5.5 4.5
Communication Engineering
5 4.5
Electrical Engineering 5.5 5Mechanical Engineering
5.5 4.5
Petroleum Engineering 6.5 5.25
Overall 5.5 5
Graduation and retention rates, and time-to-degree of undergraduate students at the College of Engineering (COE)
COE
COE
COE Female
Male
Female
Male
All
72
10
Average of the three cohorts 2006-09
119
126
17
21
4
282
Average of the three cohorts 2006-09
49
41
(1) indicates students who left the university without completing a degree due to academic dismissal, cancellation, withdrawal from the university, etc.
Table 2: Overall cumulative percentages of undergraduate graduation, and attrition for COE classified by department
42
33
35
42
50
22
5
Chemical Engineering 51
41
(1) indicates students who left the university without completing a degree due to academic dismissal, cancellation, withdrawal from the university, etc.
Mechanical EngineeringPetroleum Engineering 5
Table 3: Median time to degree of COE undergraduate students who graduated in 2012 classified by program
1
36
22
16
13 28
Architectural Engineering
43 35
250 252
2005-06 cohort 2006-07 cohort 2007-08 cohort
68
19
345
Non-National
2007-08 cohort
National79 106
142 102 133
171
16
2005-06 cohort 2006-07 cohort
Civil Engineering
Electrical Engineering
Communication Engineering
36
101
138
36
49 66
8
Graduation Time (years)
Time excluding Fondation
(years)
Graduation Time (years)
Time excluding Fondation
(years)
Graduation Time (years)
Time excluding
Foundation (years)
Architectural Engineering
6 5.5 7 6 6 5.5
Chemical Engineering 5.5 5 6 5 5.5 5
Civil Engineering 5.5 5 5.5 4.5 5.5 4.5Communication Engineering
- - - - - -
Electrical Engineering 5.5 5 5.5 5 5.5 5Mechanical Engineering
5.5 5 6 4.75 5.5 5
Petroleum Engineering
0 0 6.5 5.25 6.5 5.25
Architectural Engineering
6 5.5 6.5 5.5 6.25 5.5
Chemical Engineering 5.5 5 6 5.25 6 5
Civil Engineering 5.5 4.25 5.5 4.5 5.5 4.5Communication Engineering
5 4.5 0 0 5 4.5
Electrical Engineering 4.5 3.75 5.5 5 5.5 4Mechanical Engineering
5.5 4.5 5.25 4.25 5.5 4.5
Petroleum Engineering
0 0 6.5 5.25 6.5 5.25
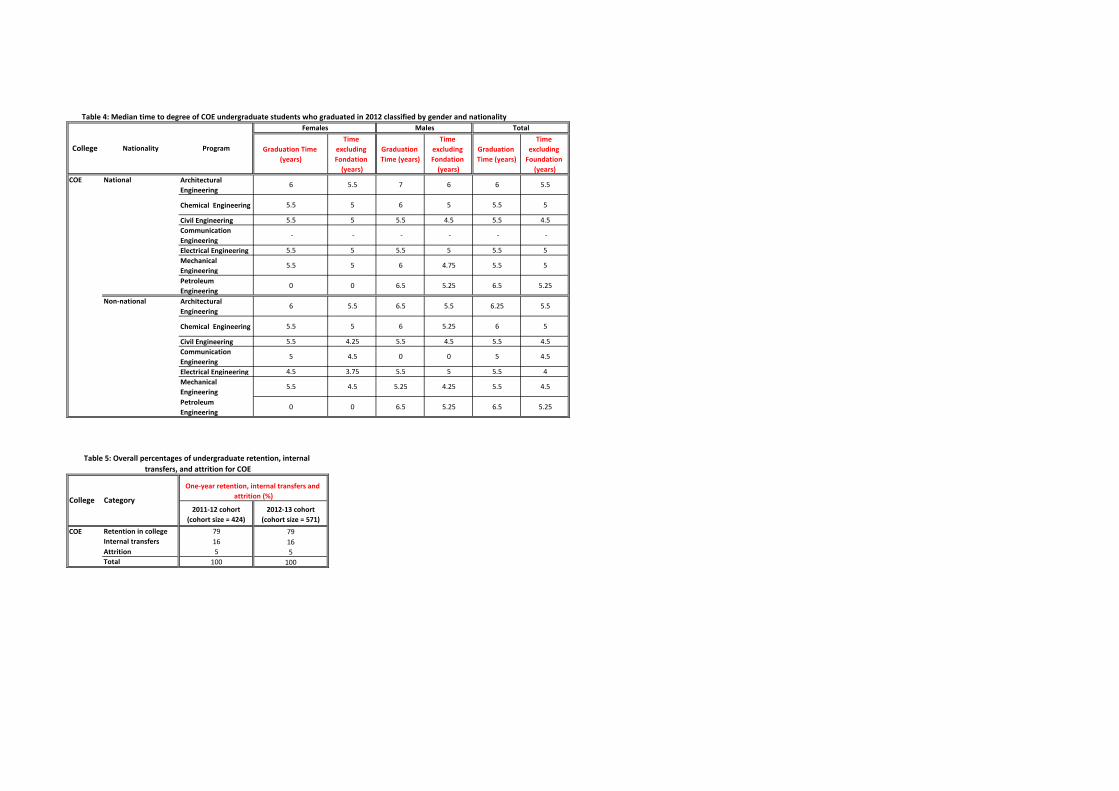
2011-12 cohort(cohort size = 424)
2012-13 cohort(cohort size = 571)
Retention in college 79 79Internal transfers 16 16Attrition 5 5Total 100 100
NationalCOE
COE
College Nationality
Table 5: Overall percentages of undergraduate retention, internal transfers, and attrition for COE
College Category
One-year retention, internal transfers and attrition (%)
Total
Non-national
Program
Females MalesTable 4: Median time to degree of COE undergraduate students who graduated in 2012 classified by gender and nationality
College Subgroup Category Cohort size 5 years (%) 7 years (%) Cohort size 5 years (%)7 years
(%)Cohort
size 5 years
(%)7 years
(%) Cohort size 5 years (%) 7 years (%)Female Graduation 79 97 82 98 71 87 78 94
Attrition1 3 3 1 2 12 12 5 5Male Graduation 50 81 63 81 52 85 54 83
Attrition 13 13 19 19 15 15 16 16Female Graduation - - - - - - - -
Attrition - - - - - - - -Male Graduation - - - - - - - -
Attrition - - - - - - - -All Graduation 76 95 80 96 67 87 74 93
Attrition 4 4 3 4 13 13 7 7
College Program Category Cohort size 5 years (%) 7 years (%) Cohort size 5 years (%) 7 years (%)Cohort
size 5 years
(%)7 years
(%)Cohort
size 5 years (%) 7 years (%)Graduation 100 100 100 100 - - 100 100Attrition1 0 0 0 0 - - 0 0Graduation 67 100 100 100 - - 90 100Attrition 0 0 0 0 - - 0 0Graduation - - 67 100 64 100 65 100Attrition - - 0 0 0 0 0 0Graduation 55 100 71 100 67 92 64 97Attrition 0 0 0 0 8 8 3 3Graduation - - 50 100 67 100 62 100Attrition - - 0 0 0 0 0 0Graduation 79 95 65 100 67 97 69 98Attrition 0 0 0 0 3 3 1 1Graduation 79 100 100 100 100 100 86 100Attrition 0 0 0 0 0 0 0 0Graduation 88 100 91 97 100 100 90 99Attrition 0 0 0 3 0 0 0 1Graduation - - 75 100 88 100 82 100Attrition - - 0 0 0 0 0 0Graduation 79 100 100 100 92 100 87 100Attrition 0 0 0 0 0 0Graduation 0 100 - - 78 100 70 100Attrition 0 0 - - 0 0 0 0
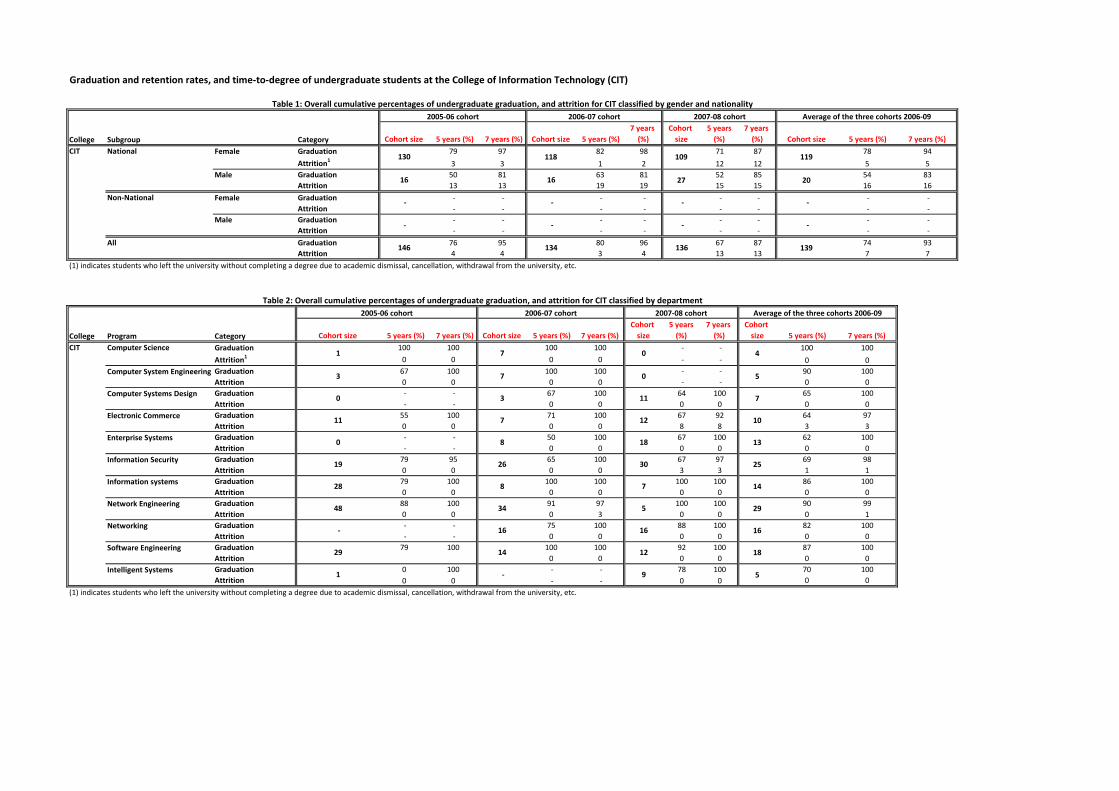
Graduation and retention rates, and time-to-degree of undergraduate students at the College of Information Technology (CIT)
CIT
CIT
16
18
5
(1) indicates students who left the university without completing a degree due to academic dismissal, cancellation, withdrawal from the university, etc.
Table 1: Overall cumulative percentages of undergraduate graduation, and attrition for CIT classified by gender and nationality
Table 2: Overall cumulative percentages of undergraduate graduation, and attrition for CIT classified by department
10
13
25
14
29
139
Average of the three cohorts 2006-09
4
5
7
Average of the three cohorts 2006-09
119
20
-
-
(1) indicates students who left the university without completing a degree due to academic dismissal, cancellation, withdrawal from the university, etc.
2005-06 cohort 2006-07 cohort
Computer Science1 7
2007-08 cohort
0
Computer System Engineering 3 7
Computer Systems Design 0 3
Electronic Commerce 11
Enterprise Systems 0 8
Information Security 19 26
Information systems 28 8
Network Engineering
Networking
Software Engineering
48
Intelligent Systems 1 -
34
-
29 14
16
0
11
12
18
30
7
5
16
12
9
7
National
27
109
Non-National - -
- - -
146 134
-
130 118
16 16
136
2005-06 cohort 2006-07 cohort 2007-08 cohort
College ProgramGraduation Time
(Years)Time excluding
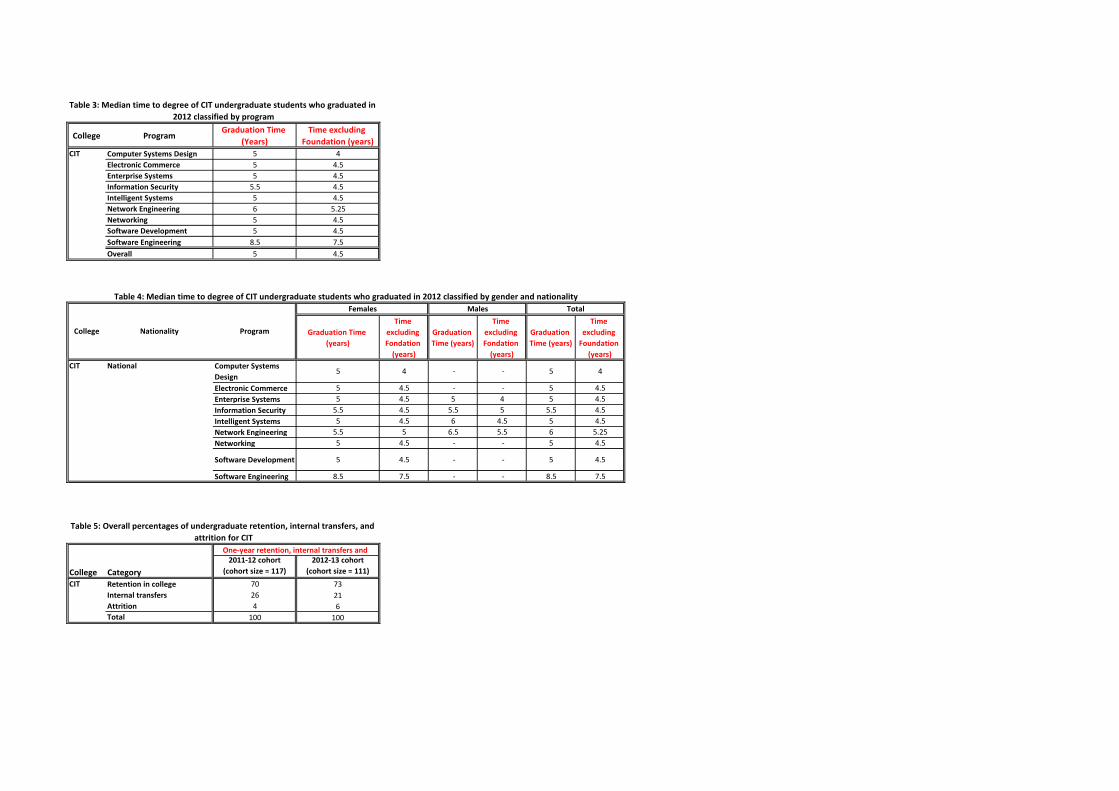
Foundation (years)Computer Systems Design 5 4Electronic Commerce 5 4.5Enterprise Systems 5 4.5Information Security 5.5 4.5Intelligent Systems 5 4.5Network Engineering 6 5.25Networking 5 4.5Software Development 5 4.5Software Engineering 8.5 7.5Overall 5 4.5
Graduation Time (years)
Time excluding Fondation
(years)
Graduation Time (years)
Time excluding Fondation
(years)
Graduation Time (years)
Time excluding
Foundation (years)
Computer Systems Design
5 4 - - 5 4
Electronic Commerce 5 4.5 - - 5 4.5Enterprise Systems 5 4.5 5 4 5 4.5Information Security 5.5 4.5 5.5 5 5.5 4.5Intelligent Systems 5 4.5 6 4.5 5 4.5Network Engineering 5.5 5 6.5 5.5 6 5.25Networking 5 4.5 - - 5 4.5
Software Development 5 4.5 - - 5 4.5
Software Engineering 8.5 7.5 - - 8.5 7.5
2011-12 cohort(cohort size = 117)
2012-13 cohort(cohort size = 111)
Retention in college 70 73Internal transfers 26 21Attrition 4 6Total 100 100
CIT
CIT National
Table 5: Overall percentages of undergraduate retention, internal transfers, and attrition for CIT
College Category
One-year retention, internal transfers and
CIT
Total
Table 3: Median time to degree of CIT undergraduate students who graduated in 2012 classified by program
Table 4: Median time to degree of CIT undergraduate students who graduated in 2012 classified by gender and nationality
College Nationality Program
Females Males
Postgraduate Graduation Rates and Time to Degree
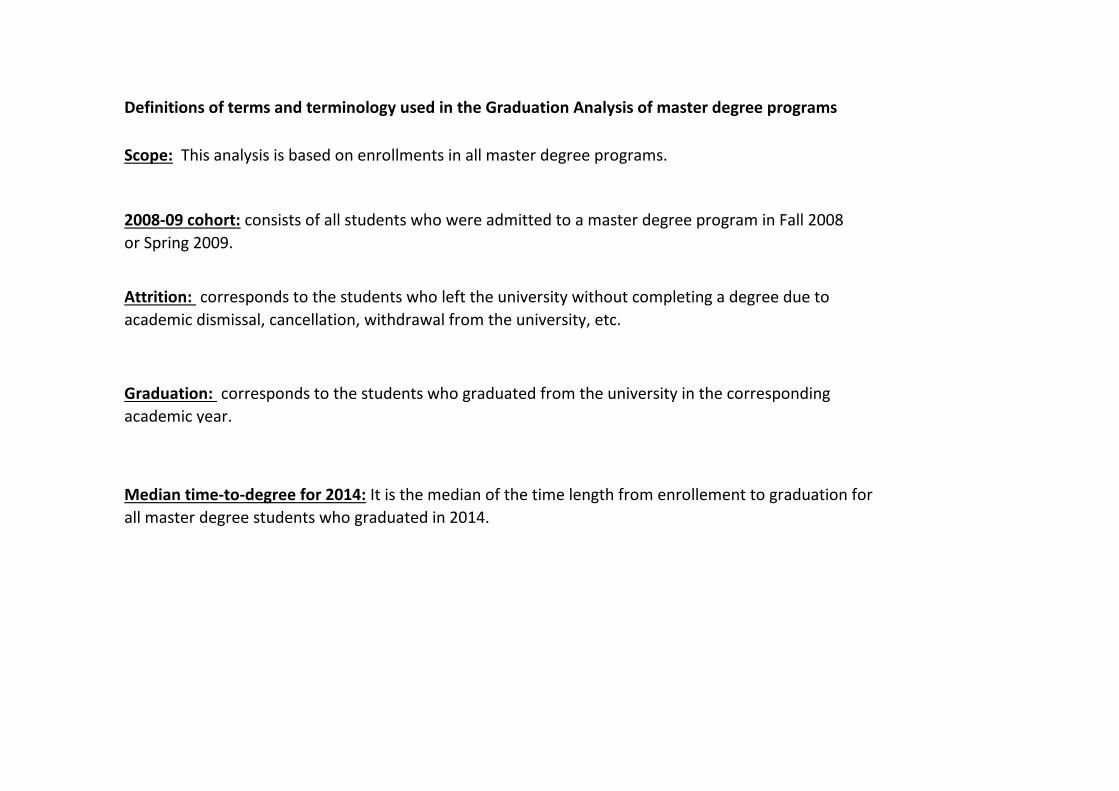
Graduation: corresponds to the students who graduated from the university in the corresponding academic year.
Median time-to-degree for 2014: It is the median of the time length from enrollement to graduation for all master degree students who graduated in 2014.
Definitions of terms and terminology used in the Graduation Analysis of master degree programs
Scope: This analysis is based on enrollments in all master degree programs.
2008-09 cohort: consists of all students who were admitted to a master degree program in Fall 2008 or Spring 2009.
Attrition: corresponds to the students who left the university without completing a degree due to academic dismissal, cancellation, withdrawal from the university, etc.
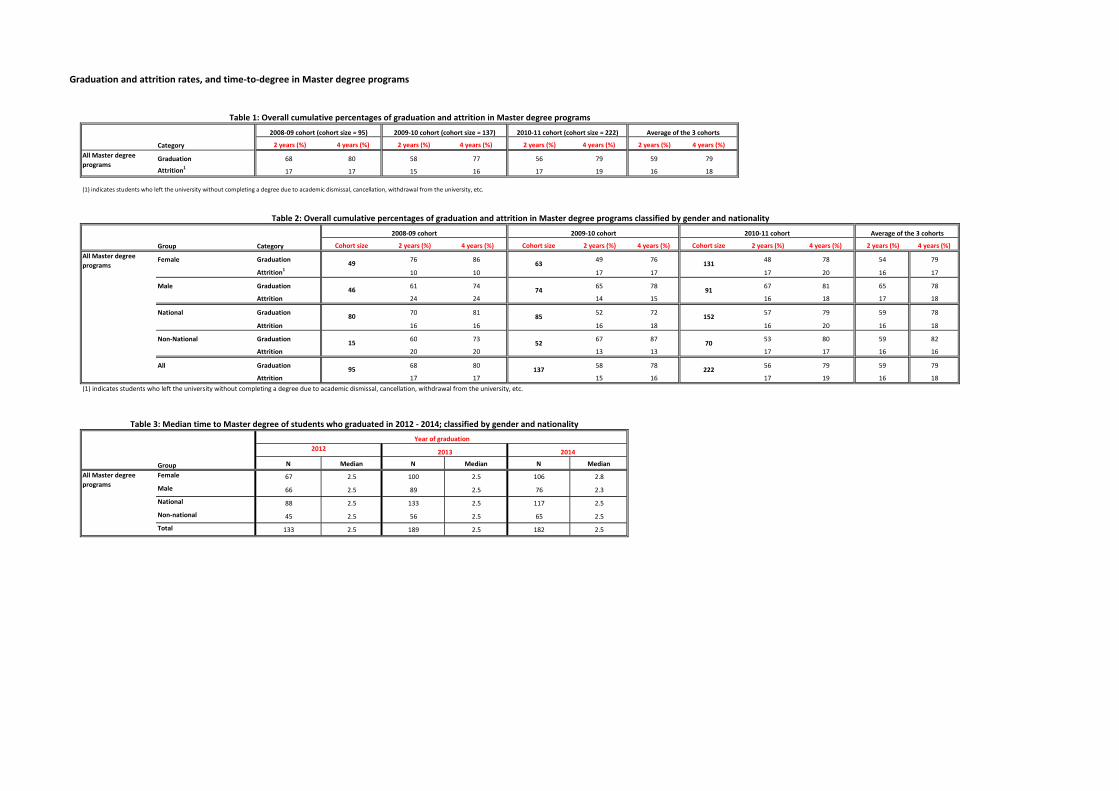
Category 2 years (%) 4 years (%) 2 years (%) 4 years (%) 2 years (%) 4 years (%) 2 years (%) 4 years (%)
Graduation 68 80 58 77 56 79 59 79
Attrition1 17 17 15 16 17 19 16 18
Group Category Cohort size 2 years (%) 4 years (%) Cohort size 2 years (%) 4 years (%) Cohort size 2 years (%) 4 years (%) 2 years (%) 4 years (%)
Female Graduation 76 86 49 76 48 78 54 79
Attrition1 10 10 17 17 17 20 16 17
Male Graduation 61 74 65 78 67 81 65 78
Attrition 24 24 14 15 16 18 17 18
National Graduation 70 81 52 72 57 79 59 78
Attrition 16 16 16 18 16 20 16 18
Non-National Graduation 60 73 67 87 53 80 59 82
Attrition 20 20 13 13 17 17 16 16
All Graduation 68 80 58 78 56 79 59 79
Attrition 17 17 15 16 17 19 16 18
N Median N Median N MedianFemale 67 2.5 100 2.5 106 2.8
Male 66 2.5 89 2.5 76 2.3
National 88 2.5 133 2.5 117 2.5
Non-national 45 2.5 56 2.5 65 2.5
Total 133 2.5 189 2.5 182 2.5
Graduation and attrition rates, and time-to-degree in Master degree programs
2008-09 cohort 2009-10 cohort
Table 1: Overall cumulative percentages of graduation and attrition in Master degree programs
All Master degree programs
15 52
Average of the 3 cohorts
2008-09 cohort (cohort size = 95) 2009-10 cohort (cohort size = 137) Average of the 3 cohorts
(1) indicates students who left the university without completing a degree due to academic dismissal, cancellation, withdrawal from the university, etc.
All Master degree programs
2010-11 cohort (cohort size = 222)
2010-11 cohort
Table 2: Overall cumulative percentages of graduation and attrition in Master degree programs classified by gender and nationality
95 137
91
152
Group
Year of graduation2012 2013 2014
70
222
Table 3: Median time to Master degree of students who graduated in 2012 - 2014; classified by gender and nationality
(1) indicates students who left the university without completing a degree due to academic dismissal, cancellation, withdrawal from the university, etc.
All Master degree programs 13149 63
46 74
80 85
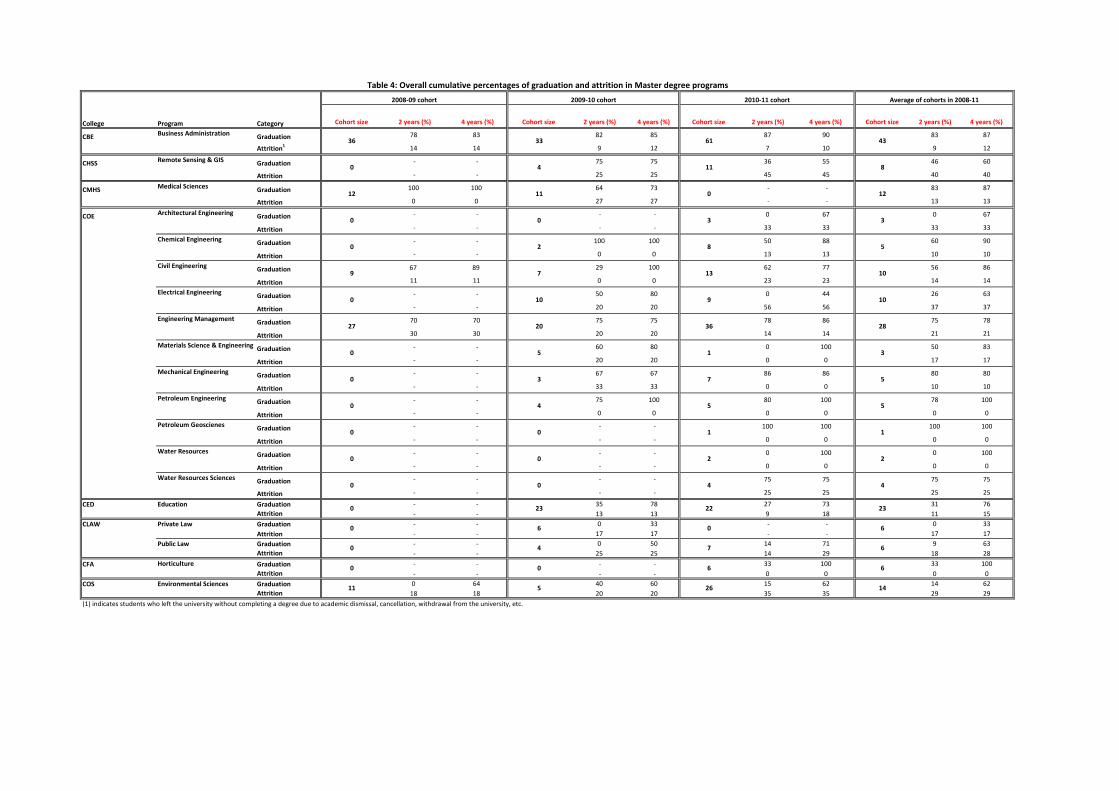
Cohort size 2 years (%) 4 years (%) Cohort size 2 years (%) 4 years (%) Cohort size 2 years (%) 4 years (%) Cohort size 2 years (%) 4 years (%)
CBE Graduation 78 83 82 85 87 90 83 87
Attrition1 14 14 9 12 7 10 9 12
CHSS Graduation - - 75 75 36 55 46 60
Attrition - - 25 25 45 45 40 40
CMHS Graduation 100 100 64 73 - - 83 87
Attrition 0 0 27 27 - - 13 13
COE Graduation - - - - 0 67 0 67
Attrition - - - - 33 33 33 33
Graduation - - 100 100 50 88 60 90
Attrition - - 0 0 13 13 10 10
Graduation 67 89 29 100 62 77 56 86
Attrition 11 11 0 0 23 23 14 14
Graduation - - 50 80 0 44 26 63
Attrition - - 20 20 56 56 37 37
Graduation 70 70 75 75 78 86 75 78
Attrition 30 30 20 20 14 14 21 21
Graduation - - 60 80 0 100 50 83
Attrition - - 20 20 0 0 17 17
Graduation - - 67 67 86 86 80 80
Attrition - - 33 33 0 0 10 10
Graduation - - 75 100 80 100 78 100
Attrition - - 0 0 0 0 0 0
Graduation - - - - 100 100 100 100
Attrition - - - - 0 0 0 0
Graduation - - - - 0 100 0 100
Attrition - - - - 0 0 0 0
Graduation - - - - 75 75 75 75
Attrition - - - - 25 25 25 25
CED Graduation - - 35 78 27 73 31 76Attrition - - 13 13 9 18 11 15
CLAW Graduation - - 0 33 - - 0 33Attrition - - 17 17 - - 17 17Graduation - - 0 50 14 71 9 63Attrition - - 25 25 14 29 18 28
CFA Graduation - - - - 33 100 33 100Attrition - - - - 0 0 0 0
COS Graduation 0 64 40 60 15 62 14 62Attrition 18 18 20 20 35 35 29 29
10
28
3
Average of cohorts in 2008-11
43
8
12
3
5
2010-11 cohort
61
11
0
8
3
23
6
6
6
14
5
5
1
2
4
22
0
7
26
1
2
4
6
13
9
36
1
7
Education 0 23
0 0
0 0
0 0
Petroleum Geoscienes
Water Resources
Water Resources Sciences
Materials Science & Engineering0 5
Mechanical Engineering0 3
Petroleum Engineering0 4
(1) indicates students who left the university without completing a degree due to academic dismissal, cancellation, withdrawal from the university, etc.
Private Law 0 6
Public Law 0 4
Horticulture 0 0
Environmental Sciences 11 5
2
Business Administration36 33
Remote Sensing & GIS0 4
0 0Architectural Engineering
0
0 10
Engineering Management27 20
Electrical Engineering
Civil Engineering9 7
Medical Sciences12
College Program Category
2008-09 cohort 2009-10 cohort
11
Chemical Engineering
Table 4: Overall cumulative percentages of graduation and attrition in Master degree programs
5
10
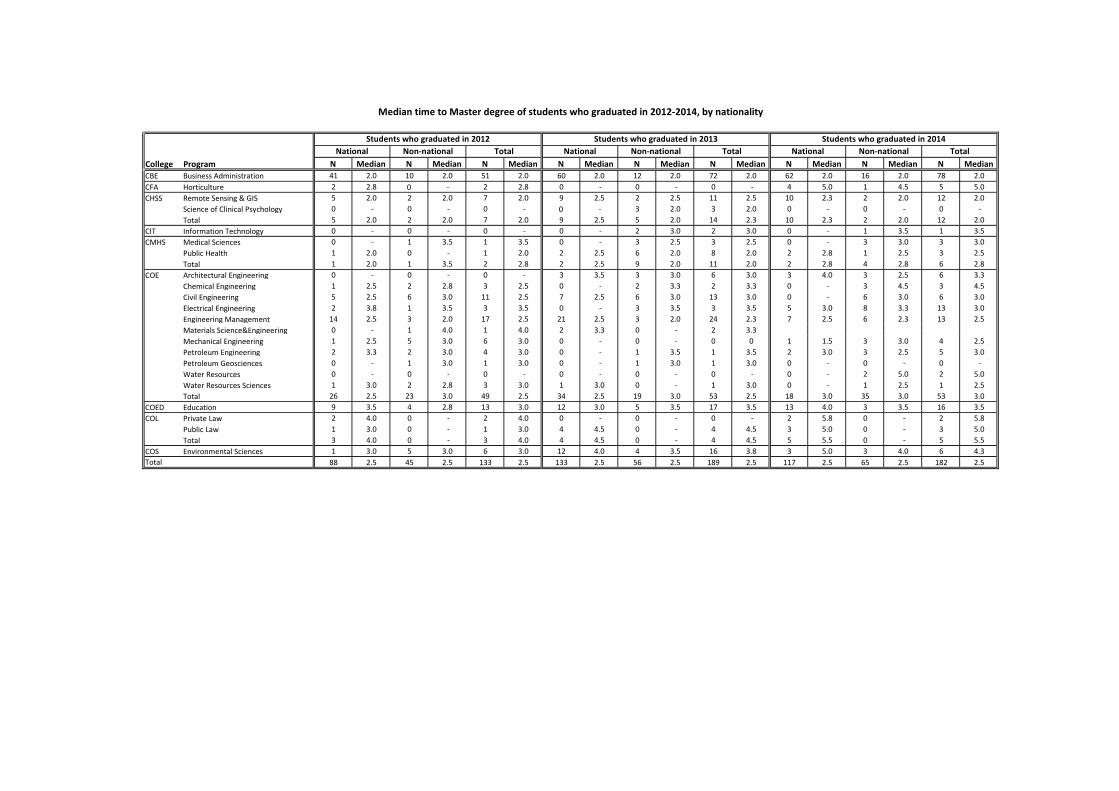
N Median N Median N Median N Median N Median N Median N Median N Median N MedianCBE Business Administration 41 2.0 10 2.0 51 2.0 60 2.0 12 2.0 72 2.0 62 2.0 16 2.0 78 2.0CFA Horticulture 2 2.8 0 - 2 2.8 0 - 0 - 0 - 4 5.0 1 4.5 5 5.0CHSS Remote Sensing & GIS 5 2.0 2 2.0 7 2.0 9 2.5 2 2.5 11 2.5 10 2.3 2 2.0 12 2.0
Science of Clinical Psychology 0 - 0 - 0 - 0 - 3 2.0 3 2.0 0 - 0 - 0 -Total 5 2.0 2 2.0 7 2.0 9 2.5 5 2.0 14 2.3 10 2.3 2 2.0 12 2.0
CIT Information Technology 0 - 0 - 0 - 0 - 2 3.0 2 3.0 0 - 1 3.5 1 3.5CMHS Medical Sciences 0 - 1 3.5 1 3.5 0 - 3 2.5 3 2.5 0 - 3 3.0 3 3.0
Public Health 1 2.0 0 - 1 2.0 2 2.5 6 2.0 8 2.0 2 2.8 1 2.5 3 2.5Total 1 2.0 1 3.5 2 2.8 2 2.5 9 2.0 11 2.0 2 2.8 4 2.8 6 2.8
COE Architectural Engineering 0 - 0 - 0 - 3 3.5 3 3.0 6 3.0 3 4.0 3 2.5 6 3.3Chemical Engineering 1 2.5 2 2.8 3 2.5 0 - 2 3.3 2 3.3 0 - 3 4.5 3 4.5Civil Engineering 5 2.5 6 3.0 11 2.5 7 2.5 6 3.0 13 3.0 0 - 6 3.0 6 3.0Electrical Engineering 2 3.8 1 3.5 3 3.5 0 - 3 3.5 3 3.5 5 3.0 8 3.3 13 3.0Engineering Management 14 2.5 3 2.0 17 2.5 21 2.5 3 2.0 24 2.3 7 2.5 6 2.3 13 2.5Materials Science&Engineering 0 - 1 4.0 1 4.0 2 3.3 0 - 2 3.3Mechanical Engineering 1 2.5 5 3.0 6 3.0 0 - 0 - 0 0 1 1.5 3 3.0 4 2.5Petroleum Engineering 2 3.3 2 3.0 4 3.0 0 - 1 3.5 1 3.5 2 3.0 3 2.5 5 3.0Petroleum Geosciences 0 - 1 3.0 1 3.0 0 - 1 3.0 1 3.0 0 - 0 - 0 -Water Resources 0 - 0 - 0 - 0 - 0 - 0 - 0 - 2 5.0 2 5.0Water Resources Sciences 1 3.0 2 2.8 3 3.0 1 3.0 0 - 1 3.0 0 - 1 2.5 1 2.5Total 26 2.5 23 3.0 49 2.5 34 2.5 19 3.0 53 2.5 18 3.0 35 3.0 53 3.0
COED Education 9 3.5 4 2.8 13 3.0 12 3.0 5 3.5 17 3.5 13 4.0 3 3.5 16 3.5COL Private Law 2 4.0 0 - 2 4.0 0 - 0 - 0 - 2 5.8 0 - 2 5.8
Public Law 1 3.0 0 - 1 3.0 4 4.5 0 - 4 4.5 3 5.0 0 - 3 5.0Total 3 4.0 0 - 3 4.0 4 4.5 0 - 4 4.5 5 5.5 0 - 5 5.5
COS Environmental Sciences 1 3.0 5 3.0 6 3.0 12 4.0 4 3.5 16 3.8 3 5.0 3 4.0 6 4.388 2.5 45 2.5 133 2.5 133 2.5 56 2.5 189 2.5 117 2.5 65 2.5 182 2.5
Median time to Master degree of students who graduated in 2012-2014, by nationality
Non-national Total National Non-national Total
Total
College Program
Students who graduated in 2012 Students who graduated in 2013 Students who graduated in 2014National Non-national Total National
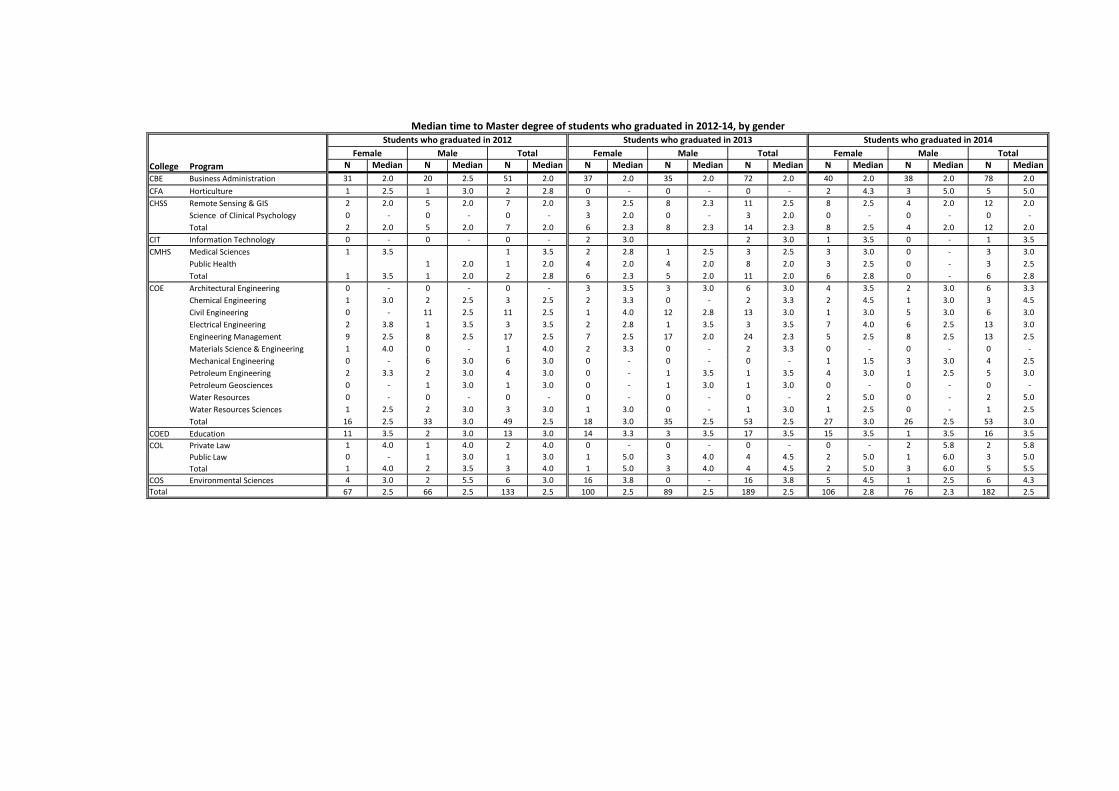
N Median N Median N Median N Median N Median N Median N Median N Median N MedianCBE Business Administration 31 2.0 20 2.5 51 2.0 37 2.0 35 2.0 72 2.0 40 2.0 38 2.0 78 2.0CFA Horticulture 1 2.5 1 3.0 2 2.8 0 - 0 - 0 - 2 4.3 3 5.0 5 5.0CHSS Remote Sensing & GIS 2 2.0 5 2.0 7 2.0 3 2.5 8 2.3 11 2.5 8 2.5 4 2.0 12 2.0
Science of Clinical Psychology 0 - 0 - 0 - 3 2.0 0 - 3 2.0 0 - 0 - 0 -Total 2 2.0 5 2.0 7 2.0 6 2.3 8 2.3 14 2.3 8 2.5 4 2.0 12 2.0
CIT Information Technology 0 - 0 - 0 - 2 3.0 2 3.0 1 3.5 0 - 1 3.5CMHS Medical Sciences 1 3.5 1 3.5 2 2.8 1 2.5 3 2.5 3 3.0 0 - 3 3.0
Public Health 1 2.0 1 2.0 4 2.0 4 2.0 8 2.0 3 2.5 0 - 3 2.5Total 1 3.5 1 2.0 2 2.8 6 2.3 5 2.0 11 2.0 6 2.8 0 - 6 2.8
COE Architectural Engineering 0 - 0 - 0 - 3 3.5 3 3.0 6 3.0 4 3.5 2 3.0 6 3.3Chemical Engineering 1 3.0 2 2.5 3 2.5 2 3.3 0 - 2 3.3 2 4.5 1 3.0 3 4.5Civil Engineering 0 - 11 2.5 11 2.5 1 4.0 12 2.8 13 3.0 1 3.0 5 3.0 6 3.0Electrical Engineering 2 3.8 1 3.5 3 3.5 2 2.8 1 3.5 3 3.5 7 4.0 6 2.5 13 3.0Engineering Management 9 2.5 8 2.5 17 2.5 7 2.5 17 2.0 24 2.3 5 2.5 8 2.5 13 2.5Materials Science & Engineering 1 4.0 0 - 1 4.0 2 3.3 0 - 2 3.3 0 - 0 - 0 -Mechanical Engineering 0 - 6 3.0 6 3.0 0 - 0 - 0 - 1 1.5 3 3.0 4 2.5Petroleum Engineering 2 3.3 2 3.0 4 3.0 0 - 1 3.5 1 3.5 4 3.0 1 2.5 5 3.0Petroleum Geosciences 0 - 1 3.0 1 3.0 0 - 1 3.0 1 3.0 0 - 0 - 0 -Water Resources 0 - 0 - 0 - 0 - 0 - 0 - 2 5.0 0 - 2 5.0Water Resources Sciences 1 2.5 2 3.0 3 3.0 1 3.0 0 - 1 3.0 1 2.5 0 - 1 2.5Total 16 2.5 33 3.0 49 2.5 18 3.0 35 2.5 53 2.5 27 3.0 26 2.5 53 3.0
COED Education 11 3.5 2 3.0 13 3.0 14 3.3 3 3.5 17 3.5 15 3.5 1 3.5 16 3.5COL Private Law 1 4.0 1 4.0 2 4.0 0 - 0 - 0 - 0 - 2 5.8 2 5.8
Public Law 0 - 1 3.0 1 3.0 1 5.0 3 4.0 4 4.5 2 5.0 1 6.0 3 5.0Total 1 4.0 2 3.5 3 4.0 1 5.0 3 4.0 4 4.5 2 5.0 3 6.0 5 5.5
COS Environmental Sciences 4 3.0 2 5.5 6 3.0 16 3.8 0 - 16 3.8 5 4.5 1 2.5 6 4.367 2.5 66 2.5 133 2.5 100 2.5 89 2.5 189 2.5 106 2.8 76 2.3 182 2.5Total
Median time to Master degree of students who graduated in 2012-14, by gender
College Program
Students who graduated in 2012 Students who graduated in 2013 Students who graduated in 2014Female Male Total Female Male Total Female Male Total


